the Creative Commons Attribution 4.0 License.
the Creative Commons Attribution 4.0 License.
 | 15 Sep 2020
Decomposing reflectance spectra to track gross primary production in a subalpine evergreen forest
Troy S. Magney
Debsunder Dutta
David R. Bowling
Barry A. Logan
Sean P. Burns
Peter D. Blanken
Katja Grossmann
Sophia Lopez
Andrew D. Richardson
Jochen Stutz
Christian Frankenberg
Photosynthesis by terrestrial plants represents the majority of CO2 uptake on Earth, yet it is difficult to measure directly from space. Estimation of gross primary production (GPP) from remote sensing indices represents a primary source of uncertainty, in particular for observing seasonal variations in evergreen forests. Recent vegetation remote sensing techniques have highlighted spectral regions sensitive to dynamic changes in leaf/needle carotenoid composition, showing promise for tracking seasonal changes in photosynthesis of evergreen forests. However, these have mostly been investigated with intermittent field campaigns or with narrow-band spectrometers in these ecosystems. To investigate this potential, we continuously measured vegetation reflectance (400–900 nm) using a canopy spectrometer system, PhotoSpec, mounted on top of an eddy-covariance flux tower in a subalpine evergreen forest at Niwot Ridge, Colorado, USA. We analyzed driving spectral components in the measured canopy reflectance using both statistical and process-based approaches. The decomposed spectral components co-varied with carotenoid content and GPP, supporting the interpretation of the photochemical reflectance index (PRI) and the chlorophyll/carotenoid index (CCI). Although the entire 400–900 nm range showed additional spectral changes near the red edge, it did not provide significant improvements in GPP predictions. We found little seasonal variation in both normalized difference vegetation index (NDVI) and the near-infrared vegetation index (NIRv) in this ecosystem. In addition, we quantitatively determined needle-scale chlorophyll-to-carotenoid ratios as well as anthocyanin contents using full-spectrum inversions, both of which were tightly correlated with seasonal GPP changes. Reconstructing GPP from vegetation reflectance using partial least-squares regression (PLSR) explained approximately 87 % of the variability in observed GPP. Our results linked the seasonal variation in reflectance to the pool size of photoprotective pigments, highlighting all spectral locations within 400–900 nm associated with GPP seasonality in evergreen forests.
- Article
(7906 KB) - Full-text XML
-
Supplement
(1042 KB) - BibTeX
- EndNote


Terrestrial gross primary production (GPP), the gross CO2 uptake through photosynthesis, is the largest uptake of atmospheric CO2 (Ciais et al., 2013), yet the uncertainties are large, hampering our ability to monitor and predict the response of the terrestrial biosphere to climate change (Ahlström et al., 2012). Hence, accurately mapping GPP globally is critical. In contrast to unevenly distributed ground-level measurements such as Fluxnet (Baldocchi et al., 2001), satellites can infer GPP globally and uniformly. Remote sensing techniques are based on the optical response of vegetation to incoming sunlight, which can track photosynthesis via the absorption features of photosynthetic and photoprotective pigments (Rouse et al., 1974; Liu and Huete, 1995; Gamon et al., 1992, 2016). Progress is particularly important for evergreen forests, which can have large seasonal dynamics in photosynthesis but low variability in canopy structure and color. However, these promising techniques still lack a comprehensive evaluation/validation using both continuous in situ measurements and process-based simulations.
GPP can be expressed as a function of photosynthetically active radiation (PAR), the fraction of PAR absorbed by the canopy (fPAR), and light-use efficiency (LUE):
with LUE representing the efficiency of plants to fix carbon using absorbed light (Monteith, 1972; Monteith and Moss, 1977). The accuracy of remote-sensing-derived GPP is limited by the estimation of LUE, which is more dynamic and difficult to measure remotely than PAR and fPAR, particularly in evergreen ecosystems. There have been many studies inferring the light absorbed by canopies (i.e., fPAR) from vegetation indices (VIs) that estimate the “greenness” of canopies (Running et al., 2004; Zhao et al., 2005; Robinson et al., 2018; Glenn et al., 2008), such as the normalized difference vegetation index (NDVI; Rouse et al., 1974; Tucker, 1979), the enhanced vegetation index (EVI; Liu and Huete, 1995; Huete et al., 1997), and the near-infrared vegetation index (NIRv; Badgley et al., 2017). Current GPP data products derived from Eq. (1) rely on the modulation of abiotic conditions to estimate LUE (Xiao et al., 2004). LUE is derived empirically by defining a general timing of dormancy for all evergreen forests with the same plant functional type (e.g., Krinner et al., 2005) or the same meteorological thresholds (e.g., Running et al., 2004). However, within the same climate region or plant functional type, forests are not identical – leading to uncertainties in estimated LUE (Stylinski et al., 2002; Gamon et al., 2016; Zuromski et al., 2018), which propagate to the estimation of GPP.
Because evergreen trees retain most of their needles and chlorophyll throughout the entire year (Bowling et al., 2018), LUE in evergreens is regulated by needle biochemistry. As LUE falls with the onset of winter due to unfavorable environmental conditions and seasonal downregulation of photosynthetic capacity, evergreen needles quench excess absorbed light via thermal energy dissipation that involves the xanthophyll cycle and other pigments (Adams and Demmig-Adams, 1994; Demmig-Adams and Adams, 1996; Verhoeven et al., 1996; Zarter et al., 2006). Thermal energy dissipation is a primary de-excitation pathway measured by pulse-amplitude fluorescence as non-photochemical quenching (NPQ; Schreiber et al., 1986). At the same time, a small amount of radiation, solar-induced fluorescence (SIF), via the de-excitation of absorbed photons is emitted by photosystem II (Genty et al., 1989; Krause and Weis, 1991).
Some vegetation indices are sensitive to photoprotective pigments (e.g., carotenoids) and can characterize the seasonality of evergreen LUE with some success. For instance, the photochemical reflectance index (PRI; Gamon et al., 1992, 1997) and chlorophyll/carotenoid index (CCI; Gamon et al., 2016) both use wavelength regions that represent carotenoid absorption features around 531 nm at the leaf level (Wong et al., 2019; Wong and Gamon, 2015a, b) and show great promise for estimating photosynthetic seasonality (Hall et al., 2008; Hilker et al., 2011a). Due to the relatively invariant canopy structure in evergreen forests, CCI and PRI have been applied at the canopy level as well (Gamon et al., 2016; Garbulsky et al., 2011; Middleton et al., 2016). In addition, the green chromatic coordinate (GCC; Richardson et al., 2009, 2018; Sonnentag et al., 2012), an index derived from the brightness levels of RGB canopy images, is also capable of tracking the seasonality of evergreen GPP (Bowling et al., 2018). However, the full potential of spectrally resolved reflectance measurements to explore the photosynthetic phenology of evergreens has not been comprehensively explored at the canopy scale. The evaluation of pigment-driven spectral changes in evergreen forests over the course of a season is necessary to determine where, when, and why certain wavelength regions could advance our mechanistic understanding of canopy photosynthetic and photoprotective pigments. However, this has not been done with both empirical and process-based methods using continuously measured canopy hyperspectral reflectance and in situ pigment samples.
Here, we used continuous measurements in both spectral space (full spectrum between 400 and 900 nm) and time (daily over an entire year) to evaluate the potential of hyperspectral canopy reflectance for better understanding the sensitivity of VIs to pigment changes that regulate GPP in evergreen forests. Continuous measurements of spectrally resolved reflectance at the canopy scale have so far been sparse at evergreen forest sites (Gamon et al., 2006; Hilker et al., 2011b; Porcar-Castell et al., 2015; Rautiainen et al., 2018; Wong et al., 2020). There are only a few empirical studies on hyperspectral canopy reflectance in evergreen forests (Smith et al., 2002; Singh et al., 2015). Yet, empirically decomposed canopy spectral reflectance has been used as a predictor of maximum photosynthetic capacity (Serbin et al., 2012; Barnes et al., 2017; Dechant et al., 2017; Silva-Perez et al., 2018; Meacham-Hensold et al., 2019), GPP (Matthes et al., 2015; Huemmrich et al., 2017; DuBois et al., 2018; Huemmrich et al., 2019; Dechant et al., 2019), and other physiological properties (Ustin et al., 2004, 2009; Asner et al., 2011; Serbin et al., 2014).
In contrast to empirical methods, process-based approaches, such as canopy radiative transfer models (RTMs) can help to quantitatively link canopy photosynthesis with leaf-level contents of photosynthetic/photoprotective pigments (Feret et al., 2008; Jacquemoud et al., 2009). With RTMs, we can use spectrally resolved reflectance to directly derive leaf pigment contents (Féret et al., 2017; Jacquemoud et al., 1995) and plant traits (Féret et al., 2019).
In addition to seasonal changes in pigment concentrations, canopy SIF was found to correlate significantly with the seasonality of photoprotective pigment content in a subalpine coniferous forest (Magney et al., 2019a). Steady-state SIF is regulated by NPQ and photochemistry (Porcar-Castell et al., 2014), and it provides complementary information on canopy GPP. Yang and van der Tol (2018) justified that the relative SIF, SIF normalized by the reflected near-infrared radiation, is more representative of the physiological variations in SIF as it is comparable to a SIF yield (Guanter et al., 2014; Genty et al., 1989). Our continuous optical measurements make it possible to differentiate mechanisms undergoing seasonal changes by comparing the decomposed reflectance spectrum against relative far-red SIF. Additionally, using relative SIF can effectively correct for incoming irradiance and account for the sunlit and shade fractions within the observation field of view (FOV) of PhotoSpec (Magney et al., 2019a).
In the present study, we analyzed continuous canopy reflectance data from PhotoSpec at a subalpine evergreen forest at the Niwot Ridge AmeriFlux site (US-NR1) in Colorado, US, and sought to understand the mechanisms controlling the seasonality of photosynthesis using continuous hyperspectral remote sensing. We first explored empirical techniques to study all seasonal variations in reflectance spectra, identified specific spectral regions that best explained the seasonal changes in GPP, and then linked these spectral features to pigment absorption features that impacted both biochemical and biophysical traits. We also used full-spectral inversions using a canopy RTM to infer quantitative estimates of leaf pigment pool sizes. Finally, we compared the spring onset of photosynthesis captured by different methods, VIs, and relative SIF to determine the underlying mechanisms that contributed to photosynthetic phenology.
2.1 Study site
The high-altitude (3050 m above sea level) subalpine evergreen forest near Niwot Ridge, Colorado, US, is an active AmeriFlux site (US-NR1, lat: 40.0329∘ N, long: 105.5464∘ W; tower height: 26 m; Monson et al., 2002; Burns et al., 2015, 2016; Blanken et al., 2019). Three species dominate: subalpine fir (Abies lasiocarpa var. bifolia), Engelmann spruce (Picea engelmannii), and lodgepole pine (Pinus contorta) with an average height of 11.5 m, a leaf area index of 4.2 (Burns et al., 2016), and minimal understory. The annual mean precipitation and air temperature are 800 mm and 1.5 ∘C, respectively (Monson et al., 2002). The high elevation creates an environment with cold winters (with snow present more than half the year), while the relatively low latitude (40∘ N) allows for year-round high solar irradiation (Monson et al., 2002). Thus, trees have to dissipate a considerable amount of excess sunlight during winter dormancy, which makes this forest an ideal site for studying seasonal variation in NPQ including the sustained component of it during dormancy (Bowling et al., 2018; Magney et al., 2019a).
2.2 Continuous tower-based measurements of canopy reflectance
PhotoSpec (Grossmann et al., 2018) is a 2D scanning telescope spectrometer unit originally designed to measure SIF. It also features a broadband Flame-S spectrometer (Ocean Optics, Inc., Florida, USA), used to measure reflectance from 400 to 900 nm at a moderate (full width at half maximum = 1.2 nm) spectral resolution with a FOV of 0.7∘ (more details in Grossmann et al., 2018; Magney et al., 2019a). In the summer of 2017, we installed a PhotoSpec system on the top of the US-NR1 eddy-covariance tower, from where we can scan the canopy by changing both viewing azimuth angle and zenith angles. On every other summer day and every winter day, PhotoSpec scans the canopy by changing the view zenith angle with small increments at fixed view azimuth angles, i.e., elevation scans. Only one azimuth position is kept after 18 October 2017 to protect the mechanism from potentially damaging winter conditions at the site. Spectrally resolved reflectance was calculated using direct solar irradiance measurements via a cosine diffuser mounted in the upward nadir direction (Grossmann et al., 2018) as well as reflected radiance from the canopy. The reflectance data used in this study are from 16 June 2017 to 15 June 2018.
Here, we integrated all elevation scans to daily-averaged reflectance (every other day before 18 October 2017) by using all scanning viewing directions with vegetation in the field of view over the course of a day, filtering for both low-light conditions and thick clouds by requiring PAR to be both at least 100 µmol m−2 s−1 and 60 % of theoretical clear-sky PAR. A detailed description of data processing can be found in Appendix B. To further test whether bidirectional reflectance effects impacted our daily averages, we compared the NDVI and NIRv at various canopy positions given a range of solar zenith and azimuth angles (Figs. A1–A3). Neither of the daily averaged VIs was substantially impacted by the solar geometry supporting the robustness of daily averaged canopy reflectance. An additional analysis (Fig. A4) has also shown the variation in phase angle at a daily time step is not a critical factor for the change in reflectance.
About 49 winter days exhibited significantly higher reflectances, attributable to snow within the field of view, which we corroborated with canopy RGB imagery from the tower. After removing data strongly affected by snow and excluding the days of instrument outages, 211 valid sample days remained, among which 96 valid sample days were between DOY 100 and 300. The daily-averaged reflectance was computed as the median reflectance from all selected scans for a single day, which was then smoothed by a 10-point (3.7 nm) box-car filter over the spectral dimension (400–900 nm) to remove the noise in the spectra. Figure 1a shows the seasonally averaged and spectrally resolved canopy reflectances measured by PhotoSpec.
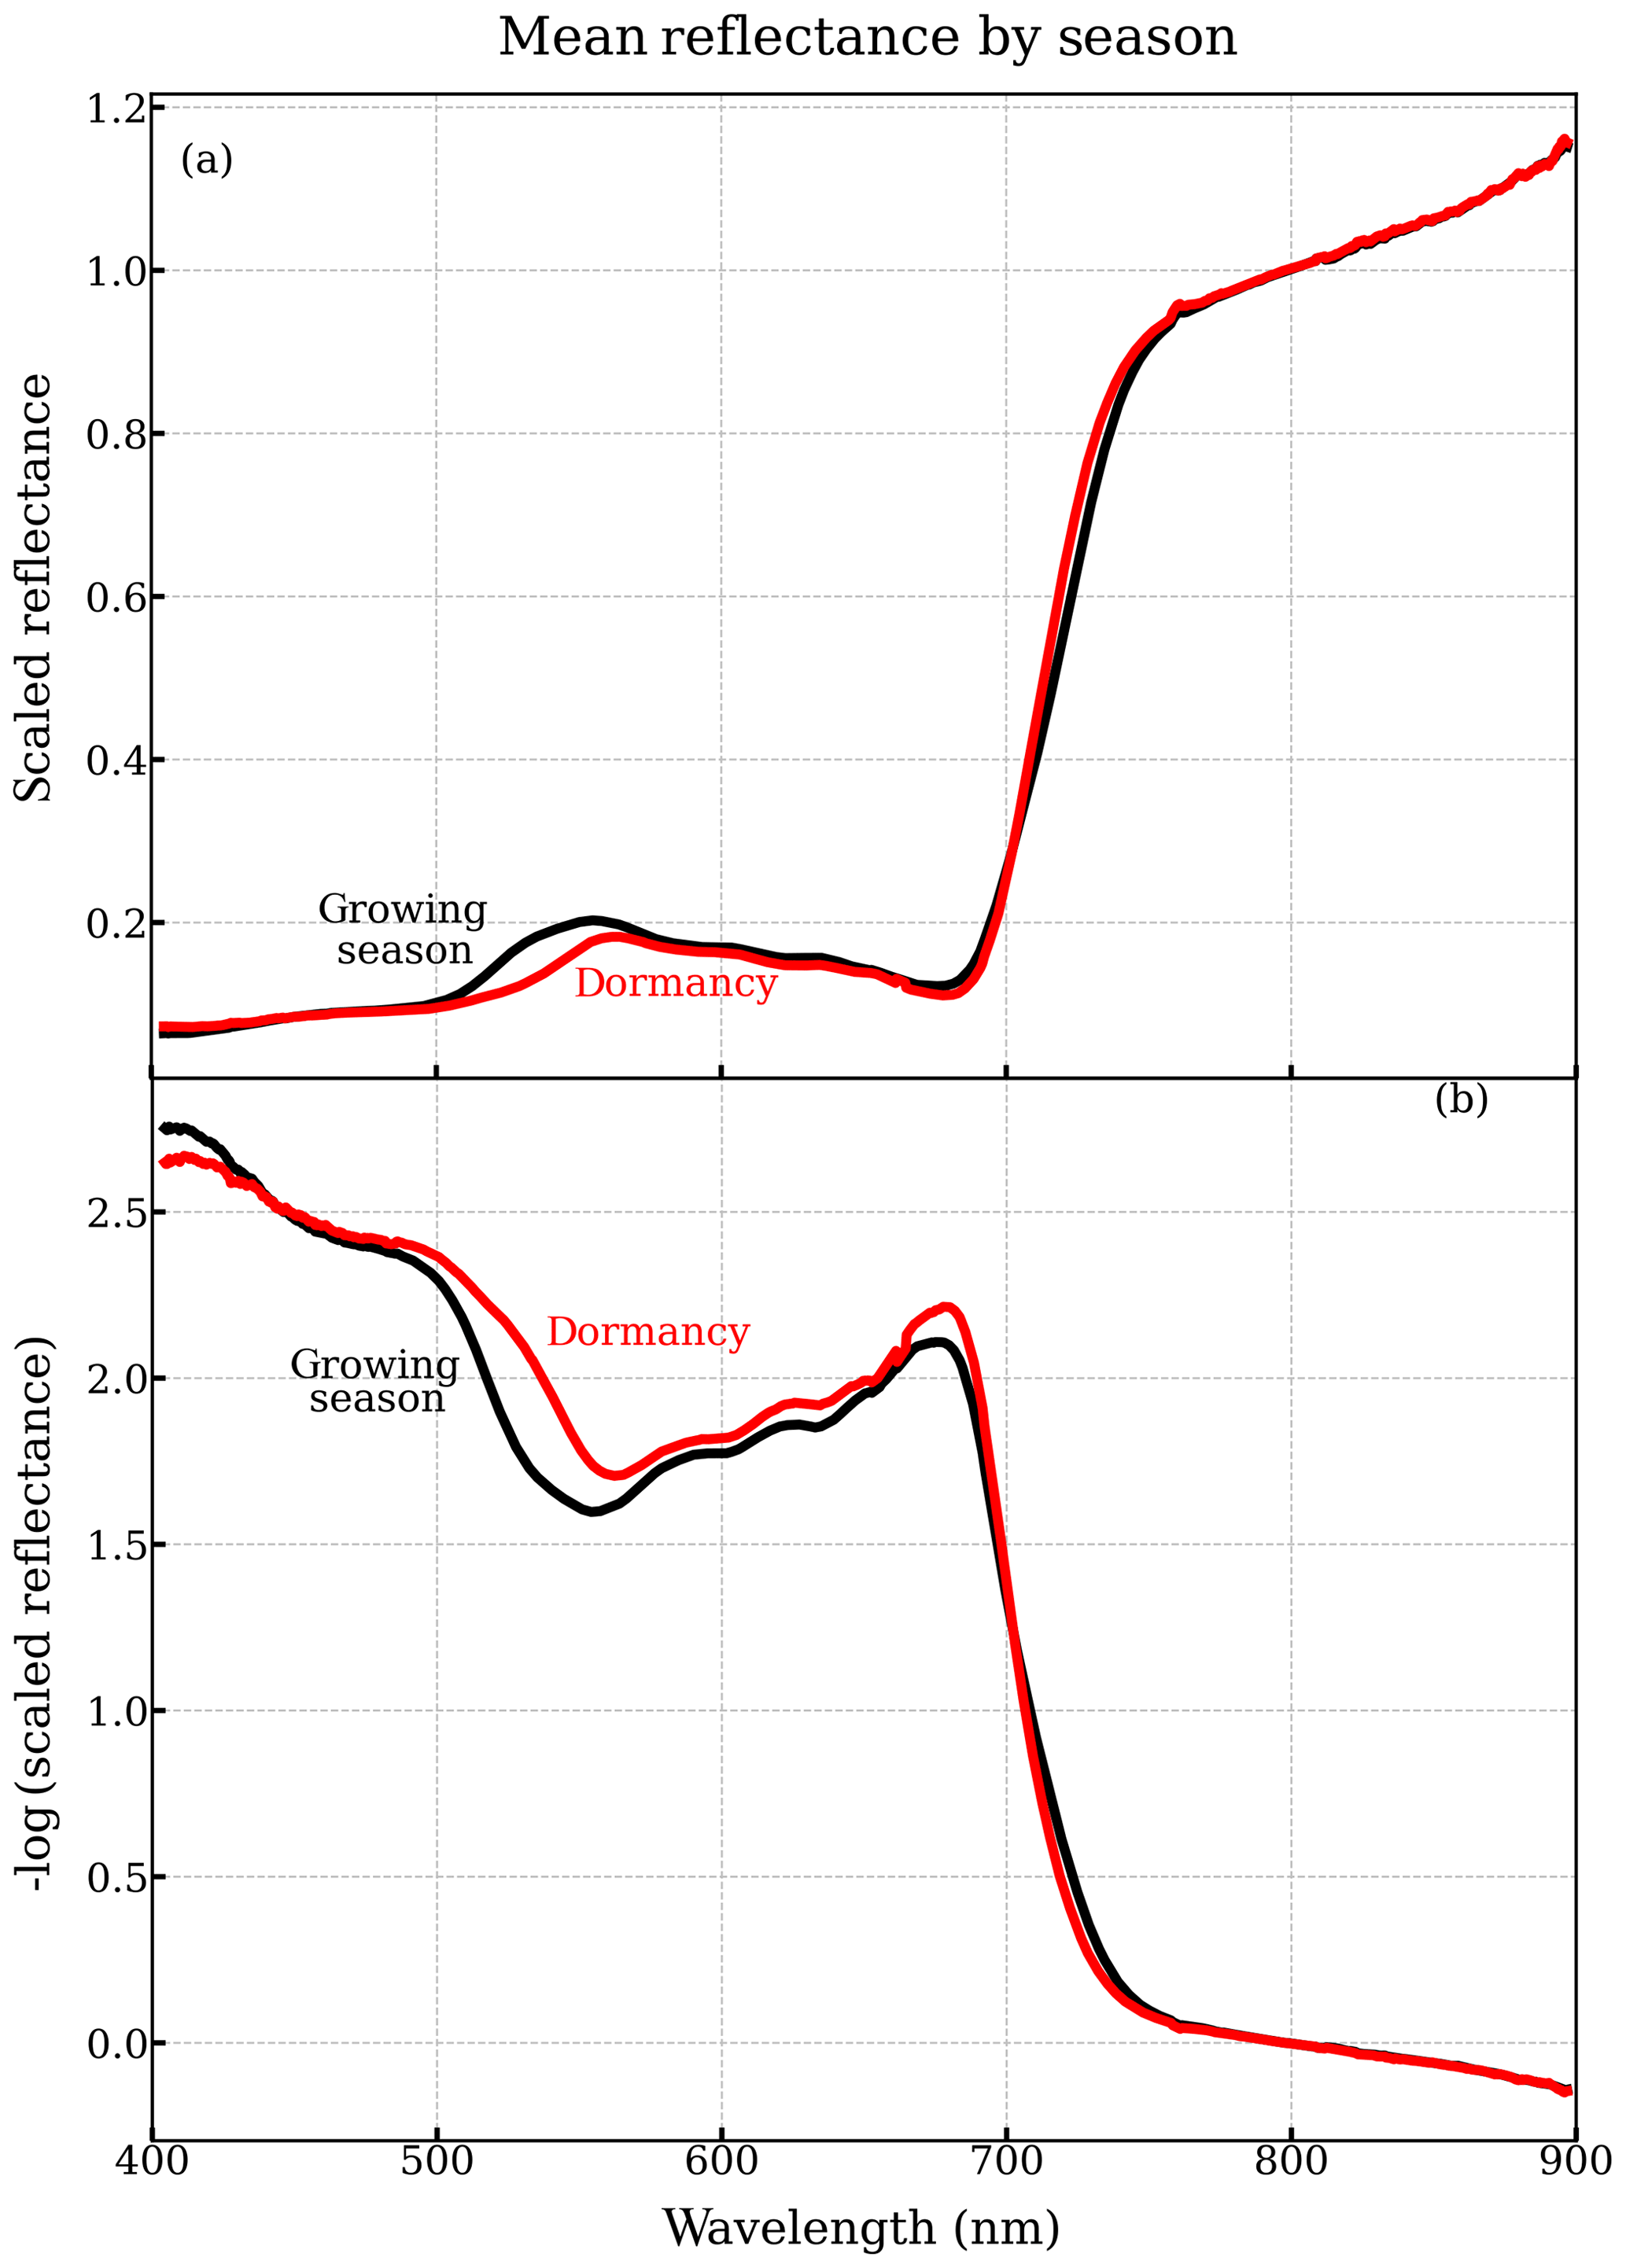
Figure 1(a) Seasonally averaged canopy reflectance in winter dormancy (red) and the growing season (black) from PhotoSpec. (b) Seasonally averaged negative logarithm transformation of reflectance (400–900 nm). For comparison, we normalized the reflectance by the value at 800 nm on each day. Here, we referred to 13 November–18 April as dormancy, and 2 June–21 August as the main growing season. The seasonal averaged canopy reflectance is composed of 39 daily-average reflectance in the growing season and 113 daily-averaged reflectance in the dormancy.
To further emphasize the change in reflectance as a result of changes in pigment contents, we transformed the reflectance (shown as Rλ) using the negative logarithm (Eq. 2), as light intensity diminishes exponentially with pigment contents (Horler et al., 1983).
Here σ is the absorption cross section of pigments.
Therefore, the log-transformed reflectance (Fig. 1b) should correlate more linearly with pigment contents (shown as C). We also considered a variety of typical VIs using the reflectance data from PhotoSpec.
In order to calculate GCC, we convolved the reflectance using the instrumental spectral response function (Fig. S1 in the Supplement; Wingate et al., 2015) of the StarDot NetCam SC 5 MP IR (StarDot Technologies, Buena Park, CA, USA), which is the standard camera model used by the PhenoCam Network protocol (Sonnentag et al., 2012).
In addition to the reflectance measurements, we also included relative SIF, far-red SIF normalized by the reflected near-infrared radiance at 755 nm. The far-red SIF (745–758 nm, Grossmann et al., 2018) was measured simultaneously with reflectance with a QEPro spectrometer (Ocean Optics, Inc., Florida, USA). The daily relative SIF was processed in the same fashion as the reflectance.
2.3 Eddy covariance measurements and LUE
Observations of net ecosystem exchange (net flux of CO2, NEE), PAR, and meteorological variables made at the US-NR1 tower are part of the official AmeriFlux Network data (Burns et al., 2016). GPP was estimated in half-hourly intervals (Reichstein et al., 2005) using the REddyProc package (Wutzler et al., 2018), allowing us to compute LUE (Goulden et al., 1996; Gamon et al., 2016) at half-hourly intervals.
According to the light response curves, GPP is a nonlinear function of PAR (Fig. 2; Harbinson, 2012). Magney et al. (2019a) showed that fPAR does not significantly vary with seasons. We started to observe a photosynthetic saturation between 500 and 1000 µmol m−2 s−1 of PAR (Fig. 2), when the carboxylation rate, driven by maximum carboxylation rate (Vcmax), became the limiting factor (Farquhar et al., 1980). Thus, we defined the light-saturated GPP (GPPmax), as the mean half-hourly GPP at PAR levels between 1000 and 1500 µmol m−2 s−1, a range which was covered throughout the year (Fig. 2), even in winter. Therefore, GPPmax was less susceptible to short-term changes in PAR. Yet, due to the lower light intensity during storms, GPPmax was not always available. As suggested by the low PAR value at which light saturation happened, plants remained in a light-saturated condition for most of the daytime. A higher GPPmax indicates a greater Vcmax and maximum electron transport rate (Jmax) when the variation in GPPmax is independent of stomatal conductance and intercellular CO2 concentration (Leuning, 1995). Therefore, GPPmax was closely correlated with daily LUE driven by physiology (see Sect. S2.4 in the Supplement).
We refrained from normalizing GPPmax by absorbed photosynthetically active radiation (APAR) due to some of the APAR measurements (see Sect. S2.1 in the Supplement) not available in the beginning of growing season. GPPmax was significantly linearly correlated with normalized GPPmax by APAR (Fig. S2c).
We also included air temperature (Tair) and vapor pressure deficit (VPD) provided from the AmeriFlux network data. Daytime daily mean Tair and VPD were computed from averaging the half-hourly Tair and VPD when PAR was greater than 100 µmol m−2 s−1.
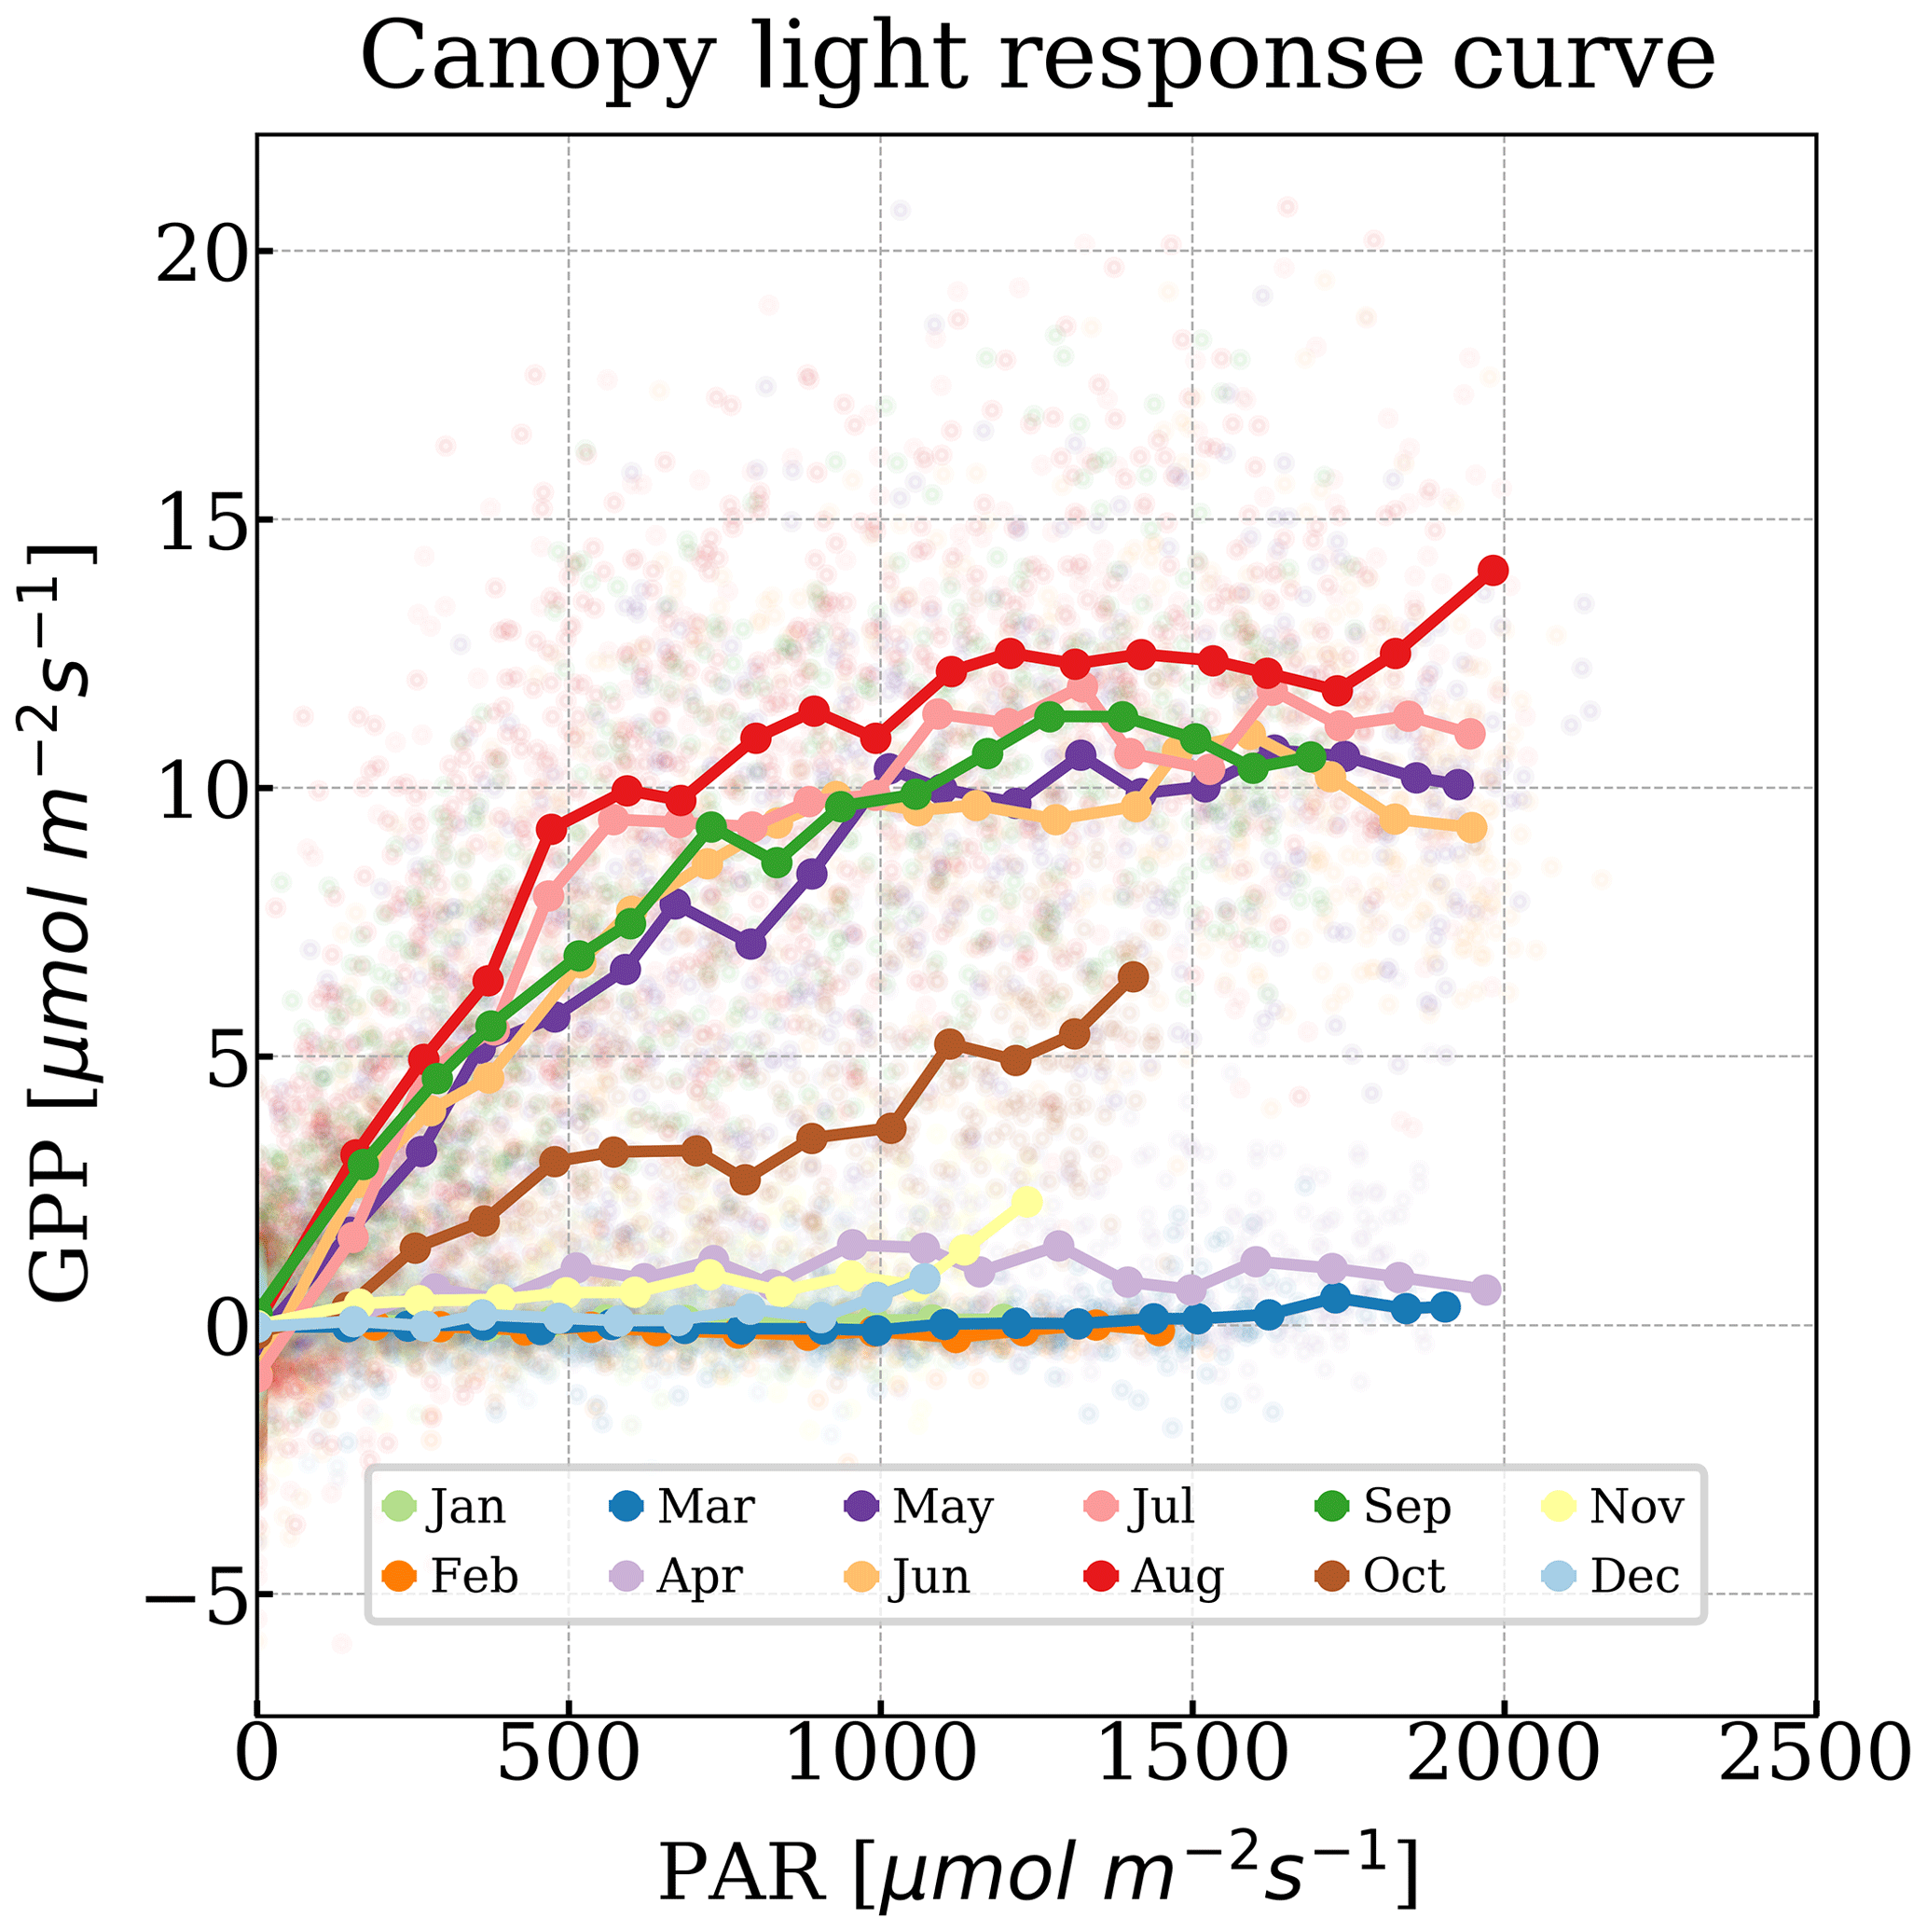
Figure 2Half-hourly GPP as a function of PAR during the measurement period. Points were colored by month. Bold points were the median GPP when PAR was binned every 100 µmol m−2 s−1 approximately. The solid lines represent the canopy light response curve.
2.4 Pigment measurements
To link canopy reflectance with variations in pigment contents, we used pigment data (Bowling et al., 2018; Bowling and Logan, 2019; Magney et al., 2019a) at monthly intervals over the course of the sampling period. Here, we focused on the xanthophyll cycle pool size (violaxanthin + antheraxanthin + zeaxanthin, V + A + Z), total carotenoid content (car), and total chlorophyll content (chl) measured on Pinus contorta and Picea engelmannii needles with units of moles per unit fresh mass. Car includes V + A + Z, lutein, neoxanthin, and beta-carotene. We also computed the ratio of chlorophyll to carotenoid contents (chl : car), because CCI derived from the Moderate Resolution Imaging Spectroradiometer (MODIS) can track chl : car (Gamon et al., 2016). Overall, we can match 10 individual leaf-level sampling days for both pine and spruce samples with reflectance measured within ±2 d. Among these 10 valid sample days, 6 sample days are between DOY 100 and 300.
2.5 Data-driven spectral decomposition
We assumed that the spectrally resolved reflectance is a result of mixed absorption processes by different pigments. This allowed us to apply an independent component analysis (ICA; Hyvärinen and Oja, 2000) to decompose the log-transformed reflectance matrix (day of the year in rows and spectral dimension in columns) into its independent components. An advantage of the ICA is that it can separate a multivariate signal into additive subcomponents that are maximally independent, without the condition of orthogonality (Comon, 1994). We extracted three independent components, which explained more than 99.99 % of the variance, using the ICA algorithm (FastICA, Python package scikit-learn v0.21.0; Sect. S4 in the Supplement), such as
where i is the ith component in spectral space.
The decomposed spectral components revealed characteristic features that explain most of the variance in the reflectance matrix, which dictated the time-independent spectral shapes of pigment absorption features based on Eq. (2). The corresponding temporal loadings showed temporal variations in these spectral features, i.e., the variations in pigment contents. We will introduce the method of extracting pigment absorption features in a quantitative model-driven approach in Sect. 2.6.
In addition to analyzing the transformed reflectance alone, we empirically correlated the reflectance with GPPmax using partial least-squares regression (PLSR, Python package scikit-learn v0.21.0). PLSR is a predictive regression model which solves for a coefficient that can maximally explain the linear covariance of the predictor with multiple variables (Wold et al., 1984; Geladi and Kowalski, 1986). PLSR has been used to successfully predict photosynthetic properties using reflectance matrices in previous studies from the leaf to canopy scales (e.g., Serbin et al., 2012, 2015; Barnes et al., 2017; Silva-Perez et al., 2018; Woodgate et al., 2019). Applying the PLSR to the hyperspectral canopy reflectance and GPPmax resulted in a time-independent coefficient that emphasizes the key wavelength regions which contribute to the covariation of reflectance and GPPmax, such as
We implemented another set of PLSR analyses on the reflectance with individual pigment measurement as the target variable, such as the mean values of V + A + Z, car, and chl : car, such as
We did not include chl as one of the target variables in this PLSR analysis since Bowling et al. (2018) and Magney et al. (2019a) have already shown chl did not vary seasonally in our study site. Fitting the minimal variance in chl will lead to overfitting the PLSR model.
Comparing the PLSR coefficient of pigment measurements at the leaf level with the PLSR coefficient of GPPmax connected the changes in GPPmax to the pool size of photoprotective pigments, because the reflectance is regulated by the absorption of pigments.
2.6 Process-based methods
PROSPECT + SAIL (PROSAIL; Jacquemoud et al., 2009) is a process-based 1-D canopy RTM that models canopy reflectance, given canopy structure information (SAIL) as well as leaf pigment contents (PROSPECT) (Jacquemoud and Baret, 1990; Vilfan et al., 2018).
We used PROSAIL (with PROSPECT-D; Féret et al., 2017) to compute the derivative of the daily-averaged negative logarithm transformed reflectance with respect to individual pigment contents, namely chlorophyll content (chlorophyll Jacobian, ) and carotenoid content (carotenoid Jacobian, ) (Dutta et al., 2019). This helped explain the decomposed spectral components from the empirical analysis.
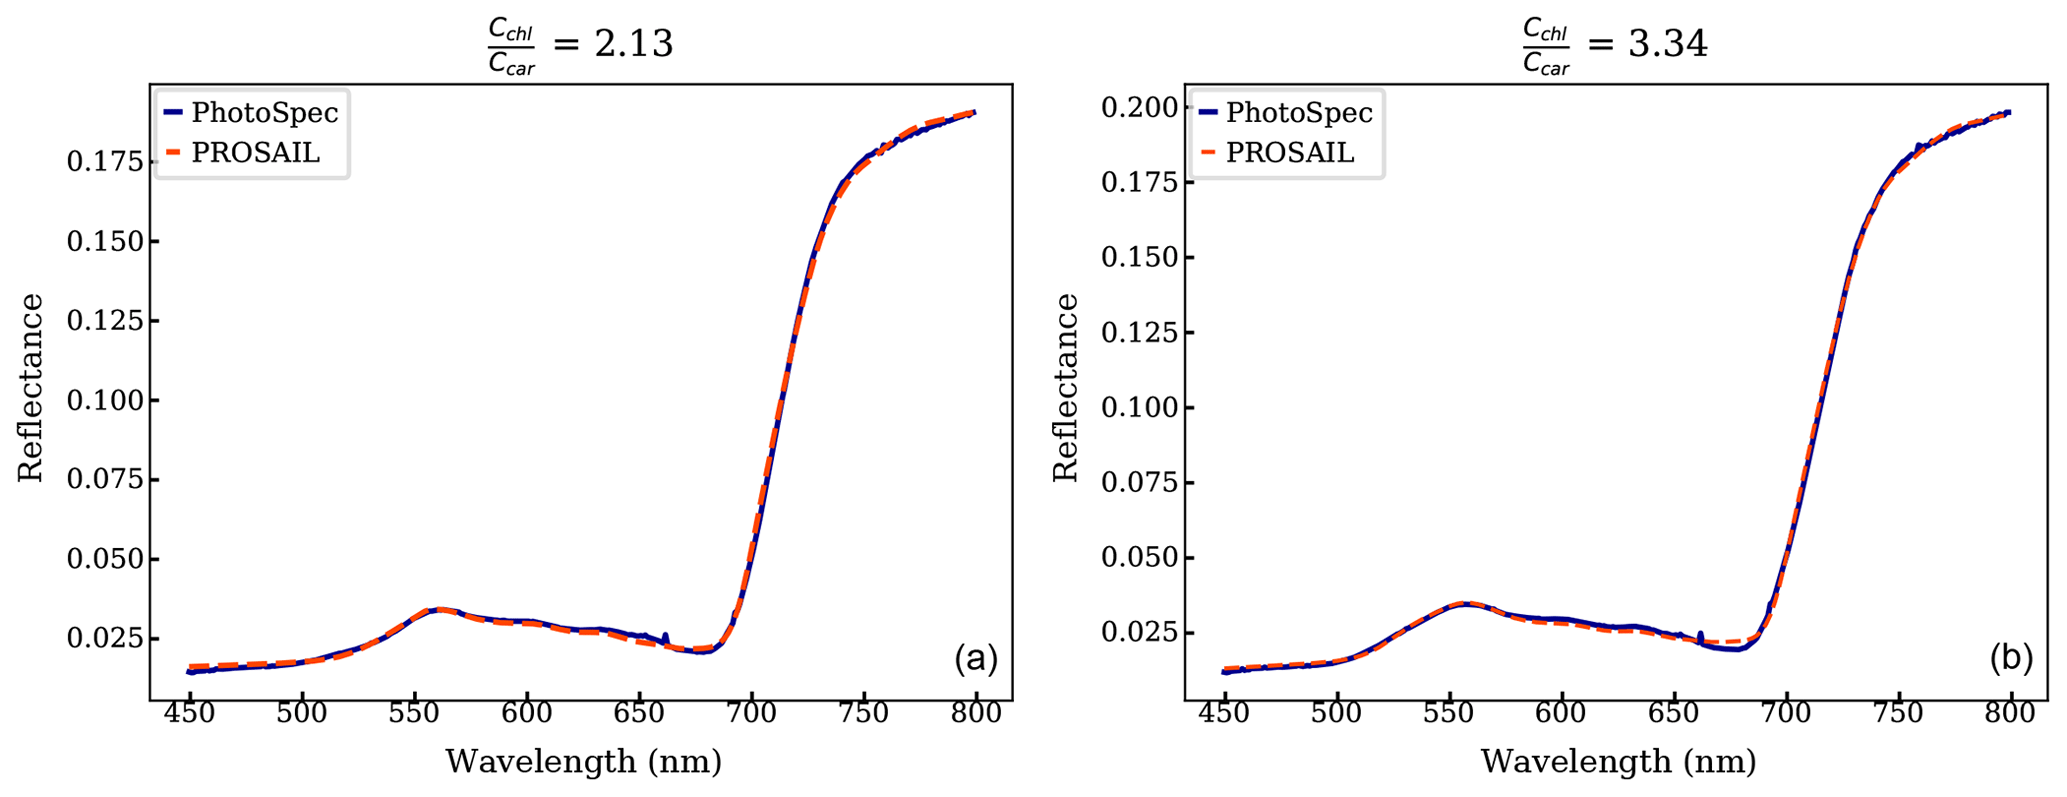
We also used PROSAIL to infer pigment contents (i.e., Cchl, Ccar, Cant) by optimizing the agreement between PROSAIL-modeled reflectance and measured canopy daily-mean reflectance from PhotoSpec. We fixed canopy structural parameters (e.g., the leaf area index (LAI) to 4.2, as reported in Burns et al., 2015) and fitted leaf pigment compositions as well as a low-order polynomial for soil reflectance (Appendix C), similar to Vilfan et al. (2018) and Féret et al. (2017). The cost function J in Eq. (7) represents a least-squares approach, where is the modeled reflectance.
We used the spectral range between 450 and 800 nm, which encompasses most pigment absorption features.
3.1 Seasonal cycle of GPPmax and environmental conditions
As can be seen in Fig. 3, the subalpine evergreen forest at Niwot Ridge exhibits strong seasonal variation in GPP, Tair, VPD, GPPmax, and PAR. GPP and GPPmax dropped to zero while sufficient PAR, required for photosynthesis, was still available in the dormancy, which suggests that the abiotic environmental factors impact photosynthesis seasonality nonlinearly and jointly.
Abiotic factors played a strong role in regulating GPPmax in this subalpine evergreen forest over the course of the season. For instance, there was a strong dependence of GPPmax with Tair. However, photosynthesis completely shut down during dormancy, even when the Tair exceeded 5 ∘C (Fig. 3). During the onset and cessation periods of photosynthesis, GPPmax rapidly increased with temperature (Fig. S3a left panel), potentially because needle temperature co-varied with Tair, and needle temperature controls the activity of photosynthetic enzymes which affect Vcmax. Spring warming approaches the optimal temperature for photosynthetic enzymes, leading to activation of photosynthesis, while cooling in the early winter inhibits these enzymes (Rook, 1969). Warming in spring melted frozen boles and made them available for water uptake (Bowling et al., 2018), and thus caused the recovery of GPPmax (Monson et al., 2005). Once the temperature was around the optimum (in the growing season), Tair was no longer the determining factor for photosynthesis. Higher VPD caused by rising Tair can stress the plants such that stomata closed, intercellular CO2 reduced, and photosynthesis decreased (Fig. S3a right panel). When intercellular CO2 concentration was not a limiting factor, GPPmax was more representative of Vcmax and did not vary T significantly.
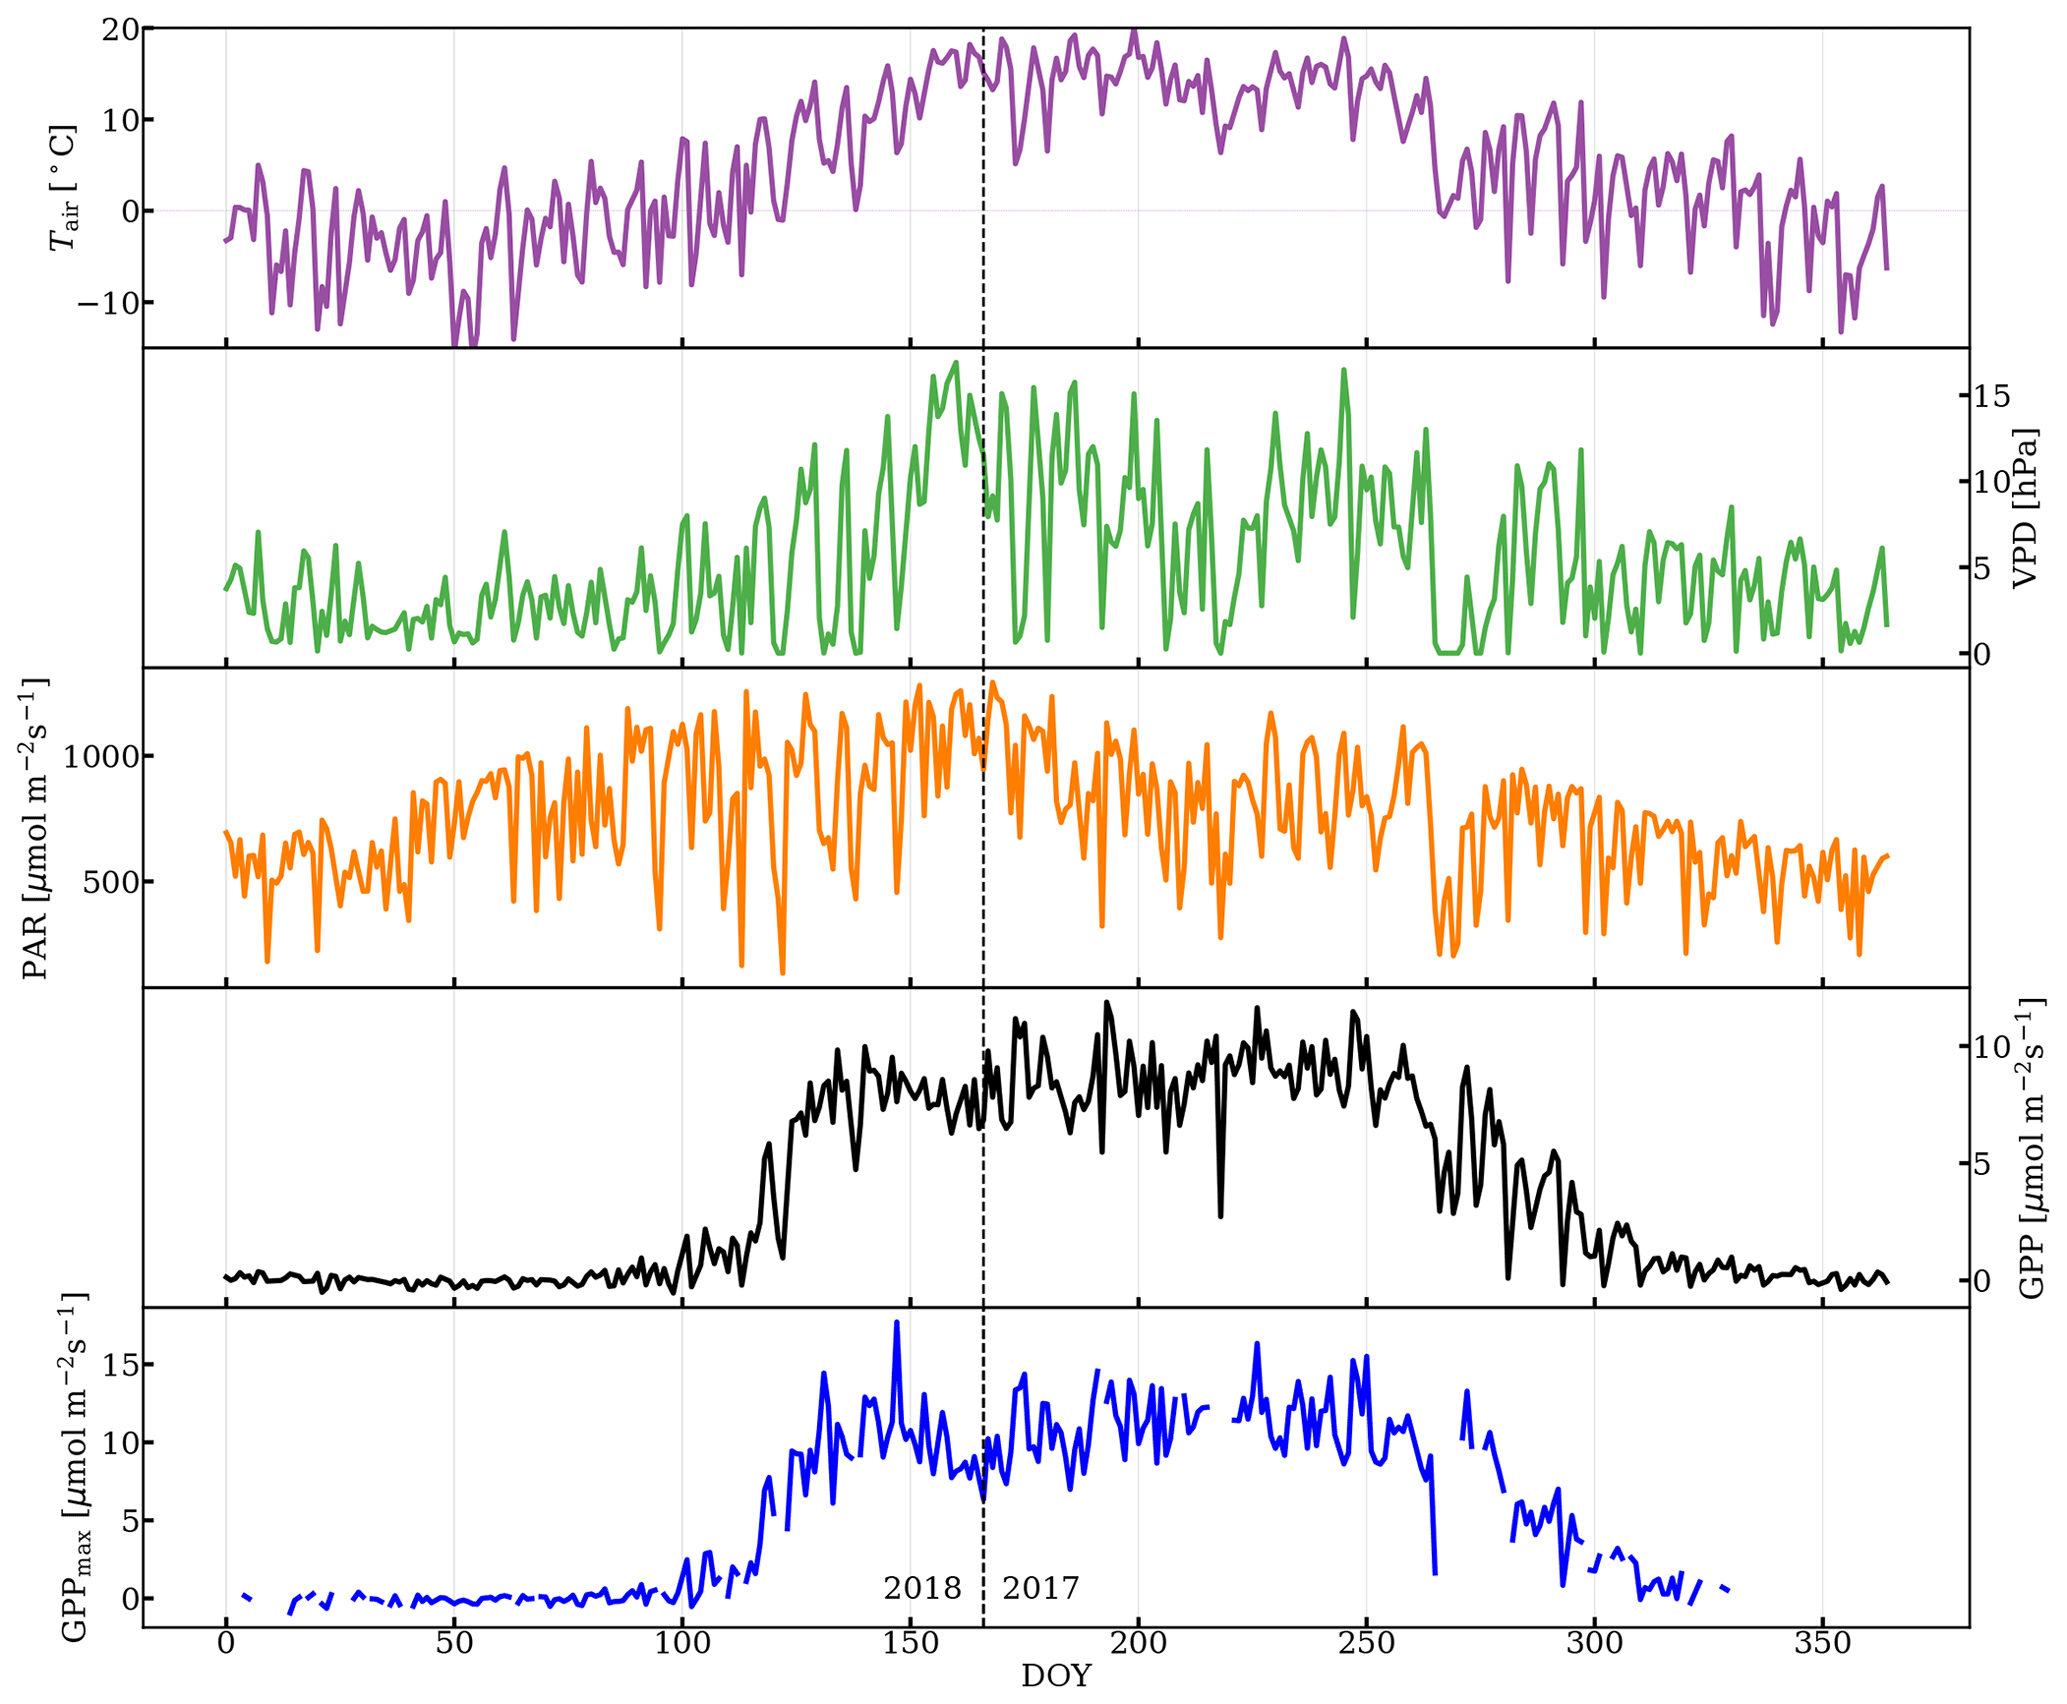
Figure 3Daily-averaged time series of air temperature (Tair), vapor pressure deficit (VPD), photosynthetically active radiation (PAR), gross primary production (GPP) from half-hourly data when PAR was greater than 100 µmol m−2 s−1, and time series of GPPmax. DOY 166 (2017) was the first day of observation. The vertical dashed line divides the observations from day of year (DOY) for the years 2017 and 2018.
3.2 Seasonal cycle of reflectance
In Fig. 4, the Jacobians show the maximum sensitivity of the reflectance spectral shape to carotenoid content at 524 nm, and near 566 and 700 nm for chlorophyll. The first peak of the chlorophyll Jacobian covers a wide spectral range in the visible range, while the second peak around the red edge is narrower.
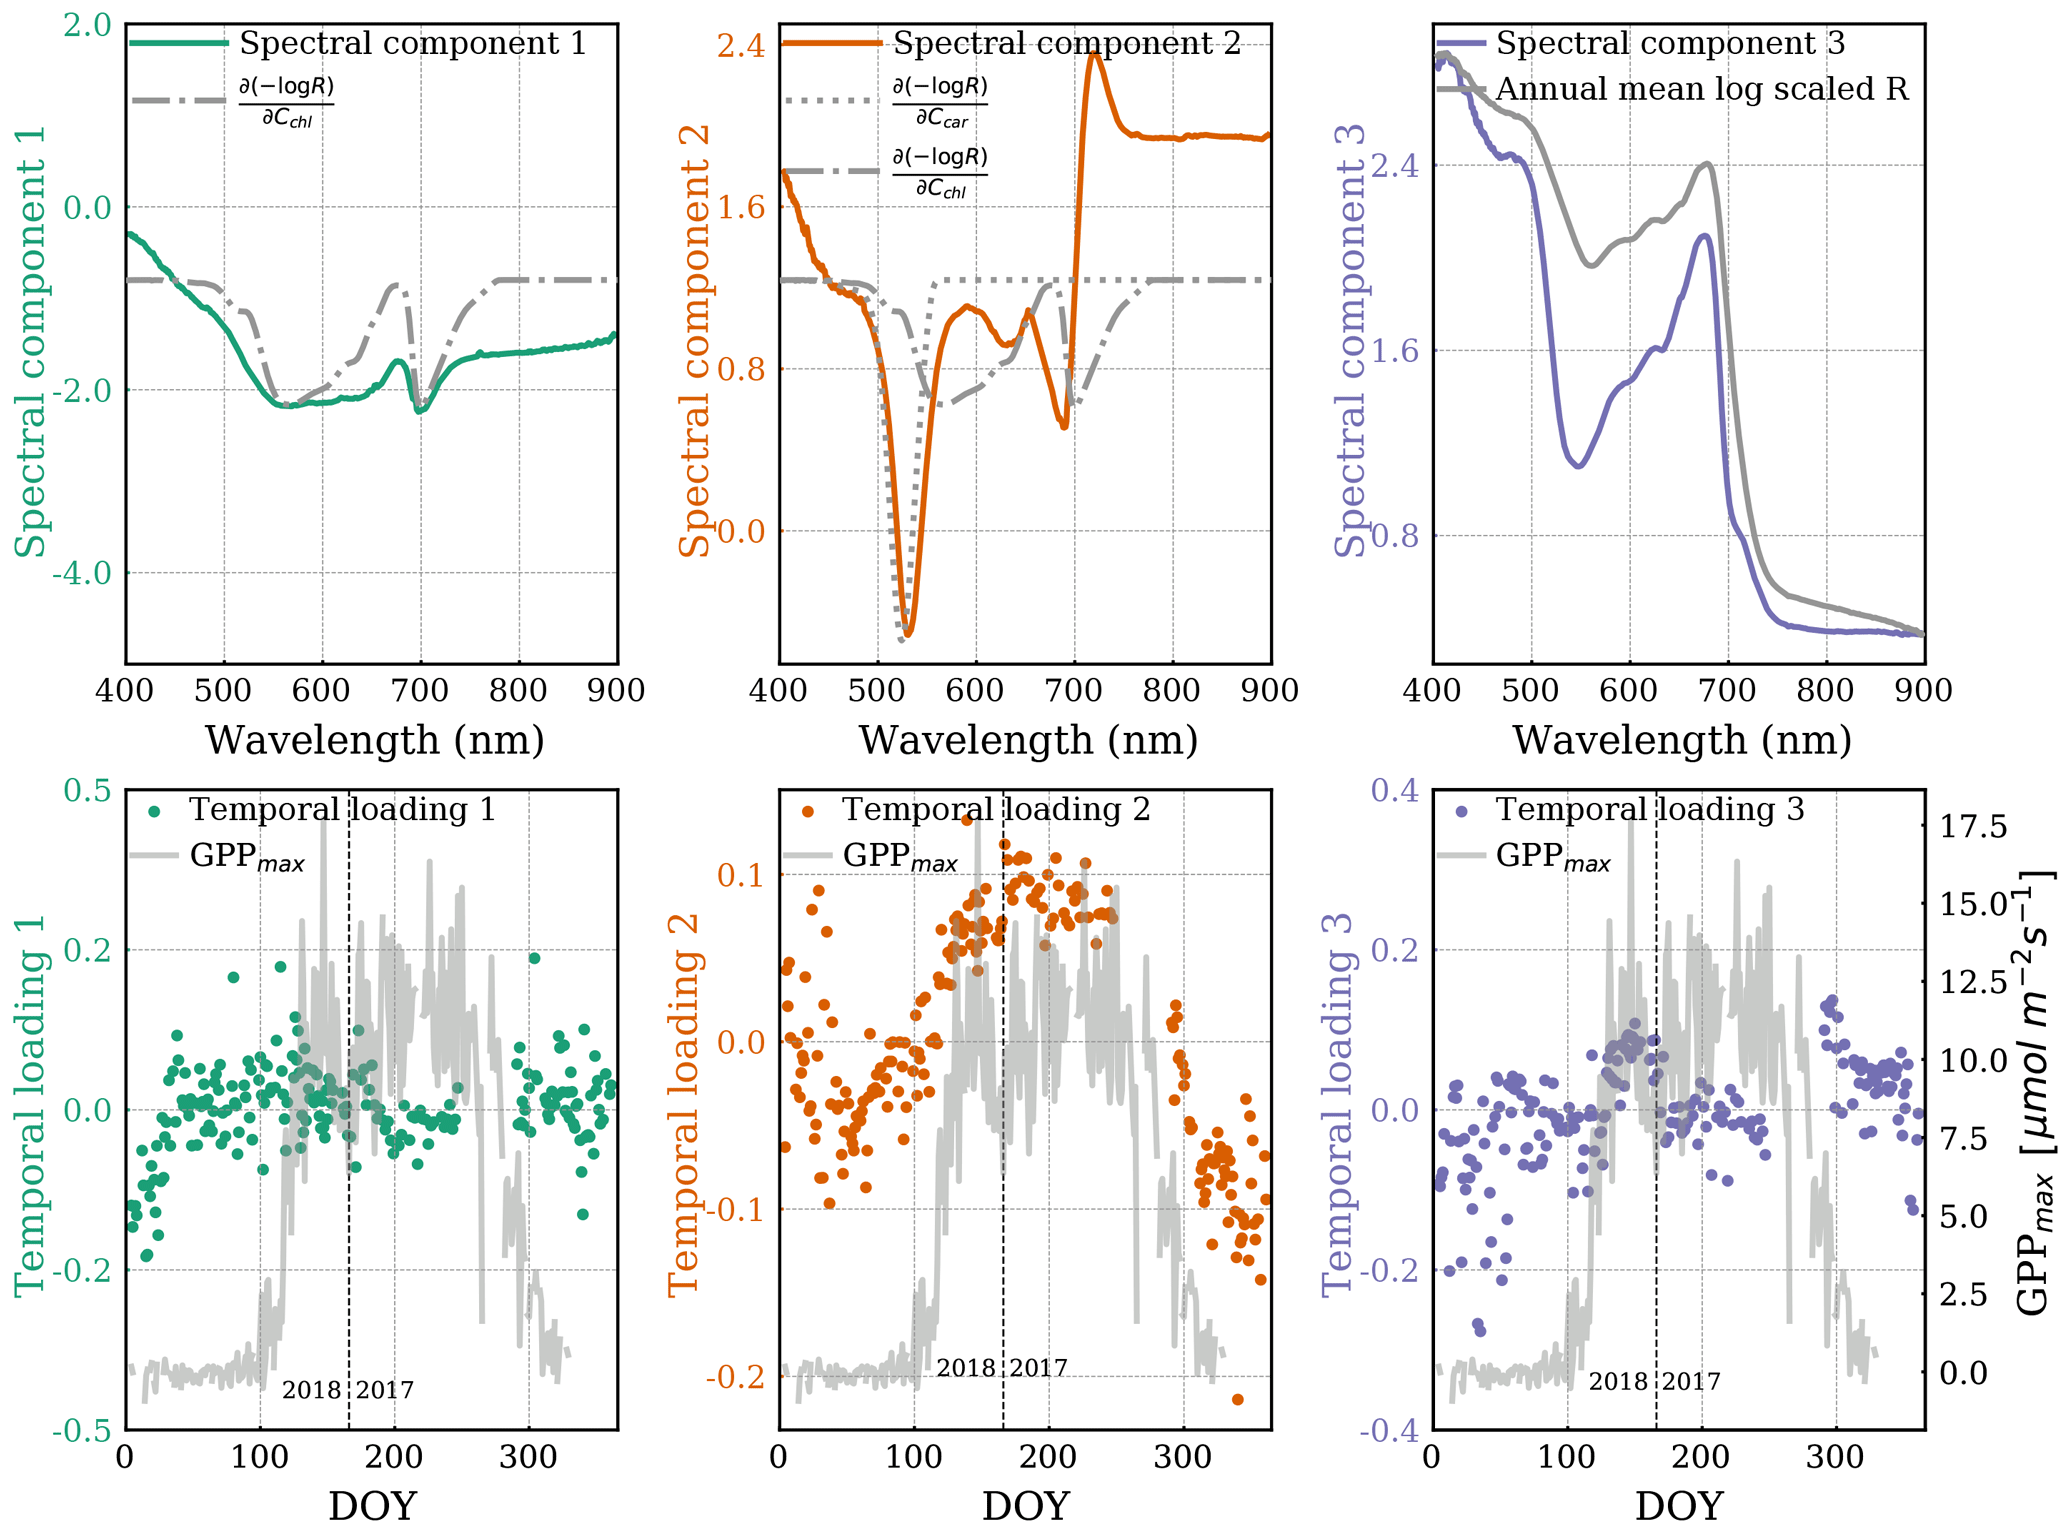
Figure 4A set of three spectral components (top, colored) and corresponding temporal loadings (bottom, colored) from ICA decomposition. The first spectral component is overlaid with the chlorophyll Jacobian (, dashed–dotted), and the second spectral component is overlaid with the carotenoid Jacobian (, dotted). The third spectral component is overlaid on the annual mean shape of transformed reflectance spectra. Temporal loadings are overlaid with GPPmax (grey line). The axis of Jacobians is not shown because its magnitude is arbitrary here. The vertical dashed line divides the observations from DOY for the years 2017 and 2018.
It can be seen that the first spectral ICA component has a similar shape as the chlorophyll Jacobian. The corresponding temporal loading has a range between −0.2 and 0.2 without any obvious seasonal variation, consistent with a negligible seasonal cycle in chlorophyll content as shown in the pigment analysis. However, there is a gradual increase before DOY 50 in the first temporal loading, which appears to be anti-correlated with the temporal loading of the second ICA structure.
Two major features in the second spectral component can be observed. One is a negative peak centered around 530 nm, which aligns with the carotenoid Jacobian. At the negative logarithm scale, the negative values resulting from the negative ICA spectral peak multiplied by the positive ICA temporal loadings (growing season in Fig. 4 middle plots) indicate there were fewer carotenoids during the growing season (Eqs. 2 and 4). Conversely, positive values resulting from a negative spectral peak multiplied by the negative temporal loadings (dormancy in Fig. 4 middle plots) indicate there were more carotenoids during dormancy (i.e., sustained photoprotection via the xanthophyll pigments; Bowling et al., 2018). Another feature is the valley-trough shape, which is co-located with the chlorophyll Jacobian center at the longer wavelength in the red-edge region. The center of this feature occurs at the shorter-wavelength edge of the chlorophyll Jacobian but does not easily explain changes in total chlorophyll content, which should show equal changes around 600 nm. The corresponding temporal loading apparently varied seasonally with GPPmax.
The second temporal loading transitioned more gradually from dormancy to the peak growing season than GPPmax. Unfortunately, we were missing data to evaluate the relative timing of GPPmax cessation.
The third spectral component is similar to the mean shape of reflectance spectra. Its temporal loading remained around zero throughout the year.
Overall, the second ICA spectral component is more representative of the seasonal variation in the magnitude of total canopy reflectance than the other spectral components. The spectral changes around the red edge in the second component are interesting and might be related to structural needle changes in chlorophyll-a and chlorophyll-b contributions (de Tomás Marín et al., 2016; Rautiainen et al., 2018), which are not separated in PROSPECT.
CCI and PRI (Fig. 5a–b) followed the seasonal cycle of GPPmax closely. CCI and PRI use reflectance near the center of the 530 nm valley feature (Eqs. 3c–3d), the spectral range that is most sensitive to the change of carotenoid content, so that they matched changes in GPPmax very well. PRI was the smoothest throughout the year, without any significant fluctuations within the growing season, as opposite to what was observed in GPPmax, which co-varied with Tair and VPD (Fig. S3a and b). This performance is intriguing given that PRI was originally developed to track short-term variations in LUE (Gamon et al., 1992), such as day-to-day and sub-seasonal scales.
GCC (Fig. 5c) also correlated well with GPPmax, but less than CCI and PRI. As can be seen in Fig. S1, the peak of the green channel used for GCC is close to the carotenoid Jacobian peak, while the red channel feature covers a part of the chlorophyll Jacobian feature. This explained the sensitivity of the GCC to changes in both carotenoid content and chlorophyll. The bands used in GCC are broader than the ones used by PRI and CCI; however it still captured these variations and can be computed using RGB imagery. Gentine and Alemohammad (2018) found that the green band helps to reconstruct variations in SIF using reflectances from MODIS. While they speculated that most variations in SIF are related to variations in PAR⋅fPAR (Gentine and Alemohammad, 2018), we suggest here that the green band indeed captures variations in LUE as well.
NDVI (Fig. 5e) and NIRv (Fig. 5f) did not show an obvious seasonal variability.
Similar to the ICA components, all VIs were quite noisy during dormancy, especially prior to DOY 50. This noise may be due to snow because we only removed the reflectance when the canopy was snow covered. Scattered photons possibly still reached the telescope when there was snow on the ground, which is true for our study site as snowpack exists in winter (Bowling et al., 2018).
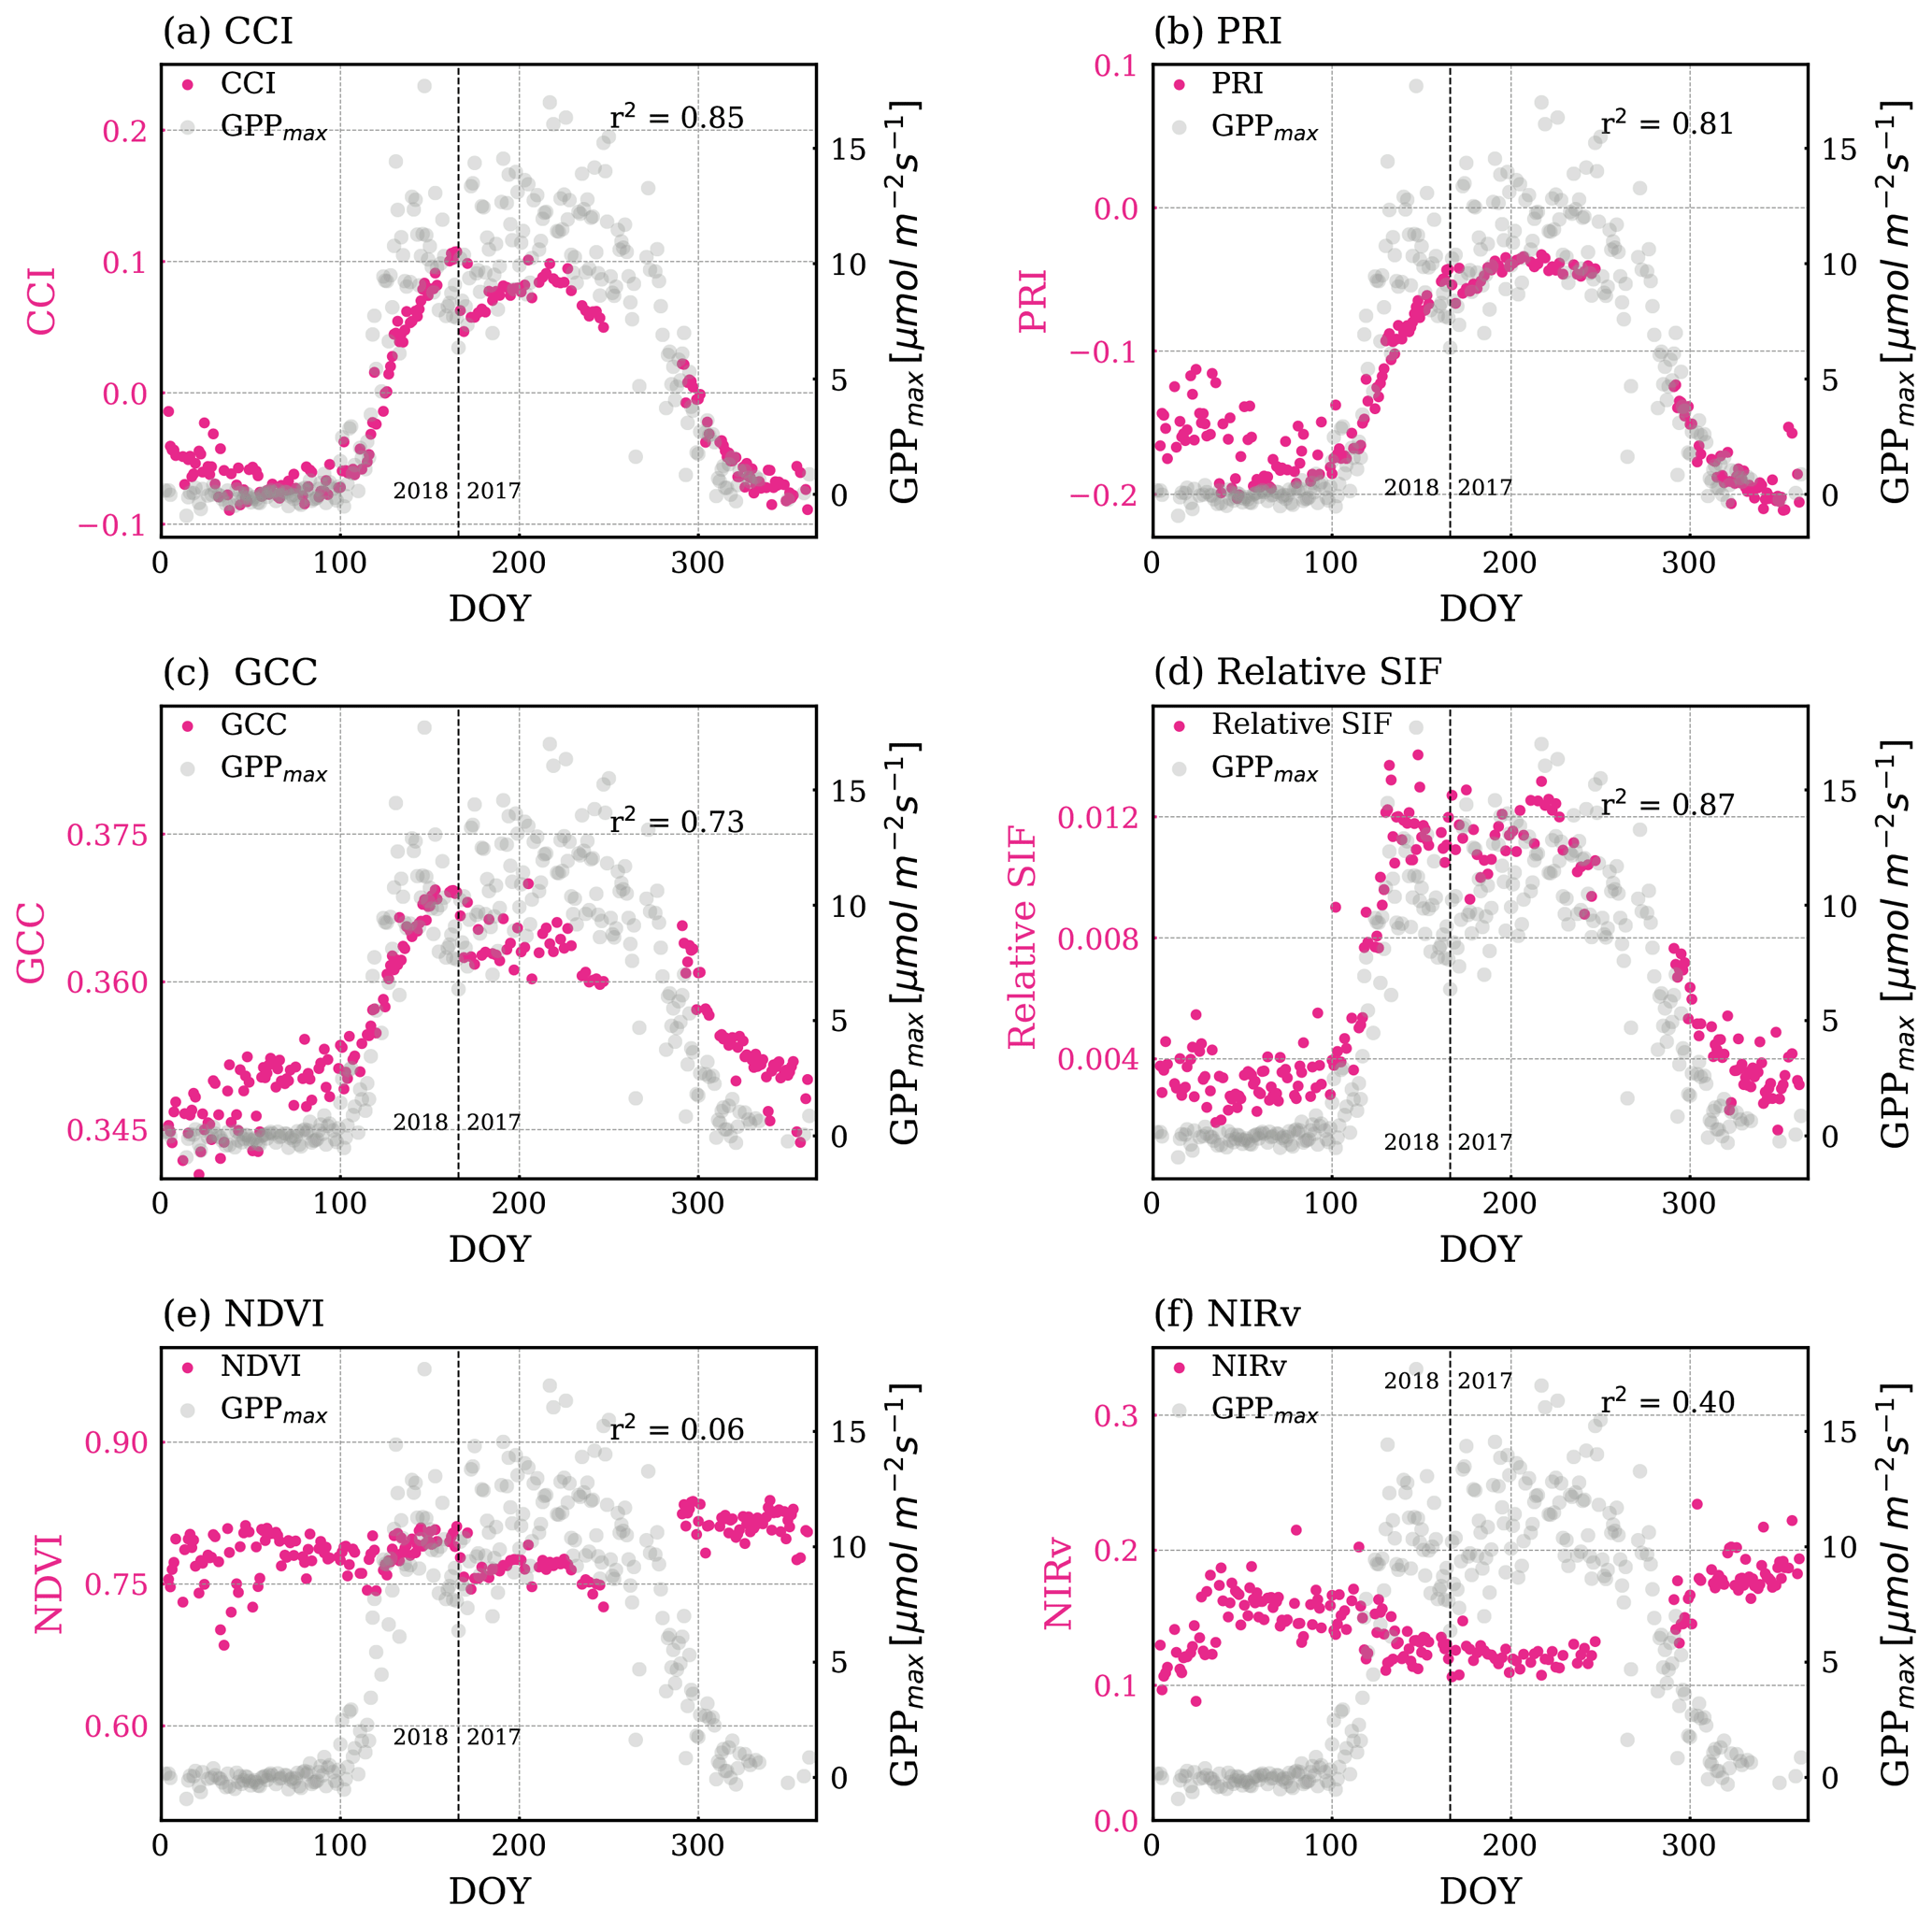
Figure 5Magenta points are time series of VIs: (a) CCI, (b) PRI, (c) GCC, (d) relative SIF, (e) NDVI, (f) NIRv. The grey points in the background show GPPmax. The Pearson r2 values of regressing VIs and GPPmax are noted in each plot. The p values of all correlations in this figure are less than 0.005. The vertical dashed line divides the observations from DOY for the years 2017 and 2018.
3.3 PLSR coefficients of reflectance with GPPmax and pigment measurements
The spectral shape of the PLSR coefficient with GPPmax highlighted a peak (centering at 532 nm) near that of the carotenoid Jacobian with the same valley-trough feature observed near the second peak of the chlorophyll Jacobian (Fig. 6a).
The reconstructed GPPmax captured the onset and cessation of growth, while the day-to-day noise in reflectance during dormancy propagated to the reconstructed GPPmax (−2 to 5 µmol m−2 s−1). During the growing season, the day-to-day variations in GPPmax were not captured by any of the methods using pigment absorption features (Figs. 5a–c and 6b), which indicates those variations were not related to pigment content, but rather changes in environmental conditions that lead to day-to-day changes in photosynthesis (Fig. S3a). Overall, the observed GPPmax was significantly correlated with the PLSR reconstruction (Pearson r2=0.87), but very similar compared to CCI and PRI.

Figure 6(a) The PLSR coefficient of reflectance with GPPmax is the blue line. The overlaid dashed–dotted and dotted lines are chlorophyll and carotenoid Jacobians, respectively. The overlaid orange solid line is the second ICA spectral component, which was scaled to fit to the plot without a y axis. (b) The reconstructed GPPmax (blue) by PLSR is overlaid with the observed GPPmax (red). The vertical dashed line divides the observations from DOY for the years 2017 and 2018.
A similar PLSR model of reflectance but with pigment measurements (Fig. 7) showed a direct link between pigment contents and reflectance. It can be seen that the PLSR coefficients of reflectance are very similar, irrespective of the target variable. They feature a valley near the peak of the carotenoid Jacobian and a valley-trough feature near the peak at the longer wavelength of the chlorophyll Jacobian. This spectral shape is also very similar to the second ICA spectral component and PLSR coefficients of GPPmax. V + A + Z, chl : car, and car were all nicely reconstructed by using the PLSR coefficients and reflectance (Fig. 7b). The reconstructed V + A + Z, car, and chl:car are correlated with the measured ones with Pearson r2 values of 0.84, 0.71, and 0.93, respectively.
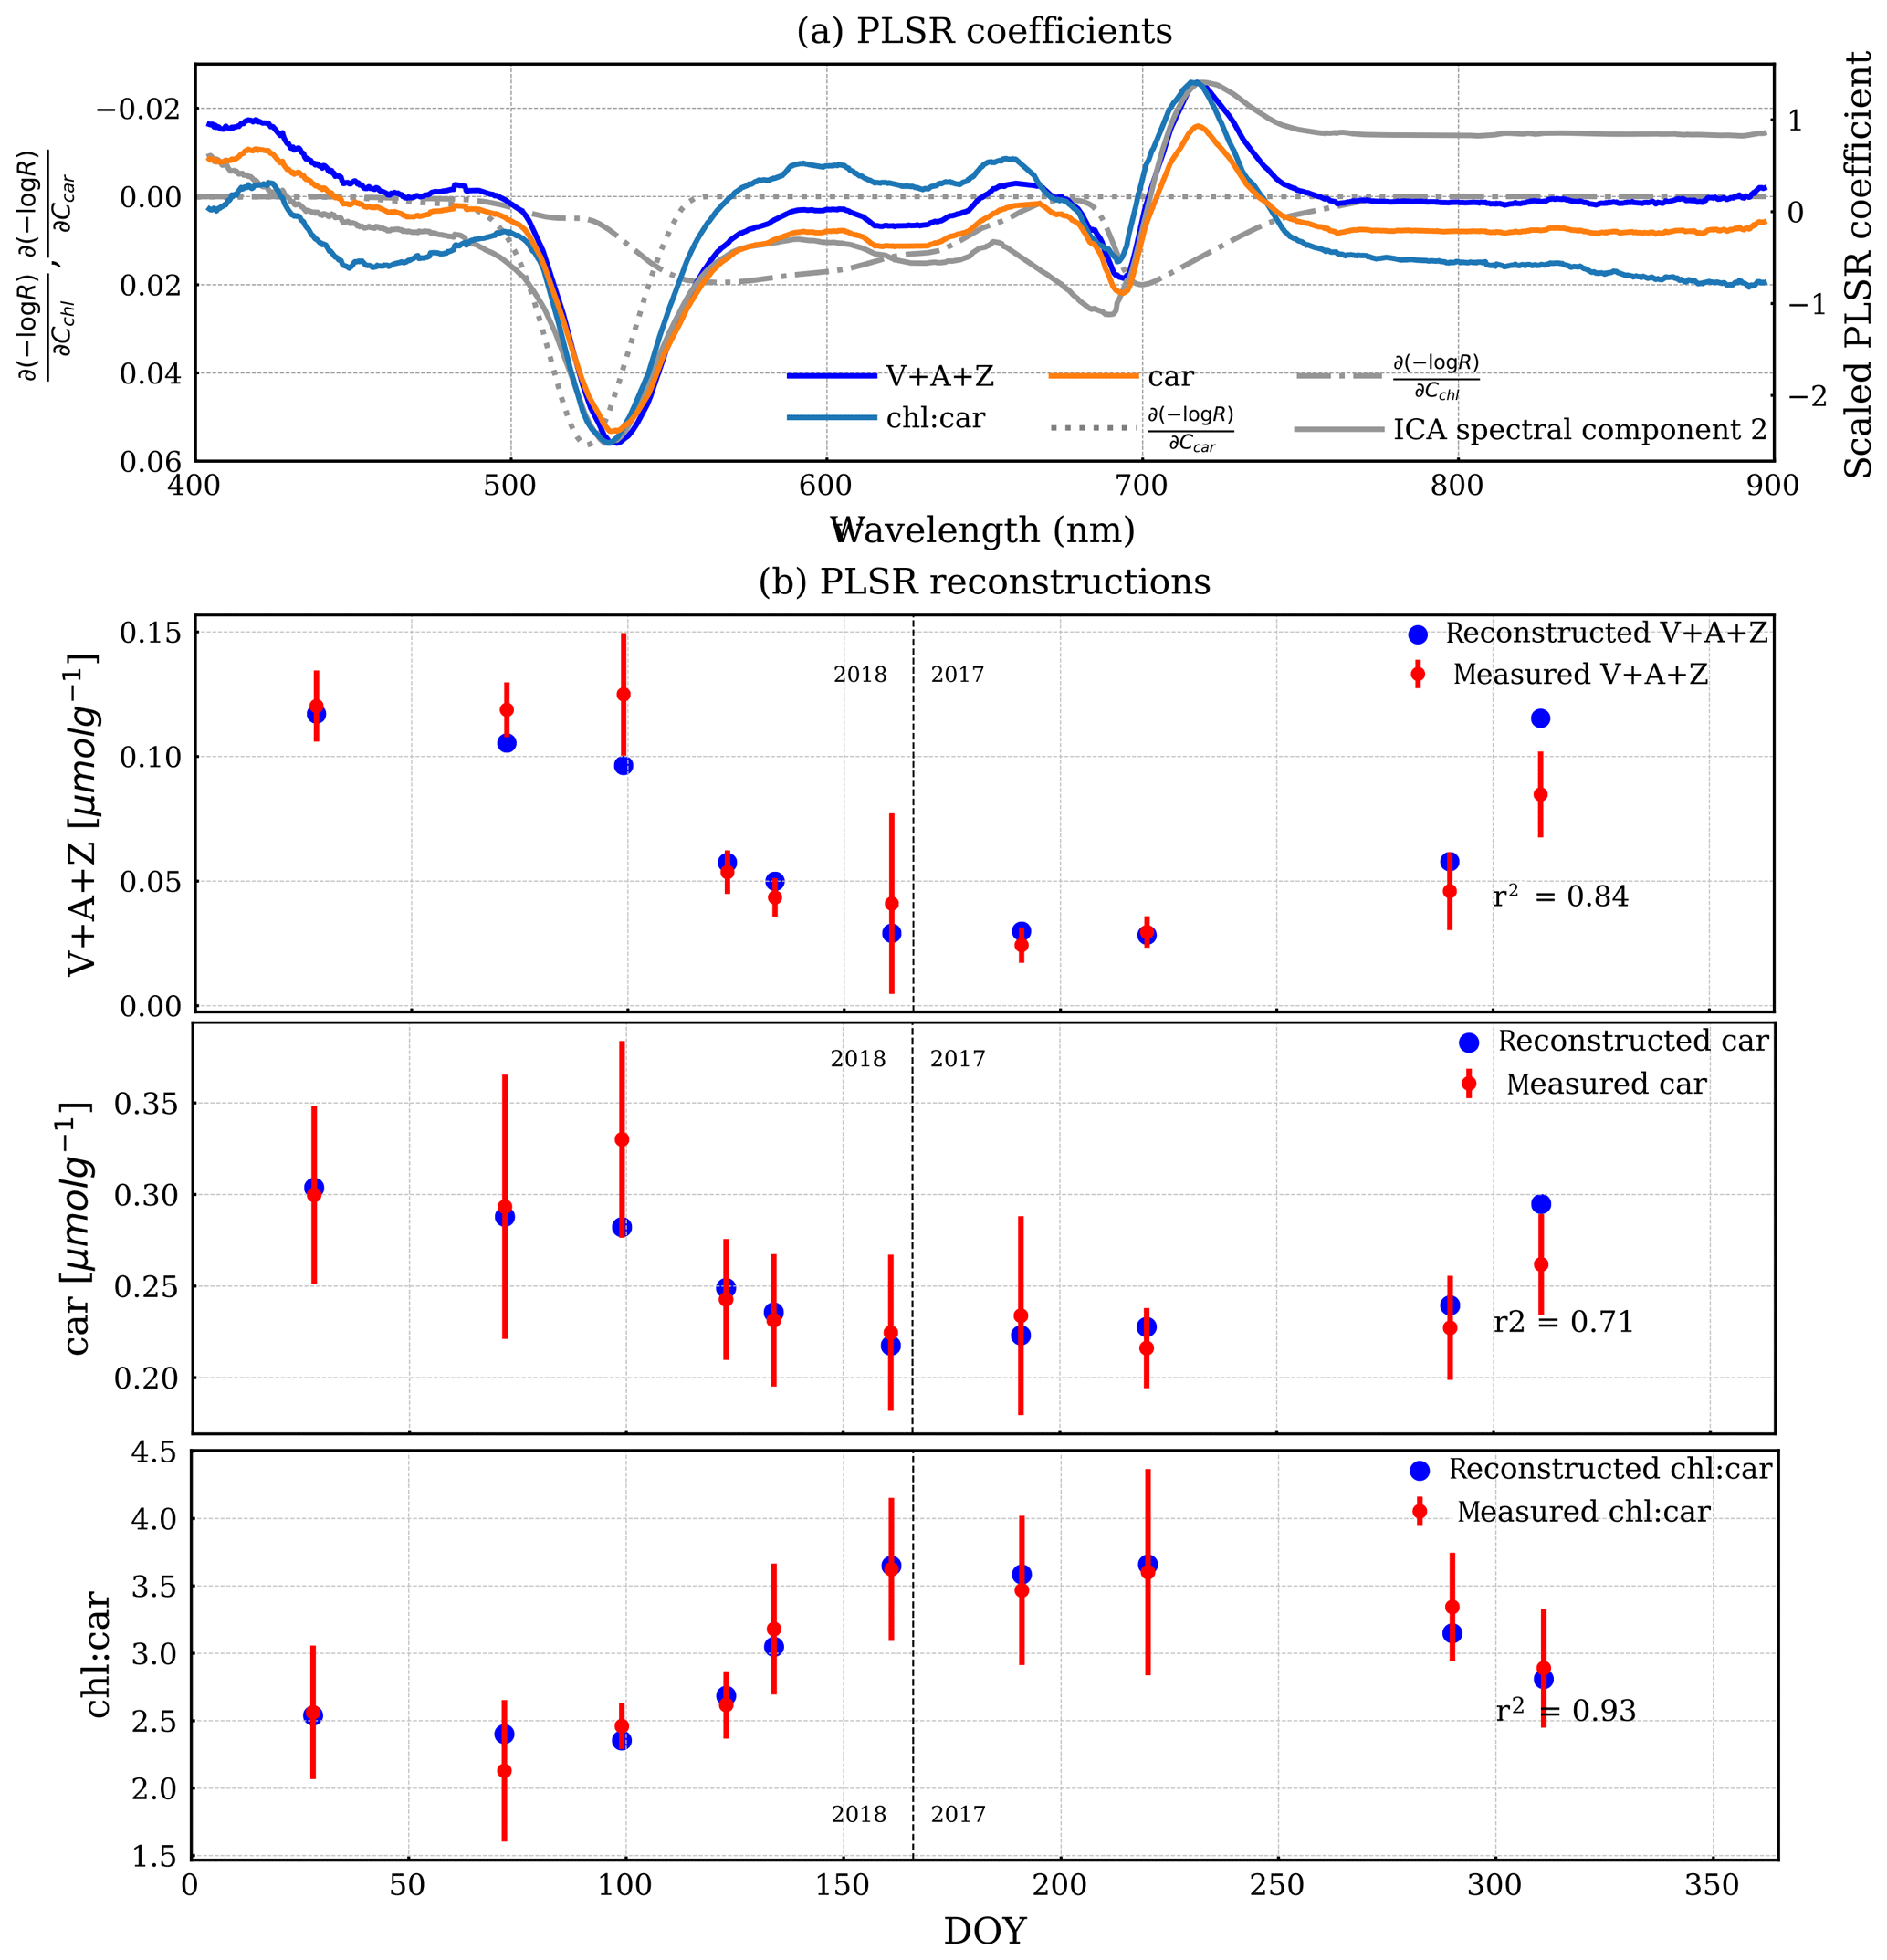
Figure 7(a) PLSR coefficients of reflectance and three pigment measurements. The overlaid dashed–dotted and dotted lines are chlorophyll and carotenoid Jacobians, respectively. The overlaid solid grey line is the second ICA spectral component, which is scaled to fit to the plot without a y axis. (b) The reconstructed pigment measurements (blue) by PLSR are overlaid with the measured mean pigment measurements (red). The error bar is 1 standard deviation of the measurements. The vertical dashed line divides the observations from DOY for the years 2017 and 2018.
The second ICA component and PLSR empirically showed the seasonality of reflectance using two different empirical frameworks. ICA only used the reflectance, while the PLSR model accounts for variations in both reflectance and GPPmax or pigment content. Yet, both ICA and PLSR agreed on similar spectral features that co-varied seasonally with GPPmax. This indicates that the resulting spectral features were primarily responsible for representing this seasonal cycle. The overlap of these features with the chlorophyll/carotenoid absorption features showed that the seasonality of GPPmax was related to variation in pigment content at the canopy scale, which was directly validated with a similar PLSR coefficient of reflectance and pigment contents. These results are consistent with leaf-level measurements of a higher ratio of chlorophyll to carotenoid content during the growing season in this forest (Fig. 7).
The highlighted spectral feature around 530 nm from ICA and PLSR closely overlaps with one of the bands used in CCI, PRI, and GCC (Eqs. 3a–3e), which provides a justification that these VIs can remarkably capture the LUE seasonality. The comparable Pearson r2 values of PLSR, CCI, and PRI with GPPmax suggest the pigment-driven seasonal cycle of GPPmax is sufficiently represented by CCI and PRI. The spectral feature around the red edge does not make PLSR significantly more correlated with GPPmax than CCI or PRI, which implies the feature is not driven by total chlorophyll or carotenoid contents.
3.4 Process-based estimation of pigment content
PROSAIL inversion results further supported the link between canopy reflectance, pigment contents, and GPPmax. Figure 8 shows a continuous time series of Cchl, Ccar, anthocyanin content (Cant), and derived from the PROSAIL canopy RTM inversion model. Examples of simulated and measured reflectance spectra shown are in Fig. C1. Anthocyanins are another type of photoprotective pigment (Pietrini et al., 2002; Lee and Gould, 2002; Gould, 2004) that protects the plants from high light intensity (Hughes, 2011). The pigment inversions closely matched the seasonality of GPPmax. showed the greatest sensitivity in capturing the seasonal cycle, with the strongest correlation to leaf level measurements (Fig. 8c). The inverted Cchl had the weakest empirical relationship with the measured one (Fig. 8a right panel). Apparently, some of the inversion errors of individual Ccar and Cchl contents canceled out in the ratio, making the ratio more stable. Cant performed similarly to Ccar, since they both are photoprotective, and the anthocyanins absorb at 550 nm (Sims and Gamon, 2002), which is close to the center of carotenoid absorption feature. Even though we lacked field measurements of anthocyanins to validate anthocyanin retrievals, the inversions showed that more than just carotenoid content can be obtained from full-spectral inversions.
Strictly speaking, the complex canopy structure of evergreens makes the application of 1D canopy RTMs such as PROSAIL difficult (Jacquemoud et al., 2009; Zarco-Tejada et al., 2019). Yet, Moorthy et al. (2008), Ali et al. (2016), and Zarco-Tejada et al. (2019) reasonably discussed the pigment retrieval in conifer forests with careful applications. In our study, the reflectance was collected from needles with a very small FOV, and our study site has a very stable canopy structure throughout the year (Burns et al., 2016). Thus, the inversion results are meaningful for discussing the seasonality of pigment contents. In the future, radiative transfer models that properly describe conifer forests, such as LIBERTY (Dawson et al., 1998), could be used.
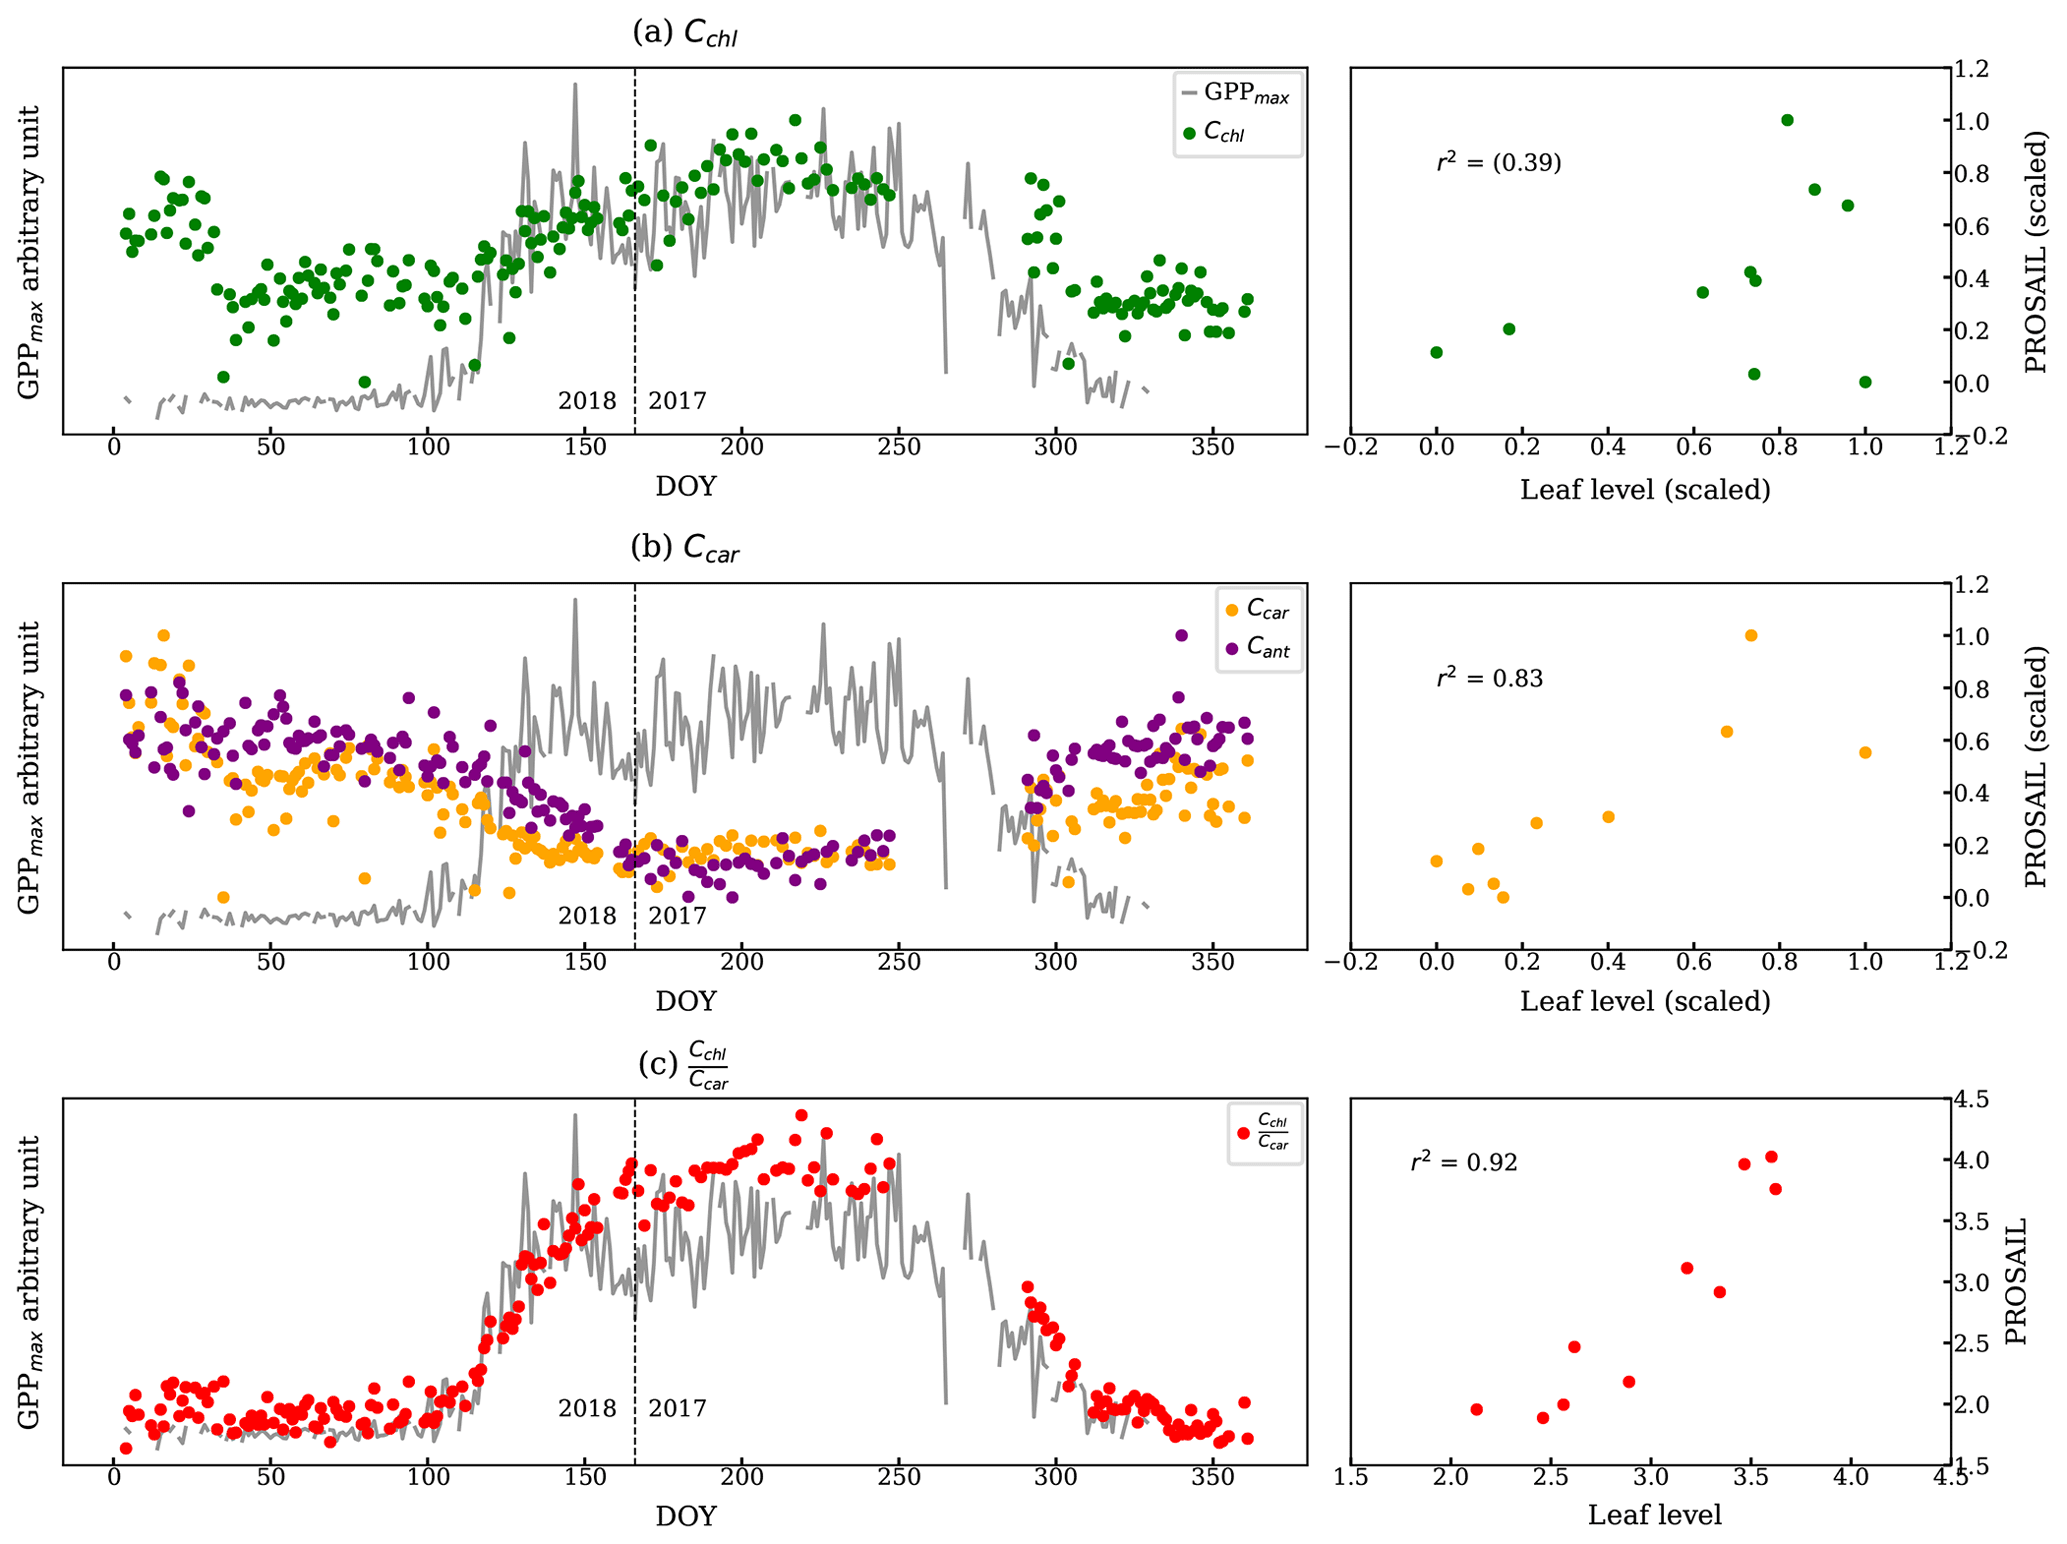
Figure 8The left panels are the estimations of (a) Cchl, (b) Ccar, Cant, and (c) from the PROSAIL overlaid with the GPPmax. We normalized two metrics because they report the pigment contents in different units. The vertical dashed line divides the observations from DOY for the years 2017 and 2018. The plots on the right compare the pigment contents from leaf-level measurements and using PROSAIL: (a) chl vs. Cchl, (b) car vs. Ccar, and (c) chl : car vs. . The correlations are statistically significant except Cchl.
3.5 Comparison across methods
Although decomposing the hyperspectral canopy reflectance and using relative SIF (Fig. 5d) both successfully tracked the seasonal cycle of evergreen LUE, they underlie different de-excitation processes. During the growing season, environmental conditions primarily drove the day-to-day variations in GPPmax. Relative SIF responded to such environmental stresses (van der Tol et al., 2014) so that it appeared to track sub-seasonal variations better than reflectance, particularly during the growing season (Fig. S5f). Yet, reflectance decompositions and VIs were less sensitive to such day-to-day variations (Figs. 6, S3b).
There was also some variability between reflectance-based methods and relative SIF during the transition periods between the growing season and dormancy. We focused on the growing season onset since the reflectance measurements were not available during the cessation period. The onset (DOY 60 to 166) described by all the methods mentioned above as well as the relative SIF are compared in Fig. 9, using a sigmoid fit to available data (Fig. D1). The observed GPPmax had the most rapid yet latest growing onset. The methods and VIs derived from or related to the pigment contents increased earlier than GPPmax – such as the ICA component, PLSR coefficient, PROSAIL , and CCI. However, they built up slowly to reach the maximum, which suggests that reduction of the carotenoid content is a slower process than the recovery of LUE. Reflectance-based VIs (Fig. 5) and decomposing methods (Figs. 4 and 8b, c) had a slower growing season onset than GPPmax, as found in Bowling et al. (2018) as well. On the other hand, relative SIF started the onset at almost the same time as the GPPmax, and it quickly reached the maximum. Therefore, using both SIF and reflectance to constrain the LUE prediction (van der Tol et al., 2014) can further improve the prediction accuracy.
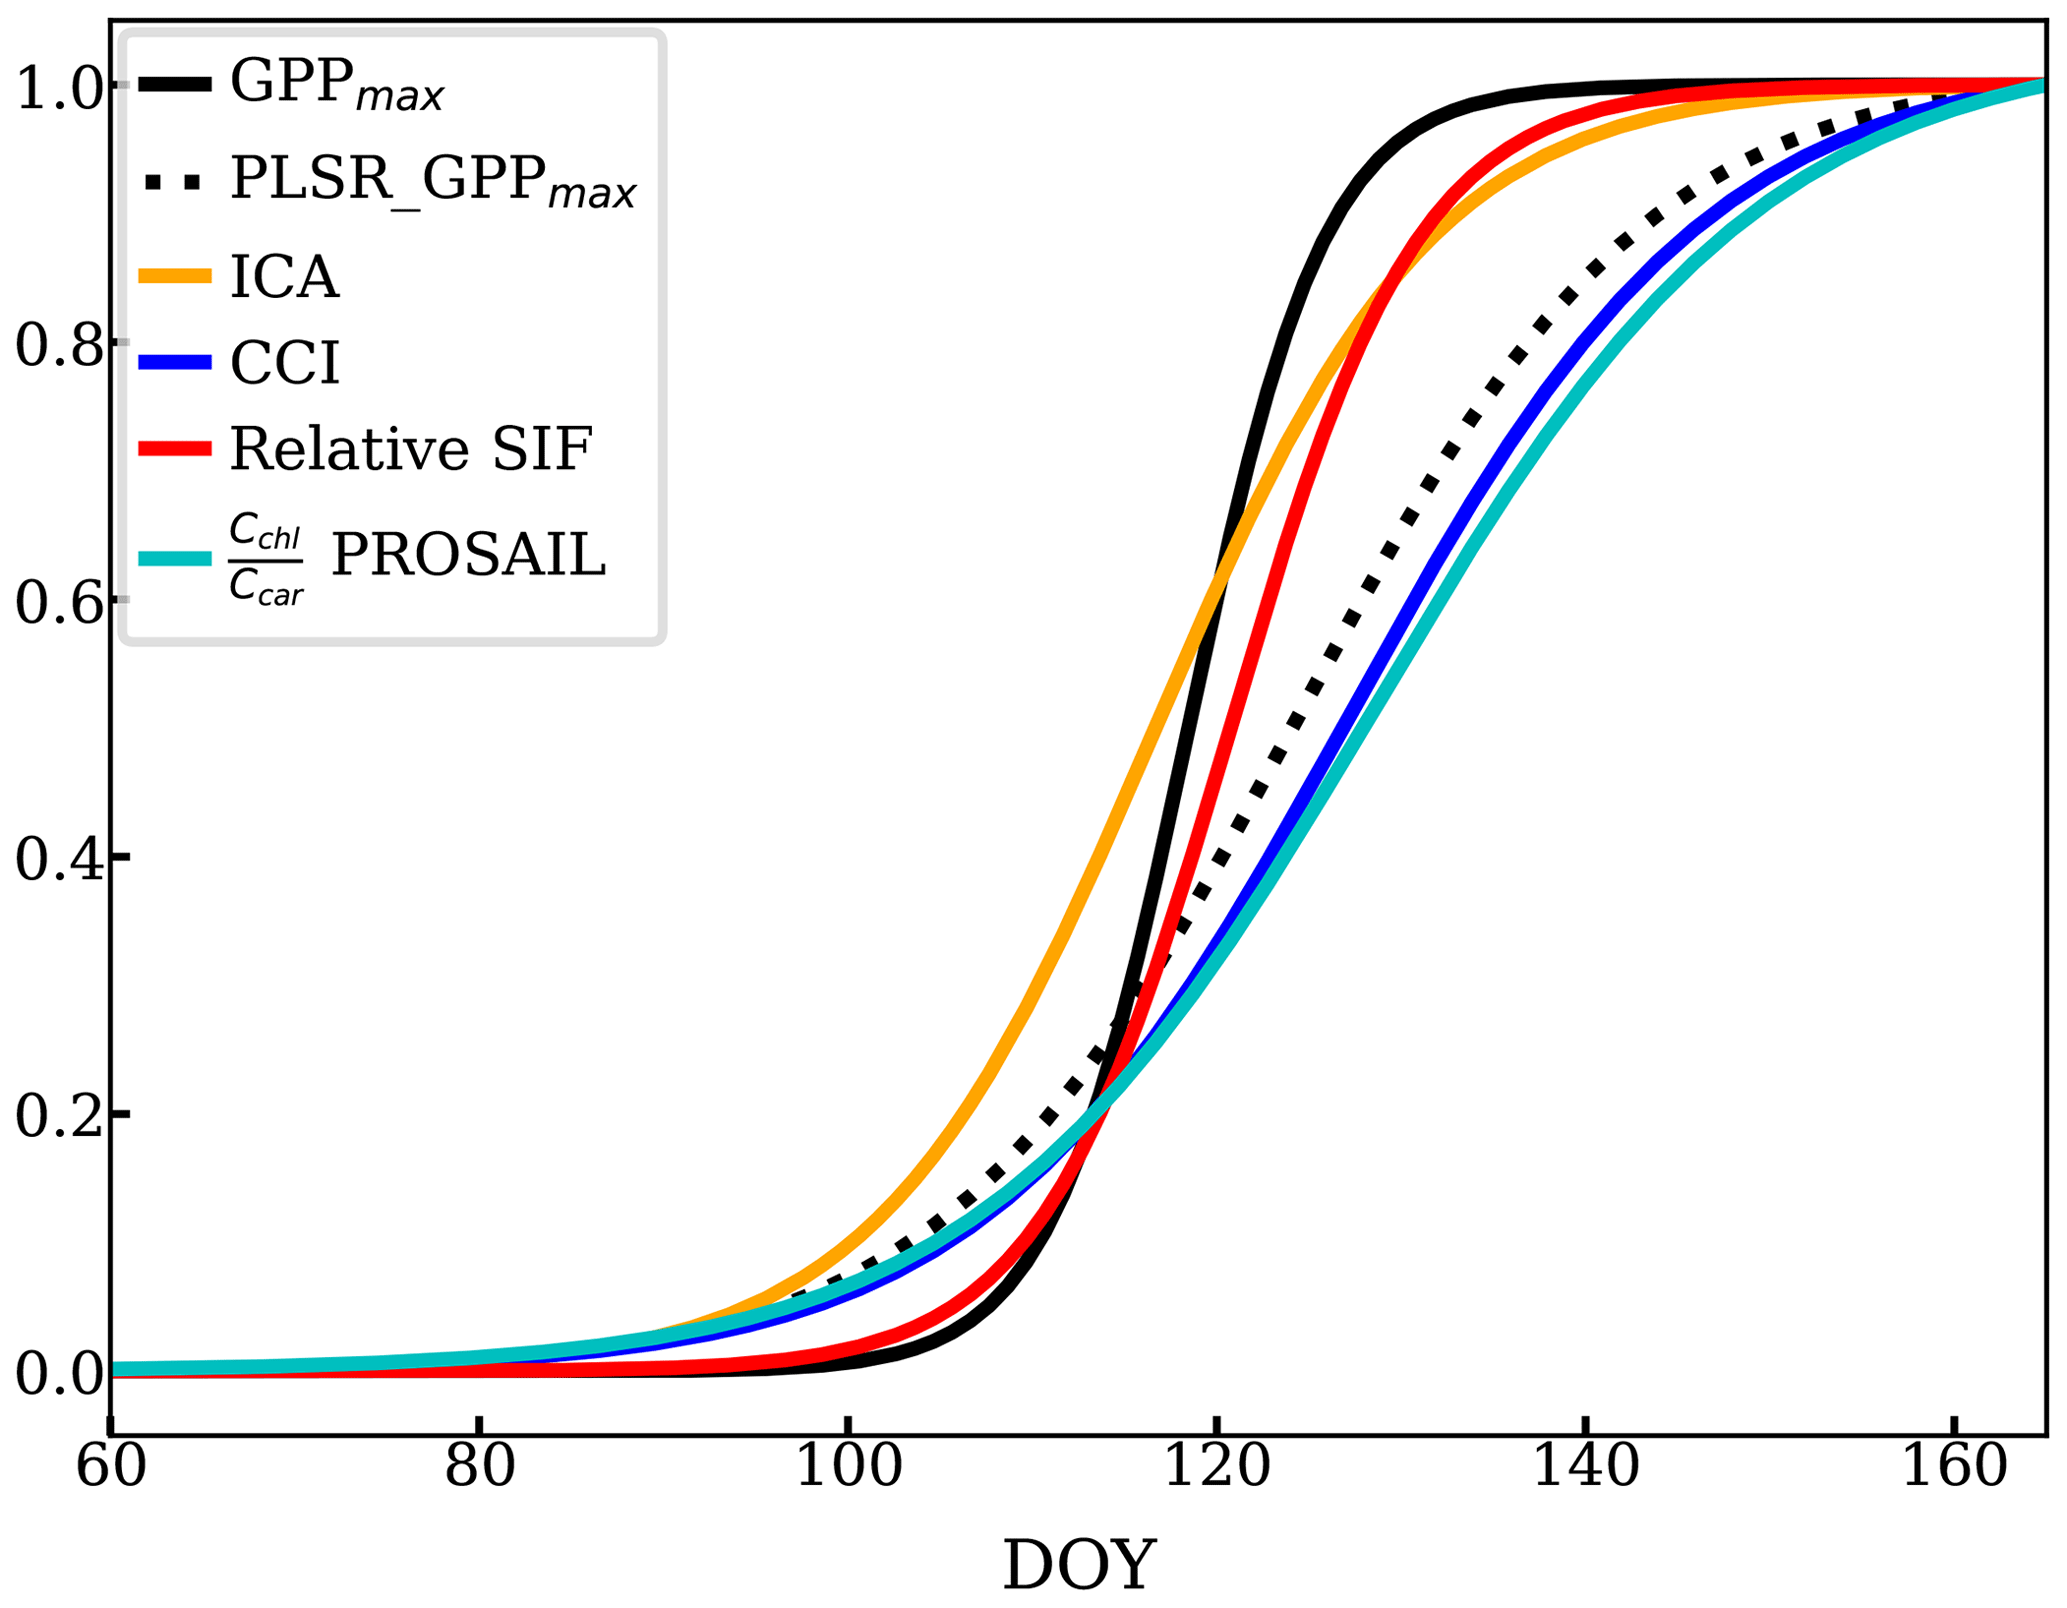
Figure 9Temporal evolution of the growing season onset using sigmoid fits (scaled) of PLSR, ICA, CCI, chlorophyll-to-carotenoid ratio, and relative SIF.
In this study, we analyzed seasonal co-variation in GPP and the spectrally resolved visible and near-infrared reflectance signal, as well as several commonly used VIs. The main spectral feature centered around 530 nm is most important for inferring the seasonal cycle of reflectance (400–900 nm) and LUE, which corresponds to changes in carotenoid content. This explains why CCI, PRI, and GCC track GPP seasonality so well, as most variations are driven by carotenoid pool changes. Our analysis included RTM simulation and in situ pigment measurements throughout the season, confirming the link between reflectance/VIs and pigment contents. The comparison of reflectance/VIs and relative SIF reveals differences in the timing of the growing season onset, pigment changes, and SIF, indicating the potential of using both reflectance and SIF to track the seasonality of photosynthesis. However, the close correspondence between both SIF and reflectance suggests that hyperspectral reflectance alone provides mechanistic evidence for a robust approach to track photosynthetic phenology of evergreen systems. Because seasonal variation in pigment concentration plays a strong role in regulating the seasonality of photosynthesis in evergreen systems, our work will help to inform future studies using hyperspectral reflectance to achieve accurate monitoring of these ecosystems. While indices like PRI and CCI are performing sufficiently as our methods which use the full-spectrum analysis at the canopy scale, the application of the full spectrum might be more robust for space-based measurements. In addition, we found seasonal changes of canopy reflectance near the red-edge region, which could be related to leaf structural changes or changes in chlorophyll a and b. Our PLSR coefficients are good references for customizing VIs to infer the photosynthetic seasonality in evergreen forest when there are restrictions to use the specific bands from currently existing VIs (such as PRI and CCI). While our current study is limited to a subalpine evergreen forest and canopy-scale measurements, applications to other regions, vegetation types, and observational platforms will be a focus for future research.
A1 NDVI and NIRv
The impact of geometry and small FOV is relatively negligible. First, our method only used the scans when FOV is on the needles by setting a NDVI threshold. Second, we plotted the NDVI and NIRv against the solar geometry at each individual tree target throughout a year. NDVI and NIRv are quite homogeneous regardless of various solar geometries as shown in the following figures.

Figure A1NDVI and NIRv of all scans targeting a pine at different solar azimuth angles and solar zenith angles throughout a year.
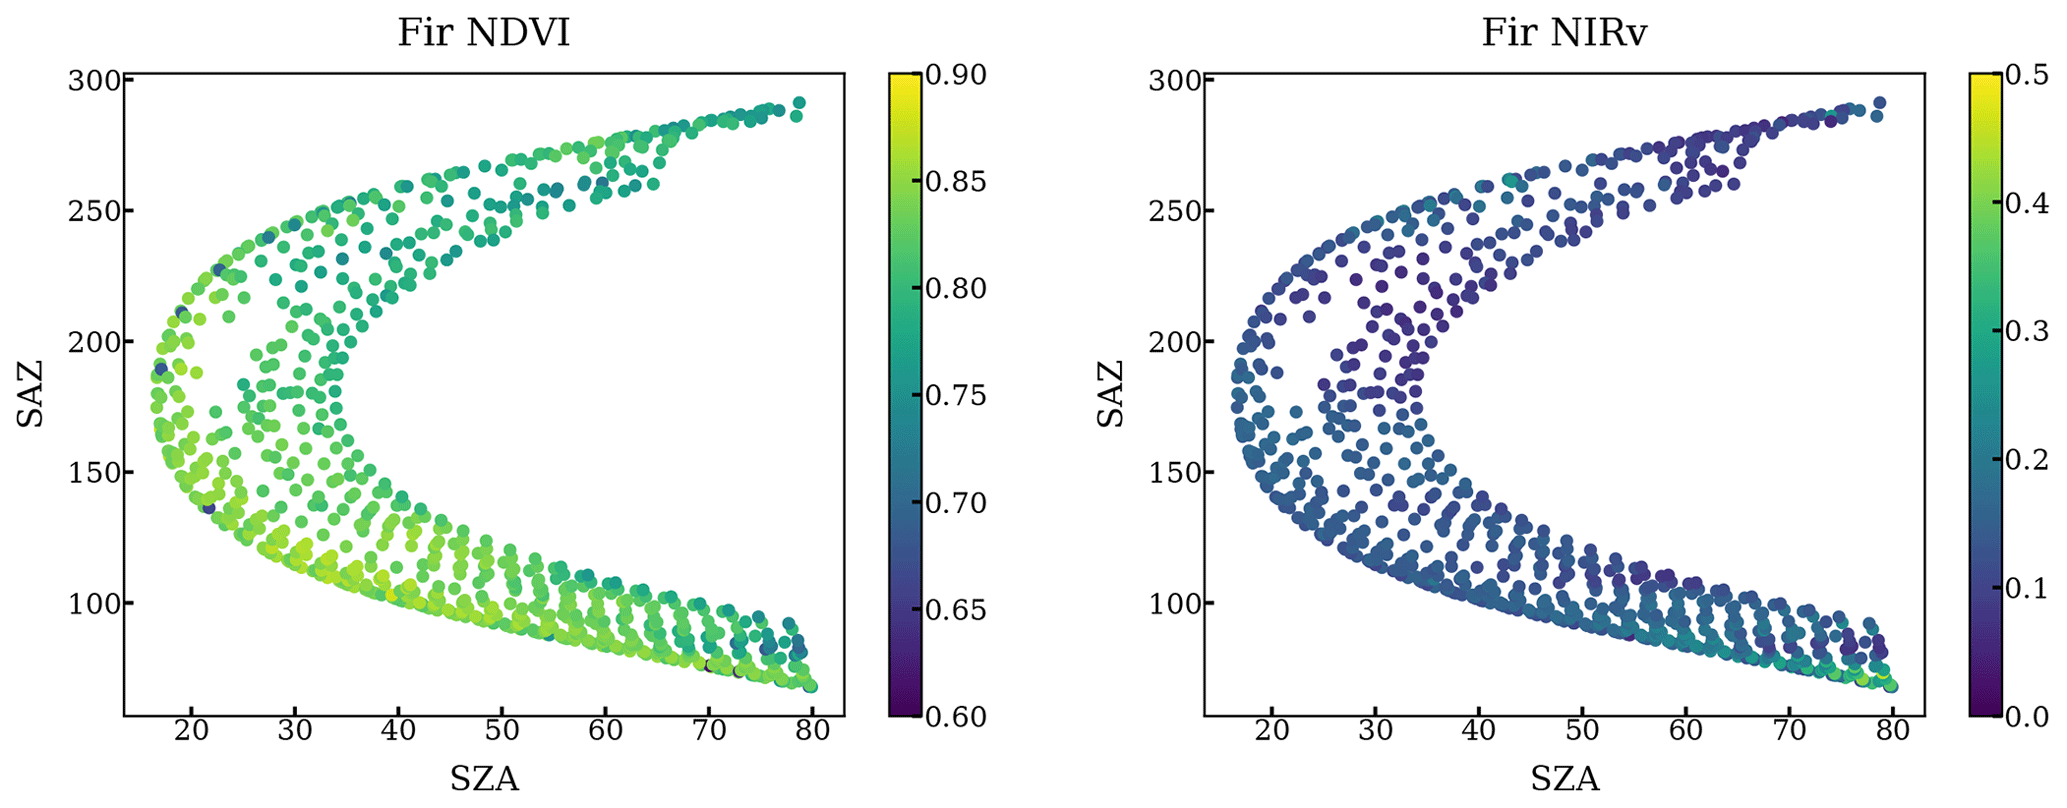
Figure A2NDVI and NIRv of all scans targeting a fir at different solar azimuth angles and solar zenith angles throughout a year.
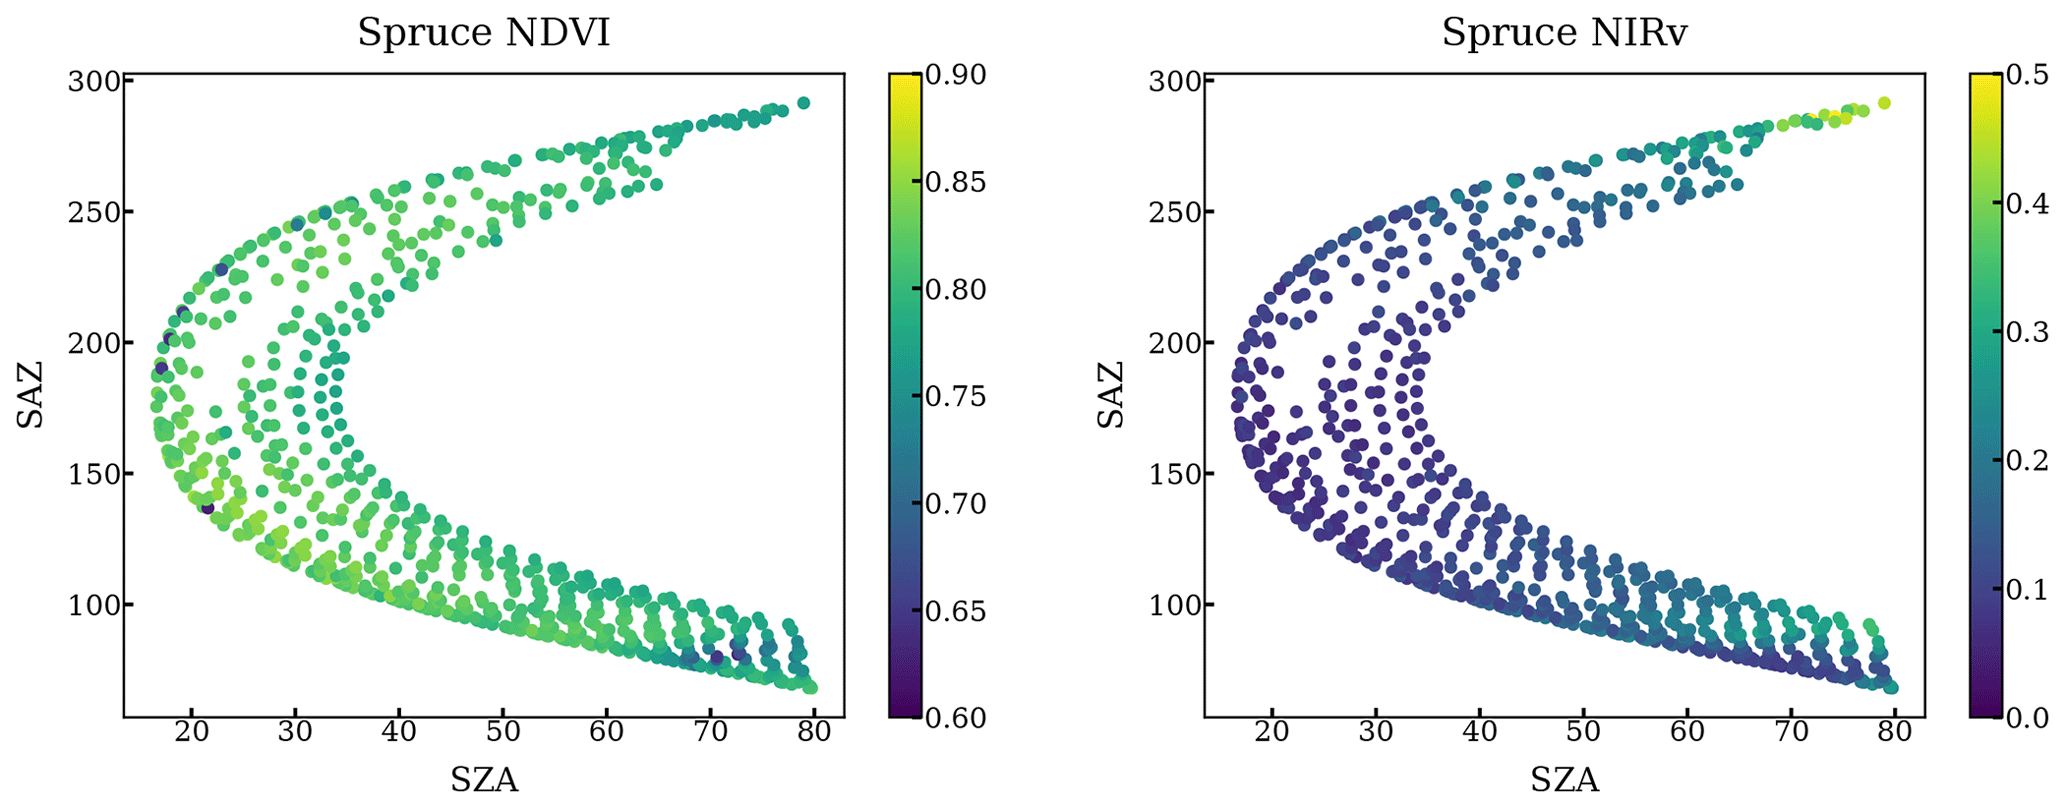
Figure A3NDVI and NIRv of all scans targeting a spruce at different solar azimuth angles and solar zenith angles throughout a year.
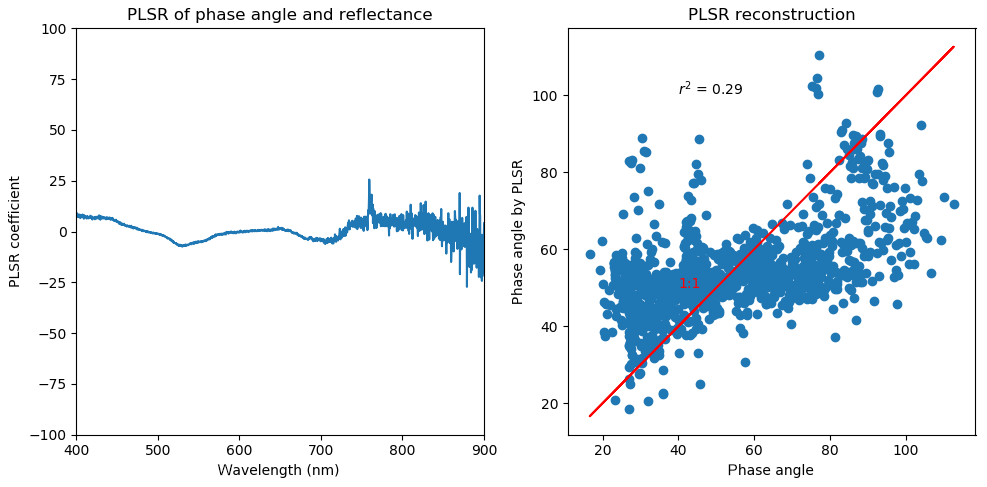
A2 PLSR on phase angle and reflectance
We did a PLSR analysis on individual measurements of phase angle and reflectance for 3 summer days (1 to 3 July 2017). The results are the same from other sample days. Indeed, the reflectance has different sensitivities to the phase angle. However, the poor correlation of PLSR reconstructed phase angle and the measured one suggests the variations in phase angle should not be the critical factor for the change in reflectance. In our study, we primarily removed the bidirectional impact by averaging all the individual reflectance that was measured at different solar geometry and viewing geometry.
First, we chose scans targeting vegetation only by requiring an NDVI greater than 0.6. Second, it is important to ensure that the solar irradiation did not change between the acquisition of the solar irradiance and the reflected radiance measurement. To achieve this, we matched the timestamps of a PAR sensor (LI-COR LI-190SA, LI-COR Environmental, Lincoln, Nebraska, US) to the timestamps of PhotoSpec, and we compared the PAR value from the PAR sensor during the PhotoSpec irradiance acquisition with PAR during the actual target scan of the reflected radiance from vegetation. We only used the scans when the ratio of the two was 1.0±0.1, ensuring stable PAR conditions. Third, in order to avoid unstable PAR because of clouds (Dye, 2004), we also removed cloudy scenes by requiring PAR to be at least 60 % of a theoretical maximum driven by solar geometry (Fig. B1). Further, only data when PAR was greater than 100 µmol m−2 s−1 were considered to eliminate the impact of low solar angles on reflectance data. The VIs shown in Fig. 5 were extracted in the same fashion as above.
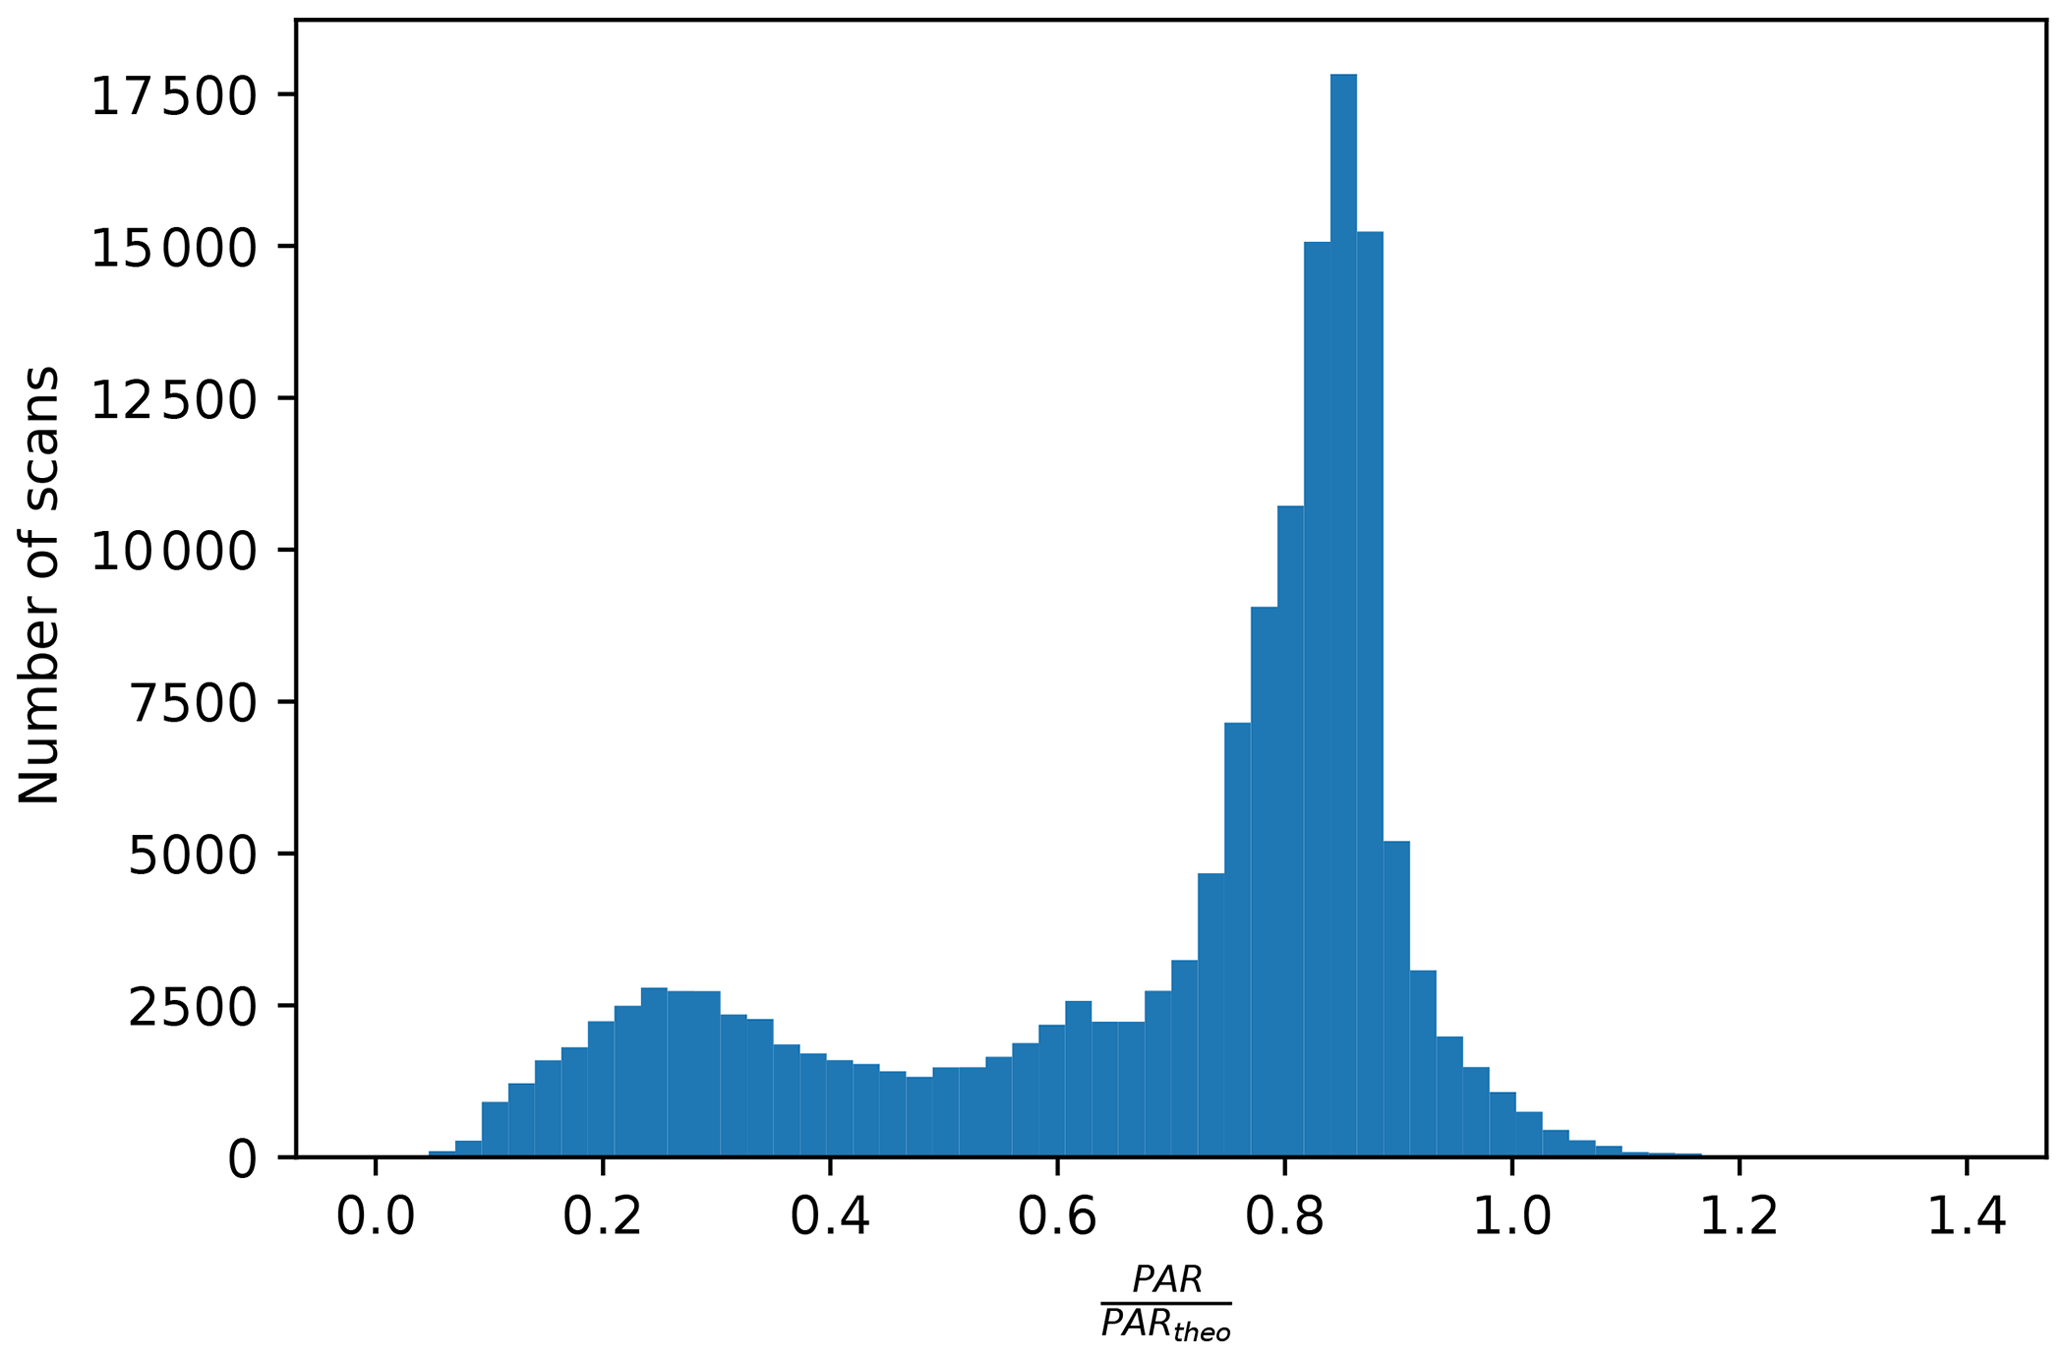
Figure B1The distribution of the ratio of the measured PAR to the PAR at theoretical maximum from all individual scans.
We used the following range constraints for variables included in the state vector of the PROSAIL inversion.
-
Leaf mesophyll structure (N): 0.9–1.1
-
Chlorophyll content (Cchl): 0–120 µmol cm−2
-
Carotenoid content (Ccar): 0–70 µmol cm−2
-
Anthocyanin content (Cant): 0–10 µmol cm−2
-
Brown pigments (Cbrown): 0–0.6
-
Water content (Cw): 0–0.2 cm
-
Dry matter content (Cm): 0–0.2 g cm−2
-
Xanthophyll cycle status (Cx) 0–1
-
Leaf area index (LAI): fixed to 4.2
The sigmoid equation is
In this form, a and b represent the maximum and minimum values of the sigmoid fit. And d is the half maximum of the fit. We obtained the optimal values of these parameters.
Proof:
If , . So,
If , . So,
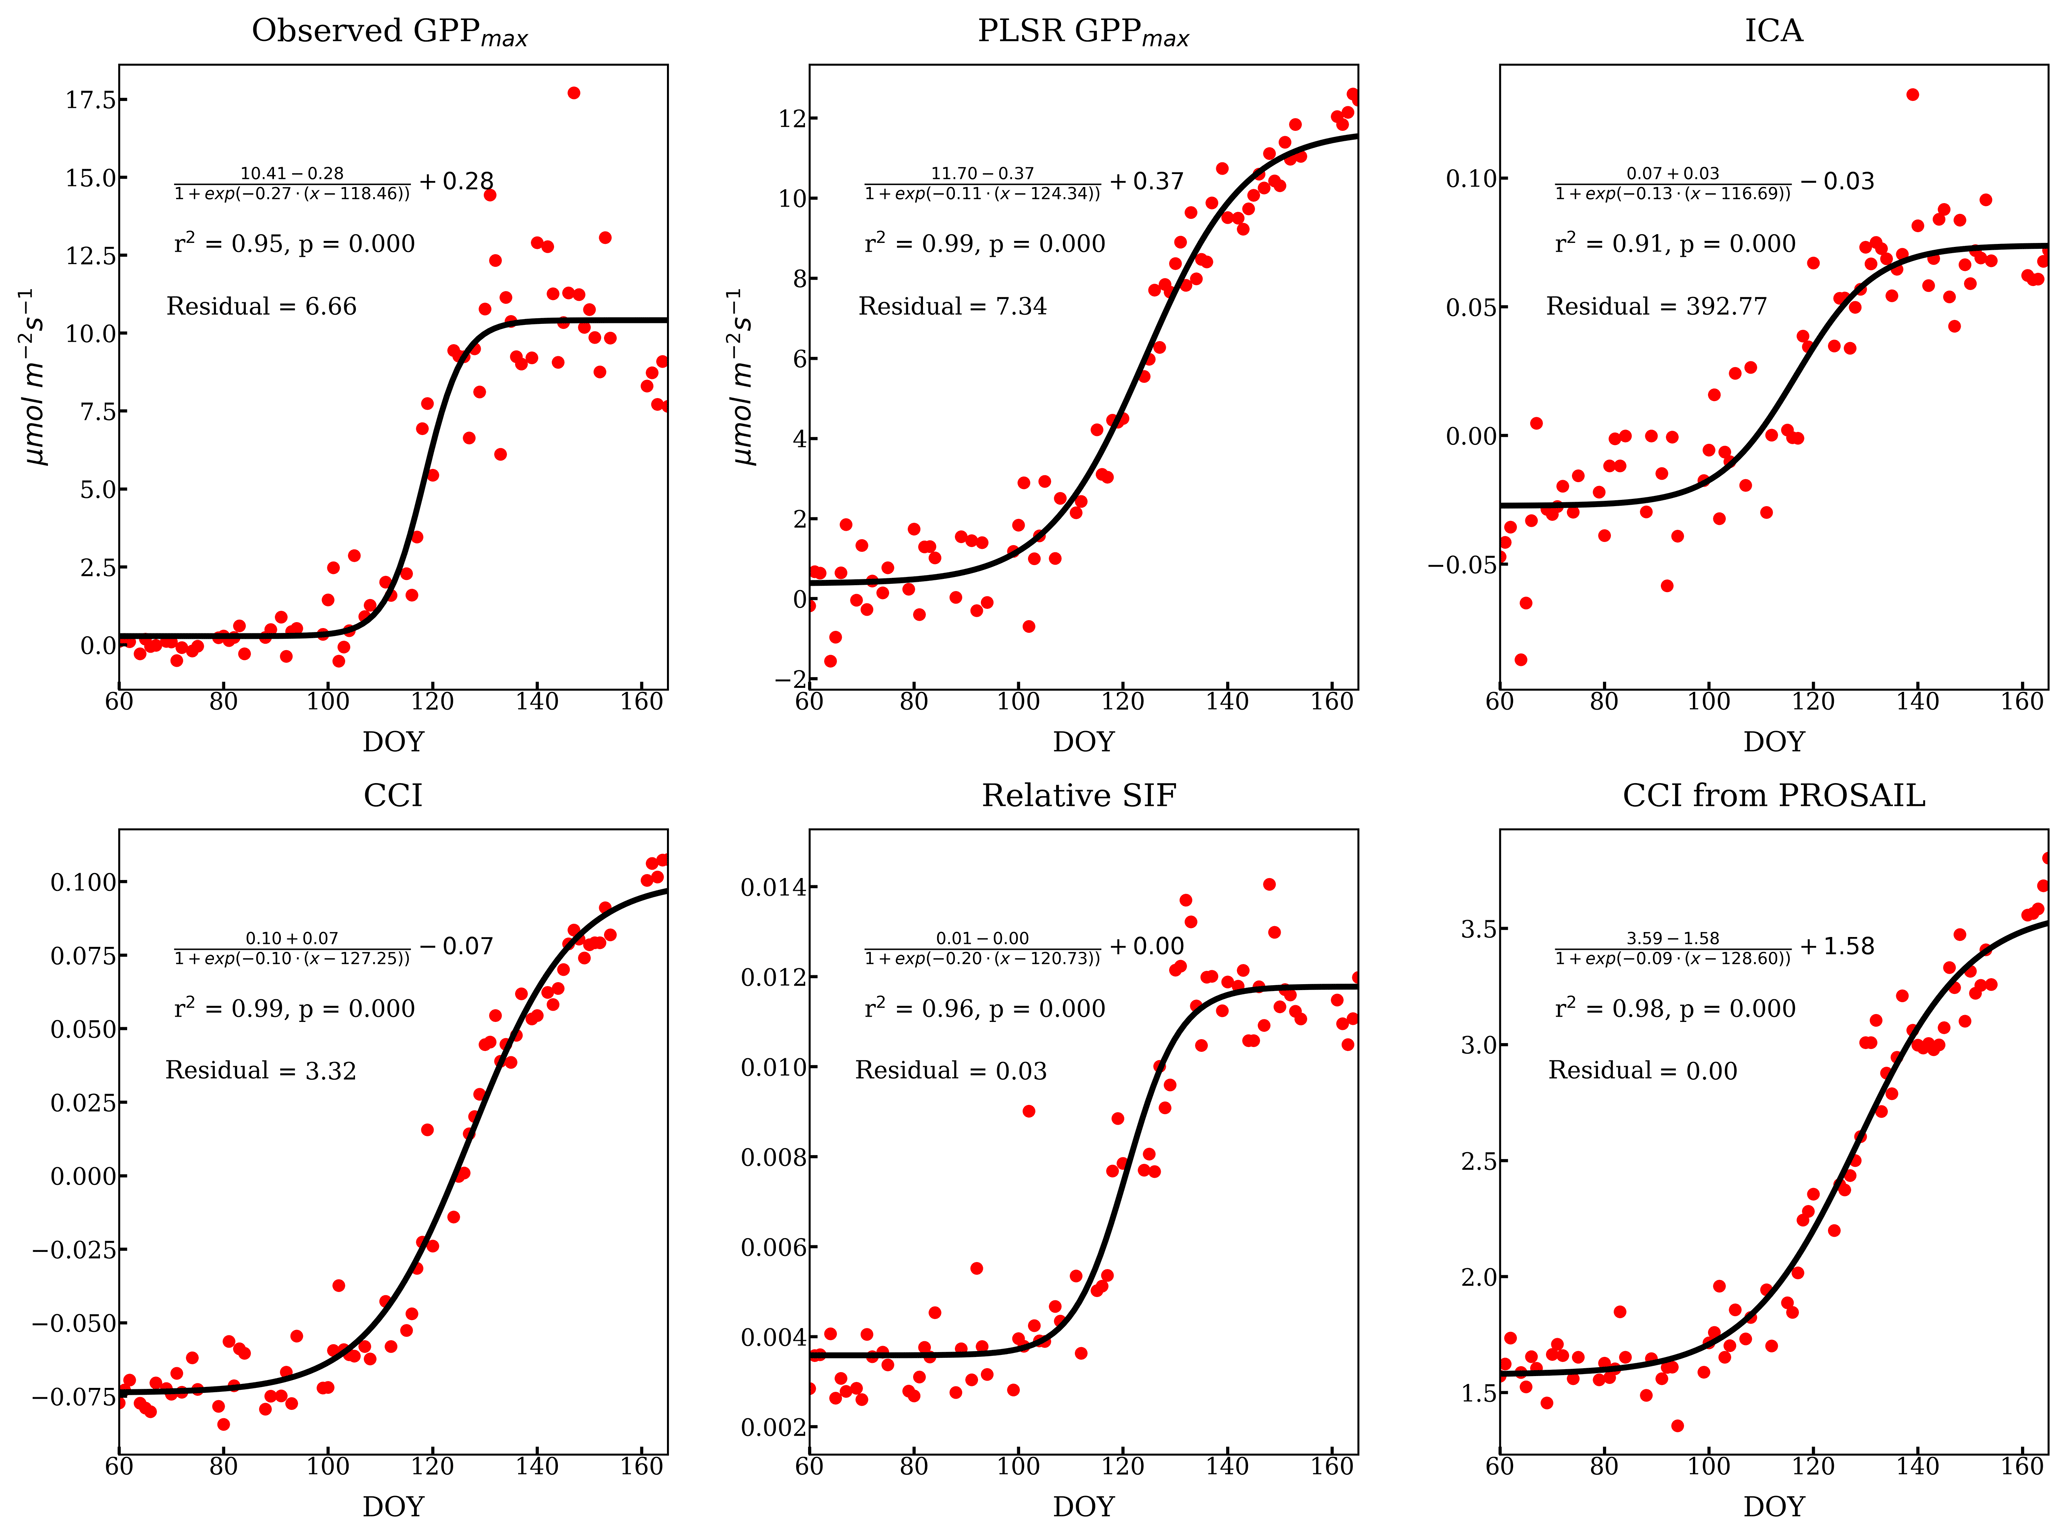
Figure D1Individual sigmoid fits of the onset of growth from different methods and more VIs. The fitted curve has been expressed as the derivation as above. The Pearson r2 and p values listed in each subplot were calculated from the correlation of observed and fitted variables. The residual was calculated as the average L2 norm of the difference between observed (y) and fitted variables () normalized by the observation, i.e., . The fittings are overall good. Because the ICA loading lacks a clear sigmoid shape, ICA has a larger residual.
The first derivative of y is
At the half maximum point (x=xhalf), . Therefore, we need to solve
Hence, xhalf=d.
Our data presented in this paper are provided at https://doi.org/10.22002/D1.1597 (Cheng et al., 2020) and https://doi.org/10.22002/d1.1231 (Magney et al., 2019b). The PROSAIL model in the Julia programming language used in our study can be obtained from https://github.com/CliMA/Land (CliMA, 2020).
The supplement related to this article is available online at: https://doi.org/10.5194/bg-17-4523-2020-supplement.
RC, TSM, DD, and CF designed research. RC, TSM, DD, DRB, BAL, SPB, PDB, KG, SL, ADR, JS, and CF performed data analyses. RC, TSM, DD, DRB, BAL, SPB, PDB, KG, SL, ADR, JS, and CF wrote the paper.
The authors declare that they have no conflict of interest.
We thank the sponsors from the Caltech Graduate First-year Fellowship for Rui Cheng and NASA Carbon Monitoring Systems program for David R. Bowling. The US-NR1 site is a part of the AmeriFlux Management Project (AMP). The National Center for Atmospheric Research (NCAR) is sponsored by the NSF.
This research has been supported by the NASA Carbon Monitoring Systems program (grant no. NNX16AP33G) and the DOE, Office of Science through the AmeriFlux Management Project (AMP) at Lawrence Berkeley National Laboratory (grant no. 7094866).
This paper was edited by Sönke Zaehle and reviewed by Shari Van Wittenberghe and one anonymous referee.
Adams, W. W. and Demmig-Adams, B.: Carotenoid composition and down regulation of photosystem II in three conifer species during the winter, Physiol. Plantarum, 92, 451–458, https://doi.org/10.1111/j.1399-3054.1994.tb08835.x, 1994. a
Ahlström, A., Schurgers, G., Arneth, A., and Smith, B.: Robustness and uncertainty in terrestrial ecosystem carbon response to CMIP5 climate change projections, Environ. Res. Lett., 7, 044008, https://doi.org/10.1088/1748-9326/7/4/044008, 2012. a
Ali, A. M., Darvishzadeh, R., Skidmore, A. K., van Duren, I., Heiden, U., and Heurich, M.: Estimating leaf functional traits by inversion of PROSPECT: Assessing leaf dry matter content and specific leaf area in mixed mountainous forest, Int. J. Appl. Earth Obs., 45, 66–76, 2016. a
Asner, G. P., Martin, R. E., Knapp, D. E., Tupayachi, R., Anderson, C., Carranza, L., Martinez, P., Houcheime, M., Sinca, F., and Weiss, P.: Spectroscopy of canopy chemicals in humid tropical forests, Remote Sens. Environ., 115, 3587–3598, https://doi.org/10.1016/J.RSE.2011.08.020, 2011. a
Badgley, G., Field, C. B., and Berry, J. A.: Canopy near-infrared reflectance and terrestrial photosynthesis, Sci. Adv., 3, e1602244, https://doi.org/10.1126/sciadv.1602244, 2017. a
Baldocchi, D., Falge, E., Gu, L., Olson, R., Hollinger, D., Running, S., Anthoni, P., Bernhofer, C., Davis, K., Evans, R., Fuentes, J., Goldstein, A., Katul, G., Law, B., Lee, X., Malhi, Y., Meyers, T., Munger, W., Oechel, W., Paw U, K. T., Pilegaard, K., Schmid, H. P., Valentini, R., Verma, S., Vesala, T., Wilson, K., and Wofsy, S.: FLUXNET: A new tool to study the temporal and spatial variability of ecosystem-scale carbon dioxide, water vapor, and energy flux densities, B. Am. Meteorol. Soc., 82, 2415–2434, 2001. a
Barnes, M. L., Breshears, D. D., Law, D. J., van Leeuwen, W. J. D., Monson, R. K., Fojtik, A. C., Barron-Gafford, G. A., and Moore, D. J. P.: Beyond greenness: Detecting temporal changes in photosynthetic capacity with hyperspectral reflectance data, PLOS ONE, 12, e0189539, https://doi.org/10.1371/journal.pone.0189539, 2017. a, b
Blanken, P. D., Monson, R. K., Burns, S. P., Bowling, D. R., and Turnipseed, A. A.: Data and information for the AmeriFlux US-NR1 Niwot Ridge Subalpine Forest (LTER NWT1) Site, AmeriFlux Management Project, Berkeley, CA, Lawrence Berkeley National Laboratory, https://doi.org/10.17190/AMF/1246088, 2019. a
Bowling, D. and Logan, B.: Carbon Monitoring System (CMS)Conifer Needle Pigment Composition, Niwot Ridge, Colorado, USA, 2017–2018, 0.021358 MB, https://doi.org/10.3334/ORNLDAAC/1723, 2019. a
Bowling, D. R., Logan, B. A., Hufkens, K., Aubrecht, D. M., Richardson, A. D., Burns, S. P., Anderegg, W. R., Blanken, P. D., and Eiriksson, D. P.: Limitations to winter and spring photosynthesis of a Rocky Mountain subalpine forest, Agr. Forest Meteorol., 252, 241–255, https://doi.org/10.1016/J.AGRFORMET.2018.01.025, 2018. a, b, c, d, e, f, g, h, i
Burns, S. P., Blanken, P. D., Turnipseed, A. A., Hu, J., and Monson, R. K.: The influence of warm-season precipitation on the diel cycle of the surface energy balance and carbon dioxide at a Colorado subalpine forest site, Biogeosciences, 12, 7349–7377, https://doi.org/10.5194/bg-12-7349-2015, 2015. a, b
Burns, S. P., Maclean, G. D., Blanken, P. D., Oncley, S. P., Semmer, S. R., and Monson, R. K.: The Niwot Ridge Subalpine Forest US-NR1 AmeriFlux site – Part 1: Data acquisition and site record-keeping, Geosci. Instrum. Method. Data Syst., 5, 451–471, https://doi.org/10.5194/gi-5-451-2016, 2016. a, b, c, d
Cheng, R., Frankenberg, C., Magney, T., Grossmann, K., Bowling, D., Burns, S., Stutz, J., and Blanken, P.: Hyperspectral reflectance at Niwot Ridge, Colorado (Version 1.0) [Data set], CaltechDATA, https://doi.org/10.22002/D1.1597, 2020. a
Ciais, P., Sabine, C., Bala, G., Bopp, L., Brovkin, V., Canadell, J., Chhabra, R., DeFries, R., Galloway, J., Heimann, M., Jones, C., Le Quéré, C., Myneni, R., Piao, S., and Thornton, P.: Carbon and Other Biogeochemical Cycles, in: Climate Change 2013: The Physical Science Basis. Contribution of Working Group I to the Fifth Assessment Report of the Intergovernmental Panel on Climate Change, edited by: Stock, T., Qin, D., Plattner, G.-K., Tignor, M., Allen, S., Boschung, J., Nauels, A., Xia, Y., Bex, V., and Midgley, P., chap. 6, 465–570, Cambridge University Press, Cambridge, United Kingdom and New York, NY, USA, https://doi.org/10.1017/CBO9781107415324.015, 2013. a
CliMA: Land, GitHub, available at: https://github.com/CliMA/Land, last access: 6 February 2020. a
Comon, P.: Independent component analysis, a new concept?, Signal Processing, 36, 287–314, 1994. a
Dawson, T. P., Curran, P. J., and Plummer, S. E.: LIBERTY–Modeling the effects of leaf biochemical concentration on reflectance spectra, Remote Sens. Environ., 65, 50–60, 1998. a
Dechant, B., Cuntz, M., Vohland, M., Schulz, E., and Doktor, D.: Estimation of photosynthesis traits from leaf reflectance spectra: correlation to nitrogen content as the dominant mechanism, Remote Sens. Environ., 196, 279–292, 2017. a
Dechant, B., Ryu, Y., and Kang, M.: Making full use of hyperspectral data for gross primary productivity estimation with multivariate regression: Mechanistic insights from observations and process-based simulations, Remote Sens. Environ., 234, 111435, https://doi.org/10.1016/j.rse.2019.111435, 2019. a
Demmig-Adams, B. and Adams, W. W.: The role of xanthophyll cycle carotenoids in the protection of photosynthesis, Trend Plant Sci., 1, 21–26, https://doi.org/10.1016/S1360-1385(96)80019-7, 1996. a
de Tomás Marín, S., Novák, M., Klančnik, K., and Gaberščik, A.: Spectral signatures of conifer needles mainly depend on their physical traits, Pol. J. Ecol., 64, 1–14, 2016. a
DuBois, S., Desai, A. R., Singh, A., Serbin, S. P., Goulden, M. L., Baldocchi, D. D., Ma, S., Oechel, W. C., Wharton, S., Kruger, E. L., and Townsend, P. A.: Using imaging spectroscopy to detect variation in terrestrial ecosystem productivity across a water-stressed landscape, Ecol. Appl., 28, 1313–1324, 2018. a
Dutta, D., Schimel, D. S., Sun, Y., van der Tol, C., and Frankenberg, C.: Optimal inverse estimation of ecosystem parameters from observations of carbon and energy fluxes, Biogeosciences, 16, 77–103, https://doi.org/10.5194/bg-16-77-2019, 2019. a
Dye, D. G.: Spectral composition and quanta-to-energy ratio of diffuse photosynthetically active radiation under diverse cloud conditions, J. Geophys. Res., 109, D10203, https://doi.org/10.1029/2003JD004251, 2004. a
Farquhar, G. D., von Caemmerer, S., and Berry, J. A.: A biochemical model of photosynthetic CO2 assimilation in leaves of C3 species, Planta, 149, 78–90, https://doi.org/10.1007/BF00386231, 1980. a
Feret, J.-B., François, C., Asner, G. P., Gitelson, A. A., Martin, R. E., Bidel, L. P., Ustin, S. L., le Maire, G., and Jacquemoud, S.: PROSPECT-4 and 5: Advances in the leaf optical properties model separating photosynthetic pigments, Remote Sens. Environ., 112, 3030–3043, https://doi.org/10.1016/J.RSE.2008.02.012, 2008. a
Féret, J. B., Gitelson, A. A., Noble, S. D., and Jacquemoud, S.: PROSPECT-D: Towards modeling leaf optical properties through a complete lifecycle, Remote Sens. Environ., 193, 204–215, https://doi.org/10.1016/j.rse.2017.03.004, 2017. a, b, c
Féret, J.-B., Le Maire, G., Jay, S., Berveiller, D., Bendoula, R., Hmimina, G., Cheraiet, A., Oliveira, J., Ponzoni, F., Solanki, T., de Boissieu, F., Chave, J., Nouvellon, Y., Porcar-Castell, A., Proisy, C., Soudani, K., Gastellu-Etchegorry, J.-P., and Lefèvre-Fonollosa, M.-J.: Estimating leaf mass per area and equivalent water thickness based on leaf optical properties: Potential and limitations of physical modeling and machine learning, Remote Sens. Environ., 231, 110959, 2019. a
Gamon, J., Peñuelas, J., and Field, C.: A narrow-waveband spectral index that tracks diurnal changes in photosynthetic efficiency, Remote Sens. Environ., 41, 35–44, https://doi.org/10.1016/0034-4257(92)90059-S, 1992. a, b, c
Gamon, J., Rahman, A., Dungan, J., Schildhauer, M., and Huemmrich, K.: Spectral Network (SpecNet) – What is it and why do we need it?, Remote Sens. Environ., 103, 227–235, https://doi.org/10.1016/J.RSE.2006.04.003, 2006. a
Gamon, J. A., Serrano, L., and Surfus, J. S.: The photochemical reflectance index: an optical indicator of photosynthetic radiation use efficiency across species, functional types, and nutrient levels, Oecologia, 112, 492–501, https://doi.org/10.1007/s004420050337, 1997. a
Gamon, J. A., Huemmrich, K. F., Wong, C. Y. S., Ensminger, I., Garrity, S., Hollinger, D. Y., Noormets, A., and Peñuelas, J.: A remotely sensed pigment index reveals photosynthetic phenology in evergreen conifers., P. Natl. Acad. Sci. USA, 113, 13087–13092, https://doi.org/10.1073/pnas.1606162113, 2016. a, b, c, d, e, f
Garbulsky, M. F., Peñuelas, J., Gamon, J., Inoue, Y., and Filella, I.: The photochemical reflectance index (PRI) and the remote sensing of leaf, canopy and ecosystem radiation use efficiencies: A review and meta-analysis, Remote Sens. Environ., 115, 281–297, 2011. a
Geladi, P. and Kowalski, B. R.: Partial least-squares regression: a tutorial, Anal. Chim. Acta, 185, 1–17, https://doi.org/10.1016/0003-2670(86)80028-9, 1986. a
Gentine, P. and Alemohammad, S. H.: Reconstructed Solar-Induced Fluorescence: A Machine Learning Vegetation Product Based on MODIS Surface Reflectance to Reproduce GOME-2 Solar-Induced Fluorescence, Geophys. Res. Lett., 45, 3136–3146, https://doi.org/10.1002/2017GL076294, 2018. a, b
Genty, B., Briantais, J.-M., and Baker, N. R.: The relationship between the quantum yield of photosynthetic electron transport and quenching of chlorophyll fluorescence, Biochim. Biophys. Acta, 990, 87–92, 1989. a, b
Glenn, E., Huete, A., Nagler, P., Nelson, S., Glenn, E. P., Huete, A. R., Nagler, P. L., and Nelson, S. G.: Relationship Between Remotely-sensed Vegetation Indices, Canopy Attributes and Plant Physiological Processes: What Vegetation Indices Can and Cannot Tell Us About the Landscape, Sensors, 8, 2136–2160, https://doi.org/10.3390/s8042136, 2008. a
Gould, K. S.: Nature's Swiss army knife: the diverse protective roles of anthocyanins in leaves, BioMed Research International, 2004, 314–320, 2004. a
Goulden, M. L., Munger, J. W., Fan, S.-M., Daube, B. C., and Wofsy, S. C.: Measurements of carbon sequestration by long-term eddy covariance: methods and a critical evaluation of accuracy, Glob. Change Biol., 2, 169–182, https://doi.org/10.1111/j.1365-2486.1996.tb00070.x, 1996. a
Grossmann, K., Frankenberg, C., Magney, T. S., Hurlock, S. C., Seibt, U., and Stutz, J.: PhotoSpec: A new instrument to measure spatially distributed red and far-red Solar-Induced Chlorophyll Fluorescence, Remote Sens. Environ., 216, 311–327, https://doi.org/10.1016/J.RSE.2018.07.002, 2018. a, b, c, d
Guanter, L., Zhang, Y., Jung, M., Joiner, J., Voigt, M., Berry, J. A., Frankenberg, C., Huete, A. R., Zarco-Tejada, P., Lee, J.-E., Moran, M. S., Ponce-Campos, G., Beer, C., Camps-Valls, G., Buchmann, N., Gianelle, D., Klumpp, K., Cescatti, A., Baker, J. M., and Griffis, T. J.: Global and time-resolved monitoring of crop photosynthesis with chlorophyll fluorescence, P. Natl. Acad. Sci. USA, 111, E1327–E1333, 2014. a
Hall, F. G., Hilker, T., Coops, N. C., Lyapustin, A., Huemmrich, K. F., Middleton, E., Margolis, H., Drolet, G., and Black, T. A.: Multi-angle remote sensing of forest light use efficiency by observing PRI variation with canopy shadow fraction, Remote Sens. Environ., 112, 3201–3211, https://doi.org/10.1016/J.RSE.2008.03.015, 2008. a
Harbinson, J.: Modeling the protection of photosynthesis, P. Natl. Acad. Sci. USA, 109, 15533–15534, https://doi.org/10.1073/pnas.1213195109, 2012. a
Hilker, T., Coops, N. C., Hall, F. G., Nichol, C. J., Lyapustin, A., Black, T. A., Wulder, M. A., Leuning, R., Barr, A., Hollinger, D. Y., Munger, B., and Tucker, C. J.: Inferring terrestrial photosynthetic light use efficiency of temperate ecosystems from space, J. Geophys. Res., 116, G03014, https://doi.org/10.1029/2011JG001692, 2011a. a
Hilker, T., Gitelson, A., Coops, N. C., Hall, F. G., and Black, T. A.: Tracking plant physiological properties from multi-angular tower-based remote sensing, Oecologia, 165, 865–876, https://doi.org/10.1007/s00442-010-1901-0, 2011b. a
Horler, D. N. H., Dockray, M., and Barber, J.: The red edge of plant leaf reflectance, Int. J. Remote Sens., 4, 273–288, https://doi.org/10.1080/01431168308948546, 1983. a
Huemmrich, K. F., Campbell, P. K. E., Gao, B.-C., Flanagan, L. B., and Goulden, M.: ISS as a Platform for Optical Remote Sensing of Ecosystem Carbon Fluxes: A Case Study Using HICO, IEEE J. Sel. Top. Appl., 10, 4360–4375, https://doi.org/10.1109/JSTARS.2017.2725825, 2017. a
Huemmrich, K. F., Campbell, P., Landis, D., and Middleton, E.: Developing a common globally applicable method for optical remote sensing of ecosystem light use efficiency, Remote Sens. Environ., 230, 111190, 2019. a
Huete, A., Liu, H., Batchily, K., and Van Leeuwen, W.: A comparison of vegetation indices over a global set of TM images for EOS-MODIS, Remote Sens. Environ., 59, 440–451, 1997. a
Hughes, N. M.: Winter leaf reddening in “evergreen” species, New Phytol., 190, 573–581, 2011. a
Hyvärinen, A. and Oja, E.: Independent component analysis: algorithms and applications, Neural Networks, 13, 411–430, https://doi.org/10.1016/S0893-6080(00)00026-5, 2000. a
Jacquemoud, S. and Baret, F.: PROSPECT: A model of leaf optical properties spectra, Remote Sens. Environ., 34, 75–91, 1990. a
Jacquemoud, S., Baret, F., Andrieu, B., Danson, F., and Jaggard, K.: Extraction of vegetation biophysical parameters by inversion of the PROSPECT + SAIL models on sugar beet canopy reflectance data. Application to TM and AVIRIS sensors, Remote Sens. Environ., 52, 163–172, https://doi.org/10.1016/0034-4257(95)00018-V, 1995. a
Jacquemoud, S., Verhoef, W., Baret, F., Bacour, C., Zarco-Tejada, P. J., Asner, G. P., François, C., and Ustin, S. L.: PROSPECT+ SAIL models: A review of use for vegetation characterization, Remote Sens. Environ., 113, S56–S66, 2009. a, b, c
Krause, G. H. and Weis, E.: CHLOROPHYLL FLUORESCENCE AND PHOTOSYNTHESIS: The Basics, Annu. Rev. Plant. Phys., 42, 313–349, https://doi.org/10.1146/annurev.pp.42.060191.001525, 1991. a
Krinner, G., Viovy, N., de Noblet-Ducoudré, N., Ogée, J., Polcher, J., Friedlingstein, P., Ciais, P., Sitch, S., and Prentice, I. C.: A dynamic global vegetation model for studies of the coupled atmosphere-biosphere system, Global Biogeochem. Cy., 19, GB1015, https://doi.org/10.1029/2003GB002199, 2005. a
Lee, D. W. and Gould, K. S.: Why leaves turn red: pigments called anthocyanins probably protect leaves from light damage by direct shielding and by scavenging free radicals, Am. Sci., 90, 524–531, 2002. a
Leuning, R.: A critical appraisal of a combined stomatal-photosynthesis model for C3 plants, Plant Cell Environ., 18, 339–355, 1995. a
Liu, H. Q. and Huete, A.: A feedback based modification of the NDVI to minimize canopy background and atmospheric noise, IEEE T. Geosci. Remote Sens., 33, 457–465, 1995. a, b
Magney, T. S., Bowling, D. R., Logan, B. A., Grossman, K., Stutz, J., Blanken, P., Burns, S. P., Cheng, R., Garcia, M. A., Köhler, P., Lopez, S., Parazoo, N., Raczka, B., Schimel, D., and Frankenberg, C.: Mechanistic evidence for tracking the seasonality of photosynthesis with solar induced fluorescence, P. Natl. Acad. Sci. USA, 116, 11640–11645, https://doi.org/10.1073/pnas.1900278116, 2019a. a, b, c, d, e, f, g
Magney, T., Frankenberg, C., Grossmann, K., Bowling, D., Logan, B., Burns, S., and Stutz, J.: Canopy and needle scale fluorescence data from Niwot Ridge, Colorado 2017–2018 (Version 1.1) [Data set], CaltechDATA, https://doi.org/10.22002/d1.1231, 2019b. a
Matthes, J. H., Knox, S. H., Sturtevant, C., Sonnentag, O., Verfaillie, J., and Baldocchi, D.: Predicting landscape-scale CO2 flux at a pasture and rice paddy with long-term hyperspectral canopy reflectance measurements, Biogeosciences, 12, 4577–4594, https://doi.org/10.5194/bg-12-4577-2015, 2015. a
Meacham-Hensold, K., Montes, C. M., Wu, J., Guan, K., Fu, P., Ainsworth, E. A., Pederson, T., Moore, C. E., Brown, K. L., Raines, C., and Bernacchi, C. J.: High-throughput field phenotyping using hyperspectral reflectance and partial least squares regression (PLSR) reveals genetic modifications to photosynthetic capacity, Remote Sens. Environ., 231, 111176, https://doi.org/10.1016/J.RSE.2019.04.029, 2019. a
Middleton, E., Huemmrich, K., Landis, D., Black, T., Barr, A., and McCaughey, J.: Photosynthetic efficiency of northern forest ecosystems using a MODIS-derived Photochemical Reflectance Index (PRI), Remote Sens. Environ., 187, 345–366, 2016. a
Monson, R. K., Turnipseed, A. A., Sparks, J. P., Harley, P. C., Scott-Denton, L. E., Sparks, K., and Huxman, T. E.: Carbon sequestration in a high-elevation, subalpine forest, Glob. Change Biol., 8, 459–478, https://doi.org/10.1046/j.1365-2486.2002.00480.x, 2002. a, b, c
Monson, R. K., Sparks, J. P., Rosenstiel, T. N., Scott-Denton, L. E., Huxman, T. E., Harley, P. C., Turnipseed, A. A., Burns, S. P., Backlund, B., and Hu, J.: Climatic influences on net ecosystem CO2 exchange during the transition from wintertime carbon source to springtime carbon sink in a high-elevation, subalpine forest, Oecologia, 146, 130–147, 2005. a
Monteith, J. L.: Solar Radiation and Productivity in Tropical Ecosystems, J. Appl. Ecol., 9, 747–766, 1972. a
Monteith, J. L. and Moss, C. J.: Climate and the Efficiency of Crop Production in Britain and Discussion, Philos. T. R. Soc. B, 281, 277–294, 1977. a
Moorthy, I., Miller, J. R., and Noland, T. L.: Estimating chlorophyll concentration in conifer needles with hyperspectral data: An assessment at the needle and canopy level, Remote Sens. Environ., 112, 2824–2838, 2008. a
Pietrini, F., Iannelli, M., and Massacci, A.: Anthocyanin accumulation in the illuminated surface of maize leaves enhances protection from photo-inhibitory risks at low temperature, without further limitation to photosynthesis, Plant Cell Environ., 25, 1251–1259, 2002. a
Porcar-Castell, A., Tyystjärvi, E., Atherton, J., Van der Tol, C., Flexas, J., Pfündel, E. E., Moreno, J., Frankenberg, C., and Berry, J. A.: Linking chlorophyll a fluorescence to photosynthesis for remote sensing applications: mechanisms and challenges, J. Exp. Bot., 65, 4065–4095, 2014. a
Porcar-Castell, A., Mac Arthur, A., Rossini, M., Eklundh, L., Pacheco-Labrador, J., Anderson, K., Balzarolo, M., Martín, M. P., Jin, H., Tomelleri, E., Cerasoli, S., Sakowska, K., Hueni, A., Julitta, T., Nichol, C. J., and Vescovo, L.: EUROSPEC: at the interface between remote-sensing and ecosystem CO2 flux measurements in Europe, Biogeosciences, 12, 6103–6124, https://doi.org/10.5194/bg-12-6103-2015, 2015. a
Rautiainen, M., Lukeš, P., Homolova, L., Hovi, A., Pisek, J., and Mottus, M.: Spectral properties of coniferous forests: A review of in situ and laboratory measurements, Remote Sensing, 10, 207, https://doi.org/10.3390/rs10020207, 2018. a, b
Reichstein, M., Falge, E., Baldocchi, D., Papale, D., Aubinet, M., Berbigier, P., Bernhofer, C., Buchmann, N., Gilmanov, T., Granier, A., Grunwald, T., Havrankova, K., Ilvesniemi, H., Janous, D., Knohl, A., Laurila, T., Lohila, A., Loustau, D., Matteucci, G., Meyers, T., Miglietta, F., Ourcival, J.-M., Pumpanen, J., Rambal, S., Rotenberg, E., Sanz, M., Tenhunen, J., Seufert, G., Vaccari, F., Vesala, T., Yakir, D., and Valentini, R.: On the separation of net ecosystem exchange into assimilation and ecosystem respiration: review and improved algorithm, Glob. Change Biol., 11, 1424–1439, https://doi.org/10.1111/j.1365-2486.2005.001002.x, 2005. a
Richardson, A. D., Braswell, B. H., Hollinger, D. Y., Jenkins, J. P., and Ollinger, S. V.: Near-surface remote sensing of spatial and temporal variation in canopy phenology, Ecol. Appl., 19, 1417–1428, 2009. a
Richardson, A. D., Hufkens, K., Milliman, T., Aubrecht, D. M., Chen, M., Gray, J. M., Johnston, M. R., Keenan, T. F., Klosterman, S. T., Kosmala, M., Melaas, E. K., Friedl, M. A., and Frolking, S.: Tracking vegetation phenology across diverse North American biomes using PhenoCam imagery, Scientific Data, 5, 180028, https://doi.org/10.1038/sdata.2018.28, 2018. a
Robinson, N. P., Allred, B. W., Smith, W. K., Jones, M. O., Moreno, A., Erickson, T. A., Naugle, D. E., and Running, S. W.: Terrestrial primary production for the conterminous United States derived from Landsat 30 m and MODIS 250 m, Remote Sensing in Ecology and Conservation, 4, 264–280, https://doi.org/10.1002/rse2.74, 2018. a
Rook, D. A.: The influence of growing temperature on photosynthesis and respiration of Pinus radiata seedlings, New Zeal. J. Bot., 7, 43–55, https://doi.org/10.1080/0028825X.1969.10429101, 1969. a
Rouse Jr., J., Haas, R., Schell, J., and Deering, D.: Paper A 20, in: Third Earth Resources Technology Satellite-1 Symposium: The Proceedings of a Symposium Held by Goddard Space Flight Center, Washington, DC, 10–14 December 1973, Goddard Space Flight Center, Vol. 351, p. 309, Scientific and Technical Information Office, National Aeronautics and Space, 1974. a, b
Running, S. W., Nemani, R. R., Heinsch, F. A., Zhao, M., Reeves, M., and Hashimoto, H.: A Continuous Satellite-Derived Measure of Global Terrestrial Primary Production, BioScience, 54, 547–560, https://doi.org/10.1641/0006-3568(2004)054[0547:acsmog]2.0.co;2, 2004. a, b
Schreiber, U., Schliwa, U., and Bilger, W.: Continuous recording of photochemical and non-photochemical chlorophyll fluorescence quenching with a new type of modulation fluorometer, Photosynth. Res., 10, 51–62, 1986. a
Serbin, S. P., Dillaway, D. N., Kruger, E. L., and Townsend, P. A.: Leaf optical properties reflect variation in photosynthetic metabolism and its sensitivity to temperature, J. Exp. Bot., 63, 489–502, https://doi.org/10.1093/jxb/err294, 2012. a, b
Serbin, S. P., Singh, A., McNeil, B. E., Kingdon, C. C., and Townsend, P. A.: Spectroscopic determination of leaf morphological and biochemical traits for northern temperate and boreal tree species, Ecol. Appl., 24, 1651–1669, 2014. a
Serbin, S. P., Singh, A., Desai, A. R., Dubois, S. G., Jablonski, A. D., Kingdon, C. C., Kruger, E. L., and Townsend, P. A.: Remotely estimating photosynthetic capacity, and its response to temperature, in vegetation canopies using imaging spectroscopy, Remote Sens. Environ., 167, 78–87, 2015. a
Silva-Perez, V., Molero, G., Serbin, S. P., Condon, A. G., Reynolds, M. P., Furbank, R. T., and Evans, J. R.: Hyperspectral reflectance as a tool to measure biochemical and physiological traits in wheat, J. Exp. Bot., 69, 483–496, https://doi.org/10.1093/jxb/erx421, 2018. a, b
Sims, D. A. and Gamon, J. A.: Relationships between leaf pigment content and spectral reflectance across a wide range of species, leaf structures and developmental stages, Remote Sens. Environ., 81, 337–354, 2002. a
Singh, A., Serbin, S. P., McNeil, B. E., Kingdon, C. C., and Townsend, P. A.: Imaging spectroscopy algorithms for mapping canopy foliar chemical and morphological traits and their uncertainties, Ecol. Appl., 25, 2180–2197, 2015. a
Smith, M.-L., Ollinger, S. V., Martin, M. E., Aber, J. D., Hallett, R. A., and Goodale, C. L.: Direct estimation of aboveground forest productivity through hyperspectral remote sensing of canopy nitrogen, Ecol. Appl., 12, 1286–1302, 2002. a
Sonnentag, O., Hufkens, K., Teshera-Sterne, C., Young, A. M., Friedl, M., Braswell, B. H., Milliman, T., O'Keefe, J., and Richardson, A. D.: Digital repeat photography for phenological research in forest ecosystems, Agr. Forest Meteorol., 152, 159–177, https://doi.org/10.1016/J.AGRFORMET.2011.09.009, 2012. a, b
Stylinski, C., Gamon, J., and Oechel, W.: Seasonal patterns of reflectance indices, carotenoid pigments and photosynthesis of evergreen chaparral species, Oecologia, 131, 366–374, https://doi.org/10.1007/s00442-002-0905-9, 2002. a
Tucker, C. J.: Red and photographic infrared linear combinations for monitoring vegetation, Remote Sens. Environ., 8, 127–150, https://doi.org/10.1016/0034-4257(79)90013-0, 1979. a
Ustin, S. L., Roberts, D. A., Gamon, J. A., Asner, G. P., and Green, R. O.: Using imaging spectroscopy to study ecosystem processes and properties, BioScience, 54, 523–534, 2004. a
Ustin, S. L., Gitelson, A. A., Jacquemoud, S., Schaepman, M., Asner, G. P., Gamon, J. A., and Zarco-Tejada, P.: Retrieval of foliar information about plant pigment systems from high resolution spectroscopy, Remote Sens. Environ., 113, S67–S77, 2009. a
van der Tol, C., Berry, J. A., Campbell, P. K. E., and Rascher, U.: Models of fluorescence and photosynthesis for interpreting measurements of solar-induced chlorophyll fluorescence, J. Geophys. Res.-Biogeo., 119, 2312–2327, https://doi.org/10.1002/2014JG002713, 2014. a, b
Verhoeven, A. S., Adams, W. W., and Demmig-Adams, B.: Close relationship between the state of the xanthophyll cycle pigments and photosystem II efficiency during recovery from winter stress, Physiol. Plantarum, 96, 567–576, https://doi.org/10.1111/j.1399-3054.1996.tb00228.x, 1996. a
Vilfan, N., Van der Tol, C., Yang, P., Wyber, R., Malenovský, Z., Robinson, S. A., and Verhoef, W.: Extending Fluspect to simulate xanthophyll driven leaf reflectance dynamics, Remote Sens. Environ., 211, 345–356, https://doi.org/10.1016/J.RSE.2018.04.012, 2018. a, b
Wingate, L., Ogée, J., Cremonese, E., Filippa, G., Mizunuma, T., Migliavacca, M., Moisy, C., Wilkinson, M., Moureaux, C., Wohlfahrt, G., Hammerle, A., Hörtnagl, L., Gimeno, C., Porcar-Castell, A., Galvagno, M., Nakaji, T., Morison, J., Kolle, O., Knohl, A., Kutsch, W., Kolari, P., Nikinmaa, E., Ibrom, A., Gielen, B., Eugster, W., Balzarolo, M., Papale, D., Klumpp, K., Köstner, B., Grünwald, T., Joffre, R., Ourcival, J.-M., Hellstrom, M., Lindroth, A., George, C., Longdoz, B., Genty, B., Levula, J., Heinesch, B., Sprintsin, M., Yakir, D., Manise, T., Guyon, D., Ahrends, H., Plaza-Aguilar, A., Guan, J. H., and Grace, J.: Interpreting canopy development and physiology using a European phenology camera network at flux sites, Biogeosciences, 12, 5995–6015, https://doi.org/10.5194/bg-12-5995-2015, 2015. a
Wold, S., Ruhe, A., Wold, H., and Dunn III, W.: The collinearity problem in linear regression. The partial least squares (PLS) approach to generalized inverses, SIAM J. Sci. Stat. Comp., 5, 735–743, 1984. a
Wong, C. Y. and Gamon, J. A.: The photochemical reflectance index provides an optical indicator of spring photosynthetic activation in evergreen conifers, New Phytol., 206, 196–208, 2015a. a
Wong, C. Y. S. and Gamon, J. A.: Three causes of variation in the photochemical reflectance index (PRI) in evergreen conifers, New Phytol., 206, 187–195, https://doi.org/10.1111/nph.13159, 2015b. a
Wong, C. Y., D'Odorico, P., Bhathena, Y., Arain, M. A., and Ensminger, I.: Carotenoid based vegetation indices for accurate monitoring of the phenology of photosynthesis at the leaf-scale in deciduous and evergreen trees, Remote Sens. Environ., 233, 111407, https://doi.org/10.1016/j.rse.2019.111407, 2019. a
Wong, C. Y., D'Odorico, P., Arain, M. A., and Ensminger, I.: Tracking the phenology of photosynthesis using carotenoid-sensitive and near-infrared reflectance vegetation indices in a temperate evergreen and mixed deciduous forest, New Phytol., 226, 1682–1695, https://doi.org/10.1111/nph.16479, 2020. a
Woodgate, W., Suarez, L., van Gorsel, E., Cernusak, L., Dempsey, R., Devilla, R., Held, A., Hill, M., and Norton, A.: tri-PRI: A three band reflectance index tracking dynamic photoprotective mechanisms in a mature eucalypt forest, Agr. Forest Meteorol., 272–273, 187–201, https://doi.org/10.1016/J.AGRFORMET.2019.03.020, 2019. a
Wutzler, T., Lucas-Moffat, A., Migliavacca, M., Knauer, J., Sickel, K., Šigut, L., Menzer, O., and Reichstein, M.: Basic and extensible post-processing of eddy covariance flux data with REddyProc, Biogeosciences, 15, 5015–5030, https://doi.org/10.5194/bg-15-5015-2018, 2018. a
Xiao, X., Hollinger, D., Aber, J., Goltz, M., Davidson, E. A., Zhang, Q., and Moore, B.: Satellite-based modeling of gross primary production in an evergreen needleleaf forest, Remote Sens. Environ., 89, 519–534, https://doi.org/10.1016/j.rse.2003.11.008, 2004. a
Yang, P. and van der Tol, C.: Linking canopy scattering of far-red sun-induced chlorophyll fluorescence with reflectance, Remote Sens. Environ., 209, 456–467, 2018. a
Zarco-Tejada, P., Hornero, A., Beck, P., Kattenborn, T., Kempeneers, P., and Hernández-Clemente, R.: Chlorophyll content estimation in an open-canopy conifer forest with Sentinel-2A and hyperspectral imagery in the context of forest decline, Remote Sens. Environ., 223, 320–335, 2019. a, b
Zarter, C. R., Adams, W. W., Ebbert, V., Cuthbertson, D. J., Adamska, I., and Demmig-Adams, B.: Winter down-regulation of intrinsic photosynthetic capacity coupled with up-regulation of Elip-like proteins and persistent energy dissipation in a subalpine forest, New Phytol., 172, 272–282, https://doi.org/10.1111/j.1469-8137.2006.01815.x, 2006. a
Zhao, M., Heinsch, F. A., Nemani, R. R., and Running, S. W.: Improvements of the MODIS terrestrial gross and net primary production global data set, Remote Sens. Environ., 95, 164–176, https://doi.org/10.1016/J.RSE.2004.12.011, 2005. a
Zuromski, L. M., Bowling, D. R., Köhler, P., Frankenberg, C., Goulden, M. L., Blanken, P. D., and Lin, J. C.: Solar-Induced Fluorescence Detects Interannual Variation in Gross Primary Production of Coniferous Forests in the Western United States, Geophys. Res. Lett., 45, 7184–7193, https://doi.org/10.1029/2018GL077906, 2018. a
- Abstract
- Introduction
- Material and methods
- Results and discussion
- Conclusion and future work
- Appendix A: Bidirectional reflectance effect
- Appendix B: Detailed processes on integrating daily-averaged canopy reflectance
- Appendix C: PROSAIL fits
- Appendix D: Sigmoid fit
- Code and data availability
- Author contributions
- Competing interests
- Acknowledgements
- Financial support
- Review statement
- References
- Supplement