the Creative Commons Attribution 4.0 License.
the Creative Commons Attribution 4.0 License.
 | 05 Feb 2020
Dissolved organic carbon mobilized from organic horizons of mature and harvested black spruce plots in a mesic boreal region
Kate A. Edwards
Karen Prestegaard
Xinbiao Zhu
Susan E. Ziegler
Boreal forests are subject to a wide range of temporally and spatially variable environmental conditions driven by season, climate, and disturbances such as forest harvesting and climate change. We captured dissolved organic carbon (DOC) from surface organic (O) horizons in a boreal forest hillslope using passive pan lysimeters in order to identify controls and hot moments of DOC mobilization from this key C source. We specifically addressed (1) how DOC fluxes from O horizons vary on a weekly to seasonal basis in forest and paired harvested plots and (2) how soil temperature, soil moisture, and water input relate to DOC flux trends in these plots over time. The total annual DOC flux from O horizons contain contributions from both vertical and lateral flow and was 30 % greater in the harvested plots than in the forest plots (54 g C m−2 vs. 38 g C m−2, respectively; p=0.008). This was despite smaller aboveground C inputs and smaller soil organic carbon stocks in the harvested plots but analogous to larger annual O horizon water fluxes measured in the harvested plots. Water input, measured as rain, throughfall, and/or snowmelt depending on season and plot type, was positively correlated to variations in O horizon water fluxes and DOC fluxes within the study year. Soil temperature was positively correlated to temporal variations of DOC concentration ([DOC]) of soil water and negatively correlated with water fluxes, but no relationship existed between soil temperature and DOC fluxes at the weekly to monthly scale.
The relationship between water input to soil and DOC fluxes was seasonally dependent in both plot types. In summer, a water limitation on DOC flux existed where weekly periods of no flux alternated with periods of large fluxes at high DOC concentrations. This suggests that DOC fluxes were water-limited and that increased water fluxes over this period result in proportional increases in DOC fluxes. In contrast, a flushing of DOC from O horizons (observed as decreasing DOC concentrations) occurred during increasing water input and decreasing soil temperature in autumn, prior to snowpack development. Soils of both plot types remained snow-covered all winter, which protected soils from frost and limited percolation. The largest water input and soil water fluxes occurred during spring snowmelt but did not result in the largest fluxes of DOC, suggesting a production limitation on DOC fluxes over both the wet autumn and snowmelt periods. While future increases in annual precipitation could lead to increased DOC fluxes, the magnitude of this response will be dependent on the type and intra-annual distribution of this increased precipitation.
- Article
(2448 KB) - Full-text XML
- Companion paper
-
Supplement
(526 KB) - BibTeX
- EndNote


Boreal forests occupy 11 % of the total land surface and thus span a variety of topographies and climate zones (Bonan and Shugart, 1989). They contain organic-matter-rich soils that store approximately 19 % of the global soil organic carbon (SOC) pool (Pan et al., 2011). Losses of SOC from land occur predominately through decomposition and mobilization as CO2 to the atmosphere. A secondary loss pathway of SOC occurs through solubilization and mobilization as dissolved organic carbon (DOC) to deeper SOC pools, groundwater, and surface waters. While losses of SOC as CO2 to the atmosphere, representing approximately 40 % of boreal forest gross primary production (Luyssaert et al., 2007), are accounted for, losses of SOC as DOC to surface waters are often not included in carbon budget models. This is despite the potential for DOC losses to offset ecosystem carbon sink estimates (Gielen et al., 2011; Webb et al., 2019). A mechanistic understanding of the role of DOC at the ecosystem scale is necessary for accurate accounting of the net ecosystem carbon balance (NECB) and for predicting how ecosystems will function under changing environmental conditions (Chapin et al., 2006; Marin-Spiotta et al., 2014).
The importance of upland forest SOC as a source of DOC to boreal forest surface waters is variable among boreal regions due to differences in connectivity driven by topography and precipitation (McGlynn and McDonnell, 2003). In low-relief catchments, SOC mobilized as DOC from upland forest soil may be lost as CO2 or sequestered within deeper mineral soil pools rather than reach surface waters. The SOC of the riparian zone represents an important DOC source to streams in these areas (Ledesma et al., 2017). High-relief catchments, however, are examples where upland forest soils can be much more connected to surface waters, especially during large precipitation events (Raymond and Saiers, 2010) and periods of the year when the water table is high (Laudon et al., 2011; Schelker et al., 2013). Therefore, the importance of the upland forest SOC contribution to surface waters is not generalizable across boreal forest ecosystems, constituting examination within specific regions and under different environmental conditions.
The upper organic (O) horizons of podzols are key sources of soil DOC (Mcdowell and Wood, 1985). The large range in values of O horizon DOC fluxes reported from field studies in temperate and boreal forest systems (3–122 g C m−2 at 5 cm depth, Neff and Asner, 2001; 10–40 g m−2 yr−1, Michalzik et al., 2001) is due to both real variability and variability associated with the usage of different methodologies. Real-world variability is expected given the known spatial heterogeneity of soil and hydrological aspects of forests (Creed et al., 2002). Hydrology was long ago thought to be more important than biological controls, although clarification of the water-flux–DOC-flux relationship was suggested as an area of further research (Kalbitz et al., 2000; Neff and Asner, 2001). More recent field studies therefore focused on specific hydrological controls, such as annual throughfall inputs (Klotzbücher et al., 2014), soil drying followed by rewetting (De Troyer et al., 2014), soil frost (Haei et al., 2010), and snowmelt (Finlay et al., 2006). However, climate transect studies within the boreal forest zone revealed greater DOC fluxes at warmer (low-latitude) relative to cooler (high-latitude) sites, suggesting that this difference can be explained by higher N deposition (Kleja et al., 2008) or higher net primary productivity (Fröberg et al., 2006; Ziegler et al., 2017) in the lower-latitude sites. The DOC fluxes from O to mineral horizons in white pine stands were observed to be negatively correlated with stand age (Peichl et al., 2007), and a stand species comparison study demonstrated larger DOC fluxes from the thicker O horizons of Norway spruce stands relative to silver birch stands (Fröberg et al., 2011). It is likely that a combination of hydrological and biogeochemical factors regulate DOC production and mobilization through soil, but the relative importance of each of these factors is dependent on the scale of investigation, both spatially and temporally (Michalzik et al., 2001), and remains to be confirmed.
Black spruce dominates North American boreal forests (van Cleve et al., 1983; Bona et al., 2016), and these forests span a wide range of environmental conditions that drive variations in SOC decomposition (Wickland et al., 2007) and SOC persistence across sites (Schmidt et al., 2011). Forest harvesting increases water yield (Neary, 2016) and reduces C in the organic layers due to reductions in litter fall and increases in soil respiration (James and Harrison, 2016), but the extent of the impact on soil properties and biogeochemical cycling is dependent on many interacting site-specific variables (Kreutzweiser et al., 2008). Furthermore, while lysimeter studies conducted in post-harvested forests found immediate increases in DOC fluxes from O horizons (Kalbitz et al., 2004; Piirainen et al., 2002), the longer-term effects of harvesting on DOC mobilization have not been considered. We exploited spatially (plot type) and temporally (weekly to seasonal) variable environmental conditions in a maritime boreal black spruce hillslope site to investigate the processes controlling DOC fluxes from O horizons. The region receives moderately high annual precipitation (∼1000 mm yr−1) and is snow-covered for approximately one-third of the year. The objectives of this study were (1) to measure DOC fluxes over 1 year from O horizons of podzols in two contrasting boreal plots that are typical of the managed boreal forest and (2) to measure short-term variations of DOC fluxes across seasons in order to understand how environmental conditions vary in relation to DOC fluxes. These results will facilitate a process-based understanding of DOC mobilization from O horizons, which is important to describing site-specific terrestrial to aquatic C linkages and refining forest C budget models.
2.1 Site description
This study was conducted in an experimental harvest site within a mature black spruce forest at the Pynn's Brook Experimental Watershed Area (PBEWA) located 50 km from Deer Lake, western Newfoundland and Labrador, Canada. (48∘53′14′′ N, 63∘24′8′′ W). The site consists of 2 ha divided into eight 50 m×50 m plots (note: only six were used in this study; Fig. 1a). Four of the plots were left un-harvested and four were randomly selected for clear-cutting. The four clear-cut plots were harvested on 7–10 July 2003 using a short-wood mechanical harvester, with minimal disturbance to the underlying soil and with any deciduous trees left standing. Further information on site preparation and conditions can be found in Moroni et al. (2009). The harvested plots were not replanted following clear-cutting and had naturally recovered moss, herb and shrubbery by the time of sampling for this study, but the regeneration of conifers remains scarce. The 10-year post-harvest plots will be referred to as harvested plots and the mature 80-year-old black spruce plots will be referred to as forest plots throughout. Soils are classified as humo-ferric podzols with morainal parent material (Moroni et al., 2009).

Figure 1Pynn's Brook Experimental Forest experimental design. A north-facing black spruce hillslope site divided into six 50 m×50 m plots, half of which were randomly selected for harvest 10 years prior to lysimeter installation (a). Each plot contains two lysimeter pairs (“X”) for a total of 12 harvest and 12 forest lysimeters. The lysimeters consisted of a high-density polyethylene (HDPE) tray with a sloped bottom connected to a funnel and cross-linked polyethylene (PEX) tubing (b). Each lysimeter was installed between the moss + organic and the mineral horizons on a slope ranging between 5 % and 13 %. Water collected by the lysimeters infiltrated vertically and laterally through moss and organic layers and into a 25 L reservoir from which samples were retrieved (c).
2.2 Lysimeter installation and sample collection
Passive pan lysimeters were installed at the interface between the O and mineral horizon. Each lysimeter footprint was 0.3 m by 0.4 m and collected water percolating through the O horizon, including both vertical and lateral flow (Fig. 1b, c), with a maximum solution collection capacity of 25 L. The lysimeters were designed using reported recommendations for achieving accurate volumetric measurements of soil leachate (Radulovich and Sollins, 1987; Titus et al., 1999). It was desirable for this study that (1) the collection pan directs leachate immediately into a deeper storage container, avoiding potential issues of sample evaporation from the collection pan; and (2) the buried storage reservoir is placed away from the collection pan so that soil and snowpack directly above and upslope from collection area are not disturbed during sample collection.
Installation of lysimeters began in July 2012 and was completed the following spring in May 2013. Four lysimeters were installed in three plots of each plot type for a total of 12 forest lysimeters and 12 harvested lysimeters. The slope measured at each lysimeter was 5 %–12 % and 7 %–13 % in the forest and harvested plots, respectively. Collection began on 12 July 2013 from forest and harvested lysimeters. Synchronized sampling from lysimeters of both plot types was carried out every 7 to 15 d from July to January, once between January and April, and every 7 to 15 d from April to July. Lysimeter samples were stored at 4 ∘C immediately following collection, filtered using pre-combusted GF/F-size Whatman filter paper, preserved with mercuric chloride within 24 h of collection, and stored at 4 ∘C in the dark until analysis. The DOC concentration of each lysimeter sample was measured using a high-temperature combustion analyzer (Shimadzu TOC-V). The measured DOC concentration, the total volume collected by lysimeters, the number of collection days, and the lysimeter collection area were used to calculate a DOC flux (g C m−2 d−1). Water flux was calculated using the measured lysimeter volume on each collection day and the lysimeter collection area (L m−2 d−1).
Lysimeter collection efficiency testing was completed on three forest lysimeters and three harvested lysimeters following the study period. The soil on top of and around the lysimeter catchment area was first saturated, and then the area directly above each lysimeter was watered uniformly with 10 L of water and the volume of solution collected by the lysimeters was retrieved. This was repeated three times on each of the lysimeters to determine the efficiency of the lysimeter system in collecting the leachate from the footprint of organic soil directly above the installed pan. Lysimeter efficiency was found to be 92.3±21 % and 88.6±18 % in the forest and harvested plots, respectively. No statistically significant difference between the collection behaviour of the forest and harvested forest plot lysimeters was detected (T test; p=0.8248).
2.3 Water input estimate
A tipping bucket rain gauge (RST Instruments model TR-525) was installed in an open area at PBEWA to monitor local precipitation and air temperature. Data from the local tipping bucket were compared with regional precipitation reported by Environment Canada at the Deer Lake Airport (49∘13′00′′ N, 57∘24′00′′ W) approximately 50 km away. Total precipitation measured at the Deer Lake Airport was found to be a good predictor of PBEWA precipitation on weekly timescales for the dates available (n=30, , r2=0.9145, p<0.0001). This relationship was used to calculate weekly precipitation for a gap in our on-site precipitation data between 24 July and 29 August 2013. The on-site gauge was not outfitted to partition total precipitation into snowfall and rainfall, and therefore snowfall was calculated by applying the proportion of rain and snow measured at the Deer Lake Airport station to the total precipitation measured at PBEWA.
Snowmelt water input was estimated using changes in snow depth between each lysimeter collection day measured near each lysimeter in both the forest and harvested plots. The average snow depth change by plot type was multiplied by an estimated maritime snow density of 0.343 g cm−3 (Sturm et al., 2010) to provide an estimated snowmelt water input value. Snow density is variable both within the snow profile and over the course of snowmelt; therefore, this calculation provides a rough estimate of the water input to the soil from snowmelt. These estimates were combined with rainfall when applicable to give a total water input over the lysimeter footprint for each collection period.
A snow pit was analyzed for each plot type on 2 April 2014 just prior to the onset of snowmelt. A series of 15 cm long snow cores were collected beginning from the top of the snowpack down to the forest floor to obtain a sample of the entire snowpack per plot type. The cores were melted, pooled by plot type, and the DOC concentration of the pooled samples was measured to provide a mean DOC concentration in the snow of forest and harvested plots. The snow depth of each plot, combined with the estimated snow density (0.343 g cm−3) and DOC concentration, was used to determine a snow DOC input to the forest floor (Table 1).
Table 1Ecosystem and soil properties of black spruce forest and adjacent harvested plots. Values are means of 12 litterfall traps per plot type, 16 soil respiration collars per plot type, three organic (O) horizon soil temperature and moisture probes per plot type, two mineral horizon soil temperature and moisture probes per plot type, nine O horizon samples per plot type used to determine thickness, % C, C stock, C : N and bulk density, one snow pit per plot type, and three seasonally distinct rain collections used together with annual rainfall to estimate an annual C input, with standard error in parenthesis. Results for one-way ANOVAs (litterfall, O horizon thickness, soil % C, C stock, C : N, and soil bulk density) and T tests (soil temperature and moisture) conducted to identify plot type differences are shown where applicable with significant results in bold (alpha = 0.05). Soil moisture is measured as volumetric water content (VWC). See methods for further measurement and sample collection details.
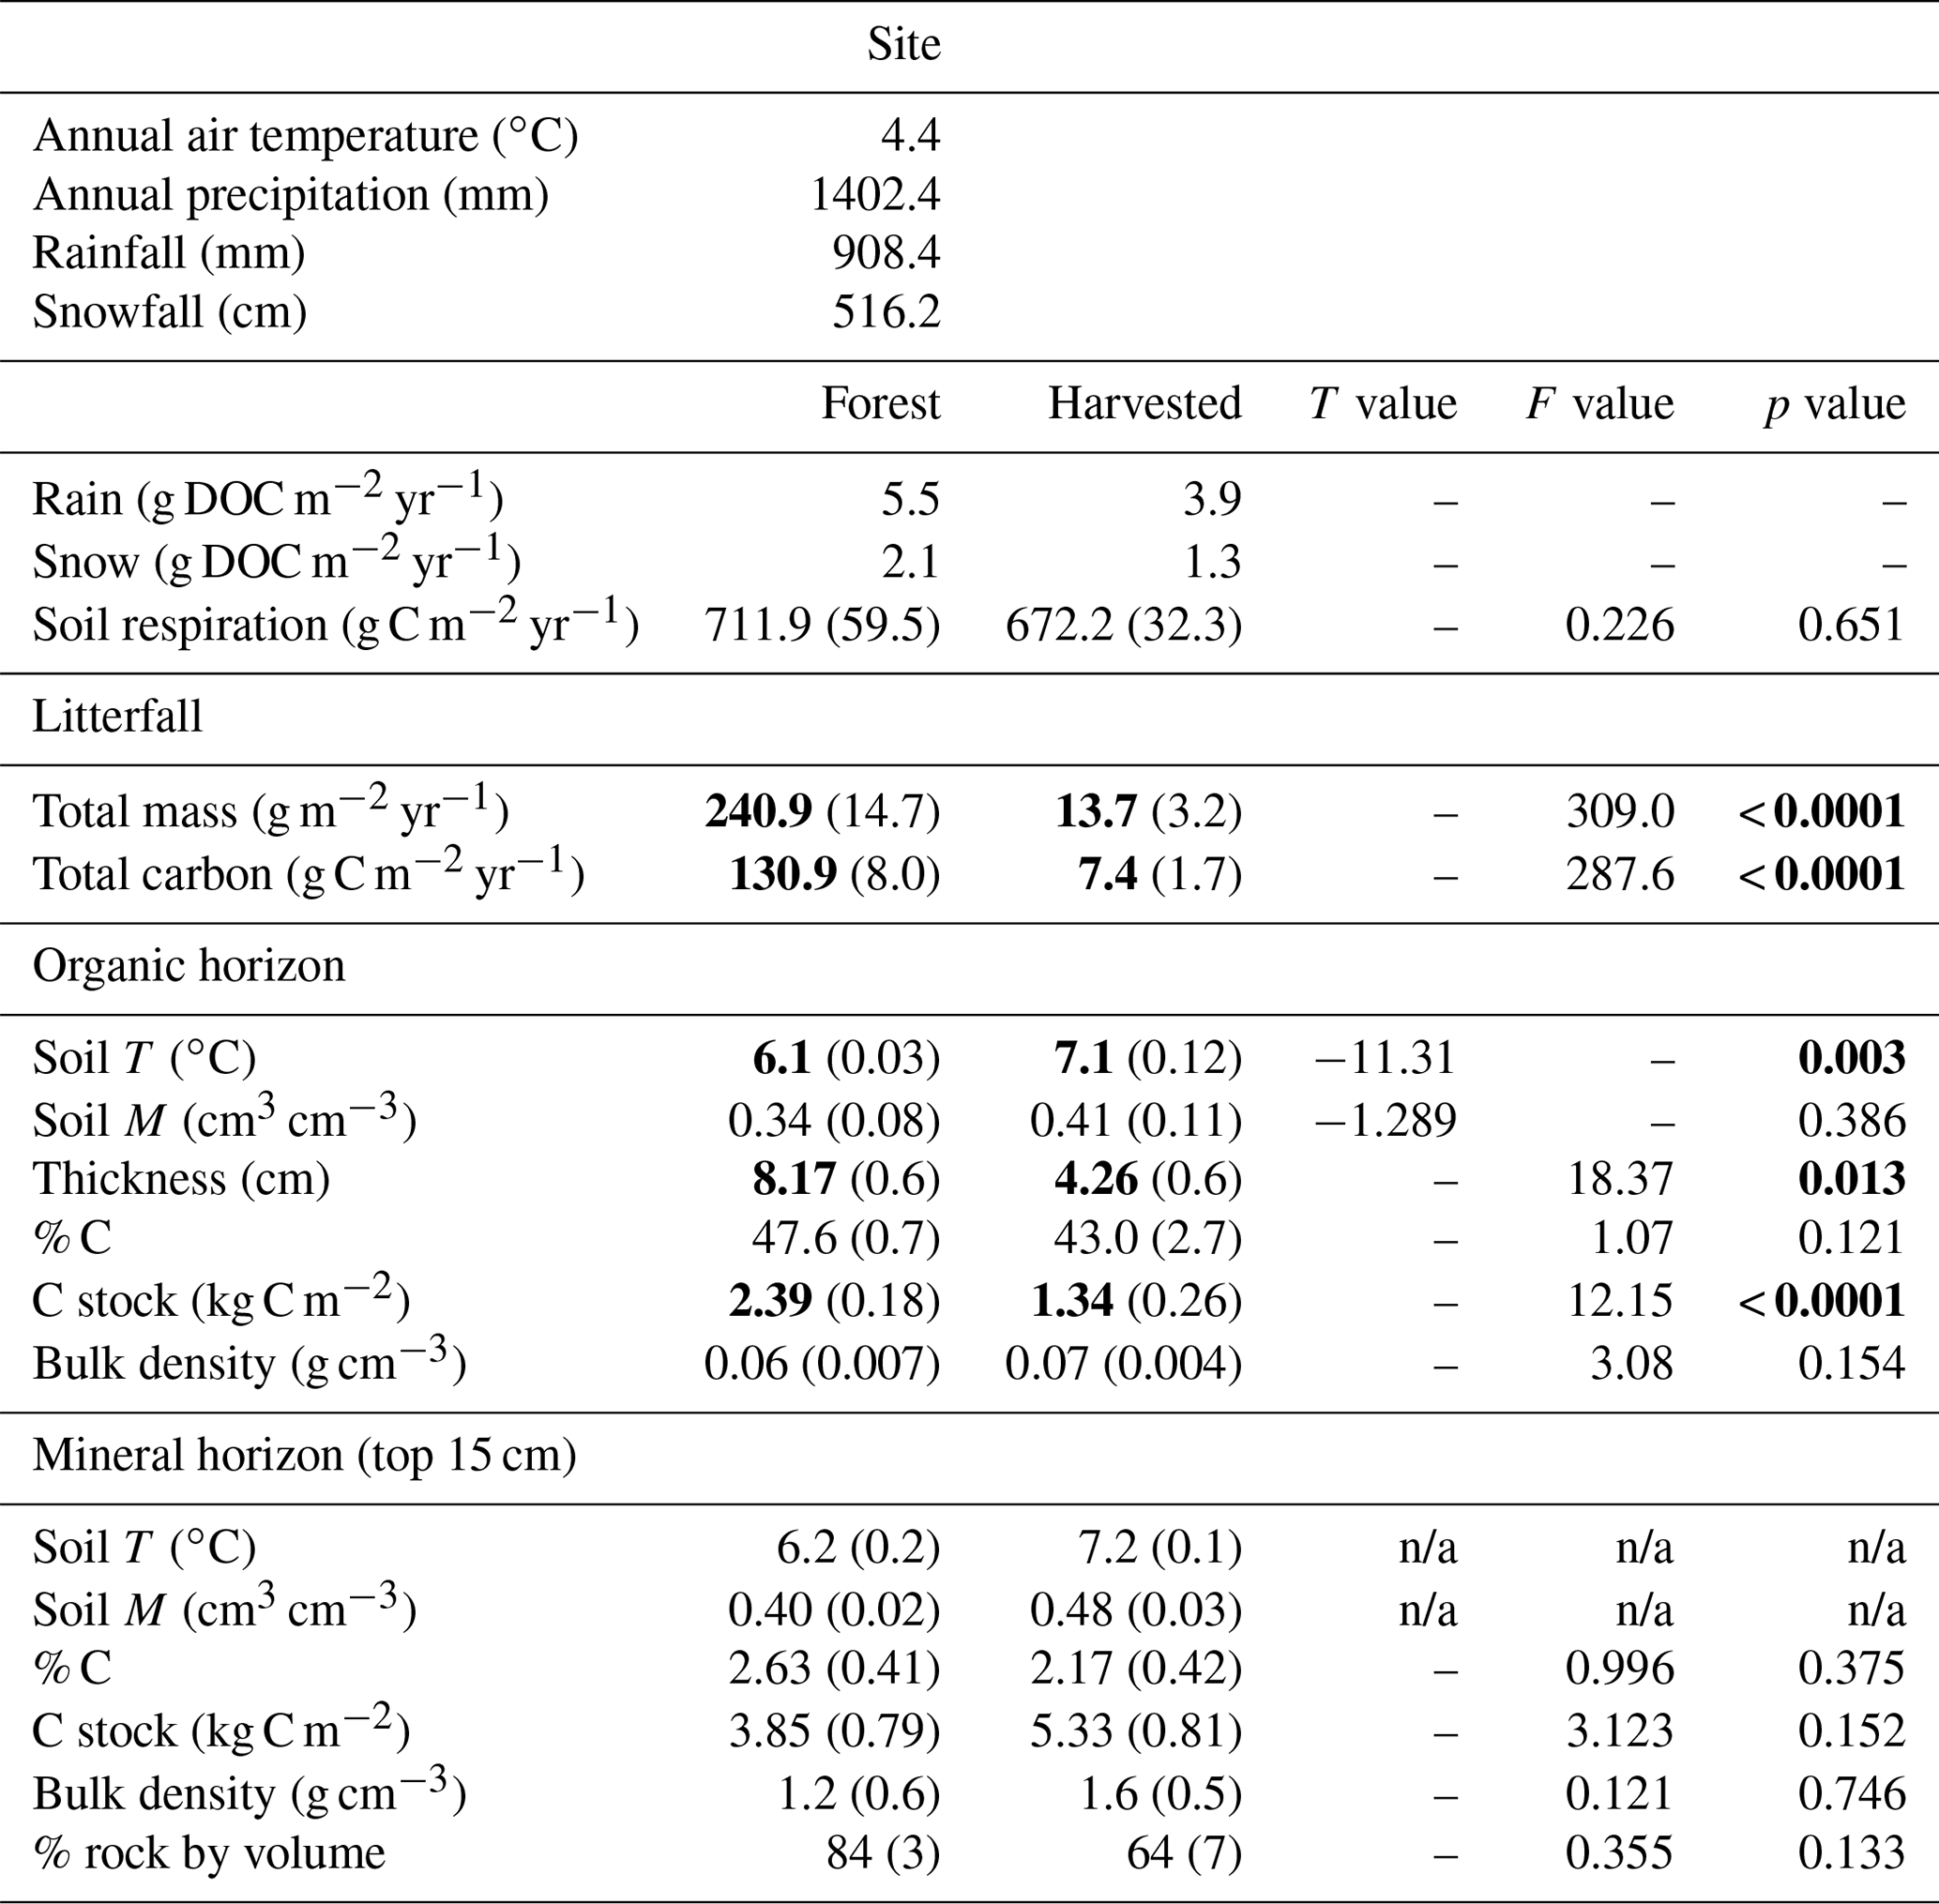
n/a: not applicable.
Throughfall was collected on an event basis using 10 buckets (0.36 m−2 collection area) distributed within a 50 m×50 m forest plot in May, August, and October 2015. Synchronized collection of open rainfall using 5 buckets was completed in an adjacent harvested plot. Prior to the first sampling date a preliminary variability experiment was conducted in October 2015 on-site to determine the most practical number of buckets required to capture the variability within forest and harvested plots. Forty buckets were installed in a forest plot and 10 in a harvested plot and left out for one rainfall event. The contents of each bucket was sampled, filtered, and analyzed for DOC concentration. From these data a Monte Carlo simulation was used to predict the relationship between the number of buckets deployed and the variability of DOC concentration captured. It was found that installing 10 buckets in the forest plots and 5 in the harvested plots captured a similar amount of variation in water volume and DOC concentration as deploying 40 gauges in the forest plot and 10 in the harvested. Mean DOC concentrations of each collection was determined for each collection period and used as a seasonal representation of forest and harvested DOC concentrations. Seasonal DOC was then scaled up to an annual DOC input estimate (Table 1).
2.4 Soil sampling
The O horizon soil was sampled specifically for this study by taking three 20 cm×20 cm samples from three forest plots and three 20 cm×20 cm samples from three harvested plots (n=9 for each plot type). Living vegetation was removed, the thickness of each sample was measured, and the soil was sieved using a 6 mm sieve and dried at 50 ∘C for 48 h. Samples were ground using a Wiley mill and subsampled for elemental analysis on a Carlo Erba NA1500 Series II elemental analyzer (Milan, Italy) at Memorial University of Newfoundland. These samples were used to determine soil % C and soil C stock (kg C m−2). Mineral soil was sampled below each O horizon sample with a soil corer (length: 15 cm, diameter: 5.5 cm). Each mineral soil sample was sieved using a 2 mm sieve and dried at 50 ∘C for 48 h and weighed. Once dried and weighed, samples were ground using a ball mill and subsampled for elemental analysis as above for O horizon samples. The rock fragment content (> 2 mm) on a volume basis was estimated using the weight of rocks and Eq. (1) (Brakensiek and Rawls, 1994):
where Z2= % rock by volume, Z1= % rock by weight.
Bulk density of O horizon and mineral soils was calculated using the volume and dried mass of the soil sample.
Additionally, two sets of O horizon samples were obtained for physical measurement of O horizon unsaturated and saturated hydraulic properties and water infiltration rates. Cores (5 cm diameter) were collected in triplicate at two locations in forest and harvested plots (six cores per plot type), and live moss was removed prior to analysis using a HYPROP system. The HYPROP measurements of water content and soil water tension during continuous evaporation were analyzed to obtain relationships of soil water tension and hydraulic conductivity to water content (Schindler and Muller, 2006; Schindler, 2010). A second set of cores (10 cm diameter) were collected at six locations in two forest plots for falling head infiltration (INF) analysis. These cores included the entire organic (L, F, and H) horizon and moss. Following a first round of infiltration rate measures a subset of cores were partially excluded to expose the entire H horizon, which was carefully removed before remeasuring infiltration. Forest and harvested plots had H layers with similar bulk densities, but H layers constituted much of the O horizon in harvested plots where moss cover was limited and the L and F layers were reduced in comparison to forest plots. Matrix and macropore saturation was determined for each these cores (Table 4).
2.5 Litterfall collection
Litterfall was collected using four 0.34 m2 litter traps placed on the forest floor in four plots per plot type from August 2012 to August 2013. Litter was collected in early spring and late fall; sorted into needles, bark, cones, lichen, and deciduous leaves; dried at 60 ∘C over 48 h; and weighed. A litterfall C input was estimated by applying concentrations of 542 mg C g−1 for both twigs and needles and 552 mg C g−1 for cones of black spruce litter fall (Preston et al., 2006).
2.6 Soil temperature and moisture
Three soil temperature and moisture probes per plot type (Decagon ECH2O-TM) were installed mid-organic horizon at approximately 5 cm depth, and two were installed in the mineral layer at approximately 15 cm depth. These probes measure the dielectric constant of the soil using capacitance/frequency domain technology, providing volumetric water content (VWC). The O horizon probes were calibrated using HYPROP and infiltration analyses (Table S7 in the Supplement; see also Sect. 2.4 and Table 4). Handheld spot measurements using a HydroSense II soil water content reflectometer on select days (data not shown) confirmed the consistently wetter O horizons in the harvested plots as indicated by field probe measurements (Fig. 2c; Table 1).
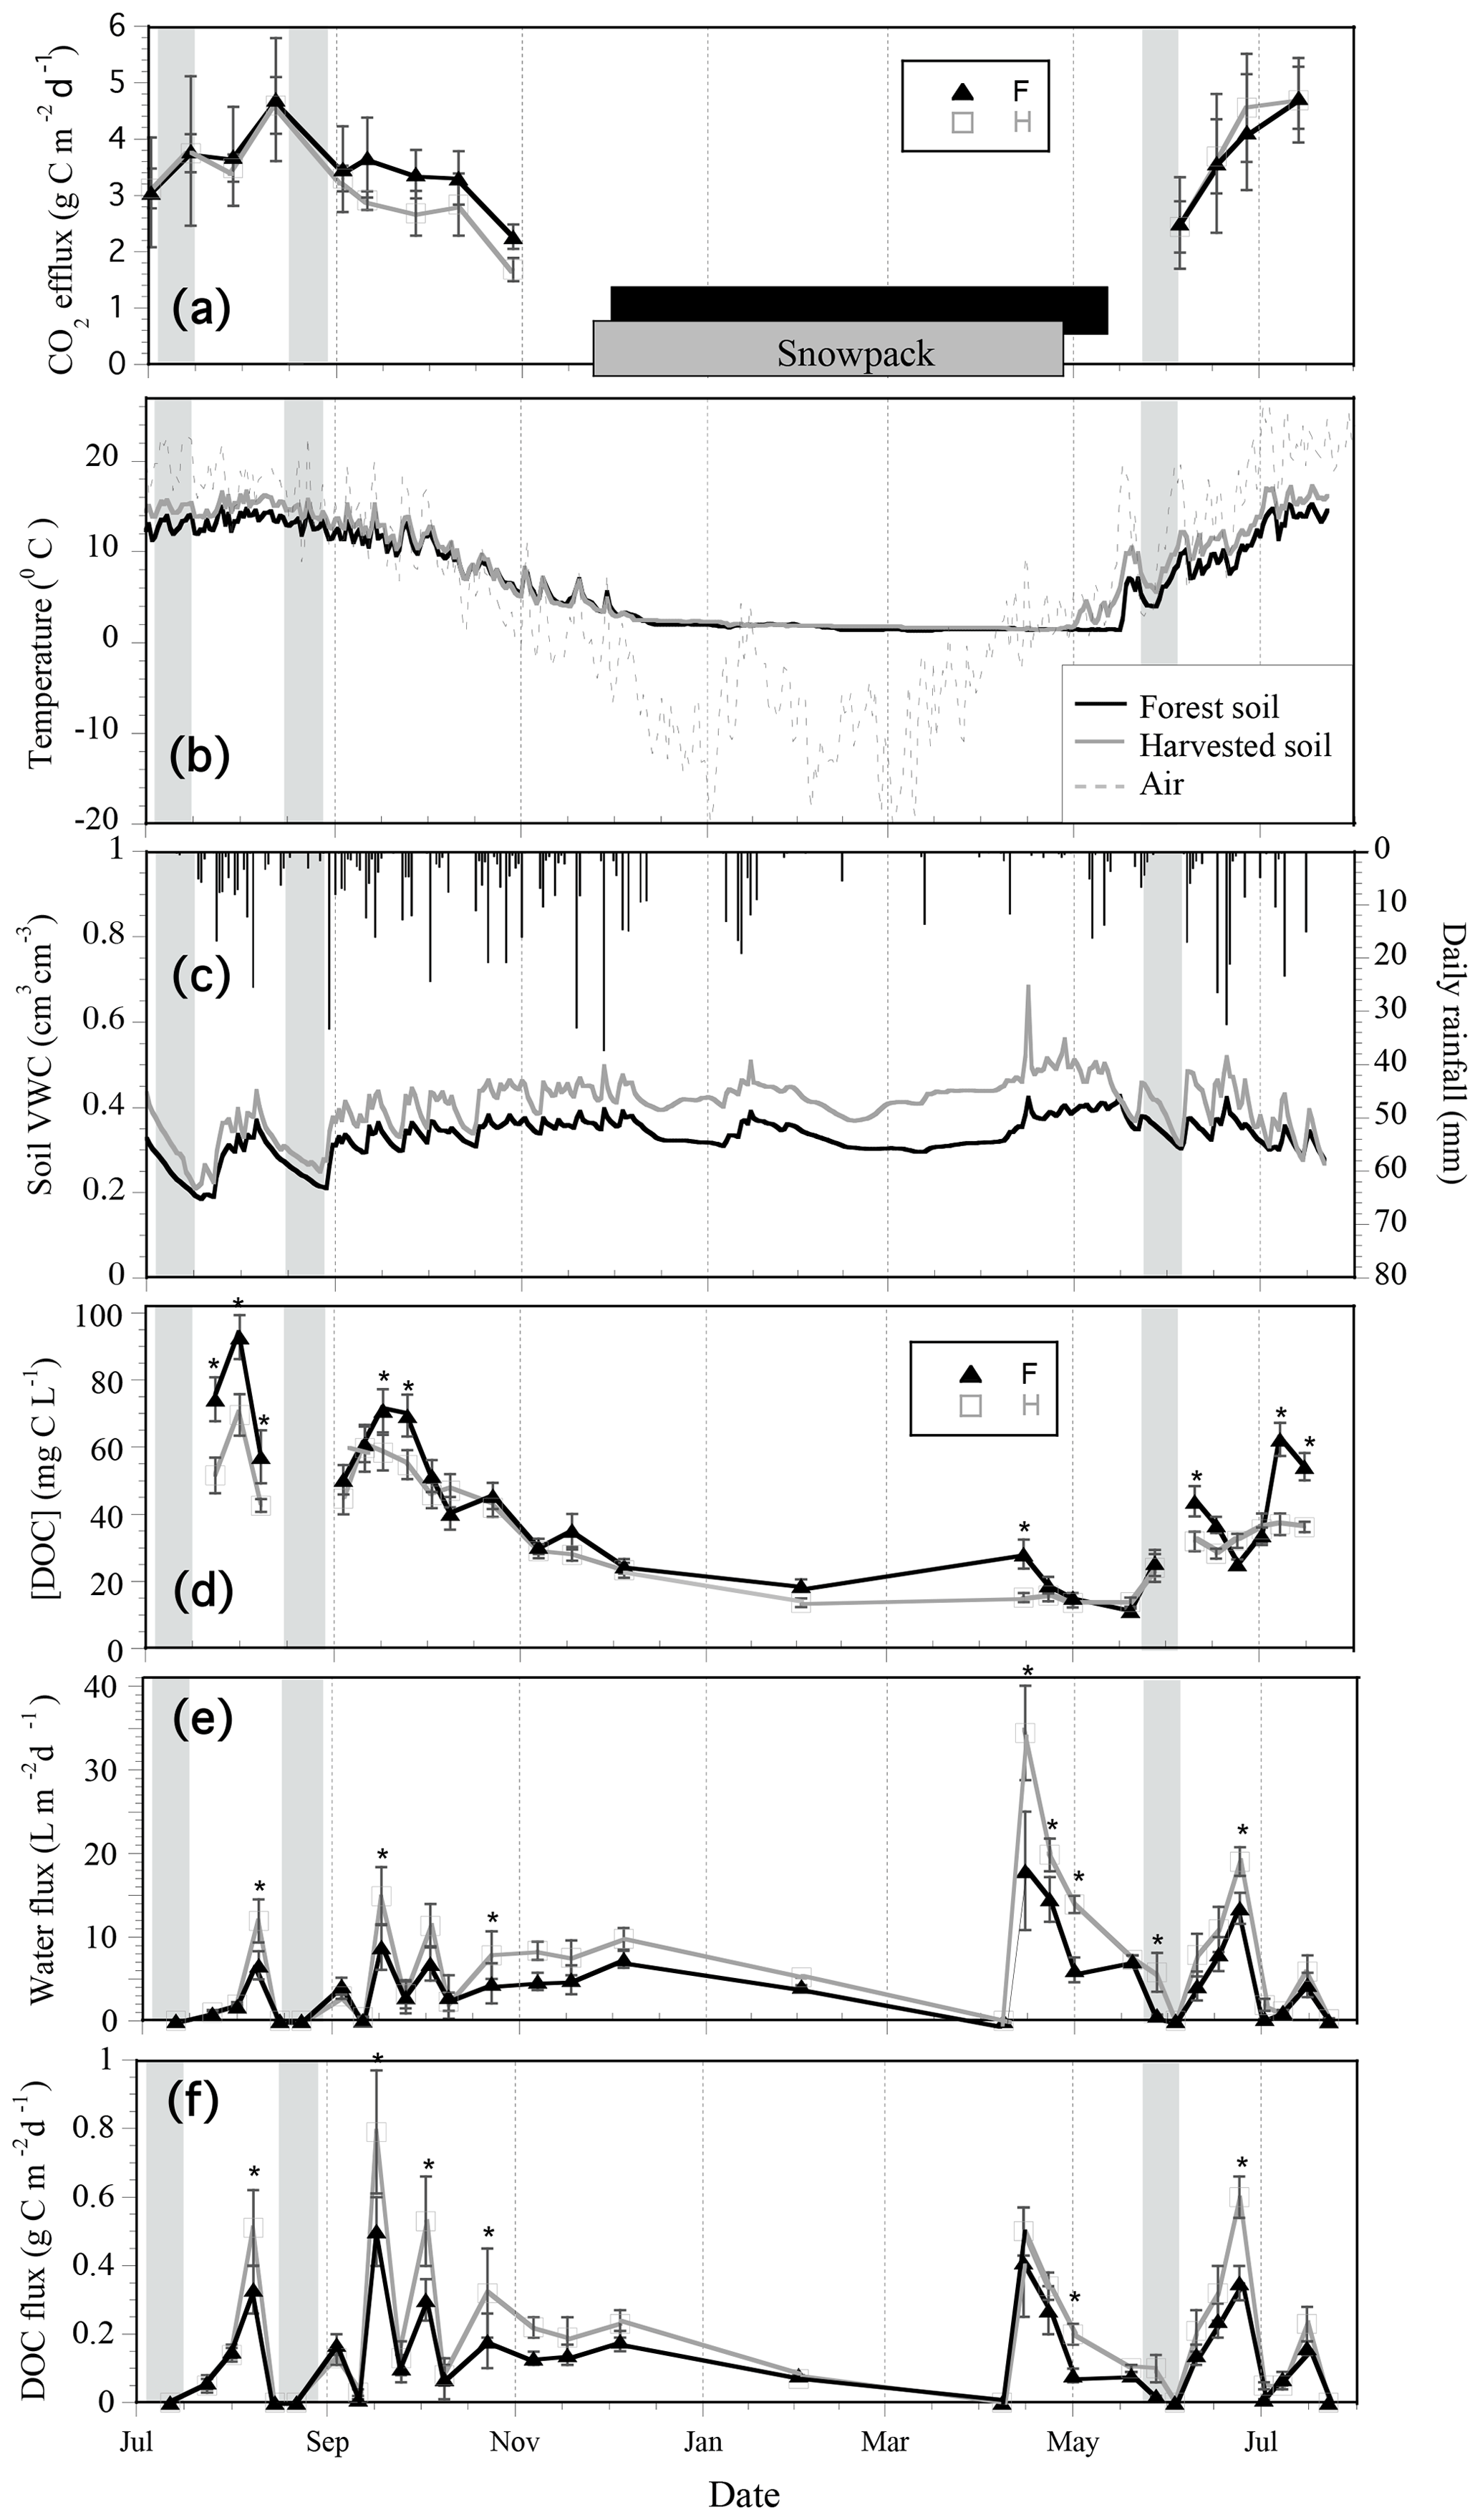
Figure 2Temporal variation of soil respiration (a), daily mean soil temperature with the presence of a snowpack indicated by the grey (harvested) and black (forest) bar (b), daily rainfall and daily mean soil moisture (c), and lysimeter collections (d, e, f) from July 2013 to July 2014 in black spruce forest and harvested plots. The mean dissolved organic carbon (DOC) concentration (d), water flux (e), and DOC flux (f) was determined using passive pan lysimeter collections underneath O horizons. Lysimeter sampling was continuous, and points represent a mean daily flux over each collection period. Error bars show the standard error of the mean of 12 lysimeter collections per plot type per collection period. Grey shading areas indicate dry periods signified by those exceeding 10 consecutive days of rainfall less than 10 mm d−1, corresponding to periods of soil drying. Significant differences in DOC flux, water flux, and DOC concentration between plot type on each collection day were determined by repeated-measures linear-mixed-model post hoc tests and are indicated by an asterisk (α = 0.05).
2.7 Soil respiration
Measurements of soil respiration were made at biweekly intervals for the snow-free growing seasons (May–November) in 2013–2015. Four collars consisting of a 7 cm section of 10 cm inside diameter PVC pipe were inserted into the ground 8 months prior to the start of measurement in four forest plots and four harvested plots. Soil respiration rate and soil temperature were measured every 2 weeks using a LI-6400-09 soil chamber and a penetration soil temperature probe, both attached to an LI-6400 portable CO2 infrared gas analyzer (IRGA). Volumetric soil water content was measured with a Campbell Hydro-Sense penetration probe inserted in the soil to the depth of 10 cm in the vicinity of the PVC collars. Daily soil respiration rates were modelled using daily average air temperature and the relationship between measured instantaneous soil respiration and temperature. Annual cumulative growing season soil respiration was calculated using the annual sum of modelled daily soil respiration.
2.8 Statistical analyses
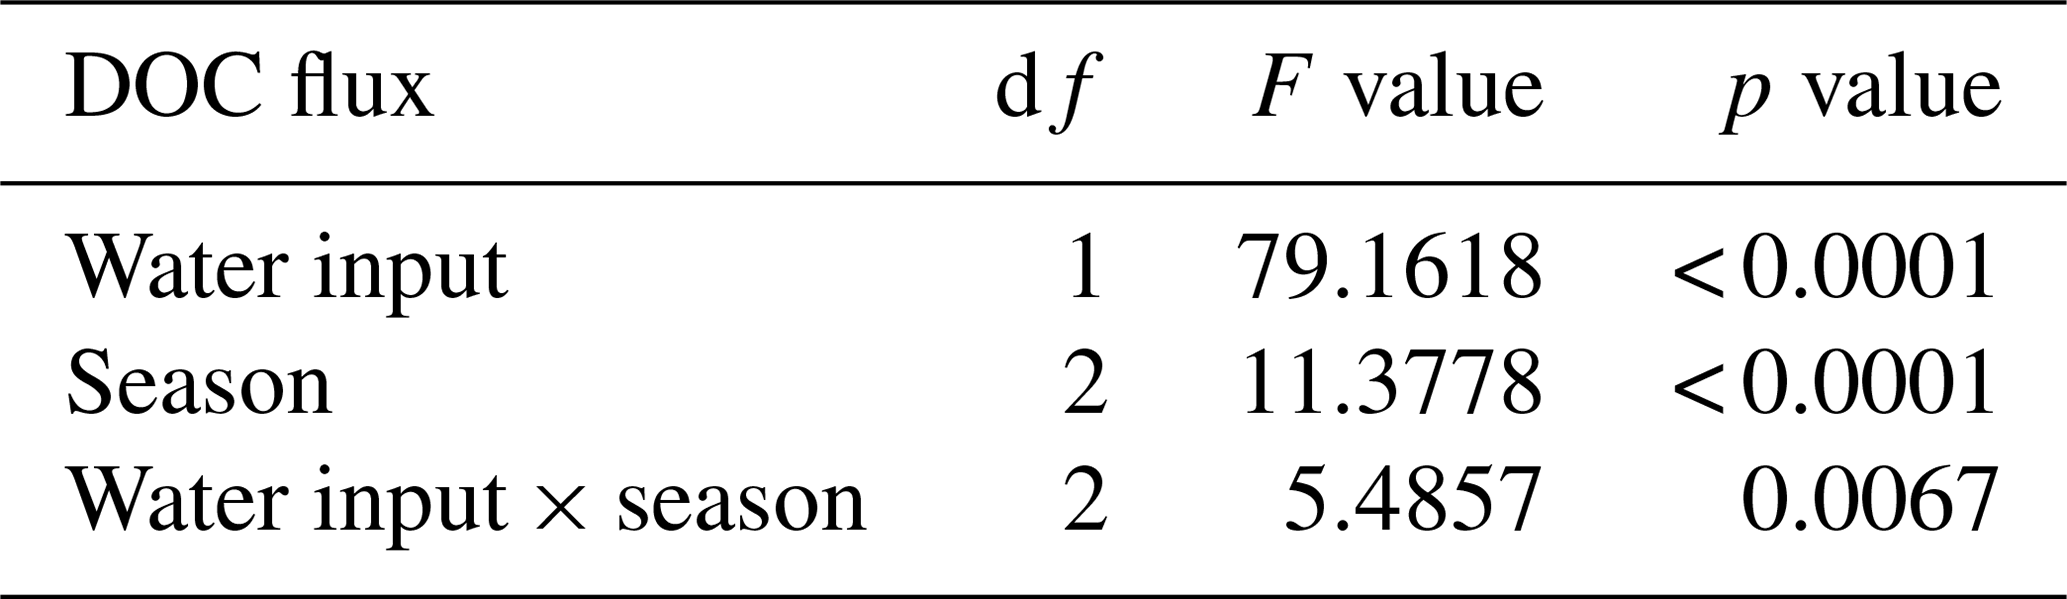
All statistical analyses were performed using RStudio version 1.0.136. T tests were used to determine plot type differences in mean annual soil moisture and soil temperature. ANOVAs were used to determine plot treatment differences in total annual DOC flux, water flux, and DOC concentration, mean organic horizon thickness, mean organic and mineral soil % C, mean organic and mineral soil C stocks, and mean annual litterfall between forest plots and harvested plots over the entire study period (Tables 1, S1, Fig. 2; asterisks). A repeated-measures linear mixed effects (RM-LME) model using the “nlme” package was used to assess the fixed effects of collection day, as well as the interaction between collection day and plot type on the intra-annual variation of DOC fluxes, water fluxes, and DOC concentration (Table S2) with lysimeters as the random effect. Post hoc Tukey tests were used to determine significant differences in DOC flux, water flux and DOC concentration between forest and harvested forest plots on individual collection days (Fig. 2d–e; asterisks). The data were grouped into three seasons: summer, autumn, and spring snowmelt, and a two-way ANOVA was used to assess the effects of water input, season, and their interaction on DOC fluxes (Table 3).
Table 2Pearson correlations between lysimeter-captured dissolved organic carbon concentrations (mg DOC L−1), dissolved organic carbon fluxes (g DOC m−2 d−1), soil solution fluxes (L water m−2 d−1), and environmental variables (mean soil temperature, mean soil moisture, and daily water input rain and/or snowmelt) over 30 collection periods.
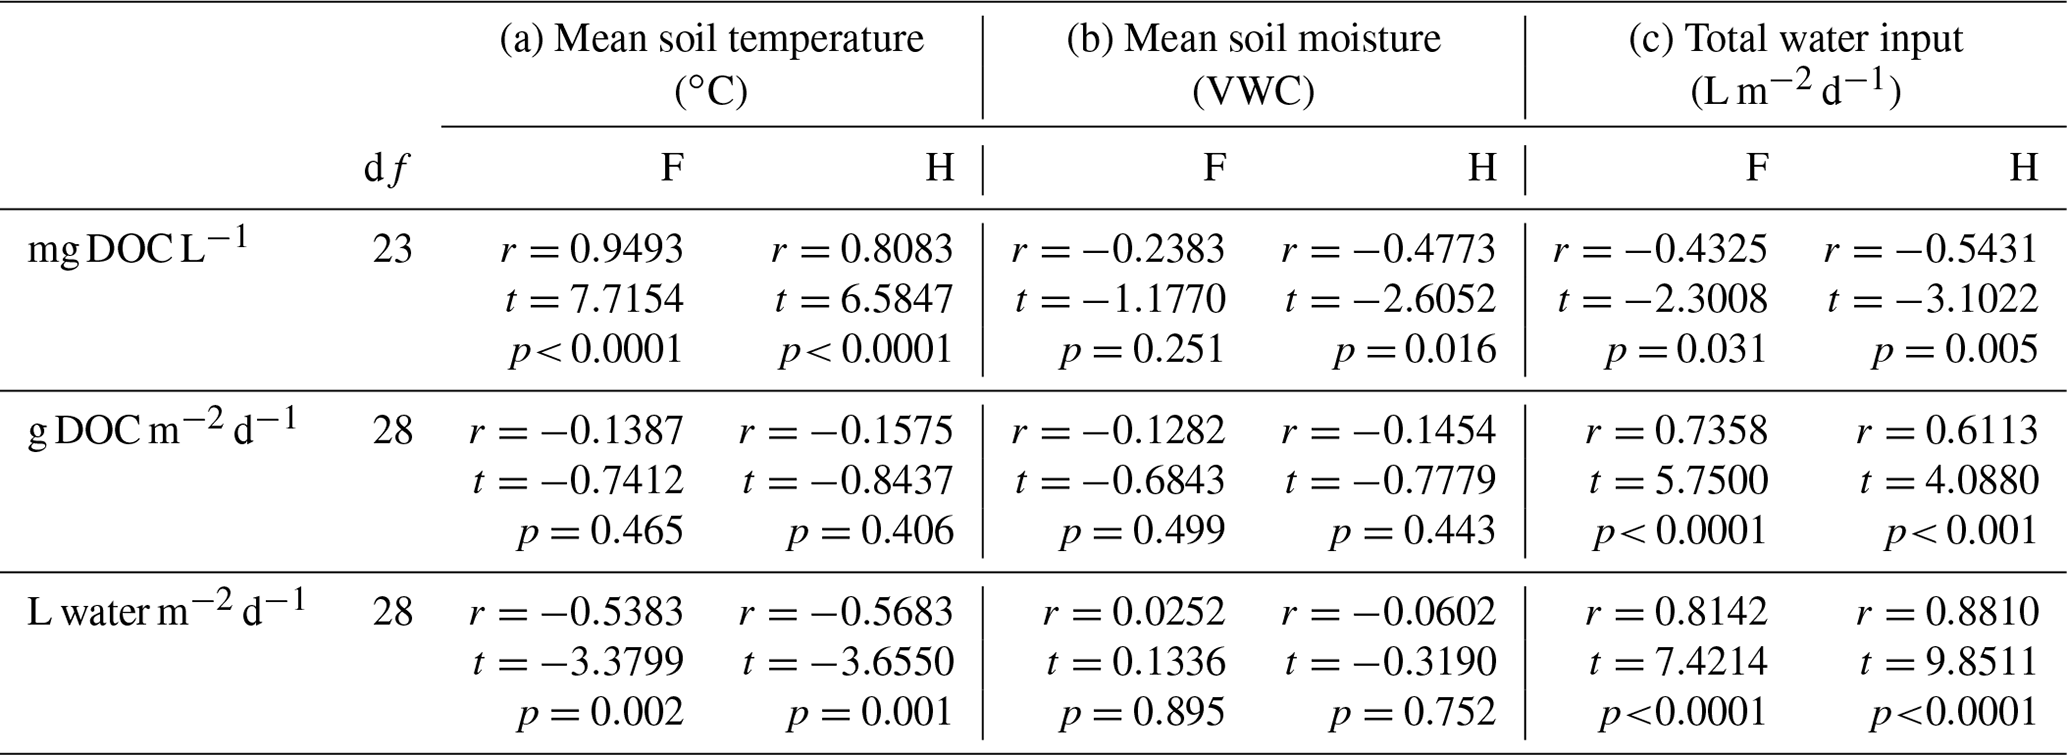
Table 3Two-way ANOVA results examining the effect of water input, season, and their interaction on DOC fluxes. Data plotted in Fig. 4.
Correlation testing was used to assess the relationships among data from lysimeter collections (DOC flux, water flux, and DOC concentration) and mean soil temperature, mean soil moisture, and daily water input (Table 2) across 30 collection days. Multiple regressions were not used due to the multi-collinearity of many of the predictor variables, which affected the estimated regression parameters. Individual correlations, however, were assessed to evaluate the strength of relationships among variables within the dataset.
A linear mixed effects model was used to examine the effects of plot type, sample year (2013–2015), and their interaction on soil respiration. The interaction term was further analyzed with a post hoc least square means test. Linear interpolation was used to calculate cumulative soil respiration for the snow-free growing season during the period of 2013–2015. A multiple linear regression was used to explain the dependence of soil respiration on soil temperature, moisture, and the soil temperature by soil moisture interaction.
3.1 Soil properties and aboveground litterfall
Soil bulk density was not different between the forest and harvested plots for either O or mineral soil horizons (Table 1). However, O horizon depth was almost twice as great in the forest plots compared with the harvested plots (means of 8.17 and 4.26 cm, respectively; Table 1). This resulted in an estimated 78 % greater O horizon SOC stock in forest plots relative to harvested plots (2390 and 1340 g C m−2; Table 1). Annual litterfall inputs to the soil surface were greater in the forest plots (240.9 and 13.7 g m−2 yr−1), amounting to an estimated 130.9.4 and 7.4 g C m−2 yr−1 reaching the forest floor as litterfall in the forest and harvested plots, respectively (Table 1).
Table 4Average soil hydraulic parameters of organic horizons. Data were obtained from the HYPROP (HP) evaporation apparatus for unsaturated conditions and falling head infiltration (INF) tests for matrix-saturated and totally saturated (macropore infiltration) conditions. Both tests were made on intact cores and standard deviations are provided in parentheses (n=6). Live and senescent moss was removed for the HP analysis but not the INF analysis (see “horizon” column). BD: bulk density; θr: water content at residual saturation; θms: water content at matrix saturation; θts: water content at total saturation; Kms: hydraulic conductivity at matrix saturation; Kts: hydraulic conductivity at total saturation. Results from INF were used to calibrate continuous field measurements (see Table S8).
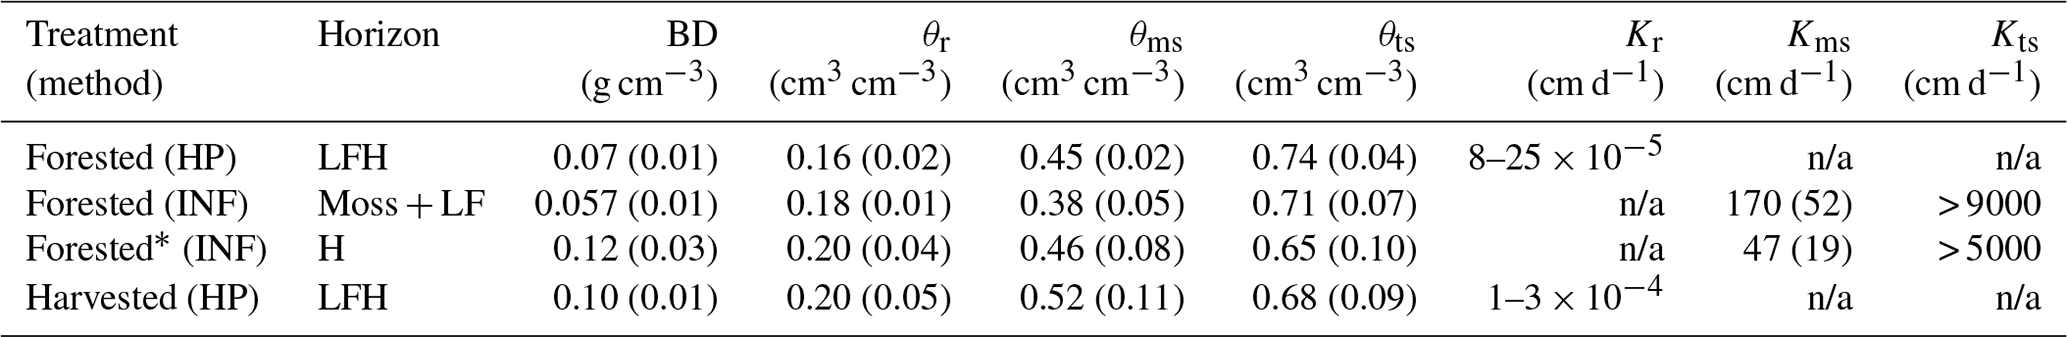
* INF measurements of forested H were used to represent the harvested O layer. See methods for details. n/a: not applicable.
3.2 Soil respiration
The temporal range in instantaneous CO2 efflux rates during the lysimeter measurement period (July 2013–July 2014; Fig. 2a) was approximately 2.0–4.8 g C m−2 d−1 in the forest and harvested plots. The estimated cumulative respiration was 672.2 and 711.9 g C m−2 yr−1 in the forest and harvested plots, respectively. Highest efflux rates occurred in the summer and decreased to lowest values in autumn in both plot types. Lowest rates occurred following snowmelt and increased in both plot types as soils warmed.
There was no overall significant difference in soil respiration between plot types for the 2013–2015 growing season estimates; however, there was a significant plot type by sample year interaction effect on soil respiration (Table S3). The multiple comparisons found that soil respiration in the harvested plot was lower relative to that in the forest plot for 2014 and 2015 growing seasons but not 2013 (Tables S4 and S5). Soil respiration was positively related with soil temperature but negatively related with soil moisture content, and the presence of a soil temperature by soil a moisture interactive effect on soil respiration in the regression analysis indicated the effects of soil temperature on soil respiration had been modified by soil moisture (Table S6).
3.3 Environmental conditions
The local mean annual air temperature over the July 2013–July 2014 study period was +4.4 ∘C (daily mean range: −19.0 to +25.9 ∘C), and 1402.4 mm of total precipitation fell, including 516 mm water equivalents as snowfall. The greatest total precipitation occurred over the winter period (600.2 mm), followed by the summer (388.2 mm), autumn (332.1 mm), and then snowmelt (81.9 mm). Two significant dry spells were observed in summer (10 consecutive days of < 10 mm d−1 of rainfall, Fig. 2; shaded areas). The greatest total snowfall occurred during the winter period (481.9 cm). Total autumn snowfall was 18.6 cm, and snowmelt snowfall was 15.8 cm, and no snow fell in the summer. The snowpack depth measured at the onset of snowmelt on 2 April 2014 was 83 cm in the forest plots and 110 cm in the harvested plots.
The O horizons in the harvested plots were generally warmer and thinner than those in the forest plots (Table 1, Fig. 2b; forest plot range: 1.1 to 16 ∘C; harvested plot range: 1.4 to 20 ∘C). In summer, soil temperatures maintained an approximate 2 ∘C difference. Decreasing air temperature in the autumn was associated with a convergence of soil temperature such that winter soil temperatures in the two different plot types were similar. Increasing air temperatures in the spring and snowmelt resulted in a divergence of soil temperature in the two plot types (Fig. 2b). The snowpack persisted throughout winter and insulated the soils of both plot types from freezing. Soil temperatures began increasing in the spring about 2 weeks earlier in the harvested plots than in the forest plots, indicating an approximate 2-week lag in the snow-free period in the forest plots compared to the harvested plots (Fig. 2a; snowpack).
The O and mineral horizons were consistently wetter in harvested plots relative to the forest plots over the duration of the study (Fig. 2c), but given the high variability and few measurement replicates (n=3 O horizon, n=2 mineral horizon) this pattern was not statistically confirmed (Table 1). The O horizons experienced long periods of drying in the summer, especially in July 2013 (Fig. 2c; shaded areas), but there was little change in soil moisture over the winter other than during a 2-week episode of warming and snowmelt in January 2014.
3.4 DOC concentration
The mean annual volume-weighted DOC concentration collected by lysimeters was 29.4 and 26.1 mg C L−1 in the forest and harvested plots (Fig. 3a) and was not statistically different (p=0.09). The mean annual DOC concentration was volume weighted because lysimeter collections were not made at even time intervals throughout the year. Seasonal ranges of absolute concentrations include summer mean concentrations of 55 and 45 mg C L−1, autumn means of 42 and 38 mg C L−1, winter means of 18 and 13 mg C L−1, and spring snowmelt means of 25 and 20 mg C L−1 in the forest and harvested plots, respectively. The DOC concentration exhibited an interaction of collection day by plot type; higher DOC concentrations were measured in forest plots relative to the harvested plots in 9 of 25 sampling times, most commonly observed during summer and early autumn. No differences in DOC concentration were detected between plot types during the late autumn and winter (October to April; Fig. 2d). Intra-annual variation in DOC concentration was correlated to soil temperature (positive correlation; Table 2a) and water flux variation (negative correlation; Table 2c) in both plot types. The DOC concentration was negatively correlated to soil moisture in the harvested plots only (Table 2b).
The mean DOC concentration in the snowpack, measured immediately prior to snowmelt on 2 April 2014, was 7.5 and 3.3 mg C L−1 in the forest and harvested plots, respectively. Total snow depth of 84 and 110 cm amounted to a potential DOC input to the soil of 2.1 and 1.2 g C m−2 over the course of snowmelt in the forest and harvested plots, respectively (Table 1). The mean DOC concentration in rain throughfall measured in one forest plot was 7 mg DOC L−1, and open rainfall measured in one adjacent harvested plot was 3 mg DOC L−1, consistent across May, June, and October samples. The estimated annual rain DOC input to soil was 5.5 and 3.9 g m−2 in the forest and harvested plots, respectively (Table 1).
3.5 Lysimeter-captured water and DOC fluxes
The mean annual O horizon water flux was 2040 L m−2 (±129) in the harvested plots and 1366 L m−2 (±344) in forest plots, revealing a 49 % greater flux of water through the O horizons in the harvested plots relative to the forest plots (Fig. 3b; p=0.0357). This corresponded to DOC fluxes of 54 (±3) and 38 g C m−2 (±5) in the harvested and forest plots, respectively, representing a 30 % greater annual loss of DOC from the O horizon of harvested plots (Fig. 3c, p=0.00836). The intra-annual DOC and water fluxes varied with collection day, with an interactive effect of plot type and collection day on both fluxes (Table S2a, b). Measured water fluxes were generally greater in harvested plots than forest plots on a given collection day, often correlating to greater DOC fluxes in harvested plots (Fig. 2d, e; asterisks). The difference in water flux between plot types was significant on 8 of 30 collection days, while the difference in DOC flux between plot types was significant less often (6 of 30).
Longer periods of soil drying and low rainfall, occurring predominately during summer, corresponded with periods of little to no water flux and, consequently, little to no DOC flux in both harvested and forest plots (Fig. 2b, d, e; shaded areas). In contrast, periods of relatively high moisture and consistent rainfall, occurring predominately in autumn, corresponded with high and consistent water and DOC fluxes. During spring snowmelt, however, when the DOC concentration was relatively low, the largest water fluxes did not result in the largest fluxes of DOC (Fig. 2; 8 April to 1 May 2014). The highest DOC flux over the study period was observed in early autumn when a large rain event followed a warm period of soil drying. Soil water fluxes were negatively correlated with soil temperature (Table 2a), and there was a strong positive correlation between water input and both soil water and DOC fluxes measured in both plot types (Table 2c). There was an interaction between season and water input on DOC fluxes (Table 3), where a linear relationship between water input and DOC fluxes was observed in the summer (Fig. 4a), but DOC fluxes exhibited a tapering off in autumn and snowmelt when water input to soil was high (Fig. 4b, c).
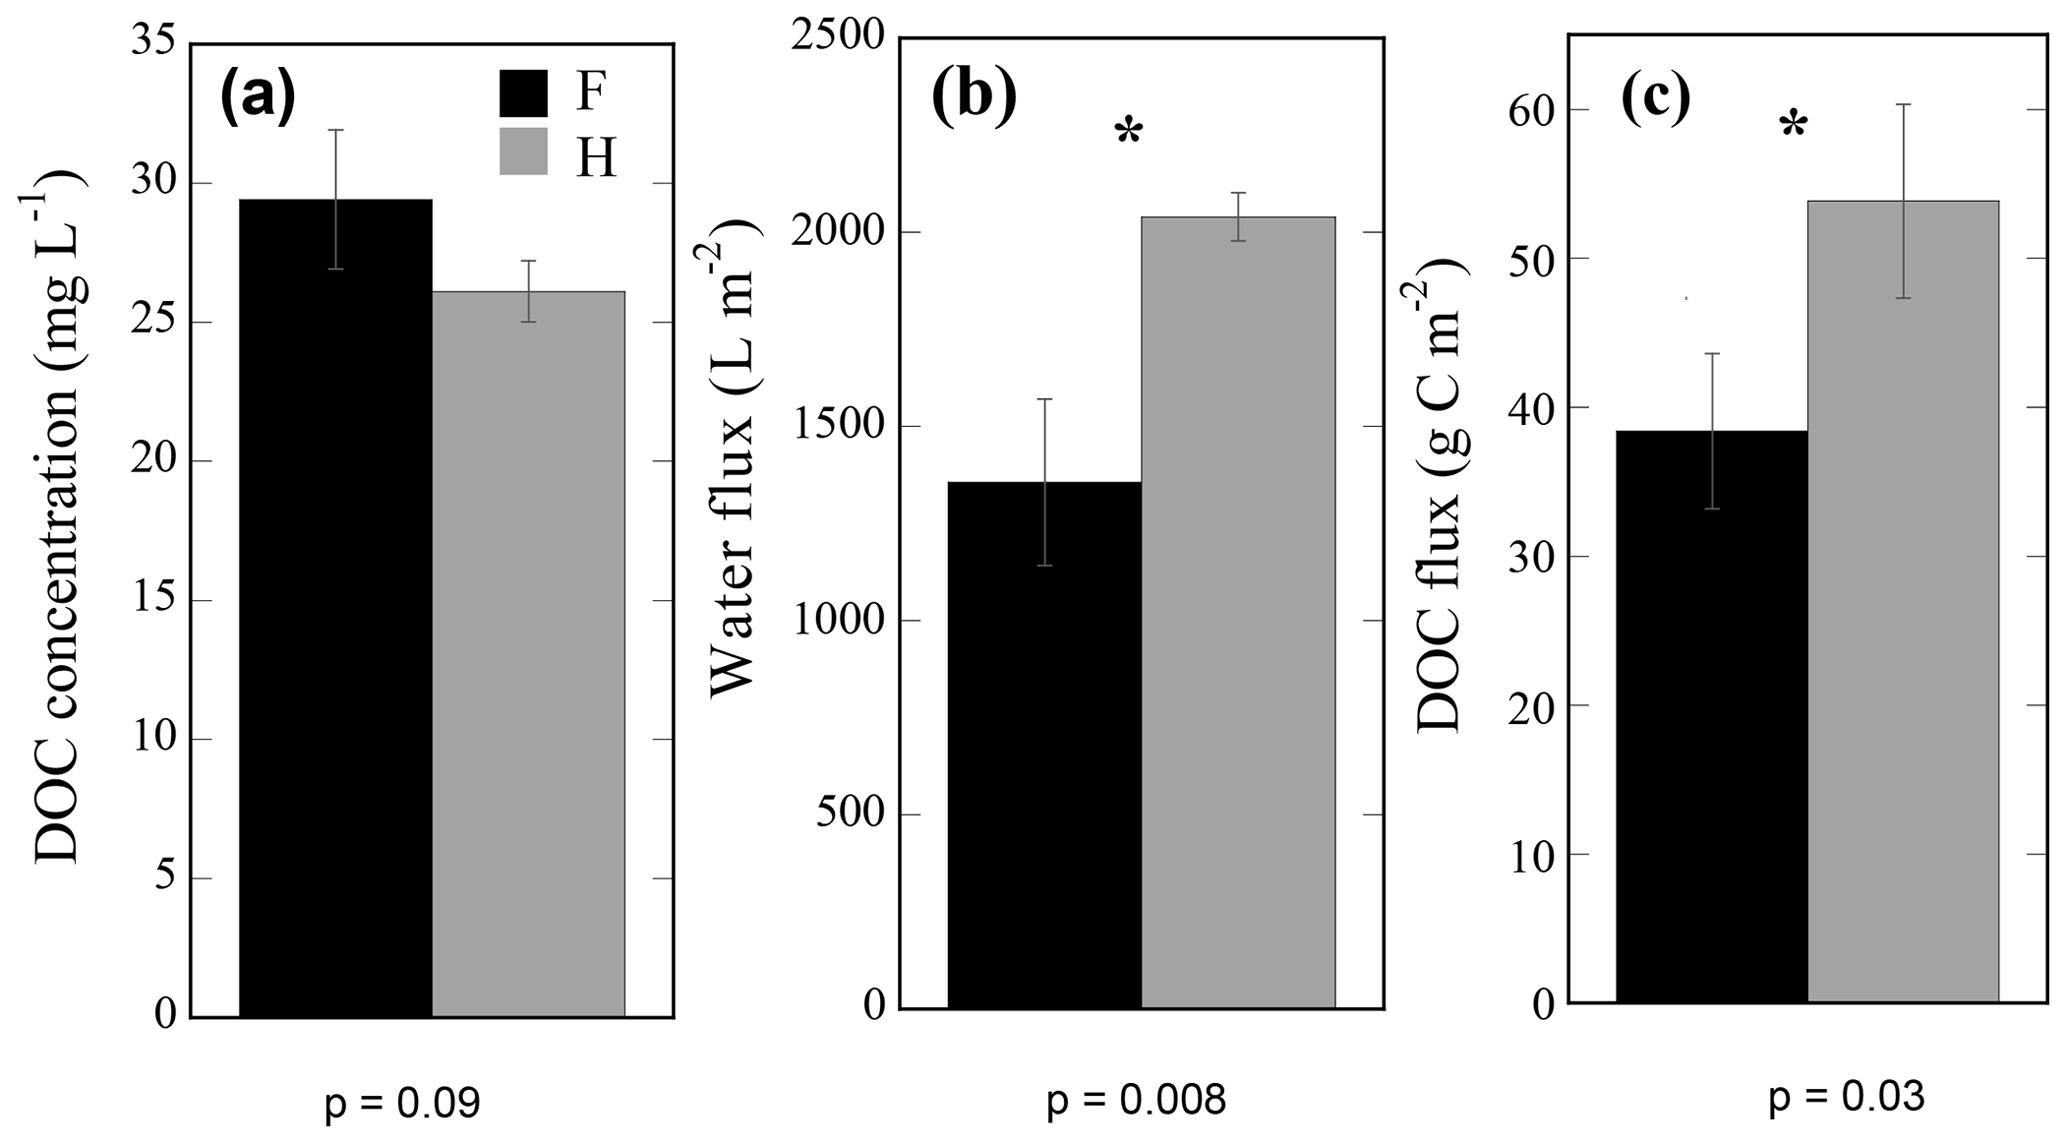
Figure 3Mean annual lysimeter-collected variables. Volume-weighted dissolved organic carbon (DOC) concentration (a), total water flux (b), and total DOC flux collected from organic horizons of forest (F) and harvested (H) plots over the entire study period. Annual values were calculated from the accumulated 29 sample collection time points taken from 12 F and 12 H passive pan lysimeters over 1 year from July 2013 to July 2014. Asterisks show significant differences between plot type (alpha = 0.05), determined using one-way plot nested ANOVA tests (Table S2).
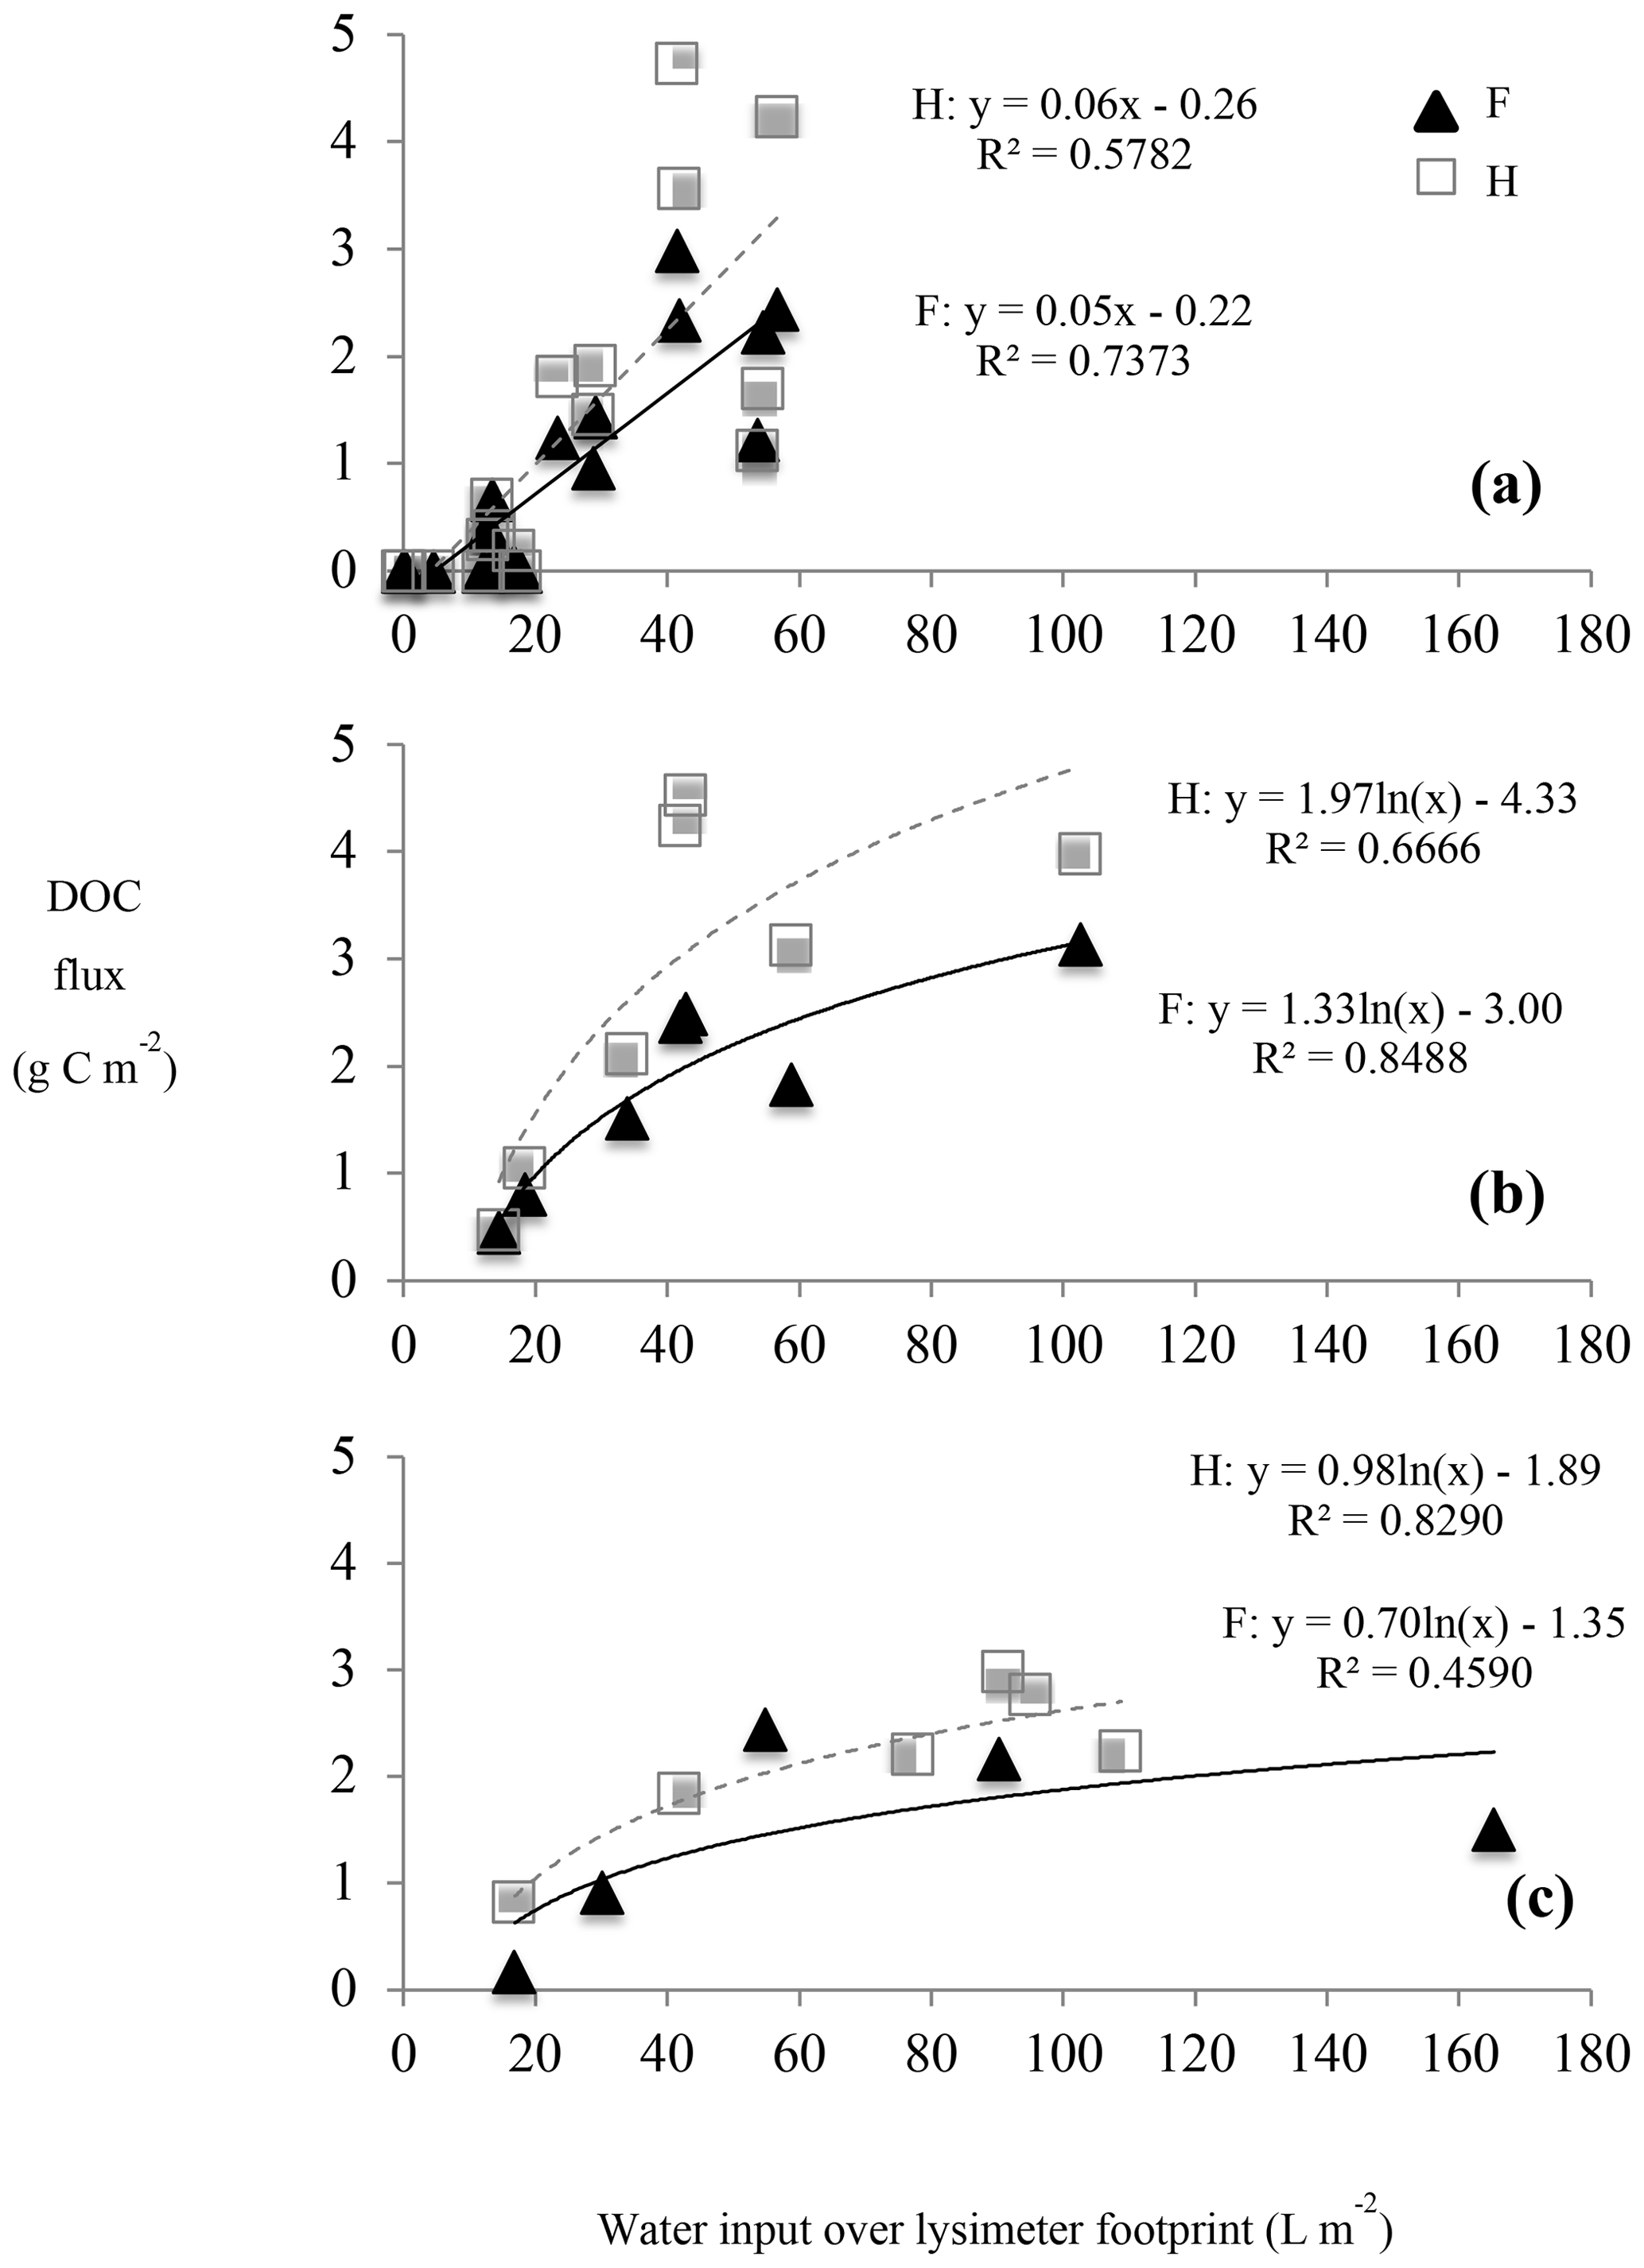
Figure 4Seasonal relationship between dissolved organic carbon (DOC) fluxes and water input to the soil in mature forest (F) and harvested (H) plots. Seasons are designated as summer (a), autumn (b), and winter + snowmelt (c).
4.1 Hydrology drives temporal and plot type differences in DOC flux
This study revealed a 30 % greater annual mobilization of DOC from O horizons in 10-year-old harvested plots compared with forest plots. This was despite lower O horizon SOC stocks and C inputs from aboveground litter in harvested plots (Table 1). Annually, the larger flux of DOC in the harvested plots correlated to a larger annual input of water to the soil surface, larger fluxes of water through thinner O horizons, and warmer mean annual soil temperature. On weekly to monthly timescales, both forest and harvested O horizon DOC flux patterns mirrored those of water fluxes, while the contribution of DOC concentration variations to observed temporal differences was less evident in DOC flux patterns (Fig. 2d, e, f). This is additionally described in both plot types by a strong positive relationship between water input to the forest floor (as rainfall, throughfall, and/or snowmelt) and DOC flux, but with no relationship between DOC flux and soil temperature (Table 2). Therefore, across both forest and harvested landscapes characterized by different surface soil and ecosystem properties, water input to soil is a dominant control over O horizon DOC mobilization dynamics on varying time and spatial scales. Increases in DOC fluxes from O horizons immediately following and up to 5 years after boreal forest harvesting were previously documented by lysimeter studies (Piirainen et al., 2002; Kalbitz et al., 2004). However, to our knowledge this is the first study to demonstrate a longer-lasting (10-year) harvesting effect on DOC fluxes. Harvesting results in sites becoming CO2 sources to the atmosphere for several years. As tree growth rates increase, forests reach a compensation point where they are neither sources nor sinks of C typically within 10–20 years following boreal forest harvesting (Kurz et al., 2013). These estimates are based primarily on CO2 efflux and biomass C sequestration with growth, but our data suggest that hydrological losses of C can also affect this compensation point, where significant differences in water and DOC fluxes between forest and harvested plots are still evident 10 years after harvesting.
To establish water input as a main driver of regional O horizon DOC flux variability, regional C budget models should be parameterized to reflect the spatial heterogeneity in mean annual precipitation (MAP) that exists across the boreal zone. This is supported by our results, as well as prior correlations between MAP and annual DOC fluxes across ecosystems (Michalzik et al., 2001), and is especially relevant given the large range in MAP that exists across boreal ecoregions (for example, Canada's boreal ecoregions 173–1492 mm; A National Ecological Framework for Canada, 1999). Furthermore, studies examining controls on DOC content in soils at depth focus on delivery of DOC from O to mineral horizons and the subsequent mineral–OM interactions that control soil C sequestration (Clarke et al., 2007; Fröberg et al., 2011; Kalbitz et al., 2004; Rosenqvist et al., 2010). Associated conceptual models assume vertical fluxes of water and DOC (e.g. Kaiser and Kalbitz, 2012). Vertically dominated O to mineral horizon DOC fluxes may occur in some boreal systems, and they may be relevant at larger spatial scales in low-relief landscapes. In our moss-mantled hillslopes, however, event-specific lateral flow was likely important in over half of the measurements made as water collected by lysimeters located at the base of the O horizon exceeded total precipitation or snowmelt over the lysimeter footprint on 17 of 30 collection dates in the forest plots and on 18 of 30 in the harvested plots. Although passive lysimeters do potentially disrupt natural soil hydrological conditions, the soil hydraulic properties of the O horizons (Table 4), combined with continuous field measurements of O horizon soil moisture, indicate that these lysimeters captured a combination of vertical and lateral flow during many precipitation events. Water fluxes measured exceeded the total precipitation or snowmelt over the lysimeter footprint only when matric saturation of the O horizon had been reached and macropore flow was initiated (Fig. 5). At soil moisture contents above matric saturation, capillary forces are ineffective and water flows uninhibited through the macropores of O horizons, flowing downslope at the base of the O horizon due to the lower hydraulic conductivity of the underlying mineral horizons. This phenomena likely drove the pipe throughflow observed at the O–mineral-horizon interface in a boreal forest hillslope during snowmelt, resulting in the delivery of highly acidic surface soil water to lakes (Roberge and Plamondon, 1987). Lateral transport of water and solutes as facilitated by macropore flow is recognized as a potentially important feature controlling landscape transport of solutes in forest hillslope and stream catchment studies (Kaiser and Guggenberger, 2005; van Verseveld et al., 2008; Terajima and Moriizumi, 2013; Laine-Kaulio et al., 2014). While modelling of water and solute transport continues to evolve and incorporate macropore flow (Beven and German, 1982, 2013), models are limited to modelling of mineral soil and do not explicitly define porous O horizons that are typically an important source of DOC in boreal forest landscapes. We advise that direct measurement and incorporation of the specific hydrologic role of O horizons is essential because they represent both a hydrologically unique layer and a hotspot for DOC mobilization. This will improve estimates of DOC mobilization and redistribution dynamics at the landscape scale.
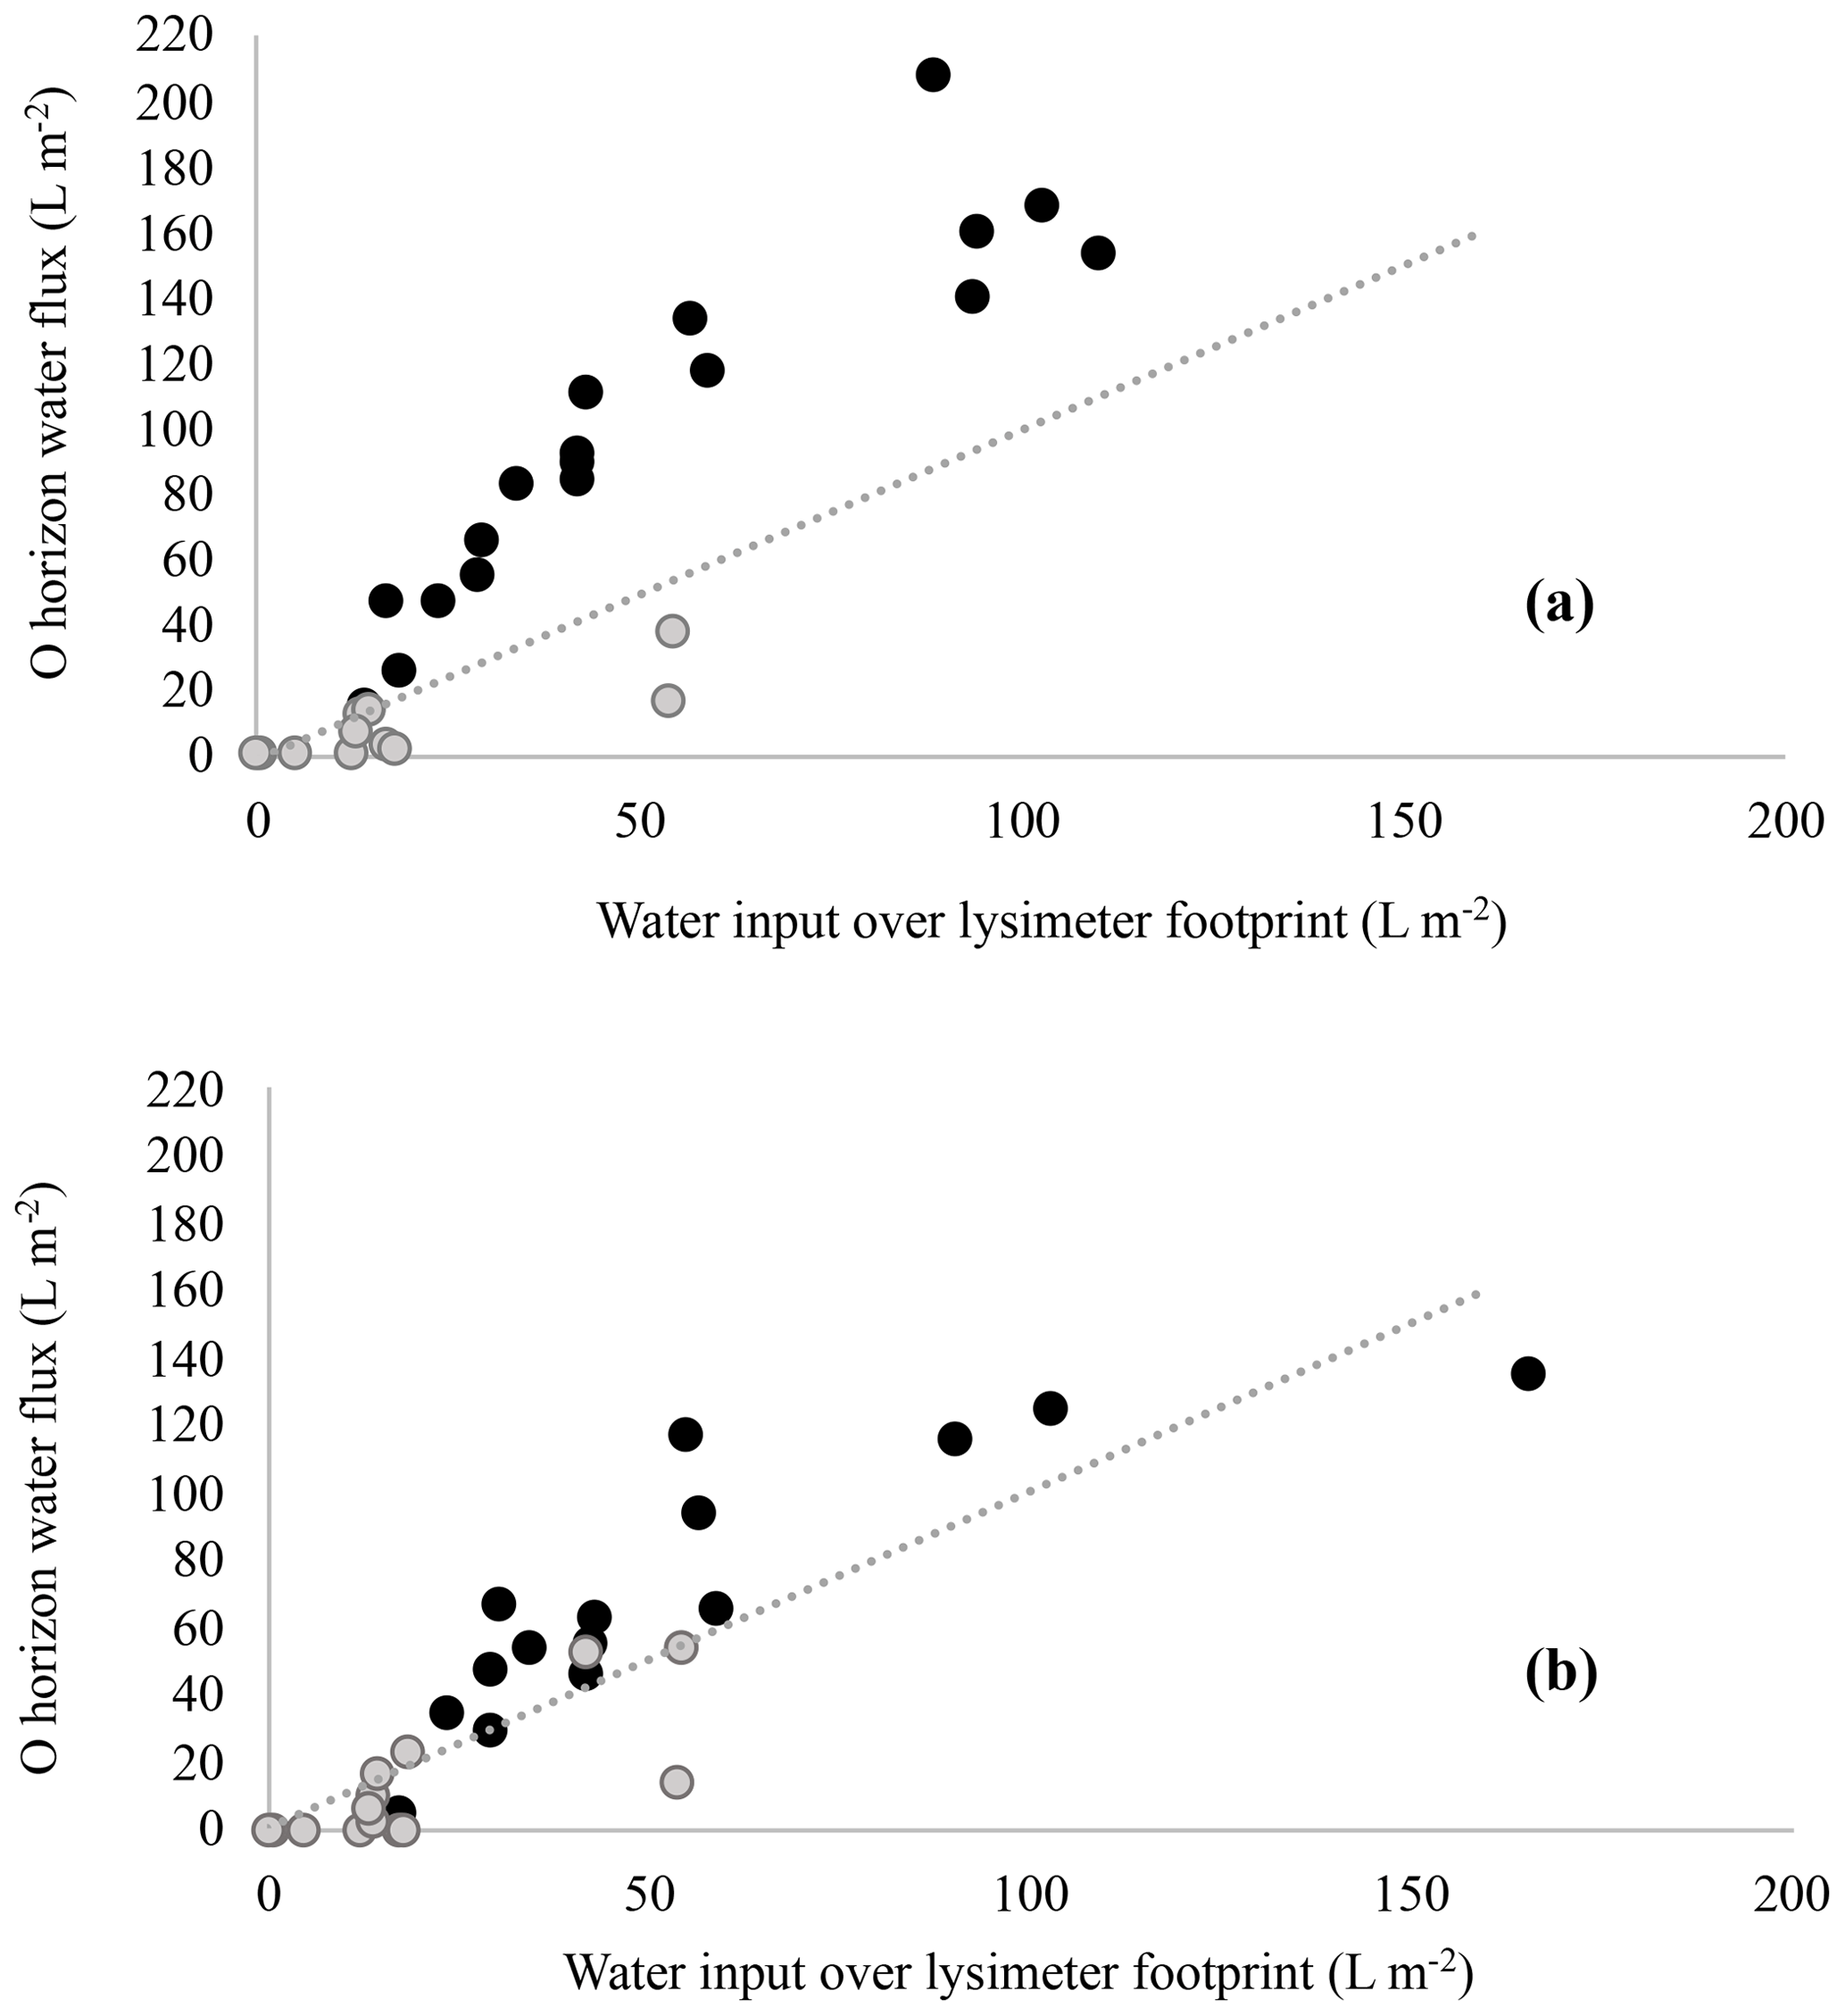
Figure 5Lysimeter-captured water fluxes versus water input over the lysimeter footprint in harvested (a) and forest (b) plots. Lysimeter collections made during periods when volumetric soil water content remained below soil matrix saturation (grey circles) contrast with lysimeter collections made during periods when soil matrix saturation was reached (black circles). Matrix saturation in harvested and forest plots was determined by infiltration experiments and complemented by soil evaporation measurements (see Table 4).
4.2 DOC flux and water flux relationship varies with seasonal environmental change and suggests an interactive temperature control
Despite the control of water input rate on DOC fluxes, the relationship between DOC flux and water flux varied at the seasonal scale (Fig. 4; Table 3). Soils of both plot types appeared to be flushed of DOC during periods of high, continual leaching and low temperatures (Fig. 2), suggesting that the seasonally variable production of DOC and/or water-soluble organic carbon (WSOC) is an important secondary control. Some field studies have shown that soil DOC concentrations remain constant and do not become more dilute with increasing soil water fluxes, suggesting that the pool of WSOC is not easily exhausted in those systems (Kalbitz et al., 2007; Klotzbücher et al., 2014). This leads to proportional increases in DOC flux with increasing water flux and, therefore, a water limitation on DOC mobilization. While summer (Fig. 4a), and likely winter, DOC fluxes in this study were similarly water-limited, autumn and spring snowmelt fluxes exhibited a tapering off of DOC fluxes during periods of highest water input (Fig. 4b, c), suggesting a production limitation during autumn and snowmelt.
DOC flux was calculated as the product of DOC concentration and solution volume for each measurement period; therefore, the highest periods of DOC flux occur when conditions support relatively high values of both terms. This occurred most frequently during late summer/early autumn and ecologically requires the combination of (1) the production of water-soluble organic carbon or DOC via temperature-sensitive mechanisms such as soil organic matter (SOM) and/or litter decomposition rhizodeposition, and microbial biomass turnover (Christ and David, 1996; Kalbitz et al., 2007; Weintraub et al., 2007); and (2) sufficient water inputs to result in a soil water flux that mobilizes or extracts DOC from O horizons. Soil water fluxes were negatively correlated with soil temperature in this study (Table 3a), likely driven by the seasonal temperature dependence of net water input and evapotranspiration, while DOC concentration was positively correlated with soil temperature. Therefore, the seasonality of DOC flux involves an interactive temperature effect, where temperature-dependent biogeochemical processes and temperature-dependent soil water fluxes interact to form seasonally unique combinations or scenarios important to a predictive understanding of these fluxes.
4.2.1 Water-limited scenarios: summer and winter
Fluxes of water and DOC were dynamic on the weekly to monthly scale during all seasons except winter (Fig. 2e, f), revealing that flux conditions can occur at all times of the year in these sites, except during periods of deep, consistent snowpack, which limits water input to the soil and, consequently, DOC mobilization. Summer also exhibited a water limitation on DOC mobilization but on a shorter timescale, alternating between weekly periods of no water and DOC flux and periods of large water and DOC fluxes. While we detected no relationship between DOC flux and soil moisture using the whole dataset (Table 3b), antecedent soil moisture can affect the proportion of the water input that results in a water and DOC flux in the summer when soil drying–rewetting cycles were common (Fig. 2; grey shaded bars), although this does not appear to be a driving factor throughout the year in these plots. In summer, when CO2 efflux rates were high but DOC fluxes were intermittent, CO2 was, in part, a larger loss of soil C because insufficient water input limited mobilization of DOC from O horizons. Without mobilization, DOC is more readily lost via respiration (Moore et al., 2008). In early autumn, however, the elevated water flux, cooler temperatures, and decreasing CO2 efflux rates favour an increasing proportion of the SOC pool being mobilized as DOC and lost to downstream C pools either in mineral soil or further to groundwater and headwaters.
4.2.2 DOC-production-limited scenarios: autumn and snowmelt
With continuous leaching and decreasing soil temperatures, late autumn water inputs resulted in a decrease in DOC concentrations and DOC fluxes, such that soils appear to be flushed of the WSOC or DOC pool just prior to snowpack development. Thus, the availability of the extractable DOC pool in these soils during the snowpack and subsequent snowmelt period was likely much reduced by high autumn water input at low soil temperatures. Spring snowmelt captured during this study year followed a winter of constant snow cover and contributed approximately 31 % of the annual water input to the soil, and 20 % of the annual DOC flux, but occurred over a period that represented only 13 % of the year. Despite representing the largest hydrological event during this study year, the large water flux over a short time period, combined with relatively low soil temperatures and previously flushed soils, resulted in dilute leachate (low DOC concentration) and a smaller contribution to the annual DOC flux in relation to early autumn fluxes.
4.3 Climate change impacts on soil conditions and precipitation patterns will affect DOC fluxes
This study shows that DOC flux variation is well described by water flux variation but that gradual flushing of O horizons occurs during consistent leaching events throughout autumn as soil temperatures decrease. These seasonal trends suggest that the projected increases in precipitation at mid- to high latitudes in the Northern Hemisphere (Kirtman et al., 2013) can result in proportional increases in DOC fluxes in the summer and early autumn when soil temperatures are warm but that DOC or water-soluble organic carbon pools are depleted during seasonal decreases in soil temperature. In order for increasing water fluxes to result in increased losses of DOC, they must therefore be met with increased production of DOC/WSOC – a process dependent on how increases in precipitation are seasonally distributed. Two potential mechanisms of increased WSOC production that are linked to reductions in snowpack are the increased occurrence of winter rainfall and soil frost. No soil freezing occurred under the consistently deep snowpack conditions observed during winter in this study. With warm winter conditions expected to become more frequent in northern regions, melting and reforming of the snowpack over winter will have consequences for soil exposure and frost, as well as the frequency and magnitude of wintertime water flux events. Similar to soil drying–rewetting events (Fierer and Schimel, 2002), soil freeze–thaw cycles have been shown to increase soil DOC concentrations by disturbing soil, root, and microbial structures (Haei et al., 2013; Schimel and Clein, 1996). Increased winter rainfall and midwinter snowmelt events that drive larger winter soil water fluxes, in combination with soil freeze–thaw events that increase production of WSOC, can therefore contribute to future increases in wintertime mobilization of DOC. Changing snowpack dynamics is therefore one possible mechanism of increasing river DOC export trends in northern temperate watersheds that are specifically attributed to increases in wintertime DOC exports (Huntington et al., 2016). These results suggest that the effect of climate change on boreal forest DOC fluxes will depend on the redistribution of seasonal precipitation and changes to precipitation form. In addition, this study highlights that defining macropore-driven lateral water flow dynamics, particularly at the O-to-mineral-horizon interface, can help define the role of DOC at the landscape scale.
All data are included in the paper tables and the Supplement.
The supplement related to this article is available online at: https://doi.org/10.5194/bg-17-581-2020-supplement.
KAE and SEZ designed the study with input from KLB. KLB and KAE designed the lysimeters and planned their installation as well as the installation of all environmental monitoring equipment. KLB collected and analyzed the lysimeter, environmental monitoring, and soil properties data. XZ contributed the soil respiration data and analysis. KP contributed soil hydrology data and interpretations. KB prepared the paper, with editing from SEZ and KAE and further contributions on final drafts from XZ and KP.
The authors declare that they have no conflict of interest.
Special thanks for field assistance provided by individuals at the Atlantic Forestry Centre (Corner Brook) of Natural Resources Canada: Andrea Skinner, Darrell Harris, and Gordon Butt; and Memorial University, Grenfell campus: Sarah Thompson and Danny Pink, as well for laboratory assistance provided by Jamie Warren at Memorial University, St. John's campus. The throughfall carbon inputs were estimated based on collections made and analyzed by Alex Newman in 2015.
This research has been supported by the Centre for Forest Science and Innovation (Agrifoods and Forestry, Government of Newfoundland and Labrador), the Natural Sciences and Engineering Research Council (NSERC) Strategic Partnerships Grants (grant no. 479224-15), and the Canada Research Chairs Program.
This paper was edited by Frank Hagedorn and reviewed by L. Thieme and two anonymous referees.
A National Ecological Framework for Canada: Attribute Data, edited by: Marshall, I. B., Schut, P. H., and Ballard, M., Agriculture and Agri-Food Canada, Research Branch, Centre for Land and Biological Resources Research, and Environment Canada, State of the Environment Directorate, Ecozone Analysis Branch, Ottawa/Hull, 1999.
Beven, K. and Germann, P.: Macropores and water flow in soils, Water Resour. Res., 18, 1311–1325, https://doi.org/10.1029/WR018i005p01311, 1982.
Beven, K. and Germann, P.: Macropores and water flow in soils revisited, Water Resour. Res., 46, 3071–3092, 2013.
Bona, K. A., Shaw, C. H., Fyles, J. W., and Kurz, W. H.: Modelling moss-derived carbon in upland black sprcue forests, Can. J. Forest Res., 46, 520–534, 2016.
Bonan, G. B. and Shugart, H. H.: Environmental Factors and Ecological Processes in Boreal Forsts, Annu. Rev. Ecol. Syst., 20, 1–28, 1989.
Brakensiek, D. L. and Rawls, W. J.: Soil containing rock fragments: effects on infiltration, Catena, 23, 99–110, https://doi.org/10.1016/0341-8162(94)90056-6, 1994.
Chapin III, F. S, Woodwell, G. M., Randerson, J. T., Rastetter, E. B., Lovett, G. M., Baldocchi, D. D., Clark, D. A., Harmon, M. E., Schimel, D. S., Valentini, R., Wirth, C., Aber, J. D., Cole, J. J., Goulden, M. L., Harden, J. W., Heimann, M. R., Howarth, W., Matson, P. A.,McGuire, A. D., Melillo, J. M., Mooney, H. A., Neff, J. C., Houghton, R. A., Pace, M. L., Ryan, M. G., Running, S. W., Sala, O. E., Schlesinger, W. H., and Schulze, E. D.: Reconciling carbon-cycle concepts, terminology, and methods, Ecosystems, 9, 1041–1050, https://doi.org/10.1007/s10021-005-0105-7, 2006.
Christ, M. J. and David, M. B.: Temperature and moisture effects on the production of dissolved organic carbon in a Spodosol, Soil Biol. Biochem., 28, 1191–1199, https://doi.org/10.1016/0038-0717(96)00120-4, 1996.
Clarke, N., Wu, Y., and Strand, L. T.: Dissolved organic carbon concentrations in four Norway spruce stands of different ages, Plant Soil, 299, 275–285, https://doi.org/10.1007/s11104-007-9384-4, 2007.
Creed, I. F., Trick, C. G., Band, L. E., and Morrison, I. K.: Characterizing the Spatial Pattern of Soil Carbon and Nitrogen Pools in the Turkey Lakes Watershed?, Water Air Soil Pollut., 2, 81–102, https://doi.org/10.1023/A:1015886308016, 2002.
De Troyer, I., Merckx, R., Amery, F., and Smolders, E.: Factors Controlling the Dissolved Organic Matter Concentration in Pore Waters of Agricultural Soils, Vadose Zone J., 13, 1–9, https://doi.org/10.2136/vzj2013.09.0167, 2014.
Fierer, N. and Schimel, J. P.: Effects of drying-rewetting frequency on soil carbon and nitrogen transformations, Soil Biol. Biochem., 34, 777–787, https://doi.org/10.1016/S0038-0717(02)00007-X, 2002.
Finlay, J., Neff, J., Zimov, S., Davydova, A., and Davydov, S.: Snowmelt dominance of dissolved organic carbon in high-latitute watersheds: Implications for characterization and flux of river DOC, Geophys. Res. Lett., 33, 2–6, https://doi.org/10.1029/2006GL025754, 2006.
Fröberg, M., Berggren, D., Bergkvist, B., Bryant, C., and Mulder, J.: Concentration and fluxes of dissolved organic carbon (DOC) in three Norway spruce stands along a climatic gradient in Sweden, Biogeochemistry, 77, 1–23, https://doi.org/10.1007/s10533-004-0564-5, 2006.
Fröberg, M., Hansson, K., Kleja, D. B., and Alavi, G.: Dissolved organic carbon and nitrogen leaching from Scots pine, Norway spruce and silver birch stands in southern Sweden, Forest Ecol. Manag., 262, 1742–1747, https://doi.org/10.1016/j.foreco.2011.07.033, 2011.
Gielen, B., Neirynck, J., Luyssaert, S., and Janssens, I. A.: The importance of dissolved organic carbon fluxes for the carbon balance of a temperate Scots pine forest, Agr. Forest Meteorol., 151, 270–278, https://doi.org/10.1016/j.agrformet.2010.10.012, 2011.
Haei, M., Öquist, M. G., Buffam, I., Ågren, A., Blomkvist, P., Bishop, K., Lofvenius, M. O., and Laudon, H.: Cold winter soils enhance dissolved organic carbon concentrations in soil and stream water, Geophys. Res. Lett., 37, 1–5, https://doi.org/10.1029/2010GL042821, 2010.
Haei, M., Öquist, M. G., Kreyling, J., Ilstedt, U., and Laudon, H.: Winter climate controls soil carbon dynamics during summer in boreal forests, Environ. Res. Lett., 8, 1–9, https://doi.org/10.1088/1748-9326/8/2/024017, 2013.
Huntington, T.G., William, M.B., Aiken, G.R., Sheffield, J., Luo, L., Roesler, C. S., and Camill, P.: Climate change and dissolved organic carbon export t the Gulf of Maine, J. Geophys. Res.-Biogeo., 121, 2700–2716, https://doi.org/10.1002/2015JG003314, 2016
James, J. and Harrison, R.: The effect of harvest on forest soil carbon: a meta-analysis, Forests, 7, 1–22, https://doi.org/10.3390/f7120308, 2016.
Kaiser, K. and Guggenberger, G.: Storm flow flushing in a structured soil changes the composition of dissolved organic matter leached into the subsoil, Geoderma, 127, 177–187, https://doi.org/10.1016/j.geoderma.2004.12.009, 2005.
Kaiser, K. and Kalbitz, K.: Cycling downwards – dissolved organic matter in soils, Soil Biol. Biochem., 52, 29–32, https://doi.org/10.1016/j.soilbio.2012.04.002, 2012.
Kalbitz, K., Glaser, B., and Bol, R.: Clear-cutting of a Norway spruce stand: Implications for controls on the dynamics of dissolved organic matter in the forest floor, Eur. J. Soil Sci., 55, 401–413, https://doi.org/10.1111/j.1351-0754.2004.00609.x, 2004.
Kalbitz, K., Meyer, A., Yang, R., and Gerstberger, P.: Response of dissolved organic matter in the forest floor to long-term manipulation of litter and throughfall inputs, Biogeochemestry, 86, 301–318, 2007.
Kalbitz, K., Solinger, P., Park, J., Michalzik, B., and Matzner, E.: Controls on the dynamics of dissolved organic matter, Soil Sci., A review, 165, 277–304, 2000.
Kirtman, B., Power, S. B., Adedoyin, J. A., Boer, G. J., Bojariu, R., Camilloni, I., Doblas-Reyes, F. J., Fiore, A. M., Kimoto, M., Meehl, G. A., Prather, M., Sarr, A., Schär, C., Sutton, R., van Oldenborgh, G. J., Vecchi, G., and Wang, H. J.: Near-term Climate Change: Projections and Predictability, in: Climate Change 2013: The Physical Science Basis. Contribution of Working Group I to the Fifth Assessment Report of the Intergovernmental Panel on Climate Change, edited by: Stocker, T. F., Qin, D., Plattner, G.-K., Tignor, M., Allen, S. K., Boschung, J., Nauels, A., Xia, Y., Bex, V., and Midgley, P. M., Cambridge University Press, Cambridge, United Kingdom and New York, NY, USA, 953–1028, 2013.
Kleja, D. B., Svensson, M., Majdi, H., Jansson, P.-E., Langvail, O., Bergkvist, B., Johannson, M.-B., Weslien, P., Truss, L., Lindroth, A., and Agren, G. I.: Pools and Fluxes of Carbon, in Three Norway Spruce Ecosystems along a Climatic Gradient in Sweden, Biogeochemistry, 89, 7–27, 2008.
Klotzbücher, T., Kaiser, K., and Kalbitz, K.: Response of Dissolved Organic Matter in the Forest Floor of a Temperate Spruce Stand to Increasing Throughfall, Vadose Zone J., 13, 1–5, https://doi.org/10.2136/vzj2013.10.0180, 2014.
Kreutzweiser, D. P., Hazlett, P. W., and Gunn, J. M.: Logging impacts on the biogeochemistyr of boreal forest soils and nutrient export to aquatic systems: A review, Environ. Rev., 16, 157–179, https://doi.org/10.1139/A08-006, 2008.
Kurz, W. A., Shaw, C. H., Boisvenue, C., Stinson, G., Metsaranta, J., Leckie, D., Dyck, A., Smyth, C., and Neilson, E. T.: Carbon in Canada's boreal forest – A synthesis, Environ. Rev., 21, 260–292, https://doi.org/10.1139/er-2013-0041, 2013.
Laine-Kaulio, H., Backnas, S., Karvenen, T., Kuivosalo, H., and McDonnell, J. J: Lateral subsurface stormflow and solute transport in a forested hillslope: A combined measurement and modeling approach, Water Resour. Res., 50, 8159–8178, https://doi.org/10.1002/ 2014WR015381, 2014.
Laudon, H., Berggren, M., Ågren, A., Buffam, I., Bishop, K., Grabs, T., Jannson, M., and Köhler, S.: Patterns and Dynamics of Dissolved Organic Carbon (DOC) in Boreal Streams: The Role of Processes, Connectivity, and Scaling, Ecosystems, 14, 880–893, https://doi.org/10.1007/s10021-011-9452-8, 2011.
Ledesma, J. L. J., Futter, M. N., Blackburn, M., Lidman, F., Grabs, T., Sponseller, R. A., Laudon, H., Bishop, K., and Köhler, S. J.: Towards an Improved Conceptualization of Riparian Zones in Boreal Forest Headwaters, Ecosystems, 21, 297–315, https://doi.org/10.1007/s10021-017-0149-5, 2017.
Luyssaert, S., Inglima, I., Jungs, M., Richardson, D., and Reichstein, M.: CO2 balance of boreal, temperate, and tropical forests derived from a global databse, Glob. Change Biol., 13, 2509–2537, https://doi.org/10.1111/j.1365-2486.2007.01439.x CO2, 2007.
Marín-Spiotta, E., Gruley, K. E., Crawford, J., Atkinson, E. E., Miesel, J. R., Greene, S., Cardona-Correa, C., and Spencer, R. G. M.: Paradigm shifts in soil organic matter research affect interpretations of aquatic carbon cycling: Transcending disciplinary and ecosystem boundaries, Biogeochemistry, 117, 279–297, https://doi.org/10.1007/s10533-013-9949-7, 2014.
McDowell, W. H. and Wood, T.: Podzolization: Soil processes control dissolved organic carbon concentrations in stream water, Soil Sci., 137, 23–32, 1984.
McGlynn, B. L. and McDonnell, J. J.: Role of discrete landscape units in controlling catchment dissolved organic carbon dynamics, Water Resour. Res., 39, 1–18, https://doi.org/10.1029/2002WR001525, 2003.
Michalzik, B., Kalbitz, K., Park, J., Solinger, S., and Matzner, E.: Fluxes and concentrations of dissolved organic carbon and nitrogen – a synthesis for temperate forests, Biogeochemistry, 52, 173–205, https://doi.org/10.1023/a:1006441620810, 2001.
Moore, T. R., Paré, D., and Boutin, R.: Production of dissolved organic carbon in Canadian forest soils, Ecosystems, 11, 740–751, https://doi.org/10.1007/s10021-008-9156-x, 2008.
Moroni, M. T., Carter, P. Q., and Ryan, D. A. J.: Harvesting and slash piling affect soil respiration, soil temperature, and soil moisture regimes in Newfoundland boreal forests, Can. J. Soil Sci., 89, 345–355, 2009.
Neary, D. G.: Long-term forest paired catchment studies: What do they tell us that landscape-level monitoring does not?, Forests, 7, 1–15, https://doi.org/10.3390/f7080164, 2016.
Neff, J. C. and Asner, G. P.: Dissolved organic carbon in terrestrial ecosystems: Synthesis and a model, Ecosystems, 4, 29–48, https://doi.org/10.1007/s100210000058, 2001.
Pan, Y., Birdsey, R. A., Fang, J., Houghton, Ri., Kauppi, P. E., Kurz, W. A., Phillips, O. L., Shvidenko, A., Lewis, S. L., Canadell, J. G., Ciais, P., Jackson, R. B., Pacala, S. W., McGuire, A. D., Piao, S., Rautiainen, A., Sitch, S., and Hayes, D.: A Large and Persistent Carbon Sink in the World's Forests, Science, 333, 988–993, 2011.
Peichl, M., Moore, T. R., Arain, M. A., Dalva, M., Brodkey, D., and McLaren, J.: Concentrations and fluxes of dissolved organic carbon in an age-sequence of white pine forests in Southern Ontario, Canada, Biogeochemistry, 86, 1–17, https://doi.org/10.1007/s10533-007-9138-7, 2007.
Piirainen, S., Finer, L., Mannerkoski, H., and Starr, M.: Effects of frest clear-cutting on the carbon and nitrogen fluxes through podzolic soil horizons, Plant Soil, 249, 301–311, https://doi.org/10.1023/A:1015031718162, 2002.
Preston, C. M., Bhatti, J. S., Flanagan, L. B., and Norris, C.: Stocks, chemistry, and sensitivity to climate change of dead organic matter along the Canadian boreal forest transect case study, Climatic Change, 74, 233–251, https://doi.org/10.1007/s10584-006-0466-8, 2006.
Radulovich, R. and Sollins, P.: Improved Performance of Zero-Tension Lysimeters, Soil Sci. Soc. Am. J., 51, 1386–1388, 1987.
Raymond, P. A. and Saiers, J. E.: Event controlled DOC export from forested watersheds, Biogeochemistry, 100, 197–209, https://doi.org/10.1007/s10533-010-9416-7, 2010.
Roberge, J. and Plamondon, A. P.: Snowmelt runoff in a boreal forest hillslope, the role of pipe throughflow, J. Hydrometeorol., 95, 39–54, 1987.
Rosenqvist, L., Kleja, D. B., and Johansson, M. B.: Concentrations and fluxes of dissolved organic carbon and nitrogen in a Picea abies chronosequence on former arable land in Sweden, Forest Ecol. Manag., 259, 275–285, https://doi.org/10.1016/j.foreco.2009.10.013, 2010.
Schindler, U. and Muller, L.: Simplifying the evaporation method for quantifying soil hydraulic properties, J. Plant Nutr. Soil Sci., 169, 623–629, https://doi.org/10.1002/jpln.200521895, 2010.
Schindler, U., Durner, W., von Unold, G., and Muller, L.: Evaporation method for measuring unsaturated hydraulic properties of soils: Extending the measurement range, Soil Sci. Soc. Am. J., 74, 1071–1083, https://doi.org/10.2136/sssaj2008.0358, 2010.
Schelker, J., Grabs, T., Bishop, K., and Laudon, H.: Drivers of increased organic carbon concentrations in stream water following forest disturbance: Separating effects of changes in flow pathways and soil warming, J. Geophys. Res.-Biogeo., 118, 1814–1827, https://doi.org/10.1002/2013JG002309, 2013.
Schimel, J. P. and Clein, J. S.: Microbial response to freeze-thaw cycles in tundra and taiga soils, Soil Biol. Biochem., 28, 1061–1066, https://doi.org/10.1016/0038-0717(96)00083-1, 1996.
Sturm, M., Taras, B., Liston, G. E., Derksen, C., Jona, T., and Lea, J.: Estimation snow water equivalent using snow depth data and climate classes, J. Hydrometeorol., 11, 1380–1394, https://doi.org/10.1175/2010JHM1202.1, 2010.
Terajima, T. and Moriizumi, M.: Temporal and spatial changes in dissolved organic carbon concentration and fluorescence intensity of fulvic acid like materials in mountainous headwater catchments, J. Hydrol., 479, 1–12, https://doi.org/10.1016/j.jhydrol.2012.10.023, 2013.
Titus, B. D., Kingston, D. G. O., Pitt, C. M., and Mahendrapp, M. K.: A lysimeter system for monitoring soil solution chemistry, Can. J. Soil Sci., 80, 219–226, 1999.
van Cleve, K., Dyrness, C. T., Viereck, L. A., Fox, J., Chapin, F. S., and Oechel, W.: Taiga Ecosystems in Interior Alaska, Bioscience, 33, 39–44, https://doi.org/10.2307/1309243, 1983.
van Verseveld, W., McDonnell, J. J., and Lajtha, K.: T A mechanistic assessment of nutrient flushingat the catchment scale, J. Hydrometeorol., 80, 268–287, https://doi.org/10.1016/j.jhydrol.2008.06.009, 2008.
Webb, J. R., Santos, R. S., Maher, D. T., and Finaly, K.: The importance of aquatic carbon fluxes in net ecosystem carbon budgets: a catchment-scale review, Ecosystems, 22, 508–527, 2019
Weintraub, M. N., Scott-Denton, L. E., Schmidt, S. K., and Monson, R. K.: The effects of tree rizodeposition on soil exoenzyme activity, dissolved organic carbon, and nutrient availability in a subalpine forest ecosystem, Oecologia, 154, 327–338, 2007.
Wickland, K. P., Neff, J. C., and Aiken, G. R.: Dissolved organic carbon in Alaskan boreal forest: Sources, chemical characteristics, and biodegradability, Ecosystems, 10, 1323–1340, https://doi.org/10.1007/s10021-007-9101-4, 2007.
Ziegler, S. E., Benner, R., Billings, S. A., Edwards, K. A., Philben, M., Zhu, X., and Laganière, J.: Climate Warming Can Accelerate Carbon Fluxes without Changing Soil Carbon Stocks, Front. Earth Sci., 5, 1–12, https://doi.org/10.3389/feart.2017.00002, 2017.