the Creative Commons Attribution 4.0 License.
the Creative Commons Attribution 4.0 License.
 | 24 Feb 2021
Technical note: Interpreting pH changes
Andrea J. Fassbender
James C. Orr
Andrew G. Dickson
The number and quality of ocean pH measurements have increased substantially over the past few decades such that trends, variability, and spatial patterns of change are now being evaluated. However, comparing pH changes across domains with different initial pH values can be misleading because a pH change reflects a relative change in the hydrogen ion concentration ([H+], expressed in mol kg−1) rather than an absolute change in [H+]. We recommend that [H+] be used in addition to pH when describing such changes and provide three examples illustrating why.
- Article
(2339 KB) - Full-text XML
-
Supplement
(1400 KB) - BibTeX
- EndNote


In 1909, Danish biochemist Søren Peter Lauritz Sørensen proposed using a logarithmic scale to display the wide range of natural hydrogen ion concentrations (CH, expressed in mol L−1) in a more compact numerical form (Sørensen, 1909).
The logarithmic scaling of hydrogen ion concentration derives from the Nernst equation, which relates the potential of an electrochemical cell to ion concentrations in solution, while the reciprocal form ensured predominantly positive values for pH in an aqueous solution (aq; Sørensen, 1909). This definition was later amended to explicitly use the hydrogen ion activity (aH) in aqueous solution (rather than the concentration) so as to take account of interionic forces when treating electromotive force data (Sørensen and Linderstrøm-Lang, 1924). This is the basis of the modern definition of pH (Buck et al., 2002):
Here, γH is the activity coefficient of H+ (aq) at molality mH, and m∘ (1 mol (kg H2O)−1) is the standard molality. The negative logarithm was adopted by Sørensen and Linderstrøm-Lang as a simpler way to express the original reciprocal. Summaries of modern pH scale development and refinement can be found elsewhere (Spitzer and Pratt, 2011). Still, since its inception, concerns have been raised about the inverse and logarithmic relationship between hydrogen ion concentration and pH being nonintuitive (see Clark, 1922, especially p. 34) and the resulting increased likelihood of misinterpreted results. This prompted scientists to argue for alternatives to the pH scale, such as using specific acidity (107 minus the [H+]) and its base 10 logarithm (i.e., 7− pH) Clark et al., 1921; Wherry, 1919; Wherry and Adams, 1921). However, such efforts were unsuccessful, and the Sørensen and Linderstrøm-Lang (1924) notional definition of pH, used early on as the basis for a conventional definition of pH and to assign values to pH standards (Bates and Guggenheim, 1960; Cohen et al., 2007; Covington et al., 1985; Hamer and Acree, 1939; McGlashan, 1970), was ultimately adopted by the International Union of Pure and Applied Chemistry in 2002, thus defining pH explicitly through Eq. (2) (Baucke, 2002; Buck et al., 2002; Cohen et al., 2007).
Within the field of marine science, several scales, all going under the name pH, have been commonly applied. These include one scale based on an operational approach that relies on calibration standards from the National Bureau of Standards (NBS; now the National Institute of Standards and Technology) and a variety of other scales whose approaches all aim to realize pH as a “concentration” of hydrogen ions, usually expressed in moles per kilogram (mol kg−1) (Bates, 1982; Dickson, 1984; Dickson et al., 2016; Marion et al., 2011; Waters and Millero, 2013). Such approaches were developed to simplify the use of acid–base equilibrium calculations in seawater media. The pH values presented here are on the total hydrogen ion scale, the scale that is presently favored for measurement and reporting in observational oceanography (Dickson, 2010); however, the concern we illustrate here applies similarly to all marine science pH scales.
The immediate interest in assessing ocean pH changes is to help understand the consequences of rising atmospheric carbon dioxide (CO2) levels caused primarily by the combustion of fossil fuels which result in a net transfer of CO2 from the atmosphere to the ocean (Friedlingstein et al., 2020). Once dissolved in the ocean, CO2 reacts with water to form a weak acid that loses a hydrogen ion, which is largely neutralized through reaction with a carbonate ion to form bicarbonate, causing the seawater [H+] to increase and the pH to decrease (Millero, 2007). This overall process is commonly referred to as ocean acidification (Caldeira and Wickett, 2003; Doney et al., 2009), and it may have far reaching effects on marine life (Boyd et al., 2016; Doney et al., 2014; Hofmann et al., 2010; Kleypas et al., 2006) and on the rates of a variety of carbon cycle feedback processes within the ocean (e.g., Archer et al., 1998; Boudreau et al., 2018; Passow and Carlson, 2012; Revelle and Suess, 1957). As a result, it has become a priority in oceanography to monitor ocean pH and understand its natural and anthropogenic variations (Brewer, 2013).
Ocean pH is considered an Essential Ocean Variable (GOOS, 2019) and an Essential Climate Variable (GCOS, 2016) because it can be used to characterize ocean chemistry changes associated with anthropogenic carbon invasion and climate change, and it also meets the other desired criteria of measurement feasibility and cost-effectiveness. Distinct rates of persistent pH decline over decades have been observed across the global surface ocean at well-maintained time-series sites (e.g., Bates et al., 2014; Sutton et al., 2014). Repeat hydrographic sections have also made it possible to characterize how ocean acidification is propagating into the ocean interior over decadal timescales (e.g., Dore et al., 2009; Lauvset et al., 2020). Autonomous pH sensors capable of sustained observations have begun to reveal the range and frequency of pH variations in open ocean and coastal waters (see Bushinsky et al., 2019). These observational efforts, in addition to numerical modeling studies (Bopp et al., 2013; Jiang et al., 2019; Kwiatkowski et al., 2020; Orr et al., 2005; Steinacher et al., 2009), inform our understanding of secular changes, patterns, and variability in ocean pH and guide research probing the sensitivities of marine organisms to changes in CO2 system variables.
Since the beginning of the industrial era, it is estimated that ocean acidification has led to a global mean decline of ∼ 0.1 in surface ocean pH (8.2 to 8.1), which corresponds to an [H+] increase of ∼ 1.6 nmol kg−1 (i.e., from 6.3 to 7.9 nmol kg−1). It has not always been realized, however, that changes in pH reflect relative changes in [H+] rather than absolute changes. Most pH fluctuations in the ocean appear small, but for a given pH change (ΔpH), the associated [H+] change (Δ[H+]) varies depending on the initial [H+] concentration. The relationship between these parameters can be derived as follows:
and thus
Here and represent the hydrogen ion concentrations corresponding to pH2 and pH1, respectively. The corresponding change in [H+] (i.e., ) can then be shown to be
Equation (4) shows that changes in pH reflect a relative change in [H+], while Eq. (5) shows that the same pH change can equate to different [H+] changes when implemented at different initial [H+] (or pH) values. For example, Fig. 1 shows that the same pH change results in a 10-fold greater change in [H+] when starting at pH 7.4 instead of pH 8.4 (which will be true of any magnitude of pH change starting at these two values). The same point is made in a different manner by Kwiatkowski and Orr (2018). For studies evaluating trends and variability in pH, it is thus advantageous to also report results in terms of [H+] to make clear how the initial condition, in Eq. (5), influences the magnitude of the perturbation.
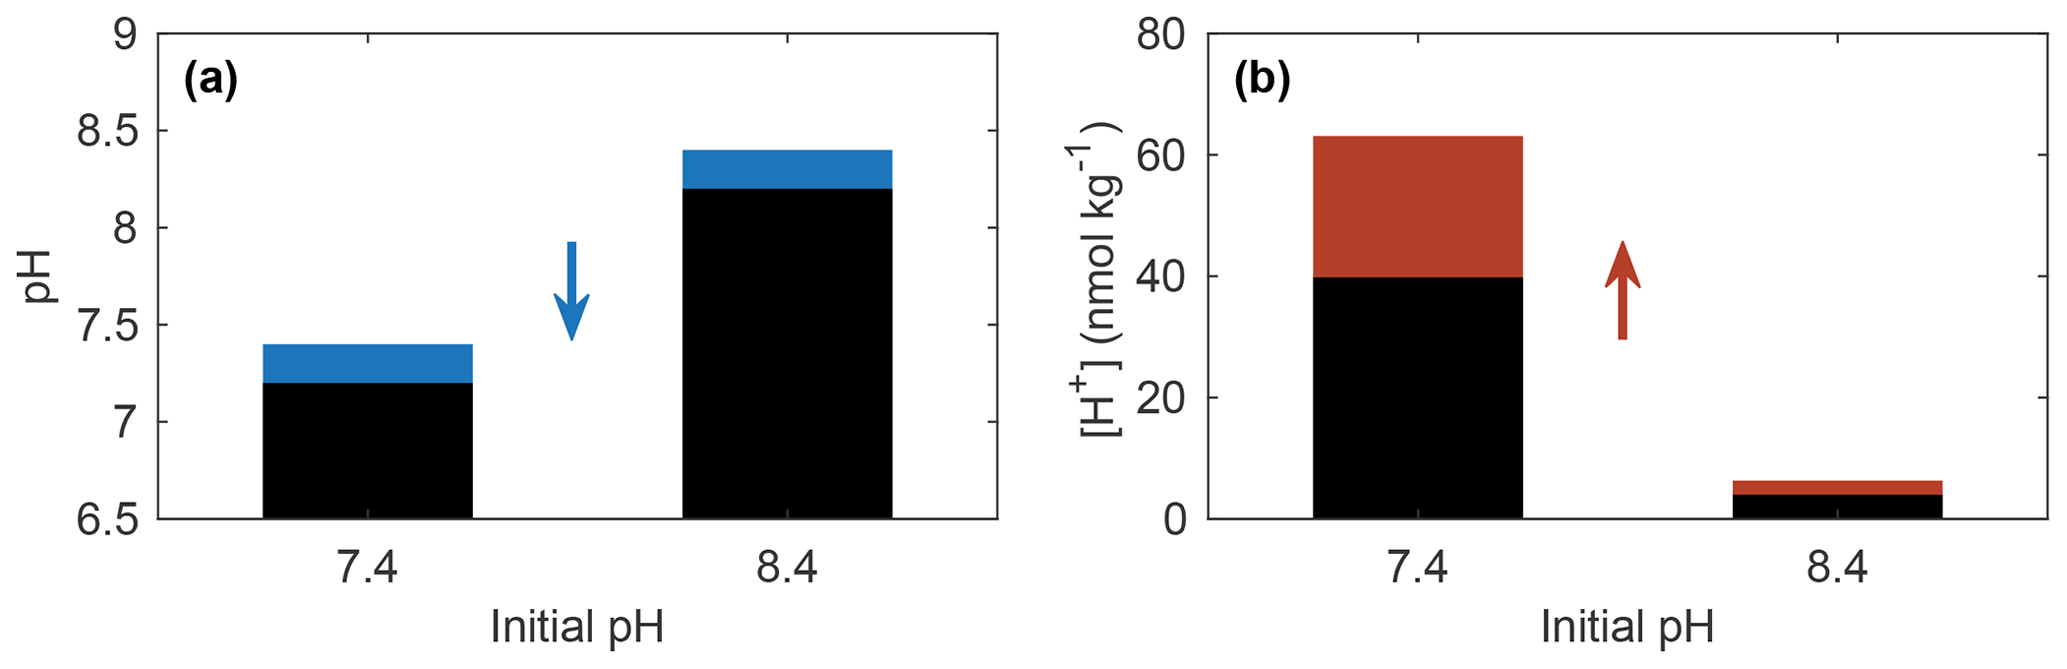
Figure 1(a) A 0.2 unit decrease in pH (blue portion of bars) equates to (b) a 58 % increase in [H+] (red portion of bars) for both initial pH values of 7.4 and 8.4. The absolute change in [H+] depends on the initial conditions.
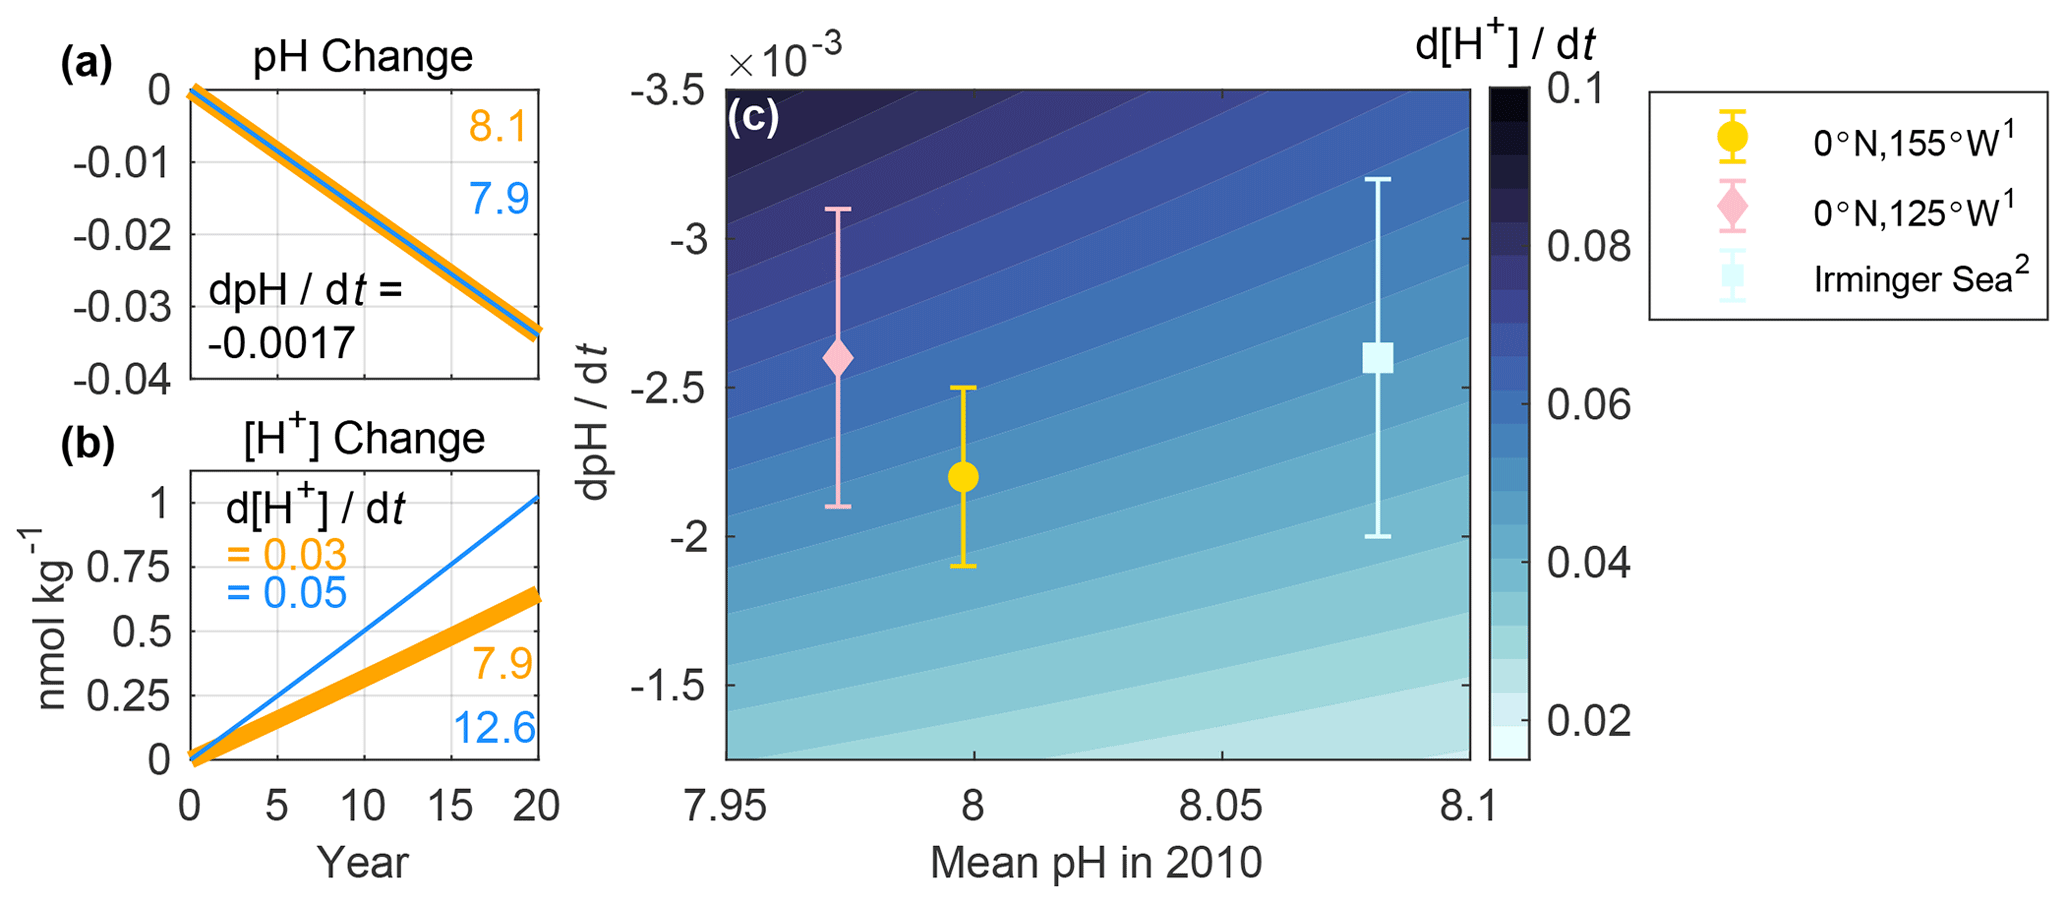
Figure 2Change in sea surface (a) pH and (b) [H+] over 20 years at two hypothetical locations. Changes are plotted relative to the initial pH (8.1 and 7.9) and [H+] (7.9 and 12.6 nmol kg−1) values noted in the figures. A fixed pH trend (dpH dt) of −0.0017 yr−1 was imposed at both sites, resulting in [H+] trends (d[H+] dt) of 0.03 and 0.05 nmol kg−1 yr−1. (c) Contour plot showing linearized trends in [H+] (nmol kg−1 yr−1) associated with mean (or initial) pH values referenced to the year 2010 and the corresponding pH trends. The y axis is reversed so that larger magnitude pH trends are near the top left corner. Symbols show observed surface ocean pH trends and uncertainties (at in situ temperature) at select time-series sites, in which legend superscripts refer to (1) Sutton et al. (2014) and (2) Bates et al. (2014). A total of 13 additional sites are included in Fig. S1. Details regarding the determination of mean pH values referenced to the year 2010 are described in Text S1, and the values are presented in Table S1. The color map for this figure, and for all subsequent figures, was made using cmocean (Thyng et al., 2016).
In the discussion, we provide three real-world examples that illustrate why reporting [H+] alongside pH can improve the clarity of studies that aim to evaluate changes in ocean chemistry. These examples include an evaluation of (1) modern sea surface trends, (2) the evolution of seasonal cycle amplitudes over the 21st century, and (3) changing interior ocean chemistry.
The first opportunity to improve clarity concerns the comparison of pH changes between regions. Observed trends in open ocean surface pH typically fall between −0.001 and −0.003 yr−1 (Lauvset et al., 2015; Takahashi et al., 2014). A critical piece of information that is often missing when such trends are compared (e.g., Table 3.2 of Rhein et al., 2013) is the initial pH value for each region. That information is key because regions with the same pH trend but different initial pH values will exhibit different [H+] trends over time (e.g., Fassbender et al., 2017). For example, Fig. 2a–b illustrate a scenario in which two locations each experience a pH trend of −0.0017 yr−1 (similar to that of the subtropics; Bates et al., 2014) but have different initial pH values: 7.9 and 8.1. As a result, there is a 58 % greater change in [H+] for the first relative to the second location. That is, when the change in pH is identical, the ratio between the two trends in [H+] is equal to the ratio of the two initial [H+] values. As a real-world example, Fig. 2c shows similar pH trends for two time series, the equatorial Pacific (0∘ N, 125∘ W; Sutton et al., 2014) and the Irminger Sea (64.3∘ N, 28∘ W; Bates et al., 2014), where the initial pH values differ (Table S1), causing the trends in [H+] to differ. Yet, at another equatorial Pacific site (0∘ N, 155∘ W; Sutton et al., 2014), there is a similar [H+] trend to that of the Irminger Sea site because the initial pH differs. While we focus here on pH changes in the open ocean, pH changes also occur in coastal waters where they tend to be larger (Carstensen and Duarte, 2019). Recognizing that a change in pH represents a relative change in [H+] regardless of location and examining long-term trends in both parameters should improve the interpretation of chemical changes across ocean domains.

Figure 3Data used in this figure come from the GFDL ESM2M model for the combined historical and RCP8.5 experiments. Time series of surface ocean (a) pH and (d) [H+] (nmol kg−1) at model grid points corresponding to the Kuroshio Extension Observatory (KEO) and the Drake Passage region north of the Antarctic Polar Front (DPN), similar to Region 1 in Munro et al. (2015). Surface ocean seasonal cycle amplitudes (A) were averaged for each decade and smoothed with a running mean filter using a four-element sliding window. Shown are the decadal changes in (b) A-pH and (e) A-[H+] (nmol kg−1) relative to the 1950s, as well as the surface ocean (c) pH and (f) [H+] (nmol kg−1) monthly anomalies relative to the annual mean at KEO and DPN during the 1950s (thin lines) and 2090s (thick lines). Global maps show the total change in (g) A-pH and (h) A-[H+] (nmol kg−1) between the 1950s and 2090s. White boxes are centered at the KEO and DPN time-series sites. Simulated 1950s and 2090s annual mean pH and [H+] values, as well as the 2090s minus 1950s change in A-pH and A-[H+], at these locations are listed in Table S2. A total of 45 additional time-series locations are included in Table S2 and Fig. S2.
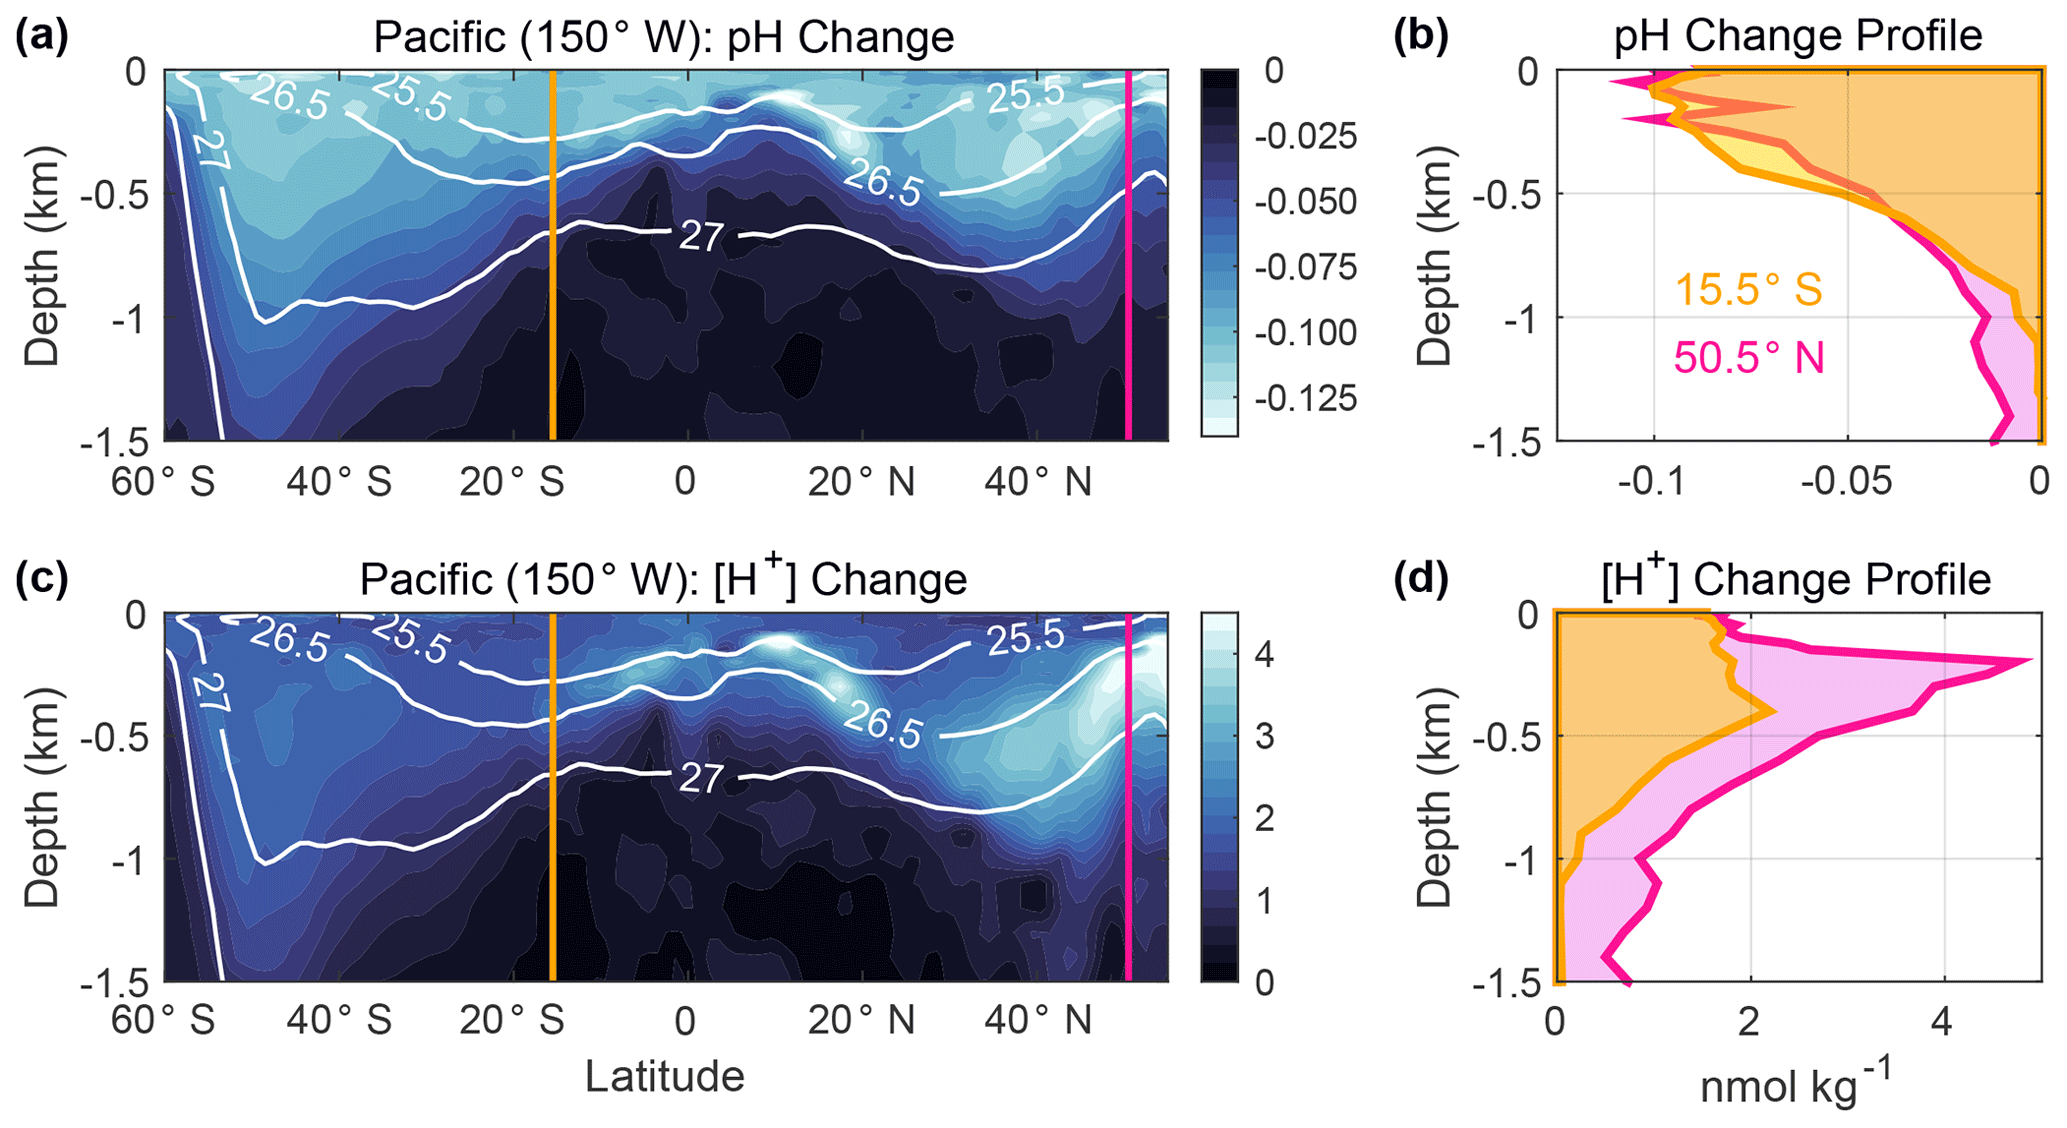
Figure 4Changes in (a) pH and (c) [H+] (nmol kg−1) associated with anthropogenic carbon (Canth) accumulation in the upper 1.5 km of the ocean along a meridional transect (150∘ W) in the Pacific Ocean from 60∘ S to 55∘ N. These values were estimated using GLODAPv2.2016b climatology data, which are referenced to the year 2002 (Lauvset et al., 2016) by subtracting the estimated Canth from dissolved inorganic carbon (DIC) and recalculating pH from the modified DIC values along with total alkalinity, silicate, phosphate, temperature, and salinity climatology data. Plotted values are derived from the differences between the pH climatology and recalculated pH values that roughly reflect preindustrial values. This simple approach neglects pH changes caused by processes other than Canth accumulation and is used merely to display the concept of interest. Potential density contours are overlaid in white. Vertical profiles of (b) pH change and (d) [H+] change at the gold and pink lines are shown in panels (a) and (c). Calculations were performed using the MATLAB program CO2SYS version 1.1 (van Heuven et al., 2011; Lewis and Wallace, 1998) and applying the equilibrium constants of Lueker et al. (2000) and Dickson (1990) and the boron-to-chlorinity ratio of Uppström (1974), following the recommendations of Orr et al. (2015) .
The second opportunity to improve clarity concerns seasonal and diurnal variability in ocean CO2 chemistry, both of which may condition the fitness and survival of organisms (Hales et al., 2017; Hofmann et al., 2011; Kapsenberg and Cyronak, 2019; McNeil and Sasse, 2016). Identical peak-to-peak amplitudes of pH variations at locations having different annual mean pH implies different peak-to-peak amplitudes in [H+]. While accounting for this concern affects the interpretation of spatial patterns of pH variations, it appears even more critical when assessing how conditions evolve over time. For example, the seasonal amplitude of pH (A-pH) is expected to decrease, while that of [H+] (A-[H+]) is expected to increase throughout much of the surface ocean over the 21st century under the RCP8.5 scenario (Kwiatkowski and Orr, 2018). This phenomenon arises because A-[H+] increases relatively more slowly over time than the annual mean [H+]. To illustrate how different these absolute and relative changes can be, in Fig. 3 let us compare simulated time series of pH and [H+] sampled at the locations of the Kuroshio Extension Observatory (KEO; Table S2) and Drake Passage region north of the Antarctic Polar Front (DPN; Table S2) from the Geophysical Fluid Dynamics Laboratory's (GFDL) Earth System Model (ESM2M; Dunne et al., 2012, 2013) for the CMIP5 historical and RCP8.5 experiments (Riahi et al., 2011). Despite nearly identical decreases in A-pH at KEO (−0.0139) and DPN: (−0.0141) from the 1950s to 2090s, the corresponding change in A-[H+] is not only positive at both sites but 10 times greater at the former than the latter (1.70 versus 0.17 nmol kg−1). Thus, it is desirable to assess A-[H+] as well as A-pH.
The third opportunity to improve clarity concerns the interpretation of changes with depth, such as those between repeat hydrography line occupations or model time steps. Recently, the magnitude of chemical changes between repeat hydrographic sections has been inferred using various linear regression techniques (Carter et al., 2019; Chen et al., 2017; Chu et al., 2016; Williams et al., 2015; Woosley et al., 2016) and water mass characterization approaches (Resplandy et al., 2013; Ríos et al., 2015), with results often plotted in terms of ΔpH. Most ocean regions exhibit a larger range of pH in the upper 1000 m of the water column (∼ 7.4–8.5; Lauvset et al., 2016, 2020) than across surface waters of the open ocean (∼ 7.7–8.5; Lauvset et al., 2016; Fassbender et al., 2017). Because of these large vertical gradients in background pH, one cannot interpret the magnitude and pattern of the corresponding absolute chemical changes by studying only ΔpH. An example is given in Fig. 4 for a meridional section in the Pacific Ocean using the 2002-referenced Global Ocean Data Analysis Project mapped climatologies (GLODAPv2.2016b; Lauvset et al., 2016). Despite there being larger changes in pH near the sea surface relative to the preindustrial period, changes in [H+] with depth indicate a different structure due to the heterogeneity of the background pH. An improved understanding of ongoing chemical changes comes from also studying Δ[H+], which reveals aspects that studying ΔpH alone may conceal or overemphasize.
When studying ocean acidification, the community often refers to changes in pH along with changes in other CO2 system variables, such as pCO2, total dissolved inorganic carbon (DIC), and the saturation state of seawater with respect to aragonite. Yet the logarithmic scale of pH means that its changes are equivalent to relative changes in [H+], unlike for all other CO2 system variables whose changes are not given on a log scale and are absolute. For absolute changes, one must actually compute Δ[H+]. We have illustrated this with three simple examples. Thus, when discussing changes in pH, it is recommended to show results as Δ[H+] as well as ΔpH, and when reporting pH data, it is recommended to provide the reference conditions as well as the changes.
The Intergovernmental Panel on Climate Change (IPCC) defines ocean acidification as “…a reduction in pH of the ocean over an extended period, typically decades or longer, caused primarily by the uptake of carbon dioxide (CO2) from the atmosphere” (Rhein et al., 2013, p. 295); a similar definition is in Weyer (2019, p. 693). This apparent emphasis on pH should be considered in the light of the challenges we have mentioned in interpreting pH changes in an ocean where background pH varies both in space and time. Do ocean regions with the same rate of pH decline really have the same rate of acidification even if their initial conditions differ and hence their [H+] change varies? Does a greater pH change at the surface relative to the subsurface indicate greater acidification even if the change in hydrogen ion concentration is identical? Does a decline in the seasonal amplitude of pH imply benefits given that the opposite trend is projected for the seasonal amplitude of [H+]? Despite such concerns, the simplicity of the IPCC definition of ocean acidification continues to make it attractive. Whether or not it should be modified merits further discussion. More important is that the community move forward as a whole to go beyond reporting changes in pH alone, thereby avoiding the unwitting focus on relative rather than absolute changes in hydrogen ion concentration.
All data used in this analysis are publicly accessible, and the appropriate references have been provided. Specifically, Fig. 2 was made using information from Sutton et al. (2014) and Bates et al. (2014) and the data products described in Fassbender et al. (2017), which can be accessed at https://www.socat.info/index.php/products-using-socat/, last access: 23 September 2020. GFDL ESM2M data used to make Fig. 3 can be accessed at ftp://nomads.gfdl.noaa.gov/CMIP5/output1/NOAA-GFDL/, last access: 23 September 2020. The gridded GLODAPv2.2016b dataset used to make Fig. 4 can be accessed at https://www.ncei.noaa.gov/access/ocean-carbon-data-system/oceans/GLODAPv2/, last access: 23 September 2020.
The supplement related to this article is available online at: https://doi.org/10.5194/bg-18-1407-2021-supplement.
AJF initiated the discussion among coauthors and wrote the first draft. All coauthors contributed to further revisions throughout the paper.
The authors declare that they have no conflict of interest.
We thank Stephen Gonski and two anonymous reviewers for their helpful comments.
Andrea J. Fassbender was supported by the David and Lucile Packard Foundation/MBARI, Andrew G. Dickson by the US National Science Foundation (grant no. OCE 1657799), and James C. Orr by the French ANR Project SOBUMS (grant no. ANR-16-CE01-0014) and EU H2020 Project COMFORT (grant no. 820989).
This paper was edited by Peter Landschützer and reviewed by two anonymous referees.
Archer, D. E., Kheshgi, H., and Maier-Reimer, E.: Dynamics of fossil fuel CO2 neutralization by marine CaCO3, Global Biogeochem. Cy., 12, 259–276, https://doi.org/10.1029/98GB00744, 1998.
Bates, N., Astor, Y., Church, M. J., Currie, K., Dore, J., Gonaález-Dávila, M., Lorenzoni, L., Muller-Karger, F., Olafsson, J., and Santana-Casiano, J. M.: A time-series view of changing ocean chemistry due to ocean uptake of anthropogenic CO2 and ocean acidification, Oceanography, 27, 126–141, https://doi.org/10.5670/oceanog.2014.16, 2014.
Bates, R. G.: pH measurements in the marine environment, Pure Appl. Chem., 54, 229–232, https://doi.org/10.1351/pac198254010229, 1982.
Bates, R. G. and Guggenheim, E. A.: Report on the standardization of pH and related terminology, Pure Appl. Chem., 1, 163–168, https://doi.org/10.1351/pac196001010163, 1960.
Baucke, F. G. K.: New IUPAC recommendations on the measurement of pH – background and essentials, Anal. Bioanal. Chem., 374, 772–777, https://doi.org/10.1007/s00216-002-1523-4, 2002.
Bopp, L., Resplandy, L., Orr, J. C., Doney, S. C., Dunne, J. P., Gehlen, M., Halloran, P., Heinze, C., Ilyina, T., Séférian, R., Tjiputra, J., and Vichi, M.: Multiple stressors of ocean ecosystems in the 21st century: projections with CMIP5 models, Biogeosciences, 10, 6225–6245, https://doi.org/10.5194/bg-10-6225-2013, 2013.
Boudreau, B. P., Middelburg, J. J., and Luo, Y.: The role of calcification in carbonate compensation, Nat. Geosci., 11, 894–900, https://doi.org/10.1038/s41561-018-0259-5, 2018.
Boyd, P. W., Cornwall, C. E., Davison, A., Doney, S. C., Fourquez, M., Hurd, C. L., Lima, I. D., and McMinn, A.: Biological responses to environmental heterogeneity under future ocean conditions, Global Change Biol., 22, 2633–2650, https://doi.org/10.1111/gcb.13287, 2016.
Brewer, P. G.: A short history of ocean acidification science in the 20th century: a chemist's view, Biogeosciences, 10, 7411–7422, https://doi.org/10.5194/bg-10-7411-2013, 2013.
Buck, R. P., Rondinini, S., Covington, A. K., Baucke, F. G. K., Brett, C. M. A., Camoes, M. F., Milton, M. J. T., Mussini, T., Naumann, R., Pratt, K. W., Spitzer, P., and Wilson, G. S.: Measurement of pH, Definition, standards, and procedures (IUPAC Recommendations 2002), Pure Appl. Chem., 74, 2169–2200, https://doi.org/10.1351/pac200274112169, 2002.
Bushinsky, S. M., Takeshita, Y., and Williams, N. L.: Observing changes in ocean carbonate chemistry: our autonomous future, Curr. Clim. Change Reports, 5, 207–220, https://doi.org/10.1007/s40641-019-00129-8, 2019.
Caldeira, K. and Wickett, M. E.: Anthropogenic carbon and ocean pH, Nature, 425, 365, https://doi.org/10.1038/425365a, 2003.
Carstensen, J. and Duarte, C. M.: Drivers of pH Variability in Coastal Ecosystems, Environ. Sci. Technol., 53, 4020–4029, https://doi.org/10.1021/acs.est.8b03655, 2019.
Carter, B. R., Feely, R. A., Wanninkhof, R., Kouketsu, S., Sonnerup, R. E., Pardo, P. C., Sabine, C. L., Johnson, G. C., Sloyan, B. M., Murata, A., Mecking, S., Tilbrook, B., Speer, K., Talley, L. D., Millero, F. J., Wijffels, S. E., Macdonald, A. M., Gruber, N., and Bullister, J. L.: Pacific anthropogenic carbon between 1991 and 2017, Global Biogeochem. Cy., 33, 597–617, https://doi.org/10.1029/2018GB006154, 2019.
Chen, C.-T. A., Lui, H.-K., Hsieh, C.-H., Yanagi, T., Kosugi, N., Ishii, M., and Gong, G.-C.: Deep oceans may acidify faster than anticipated due to global warming, Nat. Clim. Change, 7, 890–894, https://doi.org/10.1038/s41558-017-0003-y, 2017.
Chu, S. N., Wang, Z. A., Doney, S. C., Lawson, G. L., and Hoering, K. A.: Changes in anthropogenic carbon storage in the Northeast Pacific in the last decade, J. Geophys. Res.-Oceans, 121, 4618–4632, https://doi.org/10.1002/2016JC011775, 2016.
Clark, W. M.: The determination of hydrogen ions, edn. 2, Williams and Wilkins Company, Baltimore, Maryland, USA, 480 pp., 1922.
Clark, W. M., Wherry, E. T., and Adams, E. Q.: Reply to Wherry and Adams' article on methods of stating acidity, J. Washingt. Acad. Sci., 11, 199–202, available at: https://www.jstor.org/stable/24532479 (last access: 1 February 2021), 1921.
Cohen, E. R., Cvitas, T., Frey, J. G., Holström, B., Kuchitsu, K., Marquardt, R., Mills, I., Pavese, F., Quack, M., Stohner, J., Strauss, H. L., Takami, M., and Thor, A. J.: Quantities, Units and Symbols in Physical Chemistry, Third Edit., edited by: Cohen, E. R., Cvitas, T., Frey, J. G., Holström, B., Kuchitsu, K., Marquardt, R., Mills, I., Pavese, F., Quack, M., Stohner, J., Strauss, H. L., Takami, M., and Thor, A. J., Royal Society of Chemistry, Cambridge, 1–250, 2007.
Covington, A. K., Bates, R. G., and Durst, R. A.: Definition of pH scales, standard reference values, measurement of pH and related terminology (recommendations 1984), available at: http://publications.iupac.org/pac/1985/pdf/5703x0531.pdf (last access: 15 January 2021), 1985.
Dickson, A. G.: pH scales and proton-transfer reactions in saline media such as sea water, Geochim. Cosmochim. Ac., 48, 2299–2308, https://doi.org/10.1016/0016-7037(84)90225-4, 1984.
Dickson, A. G.: Standard potential of the reaction: AgCl(s) + H2(g) = Ag(s) + HCl(aq), and the standard acidity constant of the ion HSO in synthetic sea water from 273.15 to 318.15 K, J. Chem. Thermodyn., 22, 113–127, https://doi.org/10.1016/0021-9614(90)90074-Z, 1990.
Dickson, A. G.: Seawater carbonate chemistry, Part I, in: Guide to best practices for ocean acidification research and data reporting, edited by: Riebesell, U., Fabry, V. J., Hansson, L., and Gattuso, J. P., European Commission, Brussels, Belgium, 17–40, 2010.
Dickson, A. G., Camões, M. F., Spitzer, P., Fisicaro, P., Stoica, D., Pawlowicz, R., and Feistel, R.: Metrological challenges for measurements of key climatological observables, Part 3: seawater pH, Metrologia, 53, R26–R39, https://doi.org/10.1088/0026-1394/53/1/R26, 2016.
Doney, S. C., Fabry, V. J., Feely, R. A., and Kleypas, J. A.: Ocean acidification: the other CO2 problem, Annu. Rev. Mar. Sci., 1, 169–192, https://doi.org/10.1146/annurev.marine.010908.163834, 2009.
Doney, S. C., Bopp, L., and Long, M.: Historical and future trends in ocean climate and biogeochemistry, Oceanography, 27, 108–119, https://doi.org/10.5670/oceanog.2014.14, 2014.
Dore, J., Lukas, R., Sadler, D. W., Church, M. J., and Karl, D. M.: Physical and biogeochemical modulation of ocean acidification in the central North Pacific, P. Natl. Acad. Sci. USA, 106, 12235–12240, https://doi.org/10.1073/pnas.0906044106, 2009.
Dunne, J. P., John, J. G., Adcroft, A. J., Griffies, S. M., Hallberg, R. W., Shevliakova, E., Stouffer, R. J., Cooke, W., Dunne, K. A., Harrison, M. J., Krasting, J. P., Malyshev, S. L., Milly, P. C. D., Phillipps, P. J., Sentman, L. T., Samuels, B. L., Spelman, M. J., Winton, M., Wittenberg, A. T., and Zadeh, N.: GFDL's ESM2 global coupled climate–carbon Earth System Models, Part I: physical formulation and baseline simulation characteristics, J. Climate, 25, 6646–6665, https://doi.org/10.1175/JCLI-D-11-00560.1, 2012.
Dunne, J. P., John, J. G., Shevliakova, E., Stouffer, R. J., Krasting, J. P., Malyshev, S. L., Milly, P. C. D., Sentman, L. T., Adcroft, A. J., Cooke, W., Dunne, K. A., Griffies, S. M., Hallberg, R. W., Harrison, M. J., Levy, H., Wittenberg, A. T., Phillips, P. J., and Zadeh, N.: GFDL's ESM2 global coupled climate–carbon Earth System Models, Part II: carbon system formulation and baseline simulation characteristics, J. Climate, 26, 2247–2267, https://doi.org/10.1175/JCLI-D-12-00150.1, 2013.
Fassbender, A. J., Sabine, C. L., and Palevsky, H. I.: Nonuniform ocean acidification and attenuation of the ocean carbon sink, Geophys. Res. Lett., 44, 8404–8413, https://doi.org/10.1002/2017GL074389, 2017.
Friedlingstein, P., O'Sullivan, M., Jones, M. W., Andrew, R. M., Hauck, J., Olsen, A., Peters, G. P., Peters, W., Pongratz, J., Sitch, S., Le Quéré, C., Canadell, J. G., Ciais, P., Jackson, R. B., Alin, S., Aragão, L. E. O. C., Arneth, A., Arora, V., Bates, N. R., Becker, M., Benoit-Cattin, A., Bittig, H. C., Bopp, L., Bultan, S., Chandra, N., Chevallier, F., Chini, L. P., Evans, W., Florentie, L., Forster, P. M., Gasser, T., Gehlen, M., Gilfillan, D., Gkritzalis, T., Gregor, L., Gruber, N., Harris, I., Hartung, K., Haverd, V., Houghton, R. A., Ilyina, T., Jain, A. K., Joetzjer, E., Kadono, K., Kato, E., Kitidis, V., Korsbakken, J. I., Landschützer, P., Lefèvre, N., Lenton, A., Lienert, S., Liu, Z., Lombardozzi, D., Marland, G., Metzl, N., Munro, D. R., Nabel, J. E. M. S., Nakaoka, S.-I., Niwa, Y., O'Brien, K., Ono, T., Palmer, P. I., Pierrot, D., Poulter, B., Resplandy, L., Robertson, E., Rödenbeck, C., Schwinger, J., Séférian, R., Skjelvan, I., Smith, A. J. P., Sutton, A. J., Tanhua, T., Tans, P. P., Tian, H., Tilbrook, B., van der Werf, G., Vuichard, N., Walker, A. P., Wanninkhof, R., Watson, A. J., Willis, D., Wiltshire, A. J., Yuan, W., Yue, X., and Zaehle, S.: Global Carbon Budget 2020, Earth Syst. Sci. Data, 12, 3269–3340, https://doi.org/10.5194/essd-12-3269-2020, 2020.
GCOS: The Global Observing System for climate: implementation needs, available at: https://library.wmo.int/doc_num.php?explnum_id=3417 (last access: 23 September 2020), 2016.
GOOS: Essential Ocean Variables, available at: http://www.goosocean.org/index.php?option=com_content&view=article&id=14&Itemid=114, last access: 1 August 2019.
Hales, B., Suhrbier, A., Waldbusser, G. G., Feely, R. A., and Newton, J. A.: The Carbonate Chemistry of the “Fattening Line”, Willapa Bay, 2011–2014, Estuar. Coast., 40, 173–186, https://doi.org/10.1007/s12237-016-0136-7, 2017.
Hamer, W. J. and Acree, S. F.: Primary pH measurements and standards, J. Res. Natl. Bur. Stand., 23, 647–657, 1939.
Hofmann, G. E., Barry, J. P., Edmunds, P. J., Gates, R. D., Hutchins, D. A., Klinger, T., and Sewell, M. A.: The effect of ocean acidification on calcifying organisms in marine ecosystems: an organism-to-ecosystem perspective, Annu. Rev. Ecol. Evol. S., 41, 127–147, https://doi.org/10.1146/annurev.ecolsys.110308.120227, 2010.
Hofmann, G. E., Smith, J. E., Johnson, K. S., Send, U., Levin, L. A., Micheli, F., Paytan, A., Price, N. N., Peterson, B., Takeshita, Y., Matson, P. G., Crook, E. D., Kroeker, K. J., Gambi, M. C., Rivest, E. B., Frieder, C. A., Yu, P. C., and Martz, T. R.: High-frequency dynamics of ocean pH: a multi-ecosystem comparison, PLoS One, 6, e28983, https://doi.org/10.1371/journal.pone.0028983, 2011.
Jiang, L.-Q., Carter, B. R., Feely, R. A., Lauvset, S. K., and Olsen, A.: Surface ocean pH and buffer capacity: past, present and future, Sci. Rep., 9, 18624, https://doi.org/10.1038/s41598-019-55039-4, 2019.
Kapsenberg, L. and Cyronak, T.: Ocean acidification refugia in variable environments, Global Change Biol., 25, 3201–3214, https://doi.org/10.1111/gcb.14730, 2019.
Kleypas, J. A., Feely, R. A., Fabry, V. J., Langdon, C., Sabine, C. L., and Robbins, L. L.: Impacts of ocean acidification on coral reefs and other marine calcifiers: a guide for future research, report of a workshop held 18–20 April 2005, St. Petersburg, FL, sponsored by NSF, NOAA, and the U.S. Geological Survey, 88 pp., 2006.
Kwiatkowski, L. and Orr, J. C.: Diverging seasonal extremes for ocean acidification during the twenty-first century, Nat. Clim. Change, 8, 141–145, https://doi.org/10.1038/s41558-017-0054-0, 2018.
Kwiatkowski, L., Torres, O., Bopp, L., Aumont, O., Chamberlain, M., Christian, J. R., Dunne, J. P., Gehlen, M., Ilyina, T., John, J. G., Lenton, A., Li, H., Lovenduski, N. S., Orr, J. C., Palmieri, J., Santana-Falcón, Y., Schwinger, J., Séférian, R., Stock, C. A., Tagliabue, A., Takano, Y., Tjiputra, J., Toyama, K., Tsujino, H., Watanabe, M., Yamamoto, A., Yool, A., and Ziehn, T.: Twenty-first century ocean warming, acidification, deoxygenation, and upper-ocean nutrient and primary production decline from CMIP6 model projections, Biogeosciences, 17, 3439–3470, https://doi.org/10.5194/bg-17-3439-2020, 2020.
Lauvset, S. K., Gruber, N., Landschützer, P., Olsen, A., and Tjiputra, J.: Trends and drivers in global surface ocean pH over the past 3 decades, Biogeosciences, 12, 1285–1298, https://doi.org/10.5194/bg-12-1285-2015, 2015.
Lauvset, S. K., Key, R. M., Olsen, A., van Heuven, S., Velo, A., Lin, X., Schirnick, C., Kozyr, A., Tanhua, T., Hoppema, M., Jutterström, S., Steinfeldt, R., Jeansson, E., Ishii, M., Perez, F. F., Suzuki, T., and Watelet, S.: A new global interior ocean mapped climatology: the 1∘ × 1∘ GLODAP version 2, Earth Syst. Sci. Data, 8, 325–340, https://doi.org/10.5194/essd-8-325-2016, 2016.
Lauvset, S. K., Carter, B. R., Pèrez, F. F., Jiang, L.-Q., Feely, R. A., Velo, A., and Olsen, A.: Processes driving global interior ocean pH distribution, Global Biogeochem. Cy., 34, 1–17, https://doi.org/10.1029/2019GB006229, 2020.
Lewis, E. and Wallace, D. W. R.: Program developed for CO2 system calculations, Carbon Dioxide Information Analysis Center, Oak Ridge National Laboratory, US Department of Energy, Oak Ridge, Tennessee, USA, 4735, available at: https://www.nodc.noaa.gov/ocads/oceans/CO2SYS/co2rprt.html (last access: 2 July 2014), 1998.
Lueker, T. J., Dickson, A. G., and Keeling, C. D.: Ocean pCO2 calculated from dissolved inorganic carbon, alkalinity, and equations for K1 and K2: validation based on laboratory measurements of CO2 in gas and seawater at equilibrium, Mar. Chem., 70, 105–119, https://doi.org/10.1016/S0304-4203(00)00022-0, 2000.
Marion, G. M., Millero, F. J., Camões, M. F., Spitzer, P., Feistel, R., and Chen, C.-T. A.: pH of seawater, Mar. Chem., 126, 89–96, https://doi.org/10.1016/j.marchem.2011.04.002, 2011.
McGlashan, M. L.: Manual of symbols and terminology for physicochemical quantities and units, Pure Appl. Chem., 21, 1–38, 1970.
McNeil, B. I. and Sasse, T. P.: Future ocean hypercapnia driven by anthropogenic amplification of the natural CO2 cycle, Nature, 529, 383–386, https://doi.org/10.1038/nature16156, 2016.
Millero, F. J.: The marine inorganic carbon cycle, Chem. Rev., 107, 308–341, https://doi.org/10.1021/cr0503557, 2007.
Munro, D. R., Lovenduski, N. S., Takahashi, T., Stephens, B. B., Newberger, T., and Sweeney, C.: Recent evidence for a strengthening CO2 sink in the Southern Ocean from carbonate system measurements in the Drake Passage (2002–2015), Geophys. Res. Lett., 42, 7623–7630, https://doi.org/10.1002/2015GL065194, 2015.
Orr, J. C., Fabry, V. J., Aumont, O., Bopp, L., Doney, S. C., Feely, R. A., Gnanadesikan, A., Gruber, N., Ishida, A., Joos, F., Key, R. M., Lindsay, K., Maier-Reimer, E., Matear, R., Monfray, P., Mouchet, A., Najjar, R. G., Plattner, G.-K., Rodgers, K. B., Sabine, C. L., Sarmiento, J. L., Schlitzer, R., Slater, R. D., Totterdell, I. J., Weirig, M.-F., Yamanaka, Y., and Yool, A.: Anthropogenic ocean acidification over the twenty-first century and its impact on calcifying organisms, Nature, 437, 681–686, https://doi.org/10.1038/nature04095, 2005.
Orr, J. C., Epitalon, J.-M., and Gattuso, J.-P.: Comparison of ten packages that compute ocean carbonate chemistry, Biogeosciences, 12, 1483–1510, https://doi.org/10.5194/bg-12-1483-2015, 2015.
Passow, U. and Carlson, C. A.: The biological pump in a high CO2 world, Mar. Ecol. Prog. Ser., 470, 249–271, https://doi.org/10.3354/meps09985, 2012.
Resplandy, L., Bopp, L., Orr, J. C., and Dunne, J. P.: Role of mode and intermediate waters in future ocean acidification: Analysis of CMIP5 models, Geophys. Res. Lett., 40, 3091–3095, https://doi.org/10.1002/grl.50414, 2013.
Revelle, R. and Suess, H. E.: Carbon dioxide exchange between atmosphere and ocean and the question of an increase of atmospheric CO2 during the past decades, Tellus, 9, 18–27, https://doi.org/10.1111/j.2153-3490.1957.tb01849.x, 1957.
Rhein, M., Rintoul, S. R., Aoki, S., Campos, E., Chambers, D., Feely, R. A., Gulev, S., Johnson, G. C., Josey, S. A., Kostianoy, A., Mauritzen, C., Roemmich, D., Talley, L. D., and Wang, F.: Observations: Ocean. In: Climate Change 2013: The Physical Science Basis. Contribution of Working Group I to the Fifth Assessment Report of the Intergovernmental Panel on Climate Change, edited by: Stocker, T. F., Qin, D., Plattner, G.-K., Tignor, M., Allen, S. K., Boschung, J., Nauels, A., Xia, Y., Bex, V., and Midgley, P. M., Cambridge University Press, Cambridge, United Kingdom and New York, NY, USA, 2013.
Riahi, K., Rao, S., Krey, V., Cho, C., Chirkov, V., Fischer, G., Kindermann, G., Nakicenovic, N., and Rafaj, P.: RCP 8.5 – A scenario of comparatively high greenhouse gas emissions, Climatic Change, 109, 33–57, https://doi.org/10.1007/s10584-011-0149-y, 2011.
Ríos, A. F., Resplandy, L., García-Ibáñez, M. I., Fajar, N. M., Velo, A., Padín, X. A., Wanninkhof, R., Steinfeldt, R., Rosón, G., Pérez, F. F., and Morel, F. M. M.: Decadal acidification in the water masses of the Atlantic Ocean, P. Natl. Acad. Sci. USA, 112, 9950–9955, https://doi.org/10.1073/pnas.1504613112, 2015.
Sørensen, S. P. L.: Enzymstudien II: Über die Messung und Bedeutung der Wasserstoffionen-konzentration bei biologischen Prozessen, Biochem. Z., 21, 131–200, https://doi.org/10.1007/BF02325444, 1909.
Sørensen, S. P. L. and Linderstrøm-Lang, K.: On the determination and value of po in electrometric measurements of hydrogen ion concentrations, Compt. rend. trav. lab. Carlsberg, 15, 1–40, 1924.
Spitzer, P. and Pratt, K. W.: The history and development of a rigorous metrological basis for pH measurements, J. Solid State Electr., 15, 69–76, https://doi.org/10.1007/s10008-010-1106-9, 2011.
Steinacher, M., Joos, F., Frölicher, T. L., Plattner, G.-K., and Doney, S. C.: Imminent ocean acidification in the Arctic projected with the NCAR global coupled carbon cycle-climate model, Biogeosciences, 6, 515–533, https://doi.org/10.5194/bg-6-515-2009, 2009.
Sutton, A. J., Feely, R. A., Sabine, C. L., McPhaden, M. J., Takahashi, T., Chavez, F. P., Friederich, G. E., and Mathis, J. T.: Natural variability and anthropogenic change in equatorial Pacific surface ocean pCO2 and pH, Global Biogeochem. Cy., 28, 131–145, https://doi.org/10.1002/2013GB004679, 2014.
Takahashi, T., Sutherland, S. C., Chipman, D. W., Goddard, J. G., and Ho, C.: Climatological distributions of pH, pCO2, total CO2, alkalinity, and CaCO3 saturation in the global surface ocean, and temporal changes at selected locations, Mar. Chem., 164, 95–125, https://doi.org/10.1016/j.marchem.2014.06.004, 2014.
Thyng, K., Greene, C., Hetland, R., Zimmerle, H., and DiMarco, S.: True Colors of Oceanography: Guidelines for Effective and Accurate Colormap Selection, Oceanography, 29, 9–13, https://doi.org/10.5670/oceanog.2016.66, 2016.
Uppström, L. R.: The boron-chlorinity ratio of deep seawater from the Pacific Ocean, Deep. Res. Part I, 21, 161–162, 1974.
van Heuven, S. M. A. C., Pierrot, D., Rae, J. W. B., Lewis, E., and Wallace, D. W. R.: MATLAB program developed for CO2 system calculations, ORNL/CDIAC-105b, Carbon Dioxide Information Analysis Center, Oak Ridge National Laboratory, US Department of Energy, Oak Ridge, Tennessee, USA, https://www.ncei.noaa.gov/access/ocean-carbon-data-system/oceans/CO2SYS/co2rprt.html, 2011.
Waters, J. F. and Millero, F. J.: The free proton concentration scale for seawater pH, Mar. Chem., 149, 8–22, https://doi.org/10.1016/j.marchem.2012.11.003, 2013.
IPCC: Annex I: Glossary, edited by: Weyer, N. M., in: IPCC Special Report on the Ocean and Cryosphere in a Changing Climate, edited by: Pörtner, H.-O., Roberts, D. C., Masson-Delmotte, V., Zhai, P., Tignor, M., Poloczanska, E., Mintenbeck, K., Alegría, A., Nicolai, M., Okem, A., Petzold, J., Rama, B., and Weyer N. M., in press, 2019.
Wherry, E. T.: The statement of acidity and alkalinity, with special reference to soils, J. Washingt. Acad. Sci., 9, 305–309, available at: https://www.jstor.org/stable/24521412 (last access: 23 September 2020), 1919.
Wherry, E. T. and Adams, E. Q.: Methods of stating acidity, J. Washingt. Acad. Sci., 11, 197–199, available at: https://www.jstor.org/stable/24532477 (last access: 23 September 2020), 1921.
Williams, N. L., Feely, R. A., Sabine, C. L., Dickson, A. G., Swift, J. H., Talley, L. D., and Russell, J. L.: Quantifying anthropogenic carbon inventory changes in the Pacific sector of the Southern Ocean, Mar. Chem., 174, 147–160, https://doi.org/10.1016/j.marchem.2015.06.015, 2015.
Woosley, R. J., Millero, F. J., and Wanninkhof, R.: Rapid anthropogenic changes in CO2 and pH in the Atlantic Ocean: 2003–2014, Global Biogeochem. Cy., 30, 70–90, https://doi.org/10.1002/2015GB005248, 2016.