the Creative Commons Attribution 4.0 License.
the Creative Commons Attribution 4.0 License.
 | 22 Apr 2021
Wetter environment and increased grazing reduced the area burned in northern Eurasia from 2002 to 2016
Wei Min Hao
Matthew C. Reeves
L. Scott Baggett
Yves Balkanski
Philippe Ciais
Bryce L. Nordgren
Alexander Petkov
Rachel E. Corley
Florent Mouillot
Shawn P. Urbanski
Northern Eurasia is currently highly sensitive to climate change. Fires in this region can have significant impacts on regional air quality, radiative forcing and black carbon deposition in the Arctic which can accelerate ice melting. Using a MODIS-derived burned area dataset, we report that the total annual area burned in this region declined by 53 % during the 15-year period from 2002 to 2016. Grassland fires dominated this trend, accounting for 93 % of the decline in the total area burned. Grassland fires in Kazakhstan contributed 47 % of the total area burned and 84 % of the decline. A wetter climate and increased grazing are the principle driving forces for the decline. Our findings (1) highlight the importance of the complex interactions of climate–vegetation–land use in affecting fire activity and (2) reveal how the resulting impacts on fire activity in a relatively small region such as Kazakhstan can dominate the trends in burned areas across a much larger landscape of northern Eurasia.
- Article
(4037 KB) - Full-text XML
-
Supplement
(251 KB) - BibTeX
- EndNote


Fire activity worldwide is very sensitive to climate change and human actions, especially over high-latitude ecosystems (Goetz et al., 2007). Identifying and unraveling confounding drivers of fire is critical for understanding the recent and future impacts of fire activity. In northern Eurasia, fire activity impacts of chief concern include carbon cycling, boreal ecosystem dynamics, fire emissions (Hao et al., 2016a), accelerated ice melting in the Arctic (Hao et al., 2016a; Evangeliou et al., 2016), early thawing of permafrost and the hydrological cycle at high latitudes (IPCC, 2014). In addition, fire activity affects air quality in Europe, Asia and North America. An improved understanding of the region's fire dynamics can also be applied to develop climate change mitigation policy and can be incorporated into the fire modules of Earth system models to improve their predictions (Hantson et al., 2016).
The global mean surface temperature rose by approximately 0.72 ∘C from the year 1951 to 2012 according to the Fifth Assessment Report (AR5) of the Intergovernmental Panel on Climate Change (IPCC, 2013), but it remained relatively constant (“warming slowdown”) from 1998 to 2013 (Fyfe et al., 2013, 2016; Cowtan and Way, 2014; Trenberth et al., 2014). Nevertheless, extreme high-temperature events continued to occur even during the warming slowdown (Seneviratne et al., 2014; Trenberth et al., 2015). Since 2013, the global temperature has risen rapidly (NASA Global Climate Change, 2019), and there were hemispheric temperature anomalies from 1850 to 2015 (Jones et al. 2016). In the Northern Hemisphere, temperatures have increased more profoundly than in the Southern Hemisphere since the 1980s, as they are greatly affected by the sources of greenhouse gases and many other factors. High latitudes are projected to have the largest temperature increase globally by 2100 (IPCC, 2013). At the same time, however, climatic components of the fire weather index (FWI), an index of fire intensity potential, have experienced regional divergence at these latitudes with a positive FWI trend in East Asia and a negative trend in Kazakhstan (Jolly et al. 2015), suggesting divergent regional climate impacts. In northern Eurasia, current accelerated high temperatures in the summer have also been observed on the eastern European Plain and in central Siberia (Sato and Nakamura, 2019).
Over the past 20 years, a decline in total area burned in Eurasia has been observed (Giglio et al., 2013; Hao et al., 2016a, Andela et al., 2017). We will investigate trends in the spatial and temporal distribution of area burned from 2002 to 2016 across different land cover types and geographic regions in northern Eurasia, a region highly sensitive to climate change. The geographic subregion with the largest declining trend is examined, and the influence of the confounding factors of climate and human activity on burned area is explored.
Our study seeks to evaluate the decline in burned area as a function of variable fuel conditions (Krawchuk and Moritz, 2011), land use and relative moisture conditions (Pausas and Ribeiro 2013). Beside these climate variables, on a global scale, abrupt changes have been observed to significantly impact long-term or recent fire history (Pausas and Keeley, 2014), along with other mechanisms such as herbivory from native and domestic ungulates and humans (e.g., fire prevention). Considerable research has been done to understand climate–fire–grazing interactions in grassland ecosystems. In grasslands, reductions in fuel availability due to decreasing net primary production, grazing or other management activities can be the key variables limiting fire spread (Moritz et al., 2005). For instance, in the western United States, research has significant implications on forest and rangeland management (e.g., Bachelet et al., 2000; Gedalof et al., 2005; Riley et al., 2013; Abatzoglou and Kolden, 2013). Similar issues have been investigated on an African savanna for maintaining sustainable grassland (e.g., Archibald et al., 2009; Koerner and Collins, 2014). In this study we closely examine the interactions of climate, fire, grazing and fuel availability in Kazakhstan, the country in northern Eurasia with the largest decline in burned area during the 2002–2016 period.
2.1 Study area
First, we study the area of northern Eurasia, a region from 35∘ N to the Arctic and from the Pacific Ocean to the Atlantic Ocean. The region comprises 21 % of the Earth's land area and encompasses diverse ecosystems from the steppes of central Asia to the Arctic. Forest is the major ecosystem in this region, covering 27 % of the area, followed by grasslands, which cover 16 % (Friedl et al., 2010).
Second, to understand the forces driving the decline in burned area, we focus on the effects of drought and grazing in Kazakhstan. From 2002 to 2016, Kazakhstan had the highest rate of decline in burned area in northern Eurasia (Figs. 1, 2). In Kazakhstan, grassland is the dominant ecosystem and grazing is the major agricultural activity (Food and Agriculture Organization FAO Live Animals Database, 2016).

Figure 1The distribution of grassland cover in Kazakhstan with counties and states shown as administrative boundaries.
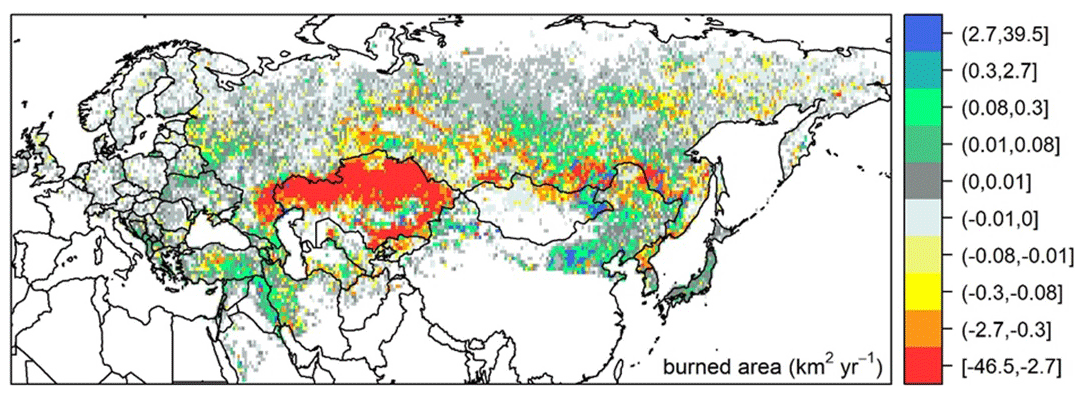
Figure 2Spatial distributions of robust linear trends in the area burned for each ∘ grid cell in northern Eurasia from 2002 to 2016. The border of Kazakhstan is also illustrated in Fig. 1.
2.2 Mapping burned areas
Burned area in northern Eurasia
Since 2000, global burned area has been mapped by remote sensing (e.g., Mouillot et al. 2014) with different sensors and detection algorithms (Chuvieco et al., 2019), leading to multiple datasets with a significant uncertainty in the magnitude of spatial distribution, interannual variability and trends in burned area (Hantson et al., 2016). We used the daily NASA MODIS (Moderate Resolution Imaging Spectroradiometer) dataset at a 500 m×500 m resolution. Our MODIS-derived burned area algorithm was validated in eastern Siberia with the Landsat-derived burned area (30 m×30 m) (Hao et al., 2012). The ratio of these two satellite-derived burned areas was 1.0 with a standard deviation of 0.5 % over 18 754 grid cells. Among other sources of variability, surface and crown fires generate significantly different spectral signals, so that the detection algorithm depends on vegetation type classification (Chuvieco et al., 2019).
The burned area data were analyzed at multiple spatial and temporal scales using frequentist statistical methods (see Sect. 2.4) to identify regional trends. Assessing burned area changes in northern Eurasia over this time period benefits from the lack of fire suppression in this region (Goldammer et al., 2013), so the impact of climate and land use on fire activity can be better understood. Our methodology for mapping daily burned area is very similar to that used by Hao et al. (2016a, b), which was specifically developed for this region. For the study of Hao et al. (2016a, 2016b), the MCD12Q1 land cover map of 2015 was used for 2002–2016. For this present study, a temporally consistent and up-to-date land cover product was used for 2002–2013 and the 2013 land cover map was used for 2014–2016, as current versions were not available for present and previous studies.
2.3 Data sources of drought, livestock, annual biomass production and land cover
The following data sources for estimating the factors affecting the burned area in Kazakhstan are described below: drought, livestock, annual biomass production and land cover. All data were evaluated at the county level for 174 counties during the period from 2002 to 2016 (Fig. 1). We focused on Kazakhstan, as it was the region with the largest decline in burned area in northern Eurasia (see Sect. 3.1).
Drought
The Palmer Drought Severity Index (PDSI) from the TerraClimate site (http://www.climatologylab.org, last access: 9 April 2021) was used to estimate drought throughout Kazakhstan (Abatzoglou et al., 2018). The PDSI was developed by Palmer (1965) and is widely used to estimate a rough soil water budget based on monthly precipitation and potential evapotranspiration, with varying soil properties for the available water content in order to account for pedological variations and species roots access to water. We used monthly PDSI data from March to July, defined as the fire season (Roy et al., 2008), to compute a cumulative drought effect index. The gridded PDSI data were available at a spatial resolution of ∼4 km and were aggregated to the county within the study area (Fig. 1). The PDSI varies from +4 for wet conditions to −4 for dry conditions.
Livestock
The annual population of livestock in each of the 14 provinces, each consisting of multiple counties, of Kazakhstan from 2002 to 2016 were compiled from the official agriculture statistics of the Ministry of National Economy of the Republic of Kazakhstan Committee on Statistics (MANE, 2019). These data included yearly numbers of large horned livestock and sheep and goats at the province level, which is coarser than the county level. Livestock populations are only available at the province level, and the population was distributed proportionally to the size of the county area so that all potential drivers of fire activity could be evaluated on a common spatial scale. Thus, the livestock density for each county is defined as the ratio of the number of animals to the area of the county.
Annual biomass production
We estimated the annual biomass production within the grassland domain of the study area (Fig. 2) using the production subroutine of the Rangeland Vegetation Simulator (RVS) model (Reeves, 2016) which applied the methods of Reeves et al. (2020). The RVS, which was originally developed for simulating rangeland vegetation dynamics in the continental United States, models annual production based on the MODIS normalized difference vegetation index (NDVI) at a 250 m spatial resolution (MOD13Q1). The MOD13Q1 NDVI data are composited on a biweekly basis and are available at a spatial resolution of 250 m. The quality assurance/quality control (QA/QC) flags were used to isolate only the best-quality NDVI pixels. At each pixel, the highest-quality maximum value composite on an annual basis was retained for further analysis. The relationships between the estimates of annual net primary production (ANPP) and maximum NDVI were divided into two groups to enable different models to be fit to the upper and lower ends of production. The upper and lower ends of production are given as follows:
where y is the estimated ANPP (in kg ha−1 of dry weight), and x is the NDVI for the upper range (x≥0.46); and
where y is the estimated ANPP (in kg ha−1), and x is the NDVI for the lower range (x<0.46). The partitioning into two groups was done, in part, because of the asymptotic nature or “saturation” feature (Santin-Janin et al., 2009) of NDVI with respect to ANPP.
Land cover
The MODIS land cover product (MCD12Q1) Version 6 was used to assess factors affecting the burned area in Kazakhstan. The product is available at a 500 m spatial resolution and describes the distribution of broad vegetation types. We screened these data to subset only those vegetation types considered to represent grassland vegetation (Class 10 in the MCD12Q1 dataset) from 2000 to 2016. In each year of the assessment, the number of grassland pixels was summed to enable estimates of grassland area throughout the study area.
2.4 Statistical analysis
For each ∘ pixel, the annual trend (Fig. 2) was estimated as the robust linear slope computed from burned area on year using M-estimation as described in Huber (1981). Our objective was to present consistent grid cell trends in the presence of within-cell variation. We chose to use M-estimation to mitigate the effect of large within-cell variation due to a relatively small within-cell samples such that the map presents a consistent surface. If computed using ordinary least squares (OLS) estimates, such large within-cell variation could result in some cells having inconsistent or “outlier” trends compared with their neighbors. The trends were estimated using the R platform (R Core Team, 2019) with the rlm R function in the MASS package (Venables and Ripley, 2002). Pairwise robust rank correlations (Figs. 5, 6) were computed as described in Kendall (1938) using the cor R function.
To validate our estimates on burned areas, we compare our annual northern Eurasian burned areas from the Forest Service Fire Emission Inventory – Northern Eurasia (FEI-NE) with the latest version of the MODIS burned area product (MCD64A1, Collection 6; Giglio et al., 2018) from 2002 to 2016 (Fig. 3). The burned areas reported by FEI-NE and MODIS MCD64 were each modeled separately by year. The models each include a first-order autoregressive term on the residuals to account for the presence of temporal autocorrelation. The response was assumed to be gamma distributed (Bickel and Doksum, 2015). A generalized linear mixed model (GLMM) approach was used that was estimated with the glmmTMB R function (R Core Team, 2019) in the glmmTMB R package (Brooks et al., 2017).
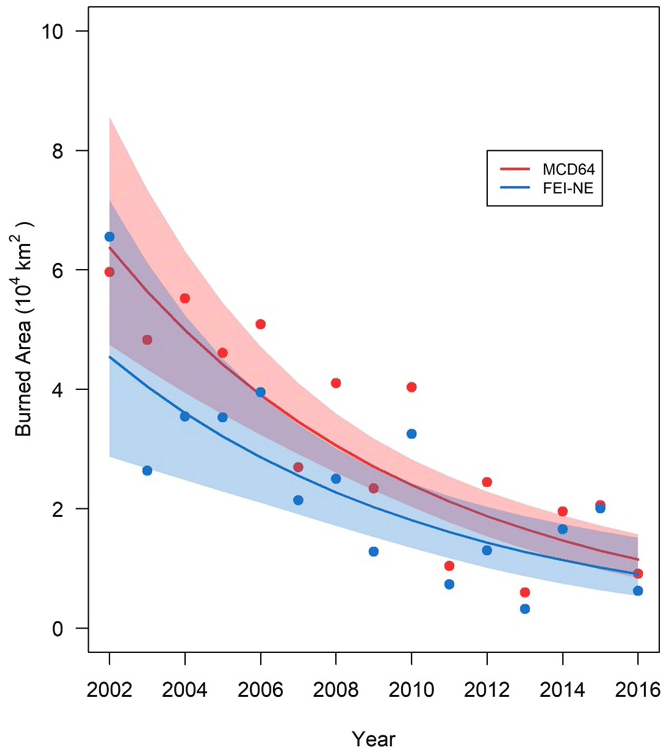
Figure 3Comparison of burned areas between the Forest Service Fire Emission Inventory – Northern Eurasia (FEI-NE) dataset and MODIS MCD64. The FEI-NE (blue) and MCD64 (pink) bands illustrate the 95 % confidence intervals.
The potential driving forces of burned area at the county level for 174 counties over a period of 15 years from 2002 to 2016 were modeled using the GLMM approach to interpret the effects on the extent of the area burned. The proportion of burned area per county was modeled on the effects of year, PDSI during the fire season (May–July), proportion of grass area, ANPP and livestock density along with two-way interactions. The model included a random effect that accounts for spatial correlation within each region along with a first-order autoregressive term on the residuals within each county that accounts for temporal autocorrelation. The response was assumed to be beta distributed (Bickel and Doksum, 2015). The model was estimated with the glmmTMB R platform (R Core Team, 2019) in the glmmTMB R package (Brooks et al., 2017).
3.1 Spatial and temporal distribution of burned areas in northern Eurasia
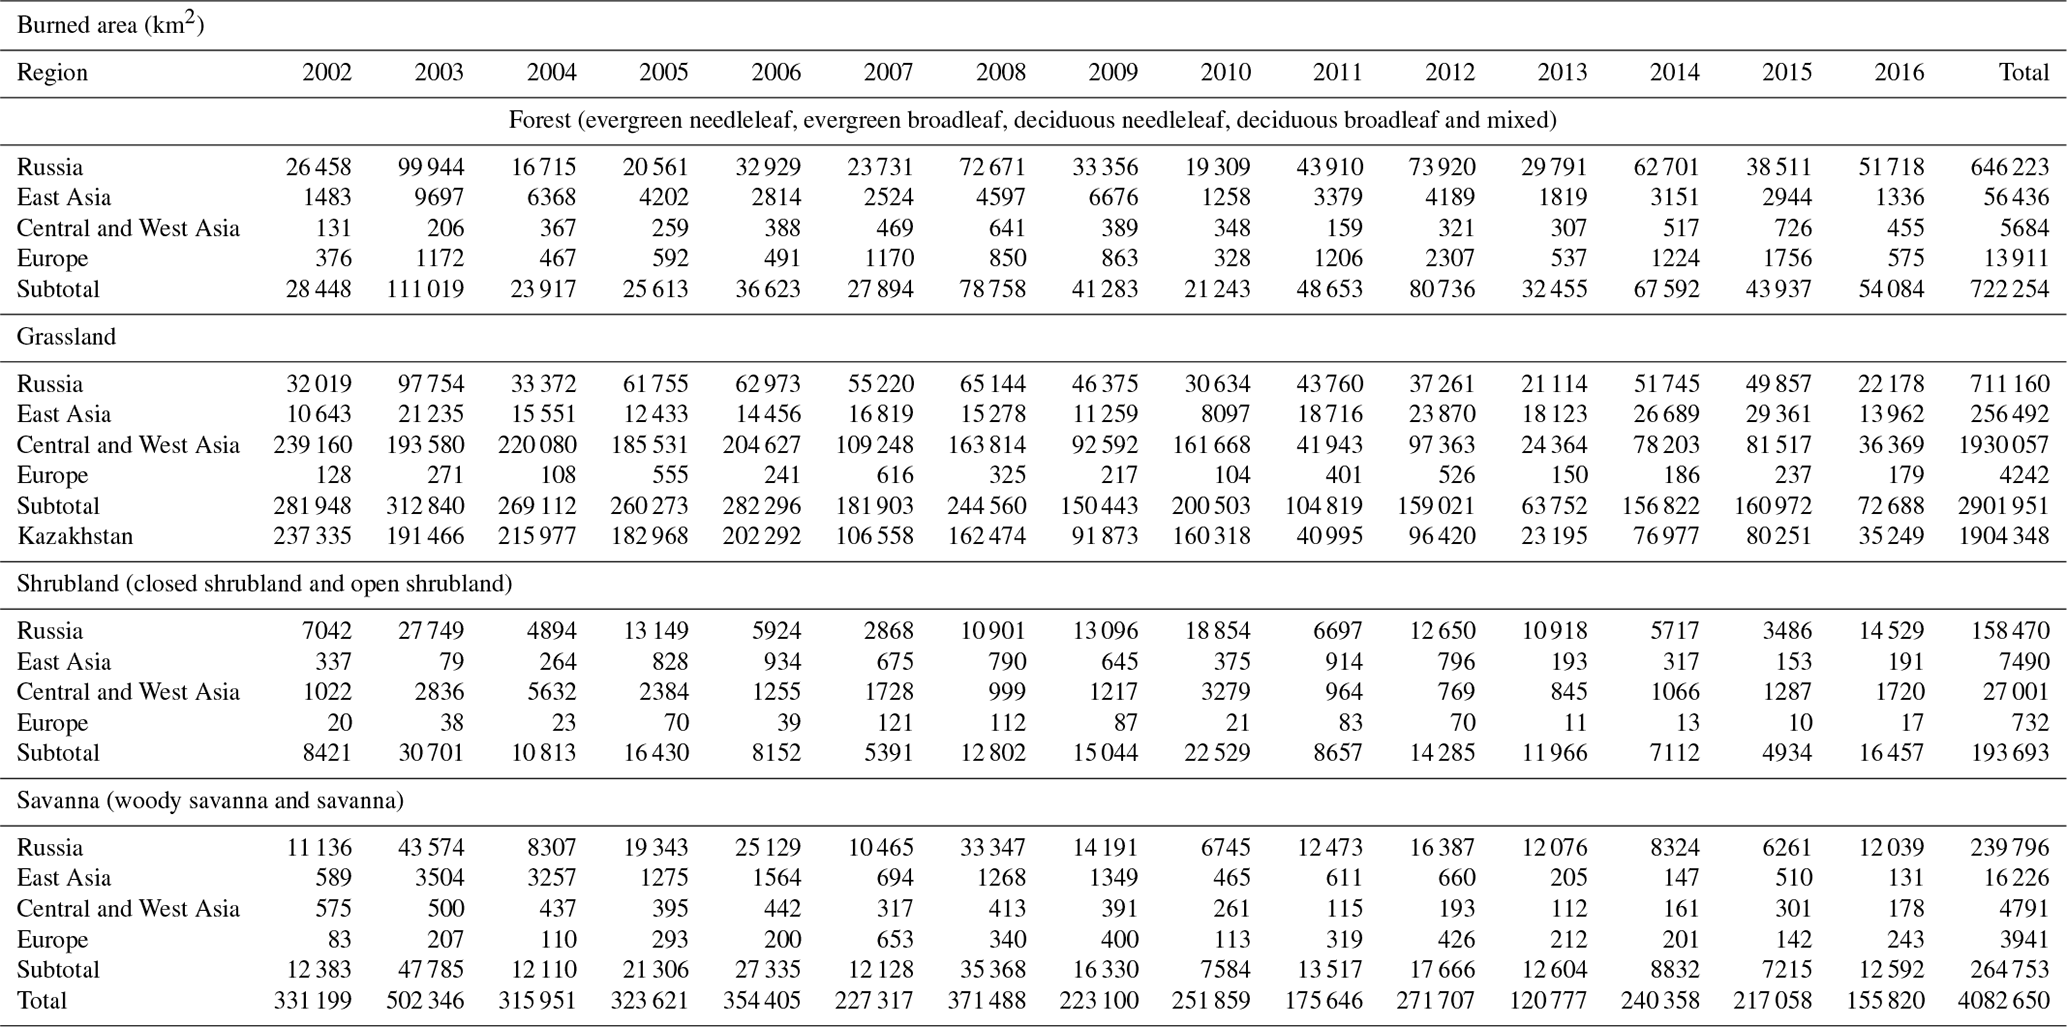
The declining trends in the spatial distribution of the area burned from 2002 to 2016 in northern Eurasia at a ∘ resolution are shown in Fig. 2. The majority of the area burned was grassland in Kazakhstan in central Asia. However, substantial areas were also burned in the Russian Far East along the Chinese border because of illegal logging (Vandergert and Newell, 2003) and the subsequent fires to burn the remaining forest residues. The annual areas burned according to ecosystem and geographic region are summarized in Table 1. The interannual burned area in northern Eurasia varied by about 4 times: from 5.0×10⁵ km2 in 2003 to 1.2×10⁵ km2 in 2013 with an average of km2 (n=15). Grassland accounted for 71 % of the total area burned, despite comprising only 16 % of the land cover (Friedl et al., 2010). Almost all of the grassland fires occurred in Kazakhstan in central and western Asia (Table 1). In contrast, forest is the major ecosystem that covers 27 % of northern Eurasia (Friedl et al., 2010), but it only contributes to 18 % of the total area burned. About 90 % of the forest area burned occurred in Russia.
Table 1The area burned in forest, grassland, shrubland and savanna in geographic regions from 2002 to 2016. The data of the area burned in Kazakhstan are listed for comparison only and are not included in the tabulation.
3.2 Trends in burned areas in northern Eurasia
Comparisons of our annual northern Eurasian burned areas (FEI-NE) with the latest version of the MODIS burned area product (MCD64A1, Collection 6; Giglio et al., 2018) from 2002 to 2016 are shown in Fig. 3. The burned areas in these two datasets agree better in recent years after 2010. Both FEI-NE and MCD64A1 demonstrated declining trends and similar interannual variability. The FEI-NE dataset was used to analyze the driving forces for the decline in burned area in Kazakhstan (see Sects. 3.3–3.4).
Grasslands of Kazakhstan dominate changes in burned area with significant declines mostly in central and northern Kazakhstan, adjacent to the Russian border. The temporal trend in annual burned areas over all vegetation types and in grasslands in northern Eurasia and in Kazakhstan from 2002 to 2016 are shown in Fig. 4. The burned area trends shown in Fig. 4 were modeled in the same way as those reported in Fig. 3, with the same response distribution. The trends in wave-like burned areas are typical for burned area trends worldwide (e.g., Andela et al., 2017). The annual total area burned over northern Eurasia during this period decreased by 53 %, from 3.3×10⁵ km2 in 2002 to 1.6×10⁵ km2 in 2016 (Table 1), or at a rate of 1.2×10⁴ km2 (or 3.5 %) yr−1. The grassland area burned during the 15 years declined by 74 %, from 2.8×10⁵ km2 in 2002 to 7.3×10⁴ km2 in 2016, or at a rate of 1.3×10⁴ km2 (or 4.9 %) yr−1. Grassland fires in Kazakhstan accounted for 47 % of the total areas burned but contributed to 84 % of the declining trend. The annual forest burned area varied by a factor of 5, from 21 243 km2 in 2010 to 111 019 km2 in 2003, but there is no trend over the 15 years (Table 1).
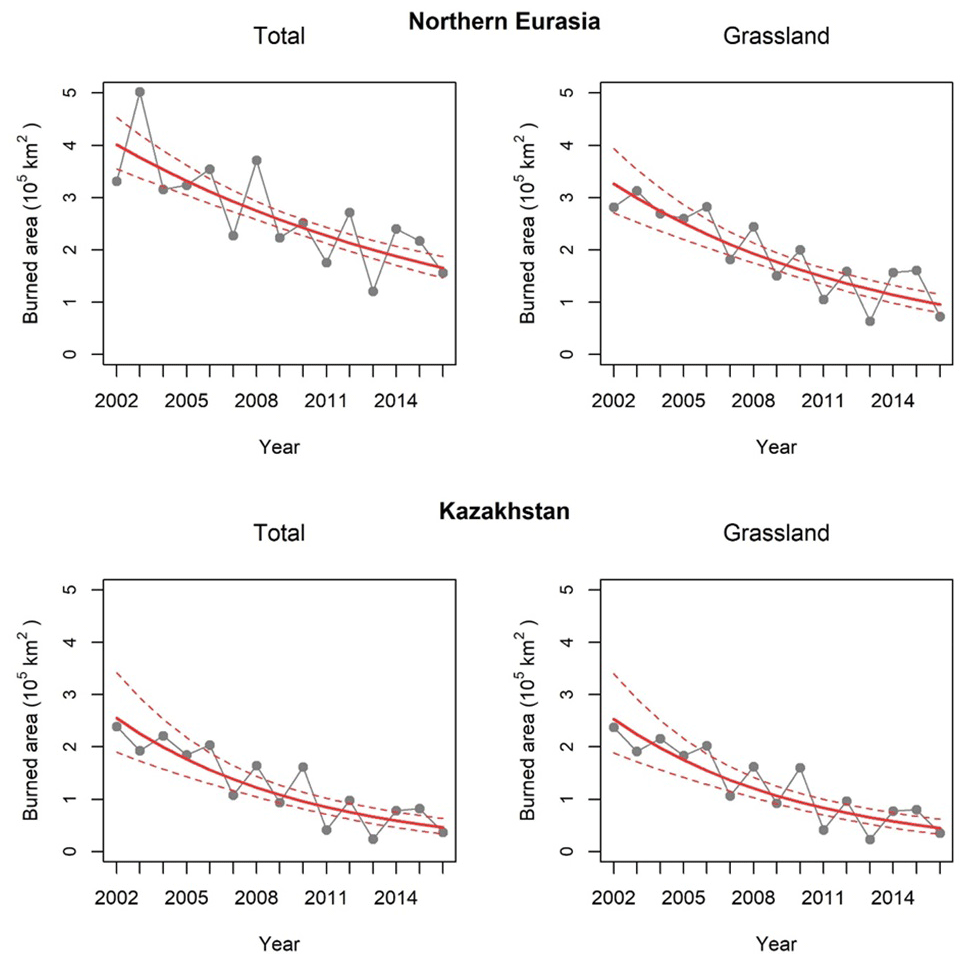
Figure 4Declining trends in the total area and grassland area burned in northern Eurasia (including Kazakhstan) and Kazakhstan from 2002 to 2016. The solid lines are the trend lines, and the dotted lines are 95 % confidence intervals.
3.3 Regional trends in driving forces over time in Kazakhstan
One of our objectives was to evaluate trends in the primary drivers responsible for reducing area burned, especially in grasslands at the county level. Pairwise correlation results are shown in Fig. 5. Each panel in Fig. 5 illustrates the coefficient of correlation between a key variable and year (2002–2016) for the 174 counties of Kazakhstan. The major factors affecting the trend in area burned in Kazakhstan are wetter climate (represented as PDSI), the proportion of grassland cover, ANPP and livestock density (Table 2). Both grassland partition and ANPP enable spreading fires.
Table 2Model parameters and associated p values.
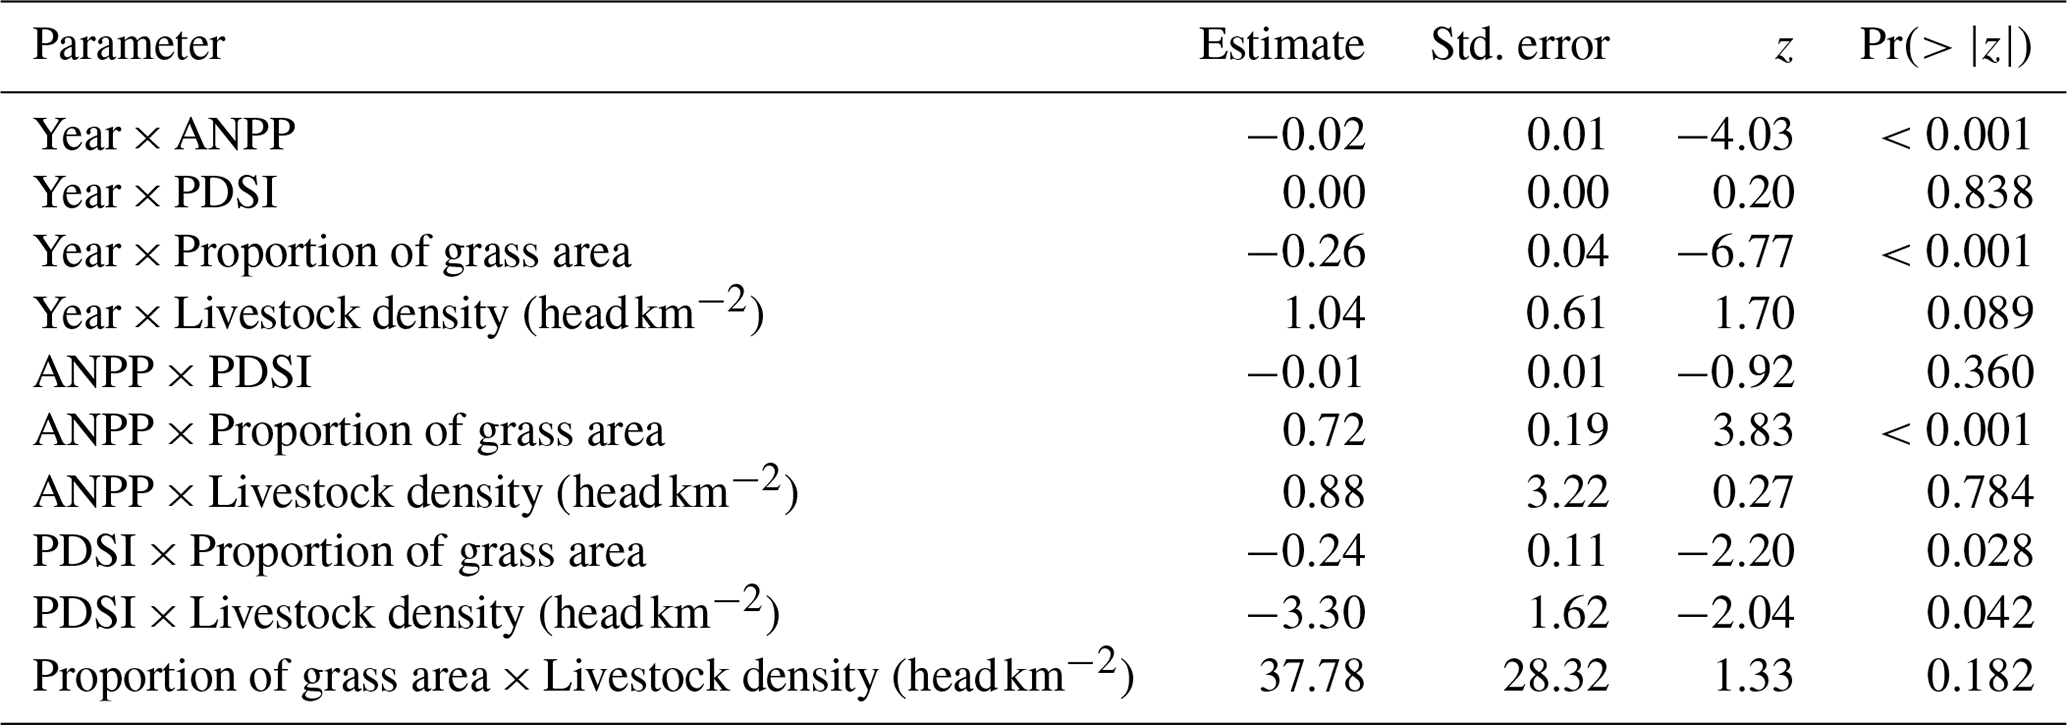
“Estimate” denotes a parameter estimate from GLMM, “Std. error” refers to the standard error of the parameter estimate, “z” is the z statistic, and “Pr(>|z|)” is the p value.
The declining trends in the fraction of the area burned annually are shown in Fig. 5a. The trend in PDSI from March to July during the 15-year period is illustrated in Fig. 5b. A higher PDSI value indicates a wetter environment. Increasing wetness, i.e., higher PDSI, during the fire season reduces the probability of fire ignition and fire spread. The declining trend in the burned area (Fig. 5a) is then consistent with the increasing trend in PDSI (wet conditions), especially in central and southern Kazakhstan (e.g., East Kazakhstan, Qaraghandy, Zhambyl and Almaty) (Fig. 5b).
Through time, the proportion of grassland cover has been asymmetric with some counties having exhibited strong decreases, such as in the north-central region of Kazakhstan, while others have seen increases, such as in the northwestern region (Fig. 5c). This north-central region has also exhibited decreases in burned area (Fig. 5a). Similarly, some regions have shown increasing trends in grassland cover through time without commensurate increases in the proportion of burned area (Fig. 5a, c).
The impacts of year, PDSI, land cover, ANPP and livestock density on the extent of the area burned and the correlations of burned area with these driving forces are illustrated in Fig. 6. Area burned and PDSI were negatively correlated in most of the counties in Kazakhstan (Fig. 6b). Therefore, as Kazakhstan becomes wetter during the fire season, the area burned declined over the 2002–2016 period. At the same time, grassland cover decreased across most of Kazakhstan, with a notable exception being the north-central and southwestern regions (Fig. 6c). The ANPP decreased with time over most of Kazakhstan, with the exception being the central and southwestern counties (Fig. 6d).
Finally, we investigated livestock density as a potential non-climatic driver affecting fuel amount. The population density of livestock increased with time in all counties and was greatest in the central, northern and southern counties of Qostanay, Pavlodar and Qaraghandy (Fig. 5e). The coupling of livestock density with PDSI affected the extent of the area burned (Fig. S1.4 in the Supplement) with p=0.042 (Table 2). The area burned was negatively correlated with the population of livestock throughout nearly all of Kazakhstan (Fig. 6e). This observation suggests that the increasing population of grazing livestock may have reduced fuel-bed continuity, contributing to the decrease in the area burned in Kazakhstan. Since 2000, the numbers of sheep, goats and cattle have increased by 60 % in Kazakhstan based on MANE statistics (2019) (Figs. S2 and S3 in the Supplement). Thus, increased livestock grazing could decrease the amount of herbaceous fuel across the landscape and offset increases in fuel quantity due to expanded grassland cover. The net result would be reductions in fire spread and the area burned.
3.4 Interactions of driving forces
The driving forces (e.g., year, PDSI, proportion of grassland cover, ANPP and livestock density) for the decline in the burned areas in Kazakhstan from 2002 to 2016 are interrelated. It is, therefore, critical to evaluate their interactions. For instance, Figs. S1.1–S1.4 illustrate the proportion of burned area affected by the interactions of the driving forces in 174 counties over 15 years (see table Table 2 for more information).
3.4.1 Proportion of grassland cover and year
Both year and the proportion of grassland area had significant effects on burned area when they interacted (Table 2, p<0.001). When the proportion of grassland cover in a county was very low (e.g., 0.48 %), only about 0.6 % of the area was burned annually during the period from 2002 to 2016 (Fig. S1.1, upper left panel). On the contrary, when the grassland cover was 25 % or greater, the area burned declined steadily from 1.5 % in 2000 to 0.6 % in 2016 (Fig. S1.2 lower right panel). This observation is consistent with grassland enhancing the spread of fires in the absence of opposing factors.
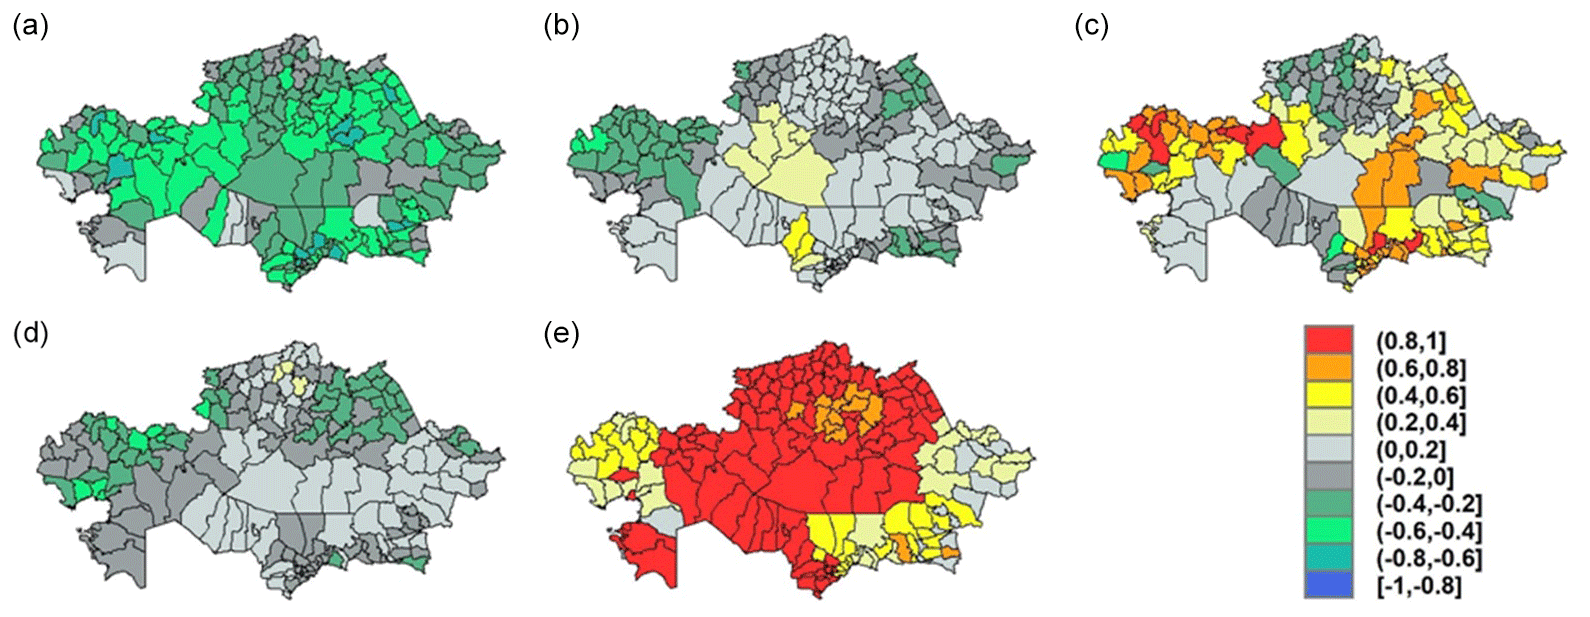
Figure 5Pairwise robust rank correlations of year with (a) fraction of burned area, (b) PDSI, (c) proportion of grassland layer, (d) ANPP and (e) livestock density without considering their interactions.
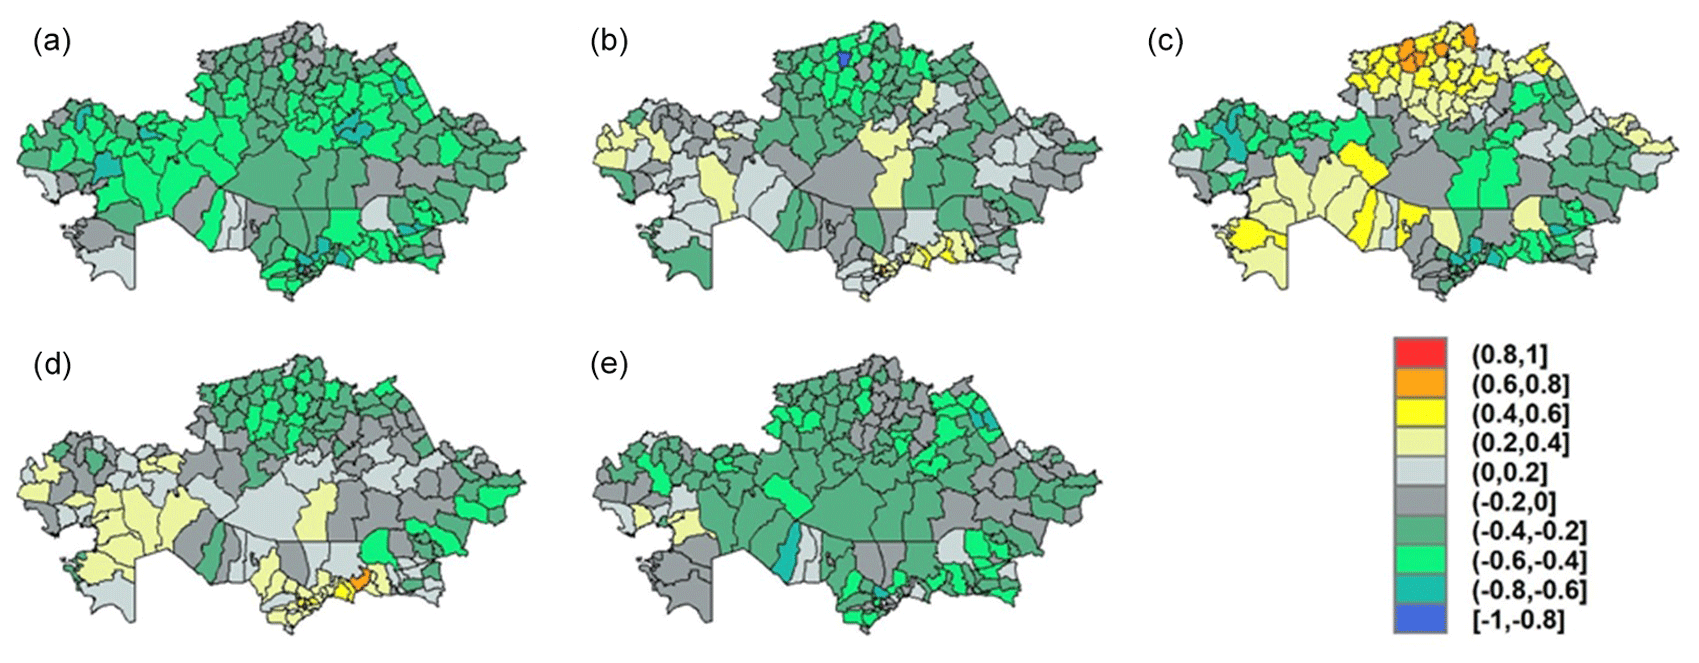
Figure 6Pairwise robust rank correlations of fraction of burned area with (a) year, (b) PDSI, (c) proportion of grassland layer, (d) ANPP and (e) livestock density without considering their interactions.
3.4.2 PDSI and the proportion of grassland area
Both the PDSI and the proportion of grassland area had significant effects on burned area when they interacted (Table 2, p=0.028). As in Fig. S1.2, for a PDSI ranging from −4.5 to ∼2, the percentage of the area burned remained at about 0.6 % for a grassland area of 0.5 % (upper left panel). On the other hand, when grassland cover was 60 %, the fraction of area burned declined from 2.2 % to 0.8 % (lower right panel). This analysis is consistent with grassland enhancing the spread of fires, as in the previous section discussing the proportion of grassland cover through time, and illustrates that increasing wetness significantly decreases burned area, mostly when grassland cover is high.
3.4.3 Livestock density and year
We investigated livestock density as a potential non-climatic driver affecting fuel amount and area burned. The effects of grazing on the area burned from 2002 to 2016 are shown in Table 2 (p=0.089). The declining trend in the area burned with time for different livestock densities are illustrated in Fig. S1.3. A higher livestock density results in less available biomass to burn and less area burned (lower right panel). This provides additional evidence that grazing could reduce the area burned in Kazakhstan.
3.4.4 PDSI and livestock density
The interaction between the PDSI and livestock was significant with respect to the area burned (p=0.042). Figure S1.4 shows the decline in the proportion of burned area with PDSI at different livestock densities. As the PDSI increases (wetter landscape), less area is burned. However, the declining trends differ with livestock density. This relationship is quite different for livestock densities of 0.002 (Fig. S1.4, upper left panel) and 0.05 head km−2 (Fig. S1.4, lower right panel). For instance, for a low PDSI (−4, dry), 1.5 % of the area was burned for all livestock densities. In contrast, at a high PDSI (+2, wet), the percentage of burned area decreases with increasing livestock density. Thus, the area burned is unaffected by grazing intensity during dry years, but during wet years with high biomass (based on our RVS analysis of Reeves, 2016), high grazing intensity tends to decrease burned area.
Burned area
The spatial and temporal extent of the area burned was examined in different ecosystems in northern Eurasia from 2002 to 2016, during which the average area burned was km2 yr−1. The burned area in grasslands declined by 74 %, from ∼282 000 km2 in 2002 to ∼73 000 km2 in 2016, at a rate of 1.3×10⁴ km2 yr−1. The area burned in forest showed no trend over time. Our burned area is higher than the MODIS MCD64 Collection 6, in which the average annual burned area was 9.7×10⁴ km2 in boreal Asia during the same period (Giglio et al., 2018). Boreal Asia in MCD64 has a similar geographic region to our northern Eurasia. Nevertheless, the interannual variability and the trends in burned area for the two datasets are consistent (Fig. 3).
Our results regarding burned area trends are consistent with other published results (Giglio et al., 2013; Hao et al., 2016a; Andela et al., 2017) which concluded that the area burned in northern Eurasia declined, contrary to the projections of increased fire frequency driven by climate change (Groisman et al., 2007; Kharuk et al., 2008). Uncertainty in global burned area remains a critical challenge, with trends and interannual variability reported by sensors and processing algorithms exhibiting large differences (Hantson et al., 2016; Chuvieco et al., 2019).
Grassland fires and grazing
Grassland fires in Kazakhstan accounted for 47 % of the total area burned but comprised 84 % of the decline in the total area burned in northern Eurasia during the 15 years from 2002 to 2016. The grassland fires are a human-induced issue caused by the production of fresh grass for grazing (Lebed et al., 2012) with a cycle of about every 2 years. A similar temporal pattern characterizes grassland fire occurrence on the African savanna (Hao and Liu, 1994; Andela and van der Werf, 2014).
Central Asia experienced tremendous socioeconomic change, with the collapse of the Soviet Union in the 1990s leading to a full restructure of the agricultural system, followed by a rapid collapse of cattle industry which has progressively recovered over the last 20 years (Figs. S2 and S3; Food and Agriculture Organization, 2016). This change has potentially altered the fuel available to burn, as observed in other ecosystems (Robinson and Milner-Gulland, 2003; Holdo et al., 2009; Vigan et al., 2017). The coincident decline in burned area with increasing livestock population suggests that changing agricultural practices may have exerted an influence on fire activity in Kazakhstan and northern Eurasia. In addition, a relationship between the livestock population and the burned area was observed in arid grassland in a small region of southern Russia from 1986 to 2006 (Dubinin et al., 2011). During this time period, the livestock population was negatively correlated with the area burned.
The fire activity data for Kazakhstan and Mongolia can be estimated from 1985 to 2017, as shown in Fig. 7, based on the recently released Advanced Very High Resolution Radiometer (AVHRR) long-term fire history (Otón et al., 2019). This new information extends the analysis to before our observed decrease during the 2002–2016 period and shows that fire activity only increased in Kazakhstan during the economic collapse and the associated reduction in livestock around the year 2000. This opposite trend supports our interpretation regarding the relationship between grazing and burned area, particularly when this variation in burned area is not clearly observed in neighboring Mongolia, where grazing collapse did not occur.

Figure 7Yearly burned area (in km2) in (a) Kazakhstan and (b) Mongolia for the 1982–2017 period based on the AVHRR LTDR (long-term data record) remotely sensed burned area of the FireCCI project (https://geogra.uah.es/fire_cci/fireccilt11.php, last access: 13 April 2021). The black line represents the mean burned fraction, and the gray area represents the burned area 95 % uncertainty delivered by FireCCILT10. The blue line represents the sheep and goat population for the 1994–2014 period. The red line represents the end year of the Soviet Union. Note that the scale of the area burned (y axis) in Kazakhstan (a) is 10 times greater than that in Mongolia (b).
In the steppe of neighboring Mongolia, overgrazing also affected fire activity from 1988 to 2008 (Liu et al., 2013) in a manner similar to Kazakhstan. However, extreme winter freezing and inadequate preparation affected the increasing livestock trend driven by the poorly prepared feeding of hay and foliage. This led to higher livestock reductions during the colder season than the average period of 2000 to 2014 (Nandintsetseg et al., 2018), highlighting the potential impact of climate on the livestock population in addition to human management decisions and practices (Xu et al., 2019).
We investigated grazing and land use as the main drivers of changes in fuel availability in grasslands that could abruptly impact the fire regime, as observed for Africa (Holdo et al., 2009; Andela et al., 2017) or globally over long periods (Marlon et al., 2008). Political changes can be associated with additional human processes affecting fire activity or fire spread. Among others, decreasing population density (−10 % observed in Kazakhstan after 1991) could decrease fire activity or suppression effort and firefighting capacities, as mentioned for the post-Soviet period (Mouillot and Field, 2005), as well as local conflicts potentially exacerbating fire ignitions, as observed in Africa (Bromley 2010). These effects might contribute less significantly than the direct effects of grazing and land use on fuel loading and the subsequent fire activity in the region. Gathering social information remains a challenge with respect to better understanding the human impact on fire activity.
Modeling fire and grazing interactions
Accounting for confounding factors related to burned area and the subsequent effects on ecosystems, biosphere–atmosphere interactions and climate have been a challenge in developing fire modules in global vegetation models (Hantson et al., 2016). Climate (drought, temperature and humidity), land cover and fuel amount are the main drivers related to fire activity in dynamic global vegetation models (DGVMs) coupled with human-related information such as population density and countries' wealth (Gross Domestic Product). Our understanding of land use dynamics (Prestele et al., 2017), especially forest management, fire prevention and grazing practices, is still developing (Rolinski et al., 2018), and better data assemblage and modeling processes are needed (Pongratz et al., 2018). In our study, we showed the strong impact of political events (here, the collapse of the political regime) on grazing intensity and the subsequent effect on fire activity. These stochastic events are hard to forecast and simulate so that DGVMs cannot fully capture long-term trends in burned area (Kloster et al., 2010; Yue et al., 2014) when compared with observed burned area reconstructions (Mouillot and Field 2005).
The Soviet economic collapse provides fruitful information on the potential amplitude and impact of grazing changes on ecosystem functioning. The 1998 Russian financial crisis led to a dramatic decrease in the consumption of livestock in neighboring countries such as in Kazakhstan. Both sheep and goats (Fig. S2) and cattle (Fig. S3) declined substantially from 1992 to 1998. As the economy improved after late 1990s, the consumption of livestock has grown steadily. Integrating grazing into DGVMs has recently emerged for global models (Chang et al., 2013; Pachzelt et al., 2015; Dangal et al. 2017) and for local studies (Bachelet et al., 2000; Caracciolo et al., 2017; Vigan et al., 2017). Grazing processes as implemented in DGVMs can capture the climate impact on livestock populations which could be affected by climate extremes (Nandintsetseg et al., 2018) and lack of forage or water (Tachiiri and Shinoda 2012; Vrieling et al., 2016). However, they still lack abrupt and stochastic changes in the projections of socioeconomic processes or infectious disease potentially affecting livestock density, as shown in Africa by Holdo et al. (2009) after rinderpest virus curation.
Paleo-fire reconstructions have already captured grazing as a keystone process through dung fungi spore residues in sediments (Cordova et al. 2019). Current modeling developments cover disease projections (Perry et al. 2013), and modeling efforts are increasingly devoted to the more complex human aspect, including human consumption behavior, inequality, and subsequent potential issues (Motesharrei et al. 2016) or social conflicts (Neumann et al. 2011). Our study demonstrates that grazing can be highly variable as a fast response to or abrupt change in agricultural policies or political regime. These abrupt changes can have a significant impact on fire activity. Better integration of human process on grazing activities in DGVMs, even as stochastic events, would capture this important process to account for probable political collapse/agricultural policies, societal decisions or widespread animal diseases. These improbable factors could affect the future global carbon budget.
The spatial and temporal extent of the area burned was examined in different ecosystems in northern Eurasia from 2002 to 2016. We conclude that the burned area in grasslands declined 74 %, from ∼282 000 km2 in 2002 to ∼73 000 km2 in 2016, or at a rate of 1.3×10⁴ km2 yr−1. The area burned in forest did not show a trend. Grassland fires in Kazakhstan accounted for 47 % of the total area burned but comprised 84 % of the decline in the total area burned in northern Eurasia during the 15 years. A wetter climate and the increase in grazing livestock in Kazakhstan are the major factors contributing to the decline in the area burned in northern Eurasia. The population of livestock increased in most of Kazakhstan from 2002 to 2016, decreasing the burned area due to fuel removal from grazing. The major factors affecting the availability of the fuels resulting in the decline in burned area are climate, the proportion of the grassland cover, the aboveground net primary production and the livestock density. These factors interact to reduce the area burned in Kazakhstan, especially in grasslands.
All data and materials are available in the paper or Supplement. The original geospatial dataset of the burned area is large and will be made available upon reasonable request. However, a derived dataset has been used to estimate black carbon emissions from fires in the same region. This dataset has been archived on the Forest Service Data Archive website (https://doi.org/10.2737/RDS-2016-0036; Hao et al., 2016b).
The supplement related to this article is available online at: https://doi.org/10.5194/bg-18-2559-2021-supplement.
WMH led both the project and the writing of the paper. MCR simulated aboveground biomass ANPP and offered advice on the statistical analysis. LSB was responsible for the statistical analysis. YB, PC and FM suggested the use of the PDSI and livestock population to explain the declining burned areas. BLN analyzed the data and contributed certain figures. AP mapped the burned areas. REC conducted GIS analysis. SPU offered advice on the execution of the project. CY advised on the trend in the burned areas. All authors contributed to writing the paper.
The authors declare that they have no conflict of interest.
Wei Min Hao received funding from the US Department of State, the US Forest Service Research and Development, and the NASA Terrestrial Ecology Program. Yves Balkanski and Philippe Ciais received funding from the European Union's Horizon 2020 Research and Innovation program (grant no. 641816; CRESCENDO). Florent Mouillot received funding from the European Space Agency FireCCI program.
This research has been supported by the European Union's Horizon 2020 Research and Innovation program (grant no. 641816; CRESCENDO), the European Space Agency (FireCCI program), the Department of State, the US Forest Service Research and Development, and the NASA Terrestrial Ecology Program.
This paper was edited by Nicolas Brüggemann and reviewed by two anonymous referees.
Abatzoglou, J. T. and Kolden, C. A.: Relationships between climate and macroscale area burned in the western United States, Int. J. Wildland Fire, 22, 1003–1020, https://doi.org/10.1071/WF13019, 2013.
Abatzoglou, J. T., Dobrowski, S. Z., Parks, S. A., and Hegewisch, K. C.: Terraclimate, a high-resolution global dataset of monthly climate and climatic water balance from 1958–2015, Sci. Data, 5, 170191, https://doi.org/10.1038/sdata.2017.191, 2018.
Andela, N. and van der Werf, G. R.: Recent trends in African fires driven by cropland expansion and El Niño to La Niña transition, Nat. Clim. Change, 4, 791–795, https://doi.org/10.1038/nclimate2313, 2014.
Andela, N., Morton, D. C., Giglio, L., Chen, Y., van der Werf, G. R., Kasibhatla, P. S., DeFries, R. S., Collatz, G. J., Hantson, S., Kloster, S., Bachelet, D., Forrest, M., Lasslop, G., Li, F., Mangeon, S., Melton, J. R., Yue, C., and Randerson, J. T.: A human-driven decline in global burned area, Science, 356, 1356–1362, https://doi.org/10.1126/science.aal4108, 2017.
Archibald, S., Roy, D. P., van Wilgen, B. W., and Scholes, R. J.: What limits fire? An examination of drivers of burnt area in Southern Africa, Glob. Change Biol., 15, 613–630, https://doi.org/10.1111/j.1365-2486.2008.01754.x, 2009.
Bachelet, D., Lenihan, J. M., Daly, C., and Neilson, R. P.: Interactions between fire, grazing and climate change at Wind Cave National Park, SD, Ecol. Model., 134, 229–244, https://doi.org/10.1016/S0304-3800(00)00343-4, 2000.
Bickel, P. J. and Doksum, K. A.: Mathematical Statistics: Basic Ideas and Selected Topics, Volume I, Chapman & Hall/CRC Texts in Statistical Science, 2nd Edition, Mathematical Statistics, Taylor & Francis Group, New York, 2015.
Bromley, L.: Relating violence to MODIS fire detections in Darfur Sudan, Int. J. Remote Sens., 31, 2277–2292, https://doi.org/10.1080/01431160902953909, 2010.
Brooks, M. E., Kristensen, K., van Benthem, K. J., Magnusson, A., Berg, C. W., Nielsen, A., Skaug, H. J., Machler, M., and Bolker, B. M.: glmmTMB balances speed and flexibility among packages for zero-inflated generalized linear mixed modeling, The R Journal, 9, 378–400, 2017.
Caracciolo, D., Istanbulluoglu, E., and Noto, L. V.: An ecohydrological cellular automata model investigation of juniper tree encroachment in a western north American landscape, Ecosystems, 20, 1104–1123, https://doi.org/10.1007/s10021-016-0096-6, 2017.
Chang, J. F., Viovy, N., Vuichard, N., Ciais, P., Wang, T., Cozic, A., Lardy, R., Graux, A.-I., Klumpp, K., Martin, R., and Soussana, J.-F.: Incorporating grassland management in ORCHIDEE: model description and evaluation at 11 eddy-covariance sites in Europe, Geosci. Model Dev., 6, 2165–2181, https://doi.org/10.5194/gmd-6-2165-2013, 2013.
Chuvieco, E., Mouillot, F., van der Werf, G. R., San Miguel, J., Tanase, M., Koutsias, N., García, M., Yebra, M., Padilla, M., Gitas, I., Heil, A., Hawbaker, T. J., and Giglio, L.: Historical background and current developments for mapping burned area from satellite Earth observation, Remote Sens. Environ., 225, 45–64, https://doi.org/10.1016/j.rse.2019.02.013, 2019.
Cordova, C. E., Kirsten, K. L., Scott, L., Meadows, M., and Lucke, A.: Multi-proxy evidence of late Holocene paeloenvrionmental change at Princessvlei, South Africa, The effect of fire, herbivores and humans, Quat. Sci. Rev., 221, 105896, https://doi.org/10.1016/j.quascirev.2019.105896, 2019.
Cowtan, K. and Way, R. G.: Coverage bias in the HadCRUT4 temperature series and its impact on recent temperature trends, Q. J. Roy. Meteorol. Soc., 140, 1935–1944, https://doi.org/10.1002/qj.2297, 2014.
Dangal, S. R. S., Tian, H., Lu, C., Ren, W., Pan, S., Yang, J., Di Cosmo, N., and Hessl, A.: Integrating herbivore population dynamics into a global land biosphere model: plugging animals into the earth system, J. Adv. Model. Earth Sy., 9, 2920–2945, https://doi.org/10.1002/2016MS000904, 2017.
Dubinin, M., Luschekina, A., and Radeloff, V. C.: Climate, livestock, and vegetation: what drives fire increase in the arid ecosystems of southern Russia?, Ecosystems, 14, 547–562, https://doi.org/10.1007/s10021-011-9427-9, 2011.
Evangeliou, N., Balkanski, Y., Hao, W. M., Petkov, A., Silverstein, R. P., Corley, R., Nordgren, B. L., Urbanski, S. P., Eckhardt, S., Stohl, A., Tunved, P., Crepinsek, S., Jefferson, A., Sharma, S., Nøjgaard, J. K., and Skov, H.: Wildfires in northern Eurasia affect the budget of black carbon in the Arctic – a 12-year retrospective synopsis (2002–2013), Atmos. Chem. Phys., 16, 7587–7604, https://doi.org/10.5194/acp-16-7587-2016, 2016.
Food and Agriculture Organization FAOSTAT Live Animals Database, http://www.fao.org/faostat/en/#home (last access: 12 April 2021), 2016.
Friedl, M. A., Sulla-Menashe, D., Tan, B., Schneider, A., Ramankutty, N., Sibley, A., and Huang, X.: MODIS collection 5 global land cover: algorithm refinements and characterization of new datasets, Remote Sens. Environ., 114, 168–182, https://doi.org/10.1016/j.rse.2009.08.016, 2010.
Fyfe, J. C., Gillett, N. P., and Zwiers, F. W.: Overestimated global warming over the past 20 years, Nat. Clim. Change, 3, 767–769, https://doi.org/10.1038/nclimate1972, 2013.
Fyfe, J. C., Meehl, G. A., England, M. H., Mann, M, E., Santer, B. D., Flato, G. M., Hawkins, E., Gillett, N. P., Xie, S.-P., Kosaka, Y., and Swart, N. C: Making sense of the early-2000s warming slowdown. Nat. Clim. Change 6, 224–228, https://doi.org/10.1038/nclimate2938, 2016.
Gedalof, Z., Peterson, D. L., and Mantua, N. J.: Atmospheric, climatic, and ecological controls on extreme wildfire years in the northwestern United States, Ecol. Appl., 15, 154–174, https://doi.org/10.1890/03-5116, 2005.
Giglio, L., Randerson, J. T., and van der Werf, G. R.: Analysis of daily, monthly, and annual burned area using the fourth-generation global fire emissions database (GFED4), J. Geophys. Res.-Biogeo., 118, 317–328, https://doi.org/10.1002/jgrg.20042, 2013.
Giglio, L., Boschetti, L., Roy, D., Humber, M. L., and Justice, C. O.: The collection 6 MODIS burned are mapping algorithm and product, Remote Sens. Environ., 217, 72–85, https://doi.org/10.1016/j.rse.2018.08.005, 2018.
Goetz, S. J., MacK, M. C., Gurney, K. R., Randerson, J. T., and Houghton, R. A.: Ecosystem responses to recent climate change and fire disturbance at northern high latitudes: observations and model results contrasting northern Eurasia and North America, Environ. Res. Lett., 2, 045031, https://doi.org/10.1088/1748-9326/2/4/045031, 2007.
Goldammer, J. G., Stocks, B. J., Sukhinin, A. I., and Ponomarev, E.: Current fire regimes, impacts and likely challenges – II: forest fires in Russia – past and current trends, in: Vegetation Fires and Global Change, edited by: Goldammer, J. G., Freiburg, Germany, 51–78, 2013.
Groisman, P. Y., Sherstyukov, B. G., Razuvaev, V. N., Knight, R. W., Enloe, J. G., Stroumentova, N. S., Whitfield, P. H., Førland, E., Hannsen-Bauer, I., Tuomenvirta, H., Aleksandersson, H., Mescherskaya, A. V., and Karl, T. R.: Potential forest fire danger over Northern Eurasia: Changes during the 20th century, Global Planet. Change, 56, 371–386, https://doi.org/10.1016/j.gloplacha.2006.07.029, 2007.
Hantson, S., Arneth, A., Harrison, S. P., Kelley, D. I., Prentice, I. C., Rabin, S. S., Archibald, S., Mouillot, F., Arnold, S. R., Artaxo, P., Bachelet, D., Ciais, P., Forrest, M., Friedlingstein, P., Hickler, T., Kaplan, J. O., Kloster, S., Knorr, W., Lasslop, G., Li, F., Mangeon, S., Melton, J. R., Meyn, A., Sitch, S., Spessa, A., van der Werf, G. R., Voulgarakis, A., and Yue, C.: The status and challenge of global fire modelling, Biogeosciences, 13, 3359–3375, https://doi.org/10.5194/bg-13-3359-2016, 2016.
Hao, W. M. and Liu, M.-H.: Spatial and temporal distribution of tropical biomass burning, Global Biogeochem. Cy., 8, 495–503, https://doi.org/10.1029/94GB02086, 1994.
Hao, W. M., Petkov, A., Nordgren, B., Corley, R. E., and Urbanski, S. P.: Comparison of MODIS-derived burned area algorithm with Landsat images in eastern Siberia, Russia. in: Proceedings of the 2012 International Emission Inventory Conference: Emission Inventories – Meeting the Challenges Posed by Emerging Global, National, Regional and Local Air Quality Issues, Tampa, FL, 13–16 August, 2012.
Hao, W. M., Petkov, A., Nordgren, B. L., Corley, R. E., Silverstein, R. P., Urbanski, S. P., Evangeliou, N., Balkanski, Y., and Kinder, B. L.: Daily black carbon emissions from fires in northern Eurasia for 2002–2015, Geosci. Model Dev., 9, 4461–4474, https://doi.org/10.5194/gmd-9-4461-2016, 2016a.
Hao, W. M., Petkov, A., Nordgren, B. L., Corley, R. E., Silverstein, R. P., and Urbanski, S. P.: Daily black carbon emissions data from fires in Northern Eurasia for 2002–2015, Forest Service Research Data Archive, https://doi.org/10.2737/RDS-2016-0036, 2016b.
Holdo, R. M., Holt, R. D., and Fryxell, J. M.: Grazers, browsers, and fire influence the extent and spatial pattern of tree cover in the Serengeti, Ecol. Appl., 19, 95–109, https://doi.org/10.1890/07-1954.1, 2009.
Huber, P. J.: Robust Statistics, in Wiley series in probability and mathematics statistics, John Wiley & Sons, New York, 1981.
IPCC: Climate Change 2013: The Physical Science Basis. Contribution of Working Group I to the Fifth Assessment Report of the Intergovernmental Panel on Climate Change, edited by: Stocker, T. F., Qin, D., Plattner, G.-K., Tignor, M., Allen, S. K., Boschung, J., Nauels, A., Xia, Y., Bex, V., and Midgley, P. M., Cambridge University Press, Cambridge, United Kingdom and New York, NY, USA, 1535 pp., 2013.
IPCC: Climate Change 2014: Synthesis Report. Contribution of Working Groups I, II and III to the Fifth Assessment Report of the Intergovernmental Panel on Climate Change, edited by: Core Writing Team, Pachauri, R. K. and Meyer, L. A., IPCC, Geneva, Switzerland, 151 pp., 2014.
Jolly, W. M., Cochrane, M. A., Freeborn, P. H., Holden, Z. A., Brown, T. J., Williamson, G. J., and Bowman, D. M. J. S.: Climate-induced variations in global wildfire danger from 1979 to 2013, Nat. Commun., 6, 7537, https://doi.org/10.1038/ncomms8537, 2015.
Jones, P. D., Parker, D. E., Osborn, T. J., and Briffa, K. R.: Global and hemispheric temperature anomalies: land and marine instrumental records (1850–2015), https://doi.org/10.3334/CDIAC/cli.002, 2016.
Kendall, M. G: A new measure of rank correlation, Biometrika, 30, 81–93, 1938.
Kharuk, V. I., Ranson, K. Jon, and Dvinskaya, M. L.: Wildfires dynamic in larch dominance zone, Geophys. Res. Lett., 35, L01402, https://doi.org/10.1029/2007GL032291, 2008.
Kloster, S., Mahowald, N. M., Randerson, J. T., Thornton, P. E., Hoffman, F. M., Levis, S., Lawrence, P. J., Feddema, J. J., Oleson, K. W., and Lawrence, D. M.: Fire dynamics during the 20th century simulated by the Community Land Model, Biogeosciences, 7, 1877–1902, https://doi.org/10.5194/bg-7-1877-2010, 2010.
Koerner, S. E. and Collins, S. L.: Interactive effects of grazing, drought, and fire on grassland plant communities in North America and South Africa, Ecology, 95, 98–109, https://doi.org/10.1890/13-0526.1, 2014.
Krawchuk, M. A. and Moritz, M. A.: Constraints on global fire activity vary across a resource gradient, Ecology, 92, 121–132, https://doi.org/10.1890/09-1843.1, 2011.
Lebed, L. V., Qi, J., and Heilman, P.: An ecological assessment of pasturelands in the Balkhash area of Kazakhstan with remote sensing and models, Env. Res. Lett., 7, 025203, https://doi.org/10.1088/1748-9326/7/2/025203, 2012.
Liu, Yi. Y., Evans, J. P., McCabe, M. F., de Jeu, R. A. M., van Dijk, A. I. J. M., Dolman, A. J., and Saizen, I.: Changing climate and overgrazing are decimating Mongolian steppes, PLoS ONE, 8, e57599, https://doi.org/10.1371/journal.pone.0057599, 2013.
MANE: National Economy of the Republic of Kazakhstan Committee on Statistics, http://www.stat.gov.kz/faces/wcnav_externalId/homeNumbersAgriculture (last access: 9 April 2021), 2019.
Marlon, J. R., Bartlein, P. J., Carcaillet, C., Gavin, D, G., Harrison, S. P., Higuera, P. E., Joos, F., Power, M. J., and Prentice, I. C.: Climate and human influences on global biomass burning over the past two millennia, Nat. Geosci., 1, 697–702, https://doi.org/10.1038/ngeo313, 2008.
Moritz, M. A., Morais, M. E., Summerell, L. A., Carlson, J. M., and Doyle, J.: Wildfires, complexity, and highly optimized tolerance, Proc. Natl. Acad. Sci. USA, 102, 17912–17917, https://doi.org/10.1073/pnas.0508985102, 2005.
Motesharrei, S., Rivas, J., Kalnay, E., Asrar, G. R., Busalacchi, A. J., Cahalan, R. F., Cane, M. A, Colwell, R. R., Feng, K., Franklin, R. S., Hubacek, K., Miralles-Wilhelm, F., Miyoshi, T., Ruth, M., Sagdeev, R., Shirmohammadi, A., Shukla, J., Srebric, J., Yakovenko, V. M., and Zeng, N.: Modeling sustainability: population, inequality, consumption, and bidirectional coupling of the earth and human systems, Natl. Sci. Rev., 3, 470–494. https://doi.org/10.1093/nsr/nww081, 2016.
Mouillot, F. and Field, C. B.: Fire history and the global carbon budget: a fire history reconstruction for the 20th century, Glob. Change Biol., 11, 398–420, https://doi.org/10.1111/j.1365-2486.2005.00920.x, 2005.
Mouillot, F., Schultz, M. G., Yue, C., Cadule, P., Tansey, K., Ciais, P., and Chuvieco, E.: Ten years of global burned area products from spaceborne remote sensing – a review: analysis of user needs and recommendations for future developments, Int. J. Appl. Earth Obs., 26, 64–79, https://doi.org/10.1016/j.jag.2013.05.014, 2014.
Nandintsetseg, B., Shinoda, M., Du, C., and Munkhjargal, E: Cold-season disasters on the Eurasian steppes: Climate-driven or man-made, Sci. Rep., 8, 14769, https://doi.org/10.1038/s41598-018-33046-1, 2018.
NASA Global Climate Change, https://climate.nasa.gov/vital-signs/global-temperature/ (last access: 12 September 2019), 2019.
Neumann, M., Braun, A., Heinke, E.-M., Saqalli, M., and Srbljinovic, A.: Challenges in modelling social conflicts: Grappling with polysemy, JASSS, 14, 9, https://doi.org/10.18564/jasss.1818, 2011.
Otón, G., Ramo, R., Lizundia-Loiola, J., and Chuvieco, E.: Global detection of long-term (1982–2017) burned area with AVHRR-LTDR data, Remote Sens., 11, 2079, https://doi.org/10.3390/rs11182079, 2019.
Pachzelt, A., Forrest, M., Rammig, A., Higgins, S. I, and Hickler, T.: Potential impact of large ungulate grazers on African vegetation, carbon storage and fire regimes, Global Ecol. Biogeogr., 24, 991–1002, https://doi.org/10.1111/geb.12313, 2015.
Palmer, W.: Meteorological drought, US Department of Commerce, Weather Bureau, Research Paper, 45, 58 pp., 1965.
Pausas, J. G. and Keeley, J. E.: Abrupt climate-independent fire regime changes, Ecosystems, 17, 1109–1120, https://doi.org/10.1007/s10021-014-9773-5, 2014.
Pausas, J. G. and Ribeiro, E.: The global fire-productivity relationship, Global Ecol. Biogeogr., 22, 728–736, https://doi.org/10.1111/geb.12043, 2013.
Perry, B. D., Grace, D., and Sones, K.: Current drivers and future directions of global livestock disease dynamics, Proc. Natl. Acad. Sci. USA. 110, 20871–20877, https://doi.org/10.1073/pnas.1012953108, 2013.
Pongratz, J., Dolman, H., Don, A., Erb, K.-H., Fuchs, R., Herold, M., Jones, C., Kuemmerle, T., Luyssaert, S., Meyfroidt, P., and Naudts, K.: Models meet data: Challenges and opportunities in implementing land management in earth system models, Glob. Change Biol., 24, 1470–1487, https://doi.org/10.1111/gcb.13988, 2018.
Prestele, R., Arneth, A., Bondeau, A., de Noblet-Ducoudré, N., Pugh, T. A. M., Sitch, S., Stehfest, E., and Verburg, P. H.: Current challenges of implementing anthropogenic land-use and land-cover change in models contributing to climate change assessments, Earth Syst. Dynam., 8, 369–386, https://doi.org/10.5194/esd-8-369-2017, 2017.
R Core Team: R: A language and environment for statistical computing, R Foundation for Statistical Computing, Vienna, Austria. https://www.R-project.org/ (last access: 31 December 2020), 2019.
Reeves, M. C.: Development of the rangeland vegetation simulator: A module of the forest vegetation simulator, Final report to the Joint Fire Science Program, Boise, Idaho, 2016.
Reeves, M. C., Hanberry, B. B., Wilmer, H., Kaplan, N. E., and Lauenroth, W. K.: An assessment of production trends on the Great Plains from 1984 to 2017, Rang. Ecol. Manage., https://doi.org/10.1016/j.rama.2020.01.011, 2020.
Riley, K. L., Abatzoglou, J. T., Grenfell, I. C., Klene, A. E., and Heinsch, F. A.: The relationship of large fire occurrence with drought and fire danger indices in the western USA, 1984–2008, Int. J. Wildland Fire, 22, 894–909, https://doi.org/10.1071/WF12149, 2013.
Robinson, S. and Milner-Gulland, E. J.: Political change and factors limiting numbers of wild and domestic ungulates in Kazakhstan, Hum. Ecol., 31, 87–110, https://doi.org/10.1023/A:1022834224257, 2003.
Rolinski, S., Müller, C., Heinke, J., Weindl, I., Biewald, A., Bodirsky, B. L., Bondeau, A., Boons-Prins, E. R., Bouwman, A. F., Leffelaar, P. A., te Roller, J. A., Schaphoff, S., and Thonicke, K.: Modeling vegetation and carbon dynamics of managed grasslands at the global scale with LPJmL 3.6, Geosci. Model Dev., 11, 429–451, https://doi.org/10.5194/gmd-11-429-2018, 2018.
Roy, D. P., Boschetti, L., Justice, C. O., and Ju, J.: The collection 5 MODIS burned area product – Global evaluation by comparison with the MODIS active fire product, Remote Sens. Environ., 112, 3690–3707, https://doi.org/10.1016/j.rse.2008.05.013, 2008.
Santin-Janin, H., Garel, M., Chapuis, J.-L., and Pontier, D.: Assessing the performance of NDVI as a proxy for plant biomass using non-linear models: a case study on the Kerguelen archipelago, Polar Biol., 32, 861–871, https://doi.org/10.1007/s00300-009-0586-5, 2009.
Sato, T. and Nakamura, T.: Intensification of hot Eurasian summers by climate change and land–atmosphere interactions, Sci. Rep., 9, 10866, https://doi.org/10.1038/s41598-019-47291-5, 2019.
Seneviratne, S. I., Donat, M. G., Mueller, B., and Alexander, L. V.: No pause in the increase of hot temperature extremes, Nat. Clim. Change, 4, 161–163, https://doi.org/10.1038/nclimate2206, 2014.
Tachiiri, K and Shinoda, M.: Quantitative risk assessment for future meteorological disasters reduced livestock mortality in Mongolia, Climatic Change, 113, 867–882, https://doi.org/10.1007/s10584-011-0365-5, 2012.
Trenberth, K. E., Fasullo, J. T., Branstator, G., and Phillips, A. S.: Seasonal aspects of the recent pause in surface warming, Nat. Clim. Change, 4, 911–916, https://doi.org/10.1038/nclimate2341, 2014.
Trenberth, K. E., Fasullo, J. T., and Shepherd, T. G.: Attribution of climate extreme events, Nat. Clim. Change, 5, 725–730, https://doi.org/10.1038/nclimate2657, 2015.
Vandergert, P. and Newell, J. P.: Illegal logging in the Russian Far East and Siberia, Int. For. Rev., 5, 303–306, https://doi.org/10.1505/IFOR.5.3.303.19150, 2003.
Venables W. N. and Ripley, B. D.: Modern Applied Statistics with S, Fourth edition, Springer, New York, ISBN 0-387-95457-0, 2002.
Vigan, A., Lasseur, J., Benoit, M., Mouillot, F., Eugéne, M., Mansard, L., Vigne, M., Lecomte, P., and Dutilly, C.: Evaluating livestock mobility as a strategy for climate change mitigation: combining models to address the specificities of pastoral systems, Agriculture, Agr. Ecosyst. Environ., 242, 89–101, https://doi.org/10.1016/j.agee.2017.03.020, 2017.
Vrieling, A., Meroni, M., Mude, A. G., Chantarat, S., Ummenhofer, C. C., and de Bie, K.: Early assessment of seasonal forage availability for mitigating the impact of drought on East African pastoralists, Remote Sens. Environ., 174, 44–55, https://doi.org/10.1016/j.rse.2015.12.003, 2016.
Xu, Y., Zhang, Y., Chen, J., and Johrn, R., J.: Livestock dynamics under changing economy and climate in Mongolia, Land Use Policy, 88, 104120, https://doi.org/10.1016/j.landusepol.2019.104120, 2019.
Yue, C., Ciais, P., Cadule, P., Thonicke, K., Archibald, S., Poulter, B., Hao, W. M., Hantson, S., Mouillot, F., Friedlingstein, P., Maignan, F., and Viovy, N.: Modelling the role of fires in the terrestrial carbon balance by incorporating SPITFIRE into the global vegetation model ORCHIDEE – Part 1: simulating historical global burned area and fire regimes, Geosci. Model Dev., 7, 2747–2767, https://doi.org/10.5194/gmd-7-2747-2014, 2014.