the Creative Commons Attribution 4.0 License.
the Creative Commons Attribution 4.0 License.
 | 26 May 2021
Simulating measurable ecosystem carbon and nitrogen dynamics with the mechanistically defined MEMS 2.0 model
Jocelyn M. Lavallee
Andy D. Robertson
Rebecca Even
Stephen M. Ogle
Keith Paustian
M. Francesca Cotrufo
For decades, predominant soil biogeochemical models have used conceptual soil organic matter (SOM) pools and only simulated them to a shallow depth in soil. Efforts to overcome these limitations have prompted the development of the new generation SOM models, including MEMS 1.0, which represents measurable biophysical SOM fractions, over the entire root zone, and embodies recent understanding of the processes that govern SOM dynamics. Here we present the result of continued development of the MEMS model, version 2.0. MEMS 2.0 is a full ecosystem model with modules simulating plant growth with above- and belowground inputs, soil water and temperature by layer, decomposition of plant inputs and SOM, and mineralization and immobilization of nitrogen (N). The model simulates two commonly measured SOM pools – particulate and mineral-associated organic matter (POM and MAOM, respectively). We present results of calibration and validation of the model with several grassland sites in the US. MEMS 2.0 generally captured the soil carbon (C) stocks (R2 of 0.89 and 0.6 for calibration and validation, respectively) and their distributions between POM and MAOM throughout the entire soil profile. The simulated soil N matches measurements but with lower accuracy (R2 of 0.73 and 0.31 for calibration and validation of total N in SOM, respectively) than for soil C. Simulated soil water and temperature were compared with measurements, and the accuracy is comparable to the other commonly used models. The seasonal variation in gross primary production (GPP; R2 = 0.83), ecosystem respiration (ER; R2 = 0.89), net ecosystem exchange (NEE; R2 = 0.67), and evapotranspiration (ET; R2 = 0.71) was well captured by the model. We will further develop the model to represent forest and agricultural systems and improve it to incorporate new understanding of SOM decomposition.
- Article
(3699 KB) - Full-text XML
-
Supplement
(1194 KB) - BibTeX
- EndNote


One of the biggest challenges facing humanity is the need to halt the rise in atmospheric CO2 concentrations, which requires a combined set of actions including management of terrestrial ecosystems to not only protect existing carbon (C) stocks but also increase net sequestration to actively remove CO2 from the atmosphere (Griscom et al., 2017; NASEM, 2019). Such management strategies can only be reliably identified and implemented when guided by decision support tools and ecosystem models that can accurately predict C dynamics between plants, microbes, and soils, and their responses to environmental and management drivers using current scientific understanding (e.g., Cotrufo et al., 2015; Lehmann and Kleber, 2015; Liang et al., 2017; Sokol et al., 2019). While these models should ideally be verifiable using measurements of their constituent pools and fluxes, the soil components of most historical ecosystem models were built around conceptual, rather than physically defined, pools (e.g., RothC, Coleman and Jenkinson, 1996; CENTURY, Parton et al., 1987). However, recent paradigm shifts in understanding of soil organic matter (SOM) formation and persistence have led to these belowground components of ecosystem models being redesigned (e.g., Ahrens et al., 2015; Robertson et al., 2019) (a full list of current models and their model structure comparison is in Table S1 in the Supplement). Ensuring that the soil pools and fluxes are measurable is particularly important if these models are to be used for estimating tradable C credits or outcome-based C sequestration incentives. These models must also simulate the entire soil profile, to account for C stocks and dynamics in deep (i.e., > 30 cm) soil layers.
Ultimately, these contemporary models that represent observed mechanisms of C and nitrogen (N) dynamics will go beyond supporting management decisions, serving also as tools for scientific enquiry, enabling testing of new hypotheses and identification of knowledge gaps. While many models currently exist and are used for these purposes (e.g., DayCent, Parton et al., 1998; DNDC, Li et al., 1992; RothC, Coleman and Jenkinson, 1996), and new ones are being developed (e.g., MEND, Wang et al., 2013; CORPSE, Sulman et al., 2014; MIMICS, Wieder et al., 2014; COMISSION, Ahrens et al., 2015), arguably none fully address all of the needs. As a result, terrestrial C storage remains the largest source of uncertainty in future C cycle projections (Ciais et al., 2014). Despite its critical role in global biogeochemical cycling, soil organic C is not well constrained in Earth system models (Todd-Brown et al., 2013), highlighting the need for improved simulation of plant–microbe–soil C feedbacks.
Few soil biogeochemical models have made measurable SOM pools a focal point (Abramoff et al., 2018; Fatichi et al., 2019; Robertson et al., 2019; Wang et al., 2013), despite their importance for guiding model development and judging model performance. To our knowledge, only MEMS 1.0 (Robertson et al., 2019) used measured SOM fraction data for model calibration and verification (Table S1), while other models continue to calibrate and validate them against total soil C. Many conventional SOM models, such as RothC and DayCent, do not model measurable SOM pools, and therefore attempts to validate their size have required abstraction based on measurable fractions (e.g., Zimmermann et al., 2007). Instead, these models partition total SOM into discrete pools based on turnover times but differ in their approaches to simplify the complex mechanisms that govern SOM dynamics. This is one reason why simulations of SOM pools and resulting total soil C stocks can vary greatly between models, sometimes predicting contrasting responses to the same driving inputs and environmental change (Smith et al., 1997; Todd-Brown et al., 2014), though there are many other potential contributors (Sulman et al., 2018). The use of physically defined, measurable pools allows for detailed data–model comparison during parameterization and validation, with the potential to produce more accurate models that better reflect real-world processes. Many methods for separating SOM into fractions with different biogeochemical properties and turnover rates currently exist, but simple physical separations yielding two to four SOM fractions and including some form of particulate (POM) and mineral-associated organic matter (MAOM) are widely used (Christensen, 2001; Cotrufo et al., 2019; Poeplau et al., 2018). These fractionation methods are relatively inexpensive and simple to perform, while yielding fractions with contrasting formation and decomposition processes (Lavallee et al., 2020), making them ideal candidates for representation in biogeochemical models.
Carbon dynamics and stock distribution between POM and MAOM are linked to N (Cotrufo et al., 2019). Moving beyond C-only models to coupled C and N dynamics enables representation of mechanistic feedbacks, such as N limitation of litter decomposition (Craine et al., 2007; Knorr et al., 2005; Zhang et al., 2008) and microbial C use efficiency (CUE) (Liu et al., 2018; Sinsabaugh et al., 2016; Soares and Rousk, 2019). Additionally, it provides constraints on C and N flows according to well-known stoichiometric relationships (Buchkowski et al., 2019; Kyker-Snowman et al., 2020). Many models that include both C and N calculate N fluxes based on donor pool sizes and are constrained by the C:N ratios of receiving pools, with little or no representation of the microbial processes that control N dynamics. While this method is relatively simple and parsimonious, it fails to capture plant–microbe feedbacks that regulate N flows. For example, microbiota may alter exoenzyme production or mine SOM (Mooshammer et al., 2014) to access N to meet their needs, and plants may increase exudate production to stimulate these processes (Tian et al., 2019). Failing to represent N dynamics resulting from plant–microbe feedbacks may lead to inaccuracies in model predictions. Emerging models such as the MIMICS-CN have begun to represent these processes in greater detail (Kyker-Snowman et al., 2020), but most ecosystem models continue to use more simplified, microbially implicit structures to simulate N dynamics.
Physicochemical and biological properties differ markedly between subsoils (e.g., > 30 cm deep) and topsoils, and there is increasing evidence that models of soil C and N storage and cycling should consider topsoils and subsoils separately. Subsoils hold more than half of the total soil C (Batjes, 2014; Harper and Tibbett, 2013), and SOM formation and stabilization processes differ from topsoils because key properties including soil texture and primary inputs to SOM – i.e., plant inputs vs. vertical transport of dissolved organic matter (DOM) – vary with soil depth (Rumpel and Kögel-Knabner, 2011). Despite their importance for C storage, sensitivity to perturbation, and the remarkable differences from topsoils, only a few recent ecosystem models explicitly represent subsoil C dynamics (e.g., Ahrens et al., 2015; Camino-Serrano et al., 2018; Fatichi et al., 2019). Most commonly, subsoil is modeled as an extension of topsoil with very limited if any validation (Braakhekke et al., 2013; Ota et al., 2013; Wieder et al., 2014), largely because of a paucity of subsoil data.
Incorporating emerging understanding of soil biogeochemical processes into models has the potential to improve model performance and increase their utility for hypothesis testing and predictions. Microbial processing of plant inputs is a key process by which SOM is formed and mechanistically links SOM pools and plant litter quality, microbial CUE, and C:N stoichiometry. For example, labile, water-soluble litter components are more likely to be processed by microbes with relatively high efficiency, forming proportionally more MAOM than structural litter components (Cotrufo et al., 2013; Haddix et al., 2016; Lavallee et al., 2018). This has been termed the in vivo pathway, but MAOM may also form directly from plant inputs by an ex vivo pathway that bypasses microbial processing (Liang et al., 2017). The relative importance of these pathways is thought to vary greatly between the rhizosphere and the bulk soil, with ex vivo MAOM production playing a larger role in the bulk soil, where the density of microbial cells is lower and DOM has less chance of being intercepted prior to mineral association (Sokol et al., 2019). Inputs to SOM also differ between the rhizosphere and bulk soil, with aboveground plant inputs only contributing appreciably to SOM in the bulk soil due to its spatial separation from roots and their exudates, which are the predominant inputs to SOM formation in the rhizosphere (Sokol and Bradford, 2019). Though these ideas have gained recognition with the scientific community and have spurred significant experimental work and hypothesis testing, to our knowledge no soil biogeochemical models yet represent all of these recent advances simultaneously.
The MEMS 1.0 model (Robertson et al., 2019) is a soil carbon model with physically defined pools that was developed in accordance with recent advances in SOM dynamics. including the microbial efficiency–matrix stabilization (MEMS) hypothesis (Cotrufo et al., 2013) and interactions between litter chemistry and MAOM saturation behavior (Castellano et al., 2015). Here we present MEMS 2.0, which builds on MEMS 1.0 to form a complete ecosystem model including N cycling, soil vertical water flows, DOM transport, plant growth, root input, and soil temperature dynamics. MEMS 2.0 represents distinct plant inputs and microbial processes in the litter layer and rhizosphere, and DOM, POM, and MAOM dynamics in the bulk soil to a user-defined depth above the bedrock. We describe the model structure, parametrization, and verification against measured ecosystem fluxes as well as soil C and N fractions along the full soil profile at multiple US grassland sites from the National Ecological Observatory Network (NEON). We focused on grasslands for this first full ecosystem version of the MEMS model because grasslands are among the largest terrestrial biomes in the world, and temperate grassland soil contains 15 % of the global soil organic C stocks (Watson et al., 2000). Grasslands have been the focus of major long-term biogeochemical research, which makes them an ideal “model system” to address questions related to soil C dynamics.
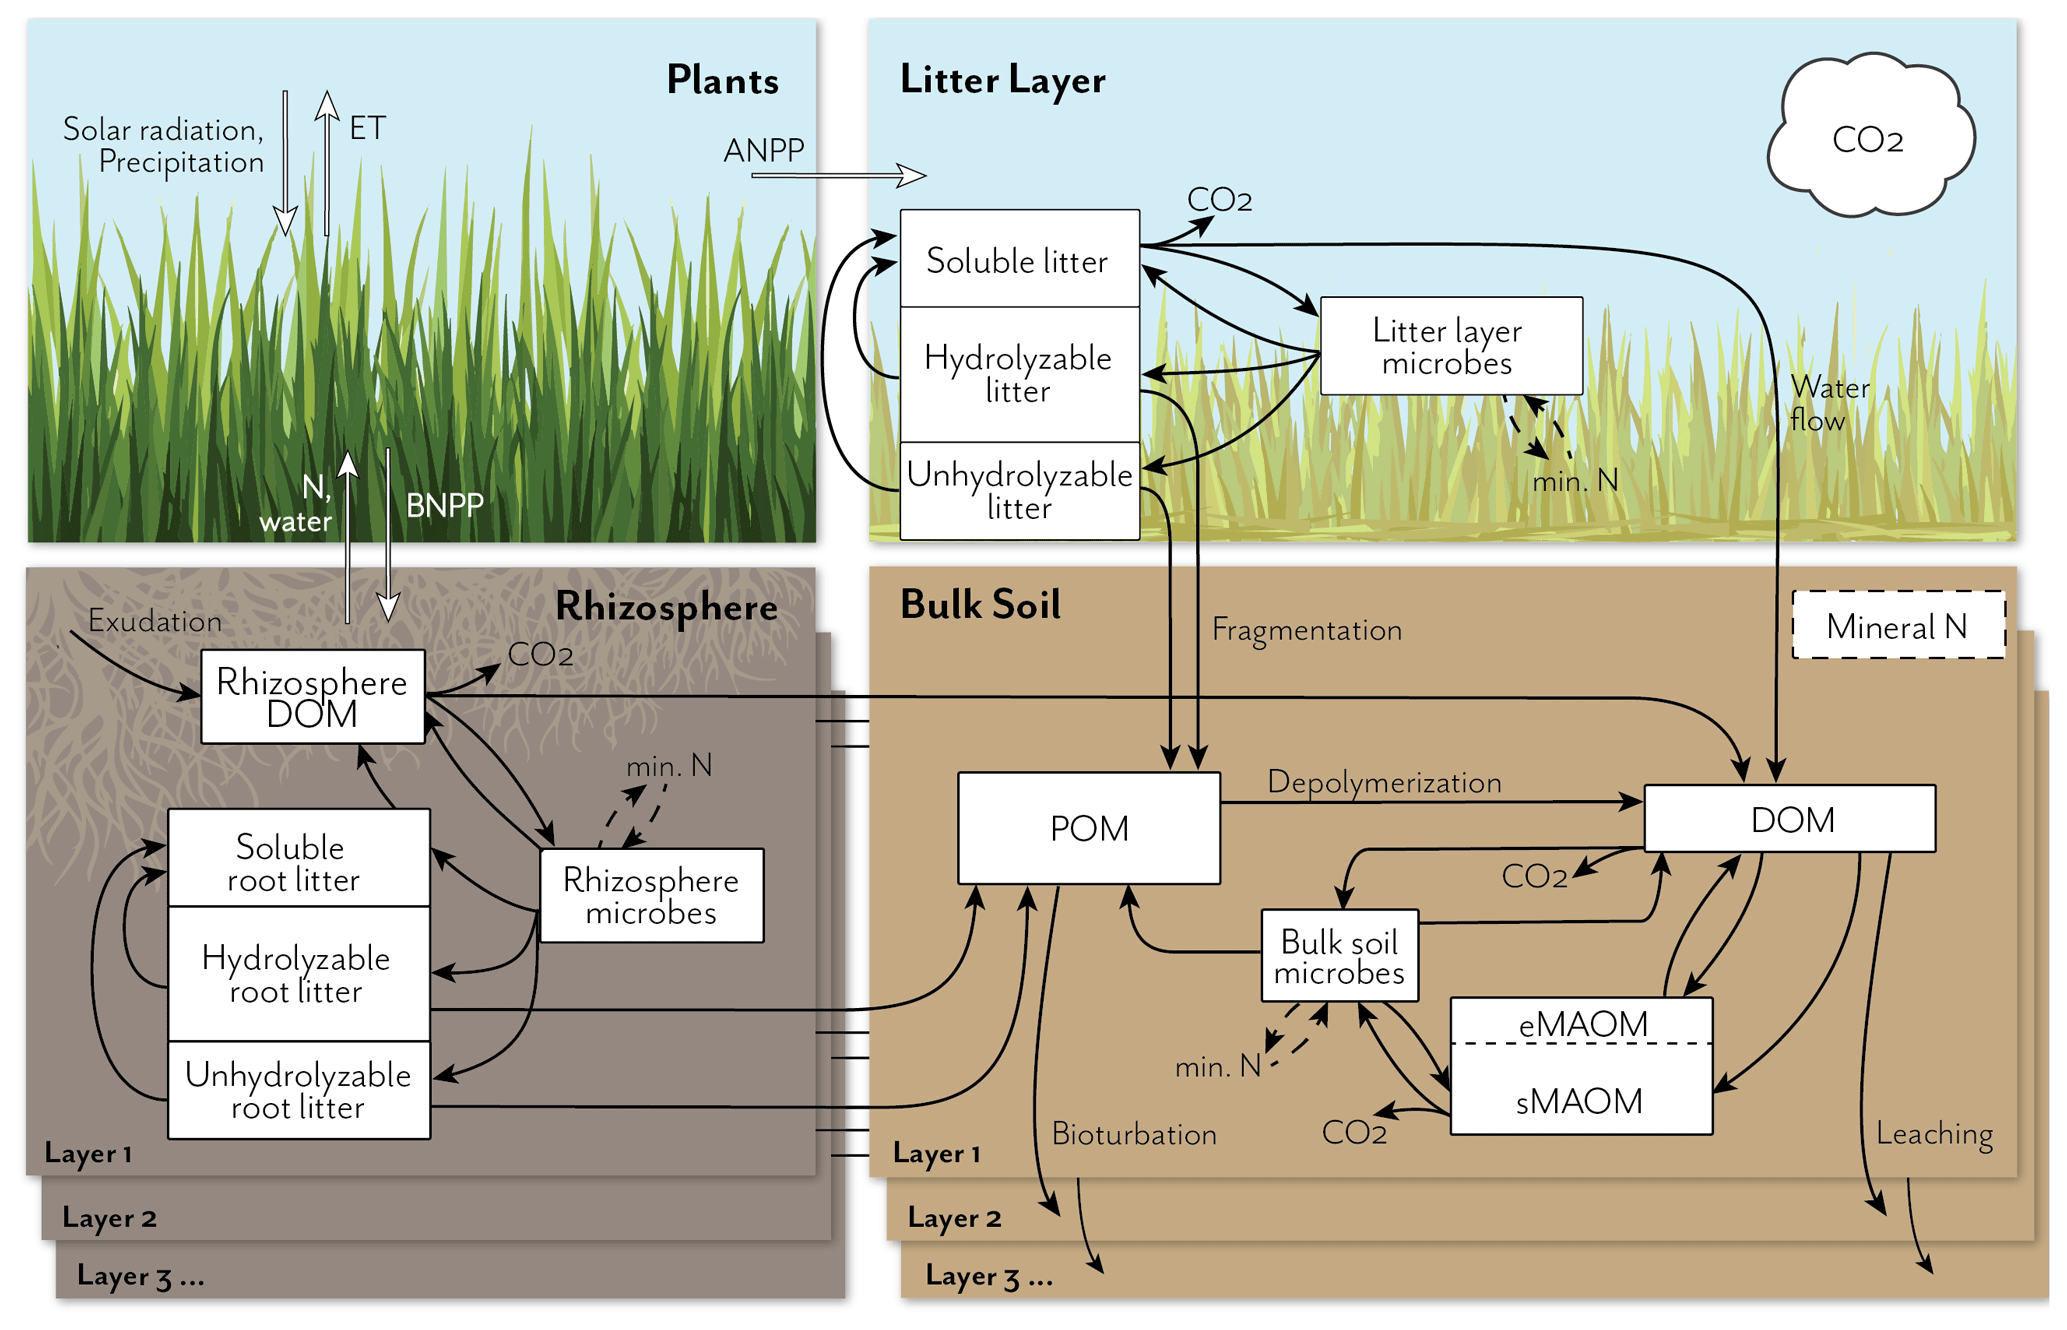
Figure 1Schematic representation of the MEMS 2.0 ecosystem model, showing detailed pools and fluxes for the litter and soil components. The full model represents carbon (C) and nitrogen (N) fluxes among atmosphere, plants, and soil in multiple soil layers down to a user-defined depth. Inputs and recycling of N cause feedbacks to net primary productivity (NPP), which is allocated above (ANPP) or below ground (BNPP) and at different depths, depending on vegetation and soil traits. Plant C and N litter inputs (simulated in the plant growth submodel; not shown in detail here) are allocated to three different measurable detritus pools that differ in their solubility and chemical structure. Root exudates contribute to the rhizosphere dissolved organic matter (DOM) pool. These plant input pools lose mass through leaching, microbial catabolism/anabolism, and fragmentation, with different rates depending on the pool C:N chemistry, temperature sensitivity, and mineral N and water demand/availability. Microbial and plant debris contribute to three physically defined and measurable soil organic matter (SOM) pools, according to current understanding (e.g., the dual-pathway model of SOM formation (Cotrufo et al., 2015), in vivo vs. ex vivo microbial processing (Liang et al., 2017), and point of entry (Sokol et al., 2019)): soil DOM, particulate organic matter (POM), and mineral-associated organic matter (MAOM). The MAOM consists of exchangeable and stable component pools (eMAOM and sMAOM, respectively). Microbial pools immobilize and mineralize N, which feeds back to plant production and soil biogeochemical processes. Multiple soil layers are represented by the same belowground model structure, with DOM and mineral N moving through the soil profile and roots contributing fresh inputs at depth.
2.1 Model description
Starting from the MEMS 1.0 version (Robertson et al., 2019), we developed a one-dimension ecosystem model, MEMS 2.0 (Fig. 1), which simulates litter layer, rhizosphere, and bulk soil C, N, water, and temperature, as well as plant growth. The main required inputs are daily weather (maximum temperature, minimum temperature, and precipitation; solar radiation is optional), soil properties, plant characteristics, and management practices. The model produces outputs on a daily time step. The soil water, soil temperature, plant and microbial N uptake, and bioturbation processes run on a sub-daily time step (hours) for higher prediction accuracy. A one-dimension soil profile is divided into continuous soil horizons in the model input file, with user-defined depths for each horizon (the user-defined horizons need to be multiples of 5 cm for the top 50 cm and multiples of 10 cm for below 50 cm). While executing a model simulation, the user-defined soil horizons are further divided into thinner layers to effectively solve partial differential equations (the model has fixed depths for the layers 0–2 and 2–5 cm, then 5 cm increments for 5–50 cm, and 10 cm increments for layers below 50 cm). The basic structure of each soil layer is the same. The model simulates a surface litter layer which interacts with the first soil layer (Fig. 1). In each soil layer, the space is conceptually divided into rhizosphere (rhizosphere goes as deep as the root system) and bulk soil, though there is no explicit spatial division due to the one-dimensional structure. Each simulated pool, including plant organs and soil organic pools, have both C and N components. MEMS 2.0 is coded in Java with an object-oriented structure (Fig. S1 in the Supplement). A full list of all model equations and the corresponding variables and parameters can be found in Tables S2–S4.
2.1.1 Litter layer and rhizosphere organic matter dynamics
MEMS 1.0 incorporated the Litter Decomposition and Leaching (LIDEL) model (Campbell et al., 2016). In MEMS 2.0, we modified this submodel to explicitly represent the depolymerization of hydrolyzable and unhydrolyzable litter pools and the microbial uptake of DOM, turnover, and contribution to litter pools. Both aboveground and belowground plant litter is divided into three pools based on its physicochemical structure (Fig. 1.). The water-soluble pool is determined as the hot-water extractable fraction of the initial litter, which is continuously replenished during litter decomposition by the depolymerization of the structural litter components (Soong et al., 2015) and is contributed by the water-soluble components of microbial biomass turnover, as described below. The litter structural component is separated into a hydrolyzable pool, representing polymers, such as proteins and cellulose, and an unhydrolyzable pool representing lignin, suberin, cutin, and microbial polysaccharide–lignin complexes (McKee et al., 2016). These litter fractions are commonly measured in decomposing litter or forage analyses (Rowland and Roberts, 1994; Soest et al., 1991). Both structural litter components in the litter layer and rhizosphere produce DOM through their depolymerization and are contributed by structural microbial components as microbes turn over in the litter layer and rhizosphere, respectively (Fig. 1).
Similarly to MEMS 1.0, the depolymerization and decomposition processes follow a first-order decay, with rate modifiers as multipliers:
where Ci is a carbon pool in the ith layer, k is the decay rate, and mi() is a function of the multiplication of the individual modifiers for the ith layer. For the aboveground soluble and hydrolyzable pools, the modifiers are normalized functions of temperature, moisture, lignocellulose index (LCI; it is defined as the ratio between acid-insoluble and acid-soluble + acid-insoluble, following Soong et al., 2015), and microbial C:N ratio (Table S2). The unhydrolyzable pool does not include the LCI modifier. The belowground soluble pool contributes together with the root exudate to the rhizosphere DOM which decomposes as described above for the aboveground soluble litter pool.
Both the litter layer and the rhizosphere have a microbial biomass pool. Microbes assimilate C from the soluble and DOM pools in the litter layer and the rhizosphere, respectively. Microbial assimilation of C uses the concept of CUE, which is calculated dynamically as a function of the substrate C:N ratio.
where micCNmax is the maximum C:N ratio of microbes, CNsubstrate is the substrate C:N ratio, and CNCUE_km is a curve-adjusting parameter. The substrate C:N ratio calculation includes the organic N in the pool as well as the available mineral N. Any C taken up by microbes from the soluble and DOM pool that is not assimilated (based on CUE) is respired as CO2. If the N from the substrate is more than the potential N demand of microbes, net mineralization occurs. Otherwise, there is immobilization that consumes mineral N. The uptake of inorganic N (ammonium and nitrate) is modeled explicitly, and we assumed no preferential uptake between ammonium and nitrate. The model first estimates a CUE (Eq. 2); then it calculates the potential demand for inorganic N based on the amount of carbon assimilated and the minimum C:N ratio of microbes (Eq. S23 in the Supplement). The actual uptake is a result of competition with the plants (hourly time step calculation based on their demand). The C:N ratio of microbes is dynamic as a result of CUE and the N availability from organic and mineral sources. When there is insufficient mineral N for immobilization, C:N of the microbial biomass increases. The increased microbial C:N leads to a reduced decomposition rate. Microbial death also follows a first-order equation, and the necromass splits between soluble, hydrolyzable, and unhydrolyzable litter pools. The litter decomposition model was created first as a stand-alone model and was incorporated into MEMS 2.0 after verification with measured data from Soong et al. (2015).
2.1.2 Bulk soil organic matter dynamics
The model has five organic matter pools in the bulk soil (Fig. 1). The POM is defined either by density as < 1.85–1.6 g cm−3 or by size as > 50–60 µm after aggregate dispersion (Lavallee et al., 2020). Inputs to the POM pool are from the fragmentation and incorporation of the structural plant and microbial litter components into the bulk soil (Cotrufo et al., 2015), from the aboveground litter layer for the topsoil layer, and from the rhizosphere for all soil layers. Bioturbation (soil mixing) is simulated as POM moves downward in the soil profile using an equation with the same form as the diffusion equation (Elzein and Balesdent, 1995) (Eq. S12 in Table S2).
The bulk soil DOM pool receives inputs from the aboveground litter soluble pool (for the top layer only), from the rhizosphere DOM, from depolymerization of POM, and from desorption of MAOM. In subsurface soil layers, DOM can also leach from layers above as an input to the bulk soil DOM pool. In the rhizosphere, a greater fraction of the DOM pool is taken up by microbes (in vivo pathway) vs. being exported to bulk soil DOM without microbial processing (DOM transport from rhizosphere to bulk soil is simulated as a diffusion process controlled by soil water content and a diffusion coefficient; Eq. S9). In the bulk soil, a greater proportion of the DOM pool can directly enter the MAOM pool via the ex vivo pathway, in accordance with the point-of-entry hypothesis (Sokol et al., 2019).
The MAOM pool is modeled as two pools: exchangeable MAOM (eMAOM) and stable MAOM (sMAOM) (Schrumpf et al., 2020). Both eMAOM and sMAOM have an upper limit of saturation, which is calculated based on soil clay and silt content (Hassink, 1997; Six et al., 2002). Inputs to eMAOM are from DOM, assuming it can adsorb to mineral surfaces or existing organo-mineral associations with weak reversible bonding (Kleber et al., 2007). This process is modeled using the Langmuir isotherm, which assumes instantaneous equilibrium between adsorption and desorption (Mayes et al., 2012). The DOM can also associate with mineral surfaces through strong bonding, forming sMAOM. This adsorption rate is modeled as a function of water-filled pore space, sand content, and the saturation level of sMAOM (Eq. S15). The sMAOM primarily receives inputs from microbial external polymeric substances (Kleber et al., 2015), which are thought to be strongly protected by mineral association but which can be slowly consumed by microbes through direct access (i.e., no DOM intermediary; Eq. S15). Bulk soil microbes assimilate DOM, and their turnover contributes to POM, sMAOM, and DOM, with CO2 as a byproduct based on microbial CUE (Eq. S14). The depolymerization of POM, decomposition of MAOM, and decomposition of DOM follow Eq. (1).
2.1.3 Soil temperature, water, and solutes
Soil surface temperature in MEMS 2.0 is calculated following Parton et al. (1998). It is a function of air temperature, litter biomass, plant biomass, and snow depth. The soil surface temperature serves as the upper boundary condition for the soil temperature calculation. To calculate soil temperature, we adopted the method by Bittelli et al. (2015) to numerically solve the heat transport equation.
Water and solute transport are calculated simultaneously using the model described in Ross (2003). This fast and simplified method numerically solves the Richards equation for water transport and the advection–dispersion equation for solute transport (Bittelli et al., 2015). The Brooks and Corey (1964) method is used to describe the soil hydraulic properties. If the soil hydraulic parameters are not provided by the user, the model estimates the parameters based on soil texture, bulk density, and SOM content using a pedotransfer method (Saxton and Rawls, 2006). The litter layer is assumed to hold water based on a concept similar to field capacity and residual soil water content (SWC) (Ogée and Brunet, 2002). In MEMS 2.0, solutes simulated are DOM, ammonium, and nitrate. Mineral N can be taken up by plant root and microbes. We modeled the competition between plants and microbes based on their demand (the amount of N required to reach maximum N content) using an hourly time step and assuming equal opportunity at each time step (Kuzyakov and Xu, 2013).
MEMS 2.0 calculates potential evapotranspiration (ET) using calculated reference ET from a grass reference surface, combined with a dynamic crop coefficient for specific plant types (Allen et al., 1998). The reference ET is estimated with the Hargreaves method, which uses daily maximum and minimum temperature data as inputs (Hargreaves and Allen, 2003). The calculation of potential evaporation and transpiration is adapted from Zhang et al. (2018) and Raes et al. (2009), which use estimated canopy cover from leaf area index and crop coefficients. Actual evaporation and transpiration are outputs of the soil water submodel as described above.
2.1.4 Plant growth
The plant growth submodel is modified from the Light INTerception and UtilLisation Version 5 (LINTUL5) crop model (Wolf, 2012) and works on a daily time step. In the MEMS 2.0 plant growth submodel, both annual and perennial herbaceous plants can be simulated. Dry matter accumulation or net primary production (NPP) is simulated using radiation use efficiency. The model can also directly use daily NPP as an input driving variable. Estimation of plant respiration uses the method from Yin and Laar (2005).
Aboveground plant components include leaves, stems, and seeds. Belowground components are coarse roots, fine roots, and exudates. Partitioning between roots and shoots is based on species- or variety-specific parameters defining dry matter allocation from emergence to maturity. The partitioning of aboveground dry matter to leaves, stems, and seeds adopts the method in Zhang et al. (2018). Plant phenology is calculated based on heat accumulation and photoperiod (Soltani and Sinclair, 2012; Yin and Laar, 2005). Root distribution is modeled using the simple curve from MEMS 1.0 (Robertson et al., 2019). Rooting depth increases from plant emergence to the end of the plant growth phase as a function of phenological development. Root exudation is a species- or variety-specific fixed fraction of C allocated below ground. A full list of the parameters is in Table S4.
2.1.5 Fire events
Fire has a significant impact on C and N cycling in grasslands (Ojima et al., 1994; Soong and Cotrufo, 2015), and we included a simple fire module in MEMS 2.0. We acknowledge that fire deserves a more detailed representation, including the production of pyrogenic organic matter (PyOM) and its cycling in soil (Bird et al., 2015; Knicker, 2011). However, a more detailed representation of fire impacts on C was beyond the scope of this model version, and we intend to develop a PyOM module in a future version. In MEMS 2.0, natural and prescribed fire events can be scheduled in the management schedule input file of the model. We used an approach modified from the DayCent model (Hartman et al., 2020; Ojima et al., 1994). A fire event removes aboveground live and dead biomass and surface litter, according to user-defined percentages of each pool (default values of 60 %, 80 %, and 80 % removal for aboveground live biomass, standing dead, and litter, respectively). Pyrogenic C is returned to the soil surface and added to the unhydrolyzable pool of the aboveground litter layer. A user-defined fraction of the N in burned plant biomass can also be returned to the soil surface (Hobbs et al., 1991).
2.2 Observation data sets used for model calibration and validation
We calibrated the litter decomposition model using a data set from a laboratory incubation of a range of litter types (Soong et al., 2015). Leaf litters covering a wide range of C:N ratios (10.8, 52.8, 92.3, 36.1, and 126.6 for alfalfa, ash, bluestem, oak, and pine, respectively) and LCI values (4.7, 9.8, 8.42, 18.8, and 24.4 for alfalfa, ash, bluestem, oak, and pine, respectively) were collected and incubated for 1 year. During this time, DOM was leached and measured periodically, and the total dry matter remaining was recorded twice on day of year 95 and 365.
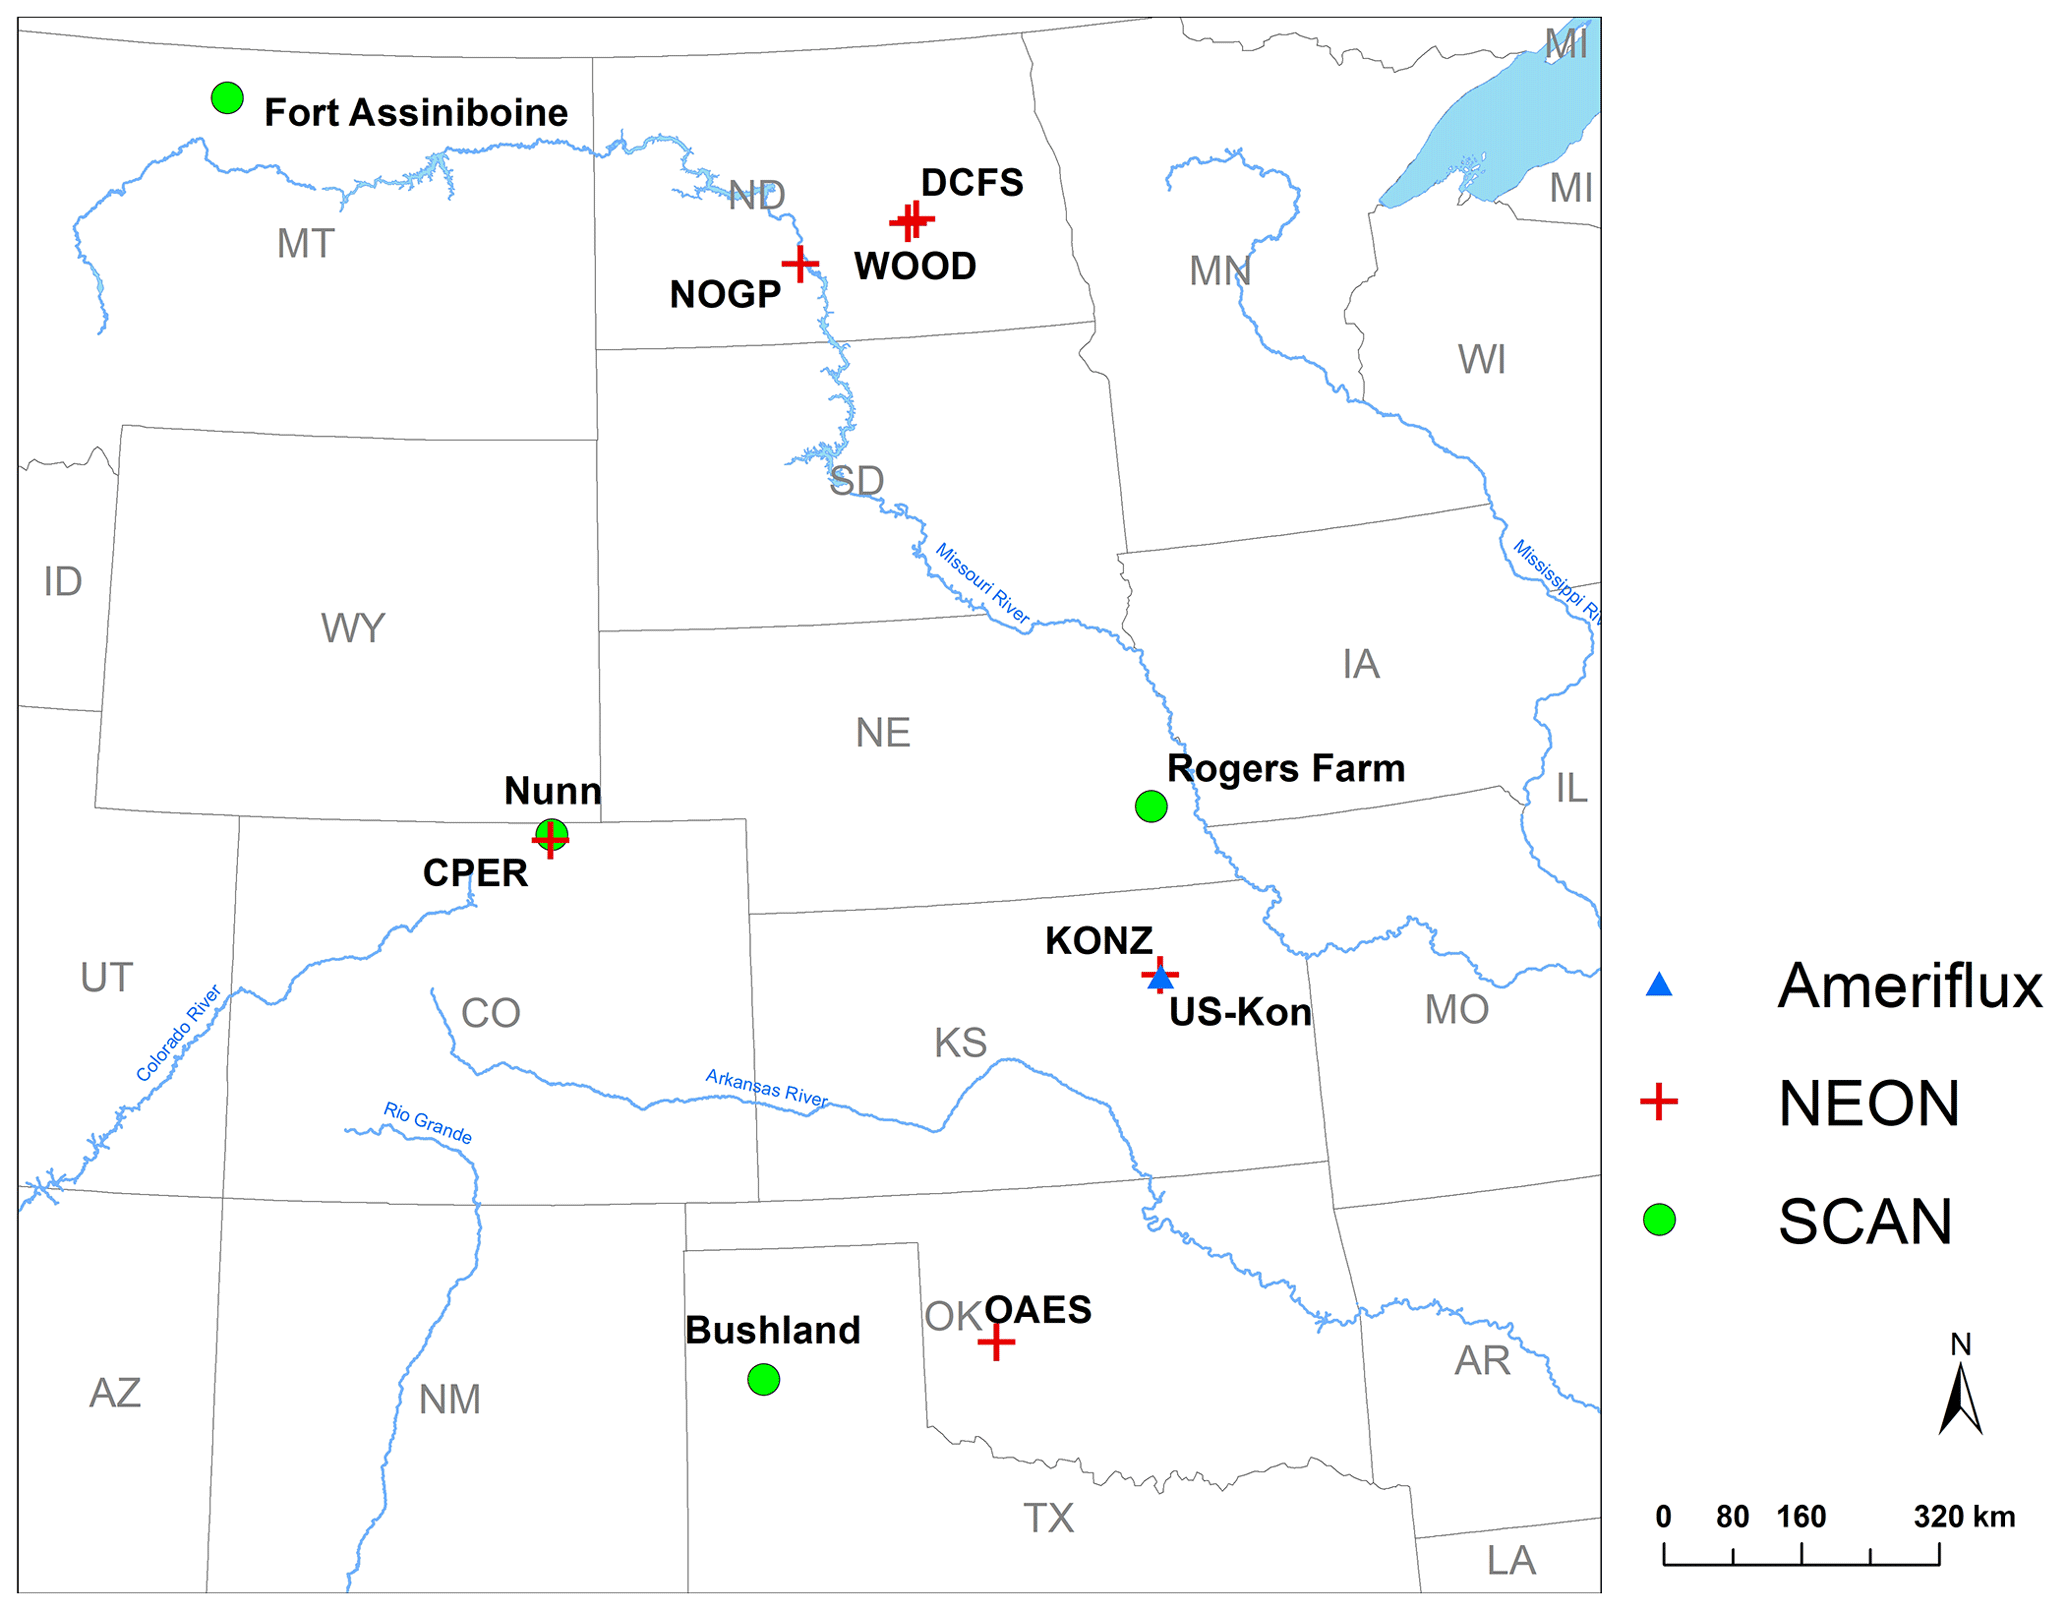
Figure 2Locations of the sites used for model calibration and validation. The sites are part of the National Ecological Observatory Network (NEON), Soil Climate Analysis Network (SCAN), or AmeriFlux Network.
Table 1Characteristics of the six sites used to calibrate and validate MEMS 2.0. Soil properties (average of top 20 cm) are from the megapit soil samples of the National Ecological Observatory Network (NEON). Site IDs are from the NEON database.
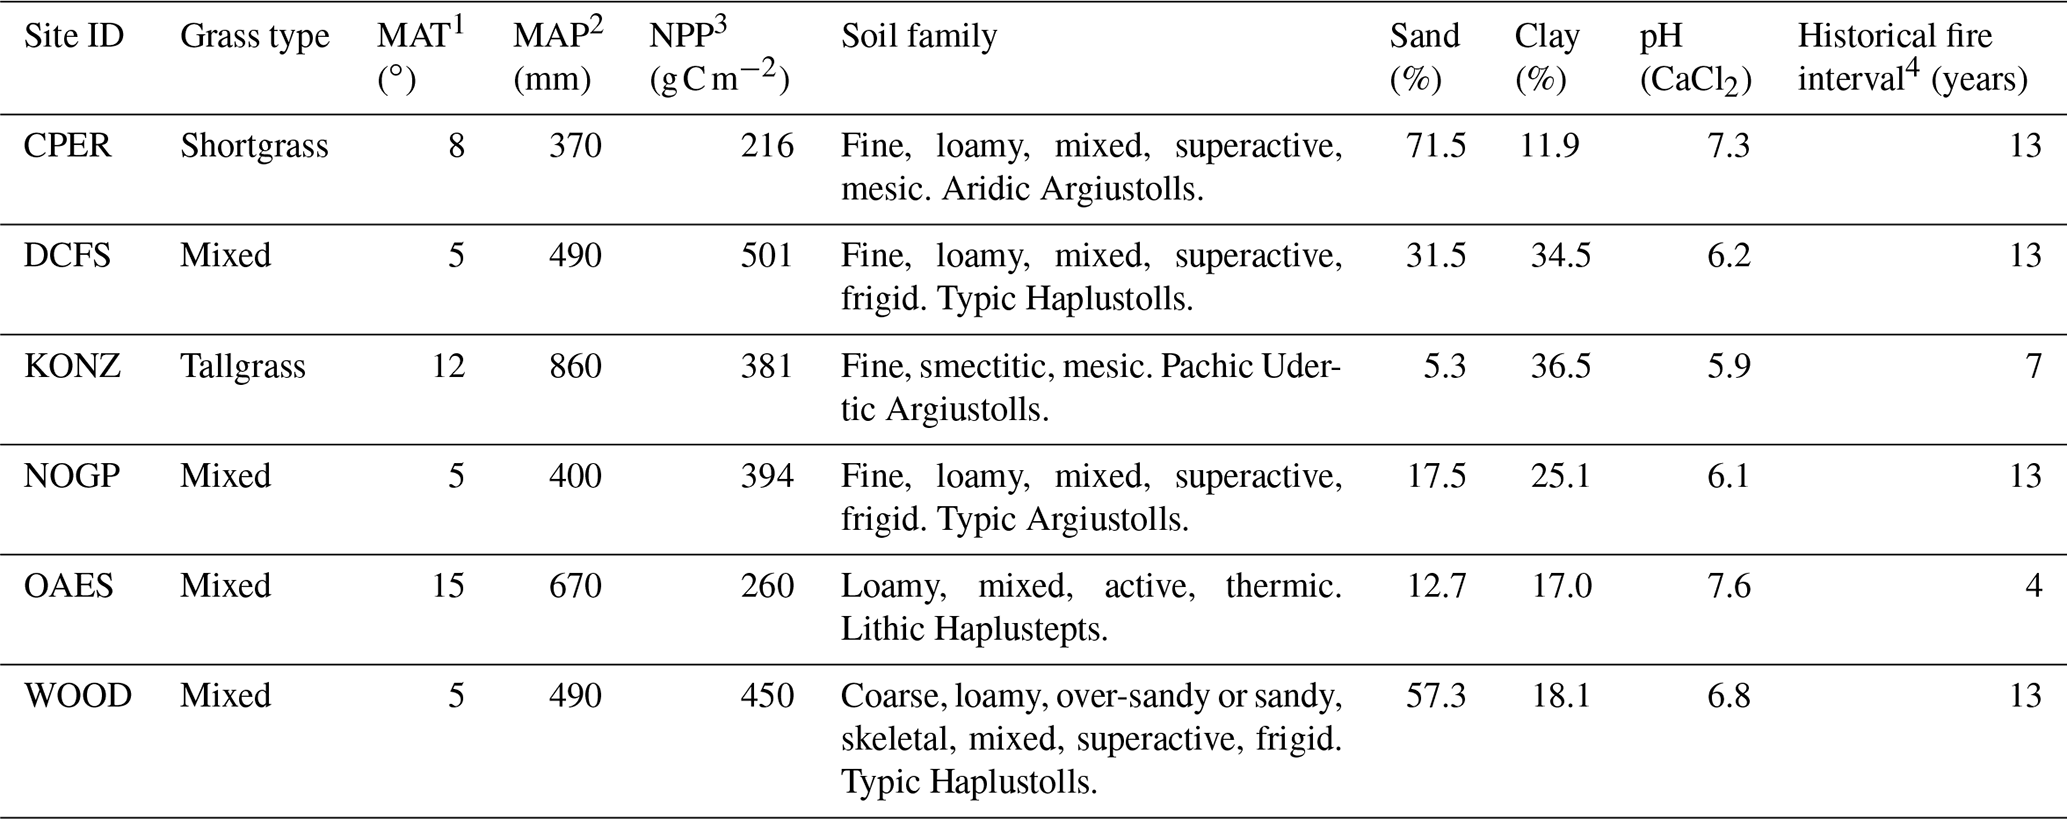
1 Mean annual temperature. 2 Mean annual precipitation. 3 Mean annual MODIS NPP (Running et al., 2015). 4 Historical fire interval data are from Guyette et al. (2012). Frequency of prescribed fire in the experimental period was different and obtained from the experimental records of individual sites.
Soil samples extracted from megapits at the NEON sites (Hinckley et al., 2016) were used to calibrate and validate the model for this study (Fig. 2, Table 1). A soil core was taken at each megapit, divided by horizon, homogenized, and characterized. The NEON sent archived 2 mm sieved and air-dried soils to Colorado State University, where each sample was heat-treated to 116 ∘C for 18 h and then fractionated to quantify C and N in DOM, POM, and MAOM. Soil subsamples (5.5–6.0 g) were first shaken in 35 mL of deionized water for 15 min and then centrifuged at 1874 g. DOM was decanted off over a 20 µm nylon filter, weighted, and place in a −20 ∘C freezer for later analysis. Any particulate material caught on the filter was set aside as light POM. Sodium polytungstate (SPT) at a density of 1.85 g cm−3 was then added to the soil residue with 12 glass beads and shaken for 18 h to disperse soil aggregates. After dispersion, the tubes were centrifuged at 1874 g for 30 min. The remaining suspended light POM was aspirated onto a 20 µm filter using a vacuum filtration system. The pellet was then rinsed multiple times with deionized water to remove any residual SPT through a series of pellet disruption and centrifugation.Once thoroughly rinsed, the remaining heavy fraction was wet-sieved at 53 µm to separate the course (> 53 µm) from the fine (< 53 µm) heavy fraction. All solid fractions were oven-dried at 60 ∘C. Once dry, solid soil fractions were weighed and finely ground to ensure homogenization before being analyzed for C and N content on an elemental analyzer (Costech ECS 4010; Costech Analytical Technologies; Valencia, CA, USA). This fractionation scheme produced four distinct soil fractions: DOM (water soluble, < 20 µm), light POM (< 1.85 g cm−3), a heavy coarse fraction (> 53 µm and > 1.85 g cm−3), and a heavy fine fraction (< 53 µm and > 1.85 g cm−3). We added the two heavy fractions into one MAOM fraction because of the relatively low C:N ratio of the heavy coarse fraction (first quantile: 7.9; third quantile: 15.0), which was more similar to the heavy fine fraction (first quantile: 7.3; third quantile: 12.7) than to the light POM (first quantile: 18.6; third quantile: 42.44). We still lack a complete understanding of the heavy coarse SOM fraction, and mechanistic research is required to clarify its role and function in soil (Lavallee et al., 2020). In the model, the MAOM was further divided into exchangeable and stable MAOM pools, though we did not measure these two fractions. Thus, we compared the measured MAOM with the simulated MAOM (sum of eMAOM and sMAOM).
Five-year SWC and soil temperature data at four depths from the Soil Climate Analysis Network (SCAN) (Schaefer et al., 2007) were used to verify the model representation of moisture and temperature dynamics. For this evaluation, we used four SCAN sites in the Great Plains representing wet, dry, hot, and cold climate with various soil textures (Fig. 2). In addition, the model was tested with multiple years of eddy covariance (EC) flux data (2007–2010), including net ecosystem exchange (NEE), gross primary production (GPP), ecosystem respiration (ER), and actual ET from an EC tower at the Konza Prairie Biological Station (AmeriFlux ID US-Kon; Fig. 2) (Brunsell et al., 2014). Although NEON collects eddy covariance flux data (NEON, 2020a), the data were not used for model testing in this study because available data are incomplete and from short monitoring periods.
2.3 Model setup, calibration, and validation
The six NEON grassland sites (Fig. 2) were used for testing model performance of C and N dynamics. These grassland sites were assumed to be at a steady state in terms of soil C and N stocks, and a long-term simulation was conducted to reach steady state for comparing the model output to the measurement data (Robertson et al., 2019). In our testing, 300 years was determined to be the minimum time needed for the system to reach steady state. The model input data were collected from several different sources (Table S5). Our measured MAOM C data from all NEON sites were used for deriving the parameters for the saturation function (Hassink, 1997; Robertson et al., 2019) by fitting a boundary line to the data (Fig. S2) (Feng et al., 2013). The daily NPP derived from a MODIS product was used as input data in these simulations (Table S5) (Running et al., 2015). Other plant-growth-related parameters were set based on measurements and the literature (Table S5). Although some of the NEON sites are under livestock grazing, this version of the model does not simulate grazing and its effect on plant growth and organic matter decomposition (in the future development plan). The input data of MODIS NPP could reflect some the effect of grazing on plant production. Fire events were scheduled according to the frequency reported in Guyette et al. (2012) for the historical periods, and each event was assumed to be in the spring. The frequency of prescribed fire in the experimental period was obtained from the experimental records of individual sites.
The SCAN sites were set up using their site-specific weather and soil data (Table S6). The specific soil texture of the EC site at Konza was not available. The nearby NEON KONZ site soil has the same soil texture class (silty clay loam), so soil parameters from NEON KONZ were used for the EC site. The plant-related parameters were based on the nearest NEON grassland site. The plant production parameters for modeling the EC site were adjusted using the GPP data of the first measurement year (2007) to reflect the productivity at this specific location (NPP was simulated by the model).
To test the litter decomposition module using the lab experiment of litter decomposition for five types of plants in Soong et al. (2015), we created a stand-alone litter decomposition model written in R. Automated calibrations were conducted to calibrate the stand-alone litter decomposition model. In a second calibration, the MEMS 2.0 model was calibrated with NEON grassland site data. The calibration method used was a Markov chain Monte Carlo Bayesian approach, specifically the DifferRential Evolution Adaptive Metropolis (DREAM) (Vrugt and Ter Braak, 2011), using the DREAM package in R (Vrugt, 2016).
Table 2Parameter names, definitions, ranges for sensitivity analysis, and calibrated optimal values. Listed in alphabetical order by parameter name. Parameters in bold were the top 15 most sensitive parameters. The list of acronyms is CUE (carbon use efficiency), DOM (dissolved organic matter), LCI (lignocellulose index), MAOM (mineral-associated organic matter), eMAOM (exchangeable MAOM), sMAOM (stable MAOM), and POM (particulate organic matter).
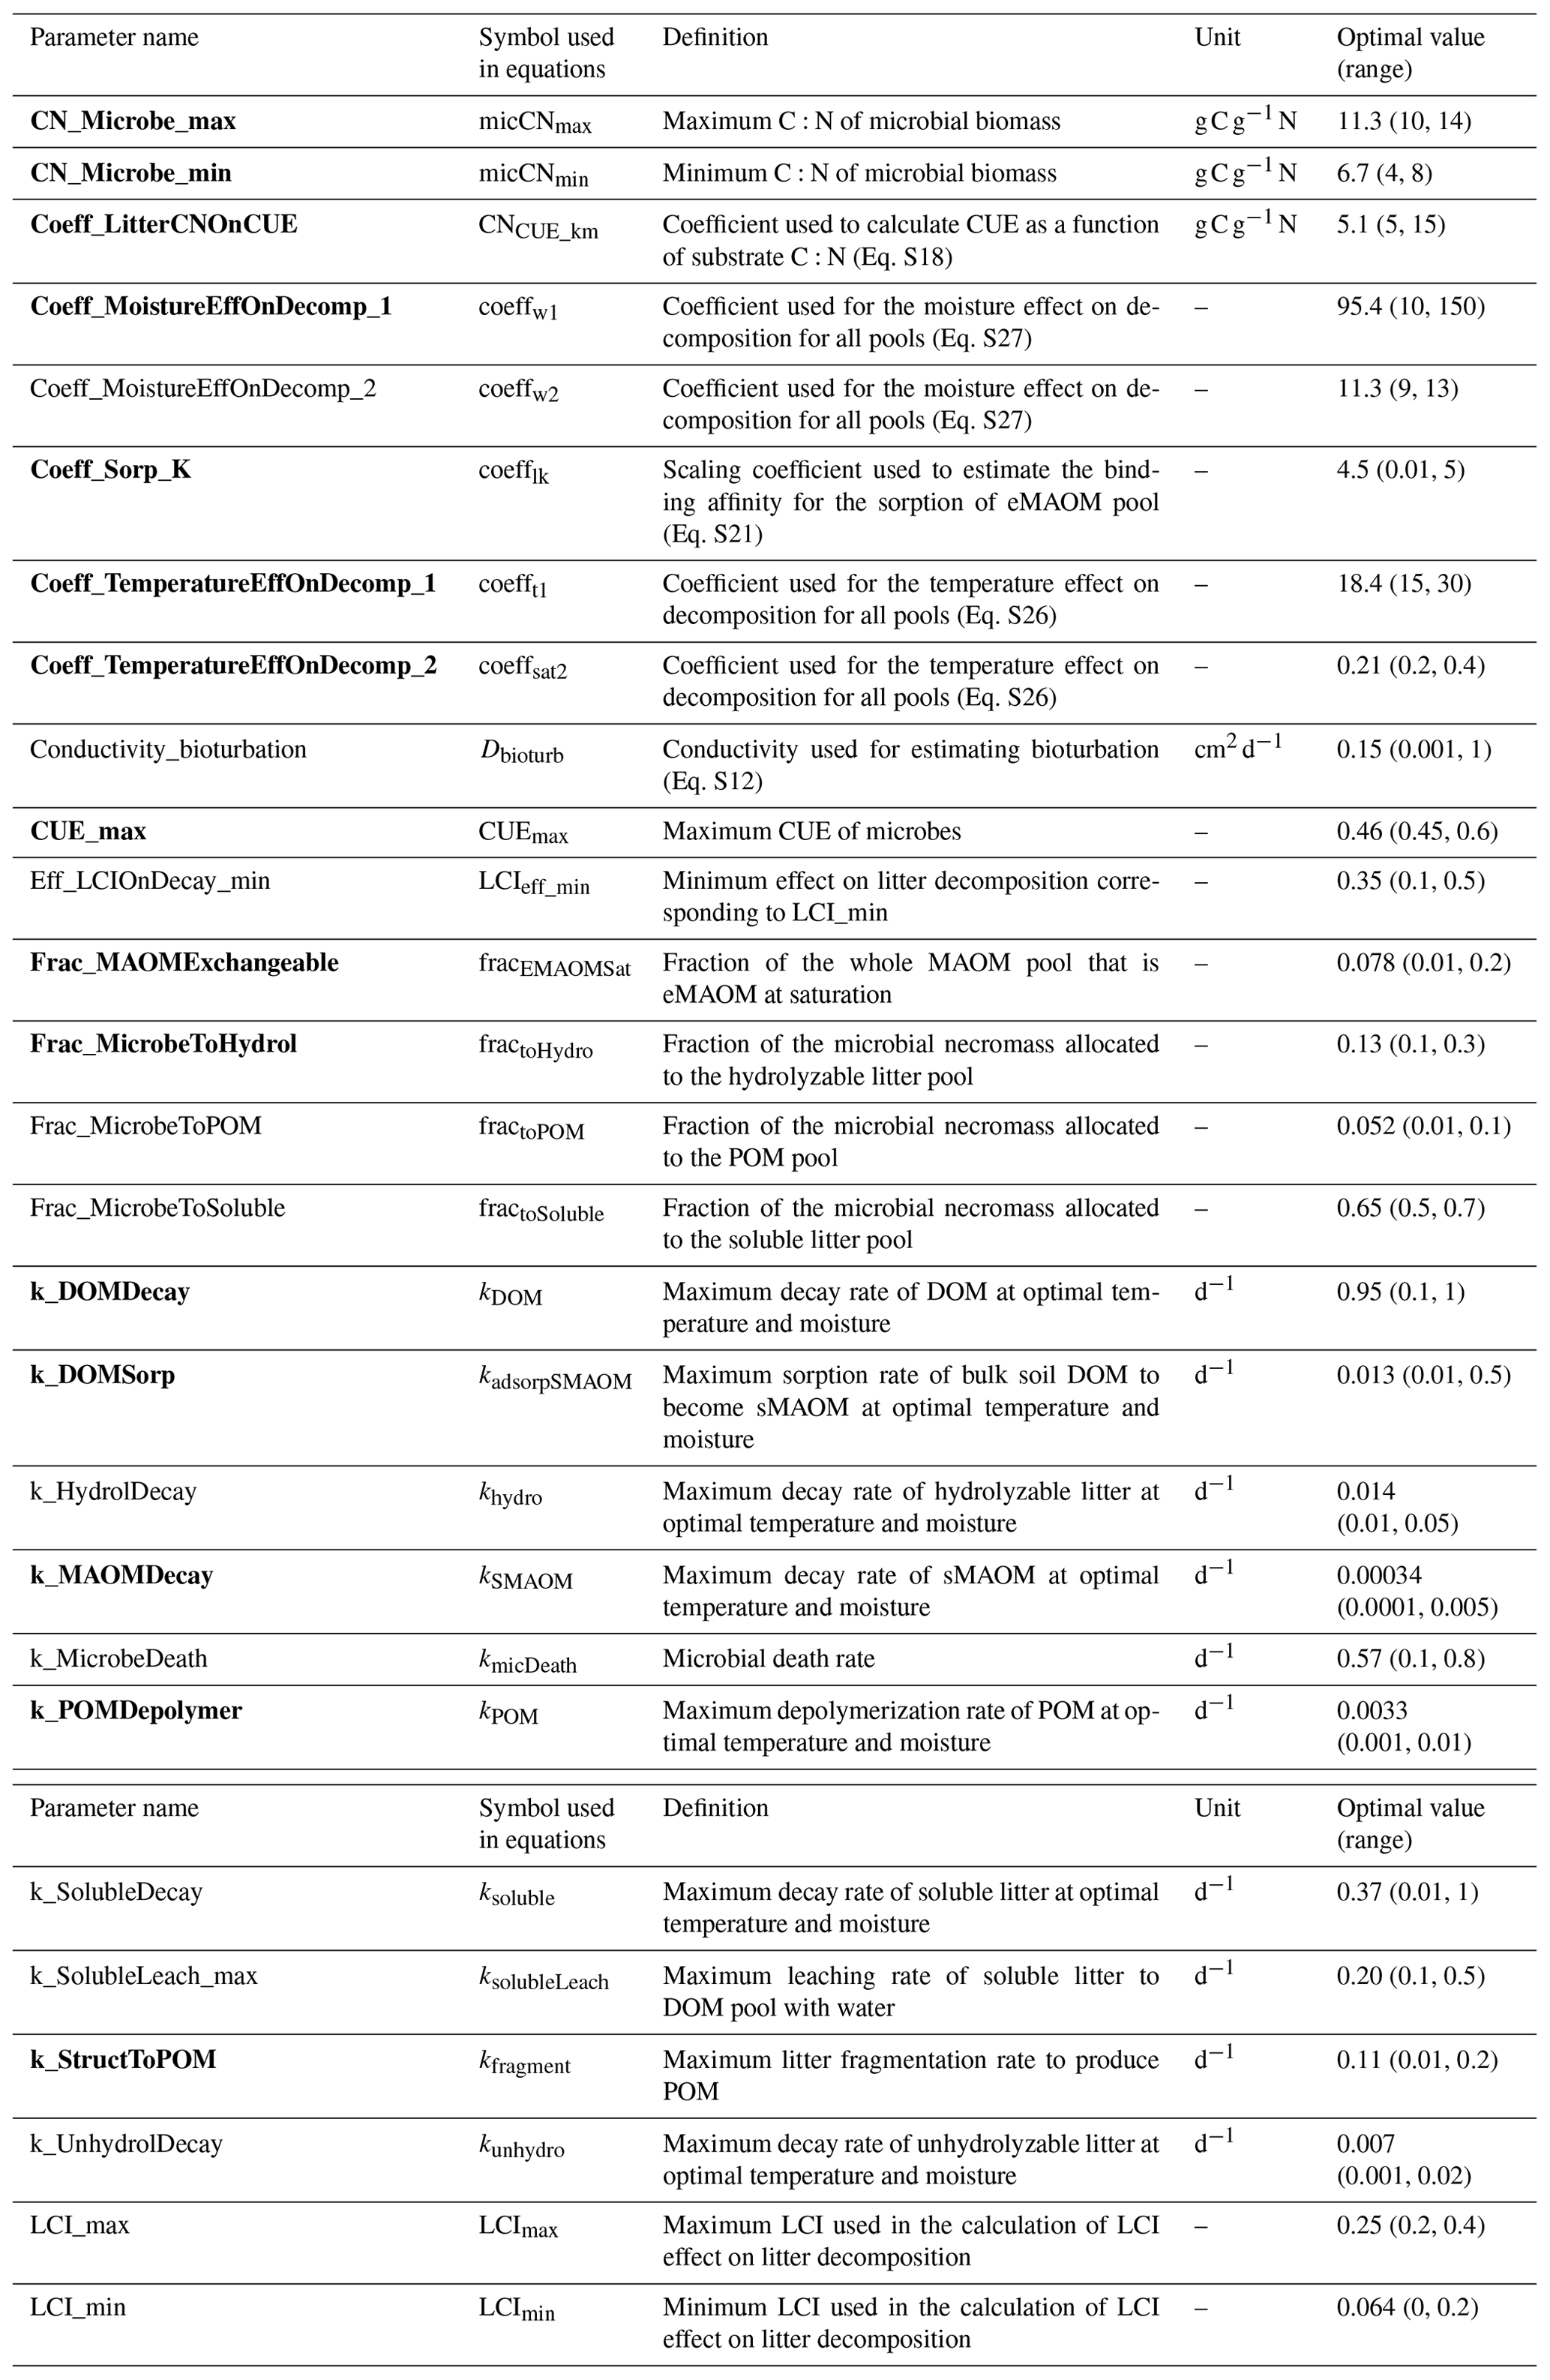
Prior to the calibration, a global sensitivity analysis on KONZ and CPER sites (wet and dry sites) was first conducted to select the most sensitive parameters used in calibration (Zhang et al., 2020a) based on the Sobol–Martinez method (Baudin et al., 2016) in the R package “sensitivity” (Iooss et al., 2020). The total sensitivity indices (Zhang et al., 2020a) account for interactions between parameters, but only SOM-related parameters were investigated. The parameter ranges were estimated based on the values reported in the literature and/or with estimates from manual calibration (Table 2). The response variables used in the sensitivity analysis were MAOM C and POM C in top 30 cm of the soil profile.
The six NEON sites were divided into calibration (KONZ, CPER, WOOD, and DCFS) and validation (NOGP and OAES) data sets. Our analysis follows the ecosystem model calibration and uncertainty analysis using DREAM described in Zhang et al. (2020a). The top 15 most sensitive parameters were selected for calibration for the NEON grassland sites (Table 2). The measured MAOM C and POM C in all horizons within the top 1 m of the calibration sites were used in the objective function. Although NPP can be input data in the model, it may still be modified by the model based on soil N. The plant growth submodel calculates plant N demand each day based on NPP, and when soil N cannot meet the plant requirement to maintain the minimum C:N ratio in biomass, the actual NPP is reduced accordingly. To prevent the reduction in NPP below the yearly total NPP, this was added in the objective function of the calibration.
All of the analyses were done in R (V3.5.1, R Core Team, 2017). Model results were evaluated using the coefficient of determination (R2), bias, and root mean square error (RMSE), which are commonly used in modeling studies (Zhang et al., 2020b).
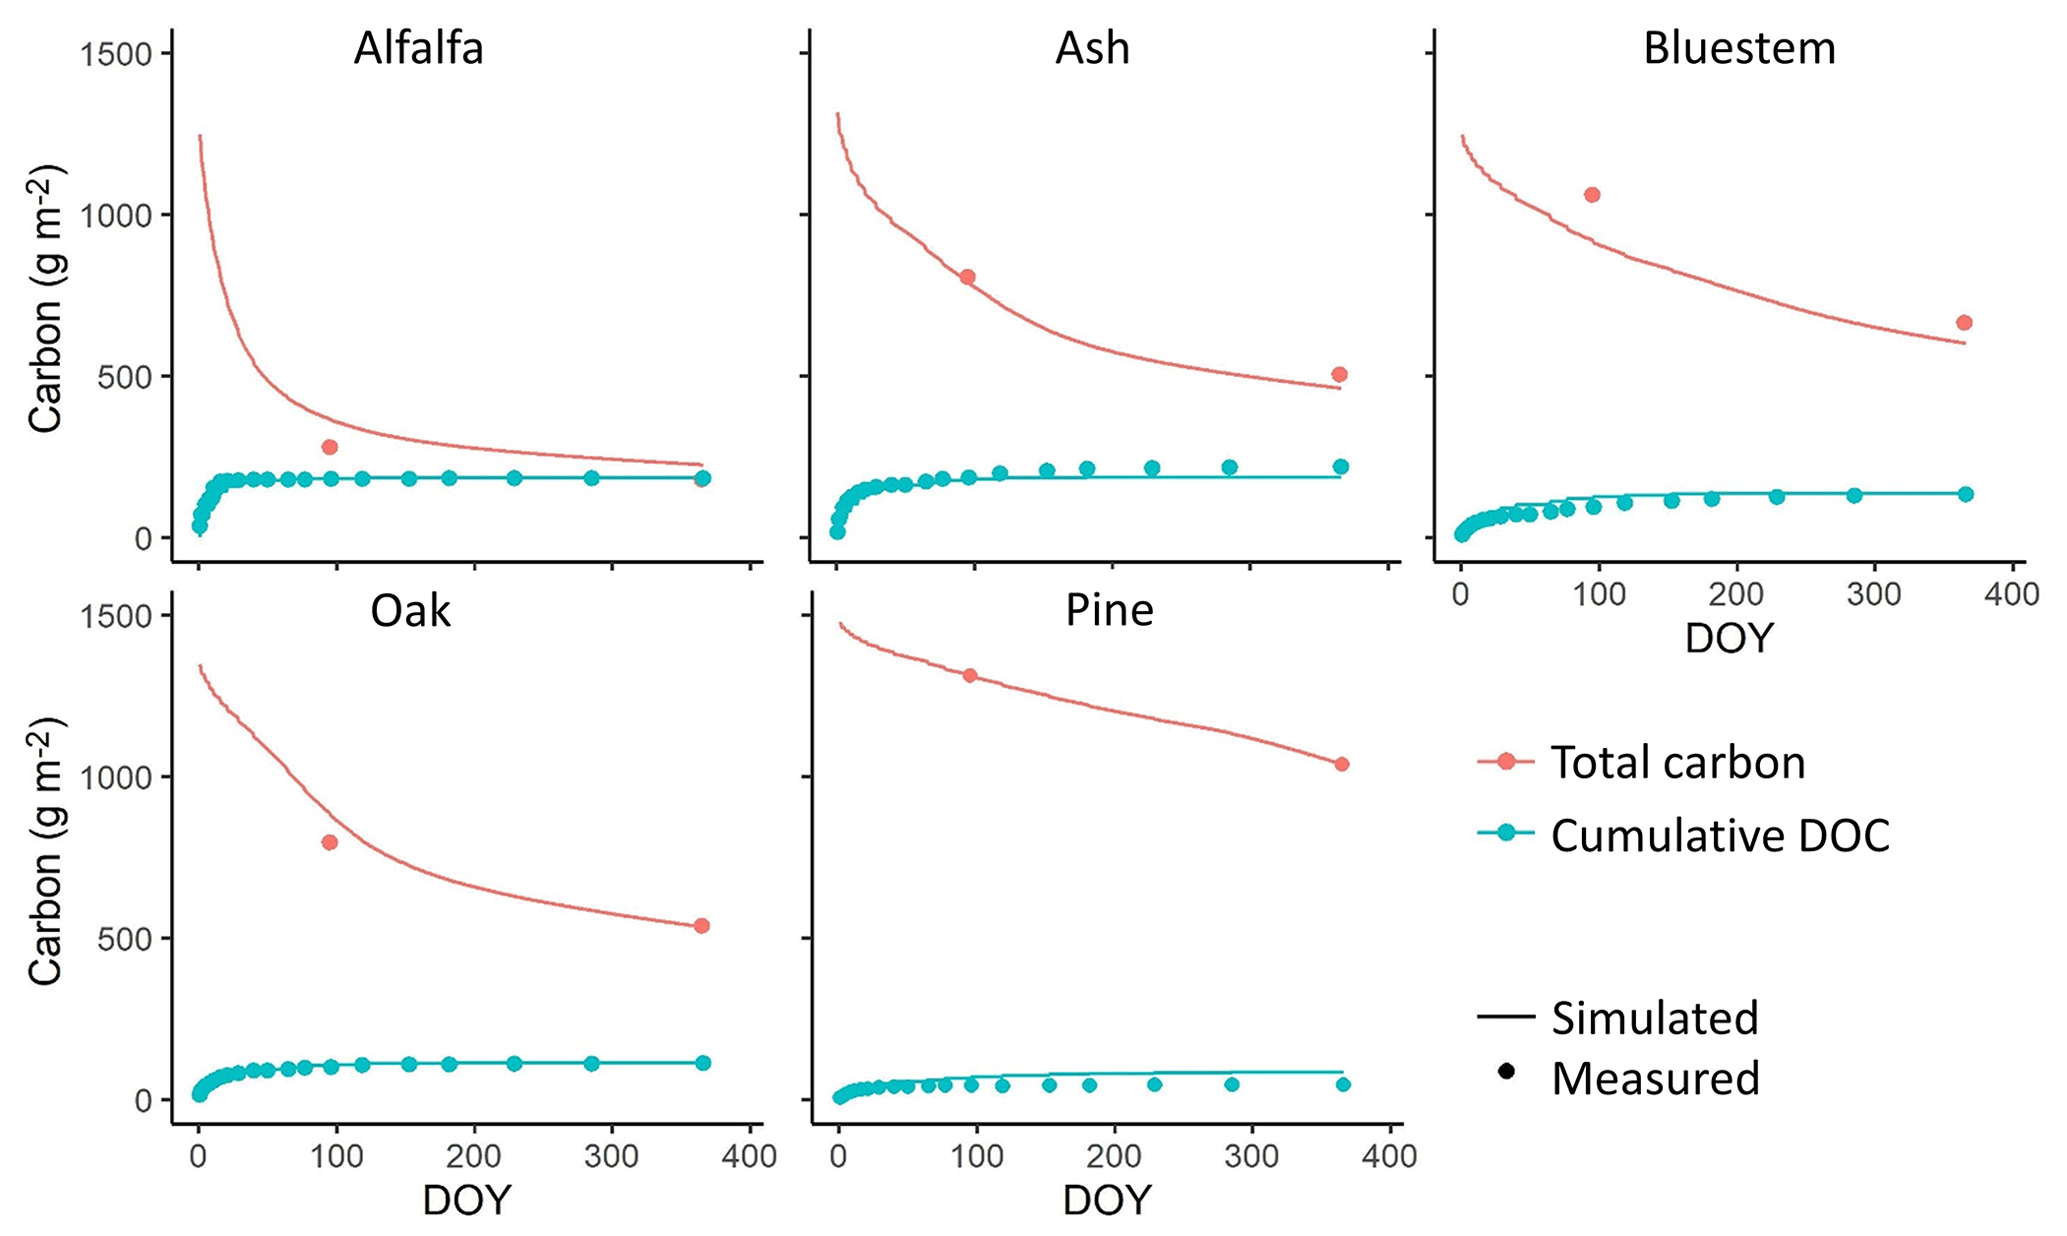
Figure 3Comparison between simulated and measured total litter layer carbon stocks and cumulative leached dissolved organic carbon (DOC) for a variety of litter types over 1 year from a one-time litter addition event using the stand-alone litter decomposition model in calibration. Measured data are from Soong et al. (2015).
3.1 Evaluating the stand-alone litter decomposition model
The litter decomposition experiment (Soong et al., 2015) showed that plant litter with a high C:N ratio and high LCI value decomposes more slowly. The stand-alone litter decomposition model represented this effect of litter chemical composition on C loss rates. The predicted litter layer C stock and cumulative dissolved organic carbon (DOC) leached during the year matched the measured values accurately in the calibration (Fig. 3). The R2, bias, and RMSE were 0.96, 2.93, and 65.65 g m−2, respectively, for the total litter C stocks across all pools and 0.9, −1.17, and 18.91 g m−2, respectively, for cumulative DOC leached.
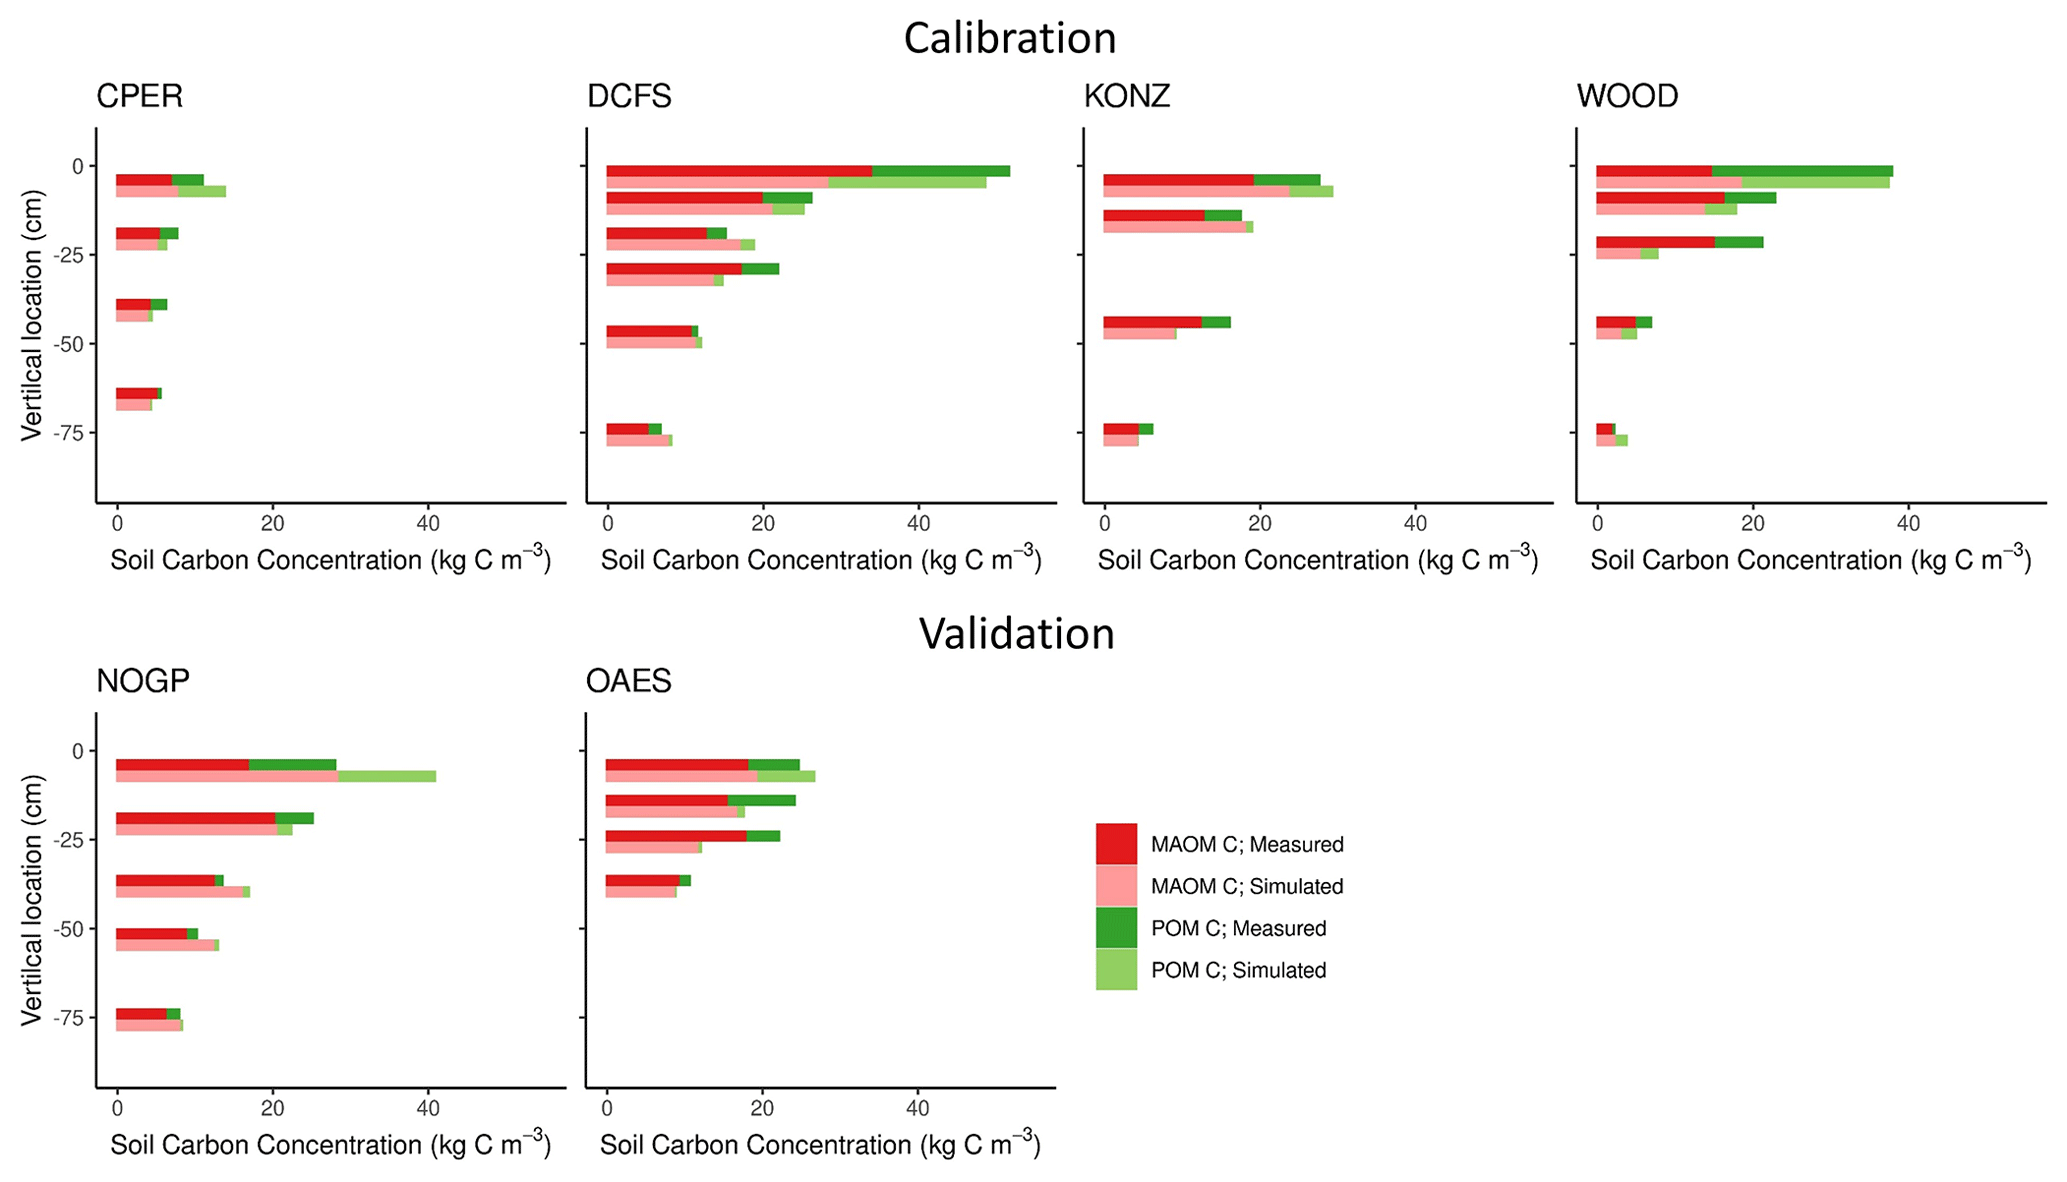
Figure 4Simulated and measured soil carbon (kg C m−3) in mineral-associated (MAOM) and particulate organic matter (POM) pools by soil horizon for calibration and validation sites from NEON. Sites are described in Table 1.
3.2 Evaluating soil organic matter predictions from MEMS 2.0
The six NEON grassland sites cover diverse climates and soil textures (Fig. 2 and Table 1), along with a wide range of soil C concentration and fractional distributions between POM and MAOM. The highest soil C content was found at the DCFS site, likely a result of relatively high NPP (Table 1) and relatively low decomposition rates (cold and relatively dry climate). The WOOD site is only 11 km away from the DCFS site, but the soil texture was different between the two sites, and the WOOD site was not grazed by livestock, while the DCFS was grazed. We expect the large difference in soil texture (Table 1) may explain the difference in fractional distribution in the topsoil layers at these two sites, with WOOD having a sandier texture and a larger proportion of total C and N in POM. The CPER site is located in a semi-arid climate with a soil texture of more than 70 % sand, though it still has a relatively high proportion of total C and N in the MAOM fraction. The CPER site has the lowest soil C content as a result of the low plant production and relatively high decomposition rates. KONZ, OAES, and NOGP all have similar C contents and approximately equal proportions of POM and MAOM, though NOGP has slightly more C in POM in the topsoil layer. At all sites, total soil C and N concentrations decreased, and the proportion of soil C and N in MAOM increased with depth (Fig. 4).
Table 3Statistics for the simulations of carbon and nitrogen concentrations (kg m−3) by layers in total, mineral-associated (MAOM), and particulate organic matter (POM) pools across the NEON grassland sites used for calibration and validation of the MEMS 2.0 model.

The calibrated model captured the distribution of C in MAOM and POM along the soil profile well for the four calibration sites (Fig. 4, Table 3). The model also captured the distribution of the soil C for the two validation sites well, but with slightly lower accuracy compared with the calibration data set (Table 3). The largest difference was found for the first soil horizon of the NOGP site, where the model overestimated MAOM C by 68.7 %. The model underpredicted C in the second and third horizon of the OAES site.
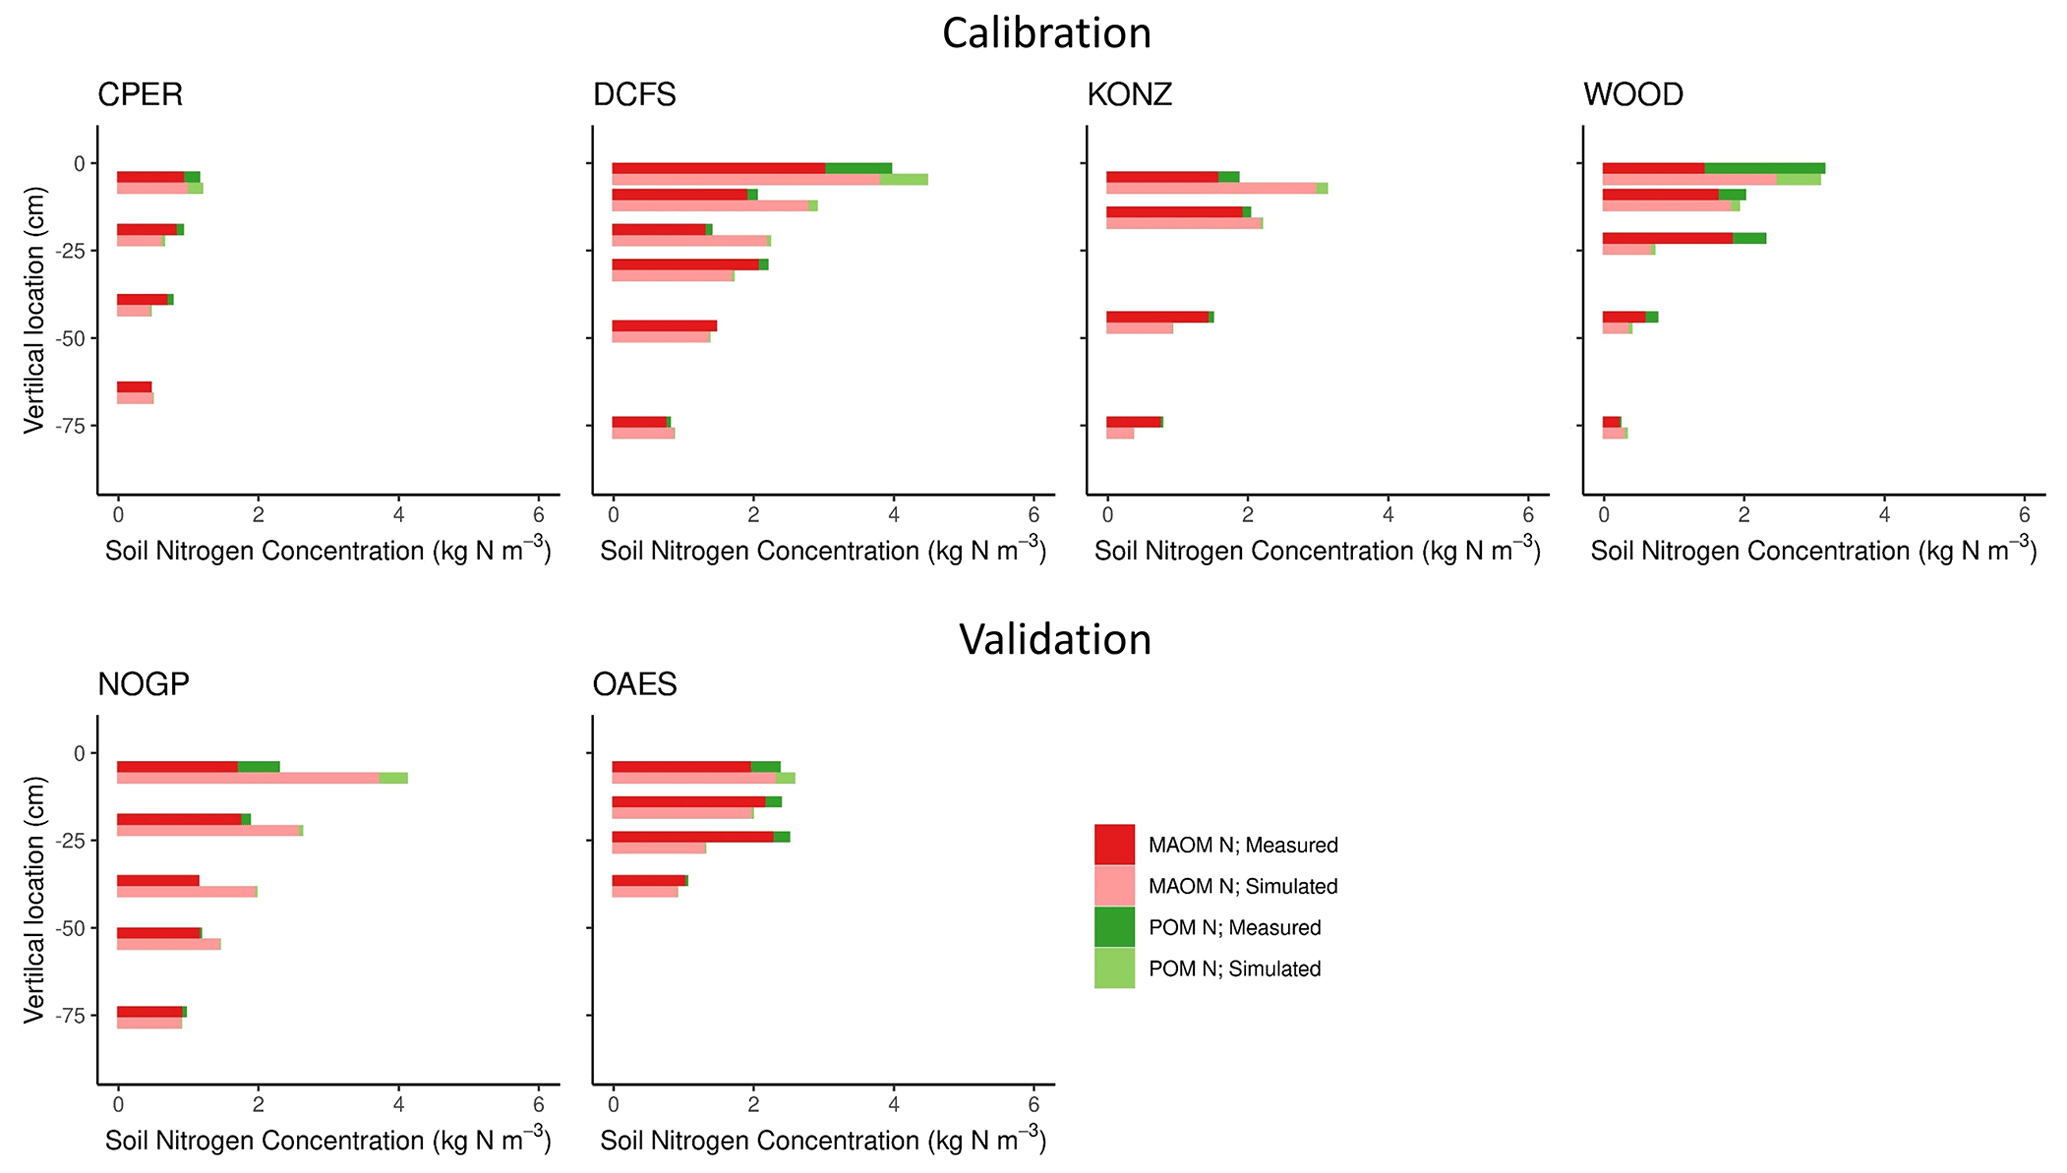
Figure 5Simulated and measured soil nitrogen (kg N m−3) in mineral-associated (MAOM) and particulate organic matter (POM) pools by soil horizon for calibration and validation sites from NEON. Sites are described in Table 1.
Our predictions of the soil N pools were slightly less accurate compared to those of the soil C pools (Fig. 5 and Table 3). Both the field measurements and model results showed that most (> 50 % on average, especially in deeper soil layers) of the C and N in grassland soils are stored in the MAOM fraction, which is more resistant to decomposition. As expected, the relative contribution of MAOM increases with depth, as structural aboveground plant inputs only contribute to POM in the top layer (Fig. 1), and structural root inputs to POM decrease with depth.
All measured data come from a single sample (NEON megapit) per site and soil depth, and they do not capture the natural site variability. Thus we cannot exclude that some of the discrepancy between measured and modeled values may be attributed to lack of spatial repetition of the measured samples.

Figure 6Total sensitivity indices from the global sensitivity analysis for steady-state C in mineral-associated (MAOM) and particulate (POM) organic matter for the 0–30 cm depth at two sites. Site characteristics are presented in Table 1. Definitions of parameters are presented in Table 2.
3.3 Parameter sensitivity for soil organic matter module in MEMS
A total of 27 parameters in the SOM module were tested in the sensitivity analysis. The model sensitivity analysis showed that C in MAOM at steady state was sensitive to different parameters than was POM, but the parameter rankings were similar between sites for the same pool of C (Fig. 6). The decay rate of sMAOM (k_MAOMDecay) had the largest effect on MAOM C, as expected. Similarly, the POM depolymerization parameter (k_POMDepolymer) had the largest effect on POM C. The second-most-sensitive parameter for both MAOM and POM was the coefficient used to define the temperature effect curve on decomposition (Coeff_TemperatureEffOnDecomp_1). Decomposition is well known to be largely affected by temperature (Conant et al., 2011). The MAOM C is also sensitive to the fraction of total sorption capacity that is exchangeable (Frac_MAOMExchangeable) and the sorption rate of DOM to sMAOM (k_DOMSorp), while all other parameters had relatively low sensitivity index values. All the other parameters tested had relatively low impact on POM C. Almost all the litter-decomposition-related parameters have low sensitivity indices; these parameters may substantially affect C in MAOM and POM within a short time after litter is produced, but the effect is low when the system reaches steady state. The parameters defining the soil water effect on decomposition appeared to have a higher impact on both POM and MAOM at the dry site CPER than at the wet site KONZ.
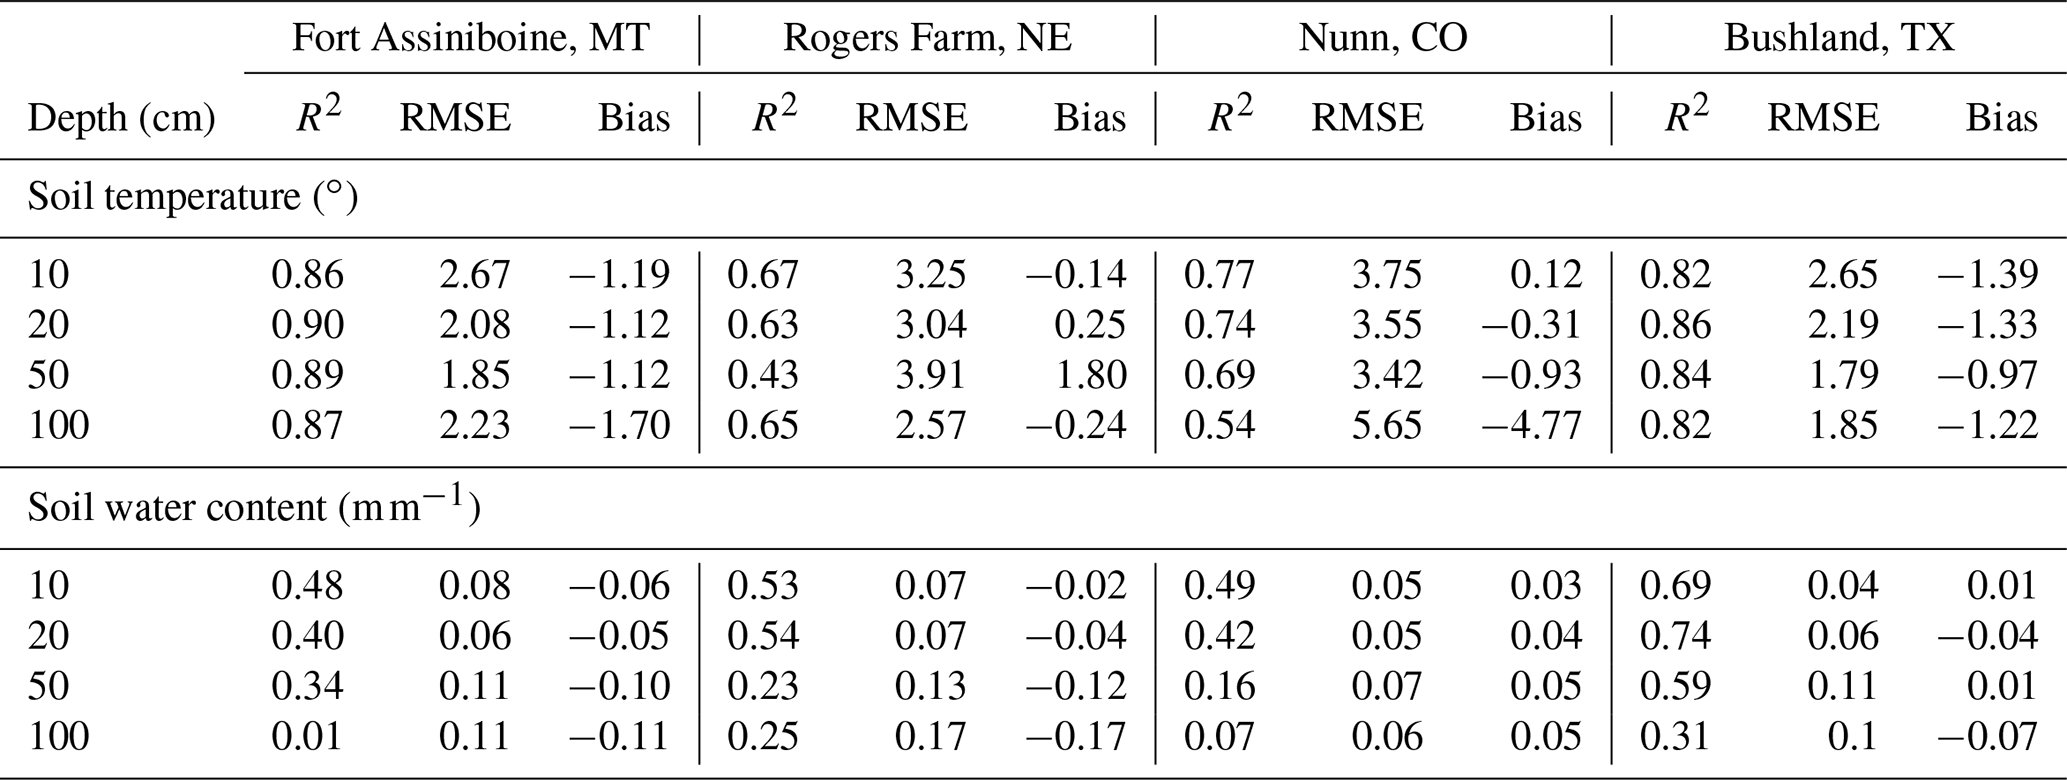
Table 4The statistics of simulated soil temperature and water content of four SCAN sites for model testing. Daily values in the growing season (between day of year 100 and 300) of 5 years (2014–2018) were used. Winter period is excluded because the moisture sensor measures liquid water and the model predicts total water.
3.4 Evaluating the predictions of soil water, soil temperature, and ecosystem fluxes
Soil temperature and moisture are the two major abiotic environmental factors controlling decomposition. Overall, the model prediction for soil temperature is relatively accurate (Table 4 and Fig. S3). The Nunn site in Colorado had lower accuracy than the other sites. Regarding soil moisture, the overall accuracy was lower than that of soil temperature. The accuracy of model predictions of SWC decreases down the soil profile (Table 4 and Fig. S3). Changes in SWC further from the surface (100 cm) were small as most rainfall events at these sites did not reach deeper soil depths.

Figure 7Comparison between weekly gross primary production (GPP), ecosystem respiration (ER), net ecosystem exchange (NEE), and evapotranspiration (ET) from eddy covariance measurements at the KONZ prairie (Table 1) and simulated (validation data only). Data from the year 2007 were used for GPP calibration.
The model predicted measured weekly cumulative GPP with relatively high accuracy (R2 = 0.83, bias = 2.98 g C m−2, and RMSE = 15.46 g C m−2). However, it slightly overpredicted the peaks of GPP in summer (Fig. 7). The model also captured the changes of ER with R2 = 0.89, bias = 6.43 g C m−2, and RMSE = 9.02 g C m−2. The difference between GPP and ER is NEE. As GPP was overpredicted and ER was underpredicted, the NEE prediction was biased in summer periods (R2 = 0.67, bias = 3.45 g C m−2, and RMSE = 12.22 g C m−2). The modeled actual ET matched the measurements with R2 = 0.71, bias = 0.07 cm, and RMSE = 0.73 cm. The measurements from the EC tower at the Konza Prairie used in this study showed lower GPP, ER, and ET in 2009 compared with the other 2 years (Fig. 7). However, the model predictions did not show the same pattern. Due to the biases in predicted GPP and ER, the model underestimated NEE in the summer growing seasons of the 3 years.
We built the MEMS 2.0 ecosystem model to represent state-of-the-art understanding of plant–microbe–soil C and N dynamics, using biophysically defined and measurable pools and fluxes. MEMS 2.0 included our new understandings of microbe–mineral relationships (Cotrufo et al., 2013), dynamic CUE (Soares and Rousk, 2019), point of entry (Sokol et al., 2019), saturation (Castellano et al., 2015; Feng et al., 2013), and in vivo/ex vivo pathway (Liang et al., 2017). Our goal was to have a tool that can be improved over time to represent different ecosystems and drivers (e.g., fire, fauna, and management) as new understanding emerges and can be useful for scientific research inquiry as well as decision support. Here we discuss the novel capabilities of the MEMS 2.0.
4.1 Measurable pools
To our knowledge, there are no other models that were calibrated and validated using measured soil C fractions from multiple sites, except for MEMS 1.0 (Robertson et al., 2019), although measurable pools are present in many new-generation models (Table S1). However, as MEMS 1.0 lacks soil water and separation of belowground and aboveground plant inputs, it was only able to capture overall patterns and could not simulate individual sites with high accuracy. Another model, CORPSE, only compared two values of MAOM data from two sites with simulated results (Sulman et al., 2014), and it is hard to judge the model performance with two data points. The MEMS 2.0 model simulated C and N distribution in MAOM and POM in all soil horizons which matched the measurements relatively well (Table 3, Figs. 4 and 5). This suggests that the theories of MAOM and POM formation and persistence used in our model may be robust; however, further testing is certainly needed.
Our Bayesian optimization showed there is a large difference between the POM and sMAOM pools in terms of their decomposition rates, further confirming the need to consider these two pools separately when predicting soil C stocks (Cotrufo et al., 2019). The calibrated values for these two parameters – the maximum depolymerization rate of POM and maximum decay rate of stable MAOM – were 0.0033 and 0.00034 d−1, respectively, which indicated the average turnover time for sMAOM was an order of magnitude slower than POM. This generally aligns with a wealth of experimental data quantifying average turnover times of these two SOM fractions (von Lützow et al., 2007; Tiessen and Stewart, 1983).
4.2 Topsoil vs. subsoil
The formation and dynamics of SOM in topsoil and subsoils are believed to be very different (Ota et al., 2013; Johnson et al., 2014), but many current models do not represent these differences explicitly. There have been some efforts to modify traditional models to better represent subsoil processes; however the underlying assumptions in these models do not reflect our current understanding of SOM formation in subsoil. For example, the modified RothC model for subsoil SOM in Jenkinson and Coleman (2008) assumed that all the SOM pools move downward in the soil profile at the same rate and that the decomposition rate constant (k in our Eq. 1) decreases exponentially along the depth. Yet it is the vertical movement of DOM which is known to be a key driver of SOM distribution in subsoils (Ota et al., 2013); thus MEMS 2.0 simulates this transport. Also, the bioturbation that moves POM down through the soil profile has been found to be a key input of SOM to subsoils (Johnson et al., 2014), so we included it in MEMS 2.0.
Our measurements showed that the fraction of POM in the topsoil is substantially higher than that in the subsoil. This can be explained as the topsoil directly receives aboveground litter and a large proportion of the root litter, which are primary inputs to POM, while the subsoil receives proportionally less litter and more DOM and microbially derived compounds, which are primary inputs to MAOM. MEMS 2.0 captured this pattern (Fig. 4). Regarding our modeled MAOM and POM C stocks in the topsoil, they were consistent with the measurements for the calibration sites and the OAES site used for validation. However, the model overestimated MAOM C in the topsoil at the NOGP site. The NOGP site has lower sand content in the topsoil relative to the other sites, which results in a higher predicted MAOM saturation limit according to the linear equation used in the model (Eq. S24 and Fig. S2; the saturation limits for NOGP, DCFS, and WOOD were 45.0, 34.8, and 21.35 kg C m−3, respectively) (Feng et al., 2013). The high MAOM saturation limit may explain the overprediction of MAOM C in the topsoil of NOGP. Although sand content (or the sum of clay and silt content) has been used for estimating MAOM saturation deficit in many studies, other studies have suggested that soil texture alone may not be the best indicator (Beare et al., 2014; Curtin, 2002; Rasmussen et al., 2018). The MEMS 2.0 simulations of C distribution and C fractions in MAOM and POM in deeper soil layers matched the measurements relatively well. With advancements in understanding of C and N in deep soils built into MEMS, we were able to represent the distribution of C of these grassland sites across the range of climates and soil properties. The largest discrepancy between predicted and measured MAOM C in deeper layers is at 25 cm (third soil layer in Fig. 4) at the WOOD site. The reason might again be related to the simulated MAOM saturation. The sand content of the top two layers of this site is 55 % and 59 %, but it increases to 74 % in the third layer. The low simulated MAOM saturation limit in this layer may have constrained the accumulation of C in the MAOM pool in our simulation. Overall, the model tended to underestimate POM C in the deeper layers across all sites, and there are several possible reasons for this. We use a simple representation of bioturbation by soil fauna that moves POM downward in the soil (Eq. S12). We used a constant coefficient for all sites (decreases along the soil profile as a function of root distribution) without considering differences in climate, soil properties, and fauna community composition. The uncertainty in root depth and distribution (Jackson et al., 1996) and the assumption that the bioturbation rate is a function of root distribution are other possible reasons for the underestimation of POM C in deeper layers in the model. It is also possible that the maximum POM decomposition rate in deep soil is reduced compared with the topsoil (Gill et al., 1999), but because these dynamics are not well understood we chose to use the same maximum specific decomposition rate for all soil layers. There are very limited data on soil bioturbation and decomposition in subsoil, and we believe models including MEMS 2.0 can be substantially improved as more data on these processes become available.
4.3 First-order vs. microbially explicit
While MEMS 2.0 uses first-order decay, it also represents microbial moderators of decomposition rates. The decay equation used in MEMS 2.0 (Eq. 1) is different from the first-order method used in traditional SOM models (e.g., CENTURY model). The decomposition rate in MEMS 2.0 is mediated by the dynamic microbial C:N ratio, and a dynamic CUE is used for microbial assimilation. This microbially mediated decay is also different from the commonly called “microbially explicit” approach, in which microbial biomass directly interacts with the decomposition rate (e.g., CORPSE model). Luo et al. (2016) stated that – although the microbially explicit models might better explain priming effects, microbial acclimation, and pulse responses to some environmental changes – they tend to produce unrealistic oscillatory responses to perturbations, and their simulated C storage is not sensitive to C input. Georgiou et al. (2017) proposed a way to reduce the oscillation and correct the insensitivity to C input by introducing a density-dependent formulation of microbial turnover. Decomposition is a complex process involving a community of microbes and various extracellular enzymes, and, while recent models with microbial groups and/or extracellular enzymes explicitly represented have been developed (e.g., MEND model), there is lack of evidence that these models can be widely applied to different environmental conditions, and the parameters required are not readily available for large regional applications. For instance, the lack of data for parametrization may lead to treating a variable enzyme pool as a constant, resulting in a decomposition equation equivalent to a first-order equation, as in the case of the FoBAAR ecosystem model (Sihi et al., 2018). To avoid too complex a model structure and to enable wide applicability of the model, we chose to use a microbially moderated first-order approach in MEMS 2.0.
The simulation of the litter decomposition experiment with the stand-alone MEMS litter model and the simulated EC flux data showed that the modified first-order approach in the MEMS model captured the temporal dynamics of decomposition. The simulated C fluxes matched the EC observations, and the accuracy was comparable to or better than other published modeling studies (Chang et al., 2013; Schaefer et al., 2012; Yan et al., 2015). Measurements at the KONZA site show less plant C assimilation and lower ER during the 2009 growing season compared with the other 2 years (Fig. 7). However, the air temperature, precipitation, and solar radiation in 2009, especially over the growing season, were similar to conditions in the other 2 years. Since these weather variables are the main drivers of interannual variability in the model (assuming that management is constant over time), the model does not explain the observed difference in growing season C fluxes in 2009. It is possible that a factor not accounted for in the model (e.g., differential pest pressure) may have caused lower plant C assimilation and respiration in 2009.
We acknowledge that MEMS 2.0 may not simulate the priming effect on SOM decomposition well. However, the mechanisms behind the priming effect are still not clear (Li et al., 2018). Contrary to the assumption used in microbially explicit models, some studies find no robust correlation between soil microbial biomass and priming (Liu et al., 2017). Studies also show the quality of substrate and N availability might mediate the priming effect (Stewart et al., 2015; Kuzyakov, 2010; Chen et al., 2014). We will continue to follow advancements in the understating of the priming effect and will modify the model to represent it when there is more consensus around mechanisms.
4.4 Microbial control on N
Our model explicitly represents the N mineralization and immobilization processes and uses a dynamic microbial C:N ratio to control the N concentration in SOM pools instead of fixing the C:N ratios or setting ratio limits for SOM pools (e.g., DayCent model). MEMS 2.0 calculates the demand of mineral N from microbes and plants, and then the actual uptake of mineral N is a competition between them. The FUN-CORPSE model (Sulman et al., 2017) calculated N uptake using the FUN hypothesis (Brzostek et al., 2014), and the calculation relies on fixed C:N ratios in plant components. While the assumption of constant C:N ratios in plant components (e.g., of wood tissue) is common for trees, herbaceous plants are known to have a wide range of C:N ratios depending on the availability of mineral N in the soil (e.g., Schepers et al., 1992). In MEMS 2.0, the C:N ratios in plant components are dynamic and depend on mineral N availability and uptake.
MEMS 2.0 predicted soil organic N stocks reasonably but with lower overall accuracy than soil C (Fig. 4, Table 3), possibly because soil N cycling is more complex. One of the possible causes is the uncertainty in our input data of the atmospheric N deposition and biological N fixation, which are the two main external inputs of N to these grassland sites. Another possible cause is that N consumed and excreted by grazers is not accounted for in our simulations. The simulation of N and use of measured pools make MEMS 2.0 relatively unique with regard to new-generation models, most of which either do not model N or have not been validated with measured soil N (Table S1).
4.5 Point of entry and in vivo/ex vivo pathway
Soil is conceptually divided into rhizosphere and bulk soil compartments in MEMS 2.0, allowing for representation of differences in inputs and SOM formation processes between the two (i.e., “point of entry” sensu Sokol et al. 2019).
The leaching of DOM from the rhizosphere to bulk soil is modeled as a diffusion process that is a function of the water-filled pore space (Eq. S9). This leaching process is in most cases much slower than the leaching of soluble fraction of litter from the soil surface (Eqs. S9 and S1). As a result, the soluble fraction of root litter is more likely to be processed by microbes in the rhizosphere before entering bulk soil than is surface litter. The microbially processed (in vivo) and unprocessed (ex vivo) DOM is combined into one DOM pool in the model. However, the ratio of these two DOM sources affects the C:N ratio of the DOM pool, and once combined they can be absorbed to the mineral surface, implicitly representing the in vivo and ex vivo pathways of MAOM formation (Fig. 1).
4.6 Separation of eMAOM and sMAOM
MEMS 2.0 includes two pools of MAOM, characterized as “exchangeable” and “stable”, with the underlying assumption that a certain fraction of the MAOM pool is associated with the mineral surface with weak binding and thus exchangeable (Kleber et al., 2007). The MEND model uses a similar structure, where a Q pool is defined as the adsorbed phase of DOM, which is separate from the stable MOC (mineral-associated carbon) pool.
In MEMS 2.0, we defined separate saturation limits for eMAOM and sMAOM. The sum of the limits is the total saturation limit for a soil defined by the linear equation (Eq. S24 and Fig. S2). A parameter (Frac_MAOMExchangeable) was used to define the limit for eMAOM relative to the total saturation limit. The value of this parameter was not based on measurements but optimized in our Bayesian optimization algorithm. A wide prior range was used because there are currently few data upon which to base this partitioning. The actual amounts of eMAOM and sMAOM as well as their proportions in MAOM are dynamic in the model depending on soil texture, litter quality, water flow, and microbial activity. Our result showed the proportion of eMAOM in MAOM ranged between 14 % and 27 % in the topsoil layers of the NEON sites in our simulations, with a trend of increasing at deeper depths. Experimental data are needed to verify these findings. One hurdle to producing these data is reaching scientific consensus around a reliable method for measuring exchangeable MAOM (Schrumpf et al., 2020). We plan to verify and re-parameterize the partitioning of MAOM between exchangeable and stable pools in the future as these data become available.
4.7 Environmental variables
4.7.1 Simulated soil temperature
The method used for soil surface temperature estimation was adopted from the empirical method used in the DayCent model, which has been tested in various systems (Parton et al., 1998; Zhang et al., 2013). Our validation also showed the predicted soil temperature at 10 cm matched the measurements. The model tended to underestimate soil temperature at 10 cm at Nunn, Colorado, in 2014 (Fig. S3), though the bias was much smaller in other years. This may be due to an underestimation of the amount of surface litter and live biomass in that year as the litter and biomass quantities are the two independent variables in the empirical equation. The lower accuracy at 100 cm at Nunn (Table 4) is likely caused by a biased estimation of the thermal conductivity for soils with high sand content and low soil moisture. According to the classical heat transfer equation, the main factor influencing soil temperature is the thermal conductivity when the two boundary conditions (soil surface and soil bottom) are well estimated (Bittelli et al., 2015). This underestimation of soil temperature at deep depth could lead to an underestimation of decomposition rate and overprediction of soil organic carbon (SOC) stock. However, at the NEON CPER site (close to the Nunn site in distance and similar in soil texture), SOC at deeper depths was slightly underestimated. This may again be related to the saturation limit of soils with high sand content discussed previously.
4.7.2 Simulated soil moisture
Our simulation accuracy of soil water is similar to other models (e.g., Shelia et al., 2018). It is common to see lower prediction accuracy for SWC in deep soil layers in modeling studies (e.g., Zhang et al., 2018). A model like MEMS 2.0 that receives only daily precipitation input without rainfall intensity data cannot very accurately estimate the amount of infiltration and surface runoff, especially for large rainfall events. The SWC at deeper depths is impacted by this inaccuracy to a greater extent than the upper soil layers. For example, when infiltration was underestimated, the topsoil was filled with water regardless of the rainfall intensity, but the deep soil may not receive any water as the downward flow did not reach deeper depths. Additionally, for a 1D model, it is not possible to capture the slope and hill position effects on lateral flow of water. The use of pedotransfer equations, which carry significant uncertainty in estimating soil hydraulic properties (Saxton and Rawls, 2006), added uncertainty and contributed to the bias. The SWC at 100 cm at the Rogers Farm site was constantly close to saturation (Fig. S4), while the model predictions were at field capacity. It is likely that there was a relatively high water table at that site (no measurements available) because otherwise the SWC at 100 cm would be at field capacity for a free drained soil. However, for a 1D model, water table depth is needed to be provided as an input to simulate a high water table, and this information was not available for the Rogers Farm site. As none of the NEON sites used in this study has a shallow water table, it is not possible to test the model accuracy on SOM dynamics in such situations.
4.7.3 Effect of temperature and moisture on decomposition
Parameters related to soil temperature and moisture effects on decomposition were found to be relatively sensitive in our sensitivity analysis. We used a temperature effect curve (which served as a modifier in Eq. 1) similar in shape to that in MEMS 1.0 but used a different equation with fewer parameters (Eq. S26 and Fig. S4). Both curves assume the slope of the decomposition rate curve (reflecting the sensitivity of decomposition to temperature) decrease at very high temperatures, which is different from a Q10 curve with a consistent increase in the slope of reaction rate with temperature. This decrease in the sensitivity of decomposition rates to temperature at high temperature is supported by field observations (e.g., Del Grosso et al., 2005), and our calibrated temperature effect curve was very similar to the recently calibrated curve used in the DayCent model (Gurung et al., 2020) (Fig. S5). Our calibrated soil moisture effect curve was also similar to the curve used in DayCent (Fig. S5).
In a sensitivity analysis of the DayCent model, Gurung et al. (2020) found that the top four most sensitive parameters for soil C are the maximum decomposition rate of the passive pool, the maximum decomposition rate of the slow pool, and the two parameters controlling the curve of temperature effect on decomposition. The passive and slow pools are the two largest soil C pools in the DayCent model. This is similar to our results for the MEMS 2.0 model, where the most sensitive parameters were the decay rates of the POM and MAOM pools and the temperature effect on decomposition. The role of temperature in controlling decomposition is much higher than the other abiotic factors in both models. By studying several SOM models, Sierra et al. (2015) found that temperature has a stronger control than moisture on the sensitivity of decomposition rates, which is also supported by experimental evidence (Reichstein et al., 2005; Yuste et al., 2007).
4.8 Model limitations and future work
Following the same design concept of MEMS 1.0, we aimed to keep the model as parsimonious as possible while representing new understanding of SOM dynamics and litter decomposition. Here we describe what we consider to be the main limitations of the model, which we will address during future model development and improvement.
4.8.1 Grazing
In the current model version, large ungulate grazing is not explicitly modeled, but we plan to incorporate representation of grazing management in the future. In a global review of grassland, McSherry and Ritchie (2013) found that moderate grazing may increase or decrease total soil C depending on grass type, and the mean effect was generally within ± 10 %. Even for heavy grazing, the mean effect is around ± 15 %. Grazing impacts ecosystem C and N dynamics in many ways, including by removing aboveground plant biomass and reducing plant litter (Piñeiro et al., 2010), modifying plant growth rates and biomass allocation (Matches, 1992; Wei et al., 2011), changing root exudation (Hamilton et al., 2008; Sun et al., 2017), and adding C and N inputs from feces and urine (Matches, 1992; McSherry and Ritchie, 2013). Management practices such as adaptive multi-paddock grazing, which may alter soil C and N stocks compared with continuous grazing (Byrnes et al., 2018), need to be accurately modeled to fully understand C dynamics in grassland.
4.8.2 Temperature responses of SOM fractions
We used the same temperature responses for all SOM fractions in MEMS 2.0. The differential temperature responses of SOM fractions have been suggested (Conant et al., 2011; Davidson et al., 2000; Davidson and Janssens, 2006) and demonstrated in past studies (Benbi et al., 2014). Results are not consistent, however, especially between lab and field studies, and more data are needed to accurately quantify the differences and provide measurements for model calibration. Specifically, measurements of temperature effects on processes involved in POM and MAOM formation and decomposition – such as CUE, enzyme activities, and microbial respiration rates – would enable more accurate representation of temperature effects on soil C and N dynamics in future versions of the MEMS model.
4.8.3 Microbiota
Currently, microbiota is modeled as a single entity in each model compartment, despite the significant differences between microbial groups in growth forms, life strategies, biomass stoichiometry, substrate preferences, and many traits that influence C and N cycling. We plan to increase the complexity of the microbial aspects of the model in future model versions, beginning with separation of bacteria and fungi, which will include representing arbuscular and ectomycorrhizal systems separately because of their highly contrasting traits (Graaff et al., 2010; Hodge et al., 2001). In future model versions, bacterial and fungal pools will have different N demands, CUEs, growth rates, substrate preferences, pH preferences, responses to disturbance, and necromass contributions to plant litter and SOM pools.
4.8.4 Soil pH effects
Soil pH is a static soil property in MEMS 2.0, but pH is dynamic in nature and has important effects on plant growth (Islam et al., 1980), microbial activity (Walse et al., 1998), and SOM dynamics (Averill and Waring, 2018). The grassland sites in our simulation have close to neutral pH, and it is thought to be relatively stable through time. However, representing other sites, especially those where shifts in pH may be a major driver of C and N dynamics (e.g., fertilized systems), will require dynamic modeling of pH and its effect on decomposition. This is a major goal of future model development efforts. Furthermore, soil mineralogy and redox conditions play important roles in mediating MAOM formation and persistence (Hall et al., 2015; Huang and Hall, 2017; Kögel-Knabner et al., 2008), but they are currently not included in MEMS 2.0.
Finally, MEMS 2.0 has been developed, calibrated, and tested using temperate grassland sites, and further development and testing for different ecosystem types and climatic regions are needed to increase the utility of the model.
MEMS 2.0 is an ecosystem model built on the same foundational principles as MEMS 1.0: (1) the use of measurable pools that can be directly validated, (2) the MEMS hypothesis linking litter chemistry to microbial substrate use efficiency and SOM formation, and (3) saturation behavior of the MAOM pool. In developing MEMS 2.0, we created a full ecosystem model and expanded upon the foundational principles to incorporate updated understanding of SOM dynamics, such as the point-of-entry framework (Sokol et al., 2019) and in vivo and ex vivo pathways of SOM formation (Liang et al., 2017), through the entire soil profile. The resulting model represents ecosystem C and N pools in grassland systems across a wide range of climates and soils. In addition to calibrating and verifying the model in diverse systems beyond grasslands, future development will also aim to incorporate additional controls on SOM dynamics such as management impacts and additional environmental factors, including variable pH and redox conditions, mineralogy, soil microbial community structure, and temperature sensitivities. Much of the planned development hinges upon the availability of data quantifying these relationships across ecosystems, soil types, and soil depths, and we encourage experimentalists to continue this important work and disseminate their results to bolster modeling efforts such as this one. Using mechanistic models with measurable pools allows for detailed hypothesis testing to improve understanding of SOM dynamics and will ultimately provide more reliable predictions of land–climate feedbacks for use in land management and global change mitigation.
The NEON data set is available at https://data.neonscience.org/ (NEON, 2020b). The SCAN data set is available at https://www.wcc.nrcs.usda.gov/scan/ (USDA-NRCS, 2020). The EC data used in this study can be found on the website of AmeriFlux (https://ameriflux.lbl.gov/, AmeriFlux, 2020). The MODIS data product is hosted at the Oak Ridge National Laboratory (https://modis.ornl.gov/, Oak Ridge National Laboratory, 2020). The SOM fraction data of the six NEON sites and model input files used in this study can be accessed at the Zenodo online repository (https://doi.org/10.5281/zenodo.4404685, Zhang et al., 2020). The source code of the MEMS 2.0 model is available upon request.
The supplement related to this article is available online at: https://doi.org/10.5194/bg-18-3147-2021-supplement.
MFC, YZ, JML, ADR, KP, and SMO contributed to the conceptualization of the model structure and wrote the manuscript. YZ formulated the equations and coded the model. YZ and JML collected the data used in the simulations. RE conducted the soil organic matter fractionation work. MFC, JML, and RE interpreted the lab data. MFC, KP, and SMO contributed substantial interpretation and discussion, and they supervised the study.
The authors declare that they have no conflict of interest.
The project was supported with funding from the US DOE Advanced Research Projects Agency – Energy program (ROOTS project; DE-AR0000826), from the National Science Foundation (NSF) Division of Environmental Biology (award nos. 1743237 and 2016003), and from Shell Inc. (contract no. 4550183252). The authors would like to thank William J. Parton for model development discussions. The authors also thank Peter J. Ross for providing his Fortran source code of the soil water and solute transport model. Soil samples were provided from the National Ecological Observatory Network (NEON) Megapit Soil Archive. NEON is a program sponsored by the NSF and operated under cooperative agreement by Battelle Memorial Institute. This material is based in part upon work supported by the NSF through the NEON program.
This research has been supported by the US Department of Energy (grant no. DE-AR0000826), the National Science Foundation (grant no. 1743237), and Shell United States (contract no. 4550183252).
This paper was edited by Ben Bond-Lamberty and reviewed by Jianqiu Zheng and one anonymous referee.
Abramoff, R., Xu, X., Hartman, M., O'Brien, S., Feng, W., Davidson, E., Finzi, A., Moorhead, D., Schimel, J., Torn, M., and Mayes, M. A.: The Millennial model: in search of measurable pools and transformations for modeling soil carbon in the new century, Biogeochemistry, 137, 51–71, https://doi.org/10.1007/s10533-017-0409-7, 2018.
Ahrens, B., Braakhekke, M. C., Guggenberger, G., Schrumpf, M., and Reichstein, M.: Contribution of sorption, DOC transport and microbial interactions to the 14C age of a soil organic carbon profile: Insights from a calibrated process model, Soil Biol. Biochem., 88, 390–402, https://doi.org/10.1016/j.soilbio.2015.06.008, 2015.
Allen, R. G., Pereira, L. S., Raes, D., and Smith, M.: Crop evapotranspiration-Guidelines for computing crop water requirements – FAO Irrigation and drainage paper 56, Food and Agriculture Organization, Rome, Italy, 1998.
AmeriFlux: Measuring ecosystem CO2, water, and energy fluxes in North, Central and South America, available at: https://ameriflux.lbl.gov/, last access: 18 May 2020.
Averill, C. and Waring, B.: Nitrogen limitation of decomposition and decay: How can it occur?, Glob. Change Biol., 24, 1417–1427, https://doi.org/10.1111/gcb.13980, 2018.
Batjes, N. H.: Total carbon and nitrogen in the soils of the world, Eur. J. Soil. Sci., 65, 10–21, https://doi.org/10.1111/ejss.12114_2, 2014.
Baudin, M., Boumhaout, K., Delage, T., Iooss, B., and Martinez, J.-M.: Numerical stability of Sobol'indices estimation formula, in: Proceedings of the 8th International Conference on Sensitivity Analysis of Model Output (SAMO 2016), 30 November–3 December 2016, Le Tampon, Réunion Island, France, 50–51, 2016.
Beare, M. H., McNeill, S. J., Curtin, D., Parfitt, R. L., Jones, H. S., Dodd, M. B., and Sharp, J.: Estimating the organic carbon stabilisation capacity and saturation deficit of soils: a New Zealand case study, Biogeochemistry, 120, 71–87, https://doi.org/10.1007/s10533-014-9982-1, 2014.
Benbi, D. K., Boparai, A. K., and Brar, K.: Decomposition of particulate organic matter is more sensitive to temperature than the mineral associated organic matter, Soil Biol. Biochem., 70, 183–192, https://doi.org/10.1016/j.soilbio.2013.12.032, 2014.
Bird, M. I., Wynn, J. G., Saiz, G., Wurster, C. M., and McBeath, A.: The Pyrogenic Carbon Cycle, Annu. Rev. Earth, 43, 273–298, https://doi.org/10.1146/annurev-earth-060614-105038, 2015.
Bittelli, M., Campbell, G. S., and Tomei, F.: Soil physics with Python: transport in the soil-plant-atmosphere system, Oxford University Press, Oxford, 2015.
Braakhekke, M. C., Wutzler, T., Beer, C., Kattge, J., Schrumpf, M., Ahrens, B., Schöning, I., Hoosbeek, M. R., Kruijt, B., Kabat, P., and Reichstein, M.: Modeling the vertical soil organic matter profile using Bayesian parameter estimation, Biogeosciences, 10, 399–420, https://doi.org/10.5194/bg-10-399-2013, 2013.
Brooks, R. H. and Corey, A. T.: Hydraulic properties of porous media, Hydrology papers, no. 3, Colorado State University, Fort Collins, Colorado, USA, 1964.
Brunsell, N. A., Nippert, J. B., and Buck, T. L.: Impacts of seasonality and surface heterogeneity on water-use efficiency in mesic grasslands, Ecohydrol., 7, 1223–1233, https://doi.org/10.1002/eco.1455, 2014.
Brzostek, E. R., Fisher, J. B., and Phillips, R. P.: Modeling the carbon cost of plant nitrogen acquisition: Mycorrhizal trade-offs and multipath resistance uptake improve predictions of retranslocation, J. Geophys. Res.-Biogeo., 119, 1684–1697, https://doi.org/10.1002/2014JG002660, 2014.
Buchkowski, R. W., Shaw, A. N., Sihi, D., Smith, G. R., and Keiser, A. D.: Constraining Carbon and Nutrient Flows in Soil With Ecological Stoichiometry, Front. Ecol. Evol., 7, 382, https://doi.org/10.3389/fevo.2019.00382, 2019.
Byrnes, R. C., Eastburn, D. J., Tate, K. W., and Roche, L. M.: A Global Meta-Analysis of Grazing Impacts on Soil Health Indicators, J. Environ. Qual., 47, 758–765, https://doi.org/10.2134/jeq2017.08.0313, 2018.
Camino-Serrano, M., Guenet, B., Luyssaert, S., Ciais, P., Bastrikov, V., De Vos, B., Gielen, B., Gleixner, G., Jornet-Puig, A., Kaiser, K., Kothawala, D., Lauerwald, R., Peñuelas, J., Schrumpf, M., Vicca, S., Vuichard, N., Walmsley, D., and Janssens, I. A.: ORCHIDEE-SOM: modeling soil organic carbon (SOC) and dissolved organic carbon (DOC) dynamics along vertical soil profiles in Europe, Geosci. Model Dev., 11, 937–957, https://doi.org/10.5194/gmd-11-937-2018, 2018.
Campbell, E. E., Parton, W. J., Soong, J. L., Paustian, K., Hobbs, N. T., and Cotrufo, M. F.: Using litter chemistry controls on microbial processes to partition litter carbon fluxes with the Litter Decomposition and Leaching (LIDEL) model, Soil Biol. Biochem., 100, 160–174, https://doi.org/10.1016/j.soilbio.2016.06.007, 2016.
Castellano, M. J., Mueller, K. E., Olk, D. C., Sawyer, J. E., and Six, J.: Integrating plant litter quality, soil organic matter stabilization, and the carbon saturation concept, Glob. Change Biol., 21, 3200–3209, https://doi.org/10.1111/gcb.12982, 2015.
Chang, J. F., Viovy, N., Vuichard, N., Ciais, P., Wang, T., Cozic, A., Lardy, R., Graux, A.-I., Klumpp, K., Martin, R., and Soussana, J.-F.: Incorporating grassland management in ORCHIDEE: model description and evaluation at 11 eddy-covariance sites in Europe, Geosci. Model Dev., 6, 2165–2181, https://doi.org/10.5194/gmd-6-2165-2013, 2013.
Chen, R., Senbayram, M., Blagodatsky, S., Myachina, O., Dittert, K., Lin, X., Blagodatskaya, E., and Kuzyakov, Y.: Soil C and N availability determine the priming effect: microbial N mining and stoichiometric decomposition theories, Glob. Change Biol., 20, 2356–2367, https://doi.org/10.1111/gcb.12475, 2014.
Christensen, B. T.: Physical fractionation of soil and structural and functional complexity in organic matter turnover, Eur. J. Soil Sci., 52, 345–353, https://doi.org/10.1046/j.1365-2389.2001.00417.x, 2001.
Ciais, P., Sabine, C., Bala, G., Bopp, L., Brovkin, V., Canadell, J., Chhabra, A., DeFries, R., Galloway, J., and Heimann, M.: Carbon and other biogeochemical cycles, in: Climate change 2013: the physical science basis. Contribution of Working Group I to the Fifth Assessment Report of the Intergovernmental Panel on Climate Change, edited by: Stocker, T. F., Qin, D., Plattner, G.-K., Tignor, M., Allen, S. K., Boschung, J., Nauels, A., Xia, Y., Bex, V., and Midgley, P. M., Cambridge University Press, Cambridge, United Kingdom and New York, NY, USA, 465–570, 2014.
Coleman, K. and Jenkinson, D. S.: RothC-26.3 – A Model for the turnover of carbon in soil, in: Evaluation of Soil Organic Matter Models, edited by: Powlson, D. S., Smith, P., and Smith, J. U., 237–246, Springer, Berlin, Heidelberg, 1996.
Conant, R. T., Ryan, M. G., Ågren, G. I., Birge, H. E., Davidson, E. A., Eliasson, P. E., Evans, S. E., Frey, S. D., Giardina, C. P., Hopkins, F. M., Hyvönen, R., Kirschbaum, M. U. F., Lavallee, J. M., Leifeld, J., Parton, W. J., Steinweg, J. M., Wallenstein, M. D., Wetterstedt, J. Å. M., and Bradford, M. A.: Temperature and soil organic matter decomposition rates – synthesis of current knowledge and a way forward, Glob. Change Biol., 17, 3392–3404, https://doi.org/10.1111/j.1365-2486.2011.02496.x, 2011.
Cotrufo, M. F., Wallenstein, M. D., Boot, C. M., Denef, K., and Paul, E. A.: The Microbial Efficiency-Matrix Stabilization (MEMS) framework integrates plant litter decomposition with soil organic matter stabilization: do labile plant inputs form stable soil organic matter?, Glob. Change Biol., 19, 988–995, 2013.
Cotrufo, M. F., Soong, J. L., Horton, A. J., Campbell, E. E., Haddix, M. L., Wall, D. H., and Parton, W. J.: Formation of soil organic matter via biochemical and physical pathways of litter mass loss, Nat. Geosci., 8, 776–779, https://doi.org/10.1038/ngeo2520, 2015.
Cotrufo, M. F., Ranalli, M. G., Haddix, M. L., Six, J., and Lugato, E.: Soil carbon storage informed by particulate and mineral-associated organic matter, Nat. Geosci., 12, 989–994, https://doi.org/10.1038/s41561-019-0484-6, 2019.
Craine, J. M., Morrow, C., and Fierer, N.: Microbial Nitrogen Limitation Increases Decomposition, Ecology, 88, 2105–2113, https://doi.org/10.1890/06-1847.1, 2007.
Curtin, D.: Possible role of aluminum in stabilizing organic matter in particle size fractions of Chernozemic and solonetizic soils, Can. J. Soil. Sci., 82, 265–268, https://doi.org/10.4141/S01-035, 2002.
Davidson, E. A. and Janssens, I. A.: Temperature sensitivity of soil carbon decomposition and feedbacks to climate change, Nature, 440, 165–173, https://doi.org/10.1038/nature04514, 2006.
Davidson, E. A., Trumbore, S. E., and Amundson, R.: Soil warming and organic carbon content, Nature, 408, 789–790, https://doi.org/10.1038/35048672, 2000.
de Graaff, M.-A., Classen, A. T., Castro, H. F., and Schadt, C. W.: Labile soil carbon inputs mediate the soil microbial community composition and plant residue decomposition rates, New Phytol., 188, 1055–1064, https://doi.org/10.1111/j.1469-8137.2010.03427.x, 2010.
Del Grosso, S. J., Parton, W. J., Mosier, A. R., Holland, E. A., Pendall, E., Schimel, D. S., and Ojima, D. S.: Modeling soil CO2 emissions from ecosystems, Biogeochemistry, 73, 71–91, https://doi.org/10.1007/s10533-004-0898-z, 2005.
Elzein, A. and Balesdent, J.: Mechanistic Simulation of Vertical Distribution of Carbon Concentrations and Residence Times in Soils, Soil Sci. Soc. Am. J., 59, 1328–1335, https://doi.org/10.2136/sssaj1995.03615995005900050019x, 1995.
Fatichi, S., Manzoni, S., Or, D., and Paschalis, A.: A Mechanistic Model of Microbially Mediated Soil Biogeochemical Processes: A Reality Check, Global Biogeochem. Cy., 33, 620–648, https://doi.org/10.1029/2018GB006077, 2019.
Feng, W., Plante, A. F., and Six, J.: Improving estimates of maximal organic carbon stabilization by fine soil particles, Biogeochemistry, 112, 81–93, https://doi.org/10.1007/s10533-011-9679-7, 2013.
Georgiou, K., Abramoff, R. Z., Harte, J., Riley, W. J., and Torn, M. S.: Microbial community-level regulation explains soil carbon responses to long-term litter manipulations, Nat. Commun., 8, 1223, https://doi.org/10.1038/s41467-017-01116-z, 2017.
Gill, R., Burke, I. C., Milchunas, D. G., and Lauenroth, W. K.: Relationship Between Root Biomass and Soil Organic Matter Pools in the Shortgrass Steppe of Eastern Colorado, Ecosystems, 2, 226–236, https://doi.org/10.1007/s100219900070, 1999.
Griscom, B. W., Adams, J., Ellis, P. W., Houghton, R. A., Lomax, G., Miteva, D. A., Schlesinger, W. H., Shoch, D., Siikamäki, J. V., Smith, P., Woodbury, P., Zganjar, C., Blackman, A., Campari, J., Conant, R. T., Delgado, C., Elias, P., Gopalakrishna, T., Hamsik, M. R., Herrero, M., Kiesecker, J., Landis, E., Laestadius, L., Leavitt, S. M., Minnemeyer, S., Polasky, S., Potapov, P., Putz, F. E., Sanderman, J., Silvius, M., Wollenberg, E., and Fargione, J.: Natural climate solutions, P. Natl. Acad. Sci. USA, 114, 11645–11650, https://doi.org/10.1073/pnas.1710465114, 2017.
Gurung, R. B., Ogle, S. M., Breidt, F. J., Williams, S. A., and Parton, W. J.: Bayesian calibration of the DayCent ecosystem model to simulate soil organic carbon dynamics and reduce model uncertainty, Geoderma, 376, 114529, https://doi.org/10.1016/j.geoderma.2020.114529, 2020.
Guyette, R. P., Stambaugh, M. C., Dey, D. C., and Muzika, R.-M.: Predicting Fire Frequency with Chemistry and Climate, Ecosystems, 15, 322–335, https://doi.org/10.1007/s10021-011-9512-0, 2012.
Haddix, M. L., Paul, E. A., and Cotrufo, M. F.: Dual, differential isotope labeling shows the preferential movement of labile plant constituents into mineral-bonded soil organic matter, Glob. Change Biol., 22, 2301–2312, https://doi.org/10.1111/gcb.13237, 2016.
Hall, S. J., McNicol, G., Natake, T., and Silver, W. L.: Large fluxes and rapid turnover of mineral-associated carbon across topographic gradients in a humid tropical forest: insights from paired 14C analysis, Biogeosciences, 12, 2471–2487, https://doi.org/10.5194/bg-12-2471-2015, 2015.
Hamilton, E. W., Frank, D. A., Hinchey, P. M., and Murray, T. R.: Defoliation induces root exudation and triggers positive rhizospheric feedbacks in a temperate grassland, Soil Biol. Biochem., 40, 2865–2873, https://doi.org/10.1016/j.soilbio.2008.08.007, 2008.
Hargreaves, G. H. and Allen, R. G.: History and Evaluation of Hargreaves Evapotranspiration Equation, J. Irrig. Drain. Eng., 129, 53–63, https://doi.org/10.1061/(ASCE)0733-9437(2003)129:1(53), 2003.
Harper, R. J. and Tibbett, M.: The hidden organic carbon in deep mineral soils, Plant Soil, 368, 641–648, https://doi.org/10.1007/s11104-013-1600-9, 2013.
Hartman, M., Parton, W., Del Grosso, S., Easter, M., Hendryx, J., Hilinski, T., Kelly, R., Keough, C., Killian, K., Lutz, S., Marx, E., McKeown, R., Ogle, S., Ojima, D., Paustian, K., Swan, A., and Williams, S.: DayCent Ecosystem Model – The Daily Century Ecosystem, Soil Organic Matter, Nutrient Cycling, Nitrogen Trace Gas, and Methane Model: User Manual, Scientific Basis, and Technical Documentation, Colorado Sate University Fort Collins, Colorado, USA, 2020.
Hassink, J.: The capacity of soils to preserve organic C and N by their association with clay and silt particles, Plant Soil, 191, 77–87, https://doi.org/10.1023/A:1004213929699, 1997.
Hinckley, E.-L. S., Bonan, G. B., Bowen, G. J., Colman, B. P., Duffy, P. A., Goodale, C. L., Houlton, B. Z., Marín-Spiotta, E., Ogle, K., Ollinger, S. V., Paul, E. A., Vitousek, P. M., Weathers, K. C., and Williams, D. G.: The soil and plant biogeochemistry sampling design for The National Ecological Observatory Network, Ecosphere, 7, e01234, https://doi.org/10.1002/ecs2.1234, 2016.
Hobbs, N. T., Schimel, D. S., Owensby, C. E., and Ojima, D. S.: Fire and Grazing in the Tallgrass Prairie: Contingent Effects on Nitrogen Budgets, Ecology, 72, 1374–1382, https://doi.org/10.2307/1941109, 1991.
Hodge, A., Campbell, C. D., and Fitter, A. H.: An arbuscular mycorrhizal fungus accelerates decomposition and acquires nitrogen directly from organic material, Nature, 413, 297–299, https://doi.org/10.1038/35095041, 2001.
Huang, W. and Hall, S. J.: Elevated moisture stimulates carbon loss from mineral soils by releasing protected organic matter, Nat. Commun., 8, 1774, https://doi.org/10.1038/s41467-017-01998-z, 2017.
Iooss, B., Da Veiga, S., Janon, A., and Pujol, G.: Global Sensitivity Analysis of Model Outputs, available at: https://CRAN.R-project.org/package=sensitivity, last access: 18 May 2020.
Islam, A. K. M. S., Edwards, D. G., and Asher, C. J.: pH optima for crop growth, Plant Soil, 54, 339–357, https://doi.org/10.1007/BF02181830, 1980.
Jackson, R. B., Canadell, J., Ehleringer, J. R., Mooney, H. A., Sala, O. E., and Schulze, E. D.: A global analysis of root distributions for terrestrial biomes, Oecologia, 108, 389–411, https://doi.org/10.1007/BF00333714, 1996.
Jenkinson, D. S. and Coleman, K.: The turnover of organic carbon in subsoils. Part 2. Modelling carbon turnover, Eur. J. Soil Sci., 59, 400–413, https://doi.org/10.1111/j.1365-2389.2008.01026.x, 2008.
Johnson, M. O., Mudd, S. M., Pillans, B., Spooner, N. A., Fifield, L. K., Kirkby, M. J., and Gloor, M.: Quantifying the rate and depth dependence of bioturbation based on optically-stimulated luminescence (OSL) dates and meteoric 10Be, Earth Surf. Proc. Land., 39, 1188–1196, https://doi.org/10.1002/esp.3520, 2014.
Kleber, M., Sollins, P., and Sutton, R.: A conceptual model of organo-mineral interactions in soils: self-assembly of organic molecular fragments into zonal structures on mineral surfaces, Biogeochemistry, 85, 9–24, https://doi.org/10.1007/s10533-007-9103-5, 2007.
Kleber, M., Eusterhues, K., Keiluweit, M., Mikutta, C., Mikutta, R., and Nico, P. S.: Chapter One – Mineral–Organic Associations: Formation, Properties, and Relevance in Soil Environments, in: Advances in Agronomy, vol. 130, edited by: Sparks, D. L., Academic Press, 1–140, https://doi.org/10.1016/bs.agron.2014.10.005, 2015.
Knicker, H.: Pyrogenic organic matter in soil: Its origin and occurrence, its chemistry and survival in soil environments, Quatern. Int., 243, 251–263, https://doi.org/10.1016/j.quaint.2011.02.037, 2011.
Knorr, M., Frey, S. D., and Curtis, P. S.: Nitrogen Additions and Litter Decomposition: A Meta-Analysis, Ecology, 86, 3252–3257, https://doi.org/10.1890/05-0150, 2005.
Kögel-Knabner, I., Guggenberger, G., Kleber, M., Kandeler, E., Kalbitz, K., Scheu, S., Eusterhues, K., and Leinweber, P.: Organo-mineral associations in temperate soils: Integrating biology, mineralogy, and organic matter chemistry, J. Plant Nutr. Soil Sci., 171, 61–82, https://doi.org/10.1002/jpln.200700048, 2008.
Kuzyakov, Y.: Priming effects: Interactions between living and dead organic matter, Soil Biol. Biochem., 42, 1363–1371, https://doi.org/10.1016/j.soilbio.2010.04.003, 2010.
Kuzyakov, Y. and Xu, X.: Competition between roots and microorganisms for nitrogen: mechanisms and ecological relevance, New Phytol., 198, 656–669, https://doi.org/10.1111/nph.12235, 2013.
Kyker-Snowman, E., Wieder, W. R., Frey, S. D., and Grandy, A. S.: Stoichiometrically coupled carbon and nitrogen cycling in the MIcrobial-MIneral Carbon Stabilization model version 1.0 (MIMICS-CN v1.0), Geosci. Model Dev., 13, 4413–4434, https://doi.org/10.5194/gmd-13-4413-2020, 2020.
Lavallee, J. M., Conant, R. T., Paul, E. A., and Cotrufo, M. F.: Incorporation of shoot versus root-derived 13C and 15N into mineral-associated organic matter fractions: results of a soil slurry incubation with dual-labelled plant material, Biogeochemistry, 137, 379–393, 2018.
Lavallee, J. M., Soong, J. L., and Cotrufo, M. F.: Conceptualizing soil organic matter into particulate and mineral-associated forms to address global change in the 21st century, Glob. Change Biol., 26, 261–273, https://doi.org/10.1111/gcb.14859, 2020.
Lehmann, J. and Kleber, M.: The contentious nature of soil organic matter, Nature, 528, 60–68, https://doi.org/10.1038/nature16069, 2015.
Li, C., Frolking, S., and Frolking, T. A.: A model of nitrous oxide evolution from soil driven by rainfall events: 1. Model structure and sensitivity, J. Geophys. Res.-Atmos., 97, 9759–9776, https://doi.org/10.1029/92JD00509, 1992.
Li, L.-J., Zhu-Barker, X., Ye, R., Doane, T. A., and Horwath, W. R.: Soil microbial biomass size and soil carbon influence the priming effect from carbon inputs depending on nitrogen availability, Soil Biol. Biochem., 119, 41–49, https://doi.org/10.1016/j.soilbio.2018.01.003, 2018.
Liang, C., Schimel, J. P., and Jastrow, J. D.: The importance of anabolism in microbial control over soil carbon storage, Nat. Microbiol., 2, 17105, https://doi.org/10.1038/nmicrobiol.2017.105, 2017.
Liu, W., Qiao, C., Yang, S., Bai, W., and Liu, L.: Microbial carbon use efficiency and priming effect regulate soil carbon storage under nitrogen deposition by slowing soil organic matter decomposition, Geoderma, 332, 37–44, https://doi.org/10.1016/j.geoderma.2018.07.008, 2018.
Liu, X.-J. A., Sun, J., Mau, R. L., Finley, B. K., Compson, Z. G., van Gestel, N., Brown, J. R., Schwartz, E., Dijkstra, P., and Hungate, B. A.: Labile carbon input determines the direction and magnitude of the priming effect, Appl. Soil Ecol., 109, 7–13, https://doi.org/10.1016/j.apsoil.2016.10.002, 2017.
Luo, Y., Ahlström, A., Allison, S. D., Batjes, N. H., Brovkin, V., Carvalhais, N., Chappell, A., Ciais, P., Davidson, E. A., Finzi, A., Georgiou, K., Guenet, B., Hararuk, O., Harden, J. W., He, Y., Hopkins, F., Jiang, L., Koven, C., Jackson, R. B., Jones, C. D., Lara, M. J., Liang, J., McGuire, A. D., Parton, W., Peng, C., Randerson, J. T., Salazar, A., Sierra, C. A., Smith, M. J., Tian, H., Todd-Brown, K. E. O., Torn, M., van Groenigen, K. J., Wang, Y. P., West, T. O., Wei, Y., Wieder, W. R., Xia, J., Xu, X., Xu, X., and Zhou, T.: Toward more realistic projections of soil carbon dynamics by Earth system models, Global Biogeochem. Cy., 30, 40–56, https://doi.org/10.1002/2015GB005239, 2016.
Matches, A. G.: Plant Response to Grazing: A Review, J. Prod. Agric., 5, 1–7, https://doi.org/10.2134/jpa1992.0001, 1992.
Mayes, M. A., Heal, K. R., Brandt, C. C., Phillips, J. R., and Jardine, P. M.: Relation between Soil Order and Sorption of Dissolved Organic Carbon in Temperate Subsoils, Soil Sci. Soc. Am. J., 76, 1027–1037, https://doi.org/10.2136/sssaj2011.0340, 2012.
McKee, G. A., Soong, J. L., Caldéron, F., Borch, T., and Cotrufo, M. F.: An integrated spectroscopic and wet chemical approach to investigate grass litter decomposition chemistry, Biogeochemistry, 128, 107–123, https://doi.org/10.1007/s10533-016-0197-5, 2016.
McSherry, M. E. and Ritchie, M. E.: Effects of grazing on grassland soil carbon: a global review, Glob. Change Biol., 19, 1347–1357, https://doi.org/10.1111/gcb.12144, 2013.
Mooshammer, M., Wanek, W., Zechmeister-Boltenstern, S., and Richter, A. A.: Stoichiometric imbalances between terrestrial decomposer communities and their resources: mechanisms and implications of microbial adaptations to their resources, Front. Microbiol., 5, 22, https://doi.org/10.3389/fmicb.2014.00022, 2014.
NASEM (National Academies of Sciences, Engineering, and Medicine): Negative Emissions Technologies and Reliable Sequestration: A Research Agenda, The National Academies Press, Washington, DC, 2019.
NEON: Data Product DP4.00200.001, Bundled data products – eddy covariance, National Ecological Observatory Network, Battelle, Boulder, CO, USA, 2020a.
NEON: NEON data, available at: https://data.neonscience.org/, last access: 18 May 2020b.
Oak Ridge National Laboratory: MODIS/VIIRS Land Product Subsets, available at: https://modis.ornl.gov/, last access: 18 May 2020.
Ogée, J. and Brunet, Y.: A forest floor model for heat and moisture including a litter layer, J. Hydrol., 255, 212–233, https://doi.org/10.1016/S0022-1694(01)00515-7, 2002.
Ojima, D. S., Schimel, D. S., Parton, W. J., and Owensby, C. E.: Long- and short-term effects of fire on nitrogen cycling in tallgrass prairie, Biogeochemistry, 24, 67–84, https://doi.org/10.1007/BF02390180, 1994.
Ota, M., Nagai, H., and Koarashi, J.: Root and dissolved organic carbon controls on subsurface soil carbon dynamics: A model approach, J. Geophys. Res.-Biogeo., 118, 1646–1659, https://doi.org/10.1002/2013JG002379, 2013.
Parton, W. J., Schimel, D. S., Cole, C. V., and Ojima, D. S.: Analysis of Factors Controlling Soil Organic Matter Levels in Great Plains Grasslands, Soil Sci. Soc. Am. J., 51, 1173–1179, https://doi.org/10.2136/sssaj1987.03615995005100050015x, 1987.
Parton, W. J., Hartman, M., Ojima, D., and Schimel, D.: DAYCENT and its land surface submodel: description and testing, Global Planet. Change, 19, 35–48, https://doi.org/10.1016/S0921-8181(98)00040-X, 1998.
Piñeiro, G., Paruelo, J. M., Oesterheld, M., and Jobbágy, E. G.: Pathways of Grazing Effects on Soil Organic Carbon and Nitrogen, Rangeland Ecol. Manag., 63, 109–119, https://doi.org/10.2111/08-255.1, 2010.
Poeplau, C., Don, A., Six, J., Kaiser, M., Benbi, D., Chenu, C., Cotrufo, M. F., Derrien, D., Gioacchini, P., Grand, S., Gregorich, E., Griepentrog, M., Gunina, A., Haddix, M., Kuzyakov, Y., Kühnel, A., Macdonald, L. M., Soong, J., Trigalet, S., Vermeire, M.-L., Rovira, P., van Wesemael, B., Wiesmeier, M., Yeasmin, S., Yevdokimov, I., and Nieder, R.: Isolating organic carbon fractions with varying turnover rates in temperate agricultural soils – A comprehensive method comparison, Soil Biol. Biochem., 125, 10–26, https://doi.org/10.1016/j.soilbio.2018.06.025, 2018.
Raes, D., Steduto, P., Hsiao, T. C., and Fereres, E.: AquaCrop — The FAO Crop Model to Simulate Yield Response to Water: II. Main Algorithms and Software Description, Agron. J., 101, 438–447, https://doi.org/10.2134/agronj2008.0140s, 2009.
Rasmussen, C., Heckman, K., Wieder, W. R., Keiluweit, M., Lawrence, C. R., Berhe, A. A., Blankinship, J. C., Crow, S. E., Druhan, J. L., Hicks Pries, C. E., Marin-Spiotta, E., Plante, A. F., Schädel, C., Schimel, J. P., Sierra, C. A., Thompson, A., and Wagai, R.: Beyond clay: towards an improved set of variables for predicting soil organic matter content, Biogeochemistry, 137, 297–306, https://doi.org/10.1007/s10533-018-0424-3, 2018.
R Core Team: R: A Language and Environment for Statistical Computing, R Foundation for Statistical Computing, Vienna, Austria, 2017.
Reichstein, M., Subke, J.-A., Angeli, A. C., and Tenhunen, J. D.: Does the temperature sensitivity of decomposition of soil organic matter depend upon water content, soil horizon, or incubation time?, Glob. Change Biol., 11, 1754–1767, https://doi.org/10.1111/j.1365-2486.2005.001010.x, 2005.
Robertson, A. D., Paustian, K., Ogle, S., Wallenstein, M. D., Lugato, E., and Cotrufo, M. F.: Unifying soil organic matter formation and persistence frameworks: the MEMS model, Biogeosciences, 16, 1225–1248, https://doi.org/10.5194/bg-16-1225-2019, 2019.
Ross, P. J.: Modeling Soil Water and Solute Transport—Fast, Simplified Numerical Solutions, Agron. J., 95, 1352–1361, https://doi.org/10.2134/agronj2003.1352, 2003.
Rowland, A. P. and Roberts, J. D.: Lignin and cellulose fractionation in decomposition studies using acid-detergent fibre methods, Commun. Soil Sci. Plan., 25, 269–277, https://doi.org/10.1080/00103629409369035, 1994.
Rumpel, C. and Kögel-Knabner, I.: Deep soil organic matter – a key but poorly understood component of terrestrial C cycle, Plant Soil, 338, 143–158, https://doi.org/10.1007/s11104-010-0391-5, 2011.
Running, S., Mu, Q., and Zhao, M.: MOD17A3H MODIS/Terra Net Primary Production Yearly L4 Global 500m SIN Grid V006, NASA EOSDIS Land Processes DAAC, NASA EOSDIS Land Processes DAAC, Sioux Falls, South Dakota, https://doi.org/10.5067/MODIS/MOD17A3H.006, 2015.
Saxton, K. E. and Rawls, W. J.: Soil Water Characteristic Estimates by Texture and Organic Matter for Hydrologic Solutions, Soil Sci. Soc. Am. J., 70, 1569–1578, https://doi.org/10.2136/sssaj2005.0117, 2006.
Schaefer, G. L., Cosh, M. H., and Jackson, T. J.: The USDA Natural Resources Conservation Service Soil Climate Analysis Network (SCAN), J. Atmos. Ocean. Tech., 24, 2073–2077, https://doi.org/10.1175/2007JTECHA930.1, 2007.
Schaefer, K., Schwalm, C. R., Williams, C., Arain, M. A., Barr, A., Chen, J. M., Davis, K. J., Dimitrov, D., Hilton, T. W., Hollinger, D. Y., Humphreys, E., Poulter, B., Raczka, B. M., Richardson, A. D., Sahoo, A., Thornton, P., Vargas, R., Verbeeck, H., Anderson, R., Baker, I., Black, T. A., Bolstad, P., Chen, J., Curtis, P. S., Desai, A. R., Dietze, M., Dragoni, D., Gough, C., Grant, R. F., Gu, L., Jain, A., Kucharik, C., Law, B., Liu, S., Lokipitiya, E., Margolis, H. A., Matamala, R., McCaughey, J. H., Monson, R., Munger, J. W., Oechel, W., Peng, C., Price, D. T., Ricciuto, D., Riley, W. J., Roulet, N., Tian, H., Tonitto, C., Torn, M., Weng, E., and Zhou, X.: A model-data comparison of gross primary productivity: Results from the North American Carbon Program site synthesis, J. Geophys. Res.-Biogeo., 117, G03010, https://doi.org/10.1029/2012JG001960, 2012.
Schepers, J. S., Francis, D. D., Vigil, M., and Below, F. E.: Comparison of corn leaf nitrogen concentration and chlorophyll meter readings, Commun. Soil Sci. Plan., 23, 2173–2187, https://doi.org/10.1080/00103629209368733, 1992.
Schrumpf, M., Kaiser, K., Mayer, A., Hempel, G., and Trumbore, S.: Age distribution, extractability, and stability of mineral-bound organic carbon in central European soils, Biogeosciences, 18, 1241–1257, https://doi.org/10.5194/bg-18-1241-2021, 2021.
Shelia, V., Šimůnek, J., Boote, K., and Hoogenbooom, G.: Coupling DSSAT and HYDRUS-1D for simulations of soil water dynamics in the soil-plant-atmosphere system, J. Hydrol. Hydromech., 66, 232–245, https://doi.org/10.1515/johh-2017-0055, 2018.
Sierra, C. A., Trumbore, S. E., Davidson, E. A., Vicca, S., and Janssens, I.: Sensitivity of decomposition rates of soil organic matter with respect to simultaneous changes in temperature and moisture, J. Adv. Model. Earth Sy., 7, 335–356, https://doi.org/10.1002/2014MS000358, 2015.
Sihi, D., Davidson, E. A., Chen, M., Savage, K. E., Richardson, A. D., Keenan, T. F., and Hollinger, D. Y.: Merging a mechanistic enzymatic model of soil heterotrophic respiration into an ecosystem model in two AmeriFlux sites of northeastern USA, Agr. Forest Meteorol., 252, 155–166, https://doi.org/10.1016/j.agrformet.2018.01.026, 2018.
Sinsabaugh, R. L., Turner, B. L., Talbot, J. M., Waring, B. G., Powers, J. S., Kuske, C. R., Moorhead, D. L., and Shah, J. J. F.: Stoichiometry of microbial carbon use efficiency in soils, Ecol. Monogr., 86, 172–189, https://doi.org/10.1890/15-2110.1, 2016.
Six, J., Conant, R. T., Paul, E. A., and Paustian, K.: Stabilization mechanisms of soil organic matter: Implications for C-saturation of soils, Plant Soil, 241, 155–176, https://doi.org/10.1023/A:1016125726789, 2002.
Smith, P., Smith, J. U., Powlson, D. S., McGill, W. B., Arah, J. R. M., Chertov, O. G., Coleman, K., Franko, U., Frolking, S., Jenkinson, D. S., Jensen, L. S., Kelly, R. H., Klein-Gunnewiek, H., Komarov, A. S., Li, C., Molina, J. A. E., Mueller, T., Parton, W. J., Thornley, J. H. M., and Whitmore, A. P.: A comparison of the performance of nine soil organic matter models using datasets from seven long-term experiments, Geoderma, 81, 153–225, https://doi.org/10.1016/S0016-7061(97)00087-6, 1997.
Soares, M. and Rousk, J.: Microbial growth and carbon use efficiency in soil: Links to fungal-bacterial dominance, SOC-quality and stoichiometry, Soil Biol. Biochem., 131, 195–205, https://doi.org/10.1016/j.soilbio.2019.01.010, 2019.
Soest, P. J. V., Robertson, J. B., and Lewis, B. A.: Methods for Dietary Fiber, Neutral Detergent Fiber, and Nonstarch Polysaccharides in Relation to Animal Nutrition, J. Dairy Sci., 74, 3583–3597, https://doi.org/10.3168/jds.S0022-0302(91)78551-2, 1991.
Sokol, N. W. and Bradford, M. A.: Microbial formation of stable soil carbon is more efficient from belowground than aboveground input, Nat. Geosci., 12, 46–53, https://doi.org/10.1038/s41561-018-0258-6, 2019.
Sokol, N. W., Sanderman, J., and Bradford, M. A.: Pathways of mineral-associated soil organic matter formation: Integrating the role of plant carbon source, chemistry, and point of entry, Glob. Change Biol., 25, 12–24, https://doi.org/10.1111/gcb.14482, 2019.
Soltani, A. and Sinclair, T. R.: Modeling physiology of crop development, growth and yield, CABI, Wallingford, xiii + 322 pp., https://doi.org/10.1079/9781845939700.0000, 2012.
Soong, J. L. and Cotrufo, M. F.: Annual burning of a tallgrass prairie inhibits C and N cycling in soil, increasing recalcitrant pyrogenic organic matter storage while reducing N availability, Glob. Change Bio., 21, 2321–2333, https://doi.org/10.1111/gcb.12832, 2015.
Soong, J. L., Parton, W. J., Calderon, F., Campbell, E. E., and Cotrufo, M. F.: A new conceptual model on the fate and controls of fresh and pyrolized plant litter decomposition, Biogeochemistry, 124, 27–44, https://doi.org/10.1007/s10533-015-0079-2, 2015.
Stewart, C. E., Moturi, P., Follett, R. F., and Halvorson, A. D.: Lignin biochemistry and soil N determine crop residue decomposition and soil priming, Biogeochemistry, 124, 335–351, https://doi.org/10.1007/s10533-015-0101-8, 2015.
Sulman, B. N., Phillips, R. P., Oishi, A. C., Shevliakova, E., and Pacala, S. W.: Microbe-driven turnover offsets mineral-mediated storage of soil carbon under elevated CO2, Nat. Clim. Change, 4, 1099–1102, https://doi.org/10.1038/nclimate2436, 2014.
Sulman, B. N., Brzostek, E. R., Medici, C., Shevliakova, E., Menge, D. N. L., and Phillips, R. P.: Feedbacks between plant N demand and rhizosphere priming depend on type of mycorrhizal association, Ecol. Lett., 20, 1043–1053, https://doi.org/10.1111/ele.12802, 2017.
Sulman, B. N., Moore, J. A. M., Abramoff, R., Averill, C., Kivlin, S., Georgiou, K., Sridhar, B., Hartman, M. D., Wang, G., Wieder, W. R., Bradford, M. A., Luo, Y., Mayes, M. A., Morrison, E., Riley, W. J., Salazar, A., Schimel, J. P., Tang, J., and Classen, A. T.: Multiple models and experiments underscore large uncertainty in soil carbon dynamics, Biogeochemistry, 141, 109–123, https://doi.org/10.1007/s10533-018-0509-z, 2018.
Sun, G., Zhu-Barker, X., Chen, D., Liu, L., Zhang, N., Shi, C., He, L., and Lei, Y.: Responses of root exudation and nutrient cycling to grazing intensities and recovery practices in an alpine meadow: An implication for pasture management, Plant Soil, 416, 515–525, https://doi.org/10.1007/s11104-017-3236-7, 2017.
Tian, K., Kong, X., Yuan, L., Lin, H., He, Z., Yao, B., Ji, Y., Yang, J., Sun, S., and Tian, X.: Priming effect of litter mineralization: the role of root exudate depends on its interactions with litter quality and soil condition, Plant Soil, 440, 457–471, https://doi.org/10.1007/s11104-019-04070-5, 2019.
Tiessen, H. and Stewart, J. W. B.: Particle-size Fractions and their Use in Studies of Soil Organic Matter: II. Cultivation Effects on Organic Matter Composition in Size Fractions, Soil Sci. Soc. Am. J., 47, 509–514, https://doi.org/10.2136/sssaj1983.03615995004700030023x, 1983.
Todd-Brown, K. E. O., Randerson, J. T., Post, W. M., Hoffman, F. M., Tarnocai, C., Schuur, E. A. G., and Allison, S. D.: Causes of variation in soil carbon simulations from CMIP5 Earth system models and comparison with observations, Biogeosciences, 10, 1717–1736, https://doi.org/10.5194/bg-10-1717-2013, 2013.
Todd-Brown, K. E. O., Randerson, J. T., Hopkins, F., Arora, V., Hajima, T., Jones, C., Shevliakova, E., Tjiputra, J., Volodin, E., Wu, T., Zhang, Q., and Allison, S. D.: Changes in soil organic carbon storage predicted by Earth system models during the 21st century, Biogeosciences, 11, 2341–2356, https://doi.org/10.5194/bg-11-2341-2014, 2014.
USDA-NRCS: SCAN data, available at: https://www.wcc.nrcs.usda.gov/scan/, last access: 18 May 2020.
von Lützow, M., Kögel-Knabner, I., Ekschmitt, K., Flessa, H., Guggenberger, G., Matzner, E., and Marschner, B.: SOM fractionation methods: Relevance to functional pools and to stabilization mechanisms, Soil Biol. Biochem., 39, 2183–2207, https://doi.org/10.1016/j.soilbio.2007.03.007, 2007.
Vrugt, J. A.: Markov chain Monte Carlo simulation using the DREAM software package: Theory, concepts, and MATLAB implementation, Environ. Modell. Softw., 75, 273–316, https://doi.org/10.1016/j.envsoft.2015.08.013, 2016.
Vrugt, J. A. and Ter Braak, C. J. F.: DREAM(D): an adaptive Markov Chain Monte Carlo simulation algorithm to solve discrete, noncontinuous, and combinatorial posterior parameter estimation problems, Hydrol. Earth Syst. Sci., 15, 3701–3713, https://doi.org/10.5194/hess-15-3701-2011, 2011.
Walse, C., Berg, B., and Sverdrup, H.: Review and synthesis of experimental data on organic matter decomposition with respect to the effect of temperature, moisture, and acidity, Environ. Rev., 6, 25–40, https://doi.org/10.1139/a98-001, 1998.
Wang, G., Post, W. M., and Mayes, M. A.: Development of microbial-enzyme-mediated decomposition model parameters through steady-state and dynamic analyses, Ecol. Appl., 23, 255–272, https://doi.org/10.1890/12-0681.1, 2013.
Watson, R. T., Noble, I. R., Bolin, B., Ravindranath, N. H., Verardo, D. J., and Dokken, D. J.: Land use, land-use change and forestry: a special report of the Intergovernmental Panel on Climate Change, Cambridge University Press, Cambridge, United Kingdom, 2000.
Wei, L., HaiZhou, H., ZhiNan, Z., and GaoLin, W.: Effects of grazing on the soil properties and C and N storage in relation to biomass allocation in an alpine meadow, J. Soil Sci. Plant Nutr., 11, 27–39, 2011.
Wieder, W. R., Grandy, A. S., Kallenbach, C. M., and Bonan, G. B.: Integrating microbial physiology and physio-chemical principles in soils with the MIcrobial-MIneral Carbon Stabilization (MIMICS) model, Biogeosciences, 11, 3899–3917, https://doi.org/10.5194/bg-11-3899-2014, 2014.
Wolf, J.: User guide for LINTUL5: Simple generic model for simulation of crop growth under potential, water limited and nitrogen, phosphorus and potassium limited conditions, Wageningen University, Wageningen, the Netherlands, 2012.
Yan, H., Wang, S., Billesbach, D., Oechel, W., Bohrer, G., Meyers, T., Martin, T. A., Matamala, R., Phillips, R. P., Rahman, F., Yu, Q., and Shugart, H. H.: Improved global simulations of gross primary product based on a new definition of water stress factor and a separate treatment of C3 and C4 plants, Ecol. Model., 297, 42–59, https://doi.org/10.1016/j.ecolmodel.2014.11.002, 2015.
Yin, X. and van Laar, H. H.: Crop Systems Dynamics: An Ecophysiological Simulation Model for Genotype-by-environment Interactions, Wageningen Academic Pub, 169 pp., Wageningen, the Netherlands, 2005.
Yuste, J. C., Baldocchi, D. D., Gershenson, A., Goldstein, A., Misson, L., and Wong, S.: Microbial soil respiration and its dependency on carbon inputs, soil temperature and moisture, Glob. Change Biol., 13, 2018–2035, https://doi.org/10.1111/j.1365-2486.2007.01415.x, 2007.
Zhang, D., Hui, D., Luo, Y., and Zhou, G.: Rates of litter decomposition in terrestrial ecosystems: global patterns and controlling factors, J. Plant Ecol., 1, 85–93, https://doi.org/10.1093/jpe/rtn002, 2008.
Zhang, Y., Lavallee, J., Robertson, A., Even, R., Ogle, S., Paustian, K., and Cotrufo, F.: Data for manuscript of “Simulating measurable ecosystem carbon and nitrogen dynamics with the mechanistically-defined MEMS 2.0 model”, Zenodo, https://doi.org/10.5281/zenodo.4404685, 2020.
Zhang, Y., Qian, Y., Bremer, D. J., and Kaye, J. P.: Simulation of Nitrous Oxide Emissions and Estimation of Global Warming Potential in Turfgrass Systems Using the DAYCENT Model, J. Environ. Qual., 42, 1100–1108, https://doi.org/10.2134/jeq2012.0486, 2013.
Zhang, Y., Suyker, A., and Paustian, K.: Improved Crop Canopy and Water Balance Dynamics for Agroecosystem Modeling Using DayCent, Agron. J., 110, 511–524, https://doi.org/10.2134/agronj2017.06.0328, 2018.
Zhang, Y., Arabi, M., and Paustian, K.: Analysis of parameter uncertainty in model simulations of irrigated and rainfed agroecosystems, Environ. Modell. Softw., 126, 104642, https://doi.org/10.1016/j.envsoft.2020.104642, 2020a.
Zhang, Y., Gurung, R., Marx, E., Williams, S., Ogle, S. M., and Paustian, K.: DayCent Model Predictions of NPP and Grain Yields for Agricultural Lands in the Contiguous U. S., J. Geophys. Res.-Biogeo., 125, e2020JG005750, https://doi.org/10.1029/2020JG005750, 2020b.
Zimmermann, M., Leifeld, J., Schmidt, M. W. I., Smith, P., and Fuhrer, J.: Measured soil organic matter fractions can be related to pools in the RothC model, Eur. J. Soil. Sci., 58, 658–667, https://doi.org/10.1111/j.1365-2389.2006.00855.x, 2007.