the Creative Commons Attribution 4.0 License.
the Creative Commons Attribution 4.0 License.
 | 13 Sep 2021
Slowdown of the greening trend in natural vegetation with further rise in atmospheric CO2
Alexander J. Winkler
Ranga B. Myneni
Alexis Hannart
Stephen Sitch
Vanessa Haverd
Danica Lombardozzi
Vivek K. Arora
Julia Pongratz
Julia E. M. S. Nabel
Daniel S. Goll
Etsushi Kato
Hanqin Tian
Almut Arneth
Pierre Friedlingstein
Atul K. Jain
Sönke Zaehle
Victor Brovkin
Satellite data reveal widespread changes in Earth's vegetation cover. Regions intensively attended to by humans are mostly greening due to land management. Natural vegetation, on the other hand, is exhibiting patterns of both greening and browning in all continents. Factors linked to anthropogenic carbon emissions, such as CO2 fertilization, climate change, and consequent disturbances such as fires and droughts, are hypothesized to be key drivers of changes in natural vegetation. A rigorous regional attribution at the biome level that can be scaled to a global picture of what is behind the observed changes is currently lacking. Here we analyze different datasets of decades-long satellite observations of global leaf area index (LAI, 1981–2017) as well as other proxies for vegetation changes and identify several clusters of significant long-term changes. Using process-based model simulations (Earth system and land surface models), we disentangle the effects of anthropogenic carbon emissions on LAI in a probabilistic setting applying causal counterfactual theory. The analysis prominently indicates the effects of climate change on many biomes – warming in northern ecosystems (greening) and rainfall anomalies in tropical biomes (browning). The probabilistic attribution method clearly identifies the CO2 fertilization effect as the dominant driver in only two biomes, the temperate forests and cool grasslands, challenging the view of a dominant global-scale effect. Altogether, our analysis reveals a slowing down of greening and strengthening of browning trends, particularly in the last 2 decades. Most models substantially underestimate the emerging vegetation browning, especially in the tropical rainforests. Leaf area loss in these productive ecosystems could be an early indicator of a slowdown in the terrestrial carbon sink. Models need to account for this effect to realize plausible climate projections of the 21st century.
- Article
(5017 KB) - Full-text XML
-
Supplement
(7924 KB) - BibTeX
- EndNote


Satellite observations reveal widespread changes in terrestrial vegetation across the entire globe. The greening and browning trends reflect changes in the abundance of green leaves, and thus, the rate and amount of photosynthesis. Plants modulate pivotal land–atmosphere interactions through the process of photosynthesis. Hence, changes in photosynthetic activity have immediate effects on the land–atmosphere exchange of energy (Forzieri et al., 2017), water (McPherson, 2007; Ukkola et al., 2016), and carbon (Poulter et al., 2014; Thomas et al., 2016; Winkler et al., 2019a, b). Several studies have reported that many biomes are largely greening, from Arctic tundra to subtropical drylands (Myneni et al., 1997; Nemani et al., 2003; Mao et al., 2016; Zhu et al., 2016; Chen et al., 2019; Winkler et al., 2019a). Others have identified regions of declining trends in leaf area (Goetz et al., 2005; Verbyla, 2011). The drivers underlying these long-term vegetation changes, however, remain under debate. In the light of nearly 40 years of continuous satellite observations, we reassess the driver attribution of natural vegetation changes in a new cause-and-effect framework.
Anthropogenic vegetation, i.e., actively cultivated vegetation, and natural vegetation should be considered separately due to their distinct origins and properties. A recent study by Chen et al. (2019) reported that anthropogenic vegetation (35 % of the global vegetated area) is greening due to human land management. The authors identified irrigation, multiple cropping, and the application of fertilizers and pesticides as the main drivers of leaf area enhancement (direct drivers). These results challenge the conclusions of a previous study by Zhu et al. (2016) that attributed the global greening trend mostly to indirect drivers induced by CO2 emissions, in particular, the CO2 fertilization effect (70 %).
Indirect drivers of vegetation changes usually include CO2 fertilization and climatic change in the literature, both of which are consequences of rising atmospheric CO2 concentration. The term “CO2 fertilization” includes two effects of increased ambient CO2 on the physiology of plants. First, elevated CO2 in the interior of leaves stimulates carbon assimilation, which enhances plant productivity and biomass (Leakey et al., 2009; Fatichi et al., 2016). Second, leaves adapt to the CO2-enriched atmosphere by lowering their stomatal conductance and potentially also their stomatal density over time, as in situ observations suggest (Lammertsma et al., 2011). As a consequence, water loss through transpiration decreases, resulting in increased water-use efficiency (ratio of carbon assimilation to transpiration rate; Ukkola et al., 2016; Fatichi et al., 2016). In theory, both effects should result in an expansion of leaf area, especially in environments where plant growth is constrained by water availability (Donohue et al., 2009, 2013; Ukkola et al., 2016).
The radiative effect of CO2 in the atmosphere induces climatic changes that can have both damaging and beneficial effects on the functioning of ecosystems. Temperature-limited biomes are expected to green (i.e., increase leaf area) due to warming and associated prolongation of the growing season (Park et al., 2016; Winkler et al., 2019a). But long-term drying (Zhou et al., 2014), as well as increased intensity and frequency of disturbances (Seidl et al., 2017) such as droughts (Bonal et al., 2016) and wildfires (Goetz et al., 2005; Verbyla, 2011), can induce regional vegetation browning trends. Regional greening and browning patterns can also be associated with insect outbreaks, local deforestation practices, regrowing or degrading forests, or nitrogen deposition; however, these drivers are considered to be of minor importance at the global scale (Zhu et al., 2016).
Indirect drivers affect both natural and anthropogenic vegetation unlike direct drivers which affect anthropogenic vegetation only. Chen et al. (2019) demonstrated that indirect drivers have either opposing or minor enhancing effects on the leaf area of anthropogenic vegetation. In general, the greening of anthropogenic vegetation has a negligible effect on the carbon cycle because carbon absorbed by agricultural plants almost immediately re-enters the atmosphere due to harvest and consumption. Natural terrestrial ecosystems, however, act as a strong carbon sink by absorbing about 30 % of the anthropogenic CO2 emissions (3.8±0.8 Pg C yr−1; Quéré et al., 2018) and mitigate human-made climate change (Bonan, 2008; Sitch et al., 2015; Winkler et al., 2019a). Thus, a mechanistic understanding of natural vegetation dynamics under rising CO2 is critical and helps to answer one of the key questions in current climate research: where does the anthropogenic carbon go (Marotzke et al., 2017)?
This study focuses on the response of natural vegetation under the influence of the two key indirect drivers, the physiological and radiative effects of rising CO2. Throughout this paper and in accordance with the literature, the terms CO2 fertilization and “physiological effect of CO2” are used interchangeably, as are “climate change” and “radiative effect of CO2”. To assess observed changes in vegetation over climatic timescales, we make use of a 37-year record of leaf area index (LAI) satellite observations (1982–2017, Global Inventory Modeling and Mapping Studies – GIMMS – LAI3g, Sect. 2.1). The GIMMS LAI3g product is based on the Advanced Very High Resolution Radiometer (AVHRR) sensors, for which there are a number of shortcomings (no onboard calibration, no correction of orbit loss, minimal correction for atmospheric contamination, and limited cloud screening; Sect. 2.1; Zhu et al., 2013; Chen et al., 2019). To address these shortcomings, we also analyze a total of five different remote sensing products that pursue different strategies for dealing with the issues associated with AVHRR data (Sect. 2.1). Due to some inexplicable variations in these datasets (Forzieri et al., 2017), we concentrate on GIMMS LAI3g in our analysis, which is used in most published papers. Despite its limitations, the AVHRR record is unique in terms of its temporal coverage and offers an opportunity to study the evolution of Earth's vegetation while atmospheric CO2 concentration increased by 65 ppm (341 to 406 ppm). We define greening and browning as statistically significant increasing and decreasing trends in LAI, respectively (Sect. 2.6). Based on a detailed biome map (Fig. S1 and Table S1 in the Supplement, Sect. 2.2), we identify spatial clusters of significant vegetation greening and browning in different natural vegetation types.
We make use of the latest version of the fully coupled Max Planck Institute Earth System Model in ensemble mode (MPI-ESM, Sect. 2.3) and a collection of 13 land surface models (LSMs) driven with observed climatic conditions (TRENDYv7 ensemble; Sect. 2.4; Quéré et al., 2018). As a first step, we analyze historical simulations to examine whether these models capture the observed behavior of natural vegetation under rising CO2. Next, we analyze factorial simulations to disentangle and quantify the effects of rising CO2 on LAI changes. Each factorial experiment consists of all historical forcings except one, which is set to its pre-industrial level (similar approach in TRENDYv7 simulations; for details see Sect. 2.4 and 2.6).
The conventional approach to detection and attribution in climate science is the method of optimal fingerprinting, for example as in Zhu et al. (2016). This framework, which considers the observed change to be a linear combination of individual forced signals, is prone to overfitting and assumes that linear correlation reflects causation (Hannart and Naveau, 2018). In particular, the attribution problem of the effects of increasing CO2 is challenging in such an empirical regression setting, since “anything with a trend over the historical period will be correlated with increasing iCO2” (increasing CO2), as explained in a recent review article on the CO2 fertilization effect (Walker et al., 2021). To overcome these limitations, we propose using the causal counterfactual theory which has recently been introduced to climate science (Pearl, 2009; Hannart et al., 2016; Hannart and Naveau, 2018). The method allows us to test if long-term greening/browning trends can be attributed to the effects of rising CO2 in a probabilistic setting combining necessary and sufficient causation (Sect. 2.7).
This is the first study that addresses vegetation browning as well as greening patterns across all major biomes, integrated into a global picture. Greening is dominant in terms of areal fraction, but browning clusters are intensifying, primarily in the tropical forests that are biodiversity-rich and highly productive. We find that CO2 fertilization is an important driver of greening in some biomes (temperate forests and cool grasslands) but cannot be established as a dominant causal driver in many others. The strengthening browning trend identified in our study is most likely linked to climate changes, i.e., long-term drying and recurring droughts. Overall, our findings suggest that the emerging browning clusters in the highly productive ecosystems might be a precursor of a weakening land carbon sink, which is not yet captured by the current land components of Earth system models.
2.1 Satellite observations of LAI
Our analyses are based on an updated version (V1) of the leaf area index dataset (LAI3g; Chen et al., 2019) based on the methodology developed by Zhu et al. (2013). The data provide global year-round LAI observations at a 15 d (bi-monthly) temporal resolution and ∘ spatial resolution. The record covers the period from July 1981 to December 2017. The complete time series of LAI3gV1 was generated using an artificial neural network trained on data of the overlap period of the Collection 6 Terra Moderate Resolution Imaging Spectroradiometer (MODIS) LAI dataset (2000–2017) and the latest version (third generation) of the GIMMS group Advanced Very High Resolution Radiometer (AVHRR) normalized difference vegetation index (NDVI) data (NDVI3g). The latter have been corrected for sensor degradation, inter-sensor differences, cloud cover, observational geometry effects due to satellite drift, Rayleigh scattering, and stratospheric volcanic aerosols (Pinzon and Tucker, 2014).
The LAI3g datasets prior to 2000 were not evaluated due to a lack of required field data (Zhu et al., 2013; Chen et al., 2019). After 2000, the quality of the LAI3g dataset was assessed through direct comparisons with ground measurements of LAI and indirectly with other satellite-data-based LAI products, as well as through statistical analysis with climatic variables such as temperature and precipitation variability (Zhu et al., 2013). Various studies used the predecessor LAI3gV0 and the related dataset of fraction of absorbed photosynthetically active radiation (FAPAR; Anav et al., 2013; Forkel et al., 2016; Zhu et al., 2016; Mao et al., 2016; Mahowald et al., 2016; Piao et al., 2014; Poulter et al., 2014; Keenan et al., 2016) and its successor LAI3gV1 (Winkler et al., 2019a, b; Chen et al., 2019).
Leaf area index is defined as the one-sided green leaf area per unit ground area in broadleaf canopies and as one-half of the green needle surface area in needleleaf canopies in both satellite observations and models (Earth system models – ESMs – and LSMs). It is expressed in units of square meters of green leaf area per square meter of ground area. Missing values in the LAI3gV1 dataset are filled using the climatology of each 16 d composite during 1982–2017. We use the annual averaged LAI of each pixel in this study.
In addition to the GIMMS LAI3g product, we analyze the MODIS LAI record as well as four other long-term global remote sensing datasets: the Global Land Surface Satellite LAI product (GLASS LAI), the Global Mapping LAI product (GLOBMAP LAI), the NDVI product from the Land Long Term Data Record (LTDR), and a new FAPAR product from the National Oceanic and Atmospheric Administration (NOAA) Climate Data Record Program.
The MODIS LAI data analyzed in this study are based on the combined Terra and Aqua MODIS LAI products (MOD15A2H and MYD15A2H) from Collection 6 (C6; Myneni et al., 2015a, b). These LAI datasets are provided at an 8 d temporal resolution with a 500 m sinusoidal projection covering the entire globe. The two LAI datasets are aggregated into 16 d composites by taking the mean of all valid LAI values after an additional data quality assessment is performed (for more details, please see Chen et al., 2019). The data are then spatially aggregated to ∘ spatial resolution and cover the period from 2000 to 2019.
The GLASS LAI dataset (Xiao et al., 2014) is based on AVHRR, MODIS, and Carbon cYcle and Change in Land Observational Products from an Ensemble of Satellite (CYCLOPES) reflectances and LAI products. The full time series was generated using an artificial neural network (general regression neural network) that has been trained on the overlap period of AVHRR, MODIS, and CYCLOPES reflectances and LAI products (Xiao et al., 2014). We use the latest version of the GLASS LAI dataset, which covers the period from 1981 to 2018 and is provided at an 8 d temporal and a ∘ spatial resolution.
The GLOBMAP LAI dataset (Liu et al., 2012) is a reconstruction of the historical AVHRR data by a quantitative fusion with MODIS data. The algorithm inverses a geometrical optical model to establish pixel-level relationships between AVHRR and MODIS LAI for the overlapping period, which are then used to reconstruct AVHRR LAI back to the initial year of the record. We use the latest version of the GLOBMAP LAI dataset, which covers the period from 1981 to 2017 and is provided at a 15 d temporal and a ∘ spatial resolution.
The NDVI dataset of NASA's LTDR (Pedelty et al., 2007) project is based on a reprocessing of long-term AVHRR reflectances applying improved preprocessing techniques and atmospheric corrections used in the generation of MODIS datasets. The preprocessing improvements include radiometric in-flight vicarious calibration for the visible and near-infrared channels and inverse navigation to relate an Earth location to each sensor instantaneous field of view (Pedelty et al., 2007). Atmospheric corrections include corrections for Rayleigh scattering, ozone, water vapor, and aerosols. We use the recently published version 5 (v5) of the LTDR NDVI dataset, which covers the period from 1981 to 2019 and is provided at a daily temporal and a ∘ spatial resolution.
The FAPAR product from the National Oceanic and Atmospheric Administration (NOAA) Climate Data Record Program provided by National Centers for Environmental Information (NCEI) is based on carefully calibrated and corrected land surface reflectances from AVHRR sensors (Claverie et al., 2016). The algorithm relies on artificial neural networks calibrated per different land cover type using the MODIS FAPAR dataset. We use the latest version of the FAPAR dataset from 1981 until 2019, which is provided at a daily temporal and a ∘ spatial resolution.
We aggregate all datasets to annually averaged values and to spatially area-weighted averages for different biomes as defined by the mask (Sect. 2.2).
2.2 Characterization of biomes and clusters of significant change
The land cover product of the MODIS sensors (MCD12C1; MODIS/Terra+Aqua Combined Land Cover Type Climate Modeling Grid (CMG) Yearly Global 0.05 Deg V006, https://lpdaac.usgs.gov/products/mcd12c1v006/, last access: 31 August 2021) is the primary source underlying the land cover map used in this study (hereafter MODIS land cover). The classes from the International Geosphere–Biosphere Programme (IGBP) in the MODIS land cover product are aggregated as follows: Tropical Forests includes Evergreen Broadleaf Forest (EBF); Temperate Forests includes Deciduous Broadleaf Forest (DBF) and Mixed Forest; Boreal Forests includes Evergreen Needleleaf Forest (ENF) and Deciduous Needleleaf Forest (DNF). Savannas includes Woody Savannas and Savannas. Shrublands includes Closed Shrublands and Open Shrublands. Croplands includes Croplands and Croplands/Natural Vegetation Mosaic. The class Others includes Permanent Wetlands, Urban and Built-up Lands, Permanent Snow and Ice, and Barren. The classes Grasslands and Water Bodies remain unchanged. The MODIS land cover product provides estimates for the time period from 2001 to 2017 for each pixel. In this study we define a representative biome map based on the most frequently occurring land cover type throughout the period of 17 years.
The MODIS land cover classification does not contain the biome tundra, which is why we use in addition the land cover product GLDAS-2 Noah version 3.3 that uses a modified IGBP classification scheme providing the classes Wooded, Mixed, or Bare Ground Tundra (https://ldas.gsfc.nasa.gov/gldas/GLDASvegetation.php, last access: 31 August 2021, hereafter GLDAS land cover) (Rodell et al., 2004). Accordingly, pixels originally of the classes Shrublands, Grasslands, Permanent Wetlands, or Barren are converted to Tundra if classified as Wooded, Mixed, or Bare Ground Tundra in the GLDAS land cover product. The classes Woody Savannas and Savannas span vast areas across the globe in the MODIS land cover product. We use the GLDAS classification for these pixels but only for regions where the MODIS and GLDAS land cover products disagree. In doing so, we obtain a more accurate global land cover classification. Table S1 describes in detail how the fusion of the MODIS and GLDAS land cover products is realized.
As a last step, we integrate the MODIS tree cover product MOD44B (MODIS Terra Vegetation Continuous Fields Yearly L3 Global 250 m SIN Grid V006, https://lpdaac.usgs.gov/products/mod44bv006/, last access: 31 August 2021) to account for the underestimation of forested area in the MODIS land cover product. Areas with tree cover exceeding 10 % are formally defined as forests (MacDicken et al., 2015). Thus, we set non-forest pixels in the MODIS land cover product above 10 % tree cover to Boreal Forests in the high latitudes 50∘ N and S. For tropical forest (25∘ S–25∘ N), we increase the threshold to 20 % tree cover to allow for a realistic areal extent of savannas. The pixels in the bands 25–50∘ N and S remain unchanged because the MODIS land cover product already realistically represents the forested area in these latitudes.
Table S1 provides a detailed overview of the conflation of the MODIS land cover product, GLDAS land cover product, and the MODIS tree cover product. The final biome map (originally resolved at 0.05∘) is regridded to the different resolutions of the AVHRR sensor and the models simulations (MPI-ESM and TRENDYv7) applying a largest-area-fraction remapping scheme.
Based on the observational LAI dataset, we define various clusters for greening or browning in most biomes: North American Tundra (NAm Tundra), Eurasian Tundra (EA Tundra), North American Boreal Forests (NAm Brl F), Eurasian Boreal Forests (EA Brl F), Temperate Forests (Tmp F), Tropical Forests (Trp F), Central African Tropical Forests (CAf Trp F), Northern African Savannas and Grasslands (NAf Sv Gl), Southern African Savannas and Grasslands (SAf Sv Gl), Cool Grasslands (Cool Gl), and Australian Shrublands (Aus Sl). Some clusters require a more detailed definition of their geographical location and extent: Southern (Northern) African Savannas and Grasslands represents these vegetation types south (north) of the Equator including Madagascar. Central African Tropical Forests represents all tropical forests in Africa. Cool Grasslands refers to grasslands above 30∘ N.
2.3 Max Planck Institute Earth System Model
MPI-ESM1.2 is the latest version of the state-of-the-art Max Planck Institute Earth System Model, which participates in the upcoming sixth phase of the Coupled Model Intercomparison Project (CMIP6; Eyring et al., 2016). Mauritsen et al. (2019) describe thoroughly the model developments and advancements with respect to its predecessor, the CMIP5 version (Giorgetta et al., 2013). Here, we use the low-resolution (LR) fully coupled carbon–climate configuration (MPI-ESM1.2-LR), which consists of the atmospheric component ECHAM6.3 with 47 vertical levels and a horizontal resolution of ±200 km grid spacing (spectral truncation at T63). The ocean dynamical model MPIOM is set up on a bi-polar grid with an approximate grid spacing of 150 km (GR1.5) and 40 vertical levels. MPI-ESM1.2-LR includes the latest versions of the land and ocean carbon cycle modules, comprising the ocean biogeochemistry model HAMOCC6 and the land surface scheme JSBACH3.2 (Mauritsen et al., 2019).
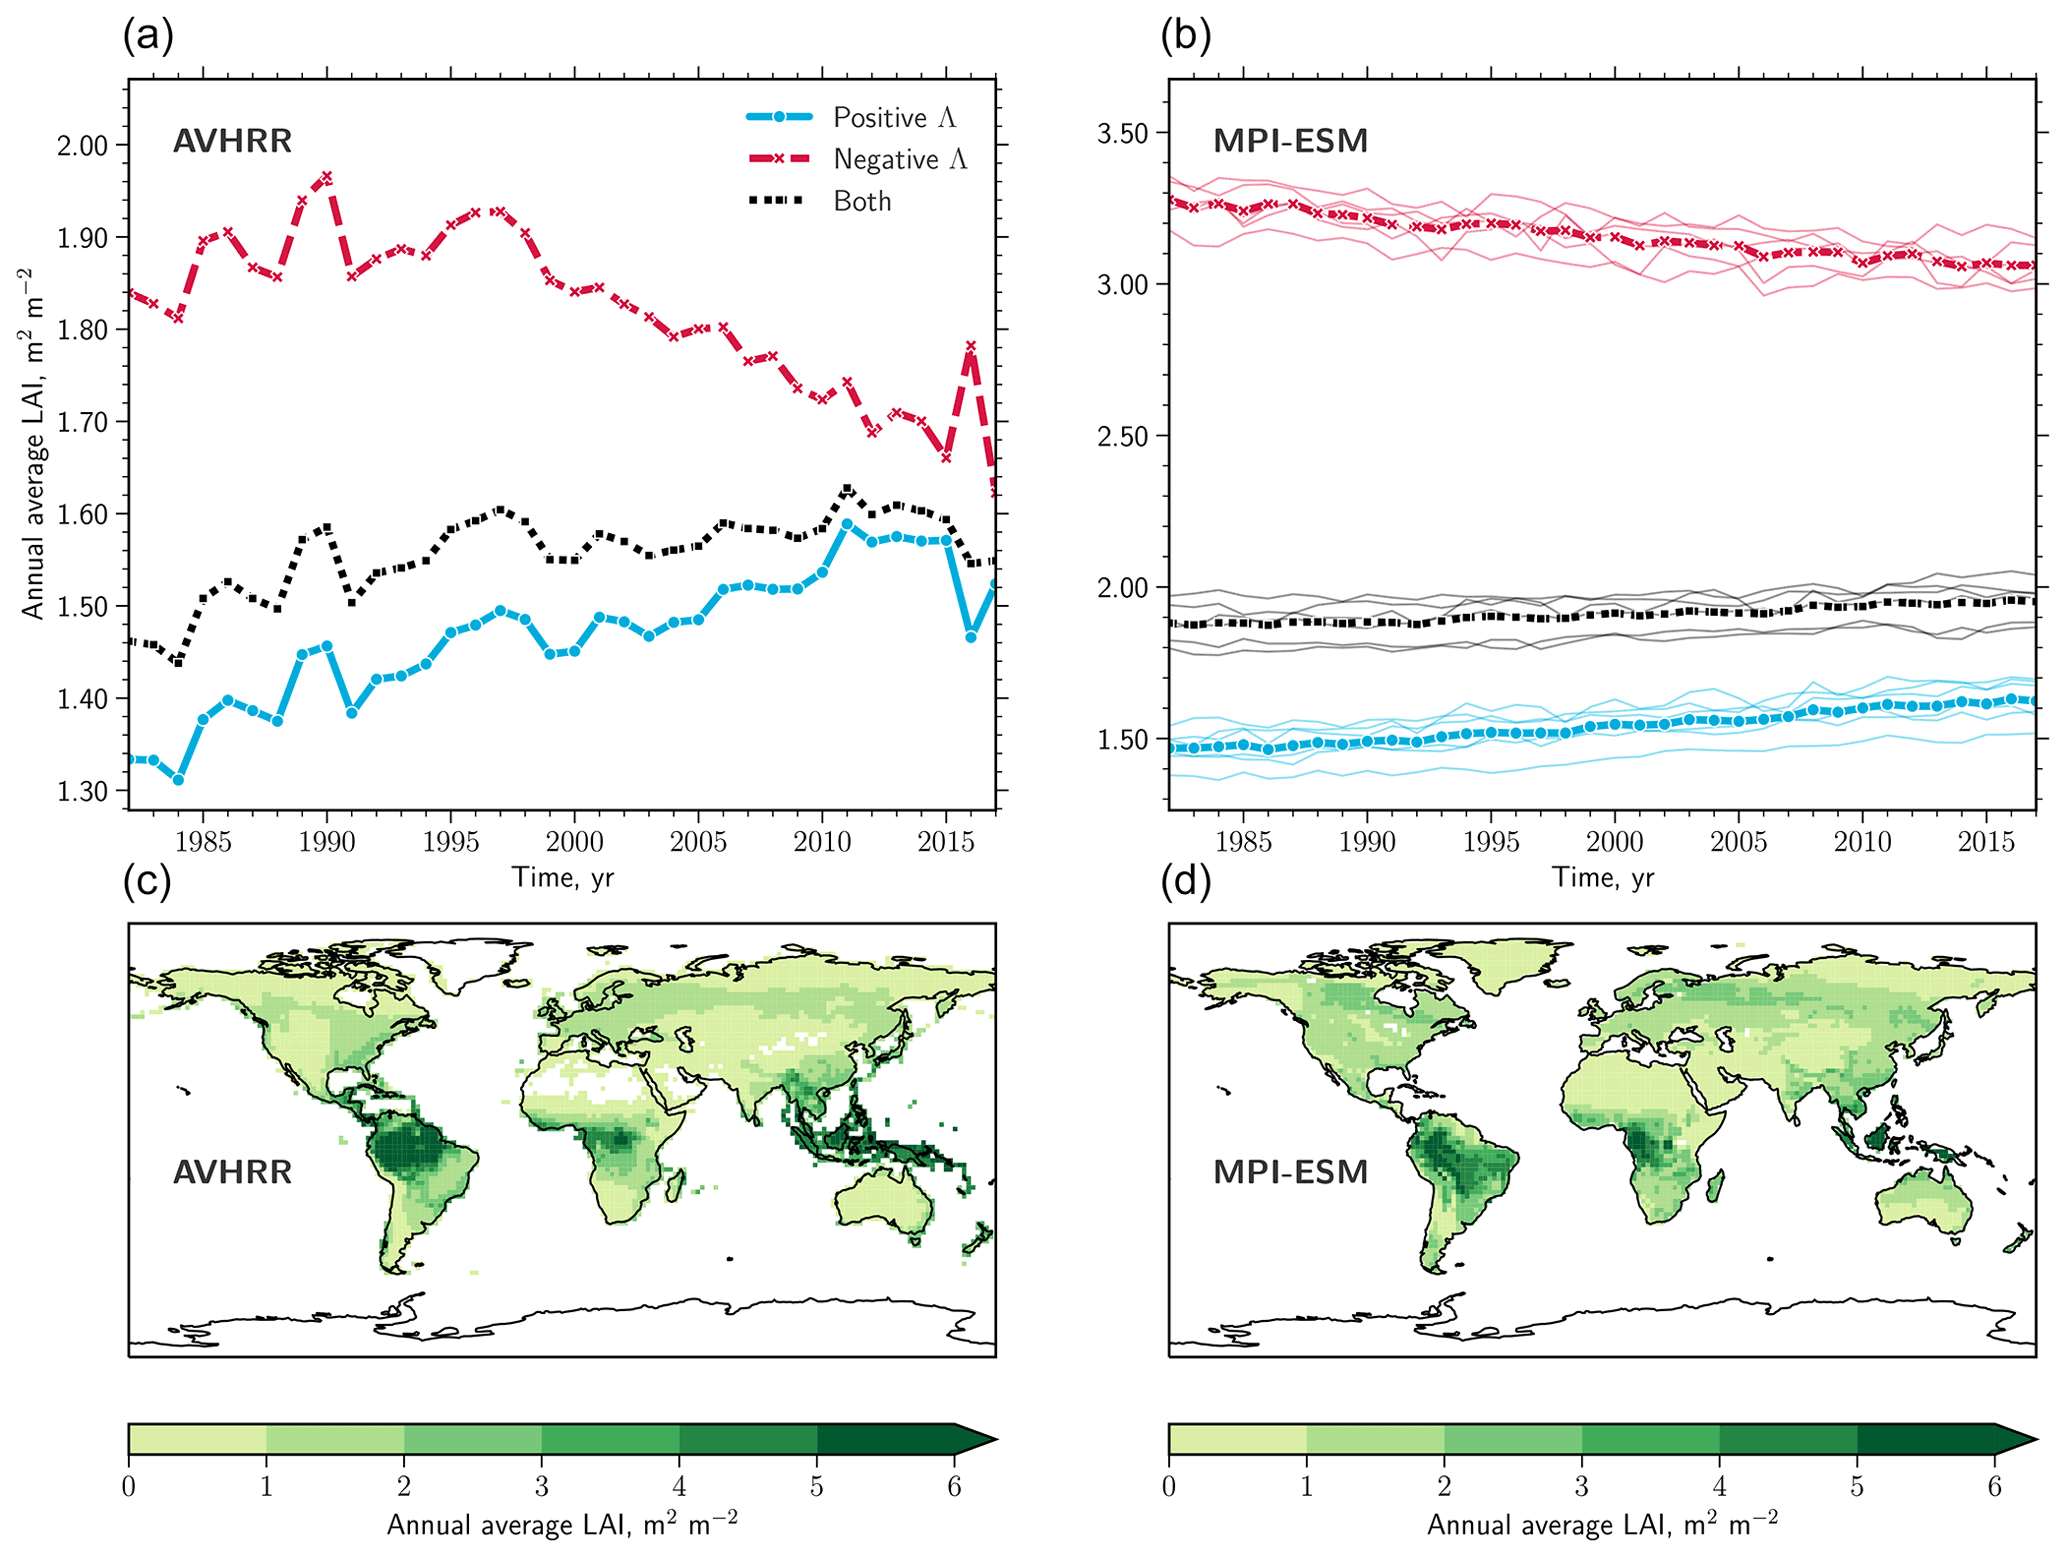
Figure 1LAI observations versus MPI-ESM ensemble. (a) Time series of area-weighted annual average LAI for regions exhibiting positive (blue line) and negative trends (red line) masked for natural vegetation (denoted Λ). Black lines represent the overall signal of all pixels. (b) As (a) but for the MPI-ESM. The individual realizations are represented as thin lines, and the ensemble means are shown in bold lines. (c) Global patterns of annual average LAI over the time period 1982–2017 downscaled to the MPI-ESM spatial resolution using first-order conservative remapping scheme (Jones, 1999). (d) As in (c) but for the MPI-ESM.
As opposed to the high-resolution configuration, the LR variant of the MPI-ESM includes all the important processes relevant for longer-timescale changes in the land surface, such as a thoroughly equilibrated global carbon cycle, dynamical vegetation changes, an interactive nitrogen cycle, land-use transitions, a process-based fire model (SPITFIRE), and an interactive coupling of all sub-models. Furthermore, it is possible to run this model configuration to generate 45–85 model years per real-time day with a modern supercomputer (Mauritsen et al., 2019). This opens up the possibility of conducting a larger number of realizations for each experiment.
Specifically, we used the initial CMIP6 release of MPI-ESM version 1.2.01 (mpiesm-1.2.01-release, revision number 9234). The final CMIP6 version will include further bug fixes, which are expected to only slightly influence long-term sensitivities of simulated land surface processes.
We conducted historical simulations (all forcings) and three factorial experiments (all forcings except one): (a) all historical forcings except the physiological effect of CO2 (no PE; increasing CO2 does not affect the biogeochemical processes), (b) all historical forcings except the radiative effect of CO2 (no RE; increasing CO2 does not affect climate), and (c) all historical forcings except anthropogenic forcings (no CO2). All experiments were preformed in ensemble mode (six realizations per experiment) using the latest CMIP6 forcing data (1850–2013). Individual realizations were initialized from different points in time of a prolongation run of the official MPI-ESM1.2-LR pre-industrial control simulation. In doing so, we account for the influence of climatic modes (e.g., El Niño–Southern Oscillation) as a source of uncertainty in simulating long-term changes.
The simulated time series were shifted by 4 years to maximize the overlap with the observational record of 1982–2017.
2.4 Land surface models – TRENDYv7
Land surface models (LSMs) or dynamic global vegetation models (DGVMs) simulate key physical and biological key processes of the land system in interaction with the atmosphere. LSMs provide a deeper insight into the mechanisms controlling terrestrial energy, hydrological, and carbon cycles, as well as the drivers of phenomena ranging from short-term anomalies to long-term changes (Sitch et al., 2015; Bastos et al., 2018). Here, we analyze the most recent TRENDY ensemble (version 7) comprising 13 state-of-the-art LSMs which vary in their representation of ecosystem processes. All models simulate vegetation growth and mortality, deforestation and regrowth, vegetation and soil carbon responses to increasing atmospheric CO2 levels, climate change, and natural variability (Quéré et al., 2018). Some models simulate an explicit nitrogen cycle (allowing for potential nitrogen limitation) and account for atmospheric N deposition (Table A1 in Quéré et al., 2018). Most LSMs include the most important components of land use and land-use changes, but they are far from representing all processes resulting from direct human land management (Table A1 in Quéré et al., 2018). A more detailed description of the TRENDYv7 ensemble, model-specific simulation setups, and references can be found in Quéré et al. (2018, Table A4).
We use output from five simulations: all forcings (S3), physiological effect of CO2 only (S1), radiative plus physiological effect of CO2 (S2), land-use changes only (S4), and the control run (S0; no forcings – fixed CO2 concentration of 276.59 ppm and fixed land-use map, loop of mean climate and variability from 1901–1920). The forcing data consist of observed atmospheric CO2 concentrations; observed temporal patterns of temperature, precipitation, and incoming surface radiation from the CRU JRA-55 reanalysis (Quéré et al., 2018; Harris et al., 2014); and human-induced land cover changes and management from an extension of the most recent Land-Use Harmonization (LUH2) dataset (Hurtt et al., 2011; Quéré et al., 2018).
In this study, we only analyze output for the period 1982–2017 (matching the observational record) from models providing spatially gridded data for all five simulations. A few models provide LAI at the level of plant functional type (PFT). We calculate the average value of all LAI values on the PFT level multiplied by their land cover fraction for each grid cell. All model outputs were spatially regridded to a common resolution of 1∘ based on a first-order conservative remapping scheme (Jones, 1999).
The design of factorial simulations in TRENDYv7 and by the MPI-ESM are conceptually different. The MPI-ESM simulations were conducted using the counterfactual approach; i.e., all forcings are present except the driver of interest. TRENDYv7 provides simulations with different combinations of drivers as described above. To obtain comparability, we have to make the assumption that the absence of a specific driver has the same effect, in absolute values, as its sole presence. Thus, we process the output of the simulations S1, S2, S3, and S4 to obtain the counterfactual setup as described above for the MPI-ESM. This approach neglects possible synergy effects from simultaneously acting forcings. Also, it has to be noted that these simulations are only to some extent comparable between the two ensembles. For instance, in the MPI-ESM we can specifically determine the impact of the radiative effect of CO2, whereas TRENDYv7 uses observed atmospheric fields including changes induced by other drivers, such as non-CO2 greenhouse gases.
For certain clusters, some models show unreasonable LAI changes and/or extreme inter-annual variability. To reduce the influence of these extreme models on the overall analysis, we apply a two-step filtering method for each cluster beforehand. Models are excluded from the analysis if they exceed 3 times the inter-annual variability in observations and/or show a drastic change (of either sign) of more than 250 % between the start and end of the observational period. Further, we apply a weighting scheme based on the performance of the all-forcings run for each cluster. We calculate quartic weights based on the distance between the simulated and observational estimate. These weights are applied when calculating the multi-model average and standard deviations for the factual and counterfactual runs.
2.5 Atmospheric CO2 concentration
Global monthly means of atmospheric CO2 concentration are taken from the GLOBALVIEW-CO2 product (for details see https://doi.org/10.3334/OBSPACK/1002) provided by the National Oceanic and Atmospheric Administration Earth System Research Laboratory (NOAA ESRL).
2.6 Processing of the gridded data
Areas of significant change in LAI are estimated using the non-parametric Mann–Kendall test, which detects monotonic trends in time series. In this study, we set the significance level to p≤0.1. An alternative statistical test for trend detection (Cox–Stuart test; Sachs, 1997) yields approximately the same results. The trends are calculated either for time series on the pixel level or for area-weighted large-scale aggregated time series (e.g., biome level).
Either we define greening (browning) as a positive (negative) temporal trend, or for better comparison among models and observations as well as for a better global comparison across diverse biomes, we express these trends relative to the initial LAI level at the beginning of the observational record (average state from 1982–1984), denoted as Λ (% per decade).
The calculation of yearly net changes in leaf area balances the effects from both statistically significant browning and greening grid cells. For each cell, we multiply the estimated trends by the respective grid area. The net change is the sum of all grid cells, where areas of insignificant change are set to zero.
Models fairly accurately reproduce global patterns of vegetation greening; however, the fraction of browning is considerably underrepresented. Yet, we can only consider pixels with significant negative trends in LAI, in observations and models alike, and test models with respect to driver attribution of browning trends. Thus, the attribution of browning trends in this paper exclusively refers to browning pixels only.
Models reveal biases in comparison to observations. To obtain informative results in the attribution analysis, we process the simulations to match the mean and variance of the observational time series. Assuming additive and multiplicative biases in simulations, we apply the following corrections:
where represents the mean value and σo the standard deviation of the observational times series. and σaf are analogous to the all-forcings simulations. All simulated time series xi are scaled using Eq. (3), where . This processing step does not affect the nature of simulated trends.
2.7 Causal counterfactual theory
The causal counterfactual approach is anchored in a formal theory of event causation developed in computer science (Pearl, 2009; Marotzke, 2019). Recently, a framework for driver attribution of long-term trends in the context of climate change has been introduced (Hannart et al., 2016; Hannart and Naveau, 2018) and is increasingly gaining in popularity (Marotzke, 2019). Through the use of this method we can ascertain the likelihood that a certain external forcing has caused an observed change in the Earth system. More precisely, we address the question of interest in a probabilistic setting; i.e., what is the probability that a given forcing (e.g., radiative effect of CO2) has caused an observed long-term change in the system (e.g., greening of the Arctic)?
In the following, we highlight the key ideas and relevant concepts of causal theory. A detailed description and formal derivations can be found in Pearl (2009), Hannart et al. (2016), and Hannart and Naveau (2018). We define the cause event (C) as “presence of a given forcing” (i.e., the factual world that occurred) and the complementary event () as “absence of a given forcing” (i.e., the counterfactual world that would have existed in the absence of a given forcing; Hannart and Naveau, 2018). Further, we define the effect event (E) as the occurrence of a long-term change (here, greening or browning) and the complementary event () as the non-occurrence of a long-term change (i.e., no persistent vegetation changes). In making use of numerical models, we can conduct factual runs comprising all forcings (i.e., historical simulations) as well as simulate counterfactual worlds by switching off a forcing of interest (i.e., all forcings except one). Based on an ensemble of simulations, in a multi-model and/or multi-realization setup, we derive the so-called factual (p1) and counterfactual (p0) probability, which read and , respectively (Hannart and Naveau, 2018). More precisely, p1 describes the probability of the event E in the real world where forcing C was present, whereas p0 refers to the probability of the event E in a hypothetical world where forcing C was absent. The notation do(⋅) means that an experimental intervention is applied to the system to obtain the probabilities (Hannart and Naveau, 2018).
The three distinct facets of causality can be established based on the probabilities p1 and p0:
PN refers to the probability of necessary causation, where the occurrence of E requires that of C but may also require other forcings. PS refers to the probability of sufficient causation, where the occurrence of C drives that of E but may not be required for E to occur. PNS describes the probability of necessary and sufficient causation, where PN and PS both hold (Hannart and Naveau, 2018). In other words, PNS may be considered the probability that combines necessity and sufficiency. Thus, the main goal is to establish a high PNS that reflects and communicates evidence for the existence of a causal relationship in a simple manner (Hannart and Naveau, 2018).
To obtain the PNS, we follow the methodology described in detail in Hannart and Naveau (2018) and derive cumulative distribution functions (CDFs) for the factual and counterfactual worlds, denoted D0 and D1, respectively. Assuming a Gaussian distribution, PNS follows as
where μ1 and μ0 refer to the mean response of all factual and all counterfactual runs, respectively. Σ denotes the overall uncertainty and is estimated based on all simulations, comprising factual, counterfactual, and centuries-long unforced (pre-industrial) model runs (for details see Hannart and Naveau, 2018). Finally, the maximum of the PNS determines the sought probability of causation (Hannart and Naveau, 2018). We express probabilities using the terminology and framework defined by the IPCC (Mastrandrea et al., 2011; Hannart and Naveau, 2018).
3.1 Natural vegetation exhibits a net gain in leaf area over the last few decades, but the number of browning regions is increasing
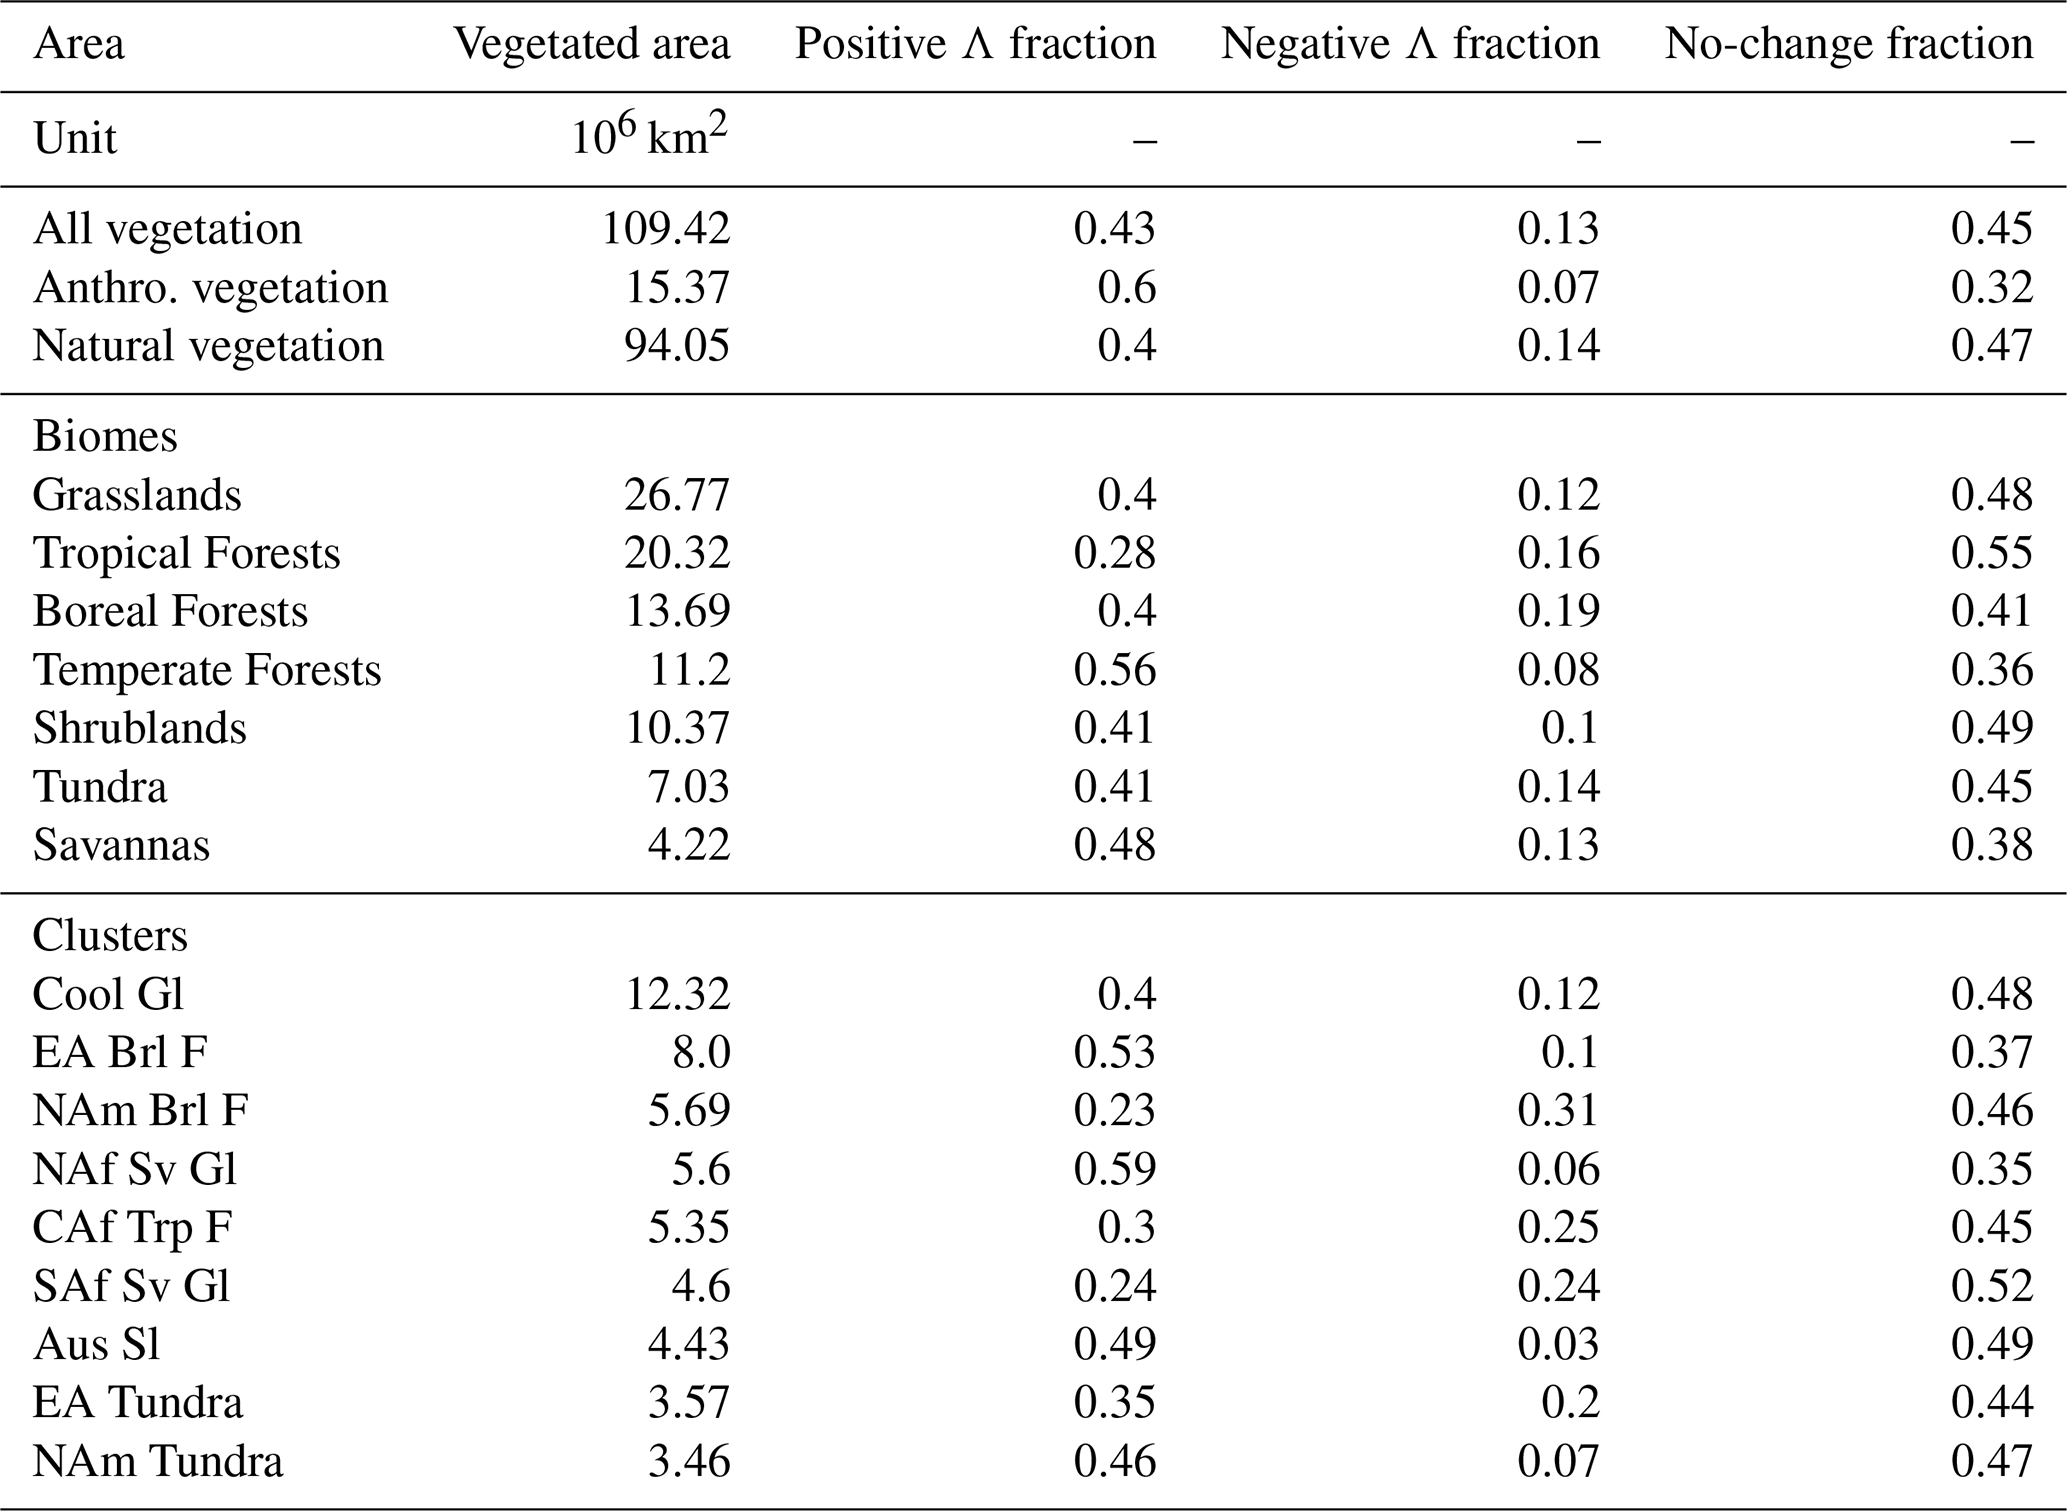
More than 3.5 decades of satellite observations (1982–2017, Sect. 2.1) reveals that 40 % of Earth's natural vegetation shows statistically significant positive trends in LAI (Mann–Kendall test, p<0.1; Table 1), concurrent with a 65 ppm increase in atmospheric CO2. However, more and more browning clusters are beginning to emerge in all continents (14 %; Table 1). Analyzing earlier versions of three shorter-duration (1982–2009) LAI datasets, Zhu et al. (2016) reported a considerably smaller browning fraction of less than 4 % and greening percentages ranging from 25 % to 50 % for all vegetation (i.e., including agriculturally dominated regions). The higher browning proportion in the extended record analyzed in this study indicates an intensification of leaf area loss in recent years. In the following, we take a closer look at different major biomes and their changes in LAI.
Table 1Greening (positive Λ), browning (negative Λ) and non-changing fractions of vegetated area for different biomes and prominent clusters of change for the time period 1982–2017. Significant changes are determined by the means of the Mann–Kendall significance test (p<0.1). The abbreviations used to describe the different clusters are explained in “Materials and methods”.
3.2 Earth's forests respond diversely throughout the satellite era
A global map of statistically significant trends in LAI (denoted Λ, Sect. 2.6) for natural vegetation reveals greening (Λ>0) and browning (Λ<0) clusters across the globe (Fig. 2). Temperate forests (56 % for Λ>0) and Eurasian boreal forests (53 % for Λ>0) exhibit extensive regions of increasing LAI and, thereby, contribute the largest fraction to the enhancement of leaf area on the planet (Table 2). The global belt of tropical forests, on the other hand, while showing a net greening (28 % for Λ>0), also features widespread browning areas (16 % for Λ<0). In particular, the central African tropical forests contain large areas of pronounced negative trends (25 %) for Λ<0). North American boreal forests exhibit the largest fraction of browning vegetation (31 %) for Λ<0), resulting in an annual net loss of leaf area (Tables 1 and 2). The picture of Earth's forests is generally in line with results based on other data sources. For instance, Song et al. (2018) reported a net gain in global forested area, with net loss in the tropics compensated for by a net gain in the extra-tropics.
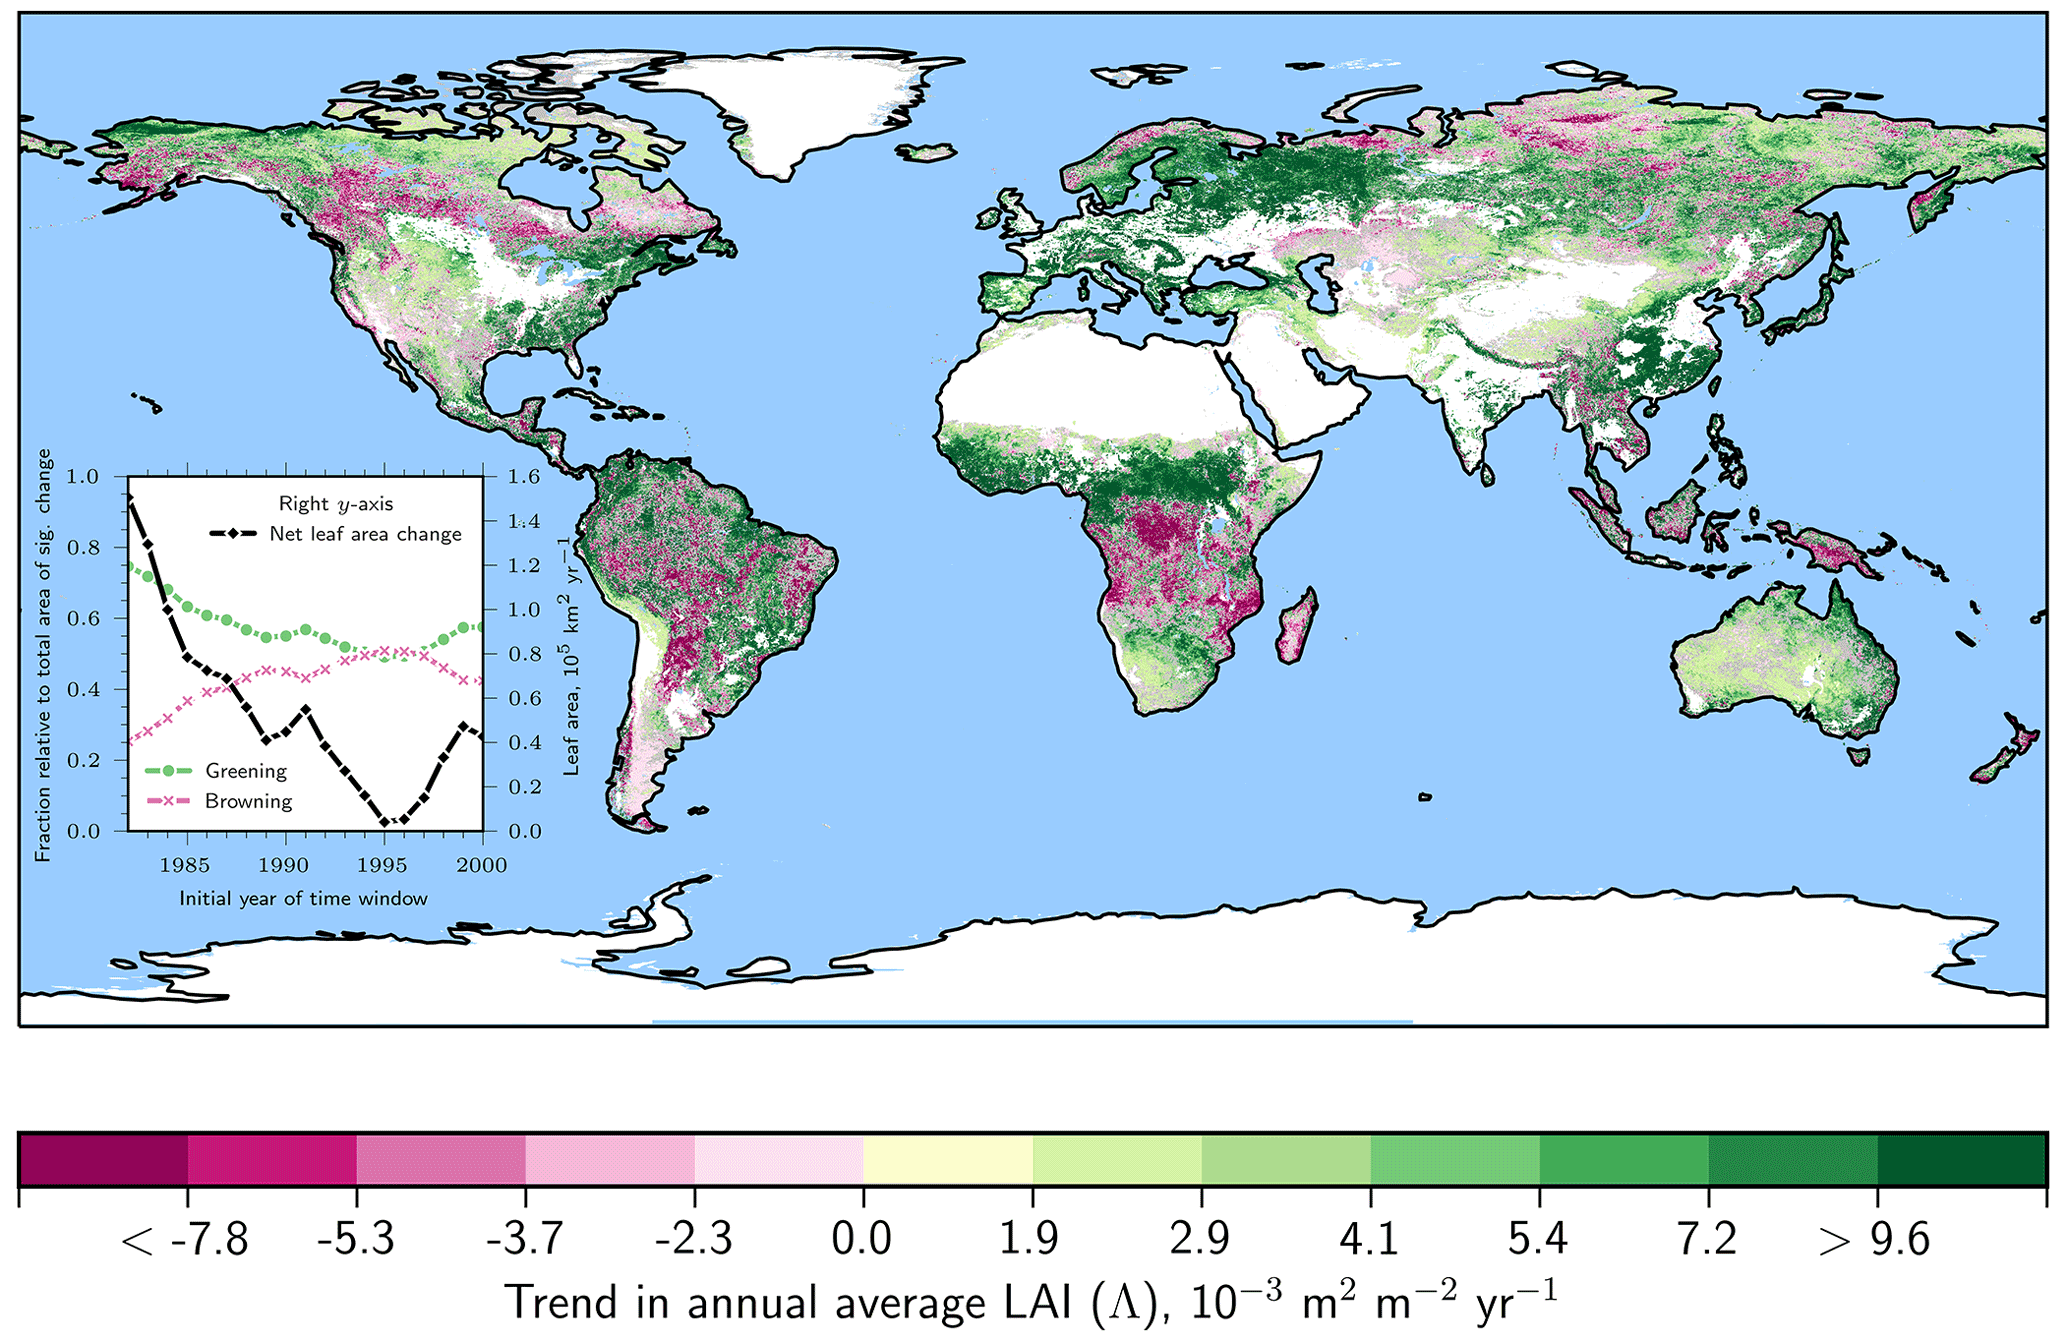
Figure 2Natural vegetation exhibits patterns of opposing long-term LAI trends with rising CO2. Global map of statistically significant (Mann–Kendall test, p<0.1) annual average LAI trends (denoted Λ) for the entire period 1982–2017 (GIMMS LAI3g, color-coded). Areas of non-significant change are shown in gray. Anthropogenic vegetation (defined as croplands, “Materials and methods”) is masked in white. Other white areas depict ice sheets or barren land. The inset line plot illustrates the change in fraction of positive (green dots) and negative (red crosses) Λ relative to the total area of significant change and net leaf area change (black squares; right y axis) for time windows of moving initial year (final year fixed at 2017). The x axis shows the advancing initial year of the time window.
Table 2Leaf area gain, loss, and net change for different biomes and prominent clusters of change for the time period 1982–2017. Significant changes are determined by the means of the Mann–Kendall significance test (p<0.1). The abbreviations used to describe the different clusters are explained in “Materials and methods”.

3.3 As in forests, other biomes also indicate divergent vegetation responses to rising CO2
Tundra in North America is primarily greening (46 % for Λ>0 versus 7 % for Λ<0), whereas in Eurasia, browning is intensifying (35 % for Λ>0 versus 20 % for Λ<0), especially in northern Scandinavia and on the Taymyr Peninsula in northern Russia. Grasslands in cool arid climates, mainly comprising the Mongolian and Kazakh Steppe, as well as the Australian shrublands, stand out as prominent greening clusters (40 % and 49 %, respectively, for Λ>0). Although these biomes show strong positive trends, they are characterized by a low level of LAI. The African continent, which is still dominated by natural vegetation, reveals a distinct change in leaf area. A greening band of savannas and grasslands in the northern regions of sub-Saharan Africa and a greening cluster in southern Africa border the browning regions of equatorial Africa (Fig. 2). Overall, the response of LAI to rising CO2 is somewhat homogeneous for some biomes (widespread browning of the tropical forests and dominant greening of the temperate forests) but divergent for others (tundra and boreal forests show a “North America–Eurasia” asymmetry, interestingly, in that they show changes of reversed sign; Fig. 2).
3.4 Net annual gain in leaf area is declining in natural vegetation
Leaf area loss occurs primarily in densely vegetated biomes (i.e., forests), which outweighs leaf area gain in rather sparsely vegetated regions (i.e., grasslands). For instance, vigorously greening areas of circumpolar tundra result in a leaf area gain of 8.74×10³ km2 yr−1, which is almost outbalanced 4-fold by a leaf area loss of 34.31×10³ km2 yr−1 in the browning regions of the tropical forests (Table 2). To assess the responses of different biomes to rising CO2 in more detail, we iteratively calculate statistically significant LAI trends for different time windows with an advancing initial year (i.e., 1982, 1983, …, 2000) but fixed final year (2017). Although the estimated trends become less robust with shorter time series, this analysis allows us to test for weakening or strengthening responses to further rising CO2. We see that the fraction of significantly browning regions is increasing over time, reaching a maximum for a time window starting in 1995. The greening fraction evolves in the opposite manner. The estimates are represented as fractions of the total area of significant change because the latter inherently decreases as a result of the Mann–Kendall test for shorter time windows. Thus, the average annual net leaf area gain of 150.51×10³ km2 yr−1 for the entire observational period (1982–2017) decreases with advancing initial year, approaching zero for the period 1995 to 2017, and rebounding to km2 yr−1 for the period 2000 to 2017 (black line in Fig. 2 inset). To obtain comparability between different time windows, the net leaf area gain estimates were scaled to the total area of significant change derived for 1982–2017 (unprocessed estimates for period 2000–2017 are listed in Table S2 in the Supplement). Chen et al. (2019) reported a global greening proportion of ∼33 % (21 % for AVHRR; Table S2) and a browning proportion of only 5 % (13 % for AVHRR; Table S2) analyzing the MODIS record including anthropogenic vegetation (2000–2017). On a global scale, LAI trends from MODIS and AVHRR agree over 61 % of the vegetated area (Chen et al., 2019). Winkler et al. (2019b) analyzed in detail the AVHRR and MODIS LAI trends for different climate zones, vegetation classes, and latitudinal bands and found general agreement between the two satellite-based sensors. Inconsistencies arise mainly in humid tropical regions (e.g., absence of intensive browning in central African tropical forests in the MODIS record) and partially in the northern high latitudes (Chen et al., 2019). In Fig. 5 we present a detailed comparison of different remote sensing datasets at the global scale, and we elaborate further on the discrepancies among the estimates in Sect. 3.8 (for a similar analysis, also refer to Yuan et al., 2019).
3.5 High-LAI regions are browning and low-LAI regions are greening
The intensification of browning during the second half of the AVHRR observational period (2000–2017) results in a reversal of the sign in terms of net leaf area change in some biomes (e.g., tropical forests, North American boreal forests, and Eurasian tundra; Table S3 in the Supplement). Critically, the tropical forests display the sharpest transition from a substantial net gain of 24.11×10³ km2 yr−1 (Table 2) to a comparably strong net loss of leaf area ( km2 yr−1; Table S3). To address the temporal development of positive and negative changes in leaf area in more detail, we calculate time series of area-weighted averages of LAI (Fig. 3a). We find that browning of natural vegetation occurs at a considerably higher level of LAI (on average ∼1.85) than greening (on average ∼1.32). Throughout the observational period, these two time series of opposite trends converge towards an LAI of 1.6 (Fig. 3a). This convergence of greening and browning is evident in terms of not only their LAI level (Fig. 3a) but also their proportions (inset in Fig. 2). The time series of anthropogenic vegetation on the other hand, aggregated for positive and negative Λ separately, are both confined to a comparably low LAI level (on average between 1 and 1.25). We next investigate the global LAI distributions of negative and positive changes and their development over time. Comparing distributions of the earlier years (1982–1984) with those of the more recent years (2015–2017) reveals that browning primarily occurs at a high (5–6) and a medium (1–2.5) level of LAI (Fig. 3b). Greening, however, occurs almost entirely at low levels of LAI between 0–1.5. As a consequence, the global area-weighted averages of the browning and greening regions are approaching one another (dashed versus solid vertical lines in Fig. 3b), as also depicted by the time series (Fig. 3a). Overall, these results suggest a homogenization of Earth's natural vegetation in terms of LAI texture with rising CO2. This homogenization becomes prominent when we compare the distributions of negative and positive Λ over time using a Q–Q plot (quantile–quantile; Fig. 3c). The relationship between the quantiles is skewed to the left at higher LAI (positive Λ on x axis, negative Λ on y axis) because browning is prevalent in high-LAI regions. Over time, the quantiles of the greening and browning distributions approach the 1–1 line (representing identical distributions), emphasizing their convergence.
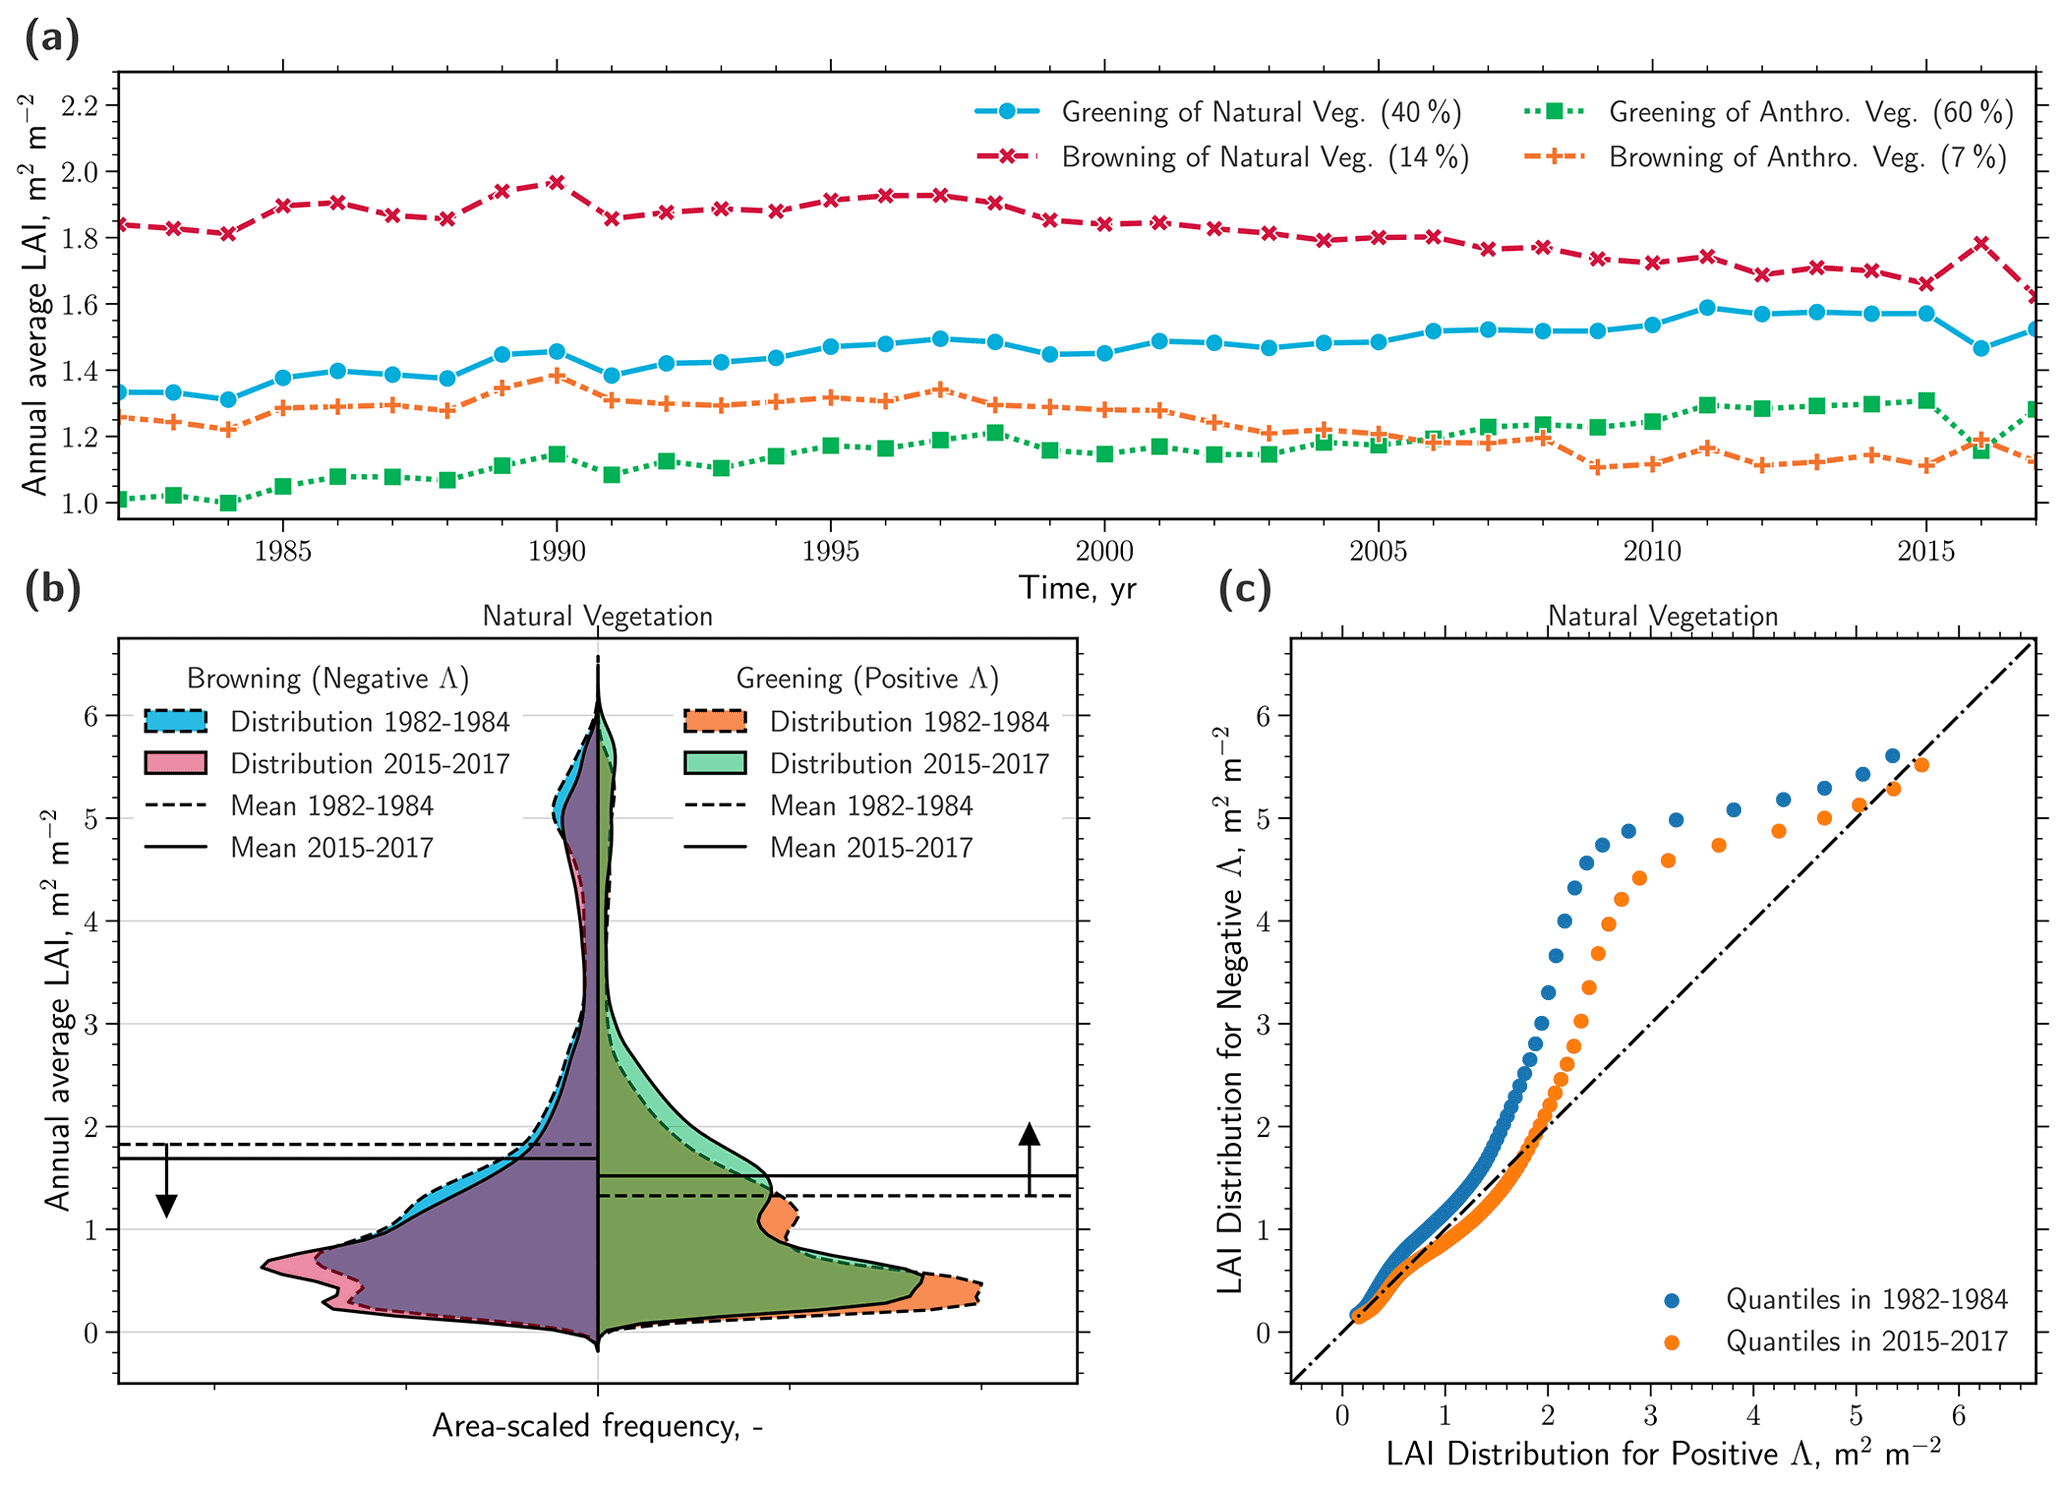
Figure 3Observed homogenization of the global natural vegetation. (a) Time series of the area-weighted annual average LAI (GIMMS LAI3g, 1982–2017) of natural and anthropogenic vegetation for regions of positive (greening) and negative (browning) trends. Only regions exhibiting significant trends are considered (Mann–Kendall significance test, p<0.1) and are referred to as Λ. The percentages in parentheses in the legend represent the respective proportions with respect to the total area. (b) Violin plot comparison of probability density functions (PDFs, Gaussian kernel density estimation; all PDFs scaled to contain the same area) of LAI distributions of natural vegetation for negative (left) and positive (right) Λ, and in time, 1982–1984 (dashed) versus 2015–2017 (solid). The horizontal lines represent the mean values for the respective period. (c) Q–Q (quantile–quantile) plot comparing the distributions of LAI for negative (x axis) and positive (y axis) Λ and their change over time, 1982–1984 (blue dots) versus 2015–2017 (orange dots).
3.6 The majority of models reproduce the observed convergence of greening and browning trends
Thus far, we have described the diverse long-term changes in natural vegetation across all continents and throughout the satellite era. We next investigate the underlying mechanisms driving these greening and browning trends and use the fully coupled MPI-ESM and the TRENDYv7 ensemble of observation-driven LSMs (Sect. 2.3 and 2.4). First, we ask if these models capture the observed behavior of natural vegetation under rising CO2. The MPI-ESM reproduces the observed browning of high-LAI regions and the greening of low-LAI regions; however, the levels of LAI do not match the observations (Fig. 1a and b). Figure 1c and d compare global maps of the observed and the simulated levels of annual average LAI. Overall, the MPI-ESM is consistent with observed patterns, with the strongest spatial variations in tropical forest regions. Historical simulations of TRENDYv7 (here 13 models) also show pronounced changes in vegetation but exhibit diverse behavior among the models (results not shown for brevity). Seven LSMs reproduce observed converging trends of greening and browning, whereas the other six models show divergent trends. All TRENDYv7 models are driven with identical atmospheric forcing fields; hence, these six models most likely lack or incorrectly represent key processes of ecosystem functioning. In general, simulated greening patterns are comparable to observations (Murray-Tortarolo et al., 2013; Sitch et al., 2015; Mahowald et al., 2016), but browning, especially in the North American boreal forests, is underestimated (Sitch et al., 2015).
3.7 In a one-dimensional global perspective, models suggest the physiological effect of CO2 as the main driver of greening
Hereafter, we use changes in annual average LAI relative to the baseline period 1982–1984 (Sect. 2.6) for better comparability between biomes, various simulations, and the observed signal. Time series of relative LAI changes from historical simulations (multi-model average for TRENDYv7 and multi-realization average for the MPI-ESM) are comparable to observations at the global scale (Fig. 4a and b; temporal correlations are low due to high internal variability in the signal).

Figure 4Driver attribution of changing natural vegetation at the global scale: neglecting ecosystem heterogeneity could lead to misleading results. (a) Time series of the area-weighted annual average LAI (GIMMS LAI3g, 1982–2017) for regions of positive (dotted blue line) and negative (dashed red line) sensitivity to rising atmospheric CO2 concentration (Λ) of natural vegetation. Solid black line represents the overall signal of all pixels. The percentages in parentheses in the legend represent the greening and browning proportions with respect to the total area. (b) Time series of changes in LAI relative to the average state from 1982–1984, comparing observations (solid black line) with historical simulations, where the dashed green line denotes the ensemble mean of 13 offline-driven land surface models (TRENDYv7, “Materials and methods”) and the dotted purple line denotes the average of an ensemble of multi-realizations with a fully coupled Earth system model (MPI-ESM, “Materials and methods”). The colored shading represents the 95 % confidence interval estimated by bootstrapping. The correlation coefficients (including significance level) of the observed and simulated time series are displayed in parentheses in the legend. (c) Bar chart showing relative trends in LAI (in % yr−1) of the total observed signal (black) and for factual (all historical forcings, ALL) as well as for counterfactual simulations, i.e., no historical CO2 forcing (No CO2) and all historical forcings except the physiological effect (No PE) or the radiative effect (No RE) of atmospheric CO2, as estimated by TRENDYv7 (green) and the MPI-ESM (purple). The yellow bar represents the overall uncertainty (UC) including inter-model variations derived from all simulations (control, factual, and counterfactual). (d) Probabilities of necessary and sufficient causation (PNS) of the change in LAI, comparing the physiological effect (PE) and radiative effect (RE) of CO2 as well as their combined effect (Both). (e) Same as in (c) but for the period 2000–2017. (f) Same as in (d) but for the period 2000–2017.
We use the framework of counterfactual causal theory to attribute changes in LAI to a given driver in a probabilistic setting (Pearl, 2009; Hannart et al., 2016; Hannart and Naveau, 2018). Note that the causal relationships in this approach are determined based on the predictions of the models for the all-forcings (also referred to as factual) and factorial (also referred to as counterfactual) runs, and therefore the causality results may reflect biases or misrepresentations in the models. Based on the factual and counterfactual runs, we derive the probability of causation that combines the necessity and sufficiency of each factor (PNS; see Sect. 2.7 for details). When aggregated to area-weighted global averages (i.e., Earth greening trend), the observed estimate (∼ 1.08 % per decade) and the factual MPI-ESM estimate (∼ 1.14 % per decade) are comparable, whereas the multi-model average of the TRENDYv7 ensemble is an overestimate (∼ 1.79 % per decade; Fig. 4c). Omitting CO2-induced climate change (no radiative effect of CO2, no RE) does not have a strong effect in the MPI-ESM (∼ 1.04 % per decade); i.e., the estimate does not differ considerably from the factual run. The TRENDYv7 models indicate that the positive trend in LAI can be explained by climate change to some extent (∼ 1.21 % per decade). However, the PNS values for the radiative effect of CO2 are generally rather low (Fig. 4d), implying that the probability of the radiative effect of CO2 acting as a sufficient and necessary causal driver of the globally aggregated LAI trend signal is rather low. The opposite is the case when the physiological effect of CO2 (no PE) is excluded. Both model setups agree that almost no positive trend in LAI is present in a world without the CO2 fertilization effect (∼0.18 % per decade for MPI-ESM and ∼0.08 % per decade for TRENDYv7; both estimates are lower than the overall uncertainty estimate of ∼0.49 % per decade). Note that the term “overall uncertainty” here refers to a broader concept of uncertainty that includes several components, such as climate variability; inter-model variability; variability between realizations; and, if applicable, variability in observations, adapted from the approach introduced by Hannart and Naveau (2018, see also Sect. 2.7 for details).
As a consequence, a high PNS can be established: the physiological effect of CO2 has in the case of the MPI-ESM likely (68 %) and in the case of TRENDYv7 very likely (91 %) caused the positive trend of global LAI in recent decades (Fig. 4d). This result is in line with Zhu et al. (2016), who reported that 70 % of global greening is attributable to CO2 fertilization. Removing both effects of CO2 results in slight negative trends, probably due to land-use practices (e.g., deforestation; Fig. 4c).
3.8 The global signal switches to a minor negative trend in the second half of the observational period
Natural vegetation shows a slight negative trend for the period 2000–2017 (ca. −0.4 % per decade; Fig. 4e). This estimate is within the range of the overall uncertainty and, thus, should be interpreted with caution. Note that the net change in leaf area is still positive when considering only significantly changing pixels (inset in Fig. 2). To provide confidence in this result, we analyze three additional remote sensing datasets for LAI (MODIS-LAI, GLASS-LAI, and GLOBMAP-LAI) as well as for the normalized difference vegetation index (LTDR-NDVI) and for the fraction of absorbed photosynthetic active radiation (NCEI-FAPAR), both proxies for leaf area changes (see Sect. 2.1 for details). We calculate time series of changes relative to the average baseline value from 1982–1984 to obtain comparability between the conceptually different estimates for changes in natural vegetation (Fig. 5a–c). Next, we compare the trends for the entire observational period (1982–2017/2018, Fig. 5d) with trends of the more recent past (2000–2018, Fig. 5e). Three of the additional four long-term datasets show a weakening of vegetation greening for the second half of the observational period in accordance with the GIMMS LAI3g dataset (GLASS-LAI and especially LTDR-NDVI also show a reversal of the sign to a negative trend). In contrast, the dataset GLOBMAP-LAI depicts a substantial strengthening of the positive trend in LAI for the recent decades. However, the dataset also shows a suspicious jump in the year 2001, which could be an artifact related to problems in the fusion of the AVHRR and MODIS data (Piao et al., 2019). Furthermore, GLOBMAP-LAI generally shows the largest discrepancy among all datasets when compared to ground measurements (Xiao et al., 2017). The shorter-term record of MODIS-LAI depicts a stable moderate greening trend for the time span of 2000–2019. Since the MODIS record cannot provide any information on the state of the vegetation in the 1980s and 1990s, we cannot assess whether MODIS would also depict a slowdown of the overall greening trend over this time period. Note that the comparability of relative trends between the long-term remote sensing products (baseline period 1982–1984) and short-term MODIS-LAI (baseline period 2000–2002) is limited. Overall, the analyses of the different remote sensing datasets support to a large extent the findings drawn from the GIMMS LAI3g dataset. For these reasons, as well as for reasons described earlier in the introduction, we focus on the GIMMS LAI3g dataset in these analyses, but we note that the single-product-centric view may imply some additional uncertainties besides the general uncertainty associated with AVHRR-based datasets.
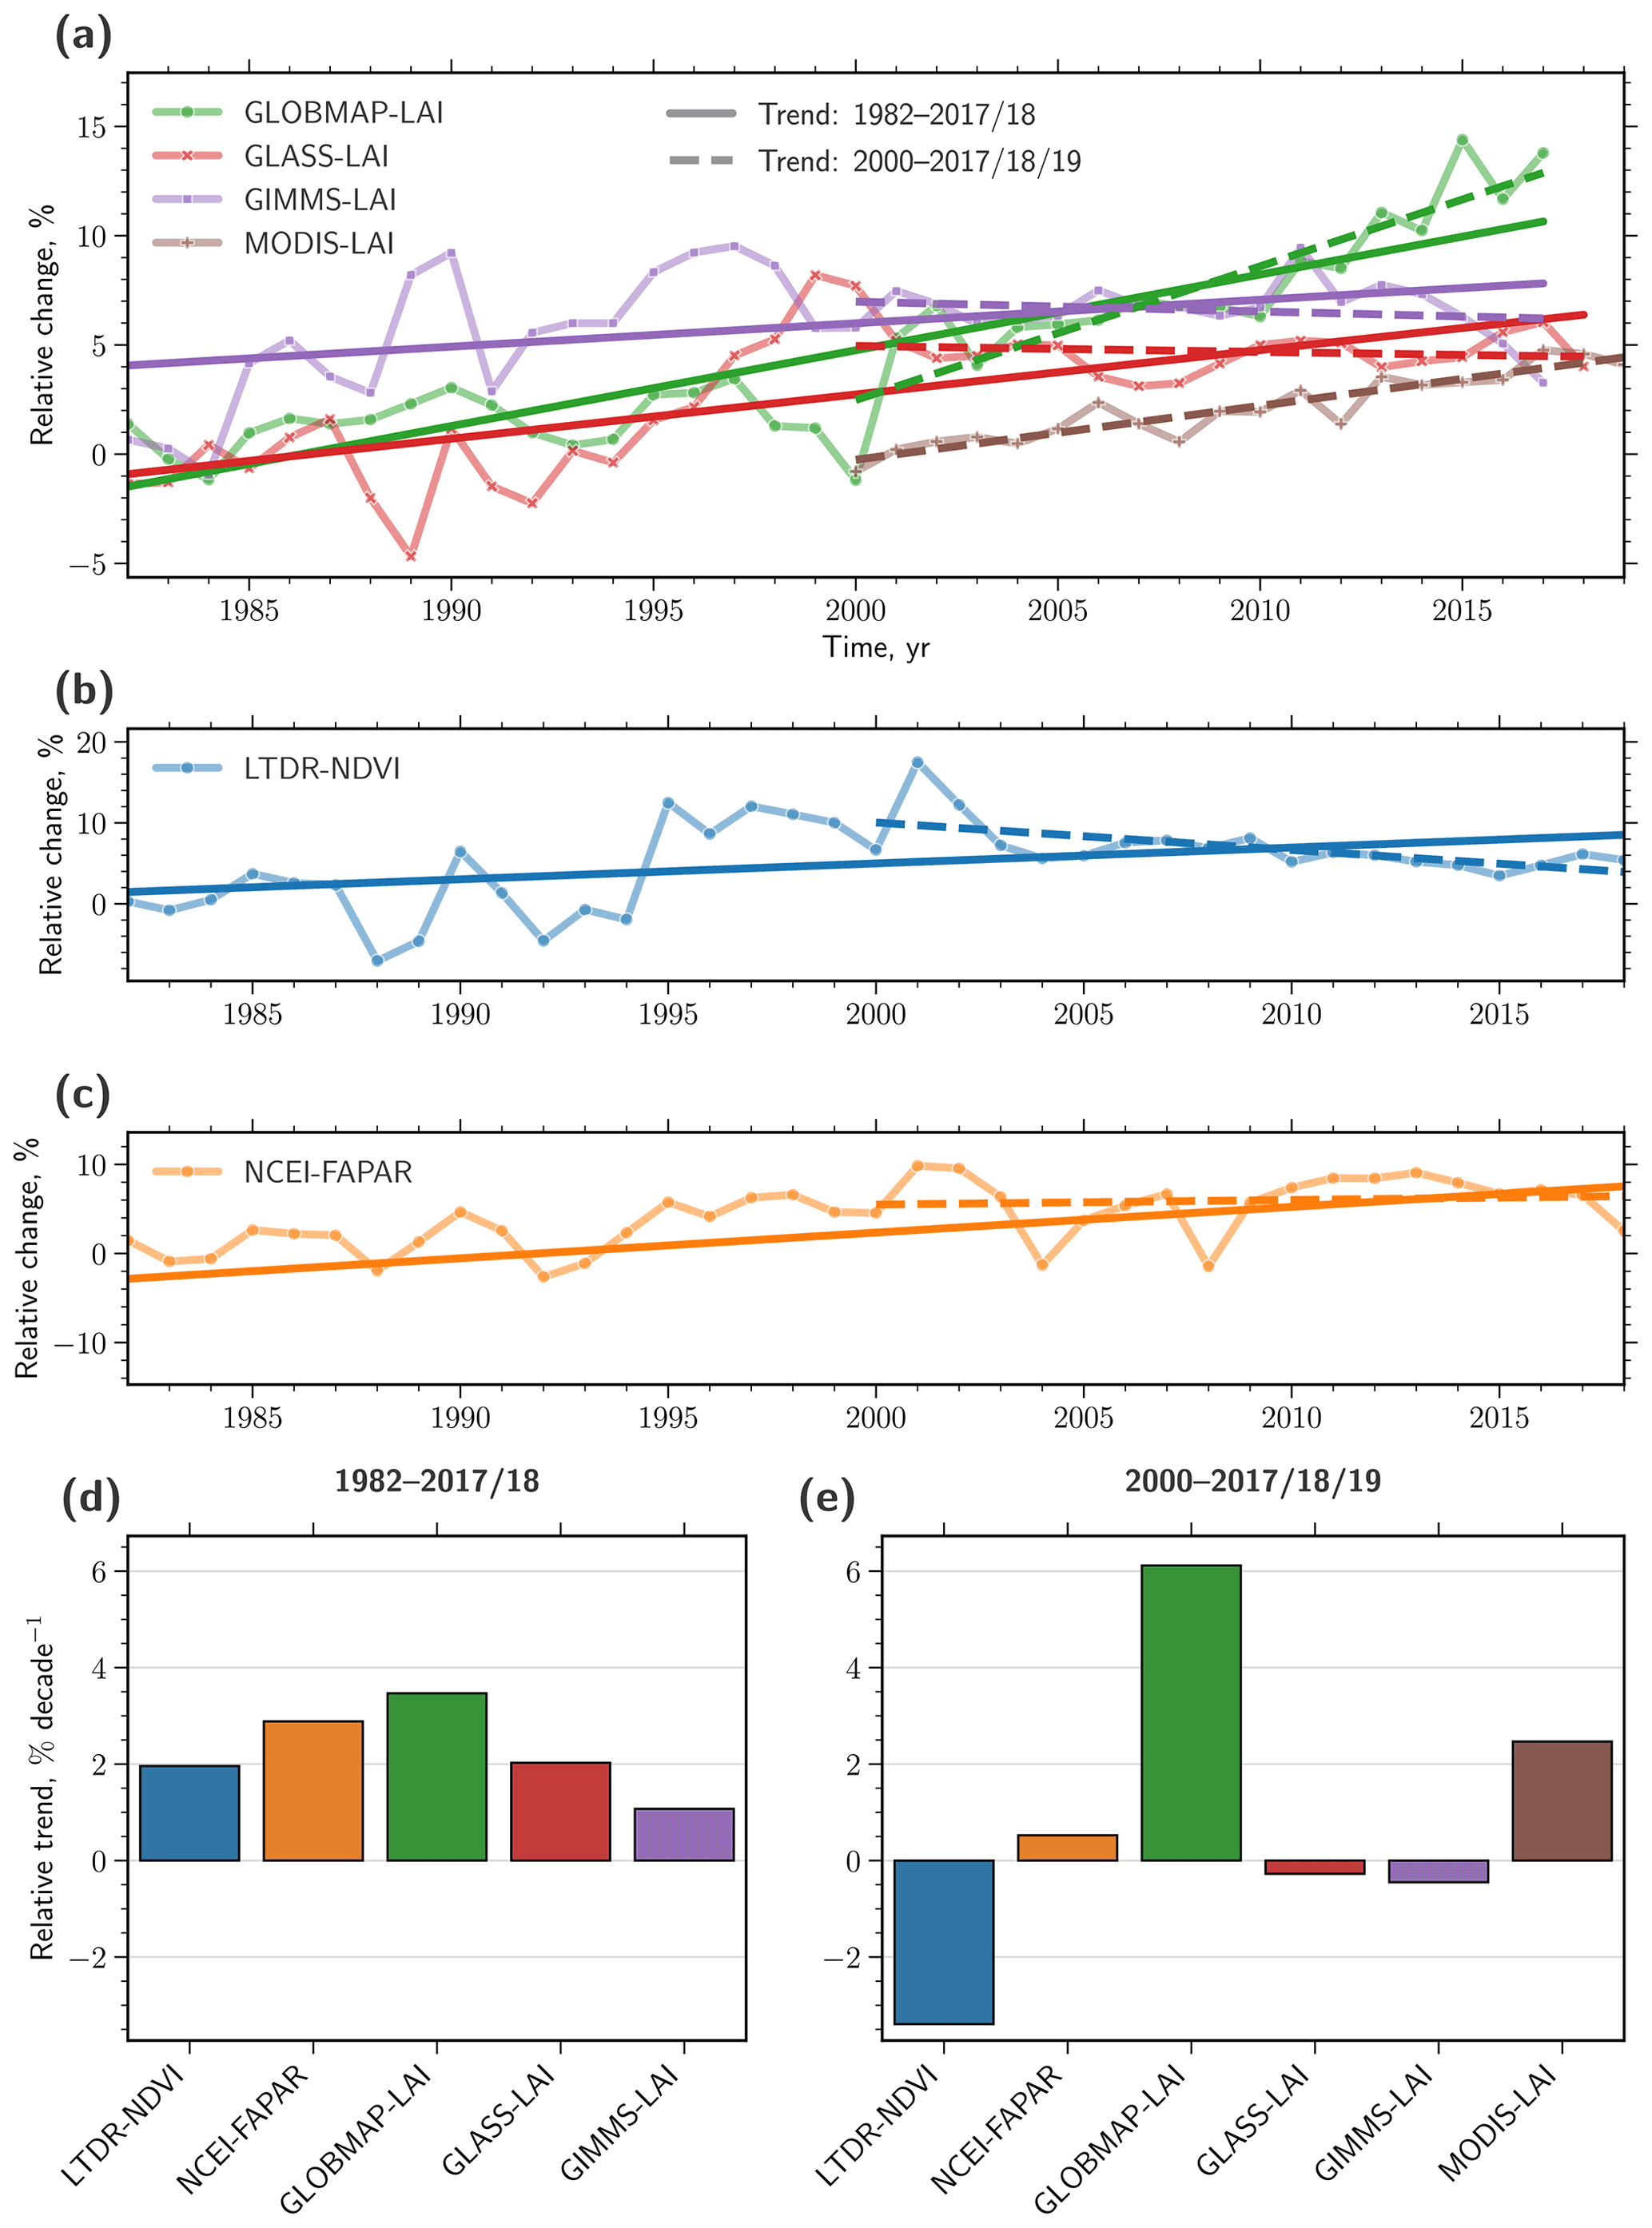
Figure 5Five different remote sensing datasets displaying the development of natural vegetation over the last 4 decades. (a) Time series of changes in LAI relative to the average state from 1982–1984 as depicted in three different datasets (green: GLOBMAP-LAI; red: GLASS-LAI; purple: GIMMS-LAI; and brown: MODIS-LAI; see “Materials and methods” section for further details). The solid straight line represents the best linear fit for the entire period (1982–2017/2018); the dashed line represents the best linear fit for the second half of the period (2000–2017/2018/2019). (b) As in (a) but for the dataset LTDR-NDVI (blue; see “Materials and methods” section for further details). (c) As in (a) but for the dataset NCEI-FAPAR (orange; see “Materials and methods” section of the main paper for further details). (d) Bar chart comparing relative trends (in % per decade) in LAI, NDVI, and FAPAR from different datasets for the entire period (1982–2017/2018) obtained from the gradients shown in (a)–(c), respectively. (e) As in (d) but for the second half of the period (2000–2017/2018/2019).
Models reproduce the flattening of the trend and even the reversal in the sign only when the physiological effect of CO2 is excluded or with a complete absence of CO2 forcing (Fig. 4e). A recent study by Wang et al. (2020) suggests, by analyzing various observational datasets, that global CO2 fertilization has declined in recent years and highlights that land surface models are not reproducing the magnitude of this decline, mainly due to the underrepresentation of nutrient limitation. While these results are consistent with ours, we are not convinced that one can infer a decline in or saturation of the CO2 fertilization effect from these observational datasets. Rather, we argue that countervailing effects associated with the radiative effect of increasing CO2 (climatic changes, e.g., increase in atmospheric dryness and changes in water availability), as discussed below in more detail, become more pronounced and increasingly reduce vegetation productivity.
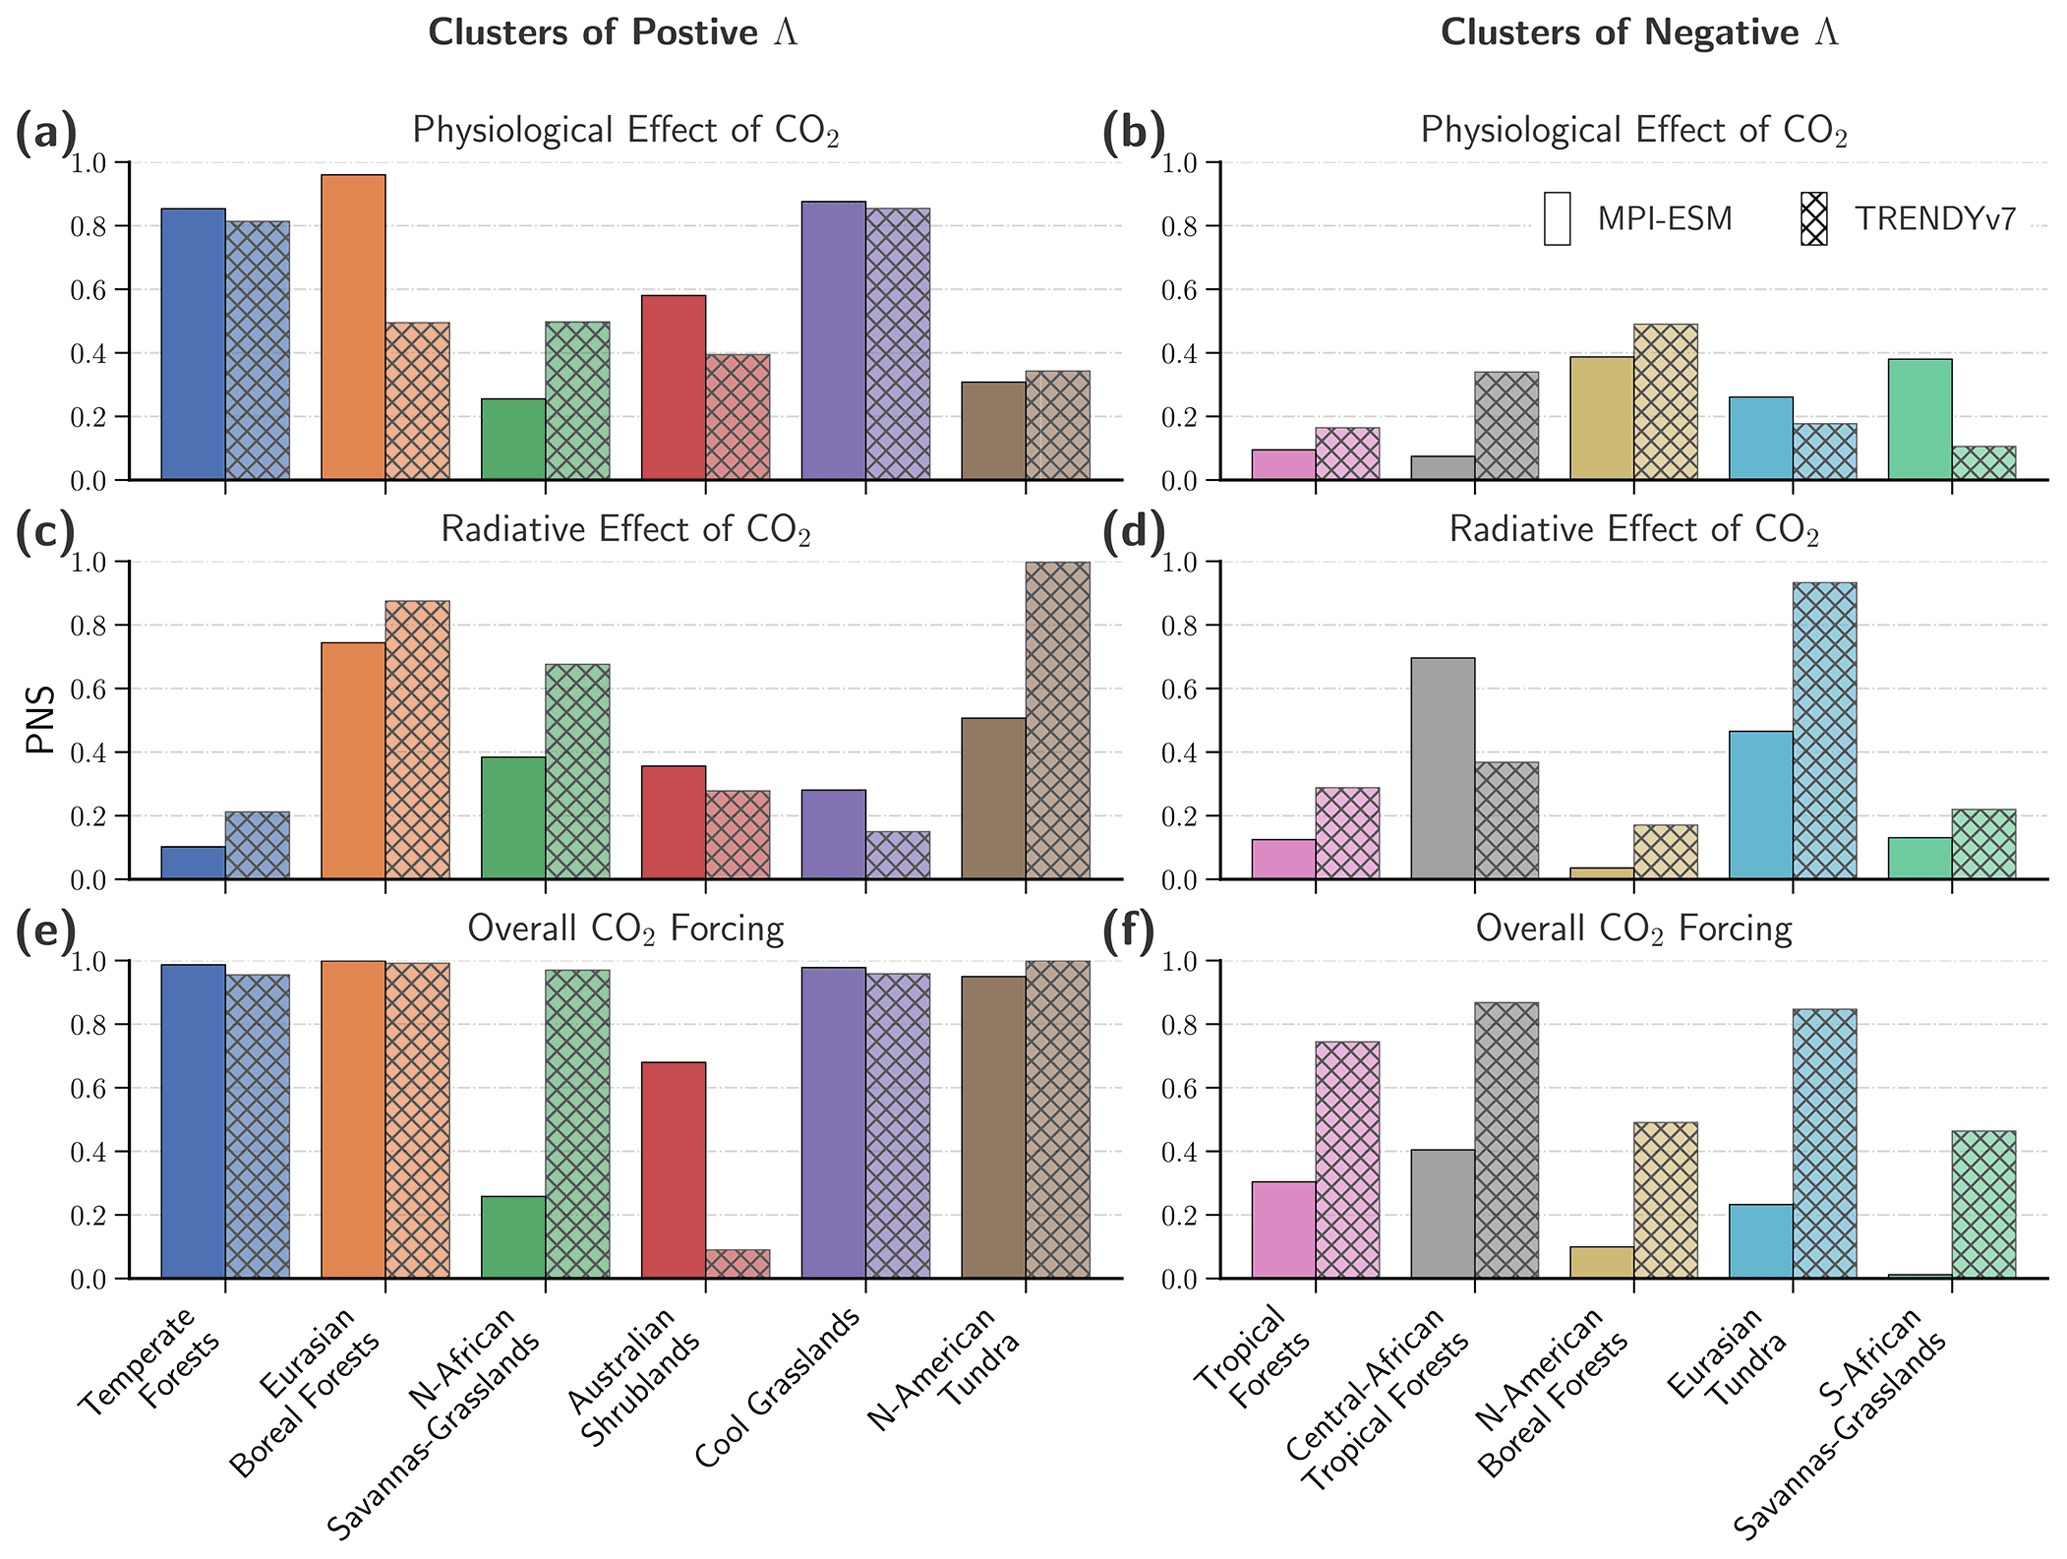
Figure 6Probabilities of sufficient and necessary causation (PNSs) of LAI changes in response to the effects of rising CO2 for 11 clusters. Bar charts represent the PNS of LAI changes in response to the physiological effect (a, b) and radiative effect (c, d) of CO2 and all anthropogenic forcings (e, f). Different colors represent the identified clusters of substantial change in LAI. Panels on the left comprise clusters that show consistent greening; panels on the right represent emerging browning clusters (observed net leaf area loss in the period 2000–2017; attribution is conducted only for significant decreasing trends; see Sect. 2 for details). The two types of bar illustrate the two different ensembles of model simulations (left: MPI-ESM, right: TRENDYv7).
Overall, driver attribution at the global scale, as described above and also in Zhu et al. (2016), neglects the heterogeneity of natural vegetation and the possibility that divergent responses of different natural biomes might cancel each other out. To account for this omission, we identify 11 clusters of significant change and derive probabilities of causation for each driver across different vegetation types (Fig. 6).
3.9 Temperate forests prosper with rising CO2 while tropical forests are increasingly under stress
Forests in temperate climates exhibit a strong positive trend in LAI (∼ 2.53 % per decade), which is also seen in the models, albeit slightly overestimated (∼ 3.18 % per decade for MPI-ESM and ∼2.69 % per decade for TRENDYv7; Fig. S2 in the Supplement). The physiological effect of CO2 is the main driver with a high PNS (85 % for the MPI-ESM, 80 % for TRENDYv7; Fig. 6). The trends are slightly weaker when only analyzing the second half of the observational period, but the overall result does not change. Observed warming might have additionally contributed to enhanced vegetation growth (e.g., growing season extension; Piao et al., 2011; Park et al., 2016); however, it is not identified as an important driver by models. Most temperate forests are in developed countries and, thus, have been managed in a sustainable manner for several decades (Currie and Bergen, 2008). It is conceivable that some of the positive trends in LAI could be attributed to forest management or regrowing forests (Pugh et al., 2019); however, this is not captured by the models (i.e., trends are negative when complete CO2 forcing is absent; Fig. S2).
The response of tropical forests to rising CO2 is more complex. The signal over the entire observational period is slightly positive (∼0.3 % per decade); however, it is within the range of overall uncertainty. Therefore, no robust driver attribution is possible (Figs. 6 and S3 in the Supplement). TRENDYv7 models show strongly opposing responses of LAI to the different effects of CO2: LAI decreases when the physiological effect is omitted but increases when the radiative effect is omitted. The MPI-ESM shows qualitatively the same responses but in a less pronounced way (Fig. S3). For the second half of the satellite record, the observed trend switches sign to a strong negative trend (ca. −1.4 % per decade). The models reproduce this tendency, but the multi-model average of the TRENDYv7 ensemble is still positive. During the same time period, the opposing reactions to CO2 in the factorial runs are more strongly marked (Fig. S3). These results suggest that browning caused by CO2-induced climate change is compensated for by greening affiliated with the CO2 fertilization effect at the biome level. Based on these findings, we hypothesize that the physiological effect of CO2 is strong in models and outbalances the negative effect of climate change in the tropical forests (Kolby Smith et al., 2016). As a consequence, the all-forcings simulations fail to reproduce the observed patterns of strengthening vegetation browning in the tropics (Zhou et al., 2014; Song et al., 2018). Because of the demonstrated limited predictive power of the models in simulating the vegetation response to climatic changes, we also rely more heavily on the published literature in the following discussion of our results.
3.10 Droughts and intensification of the dry season in the Amazon basin
The Amazonian tropical forests are frequently afflicted by severe droughts. During the satellite era most of these droughts were strongly modulated by the El Niño–Southern Oscillation (ENSO). For example, the droughts of 1982–1983, 1987, and 1991–1992 (Asner and Alencar, 2010; Anderson et al., 2018); 1997 (Williamson et al., 2000); and 2015–2016 (Jiménez-Muñoz et al., 2016). The causes of the droughts in 2005 and 2010, however, were not related to ENSO but rather to a warm anomaly in sea surface temperatures in the tropical North Atlantic (Marengo et al., 2008, 2011; Xu et al., 2011). Whereas the ENSO-driven droughts peak in northern hemispheric winter, thus during the wet season, the non-ENSO droughts happened during the dry season (July–September), when tropical ecosystems are more vulnerable to negative rainfall anomalies.
These intense and frequent droughts have diverse impacts on tropical ecosystems (Bonal et al., 2016), the most prominent being an increase in wildfires and tree mortality. Recently, perennial legacy effects have been identified which lead to persistent biomass loss in the aftermath of severe droughts (Saatchi et al., 2013; Yang et al., 2018). For instance, some regions were still recovering from the impact of the megadrought of 2005 when the next major drought began in 2010 (Saatchi et al., 2013). Maeda et al. (2015) found that these extreme events are also capable of disrupting hydrological mechanisms, which can lead to long-lasting changes in the structure of Amazonian ecosystems. Such droughts and associated wildfires are predicted to increase in frequency (Cai et al., 2014) and intensity (Fasullo et al., 2018) as a consequence of the ENSO-related amplification of heat waves but also due to the projected warming of the tropical North Atlantic (Munday and Washington, 2019).
In addition to these episodic disturbances, long-term changes in climate also affected the tropical forests in the Amazon region. Rising surface air temperatures have considerably increased the atmospheric water vapor pressure deficit (VPD), which has a negative effect on vegetation growth (Yuan et al., 2019). Moreover, we find that precipitation has steadily decreased during the dry season (July–September, Figs. S4 and S5 in the Supplement) based on the latest version of the ECMWF reanalysis for the last 40 years (ERA5; Dee et al., 2011). This rainfall deficit and the identified lengthening of the dry season (Fu et al., 2013) exacerbate vegetation water stress during dry seasons and favor conditions for wildfires. The slight increasing trend in wet-season precipitation (February–April) most likely cannot compensate for the water loss and its impact during the dry season (Fig. S4). Overall, the intensification of the dry season and the recurring droughts cause long-term browning trends (Xu et al., 2011), in line with our results of intensified browning of Amazonian forests (Fig. S5).
3.11 Drying trend in central African humid forests
African tropical forests have been experiencing a long-term drying trend since the 1970s (Malhi and Wright, 2004; Asefi-Najafabady and Saatchi, 2013; Zhou et al., 2014). In contrast to South America, the steady decline in rainfall is seen during both dry and wet seasons (Fig. S4). The origin of this decreasing trend in year-round rainfall is still under debate. Precipitation in equatorial Africa is expected to increase under climate change (Weber et al., 2018), so it is hypothesized that this trend is associated with the Atlantic Multidecadal Oscillation and/or changes in the West African Monsoon system (Asefi-Najafabady and Saatchi, 2013). Long-term drying in rainforests could also be connected to the physiological effect of rising CO2. Recently, it has been demonstrated that the reduction in stomatal conductance and transpiration induces a drier, warmer, and deeper boundary layer, resulting in a decline in local rainfall (Langenbrunner et al., 2019). Regardless of what the causes may be, this long-term water deficiency most likely has led to the most pronounced cluster of vegetation browning in Earth's tropical forests ( km2 net loss of leaf area in the time period of 2000–2017). No robust attribution is possible with the set of models analyzed in this study, since they fail to capture this substantial decrease in leaf area in the all-forcings runs (Fig. S6 in the Supplement). In the case of the TRENDYv7 models, this finding is particularly noteworthy as they are driven with observed precipitation changes: the spatial patterns of negative trends in LAI and dry-season precipitation in the central African tropical forests coincide to a large extent (Fig. S4).
Interestingly, the MODIS record does not exhibit this browning cluster (Chen et al., 2019), though it has been reported in other independent observational datasets (Zhou et al., 2014). Also, atmospheric CO2 inversion studies have identified negative trends in carbon uptake for this region (Fernández-Martínez et al., 2019), which corroborates our results based on the LAI3g dataset.
3.12 Tropical forests in Oceania are afflicted by deforestation
Although we exclude direct anthropogenic land cover changes (Fig. S1, Table S1) as well as abrupt changes (Mann–Kendall test for monotonic trends, Sect. 2.6), the LAI trend maps nevertheless show characteristic deforestation patterns, e.g., the so-called “arc of deforestation” in the Amazon region (Fig. S5; Aldrich et al., 2012). Hence, deforestation practices may explain some part of the observed gradual browning of the Amazon (Song et al., 2015) and African tropical forests (Mayaux et al., 2013; Tyukavina et al., 2018).
In Oceania, however, deforestation appears to be a crucial driver of the observed browning in the pristine tropical forests. Significant negative trends align strongly with patterns of drastic deforestation during recent decades, described in detail by Stibig et al. (2014, in comparison to Fig. 2). As opposed to central Africa and the Amazon region, climate changes are unlikely to be the key driver of browning regions in Oceania. There, precipitation, although highly variable in the dry season, appears to increase (Fig. S4) and the increase in VPD is rather minor in tropical forests (Yuan et al., 2019).
3.13 Climate change drives an asymmetrical development of North American and Eurasian ecosystems
The boreal forests show strong positive trends in Eurasia (∼2.69 % per decade for observations, ∼3.48 % per decade for MPI-ESM, and ∼2.08 % per decade for TRENDYv7), which can mostly be attributed to amplified warming of the temperature-limited northern high latitudes (PNS = 71 % for TRENDYv7; PNS = 44 % for the MPI-ESM; Fig. S7 in the Supplement). North American boreal forests exhibit a negative response to the effects of rising CO2, which has amplified over the last 2 decades (ca. −0.95 % per decade, 2000–2017). Models do not reproduce the dominant browning pattern (Fig. S8 in the Supplement), which is most likely connected to inadequate representation of disturbances (Sitch et al., 2015). Several studies have proposed that browning has occurred as a consequence of droughts, wildfire, and insect outbreaks in the North American boreal forests (Goetz et al., 2005; Sitch et al., 2015; Beck and Goetz, 2011; Kurz et al., 2008). Macias Fauria and Johnson (2008) showed that the frequency of wildfires is strongly related to the dynamics of large-scale climatic patterns (Pacific Decadal Oscillation, El Niño–Southern Oscillation, and Arctic Oscillation) and, thus, cannot be tied conclusively to anthropogenic climate change. However, there is also evidence that the residing tree species suffer from drought stress induced by higher evaporative demand as the temperature rises (Verbyla, 2011). Moreover, models lack a representation of the asymmetry in tree species distribution between North America and Eurasia, which could explain their divergent reactions to changes in key environmental variables (Abis and Brovkin, 2017). Further observational evidence for the browning of North American boreal forests and the associated decline in net ecosystem productivity can also be inferred from CO2 inversion products (Fernández-Martínez et al., 2019; Bastos et al., 2019).
Tundra ecosystems also reveal a dipole-type development between North America and Eurasia but with a reversed sign. Hence, North American tundra is strongly greening (∼4.23 % per decade for observations, ∼ 4 % per decade for MPI-ESM, and ∼4.51 % per decade for TRENDYv7), which is virtually certain (PNS = 99 % for TRENDYv7) and about likely as not (PNS = 51 % for the MPI-ESM) caused by warming (Fig. S9 in the Supplement). The trend decreases for the period 2000–2017, which could be linked to the warming hiatus in the years 1998–2012 (Bhatt et al., 2013; Ballantyne et al., 2017; Hedemann et al., 2017). This is in line with the observed slowdown in tundra greening due to short-term cooling after volcanic eruptions (Lucht et al., 2002).
Eurasian tundra shows a positive trend for the years 1982–2017 but a reversal in trend sign for the years 2000–2017 (Fig. S10 in the Supplement). Models exhibit some evidence of a strengthening browning signal but fail to capture the full extent of the emerging browning clusters seen in observations. If we only consider the grid cells that show significant browning in observations and models, we are able to conduct a robust driver attribution. According to the TRENDYv7 ensemble, the browning cluster in Eurasian tundra can very likely be attributed to CO2-induced climate change (PNS = 93 %; PNS = 47 % for the MPI-ESM). These results are in line with studies showing that tundra ecosystems are susceptible to warm spells during the growing season (Phoenix and Bjerke, 2016) and to frequent droughts (Beck and Goetz, 2011). The asymmetry between Eurasia and North America can be explained by changes in large-scale atmospheric circulation. Eurasia is cooling through increased summer cloud cover, whereas North America is warming through more cloudless skies (Bhatt et al., 2013, 2014). Also linkages between regional Arctic sea ice retreat, subsequent increasing ice-free waters, and regional Arctic vegetation dynamics have been postulated (Bhatt et al., 2014).
3.14 Vegetation in arid climates is greening, except in South America
Non-forested greening clusters beyond the high northern latitudes coincide with semi-arid to arid climates (Park et al., 2018). The northern sub-Saharan African savannas and grasslands have greened extensively in recent decades (∼ 4.63 % per decade; Fig. S11 in the Supplement), which is reproduced by the observation-driven TRENDYv7 models (∼4.55 % per decade) and is likely caused by climatic changes (PNS = 68 %). No robust attribution is feasible based on the MPI-ESM simulations. However, it is noteworthy that the fully coupled Earth system model points to climate change as having a negative effect in these regions, thus not reproducing the observed increase in rainfall (Fig. S11). This provides evidence for the hypothesis that African precipitation anomalies are not induced by rising CO2 but rather follow a multidecadal internal climatic mode (Asefi-Najafabady and Saatchi, 2013).
The overall uncertainty in LAI changes is high in the southern African grasslands and savannas, and thus, no robust long-term change can be identified (Fig. S12 in the Supplement). It has been shown that shrublands in the more southern regions are greening in response to increased rainfall (Fensholt and Rasmussen, 2011). In general, the literature suggests that greening and browning patterns in arid climates are mainly driven by precipitation anomalies (Fensholt and Rasmussen, 2011; Fensholt et al., 2012; Gu et al., 2016; Adler et al., 2017). Close resemblance arises when comparing the spatial patterns of precipitation trends throughout the satellite era (Adler et al., 2017) with significant changes in vegetation in arid environments, especially in the African continent. Decreased rainfall in arid South America coincides with strong browning clusters (Fensholt et al., 2012). This is in disagreement with the expected strong manifestation of CO2 fertilization in water-limited environments (Ukkola et al., 2016).
Australian Shrublands show a persistent positive LAI trend (∼3.84 % per decade), intermittently perturbed by climatic extreme events (e.g., strong anomalous rainfall with subsequent extensive vegetation greening in 2011, Fig. S13 in the Supplement; Poulter et al., 2014). Models reproduce the steady greening of Australia, but no robust driver attribution is feasible due to high overall uncertainty. However, both model setups point to the physiological effect of CO2 as the dominant driver (Fig. S13). These results are congruent with recent studies (Donohue et al., 2009; Ukkola et al., 2016) that show CO2 fertilization has enhanced vegetation growth by lowering the water limitation threshold.
Grasslands in the cool arid climates exhibit persistent positive trends (∼2.03 % per decade, Fig. S14 in the Supplement). Simulated estimates are in the range of the observations (∼2.33 % per decade for MPI-ESM and ∼1.81 % per decade for TRENDYv7). Our analysis suggests that the positive response of cool arid grasslands to rising CO2 can be explained by the physiological effect of CO2 (PNS = 85 % for TRENDYv7; PNS = 88 % for the MPI-ESM). These ecosystems are dominated by C3-type plants (Still et al., 2003), which are susceptible to CO2 fertilization (Sage et al., 2012), thus consistent with our results. In the warm arid areas, C4-type grasses dominate (Still et al., 2003), which are less sensitive to the physiological effects of CO2 (Sage et al., 2012). As discussed above, vegetation changes there are mostly driven by precipitation anomalies, although CO2 fertilization might also contribute to a limited extent (Sage et al., 2012).
In this paper we examine nearly 4 decades of global LAI changes under rising atmospheric CO2 concentration. We find that Earth's greening trend is weakening and clusters of browning are beginning to emerge and, importantly, have expanded during the last 2 decades. With one exception, all analyzed satellite observation datasets confirm these results but with different signal strengths. Leaf area is primarily decreasing in the pan-tropical green belt of dense vegetation. Leaf area gain is occurring mostly in sparsely vegetated regions in cold and/or arid climatic zones and in temperate forests. Thus, vegetation greening is occurring mainly in regions of low LAI, whereas browning is seen primarily in regions of high LAI. Consequently, these opposing trends are decreasing the texture of leaf area distribution in natural vegetation.
We identify clusters of greening and browning spread across all continents and conduct a regional, i.e., biome-specific, driver attribution based on factorial model simulations. The results suggest that the physiological effect of CO2 (i.e., CO2 fertilization) is the dominant driver of increasing leaf area only in temperate forests, cool arid grasslands, and likely the Australian shrublands. A cause-and-effect relationship between CO2 fertilization and greening of other biomes could not be established. This finding questions the study by Zhu et al. (2016) that identified CO2 fertilization as the globally prevailing driver of Earth's greening trend. We find that many clusters of greening and browning bear the signature of climatic changes. The greening of sub-Saharan grasslands and savannas is consistent with an increase in rainfall. Climatic changes, primarily warming and drying, determine the patterns of vegetation changes in the northern ecosystems, i.e., greening of Eurasian boreal forests and North American tundra, but also the emerging browning trend in the Eurasian tundra. Models fail to capture the browning of North American boreal forests. Models suggest rising CO2 has compensatory effects on LAI in the tropical forests. Climatic changes induce browning, which is opposed by greening due to a strong physiological effect in the models. Hence, if the physiological effect of CO2 is “turned off”, models simulate the emerging browning trend in the tropics comparable to observations. Our analysis of changes in rainfall during the satellite age underpins climate changes as the main cause of tropical forest browning: recurrent droughts and a decline in dry-season precipitation in the Amazon as well as long-term drying trends in Africa.
Models represent a simplified view of the real world reduced to its essential processes. Some of these processes are underrepresented or lacking in the current generation of land surface models. Whether they are driven with observed climatic conditions or operate in a fully coupled Earth system model, they fail to capture the full extent of adverse effects of rising CO2 in natural ecosystems. In particular, the deficiency of reproducing the observed leaf area loss in North American boreal and in pan-tropical forests – biomes which account for a large part of the photosynthetic carbon fixation – has considerable implications for future climate projections. Thus, it is important to focus model development not only on a better representation of disturbances such as droughts and wildfires but also on revising the implementation of processes associated with the physiological effect of CO2, which currently offsets browning induced by climatic changes.
Another vital issue for future research is the impact of large-scale climatic anomalies on vegetation. All three major clusters of browning are hypothesized to be associated with temperature or precipitation anomalies modulated by climatic modes. Many droughts in the Amazon have been attributed to El Niño events (Bonal et al., 2016). The long-term drying trend in tropical Africa is possibly connected to the Atlantic Multidecadal Oscillation (Asefi-Najafabady and Saatchi, 2013). Likewise, disturbances in North American boreal forests are likely controlled by an interplay between large-scale climatic patterns (Pacific Decadal Oscillation, El Niño–Southern Oscillation, and Arctic Oscillation; Macias Fauria and Johnson, 2008). Little is known about how these large-scale patterns might change in a warming climate. Current Earth system models struggle to simulate these climatic modes and related precipitation patterns, which is likely rooted in their coarse spatial resolution. New tools, such as high-resolution simulations or large ensembles, offer possibilities for studying these phenomena.
Overall, our study suggests that Earth largely greened in the 1980s and 1990s as rising CO2 triggered mainly LAI-increasing effects, e.g., by warming the high northern latitudes and overall more carbon allocation through CO2 fertilization. However, as CO2 continues to rise, the system appears to be entering or has entered a regime in which LAI-decreasing effects are amplified; i.e., climatic changes associated with rising atmospheric CO2 concentration become more pronounced and have stronger adverse effects in various ecosystems. In addition, plant sensitivity to CO2 fertilization may already be saturating, as recently suggested by Wang et al. (2020), but this aspect remains controversial.
We show that the effects of rising CO2 on LAI are not comparable across the biomes, nor are the impacts on the ecosystems. Regarding biodiversity, the consequences of leaf area loss in tropical forests that harbor the most diverse flora and fauna of the planet are not compensated for by leaf area gain in temperate and arctic ecosystems. A similar caveat is in order with respect to the carbon cycle; e.g., an additional leaf in the tundra does not offset the reduction in primary productivity of a leaf lost in the tropical rainforest. Thus, our results indicating loss of tropical leaf area should be of concern. A recent study suggested that the tropical forests have already switched to being a net source of carbon, also considering land-use emissions (Baccini et al., 2017). The uncertainty in future projections is large, ranging from a stable CO2 fertilization-driven carbon sink to a collapse of the system at a certain CO2 concentration (Cox et al., 2000). Concerning leaf area, the models project a steady greening of the tropical forests in the high-end CO2 emissions scenario (business as usual) and a slight browning in the low-end scenario (mitigation) by the end of the century (Piao et al., 2019). Altogether, the tropical forests have the potential to crucially influence the evolution of climate throughout the 21st century and should be a vital issue for future research.
All data used in this study are available from public databases or the literature, which can be found with the references provided in the respective “Materials and methods” subsection. Processed data and analysis scripts are available from the corresponding author upon request, and the repository was published under https://zenodo.org/record/5348210 together with this article. Correspondence and requests for materials should be addressed to Alexander J. Winkler (alexander.winkler@mpimet.mpg.de or awinkler@bgc-jena.mpg.de).
The animation shows how the leaf area index on the African continent has evolved over the last 4 decades. The spotlight is on tropical forests, where the initial greening signal during the first 2 decades shifts to a declining trend in the course of the last 2 decades (https://doi.org/10.5446/51213; Böttinger and Winkler, 2021).
The supplement related to this article is available online at: https://doi.org/10.5194/bg-18-4985-2021-supplement.
AJW performed the research and drafted the manuscript with inputs from RBM, VB, SS, VH, DL, VKA, JP, JEMSN, DSG, EK, HT, AA, and PF; AJW carried out the attribution analysis with support from AH; RBM, AH, and VB contributed ideas and to the interpretation of the results.
The authors declare that they have no conflict of interest.
Publisher's note: Copernicus Publications remains neutral with regard to jurisdictional claims in published maps and institutional affiliations.
We thankfully acknowledge Taejin Park and Chi Chen for their help with remote sensing data (GIMMS LAI). We also acknowledge Qian Zhao, Zaichun Zhu, and Zhiqiang Xiao, who provided further remote sensing LAI datasets (GLOBMAP LAI and GLASS LAI), and thank Ulrich Weber for his assistance in processing various datasets. We thank Philippe Peylin, Matthias Rocher, Andrew J. Wiltshire, Sebastian Lienert, and Anthony P. Walker for providing model output as part of the TRENDYv7 ensemble. Alexander J. Winkler wishes to thank Thomas Raddatz and Veronika Gayler for their support in working with the MPI-M Earth System Model. We gratefully acknowledge Thomas Riddick for his review and valuable comments on the manuscript.
Julia Pongratz was supported by the
German Research Foundation's Emmy Noether Programme. Ranga B. Myneni was supported by the NASA Earth Science Division and Alexander von Humboldt Foundation.
The article processing charges for this open-access publication were covered by the Max Planck Society.
This paper was edited by Martin De Kauwe and reviewed by Christian Frankenberg and one anonymous referee.
Abis, B. and Brovkin, V.: Environmental conditions for alternative tree-cover states in high latitudes, Biogeosciences, 14, 511–527, https://doi.org/10.5194/bg-14-511-2017, 2017. a
Adler, R. F., Gu, G., Sapiano, M., Wang, J.-J., and Huffman, G. J.: Global Precipitation: Means, Variations and Trends During the Satellite Era (1979–2014), Surv. Geophys., 38, 679–699, https://doi.org/10.1007/S10712-017-9416-4, 2017. a, b
Aldrich, S., Walker, R., Simmons, C., Caldas, M., and Perz, S.: Contentious Land Change in the Amazon's Arc of Deforestation, Ann. Assoc. Am. Geogr., 102, 103–128, https://doi.org/10.1080/00045608.2011.620501, 2012. a
Anav, A., Friedlingstein, P., Kidston, M., Bopp, L., Ciais, P., Cox, P., Jones, C., Jung, M., Myneni, R., and Zhu, Z.: Evaluating the Land and Ocean Components of the Global Carbon Cycle in the CMIP5 Earth System Models, J. Climate, 26, 6801–6843, https://doi.org/10.1175/JCLI-D-12-00417.1, 2013. a
Anderson, L. O., Ribeiro Neto, G., Cunha, A. P., Fonseca, M. G., Mendes de Moura, Y., Dalagnol, R., Wagner, F. H., and de Aragão, L. E. O. e. C.: Vulnerability of Amazonian Forests to Repeated Droughts, Philos. T. Roy. Soc. B, 373, 20170411, https://doi.org/10.1098/rstb.2017.0411, 2018. a
Asefi-Najafabady, S. and Saatchi, S.: Response of African Humid Tropical Forests to Recent Rainfall Anomalies, Philos. T. Roy. Soc. B, 368, 20120306, https://doi.org/10.1098/RSTB.2012.0306, 2013. a, b, c, d
Asner, G. P. and Alencar, A.: Drought Impacts on the Amazon Forest: The Remote Sensing Perspective, New Phytol., 187, 569–578, https://doi.org/10.1111/j.1469-8137.2010.03310.x, 2010. a
Baccini, A., Walker, W., Carvalho, L., Farina, M., Sulla-Menashe, D., and Houghton, R. A.: Tropical Forests Are a Net Carbon Source Based on Aboveground Measurements of Gain and Loss, Science, 358, 230–234, https://doi.org/10.1126/science.aam5962, 2017. a
Ballantyne, A., Smith, W., Anderegg, W., Kauppi, P., Sarmiento, J., Tans, P., Shevliakova, E., Pan, Y., Poulter, B., Anav, A., Friedlingstein, P., Houghton, R., and Running, S.: Accelerating Net Terrestrial Carbon Uptake during the Warming Hiatus Due to Reduced Respiration, Nat. Clim. Change, 7, 148–152, https://doi.org/10.1038/nclimate3204, 2017. a
Bastos, A., Friedlingstein, P., Sitch, S., Chen, C., Mialon, A., Wigneron, J.-P., Arora, V. K., Briggs, P. R., Canadell, J. G., Ciais, P., Chevallier, F., Cheng, L., Delire, C., Haverd, V., Jain, A. K., Joos, F., Kato, E., Lienert, S., Lombardozzi, D., Melton, J. R., Myneni, R., Nabel, J. E. M. S., Pongratz, J., Poulter, B., Rödenbeck, C., Séférian, R., Tian, H., van Eck, C., Viovy, N., Vuichard, N., Walker, A. P., Wiltshire, A., Yang, J., Zaehle, S., Zeng, N., and Zhu, D.: Impact of the 2015/2016 El Niño on the Terrestrial Carbon Cycle Constrained by Bottom-up and Top-down Approaches, Philos. T. Roy. Soc. B, 373, 20170304, https://doi.org/10.1098/rstb.2017.0304, 2018. a
Bastos, A., Ciais, P., Chevallier, F., Rödenbeck, C., Ballantyne, A. P., Maignan, F., Yin, Y., Fernández-Martínez, M., Friedlingstein, P., Peñuelas, J., Piao, S. L., Sitch, S., Smith, W. K., Wang, X., Zhu, Z., Haverd, V., Kato, E., Jain, A. K., Lienert, S., Lombardozzi, D., Nabel, J. E. M. S., Peylin, P., Poulter, B., and Zhu, D.: Contrasting effects of CO2 fertilization, land-use change and warming on seasonal amplitude of Northern Hemisphere CO2 exchange, Atmos. Chem. Phys., 19, 12361–12375, https://doi.org/10.5194/acp-19-12361-2019, 2019. a
Beck, P. S. A. and Goetz, S. J.: Satellite Observations of High Northern Latitude Vegetation Productivity Changes between 1982 and 2008: Ecological Variability and Regional Differences, Environ. Res. Lett., 6, 045501, https://doi.org/10.1088/1748-9326/6/4/045501, 2011. a, b
Bhatt, U. S., Walker, D. A., Raynolds, M. K., Bieniek, P. A., Epstein, H. E., Comiso, J. C., Pinzon, J. E., Tucker, C. J., and Polyakov, I. V.: Recent Declines in Warming and Vegetation Greening Trends over Pan-Arctic Tundra, Remote Sens.-Basel, 5, 4229–4254, https://doi.org/10.3390/rs5094229, 2013. a, b
Bhatt, U. S., Walker, D. A., Walsh, J. E., Carmack, E. C., Frey, K. E., Meier, W. N., Moore, S. E., Parmentier, F.-J. W., Post, E., Romanovsky, V. E., and Simpson, W. R.: Implications of Arctic Sea Ice Decline for the Earth System, Annu. Rev. Env. Resour., 39, 57–89, https://doi.org/10.1146/annurev-environ-122012-094357, 2014. a, b
Bonal, D., Burban, B., Stahl, C., Wagner, F., and Hérault, B.: The Response of Tropical Rainforests to Drought–Lessons from Recent Research and Future Prospects, Ann. For. Sci., 73, 27–44, https://doi.org/10.1007/S13595-015-0522-5, 2016. a, b, c
Bonan, G. B.: Forests and Climate Change: Forcings, Feedbacks, and the Climate Benefits of Forests, Science, 320, 1444–1449, https://doi.org/10.1126/science.1155121, 2008. a
Böttinger, M. and Winkler, A. J.: Leaf Area Changes of Sub-Saharan Africa Throughout the Satellite Era, TIB, https://doi.org/10.5446/51213, 2021. a
Cai, W., Borlace, S., Lengaigne, M., van Rensch, P., Collins, M., Vecchi, G., Timmermann, A., Santoso, A., McPhaden, M. J., Wu, L., England, M. H., Wang, G., Guilyardi, E., and Jin, F.-F.: Increasing Frequency of Extreme El Niño Events Due to Greenhouse Warming, Nat. Clim. Change, 4, 111–116, https://doi.org/10.1038/NCLIMATE2100, 2014. a
Chen, C., Park, T., Wang, X., Piao, S., Xu, B., Chaturvedi, R. K., Fuchs, R., Brovkin, V., Ciais, P., Fensholt, R., Tømmervik, H., Bala, G., Zhu, Z., Nemani, R. R., and Myneni, R. B.: China and India Lead in Greening of the World through Land-Use Management, Nature Sustainability, 2, 122, https://doi.org/10.1038/s41893-019-0220-7, 2019. a, b, c, d, e, f, g, h, i, j, k, l
Claverie, M., Matthews, J. L., Vermote, E. F., and Justice, C. O.: A 30+ Year AVHRR LAI and FAPAR Climate Data Record: Algorithm Description and Validation, Remote Sens.-Basel, 8, 263, https://doi.org/10.3390/rs8030263, 2016. a
Cox, P. M., Betts, R. A., Jones, C. D., Spall, S. A., and Totterdell, I. J.: Acceleration of Global Warming Due to Carbon-Cycle Feedbacks in a Coupled Climate Model, Nature, 408, 184–187, https://doi.org/10.1038/35041539, 2000. a
Currie, W. S. and Bergen, K. M.: Temperate Forest, in: Encyclopedia of Ecology, edited by: Jørgensen, S. E. and Fath, B. D., Academic Press, Oxford, UK, 3494–3503, https://doi.org/10.1016/B978-008045405-4.00704-7, 2008. a
Dee, D. P., Uppala, S. M., Simmons, A. J., Berrisford, P., Poli, P., Kobayashi, S., Andrae, U., Balmaseda, M. A., Balsamo, G., Bauer, P., Bechtold, P., Beljaars, A. C. M., van de Berg, L., Bidlot, J., Bormann, N., Delsol, C., Dragani, R., Fuentes, M., Geer, A. J., Haimberger, L., Healy, S. B., Hersbach, H., Hólm, E. V., Isaksen, L., Kållberg, P., Köhler, M., Matricardi, M., McNally, A. P., Monge-Sanz, B. M., Morcrette, J.-J., Park, B.-K., Peubey, C., de Rosnay, P., Tavolato, C., Thépaut, J.-N., and Vitart, F.: The ERA-Interim Reanalysis: Configuration and Performance of the Data Assimilation System, Q. J. Roy. Meteor. Soc., 137, 553–597, https://doi.org/10.1002/qj.828, 2011. a
Donohue, R. J., McVicar, T. R., and Roderick, M. L.: Climate-Related Trends in Australian Vegetation Cover as Inferred from Satellite Observations, 1981–2006, Glob. Change Biol., 15, 1025–1039, https://doi.org/10.1111/J.1365-2486.2008.01746.X, 2009. a, b
Donohue, R. J., Roderick, M. L., McVicar, T. R., and Farquhar, G. D.: Impact of CO2 Fertilization on Maximum Foliage Cover across the Globe's Warm, Arid Environments, Geophys. Res. Lett., 40, 3031–3035, https://doi.org/10.1002/GRL.50563, 2013. a
Eyring, V., Bony, S., Meehl, G. A., Senior, C. A., Stevens, B., Stouffer, R. J., and Taylor, K. E.: Overview of the Coupled Model Intercomparison Project Phase 6 (CMIP6) experimental design and organization, Geosci. Model Dev., 9, 1937–1958, https://doi.org/10.5194/gmd-9-1937-2016, 2016. a
Fasullo, J. T., Otto-Bliesner, B. L., and Stevenson, S.: ENSO's Changing Influence on Temperature, Precipitation, and Wildfire in a Warming Climate, Geophys. Res. Lett., 45, 9216–9225, https://doi.org/10.1029/2018GL079022, 2018. a
Fatichi, S., Leuzinger, S., Paschalis, A., Langley, J. A., Barraclough, A. D., and Hovenden, M. J.: Partitioning Direct and Indirect Effects Reveals the Response of Water-Limited Ecosystems to Elevated CO2, P. Natl. Acad. Sci. USA, 113, 12757–12762, https://doi.org/10.1073/pnas.1605036113, 2016. a, b
Fensholt, R. and Rasmussen, K.: Analysis of Trends in the Sahelian `Rain-Use Efficiency' Using GIMMS NDVI, RFE and GPCP Rainfall Data, Remote Sens. Environ., 115, 438–451, https://doi.org/10.1016/J.RSE.2010.09.014, 2011. a, b
Fensholt, R., Langanke, T., Rasmussen, K., Reenberg, A., Prince, S. D., Tucker, C., Scholes, R. J., Le, Q. B., Bondeau, A., Eastman, R., Epstein, H., Gaughan, A. E., Hellden, U., Mbow, C., Olsson, L., Paruelo, J., Schweitzer, C., Seaquist, J., and Wessels, K.: Greenness in Semi-Arid Areas across the Globe 1981–2007 – an Earth Observing Satellite Based Analysis of Trends and Drivers, Remote Sens. Environ., 121, 144–158, https://doi.org/10.1016/j.rse.2012.01.017, 2012. a, b
Fernández-Martínez, M., Sardans, J., Chevallier, F., Ciais, P., Obersteiner, M., Vicca, S., Canadell, J. G., Bastos, A., Friedlingstein, P., Sitch, S., Piao, S. L., Janssens, I. A., and Peñuelas, J.: Global Trends in Carbon Sinks and Their Relationships with CO2 and Temperature, Nat. Clim. Change, 9, 73, https://doi.org/10.1038/s41558-018-0367-7, 2019. a, b
Forkel, M., Carvalhais, N., Rödenbeck, C., Keeling, R., Heimann, M., Thonicke, K., Zaehle, S., and Reichstein, M.: Enhanced Seasonal CO2 Exchange Caused by Amplified Plant Productivity in Northern Ecosystems, Science, 351, 696–699, https://doi.org/10.1126/science.aac4971, 2016. a
Forzieri, G., Alkama, R., Miralles, D. G., and Cescatti, A.: Satellites Reveal Contrasting Responses of Regional Climate to the Widespread Greening of Earth, Science, 356, 1180–1184, https://doi.org/10.1126/science.aal1727, 2017. a, b
Fu, R., Yin, L., Li, W., Arias, P. A., Dickinson, R. E., Huang, L., Chakraborty, S., Fernandes, K., Liebmann, B., Fisher, R., and Myneni, R. B.: Increased Dry-Season Length over Southern Amazonia in Recent Decades and Its Implication for Future Climate Projection, P. Natl. Acad. Sci. USA, 110, 18110–18115, https://doi.org/10.1073/pnas.1302584110, 2013. a
Giorgetta, M. A., Jungclaus, J., Reick, C. H., Legutke, S., Bader, J., Böttinger, M., Brovkin, V., Crueger, T., Esch, M., Fieg, K., Glushak, K., Gayler, V., Haak, H., Hollweg, H.-D., Ilyina, T., Kinne, S., Kornblueh, L., Matei, D., Mauritsen, T., Mikolajewicz, U., Mueller, W., Notz, D., Pithan, F., Raddatz, T., Rast, S., Redler, R., Roeckner, E., Schmidt, H., Schnur, R., Segschneider, J., Six, K. D., Stockhause, M., Timmreck, C., Wegner, J., Widmann, H., Wieners, K.-H., Claussen, M., Marotzke, J., and Stevens, B.: Climate and Carbon Cycle Changes from 1850 to 2100 in MPI-ESM Simulations for the Coupled Model Intercomparison Project Phase 5, J. Adv. Model. Earth Sy., 5, 572–597, https://doi.org/10.1002/jame.20038, 2013. a
Goetz, S. J., Bunn, A. G., Fiske, G. J., and Houghton, R. A.: Satellite-Observed Photosynthetic Trends across Boreal North America Associated with Climate and Fire Disturbance, P. Natl. Acad. Sci. USA, 102, 13521–13525, https://doi.org/10.1073/pnas.0506179102, 2005. a, b, c
Gu, G., Adler, R. F., and Huffman, G. J.: Long-Term Changes/Trends in Surface Temperature and Precipitation during the Satellite Era (1979–2012), Clim. Dynam., 46, 1091–1105, https://doi.org/10.1007/S00382-015-2634-X, 2016. a
Hannart, A. and Naveau, P.: Probabilities of Causation of Climate Changes, J. Climate, 31, 5507–5524, https://doi.org/10.1175/JCLI-D-17-0304.1, 2018. a, b, c, d, e, f, g, h, i, j, k, l, m, n, o
Hannart, A., Pearl, J., Otto, F. E. L., Naveau, P., and Ghil, M.: Causal Counterfactual Theory for the Attribution of Weather and Climate-Related Events, B. Am. Meteorol. Soc., 97, 99–110, https://doi.org/10.1175/BAMS-D-14-00034.1, 2016. a, b, c, d
Harris, I., Jones, P. D., Osborn, T. J., and Lister, D. H.: Updated High-Resolution Grids of Monthly Climatic Observations – the CRU TS3.10 Dataset, Int. J. Climatol., 34, 623–642, https://doi.org/10.1002/joc.3711, 2014. a
Hedemann, C., Mauritsen, T., Jungclaus, J., and Marotzke, J.: The Subtle Origins of Surface-Warming Hiatuses, Nat. Clim. Change, 7, 336–339, https://doi.org/10.1038/nclimate3274, 2017. a
Hurtt, G. C., Chini, L. P., Frolking, S., Betts, R. A., Feddema, J., Fischer, G., Fisk, J. P., Hibbard, K., Houghton, R. A., Janetos, A., Jones, C. D., Kindermann, G., Kinoshita, T., Klein Goldewijk, K., Riahi, K., Shevliakova, E., Smith, S., Stehfest, E., Thomson, A., Thornton, P., van Vuuren, D. P., and Wang, Y. P.: Harmonization of Land-Use Scenarios for the Period 1500–2100: 600 Years of Global Gridded Annual Land-Use Transitions, Wood Harvest, and Resulting Secondary Lands, Climatic Change, 109, 117, https://doi.org/10.1007/S10584-011-0153-2, 2011. a
Jiménez-Muñoz, J. C., Mattar, C., Barichivich, J., Santamaría-Artigas, A., Takahashi, K., Malhi, Y., Sobrino, J. A., and van der Schrier, G.: Record-Breaking Warming and Extreme Drought in the Amazon Rainforest during the Course of El Niño 2015–2016, Sci. Rep.-UK, 6, 33130, https://doi.org/10.1038/SREP33130, 2016. a
Jones, P. W.: First- and Second-Order Conservative Remapping Schemes for Grids in Spherical Coordinates, Mon. Weather Rev., 127, 2204–2210, https://doi.org/10.1175/1520-0493(1999)127<2204:FASOCR>2.0.CO;2, 1999. a, b
Keenan, T. F., Prentice, I. C., Canadell, J. G., Williams, C. A., Wang, H., Raupach, M., and Collatz, G. J.: Recent Pause in the Growth Rate of Atmospheric CO2 Due to Enhanced Terrestrial Carbon Uptake, Nat. Commun., 7, 13428, https://doi.org/10.1038/ncomms13428, 2016. a
Kolby Smith, W., Reed, S. C., Cleveland, C. C., Ballantyne, A. P., Anderegg, W. R. L., Wieder, W. R., Liu, Y. Y., and Running, S. W.: Large Divergence of Satellite and Earth System Model Estimates of Global Terrestrial CO2 Fertilization, Nat. Clim. Change, 6, 306–310, https://doi.org/10.1038/nclimate2879, 2016. a
Kurz, W. A., Stinson, G., Rampley, G. J., Dymond, C. C., and Neilson, E. T.: Risk of Natural Disturbances Makes Future Contribution of Canada's Forests to the Global Carbon Cycle Highly Uncertain, P. Natl. Acad. Sci. USA, 105, 1551–1555, https://doi.org/10.1073/pnas.0708133105, 2008. a
Lammertsma, E. I., de Boer, H. J., Dekker, S. C., Dilcher, D. L., Lotter, A. F., and Wagner-Cremer, F.: Global CO2 Rise Leads to Reduced Maximum Stomatal Conductance in Florida Vegetation, P. Natl. Acad. Sci. USA, 108, 4035–4040, https://doi.org/10.1073/pnas.1100371108, 2011. a
Langenbrunner, B., Pritchard, M. S., Kooperman, G. J., and Randerson, J. T.: Why Does Amazon Precipitation Decrease When Tropical Forests Respond to Increasing CO2?, Earths Future, 7, 450–468, https://doi.org/10.1029/2018EF001026, 2019. a
Leakey, A. D. B., Ainsworth, E. A., Bernacchi, C. J., Rogers, A., Long, S. P., and Ort, D. R.: Elevated CO2 Effects on Plant Carbon, Nitrogen, and Water Relations: Six Important Lessons from FACE, J. Exp. Bot., 60, 2859–2876, https://doi.org/10.1093/jxb/erp096, 2009. a
Liu, Y., Liu, R., and Chen, J. M.: Retrospective Retrieval of Long-Term Consistent Global Leaf Area Index (1981–2011) from Combined AVHRR and MODIS Data, J. Geophys. Res.-Biogeo., 117, G04003, https://doi.org/10.1029/2012JG002084, 2012. a
Lucht, W., Prentice, I. C., Myneni, R. B., Sitch, S., Friedlingstein, P., Cramer, W., Bousquet, P., Buermann, W., and Smith, B.: Climatic Control of the High-Latitude Vegetation Greening Trend and Pinatubo Effect, Science, 296, 1687, https://doi.org/10.1126/science.1071828, 2002. a
MacDicken, K., Jonsson, Ö., Piña, L., Maulo, S., Contessa, V., Adikari, Y., Garzuglia, M., Lindquist, E., Reams, G., and D'Annunzio, R.: Global Forest Resources Assessment 2015: How Are the World's Forests Changing?, Food and Agriculture Organization of the United Nations, Rome, 2015. a
Macias Fauria, M. and Johnson, E.: Climate and Wildfires in the North American Boreal Forest, Philos. T. Roy. Soc. B, 363, 2317–2329, https://doi.org/10.1098/RSTB.2007.2202, 2008. a, b
Maeda, E. E., Kim, H., Aragão, L. E. O. C., Famiglietti, J. S., and Oki, T.: Disruption of Hydroecological Equilibrium in Southwest Amazon Mediated by Drought, Geophys. Res. Lett., 42, 7546–7553, https://doi.org/10.1002/2015GL065252, 2015. a
Mahowald, N., Lo, F., Zheng, Y., Harrison, L., Funk, C., Lombardozzi, D., and Goodale, C.: Projections of leaf area index in earth system models, Earth Syst. Dynam., 7, 211–229, https://doi.org/10.5194/esd-7-211-2016, 2016. a, b
Malhi, Y. and Wright, J.: Spatial Patterns and Recent Trends in the Climate of Tropical Rainforest Regions, Philos. T. Roy. Soc. B, 359, 311–329, https://doi.org/10.1098/RSTB.2003.1433, 2004. a
Mao, J., Ribes, A., Yan, B., Shi, X., Thornton, P. E., Séférian, R., Ciais, P., Myneni, R. B., Douville, H., Piao, S., Zhu, Z., Dickinson, R. E., Dai, Y., Ricciuto, D. M., Jin, M., Hoffman, F. M., Wang, B., Huang, M., and Lian, X.: Human-Induced Greening of the Northern Extratropical Land Surface, Nat. Clim. Change, 6, 959–963, https://doi.org/10.1038/nclimate3056, 2016. a, b
Marengo, J. A., Nobre, C. A., Tomasella, J., Oyama, M. D., Sampaio de Oliveira, G., de Oliveira, R., Camargo, H., Alves, L. M., and Brown, I. F.: The Drought of Amazonia in 2005, J. Climate, 21, 495–516, https://doi.org/10.1175/2007JCLI1600.1, 2008. a
Marengo, J. A., Tomasella, J., Alves, L. M., Soares, W. R., and Rodriguez, D. A.: The Drought of 2010 in the Context of Historical Droughts in the Amazon Region, Geophys. Res. Lett., 38, L12703, https://doi.org/10.1029/2011GL047436, 2011. a
Marotzke, J.: Quantifying the Irreducible Uncertainty in Near-term Climate Projections, WIREs Clim. Change, 10, e563, https://doi.org/10.1002/wcc.563, 2019. a, b
Marotzke, J., Jakob, C., Bony, S., Dirmeyer, P. A., O'Gorman, P. A., Hawkins, E., Perkins-Kirkpatrick, S., Quéré, C. L., Nowicki, S., Paulavets, K., Seneviratne, S. I., Stevens, B., and Tuma, M.: Climate Research Must Sharpen Its View, Nat. Clim. Change, 7, 89–91, https://doi.org/10.1038/nclimate3206, 2017. a
Mastrandrea, M. D., Mach, K. J., Plattner, G.-K., Edenhofer, O., Stocker, T. F., Field, C. B., Ebi, K. L., and Matschoss, P. R.: The IPCC AR5 Guidance Note on Consistent Treatment of Uncertainties: A Common Approach across the Working Groups, Climatic Change, 108, 675, https://doi.org/10.1007/S10584-011-0178-6, 2011. a
Mauritsen, T., Bader, J., Becker, T., Behrens, J., Bittner, M., Brokopf, R., Brovkin, V., Claussen, M., Crueger, T., Esch, M., Fast, I., Fiedler, S., Fläschner, D., Gayler, V., Giorgetta, M., Goll, D. S., Haak, H., Hagemann, S., Hedemann, C., Hohenegger, C., Ilyina, T., Jahns, T., Jimenéz-de-la Cuesta, D., Jungclaus, J., Kleinen, T., Kloster, S., Kracher, D., Kinne, S., Kleberg, D., Lasslop, G., Kornblueh, L., Marotzke, J., Matei, D., Meraner, K., Mikolajewicz, U., Modali, K., Möbis, B., Müller, W. A., Nabel, J. E. M. S., Nam, C. C. W., Notz, D., Nyawira, S.-S., Paulsen, H., Peters, K., Pincus, R., Pohlmann, H., Pongratz, J., Popp, M., Raddatz, T. J., Rast, S., Redler, R., Reick, C. H., Rohrschneider, T., Schemann, V., Schmidt, H., Schnur, R., Schulzweida, U., Six, K. D., Stein, L., Stemmler, I., Stevens, B., von Storch, J.-S., Tian, F., Voigt, A., Vrese, P., Wieners, K.-H., Wilkenskjeld, S., Winkler, A., and Roeckner, E.: Developments in the MPI-M Earth System Model Version 1.2 (MPI-ESM1.2) and Its Response to Increasing CO2, J. Adv. Model. Earth Sy., 11, 998–1038, https://doi.org/10.1029/2018MS001400, 2019. a, b, c
Mayaux, P., Pekel, J.-F., Baudouin, D., Donnay, F., Achard, F., Clerici, M., Bodart, C., Brink, A., Nasi, R., and Belward, A.: State and Evolution of the African Rainforests between 1990 and 2010, Philos. T. Roy. Soc. B, 368, 20120300, https://doi.org/10.1098/rstb.2012.0300, 2013. a
McPherson, R. A.: A Review of Vegetation–Atmosphere Interactions and Their Influences on Mesoscale Phenomena, Prog. Phys. Geog., 31, 261–285, https://doi.org/10.1177/0309133307079055, 2007. a
Munday, C. and Washington, R.: Controls on the Diversity in Climate Model Projections of Early Summer Drying over Southern Africa, J. Climate, 32, 3707–3725, https://doi.org/10.1175/JCLI-D-18-0463.1, 2019. a
Murray-Tortarolo, G., Anav, A., Friedlingstein, P., Sitch, S., Piao, S., Zhu, Z., Poulter, B., Zaehle, S., Ahlström, A., Lomas, M., Levis, S., Viovy, N., and Zeng, N.: Evaluation of Land Surface Models in Reproducing Satellite-Derived LAI over the High-Latitude Northern Hemisphere. Part I: Uncoupled DGVMs, Remote Sens.-Basel, 5, 4819–4838, https://doi.org/10.3390/RS5104819, 2013. a
Myneni, R. B., Keeling, C. D., Tucker, C. J., Asrar, G., and Nemani, R. R.: Increased Plant Growth in the Northern High Latitudes from 1981 to 1991, Nature, 386, 698–702, https://doi.org/10.1038/386698a0, 1997. a
Myneni, R. B., Knyazikhin, Y., and Park, T.: MOD15A2H MODIS/Terra Leaf Area Index/FPAR 8-Day L4 Global 500m SIN Grid V006, https://doi.org/10.5067/MODIS/MOD15A2H.006, 2015a. a
Myneni, R. B., Knyazikhin, Y., and Park, T.: MYD15A2H MODIS/Aqua Leaf Area Index/FPAR 8-Day L4 Global 500m SIN Grid V006, , https://doi.org/10.5067/MODIS/MYD15A2H.006, 2015b. a
Nemani, R. R., Keeling, C. D., Hashimoto, H., Jolly, W. M., Piper, S. C., Tucker, C. J., Myneni, R. B., and Running, S. W.: Climate-Driven Increases in Global Terrestrial Net Primary Production from 1982 to 1999, Science, 300, 1560–1563, https://doi.org/10.1126/science.1082750, 2003. a
Park, C.-E., Jeong, S.-J., Joshi, M., Osborn, T. J., Ho, C.-H., Piao, S., Chen, D., Liu, J., Yang, H., Park, H., Kim, B.-M., and Feng, S.: Keeping Global Warming within 1.5 ∘C Constrains Emergence of Aridification, Nat. Clim. Change, 8, 70, https://doi.org/10.1038/S41558-017-0034-4, 2018. a
Park, T., Ganguly, S., Tømmervik, H., Euskirchen, E. S., Høgda, K.-A., Karlsen, S. R., Brovkin, V., Nemani, R. R., and Myneni, R. B.: Changes in Growing Season Duration and Productivity of Northern Vegetation Inferred from Long-Term Remote Sensing Data, Environ. Res. Lett., 11, 084001, https://doi.org/10.1088/1748-9326/11/8/084001, 2016. a, b
Pearl, J.: Causality: Models, Reasoning and Inference, 2nd edn., Cambridge University Press, Cambridge, https://doi.org/10.1017/CBO9780511803161, 2009. a, b, c, d
Pedelty, J., Devadiga, S., Masuoka, E., Brown, M., Pinzon, J., Tucker, C., Vermote, E., Prince, S., Nagol, J., Justice, C., Roy, D., Junchang Ju, Schaaf, C., Jicheng Liu, Privette, J., and Pinheiro, A.: Generating a Long-Term Land Data Record from the AVHRR and MODIS Instruments, in: 2007 IEEE International Geoscience and Remote Sensing Symposium, 1021–1025, https://doi.org/10.1109/IGARSS.2007.4422974, 2007. a, b
Phoenix, G. K. and Bjerke, J. W.: Arctic Browning: Extreme Events and Trends Reversing Arctic Greening, Glob. Change Biol., 22, 2960–2962, https://doi.org/10.1111/GCB.13261, 2016. a
Piao, S., Wang, X., Ciais, P., Zhu, B., Wang, T., and Liu, J.: Changes in Satellite-Derived Vegetation Growth Trend in Temperate and Boreal Eurasia from 1982 to 2006, Glob. Change Biol., 17, 3228–3239, https://doi.org/10.1111/J.1365-2486.2011.02419.X, 2011. a
Piao, S., Nan, H., Huntingford, C., Ciais, P., Friedlingstein, P., Sitch, S., Peng, S., Ahlström, A., Canadell, J. G., Cong, N., Levis, S., Levy, P. E., Liu, L., Lomas, M. R., Mao, J., Myneni, R. B., Peylin, P., Poulter, B., Shi, X., Yin, G., Viovy, N., Wang, T., Wang, X., Zaehle, S., Zeng, N., Zeng, Z., and Chen, A.: Evidence for a Weakening Relationship between Interannual Temperature Variability and Northern Vegetation Activity, Nat. Commun., 5, 5018, https://doi.org/10.1038/ncomms6018, 2014. a
Piao, S., Wang, X., Park, T., Chen, C., Lian, X., He, Y., Bjerke, J. W., Chen, A., Ciais, P., Tømmervik, H., Nemani, R. R., and Myneni, R. B.: Characteristics, Drivers and Feedbacks of Global Greening, Nature Reviews Earth and Environment, 1, 14–27, https://doi.org/10.1038/s43017-019-0001-x, 2019. a, b
Pinzon, J. E. and Tucker, C. J.: A Non-Stationary 1981–2012 AVHRR NDVI3g Time Series, Remote Sens.-Basel, 6, 6929–6960, https://doi.org/10.3390/rs6086929, 2014. a
Poulter, B., Frank, D., Ciais, P., Myneni, R. B., Andela, N., Bi, J., Broquet, G., Canadell, J. G., Chevallier, F., Liu, Y. Y., Running, S. W., Sitch, S., and van der Werf, G. R.: Contribution of Semi-Arid Ecosystems to Interannual Variability of the Global Carbon Cycle, Nature, 509, 600–603, https://doi.org/10.1038/nature13376, 2014. a, b, c
Pugh, T. A. M., Lindeskog, M., Smith, B., Poulter, B., Arneth, A., Haverd, V., and Calle, L.: Role of Forest Regrowth in Global Carbon Sink Dynamics, P. Natl. Acad. Sci. USA, 116, 4382–4387, https://doi.org/10.1073/pnas.1810512116, 2019. a
Le Quéré, C., Andrew, R. M., Friedlingstein, P., Sitch, S., Hauck, J., Pongratz, J., Pickers, P. A., Korsbakken, J. I., Peters, G. P., Canadell, J. G., Arneth, A., Arora, V. K., Barbero, L., Bastos, A., Bopp, L., Chevallier, F., Chini, L. P., Ciais, P., Doney, S. C., Gkritzalis, T., Goll, D. S., Harris, I., Haverd, V., Hoffman, F. M., Hoppema, M., Houghton, R. A., Hurtt, G., Ilyina, T., Jain, A. K., Johannessen, T., Jones, C. D., Kato, E., Keeling, R. F., Goldewijk, K. K., Landschützer, P., Lefèvre, N., Lienert, S., Liu, Z., Lombardozzi, D., Metzl, N., Munro, D. R., Nabel, J. E. M. S., Nakaoka, S., Neill, C., Olsen, A., Ono, T., Patra, P., Peregon, A., Peters, W., Peylin, P., Pfeil, B., Pierrot, D., Poulter, B., Rehder, G., Resplandy, L., Robertson, E., Rocher, M., Rödenbeck, C., Schuster, U., Schwinger, J., Séférian, R., Skjelvan, I., Steinhoff, T., Sutton, A., Tans, P. P., Tian, H., Tilbrook, B., Tubiello, F. N., van der Laan-Luijkx, I. T., van der Werf, G. R., Viovy, N., Walker, A. P., Wiltshire, A. J., Wright, R., Zaehle, S., and Zheng, B.: Global Carbon Budget 2018, Earth Syst. Sci. Data, 10, 2141–2194, https://doi.org/10.5194/essd-10-2141-2018, 2018. a, b, c, d, e, f, g, h
Rodell, M., Houser, P. R., Jambor, U., Gottschalck, J., Mitchell, K., Meng, C.-J., Arsenault, K., Cosgrove, B., Radakovich, J., Bosilovich, M., Entin, J. K., Walker, J. P., Lohmann, D., and Toll, D.: The Global Land Data Assimilation System, B. Am. Meteorol. Soc., 85, 381–394, https://doi.org/10.1175/BAMS-85-3-381, 2004. a
Saatchi, S., Asefi-Najafabady, S., Malhi, Y., Aragão, L. E. O. C., Anderson, L. O., Myneni, R. B., and Nemani, R.: Persistent Effects of a Severe Drought on Amazonian Forest Canopy, P. Natl. Acad. Sci. USA, 110, 565–570, https://doi.org/10.1073/PNAS.1204651110, 2013. a, b
Sachs, L.: Angewandte Statistik, Springer, Berlin, Heidelberg, https://doi.org/10.1007/978-3-662-05746-9, 1997. a
Sage, R. F., Sage, T. L., and Ocarina, F.: Photorespiration and the Evolution of C4 Photosynthesis, Annu. Rev. Plant Biol., 63, 19–47, https://doi.org/10.1146/ANNUREV-ARPLANT-042811-105511, 2012. a, b, c
Seidl, R., Thom, D., Kautz, M., Martin-Benito, D., Peltoniemi, M., Vacchiano, G., Wild, J., Ascoli, D., Petr, M., Honkaniemi, J., Lexer, M. J., Trotsiuk, V., Mairota, P., Svoboda, M., Fabrika, M., Nagel, T. A., and Reyer, C. P. O.: Forest Disturbances under Climate Change, Nat. Clim. Change, 7, 395–402, https://doi.org/10.1038/NCLIMATE3303, 2017. a
Sitch, S., Friedlingstein, P., Gruber, N., Jones, S. D., Murray-Tortarolo, G., Ahlström, A., Doney, S. C., Graven, H., Heinze, C., Huntingford, C., Levis, S., Levy, P. E., Lomas, M., Poulter, B., Viovy, N., Zaehle, S., Zeng, N., Arneth, A., Bonan, G., Bopp, L., Canadell, J. G., Chevallier, F., Ciais, P., Ellis, R., Gloor, M., Peylin, P., Piao, S. L., Le Quéré, C., Smith, B., Zhu, Z., and Myneni, R.: Recent trends and drivers of regional sources and sinks of carbon dioxide, Biogeosciences, 12, 653–679, https://doi.org/10.5194/bg-12-653-2015, 2015. a, b, c, d, e, f
Song, X.-P., Huang, C., Saatchi, S. S., Hansen, M. C., and Townshend, J. R.: Annual Carbon Emissions from Deforestation in the Amazon Basin between 2000 and 2010, PLoS ONE, 10, e0126754, https://doi.org/10.1371/JOURNAL.PONE.0126754, 2015. a
Song, X.-P., Hansen, M. C., Stehman, S. V., Potapov, P. V., Tyukavina, A., Vermote, E. F., and Townshend, J. R.: Global Land Change from 1982 to 2016, Nature, 560, 639–643, https://doi.org/10.1038/s41586-018-0411-9, 2018. a, b
Stibig, H.-J., Achard, F., Carboni, S., Raši, R., and Miettinen, J.: Change in tropical forest cover of Southeast Asia from 1990 to 2010, Biogeosciences, 11, 247–258, https://doi.org/10.5194/bg-11-247-2014, 2014. a
Still, C. J., Berry, J. A., Collatz, G. J., and DeFries, R. S.: Global Distribution of C3 and C4 Vegetation: Carbon Cycle Implications, Global Biogeochem. Cy., 17, 6-1–6-14, https://doi.org/10.1029/2001GB001807, 2003. a, b
Thomas, R. T., Prentice, I. C., Graven, H., Ciais, P., Fisher, J. B., Hayes, D. J., Huang, M., Huntzinger, D. N., Ito, A., Jain, A., Mao, J., Michalak, A. M., Peng, S., Poulter, B., Ricciuto, D. M., Shi, X., Schwalm, C., Tian, H., and Zeng, N.: Increased Light-Use Efficiency in Northern Terrestrial Ecosystems Indicated by CO2 and Greening Observations, Geophys. Res. Lett., 43, 11339–11349, https://doi.org/10.1002/2016GL070710, 2016. a
Tyukavina, A., Hansen, M. C., Potapov, P., Parker, D., Okpa, C., Stehman, S. V., Kommareddy, I., and Turubanova, S.: Congo Basin Forest Loss Dominated by Increasing Smallholder Clearing, Science Advances, 4, eaat2993, https://doi.org/10.1126/SCIADV.AAT2993, 2018. a
Ukkola, A. M., Prentice, I. C., Keenan, T. F., van Dijk, A. I. J. M., Viney, N. R., Myneni, R. B., and Bi, J.: Reduced Streamflow in Water-Stressed Climates Consistent with CO2 Effects on Vegetation, Nat. Clim. Change, 6, 75–78, https://doi.org/10.1038/nclimate2831, 2016. a, b, c, d, e
Verbyla, D.: Browning Boreal Forests of Western North America, Environ. Res. Lett., 6, 041003, https://doi.org/10.1088/1748-9326/6/4/041003, 2011. a, b, c
Walker, A. P., Kauwe, M. G. D., Bastos, A., Belmecheri, S., Georgiou, K., Keeling, R. F., McMahon, S. M., Medlyn, B. E., Moore, D. J. P., Norby, R. J., Zaehle, S., Anderson-Teixeira, K. J., Battipaglia, G., Brienen, R. J. W., Cabugao, K. G., Cailleret, M., Campbell, E., Canadell, J. G., Ciais, P., Craig, M. E., Ellsworth, D. S., Farquhar, G. D., Fatichi, S., Fisher, J. B., Frank, D. C., Graven, H., Gu, L., Haverd, V., Heilman, K., Heimann, M., Hungate, B. A., Iversen, C. M., Joos, F., Jiang, M., Keenan, T. F., Knauer, J., Körner, C., Leshyk, V. O., Leuzinger, S., Liu, Y., MacBean, N., Malhi, Y., McVicar, T. R., Penuelas, J., Pongratz, J., Powell, A. S., Riutta, T., Sabot, M. E. B., Schleucher, J., Sitch, S., Smith, W. K., Sulman, B., Taylor, B., Terrer, C., Torn, M. S., Treseder, K. K., Trugman, A. T., Trumbore, S. E., van Mantgem, P. J., Voelker, S. L., Whelan, M. E., and Zuidema, P. A.: Integrating the Evidence for a Terrestrial Carbon Sink Caused by Increasing Atmospheric CO2, New Phytol., 229, 2413–2445, https://doi.org/10.1111/nph.16866, 2021. a
Wang, S., Zhang, Y., Ju, W., Chen, J. M., Ciais, P., Cescatti, A., Sardans, J., Janssens, I. A., Wu, M., Berry, J. A., Campbell, E., Fernández-Martínez, M., Alkama, R., Sitch, S., Friedlingstein, P., Smith, W. K., Yuan, W., He, W., Lombardozzi, D., Kautz, M., Zhu, D., Lienert, S., Kato, E., Poulter, B., Sanders, T. G. M., Krüger, I., Wang, R., Zeng, N., Tian, H., Vuichard, N., Jain, A. K., Wiltshire, A., Haverd, V., Goll, D. S., and Peñuelas, J.: Recent Global Decline of CO2 Fertilization Effects on Vegetation Photosynthesis, Science, 370, 1295–1300, https://doi.org/10.1126/science.abb7772, 2020. a, b
Weber, T., Haensler, A., Rechid, D., Pfeifer, S., Eggert, B., and Jacob, D.: Analyzing Regional Climate Change in Africa in a 1.5, 2, and 3 ∘C Global Warming World, Earths Future, 6, 643–655, https://doi.org/10.1002/2017EF000714, 2018. a
Williamson, G. B., Laurance, W. F., Oliveira, A. A., Delamônica, P., Gascon, C., Lovejoy, T. E., and Pohl, L.: Amazonian Tree Mortality during the 1997 El Niño Drought, Conserv. Biol., 14, 1538–1542, https://doi.org/10.1046/J.1523-1739.2000.99298.X, 2000. a
Winkler, A. J., Myneni, R. B., Alexandrov, G. A., and Brovkin, V.: Earth System Models Underestimate Carbon Fixation by Plants in the High Latitudes, Nat. Commun., 10, 885, https://doi.org/10.1038/S41467-019-08633-Z, 2019a. a, b, c, d, e
Winkler, A. J., Myneni, R. B., and Brovkin, V.: Investigating the applicability of emergent constraints, Earth Syst. Dynam., 10, 501–523, https://doi.org/10.5194/esd-10-501-2019, 2019b. a, b, c
Xiao, Z., Liang, S., Wang, J., Chen, P., Yin, X., Zhang, L., and Song, J.: Use of General Regression Neural Networks for Generating the GLASS Leaf Area Index Product From Time-Series MODIS Surface Reflectance, IEEE T. Geosci. Remote, 52, 209–223, https://doi.org/10.1109/TGRS.2013.2237780, 2014. a, b
Xiao, Z., Liang, S., and Jiang, B.: Evaluation of Four Long Time-Series Global Leaf Area Index Products, Agr. Forest Meteorol., 246, 218–230, https://doi.org/10.1016/j.agrformet.2017.06.016, 2017. a
Xu, L., Samanta, A., Costa, M. H., Ganguly, S., Nemani, R. R., and Myneni, R. B.: Widespread Decline in Greenness of Amazonian Vegetation Due to the 2010 Drought, Geophys. Res. Lett., 38, L07402, https://doi.org/10.1029/2011GL046824, 2011. a, b
Yang, Y., Saatchi, S. S., Xu, L., Yu, Y., Choi, S., Phillips, N., Kennedy, R., Keller, M., Knyazikhin, Y., and Myneni, R. B.: Post-Drought Decline of the Amazon Carbon Sink, Nat. Commun., 9, 3172, https://doi.org/10.1038/S41467-018-05668-6, 2018. a
Yuan, W., Zheng, Y., Piao, S., Ciais, P., Lombardozzi, D., Wang, Y., Ryu, Y., Chen, G., Dong, W., Hu, Z., Jain, A. K., Jiang, C., Kato, E., Li, S., Lienert, S., Liu, S., Nabel, J. E. M. S., Qin, Z., Quine, T., Sitch, S., Smith, W. K., Wang, F., Wu, C., Xiao, Z., and Yang, S.: Increased Atmospheric Vapor Pressure Deficit Reduces Global Vegetation Growth, Science Advances, 5, eaax1396, https://doi.org/10.1126/sciadv.aax1396, 2019. a, b, c
Zhou, L., Tian, Y., Myneni, R. B., Ciais, P., Saatchi, S., Liu, Y. Y., Piao, S., Chen, H., Vermote, E. F., Song, C., and Hwang, T.: Widespread Decline of Congo Rainforest Greenness in the Past Decade, Nature, 509, 86–90, https://doi.org/10.1038/nature13265, 2014. a, b, c, d
Zhu, Z., Bi, J., Pan, Y., Ganguly, S., Anav, A., Xu, L., Samanta, A., Piao, S., Nemani, R. R., and Myneni, R. B.: Global Data Sets of Vegetation Leaf Area Index (LAI)3g and Fraction of Photosynthetically Active Radiation (FPAR)3g Derived from Global Inventory Modeling and Mapping Studies (GIMMS) Normalized Difference Vegetation Index (NDVI3g) for the Period 1981 to 2011, Remote Sens.-Basel, 5, 927–948, https://doi.org/10.3390/rs5020927, 2013. a, b, c, d
Zhu, Z., Piao, S., Myneni, R. B., Huang, M., Zeng, Z., Canadell, J. G., Ciais, P., Sitch, S., Friedlingstein, P., Arneth, A., Cao, C., Cheng, L., Kato, E., Koven, C., Li, Y., Lian, X., Liu, Y., Liu, R., Mao, J., Pan, Y., Peng, S., Peñuelas, J., Poulter, B., Pugh, T. A. M., Stocker, B. D., Viovy, N., Wang, X., Wang, Y., Xiao, Z., Yang, H., Zaehle, S., and Zeng, N.: Greening of the Earth and Its Drivers, Nat. Clim. Change, 6, 791–795, https://doi.org/10.1038/nclimate3004, 2016. a, b, c, d, e, f, g, h, i