the Creative Commons Attribution 4.0 License.
the Creative Commons Attribution 4.0 License.
 | 27 Sep 2021
Spatial and temporal variability of pCO2 and CO2 emissions from the Dong River in south China
Mingyang Tian
Kaimin Shih
Chun Ngai Chan
Xiankun Yang
CO2 efflux at the water–air interface is an essential component of the riverine carbon cycle. However, the lack of spatially resolved CO2 emission measurements prohibits reliable estimation of the global riverine CO2 emissions. By deploying floating chambers, seasonal changes in river water CO2 partial pressure (pCO2) and CO2 emissions from the Dong River in south China were investigated. Spatial and temporal patterns of pCO2 were mainly affected by terrestrial carbon inputs (i.e., organic and inorganic carbon) and in-stream metabolism, both of which varied due to different land cover, catchment topography, and seasonality of precipitation and temperature. Temperature-normalized gas transfer velocity (k600) in small rivers was 8.29 ± 11.29 and 4.90 ± 3.82 m d−1 for the wet season and dry season, respectively, which was nearly 70 % higher than that of large rivers (3.90 ± 5.55 m d−1 during the wet season and 2.25 ± 1.61 m d−1 during the dry season). A significant correlation was observed between k600 and flow velocity but not wind speed regardless of river size. Most of the surveyed rivers were a net CO2 source while exhibiting substantial seasonal variations. The mean CO2 flux was 300.1 and 264.2 mmol m−2 d−1 during the wet season for large and small rivers, respectively, 2-fold larger than that during the dry season. However, no significant difference in CO2 flux was observed between small and large rivers. The absence of commonly observed higher CO2 fluxes in small rivers could be associated with the depletion effect caused by abundant and consistent precipitation in this subtropical monsoon catchment.
- Article
(4498 KB) - Full-text XML
-
Supplement
(247 KB) - BibTeX
- EndNote


River networks act as a processor that transfers and emits the carbon entering the water, rather than just a passive pipe that transports carbon from the terrestrial ecosystem to the ocean (Cole et al., 2007; Battin et al., 2009; Drake et al., 2018). CO2 emissions at the water–air interface are an essential component of the riverine carbon cycle. CO2 emitted from inland waters to the atmosphere reaches up to 2.9 Pg C yr−1, surpassing that transported from land to ocean through rivers (Sawakuchi et al., 2017; Drake et al., 2018). Understanding the role that rivers play in the global carbon cycle is still hindered by uncertainty on the flux estimate of CO2 emissions from rivers (Cole et al., 2007; Raymond et al., 2013; Sawakuchi et al., 2017; Drake et al., 2018). Riverine carbon emissions have significant temporal and spatial variations, making it challenging to accurately quantify carbon emissions. In addition, watershed geomorphology, hydrological conditions, climate, and other environmental factors can affect the CO2 efflux in rivers (Alin et al., 2011; Abril et al., 2014; Almeida et al., 2017; Ran et al., 2017a; Borges et al., 2018). Thus, there are substantial differences in CO2 efflux among rivers in different climate regions or the same river but between different seasons (Denfeld et al., 2013; Rasera et al., 2013). An enhanced understanding of the temporal and spatial characteristics of the water–air CO2 flux will facilitate a more robust estimate. However, global riverine CO2 emission estimates were largely based on data disproportionately focusing on temperate and boreal regions, including North America and Europe (Raymond et al., 2013; Lauerwald et al., 2015; Drake et al., 2018). More studies are required in other data-poor regions to achieve a more accurate estimate.
Rivers in tropical and subtropical regions of East Asia and Southeast Asia are among those underrepresented regions that need more attention since they are essential participants in riverine carbon transport (Ran et al., 2015, 2017b; Drake et al., 2018). The high temperature in this region facilitates a high net primary productivity in the terrestrial ecosystem and intense biochemical activities; both contribute to the carbon input dynamic from soil to rivers (Li et al., 2018). Meanwhile, rivers in this region are under the heavy influence of monsoon climate, and riverine CO2 emissions vary significantly among seasons due to the changes in temperature and precipitation. In addition, different rivers in this region may have contrasting trends in CO2 dynamic due to different underlying controlling factors. Some rivers have the highest CO2 efflux in the wet season (Li et al., 2013; Le et al., 2018; Ni et al., 2019), while others have the highest CO2 efflux in the dry season (Luo et al., 2019), suggesting that an increase in the wet season runoff can have two distinct consequences. On the one hand, recent studies have indicated that the increased runoff could enhance external carbon inputs and thus CO2 emissions (Hope et al., 2004; Johnson et al., 2008). On the other hand, the increased runoff may result in a dilution of the dissolved CO2 in rivers and accordingly a reduction in CO2 emissions (Ran et al., 2017b; Li et al., 2018). Therefore, it is important to investigate the underlying processes that determine the diverse responses of CO2 emissions to the monsoon climate.
The Dong River (DJR), located in subtropical south China, is one of the three tributaries of the Pearl River. Previous studies on riverine carbon transport and emissions in the Pearl River system mainly focused on the Xi River, which is characterized by widely distributed carbonate rocks, and the estuary area of the Pearl River delta (Yao et al., 2007; Zhang et al., 2015, 2019, 2021). Although some studies on chemical weathering and dissolved inorganic carbon (DIC) transport in the Dong River basin (DJRB) have been conducted (Tao et al., 2011; Fu et al., 2014), there is still a lack of understanding of the characteristics of catchment-wide CO2 emissions from the DJRB. Furthermore, a predominantly hilly landscape combined with abundant precipitation favors the formation of a great number of small rivers in the DJRB (Ding et al., 2015). However, current estimates of basin-wide CO2 emissions from the river network are mostly based on the data from large rivers, and small rivers are heavily underrepresented (Raymond et al., 2013; Drake et al., 2018). Because the controlling factors and the input of carbon could be significantly different between large and small rivers (Johnson et al., 2008; Dinsmore et al., 2013; Hotchkiss et al., 2015; Marx et al., 2017), a more comprehensive quantification of CO2 emissions from small headwater streams is necessary. Therefore, studies on the characteristics of riverine CO2 emissions from the DJRB should be conducted among river size spectrums, and the impact of monsoon needs to be considered.
By using directly measured river water CO2 partial pressure (pCO2) and CO2 emission data from the DJRB and in conjunction with hydrological and physicochemical data, the objectives of this study were to (1) investigate the spatial and temporal pattern of pCO2 and CO2 emissions along stream size spectrum and (2) examine the differences in hydrological and physicochemical controls on pCO2 and CO2 emissions between small headwater streams and large rivers. The results of this study will shed light on the underlying controls of the spatial and temporal distribution of riverine pCO2 and support a refined estimate of regional and global carbon budgets.
2.1 Site description
The DJR in south China is one of the three major tributaries of the Pearl River system (Fig. 1). It has a 562 km long mainstem channel and a drainage area of 35 340 km2 (Chen et al., 2011). Due to its subtropical monsoon climate, precipitation in the DJRB exhibits significant seasonal variability (Fig. 2a). The multi-annual average precipitation is about 1800 mm, 80 % of which is concentrated during the wet season from April to September. The Boluo Hydrological Gauge is the lowermost gauge of the Dong River mainstem channel, controlling a drainage area of ∼ 23 000 km2. The multi-annual average water discharge at Boluo Hydrological Gauge is 23.7 km3 (Zhang et al., 2008). About 80 %–90 % of the discharge is transported during the wet season (Fig. 2b). The landscape is characterized by plains and hills, accounting for 87.3 % of the river basin area (Ding et al., 2015), and the dominant land use of the catchment is highly diverse evergreen forests of broadleaved and needleleaf species (Ran et al., 2012; Chen et al., 2013). The impacts of human activities on land use vary among three regions in the DJRB. Urban expansion and agricultural activities have substantially altered the land use in the lower and middle Dong River basin (LDJRB and MDJRB), respectively, while the upper Dong River basin (UDJRB) is less affected by human activities (Fig. 1).

Figure 1Sample sites and land cover in the DJRB. Yearly average pCO2 at each sample site was displayed. Based on the land cover dataset FROM-GLC10 (http://data.ess.tsinghua.edu.cn, last access: 17 September 2021).
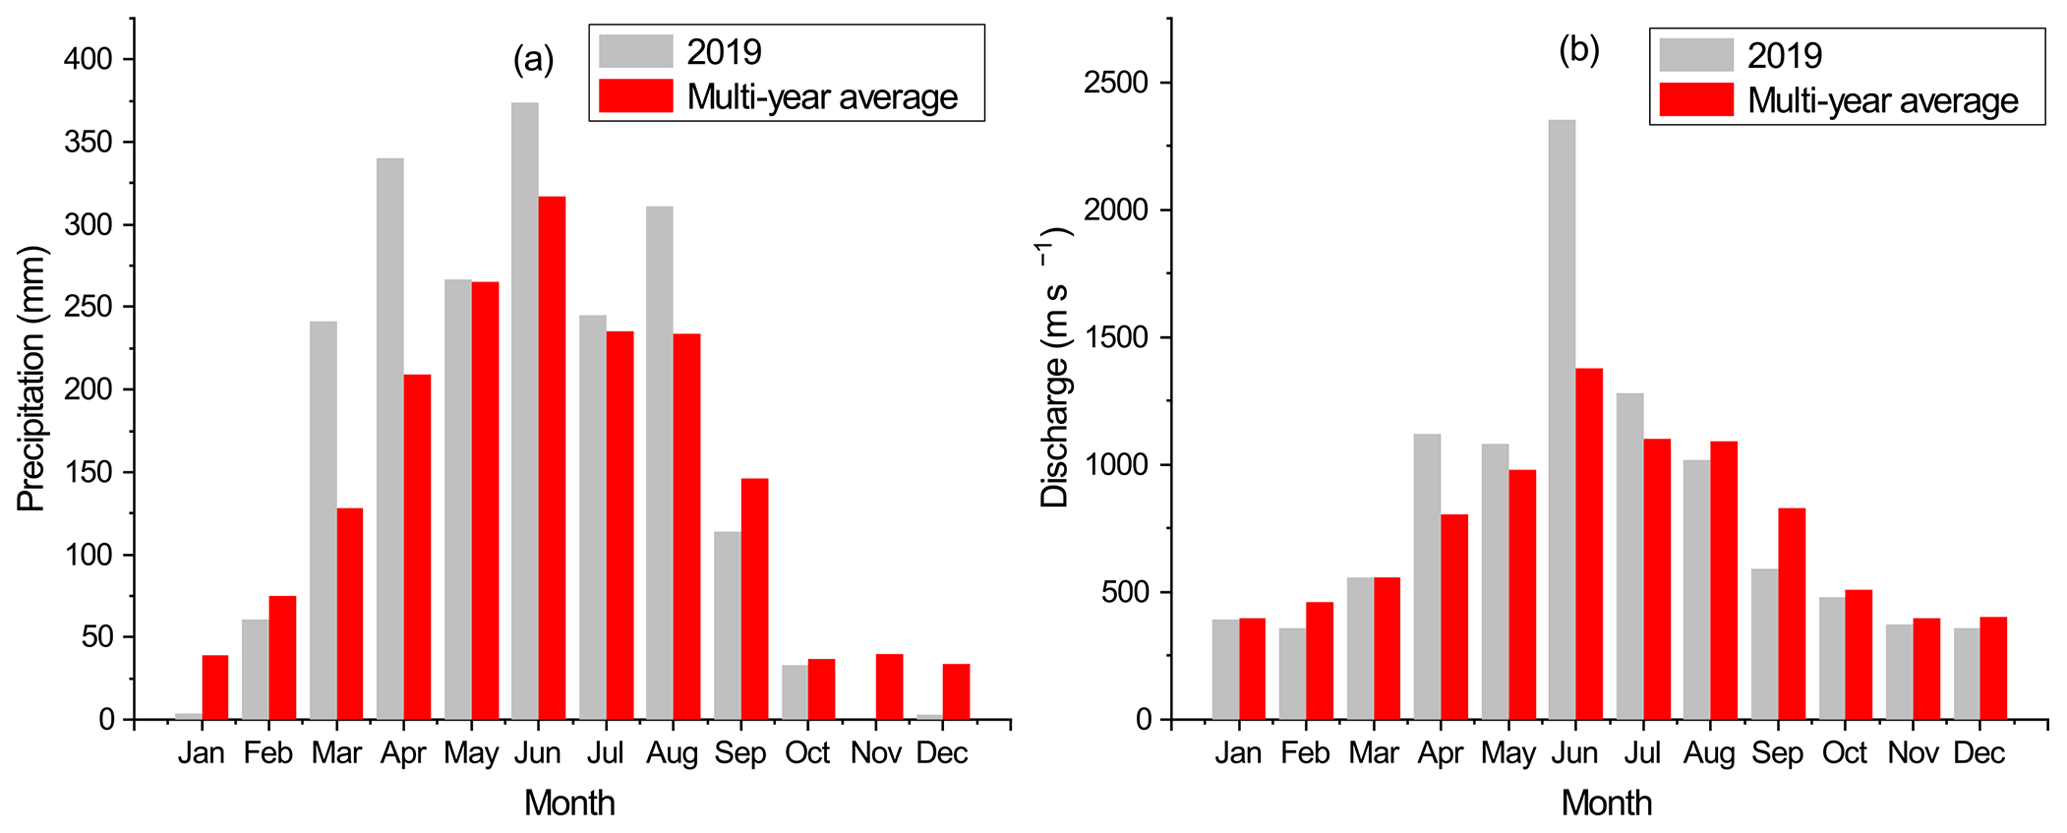
Figure 2Monthly variations in (a) precipitation of the DJRB and (b) water discharge at the Boluo hydrological gauge, based on data provided by the Hydrological Bureau of Guangdong Province.
2.2 Field measurements and analyses
In total, there were 43 sampling sites spanning seven Strahler stream orders. Fourth- to seventh-order streams were mainstem and major tributaries, while first- to third-order streams were small tributaries. River widths were measured by a laser rangefinder. Sampled rivers were categorized, according to their stream orders, into small rivers (first- to third-order streams, SR) and large rivers (fourth- to seventh-order streams, LR). The small rivers had an average width of 15.4 ± 10.2 m, while large rivers have an average width of 180.3 ± 159.3 m (Table S1). Those sampling sites were widely distributed in the mainstem and nine major sub-catchments among the three regions with different topographic features and land cover (Fig. 1). In order to investigate CO2 emissions during different hydrological conditions, we performed five fieldwork campaigns from December 2018 to October 2019, including three in the wet season (early wet season – late April, middle wet season - early July, and late wet season – late August) and two in the dry season (middle dry season – December 2018 to early January 2019 and early dry season – late October 2019). Sample sites were measured in the daytime over 2 weeks for each field trip. Three campaigns in the wet season allowed each sample site to be measured under different hydrological conditions. As for the dry season, the hydrological condition was relatively stable due to low precipitation. However, field measurements conducted during the daytime could lead to an underestimate in pCO2 and CO2 emissions (Reiman and Xu, 2019a). Nocturnal CO2 emission rates in rivers could be 27 % greater than the daytime rates (Gómez-Gener et al., 2021). During the field trips, water temperature, pH, and dissolved oxygen (DO) were measured with a portable multiparameter probe (Multi 3430, WTW GmbH, Germany). The pH probe was calibrated before each field trip with standard pH buffers (4.01 and 7.00). Measurements were conducted 10 cm below the water surface. To evaluate the contribution of metabolism on DO changes, ΔCO2 and ΔO2 were calculated as described by Stets et al. (2017) using
and
where CO2w and O2w are measured concentrations of CO2 and O2 in a water sample, while CO2a and O2a are the equilibrium CO2 and O2 concentrations (µmol L−1).
Flow velocity was determined by using a global water flow probe FP111 with a precision of 0.1 m s−1, while wind speed at 1.5 m above the water surface was measured with a Kestrel 2500 handheld anemometer and normalized to a height of 10 m (U10) using the equation from Alin et al. (2011). As the flow velocity was measured near the riverbanks, an underestimation of the flow velocity is possible. Flow velocity measured near the riverbanks is only about 40 % of the maximum flow velocity at the cross section (Moramarco et al., 2004; Le Coz et al., 2008). We also collected water for analyzing total alkalinity (TA) and dissolved organic carbon (DOC). Firstly, 100 mL of water samples was filtered through a pre-combusted glass fiber filter (pore size: 0.47 µm, Whatman GF/F, GE Healthcare Life Sciences, USA). Then, 50 mL of water used for TA analysis was titrated with 0.1 mol L−1 HCl on the same day of sampling. The remaining 50 mL of water for DOC analysis was poisoned with concentrated H2SO4 to pH < 2 and preserved in a cooler with ice bags before analysis. DOC was determined by the high-temperature combustion method using a TOC analyzer (Elementar Analysensysteme GmbH, Langenselbold, Germany) that has a precision better than 3 %.
2.3 Calculation of pCO2 and CO2 emission flux
The surface water pCO2 was determined using the headspace equilibrium method, which could avoid the possible overestimation of using TA and pH to calculate pCO2 in rivers with a relatively low pH (Abril et al., 2015). We used a 625 mL reagent bottle to collect 400 mL of water from ∼ 10 cm below the surface, leaving 225 mL of space filled with ambient air as headspace. The bottle was then immediately capped and shaken vigorously for at least 1 min to achieve an equilibrium between the water and the CO2 in the headspace (Hope et al., 1994). Then, the bottle was connected to the calibrated Li-850 CO2 H2O gas analyzer (Li-Cor, Inc, USA), and the equilibrated gas in this closed loop was measured. The measurements at each site were repeated twice, and the average was then calculated. The variation between the two measurements was less than 5 %, and the accuracy of Li-850 is within 1.5 % of the reading. The ambient air pCO2 () was measured before the headspace measurements and the chamber deployments. The value varied between 380 and 450 µatm. The original surface water pCO2 () was finally calculated by using solubility constants (K0) for CO2 from Weiss (1974), carbonate constants (K1, K2) from (Millero et al., 2006), and the volume of the flask, headspace, and residual system (line and gas analyzer) (Dickson et al., 2007; Ran et al., 2017a; Tian et al., 2019) using
where Vh, Vr, and Vw, are the headspace volume, residence system volume, and water volume, respectively. R is the universal gas constant (8.314 J mol−1 K−1), T is the water temperature in kelvin (K), and [H+] is the concentration of hydrogen ions. and are pCO2 before and after the headspace equilibration, respectively. is the pCO2 of the mixed gas in the headspace and residual system during the measurement. The was taken as the pCO2 in ambient air before the measurement, while was calculated using
To measure Vr, we filled the headspace with ambient air, which had a known pCO2, and measured the pCO2 in the closed loop. Vr was then estimated according to Eq. (3). A comparative analysis of the syringe and bottle headspace method has been conducted to evaluate the accuracy of the headspace extraction method used in this study (Table S2 and Fig. S2). Overall, our method could cause a 1 %–5 % underestimation in pCO2.
To reduce the artificial turbulence induced by anchored chambers, we used a small unmanned boat in the measurement, which allowed us to deploy drifting chambers freely in rivers deeper than 0.2 m and with a high flow velocity up to 2 m s−1. During the deployment, CO2 emissions were determined using a circular 8.5 L floating chamber with a water surface area of 0.113 m2. The chamber walls were lowered about 2 cm into the water and mounted with a pneumatic rubber tire. The chamber was connected to an infrared Li-850 CO2 H2O gas analyzer (Li-Cor, Inc, USA) in a floating storage box through polyurethane tubes for CO2 analysis. An unmanned boat connected to both the chamber and box with ropes was used to deploy them near the central line of the river. Once the entire setup reached its designated location, the readings on the Li-850 were recorded at 0.5 s intervals. During the entire measurement process, the box drifted freely with the current. The Li-850 was calibrated by the manufacturer before field trips. The rate of CO2 efflux (FCO2 in mmol m−2 d−1) was calculated from the observed change rate of the mole fraction S (ppm s−1) using
where S is the slope of CO2 accumulation in the chamber (µatm s−1), V is chamber gas volume (m3), A is the chamber area (m2), s d−1 is the conversion factor from seconds to days, and t2 is a conversion factor from mole fraction (ppm) to concentration (mmol m−3) at in situ temperature (T in K) and atmospheric pressure (p in Pa), according to the ideal gas law:
The gas transfer velocity (k) was calculated from FCO2 and pCO2 in both water and ambient air using
To compare gas transfer velocity values among different sites, k was standardized to k600 as described by Alin et al. (2011) using
where Sc is the Schmidt number, which is dependent on temperature (T) in degrees Celsius (Wanninkhof, 1992):
In total, 196 chamber measurements were conducted. In 19 out of 215 sample sites, the drifting chamber was unable to deploy due to shallow water or high flow velocity. Meanwhile, 8 out of 196 k600 data with the air–water pCO2 gradient less than 200 µatm were also excluded, as the error in these calculations could be considerable (Borges et al., 2004).
3.1 Physical and biochemical characteristics
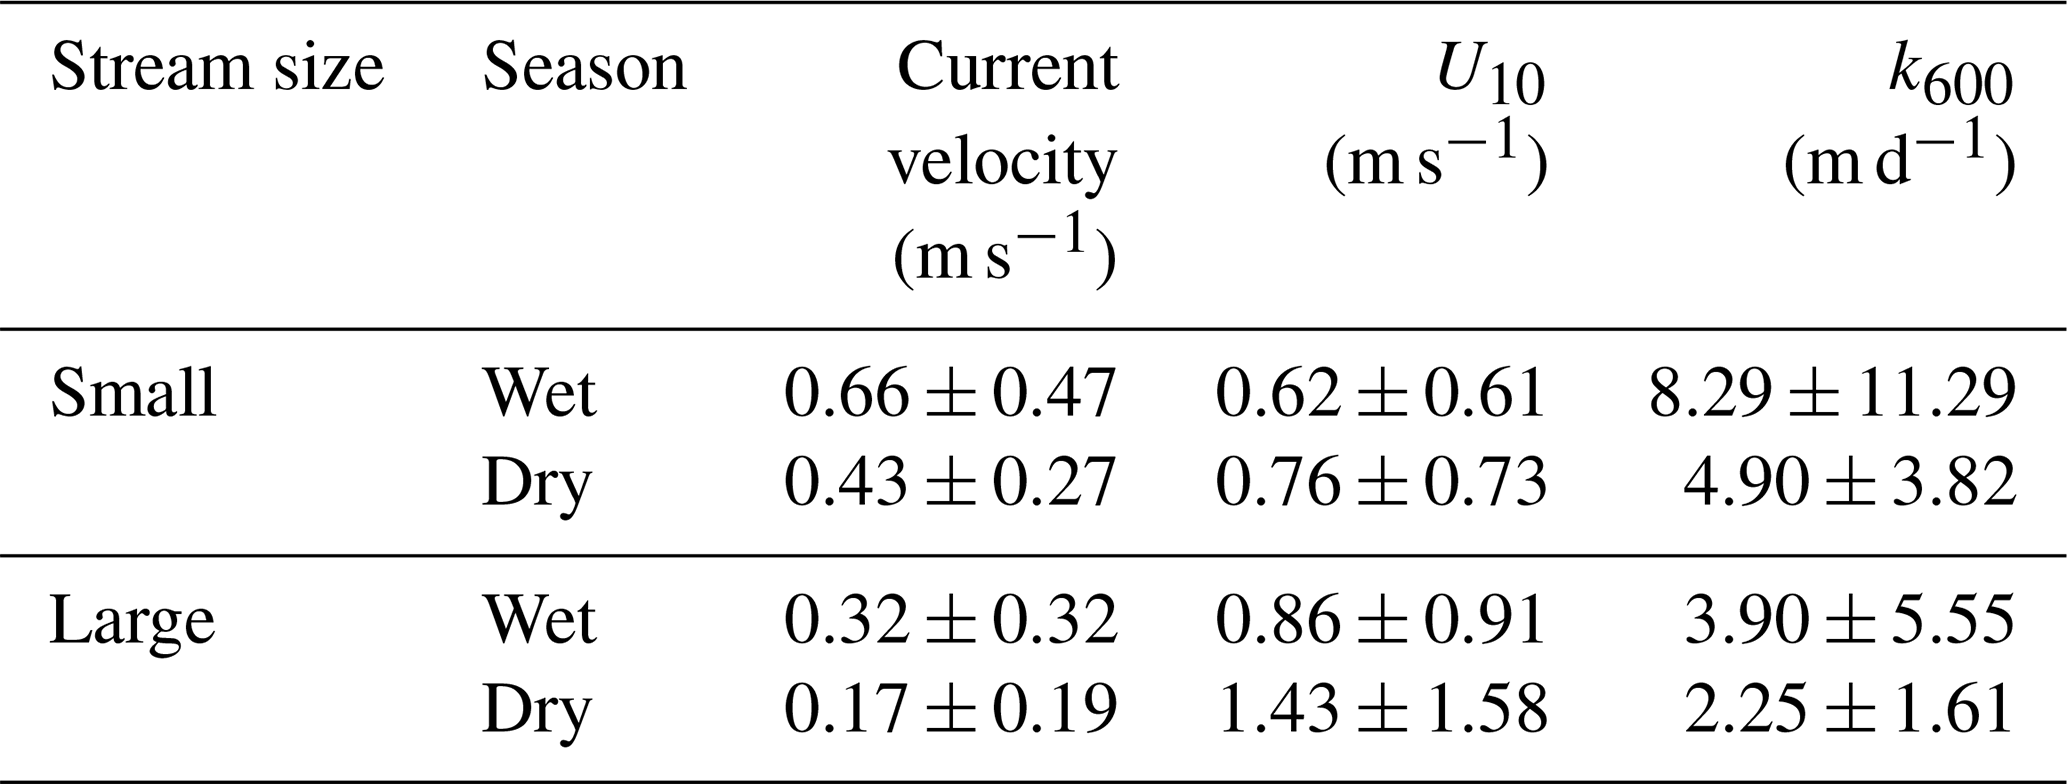
The Dong River was characterized by substantial seasonal variations in hydrologic regimes (Fig. 2). Stream width in the wet season was 17.0 % and 5.6 % larger than that in the dry season for small and large rivers, respectively (Table S1). The discharge ranged 4 orders of magnitude from 0.1 m3 s−1 in the small headwater streams during the dry season to 6690 m3 s−1 in the main stem during the wet season (Fig. S1). Water temperature was higher in July and August (21.4–33 and 21–33.4∘, respectively) than that in January (8.1–22.2∘), April (16.5–26.9∘), and October (17.4–29.7∘). pH varied from 6.38 to 8.14, with a mean of 7.08. There was no significant (independent sample t test, p>0.05) change in pH between wet and dry seasons. U10 based on all stream sites was higher in large rivers (0.86 ± 0.91 and 1.43 ± 1.58 m s−1 in wet and dry seasons, respectively) than in small rivers (0.62 ± 0.61 and 0.76 ± 0.73 m s−1 in wet and dry seasons, respectively).
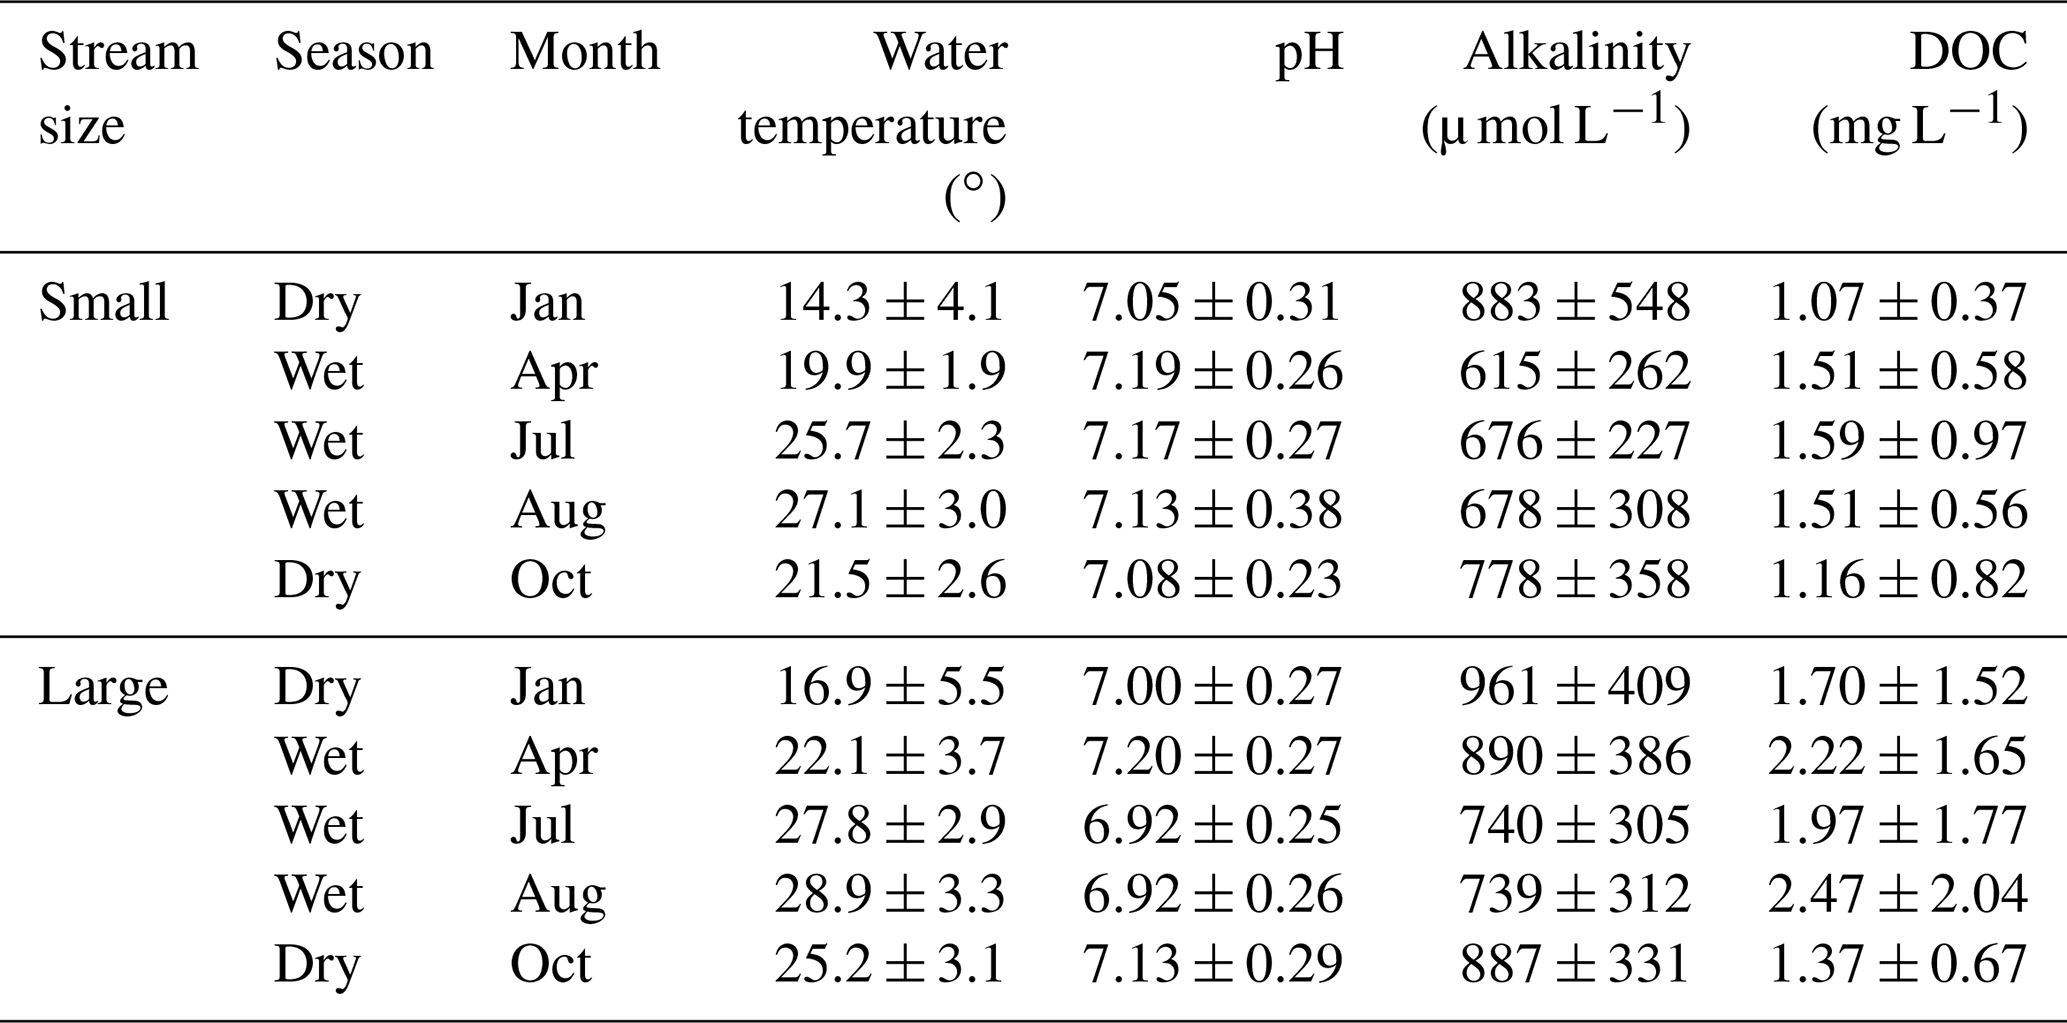
The streams presented low alkalinity ranging from 225 to 3025 µmol L−1. Overall, lower alkalinity was observed in the wet season than in the dry season (Table 1). In small rivers, the alkalinity in the wet season (656 ± 265 µmol L−1) was 21.1 % lower than that in the dry season (831 ± 460 µmol L−1), and the lowest alkalinity was observed in April (615 ± 262 µmol L−1), which was 30.4 % lower than in January (883 ± 548 µmol L−1). Similarly, the alkalinity in large rivers was 790 ± 402 µmol L−1 in the wet season, 14.5 % lower than 924 ± 411 µmol L−1 in the dry season. However, the lowest value of alkalinity in large rivers was observed in August (739 ± 312 µmol L−1) instead of April in small rivers.
Spatial and seasonal changes in DOC concentration were also observed in the surveyed rivers (Table 1). DOC concentration in large rivers (1.94 ± 1.52 mg L−1) was 41.6 % higher than that in small rivers (1.37 ± 0.72 mg L−1). Meanwhile, DOC concentrations in the wet season were 2.22 ± 1.82 and 1.54 ± 0.72 mg L−1 for large and small rivers, respectively, which were 45.1 % and 54 % higher than that in the dry season (1.53 ± 0.72 and 1.11 ± 0.63 mg L−1 for large and small rivers, respectively).
Table 1Seasonal variations in physical and biochemical characteristics, expressed as mean ± SD.
3.2 Spatial and seasonal variations in pCO2
The pCO2 ranged from 15 to 6323 µatm with a catchment-wide average of 1748 µatm and showed considerable temporal and spatial variations throughout the sampling period. There was an increasing trend of observed pCO2 from small to large rivers (Fig. 3a). On average, the pCO2 values were 856 ± 444, 1481 ± 979, 1354 ± 753, 2332 ± 1330, 2142 ± 1016, 2271 ± 1121, and 2168 ± 1046 µatm for streams from the first to seventh orders, respectively. The stronger increase in pCO2 occurred between third- and fourth-order streams (from 1354 ± 753 to 2332 ± 1330 µatm, Fig. 3a). Overall, pCO2 in large rivers (2250 ± 1178 µatm) was 76.3 % higher than that in small rivers (1276 ± 796 µatm). Meanwhile, there was also an increasing trend of pCO2 from rivers in the UDJRB compared with those in the LDJRB. The pCO2 values were 2105 ± 959 and 2487 ± 1276 µatm for small and large rivers, respectively, in the LDJRB, which were 146.7 % and 70 % higher than that in the UDJRB, respectively (Fig. 3b).
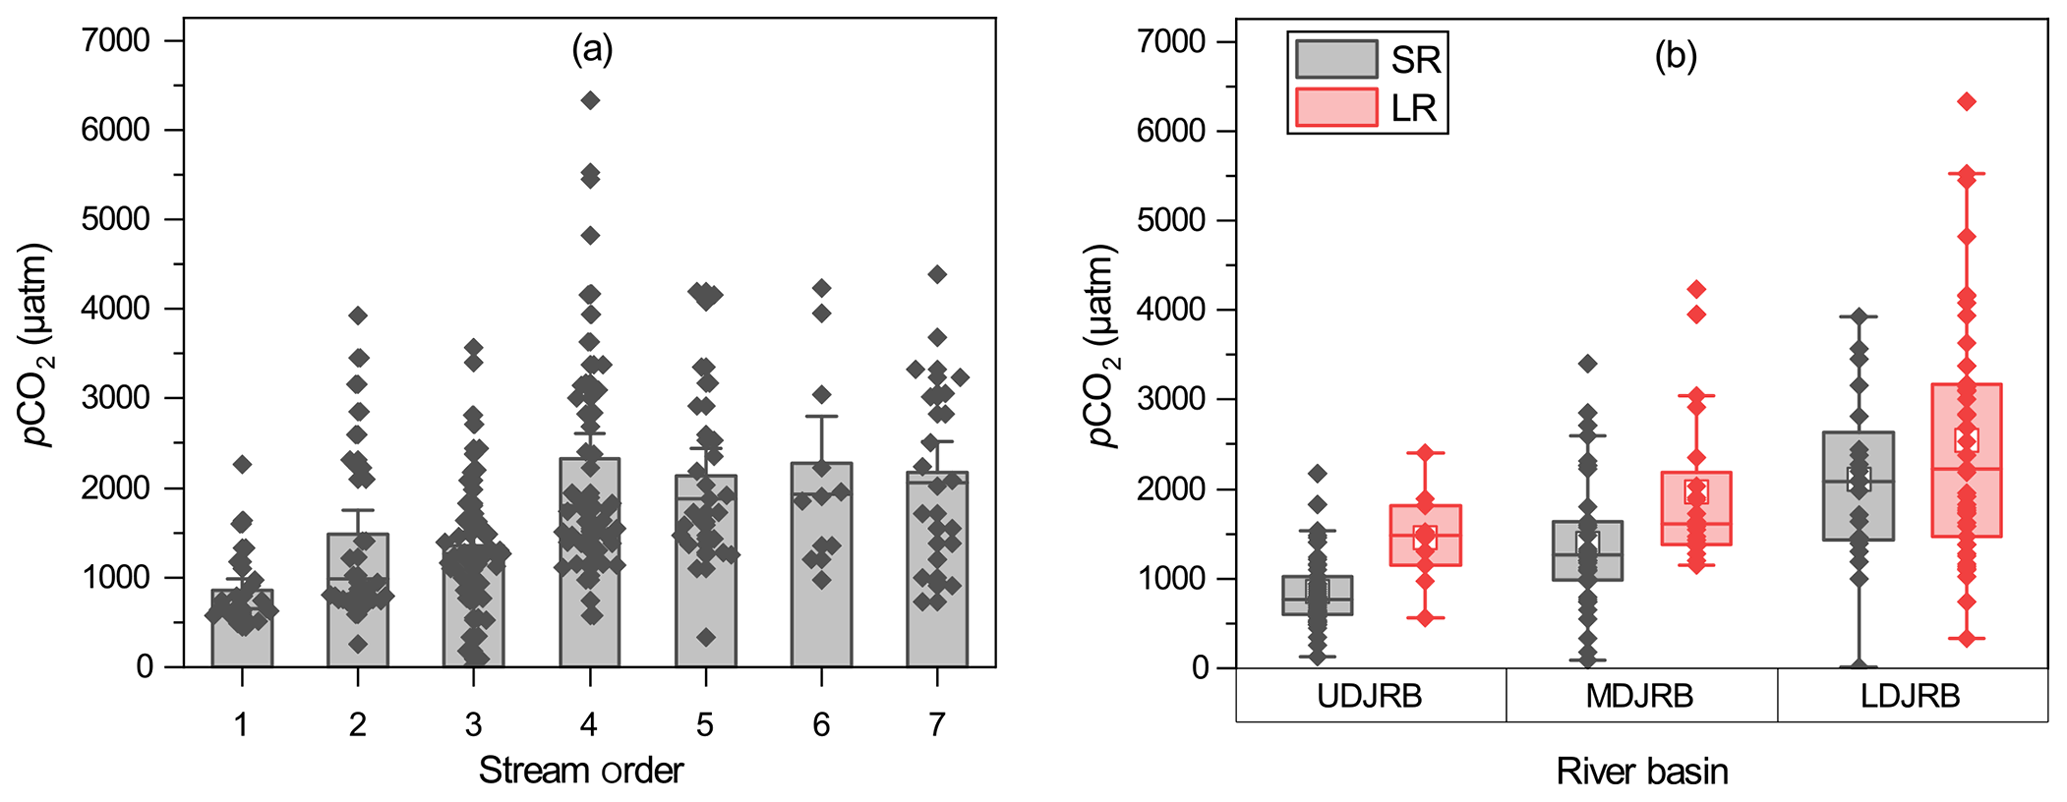
Figure 3Spatial variations in pCO2. (a) Yearly averagepCO2 in the seven stream orders; standard errors (SE) are displayed by error bars. (b) Measured pCO2 in small and large rivers among three regions in the DJRB. The box mid-lines represent medians; the interquartile range (IQR) is represented by the top and bottom of the box, respectively; whiskers indicate the range of 1.5 IQR; the white square symbols represent means, and the other symbols represent pCO2 values for each sampled site.
Seasonal variations in pCO2 differed across the stream size spectrum (Fig. 4). In small rivers, the highest pCO2 was observed in April (1506 ± 880 µatm), which was 50.3 % higher compared with January (1002 ± 660 µatm). pCO2 then decreased in July (1131 ± 589 µatm) and increased in August (1325 ± 863 µatm) and October (1414 ± 900 µatm). Compared with small rivers, the peak of pCO2 in large rivers occurred later but persisted for a longer period of time. In large rivers, an increase in pCO2 was not observed until July. pCO2 in April was 1831 ± 793 µatm, which was similar to 1805 ± 1010 µatm in January, and it increased 39.3 % to 2550 ± 1210 µatm in July. pCO2 peaked in August (2885 ± 1351 µatm) and then decreased to 2176 ± 1166 in October. Overall, pCO2 was 9.3 % and 21.7 % higher in the wet season than in the dry season for small and large rivers, respectively.
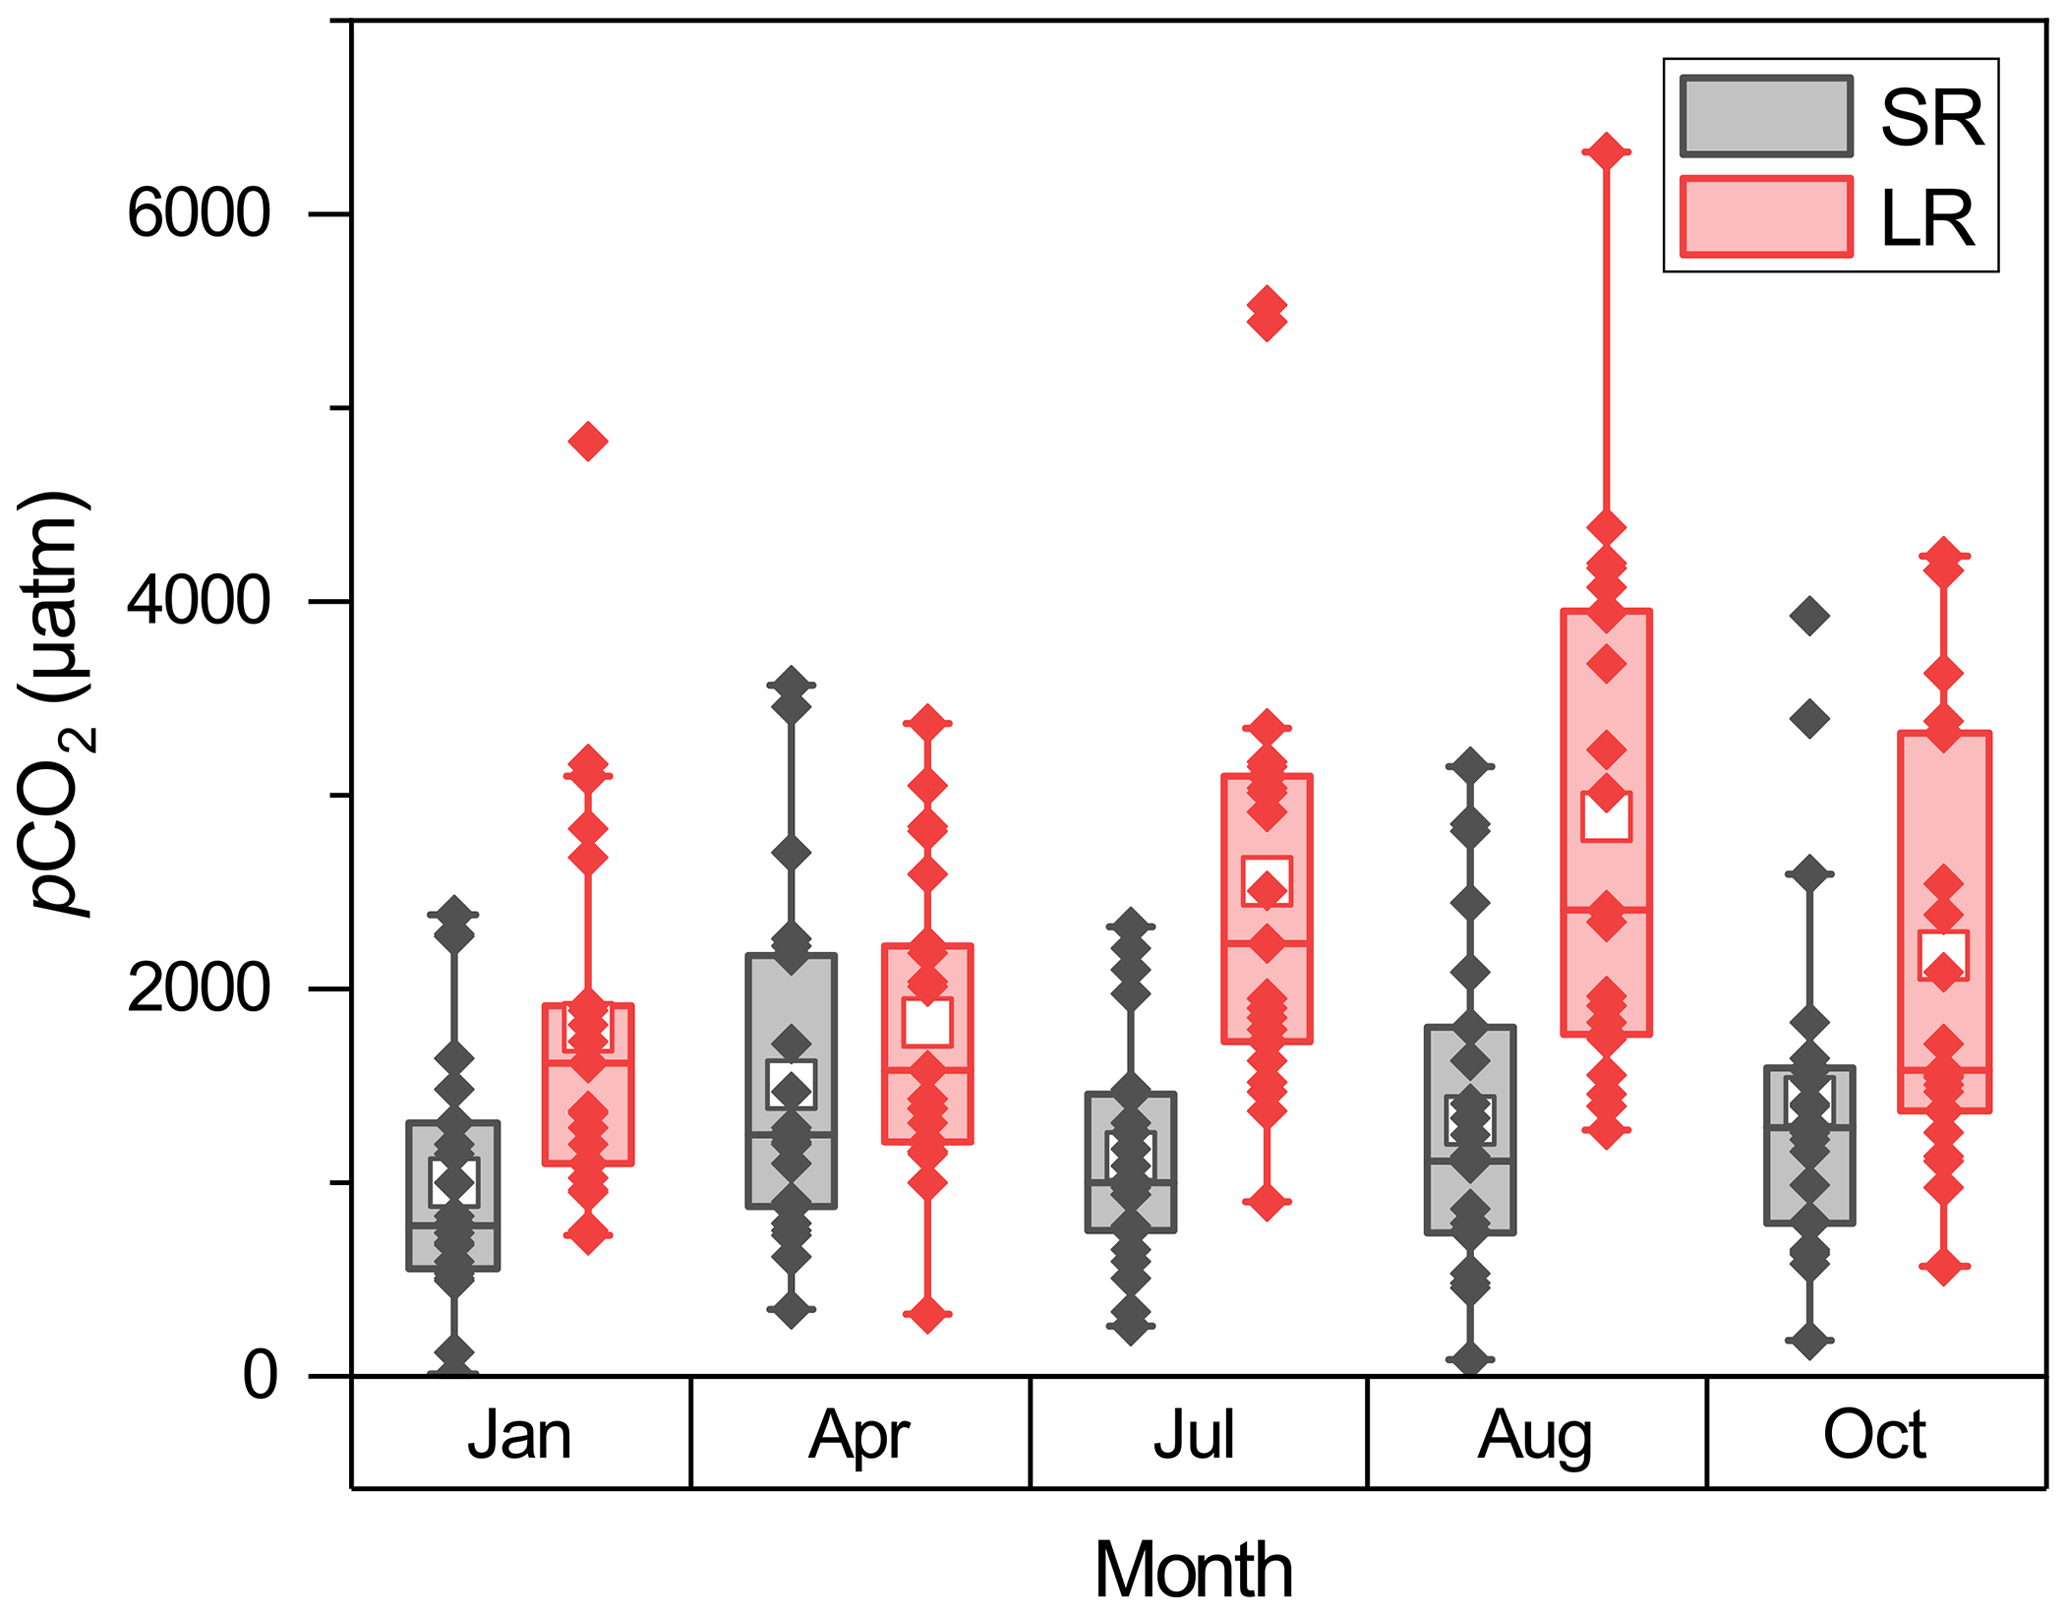
Figure 4Seasonal pCO2 changes in small and large rivers. The box mid-lines represent medians; the interquartile range (IQR) is represented by the top and bottom of the box, respectively; whiskers indicate the range of 1.5 IQR; the white square symbols represent means, and the other symbols represent pCO2 values for each sampled site.
3.3 CO2 effluxes and k600
CO2 effluxes ranged from −129.8 to 3874.8 mmol m−2 d−1 with a mean of 225.2 mmol m−2 d−1. More than 95 % of the 196 samples had positive FCO2 values, indicating that a majority of the surveyed rivers are a carbon source. Overall, we observed higher FCO2 during the wet season than during the dry season in both small and large rivers (Fig. 5a). FCO2 in small rivers and large rivers was 264.2 ± 410.0 and 300.1 ± 511.7 mmol m−2 d−1, respectively, during the wet season, which was 87.2 % and 123.1 % higher than that in the dry season (141.1 ± 188.7 and 134.5 ± 129.5 mmol m−2 d−1 for small and large rivers, respectively). No significant (independent sample t test, p>0.05) difference in FCO2 was observed between small and large rivers.
k600 differed greatly between river size classes and among hydrological periods (Fig. 5b). k600 values in small rivers were on average significantly (independent sample t test, p < 0.001) higher than that in large rivers. The mean values of k600 in small rivers were 8.29 ± 11.29 m d−1 and 4.90 ± 3.82 m d−1 for the wet season and dry seasons, respectively, which were 112.6 % and 70 % higher than that of large rivers (3.90 ± 5.55 m d−1 in the wet season and 2.25 ± 1.61 m d−1 in the dry season). k600 values during the wet season were also significantly (independent sample t test, p < 0.05) higher than that in the dry season. k600 increased 112.7 % and 118.2 % from the dry season to wet season in small and large rivers, respectively. However, comparisons between different phases in the same hydrological period (e.g., early, middle, and late wet season) did not differ significantly (paired sample t test, p>0.05) for both river size classes.
The spatial and temporal variations in CO2 efflux generally coincided with the changes in pCO2 and k600. In small rivers, the highest CO2 effluxes were 346.8 ± 625.2 mmol m−2 d−1 during April, consistent with the high k600 and pCO2 in this period. In large rivers, high CO2 effluxes were observed in both April (339.9 ± 828.6 mmol m−2 d−1) and August (329.9 ± 270.0 mmol m−2 d−1), which were attributed to the concurrently high k600 in April and high pCO2.
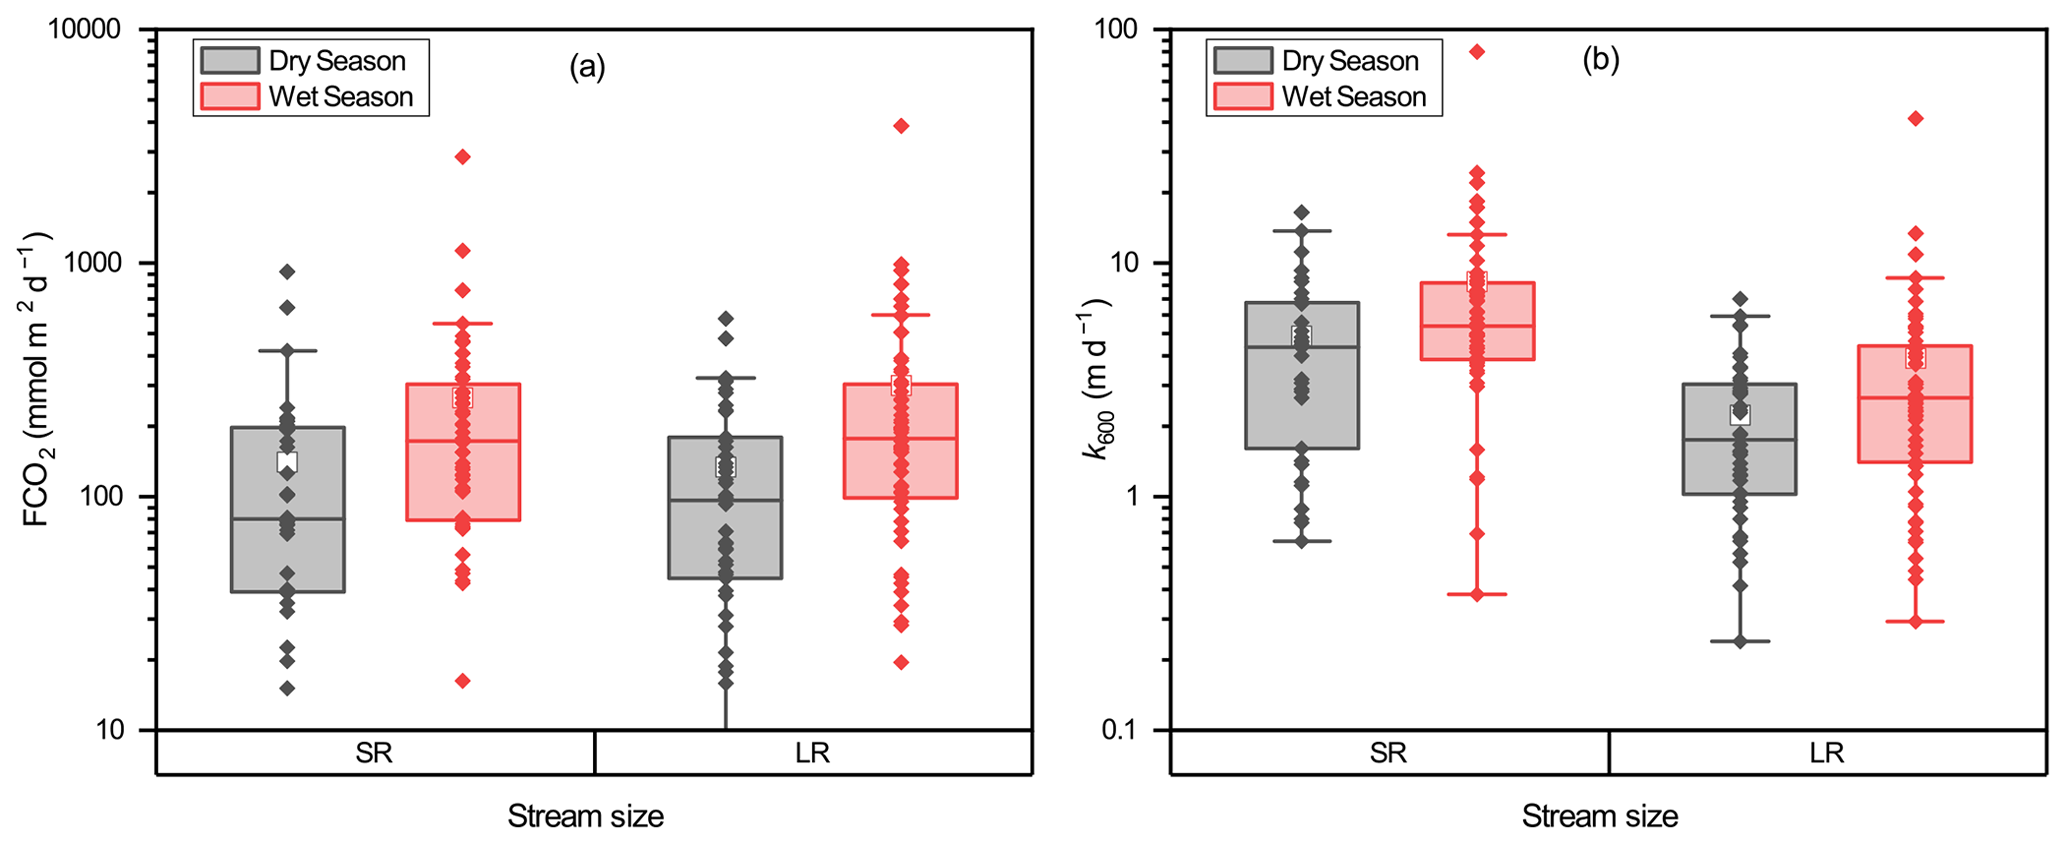
Figure 5Relationship between stream size and (a) FCO2 and (b) k600. The box mid-lines represent medians; the interquartile range (IQR) is represented by the top and bottom of the box, respectively; whiskers indicate the range of 1.5 IQR; the white square symbols represent means, and the other symbols represent FCO2 and k600 values for each sampled site.
4.1 Underlying processes of pCO2 dynamics
The spatial pattern of pCO2 in the DJRB likely results from the changes in terrestrial carbon inputs (i.e., organic and inorganic carbon) and in-stream metabolism, both of which varied due to different land cover and catchment topography. The higher pCO2 values in large rivers than small rivers were associated with a higher percentage of urban and cropland cover and a lower forest cover (Fig. 6). Compared with forest, cropland could provide a more favorable condition for soil erosion and the transfer of terrestrial carbon from land to rivers, contributing to a higher pCO2. Intensification of agricultural practices could promote the decomposition of soil organic matter (Borges et al., 2018), thereby increasing the concentration of CO2 and liable DOC in the soil (Borges et al., 2018). The soil CO2 could be easily transported to rivers and thus increase the pCO2, while the liable DOC could be decomposed rapidly after entering the rivers due to their sensitivity to in-stream metabolism (Lambert et al., 2017; Li et al., 2019). Meanwhile, the input of wastewater with high organic matter concentration from urban areas could also contribute to an increase in riverine pCO2 (Xuan et al., 2020; Zhang et al., 2021). Our results showed increasing pCO2 from forest-dominated streams in the UDJRB relative to those in agricultural and urban-impacted catchments in the MDJRB and LDJRB (Fig. 3b). The >70 % forest cover in the UDJRB (Fig. 1) may have greatly reduced the soil erosion intensity (Ran et al., 2018). Meanwhile, the organic matter from forest tends to be more aromatic and thus more capable of surviving biodegradation (Kalbitz and Kaiser, 2008), leading to a relatively low riverine pCO2 value. In contrast, cropland, occupying about 49 % of the land cover (Fig. 1), was the primary land use type in the MDJRB substituting forest, and urban areas account for ∼ 17 % of the land cover in the LDJRB. The higher pCO2 in the MDJRB and LDJRB is likely under the influence of agricultural practices and wastewater input. Overall, land use mainly affects the spatial distribution of pCO2 by altering the amount and lability of carbon inputs to the rivers.
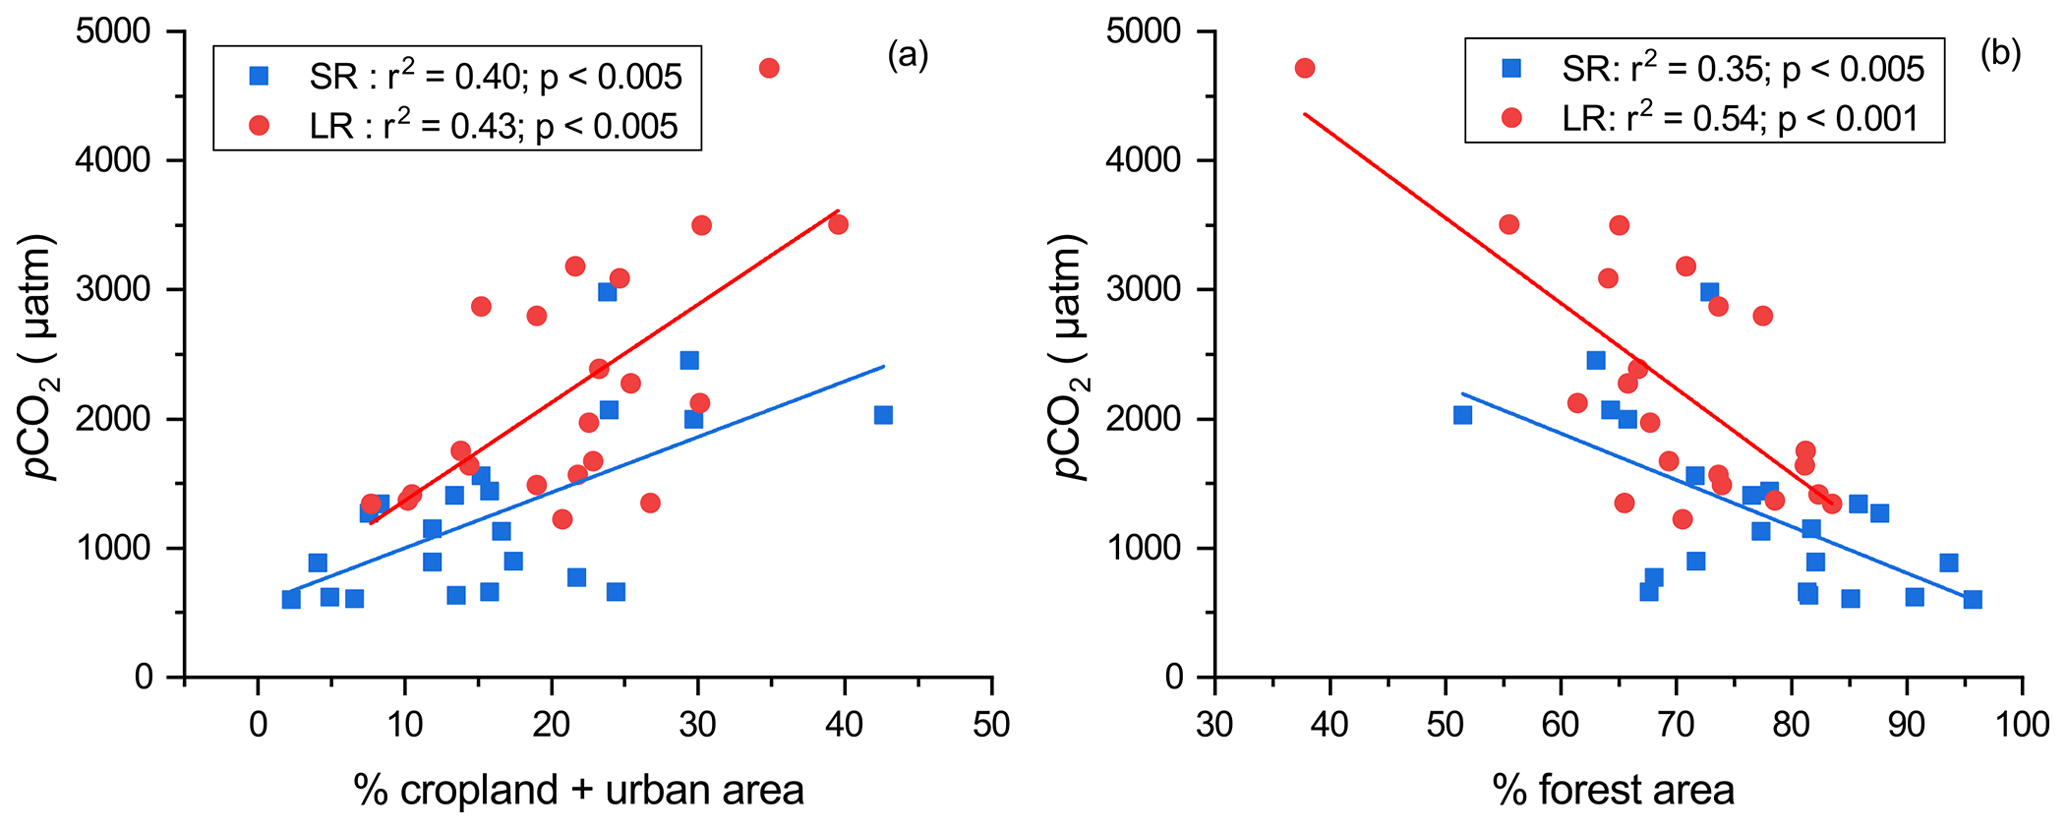
Figure 6(a) The relationship between yearly average pCO2 at each site and the percentage of cropland and urban area combined; (b) the relationship between yearly average pCO2 at each site and the percentage of forest area.
Moreover, different catchment topography in small and large rivers may have also contributed to the differences in pCO2. Due to steeper channel slopes and higher flow velocities, small rivers in the DJRB have higher k600 (Fig. 5b). As a consequence, CO2 in small rivers can exchange with the atmosphere more rapidly, preventing the build-up of dissolved CO2 and thus lower pCO2 (Rocher-Ros et al., 2019). Therefore, other processes have facilitated the carbon transfer from small rivers to downstream large rivers, sustaining the higher pCO2 in large rivers. Recent studies indicate that carbonate buffering could decrease the CO2 emissions from small rivers by increasing the ionization of CO2 (Stets et al., 2017), thereby increasing the transfer of DIC towards the rivers downstream, which resulted in the higher pCO2 in large downstream rivers. However, strong carbonate buffering usually occurs in high-alkalinity (>2500 µmol L−1) streams with high pH (>8), while in low-alkalinity waters, the pool of ionized CO2 is relatively small, indicating a weak carbonate buffering (Stets et al., 2017). Since the streams in the DJRB were characterized by low alkalinity (726 ± 364 and 844 ± 409 µmol L−1 for small and large rivers, respectively), carbonate buffering is unlikely a primary contributor to the high pCO2 in large rivers. Meanwhile, our data showed that river water pCO2 was negatively related to DO and positively related to DOC (Fig. 7), suggesting that the high pCO2 in large rivers was related to metabolic processes. The steep channel slopes in small rivers tend to promote the transfer of OC to downstream large rivers. As a consequence, it is difficult for terrestrial organic carbon to be converted into CO2 in small rivers due to the short water residence time (Hotchkiss et al., 2015). Conversely, a greater fraction of OC may have been transported downstream and fuel the heterotrophic respiration in large rivers, where low flow velocity and long water residence time facilitated the decomposition of organic carbon within the water column (Denfeld et al., 2013).
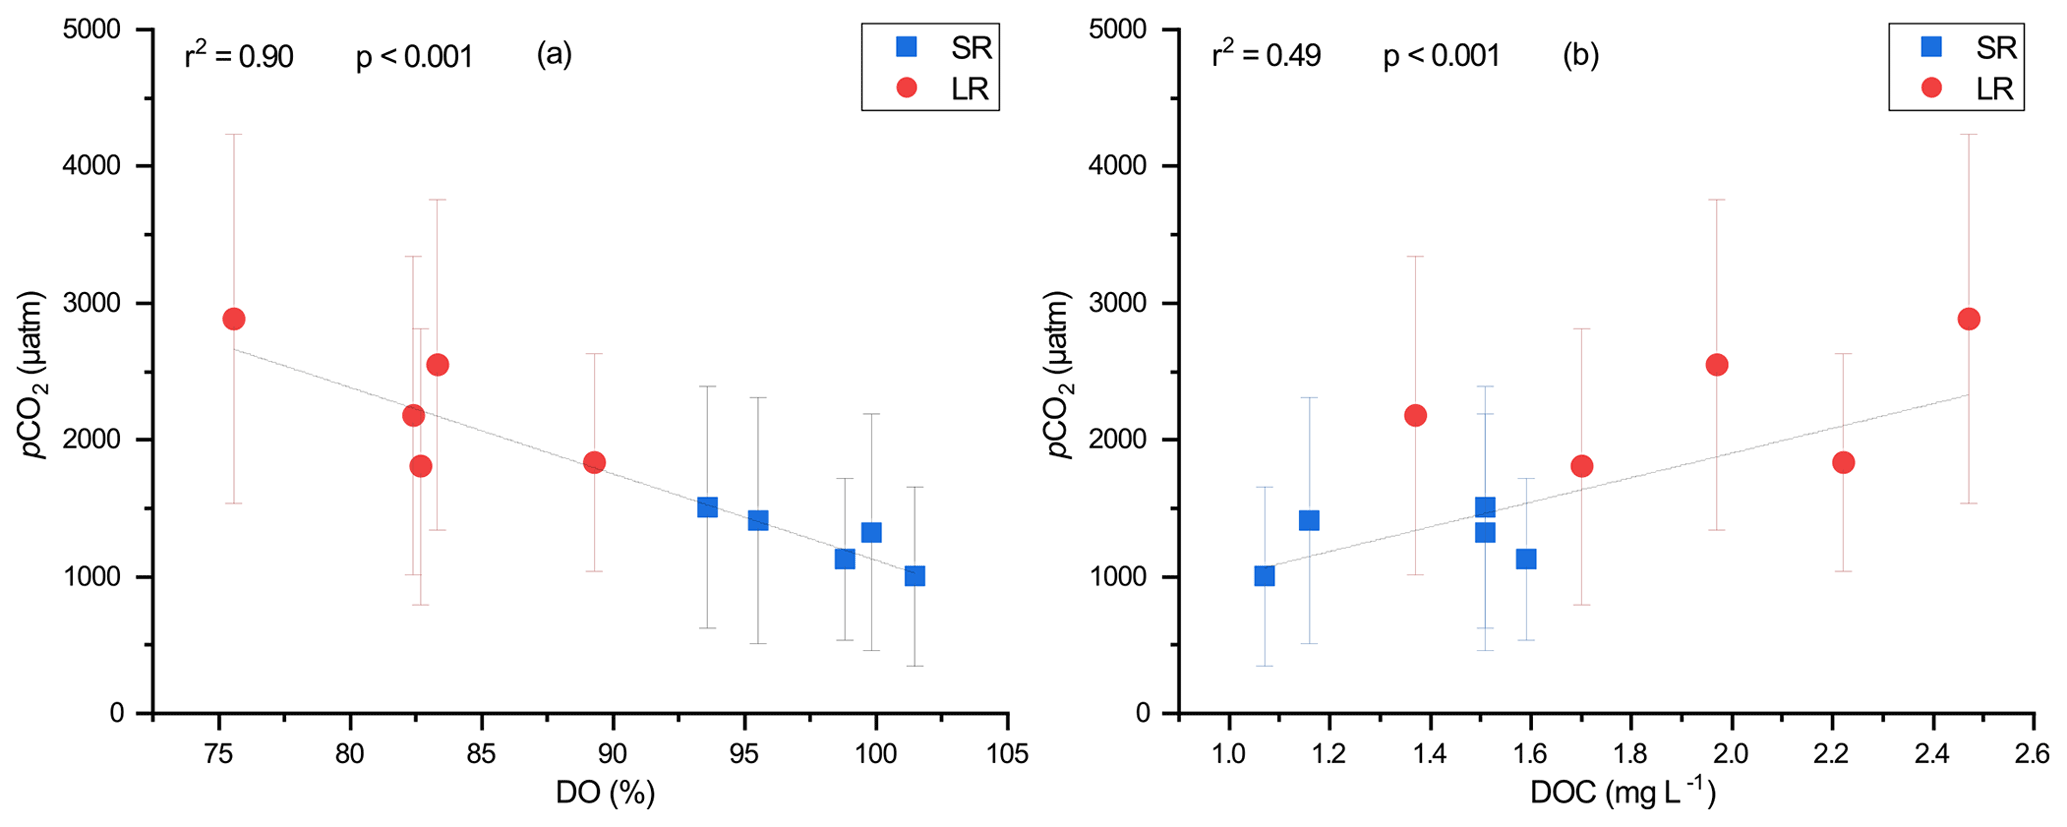
Figure 7Relationship between seasonal average pCO2 and (a) DO and (b) DOC. Error bars for the pCO2 represent 1 standard deviation from the seasonal mean. The DO–pCO2 and DOC–pCO2 relationships are shown as solid lines.
To compare the contribution of internal metabolism and external CO2 input on pCO2 in small and large rivers, the ΔCO2 : ΔO2 stoichiometry was used to evaluate the impacts of respiration and photosynthesis processes on the concentration of dissolved O2 and CO2 (Stets et al., 2017). The inverse relation between ΔCO2 and ΔO2 (Fig. 8) demonstrated that metabolic processes are important for the dissolved CO2 concentration variations (Amaral et al., 2020), while the difference in the ΔCO2 : ΔO2 stoichiometry between small and large rivers suggested the different strength of in-stream metabolism (Rasera et al., 2013). The ΔCO2:ΔO2 stoichiometry in large rivers is closer to the 1:1 line than that in small rivers, indicating that large rivers are more affected by the metabolic processes (Jeffrey et al., 2018; Amaral et al., 2020). For large rivers, the linear regression is ΔCO (± 0.081) ΔO2+18.020 (± 5.995) (r2=0.62, p < 0.001). When the CO2 concentration increases in large rivers, a similar magnitude of decrease in dissolved O2 concentration occurs, indicating that in-stream metabolism is the primary control on pCO2. In contrast, the linear regression for small rivers is ΔCO (± 0.098) ΔO2+21.42 (± 4.175) (r2=0.41, p < 0.001), which means that with the CO2 concentration increasing by 1 µmol L−1, the O2 concentration decreases by only 0.868 µmol L−1. Therefore, extra CO2 inputs have contributed to the changes in pCO2 despite the strong presence of in-stream metabolism.
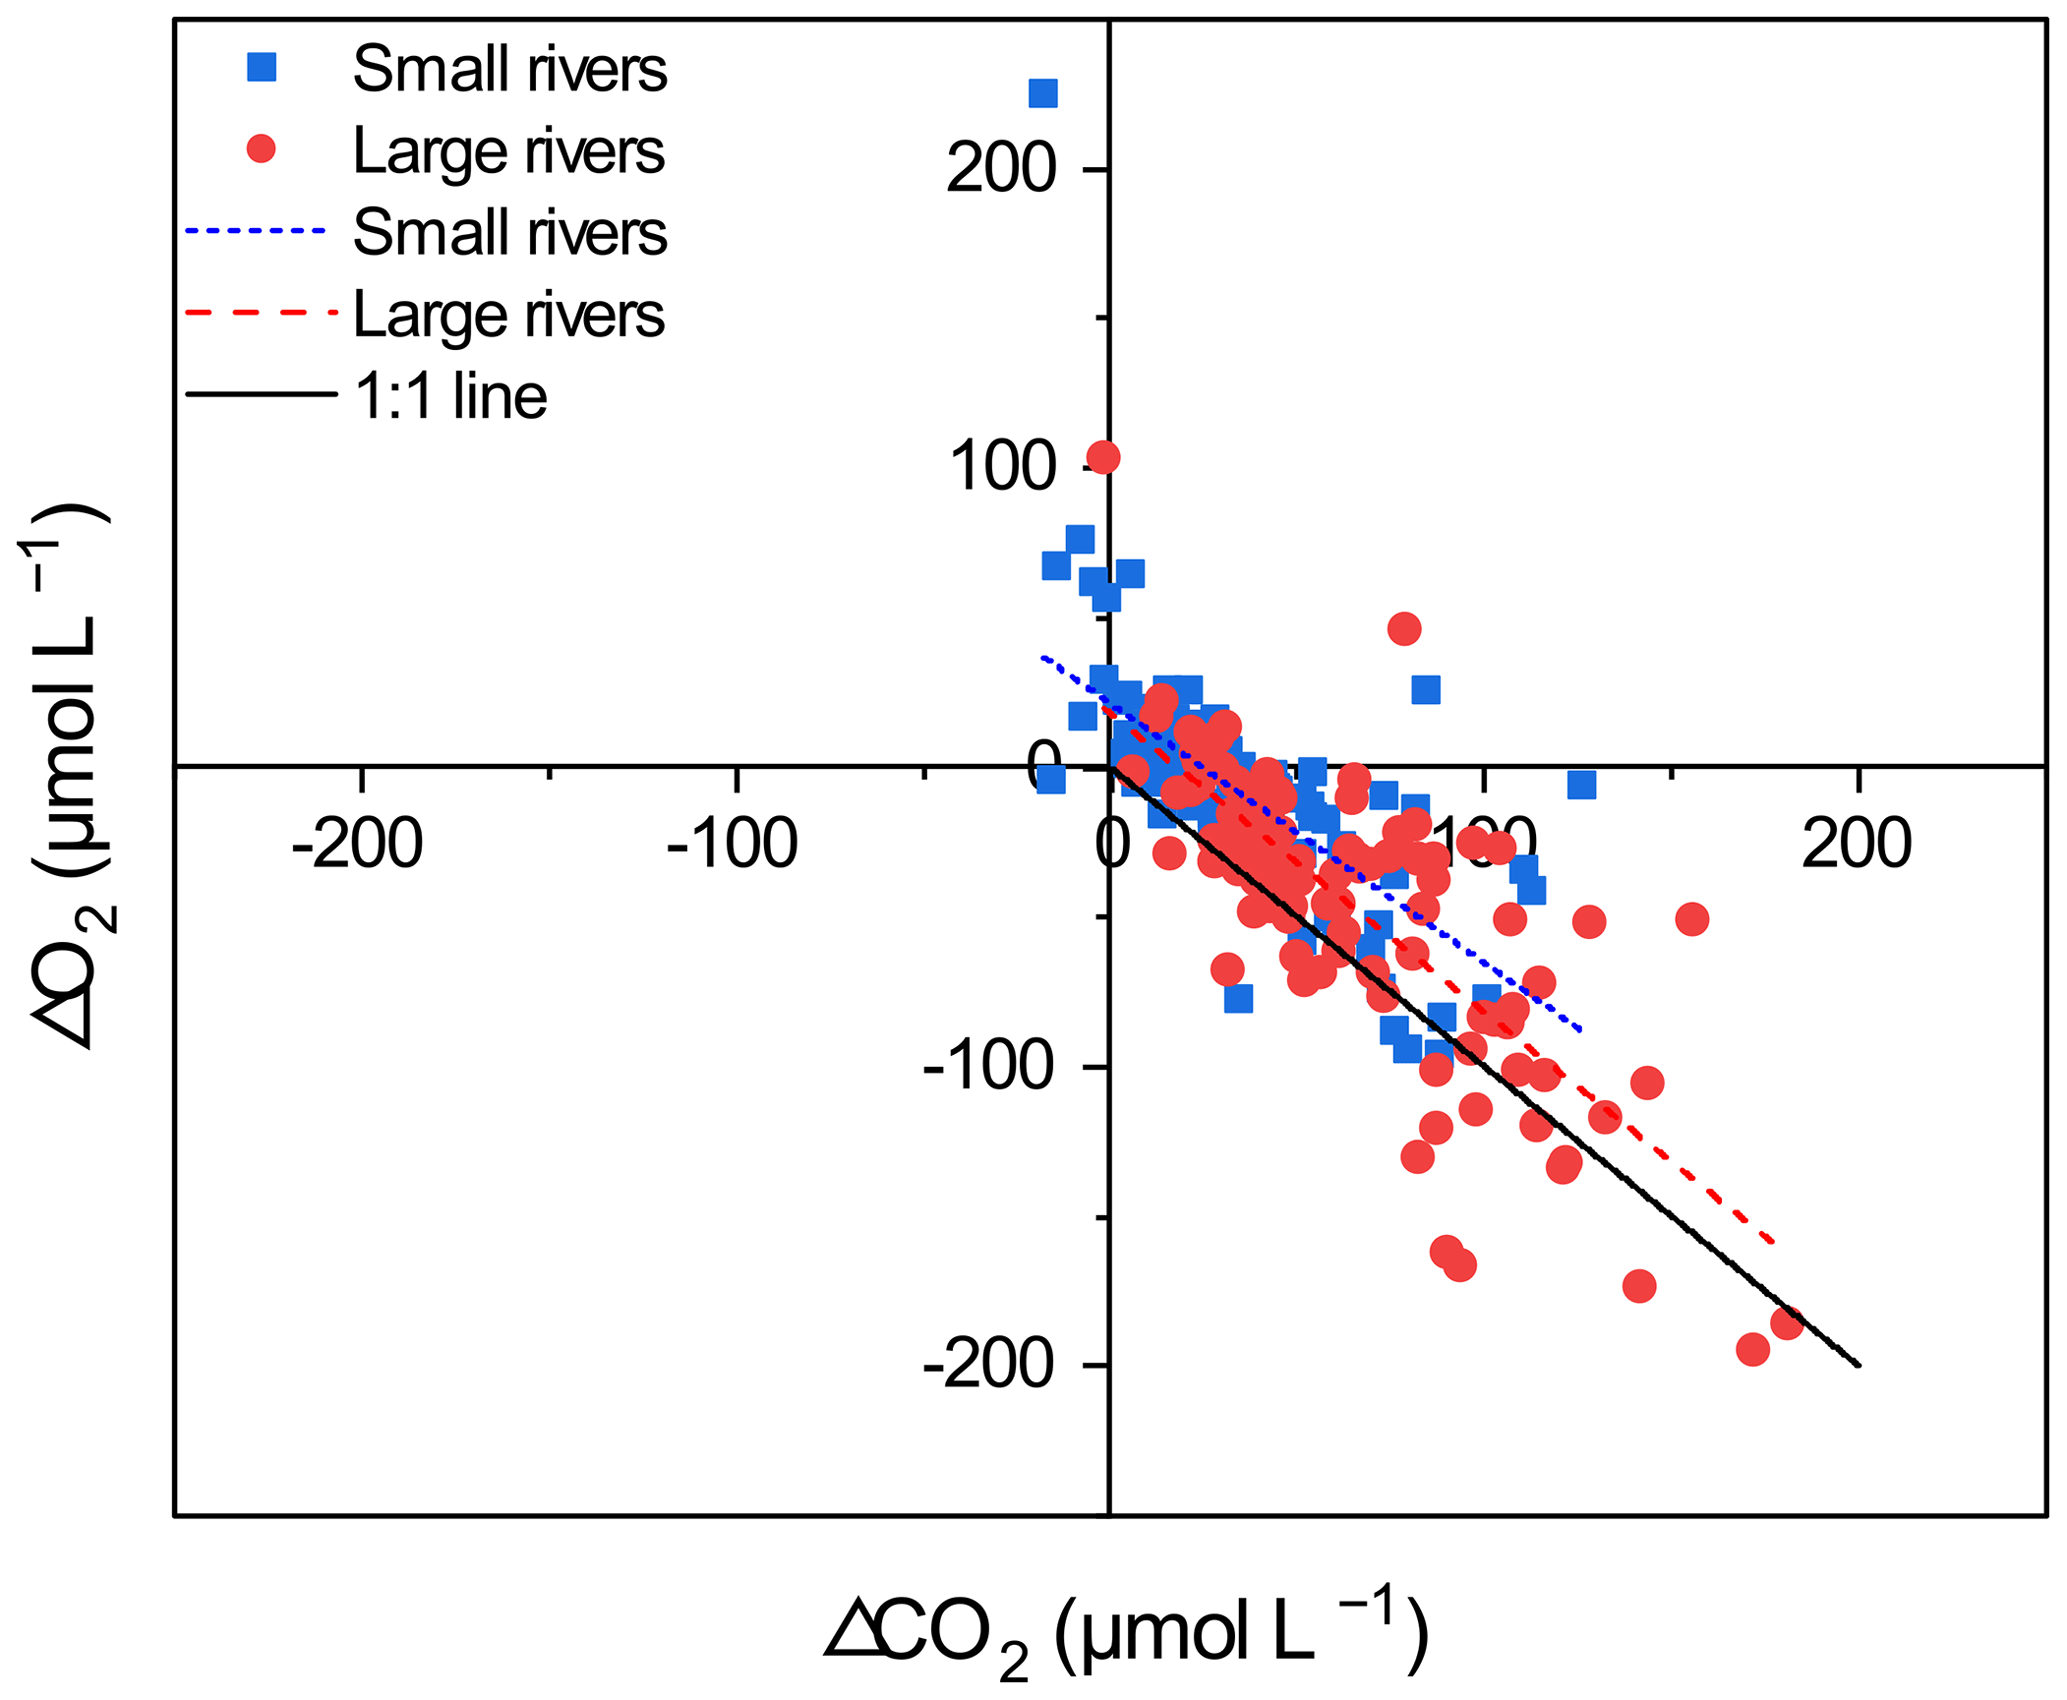
Figure 8The relationship between ΔCO2 and ΔO2. Points greater than zero are oversaturated, and points less than zero are undersaturated. Points above the 1:1 line indicate the existence of additional carbon sources, apart from in-stream metabolic processes. For large rivers, the linear regression is ΔCO (± 0.081) ΔO2+18.020 (± 5.995) (r2=0.62, p<0.001). For small rivers, the linear regression is ΔCO (± 0.098) ΔO2+21.42 (± 4.175) (r2=0.41, p < 0.001).
On the other hand, the temporal pattern was affected by precipitation and temperature seasonality. Our results showed that higher pCO2 occurred in the wet season than in the dry season for both small and large rivers (Fig. 4). The elevated temperature in the wet season could promote a substantial increase in the net primary productivity of the terrestrial ecosystem, while increased precipitation can facilitate the transfer of terrestrial carbon (Rasera et al., 2013), including both soil CO2 and OC, from land to rivers. This could either directly increase riverine pCO2 or fuel OC decomposition (Borges et al., 2018). However, the differences in seasonal changes of pCO2 between small and large rivers (Fig. 4) also suggested that their controlling process could be different. For small rivers, the highest pCO2 value was observed in April (Fig. 4), which is consistent with the rapid surge of terrestrial C inputs, usually occurring at the onset of the wet season (Hope et al., 2004; Yao et al., 2007; Johnson et al., 2008). However, such increase in pCO2 was not observed in large rivers (Fig. 4), though the DOC in large rivers increased at a rate similar to that in small rivers during the same period (Table 1). A possible explanation is that the observed pCO2 rise mainly originated from soil CO2, which was readily emitted from the small rivers into the air, with little reaching the larger rivers downstream (Denfeld et al., 2013; Drake et al., 2018). Differences in the pCO2 dynamics in July and August also reflected different controlling processes in small and large rivers. A decline in pCO2 in July in small rivers suggested that it might have experienced the depletion effect occurring in the middle and late wet season (Hope et al., 2004), during which soil CO2 decreased due to the continual precipitation. In contrast, the increase in pCO2 in large rivers in July indicated that the decreased soil CO2 inputs could hardly affect the pCO2 in large rivers during this period. Instead, stronger in-stream metabolism caused by OC inputs and the favorable conditions for OC decomposition are more likely to be responsible for the rising pCO2. In addition, there are other processes that may have affected the riverine pCO2. For example, stronger solar radiation during summer could increase photo-oxidation in rivers. However, the commonly observed lower daytime CO2 emission rates than nocturnal rates (Gómez-Gener et al., 2021) suggest that photosynthesis overrides photo-oxidation in CO2 dynamics. Nonetheless, the low DO concentration observed in the surveyed rivers (Fig. 8) suggested that photosynthesis is not likely the primary control on the seasonal variation in pCO2.
Table 2Seasonal variation in k600 and environmental factors in small and large rivers.
4.2 Environmental control of k600 variation
Environmental factors, including wind speed and hydrological variables, could affect the gas exchange at the water–air interface and are typically used to explain the variance in k600 (Alin et al., 2011; Raymond et al., 2012). Flow velocity generally determines the k600 in small rivers, while wind speed becomes a more important factor in controlling the k600 in large rivers, reservoirs, and estuaries (Guérin et al., 2007; Rasera et al., 2013; Amaral et al., 2020). In our surveyed rivers, k600 displayed a significant linear correlation (Pearson correlation, p<0.001) with the flow velocity. Our k600 model (Fig. 9) based on 188 field measurement data is similar to that developed by Alin et al. (2011) (). However, in our studied rivers, no significant correlation (Pearson correlation p>0.05) was found between wind speed and k600 regardless of stream size. This could be explained by the lower wind speed (0.68 ± 0.66 and 1.09 ± 1.06 m s−1 for small and large rivers, respectively; Table 2) (Guérin et al., 2007). As the wind speed decreases, the impact of flow velocity on k600 becomes increasingly predominant (Borges et al., 2004). Therefore, the accuracy of k600 estimation based on wind speed in nearby regions should be examined using measurement data (Yao et al., 2007; Li et al., 2018). The temporal heterogeneities of k600 between small and large rivers reveal the differences in flow regime. The k600 values in small rivers are significantly higher than that in large rivers (independent sample t test, p<0.001), which could be explained by the higher flow velocity in small rivers. Meanwhile, the significantly higher k600 in the wet season than in the dry season (independent sample t test, p < 0.05) is the result of the increased flow velocity and turbulence due to monsoon-induced precipitation during the wet season (Guérin et al., 2007; Alin et al., 2011; Ho et al., 2018).
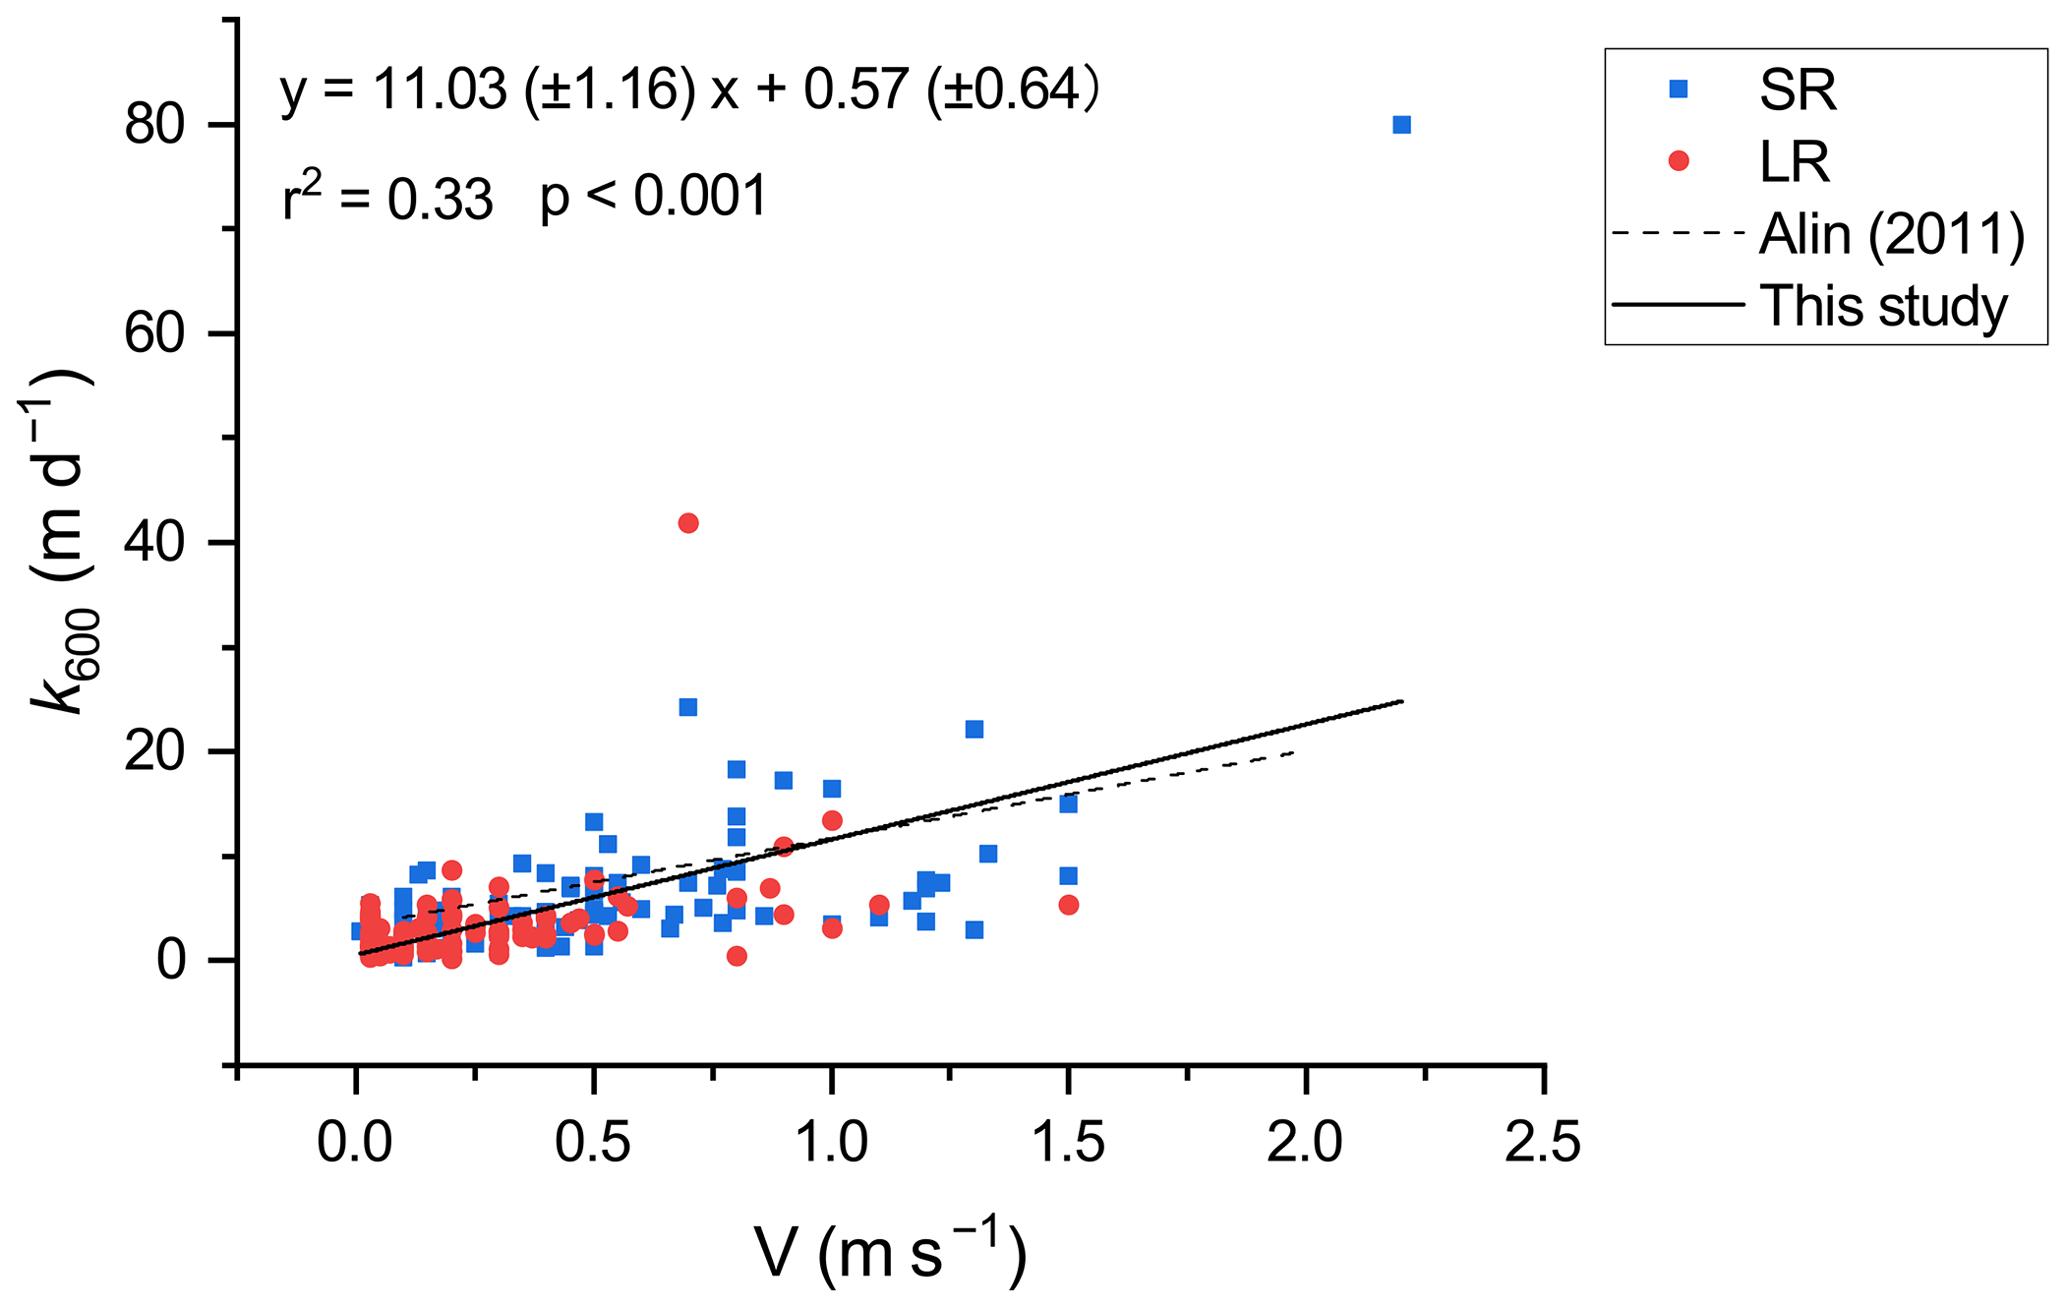
Figure 9Relationship between k600 and flow velocity. The dashed line represents the parameterization of Alin et al. (2011).
Exceptionally high k600 values were observed in the surveyed rivers (Fig. 9). The highest k600 values in large and small rivers were 41.83 and 79.97 m d−1, respectively, which were 5-fold and 3-fold larger than calculated k600, respectively. This is likely the result of the exponential increase in k600 due to extreme flood events. Generally, flood events associated with heavy rainfall can substantially increase flow velocity and near-surface turbulence (Almeida et al., 2017; Geeraert et al., 2017), leading to extremely high k600 values. Yet, neither our model nor the one from Alin et al. (2011) was suitable for the estimation of k600 during extreme flood events because the calculated k600 could deviate far from the measured k600 when they occurred. The extent to which flood events affect k600 and riverine CO2 emission is still uncertain and warrant continued research (Drake et al., 2018).
4.3 A comparison of CO2 emissions to other rivers
The mean CO2 fluxes of 225.2 mmol m−2 d−1 in the DJRB are comparable to those observed in tropical and subtropical rivers in the Americas, Africa, and Southeast Asia (Table 3). Although the magnitude of the CO2 emissions of these river systems is similar, the seasonal variations and drivers behind them could differ. The CO2 emissions from the Dong River were higher in the wet season than in the dry season. This seasonal pattern is similar to that observed in the Xi and Daning rivers (Yao et al., 2007; Ni et al., 2019) but different from that observed in the Jinshui River in the upper Yangtze River, where pCO2 is high in winter and low in summer (Luo et al., 2019), although all four rivers are in the East Asian Monsoon climate region. The seasonal differences in CO2 emissions are largely caused by the pCO2 variability, which in turn is regulated by external carbon inputs, internal production of CO2 (Yao et al., 2007), and the dilution effect caused by precipitation (Johnson et al., 2007). For rivers where pCO2 is lower in summer than in winter, the dilution effect overrides the effect of increased carbon inputs and internal CO2 production (Luo et al., 2019). In contrast, for rivers like the Dong River, although the dilution effect remains, increased CO2 inputs and metabolism are more significant factors in controlling its pCO2, thus leading to higher summer pCO2. In addition, the controlling processes of the Dong River could be different even when compared with rivers with similar seasonal variations in the same climatic zone. For instance, the DO in the Xi River was supersaturated, indicating that its aquatic photosynthetic activities predominated aquatic metabolism and tended to reduce its CO2 concentration (Yao et al., 2007). Therefore, other carbon sources like soil respiration and carbonate weathering should be responsible for the high pCO2 in summer (Zhang et al., 2019). In contrast, the low DO value and the negative correlation between DO and pCO2 in the Dong River indicated that photosynthesis is relatively weak compared with the respiration, and the latter process is an essential source of riverine CO2 (Stets et al., 2017), resulting in a higher pCO2 in summer.
Table 3Comparison of CO2 emissions from subtropical and tropical rivers.

a k values were shown here because k600 values were not provided in references. b The unit for pCO2 is ppm.
The CO2 fluxes in small rivers are similar to those in large rivers, which is contradictory to the finding in previous studies that CO2 effluxes should be higher in small rivers than in large rivers due to the input of CO2-rich groundwater (Duvert et al., 2018). The depletion and diffusion effect may be responsible for the discrepancy (Johnson et al., 2007; Dinsmore et al., 2013). Groundwater in the DJRB could be easily diluted due to abundant monsoon-induced rainfall, preventing it from supplying the small rivers with high CO2 concentrations. However, we recognize that the impact of groundwater on pCO2 in small rivers may be overlooked in our sampling process since the CO2 carried by groundwater can emit into the atmosphere within a very short distance (Duvert et al., 2018). In view of the above, it is recommended that further studies targeting the release of groundwater CO2 to the atmosphere be carried out in the future.
Studying CO2 emissions from subtropical rivers is an essential step toward more accurate estimates of global CO2 emissions from river systems. By deploying floating chambers, seasonal changes in riverine pCO2 and CO2 emissions from the Dong River catchment were investigated. Spatial and temporal patterns of pCO2 were mainly affected by terrestrial carbon inputs (i.e., organic and inorganic carbon) and in-stream metabolism, both of which varied due to different land cover, catchment topography, and seasonality of precipitation and temperature. k600 was higher in small rivers than in large rivers and higher during the wet season than during the dry season, both of which can be explained by the observed significant correlation between k600 and flow velocity. In contrast to previous studies, similar CO2 fluxes were observed among small and large rivers in the DJRB. It is suggested that the absence of commonly observed higher CO2 fluxes in small rivers could be associated with the depletion effect caused by abundant and persistent precipitation in this subtropical monsoon catchment. There is no doubt that the spatial and temporal variations in CO2 emissions from the DJRB reflected the complexity and diversity of controlling factors. As a step towards a more accurate estimate of the carbon budget in the catchment, comprehensive and systematic measurements of CO2 emissions covering a broad range of stream sizes and seasons are of paramount importance.
CO2 emission data used in this study are available online at https://doi.org/10.25442/hku.13416281.v1 (Liu, 2020). Other data are available from the corresponding author Lishan Ran upon request at lsran@hku.hk.
The supplement related to this article is available online at: https://doi.org/10.5194/bg-18-5231-2021-supplement.
BL and LR conceived the study. BL, MT, CNC, XY, and LR carried out the fieldwork. BL, MT, and KS designed and performed the laboratory analysis. BL composed the manuscript with contributions from all authors.
The authors declare that they have no conflict of interest.
Publisher's note: Copernicus Publications remains neutral with regard to jurisdictional claims in published maps and institutional affiliations.
We thank Steven Bouillon and the two anonymous reviewers for their constructive comments which have greatly improved the paper.
This research has been supported by the Research Grants Council of Hong Kong (grant nos. 17300619 and 27300118) and the National Natural Science Foundation of China (grant no. 41807318). This research has also been supported by the Hui Oi-Chow Trust Fund (grant no.201801172006).
This paper was edited by Steven Bouillon and reviewed by two anonymous referees.
Abril, G., Martinez, J. M., Artigas, L. F., Moreira-Turcq, P., Benedetti, M. F., Vidal, L., Meziane, T., Kim, J. H., Bernardes, M. C., Savoye, N., Deborde, J., Souza, E. L., Alberic, P., Landim de Souza, M. F., and Roland, F.: Amazon River carbon dioxide outgassing fuelled by wetlands, Nature, 505, 395–398, https://doi.org/10.1038/nature12797, 2014.
Abril, G., Bouillon, S., Darchambeau, F., Teodoru, C. R., Marwick, T. R., Tamooh, F., Ochieng Omengo, F., Geeraert, N., Deirmendjian, L., Polsenaere, P., and Borges, A. V.: Technical Note: Large overestimation of pCO2 calculated from pH and alkalinity in acidic, organic-rich freshwaters, Biogeosciences, 12, 67–78, https://doi.org/10.5194/bg-12-67-2015, 2015.
Alin, S. R., Rasera, M. d. F. F. L., Salimon, C. I., Richey, J. E., Holtgrieve, G. W., Krusche, A. V., and Snidvongs, A.: Physical controls on carbon dioxide transfer velocity and flux in low-gradient river systems and implications for regional carbon budgets, J. Geophys. Res., 116, G01009, https://doi.org/10.1029/2010jg001398, 2011.
Almeida, R. M., Pacheco, F. S., Barros, N., Rosi, E., and Roland, F.: Extreme floods increase CO2 outgassing from a large Amazonian river, Limnol. Oceanogr., 62, 989-999, https://doi.org/10.1002/lno.10480, 2017.
Amaral, J. H. F., Melack, J. M., Barbosa, P. M., MacIntyre, S., Kasper, D., Cortés, A., Silva, T. S. F., Nunes de Sousa, R., and Forsberg, B. R.: Carbon dioxide fluxes to the atmosphere from waters within flooded forests in the Amazon basin, J. Geophys. Res.-Biogeo., 125, e2019JG005293, https://doi.org/10.1029/2019JG005293, 2020.
Battin, T. J., Luyssaert, S., Kaplan, L. A., Aufdenkampe, A. K., Richter, A., and Tranvik, L. J.: The boundless carbon cycle, Nat. Geosci., 2, 598–600, https://doi.org/10.1038/ngeo618, 2009.
Borges, A. V., Delille, B., Schiettecatte, L. S., Gazeau, F., Abril, G., Frankignoulle, M. J. L., and Oceanography: Gas transfer velocities of CO2 in three European estuaries (Randers Fjord, Scheldt, and Thames), Limnol. Oceanogr., 49, 1630–1641, https://doi.org/10.4319/lo.2004.49.5.1630, 2004.
Borges, A. V., Abril, G., Darchambeau, F., Teodoru, C. R., Deborde, J., Vidal, L. O., Lambert, T., and Bouillon, S.: Divergent biophysical controls of aquatic CO2 and CH4 in the World's two largest rivers, Sci. Rep., 5, 15614, https://doi.org/10.1038/srep15614, 2015a.
Borges, A. V., Darchambeau, F., Teodoru, C. R., Marwick, T. R., Tamooh, F., Geeraert, N., Omengo, F. O., Guérin, F., Lambert, T., Morana, C., Okuku, E., and Bouillon, S.: Globally significant greenhouse-gas emissions from African inland waters, Nat. Geosci., 8, 637–642, https://doi.org/10.1038/ngeo2486, 2015b.
Borges, A. V., Darchambeau, F., Lambert, T., Bouillon, S., Morana, C., Brouyere, S., Hakoun, V., Jurado, A., Tseng, H. C., Descy, J. P., and Roland, F. A. E.: Effects of agricultural land use on fluvial carbon dioxide, methane and nitrous oxide concentrations in a large European river, the Meuse (Belgium), Sci. Total Environ., 610/611, 342–355, https://doi.org/10.1016/j.scitotenv.2017.08.047, 2018.
Chen, Q., Xu, W., Li, S., Fu, S., and Yan, J.: Aboveground biomass and corresponding carbon sequestration ability of four major forest types in south China, Chin. Sci. Bull., 58, 1551–1557, https://doi.org/10.1007/s11434-012-5100-8, 2013.
Chen, Y. D., Zhang, Q., Lu, X., Zhang, S., and Zhang, Z.: Precipitation variability (1956–2002) in the Dongjiang River (Zhujiang River basin, China) and associated large-scale circulation, Quaternary Int., 244, 130–137, https://doi.org/10.1016/j.quaint.2010.08.013, 2011.
Cole, J. J., Prairie, Y. T., Caraco, N. F., McDowell, W. H., Tranvik, L. J., Striegl, R. G., Duarte, C. M., Kortelainen, P., Downing, J. A., Middelburg, J. J., and Melack, J.: Plumbing the global carbon cycle: Integrating inland waters into the terrestrial carbon budget, Ecosystems, 10, 172–185, https://doi.org/10.1007/s10021-006-9013-8, 2007.
Denfeld, B. A., Frey, K. E., Sobczak, W. V., Mann, P. J., and Holmes, R. M.: Summer CO2 evasion from streams and rivers in the Kolyma River basin, north-east Siberia, Polar Res., 32, 19704, https://doi.org/10.3402/polar.v32i0.19704, 2013.
Dickson, A. G., Sabine, C. L., and Christian, J. R. (Eds.): Guide to Best Practices for Ocean CO2 Measurements, North Pacific Marine Science Organization, BC, Canada, 2007.
Ding, J., Jiang, Y., Fu, L., Liu, Q., Peng, Q., and Kang, M.: Impacts of land use on surface water quality in a subtropical river basin: A case study of the Dongjiang River Basin, Southeastern China, Water, 7, 4427–4445, https://doi.org/10.3390/w7084427, 2015.
Dinsmore, K. J., Wallin, M. B., Johnson, M. S., Billett, M. F., Bishop, K., Pumpanen, J., and Ojala, A.: Contrasting CO2 concentration discharge dynamics in headwater streams: A multi-catchment comparison, J. Geophys. Res.-Biogeo., 118, 445–461, https://doi.org/10.1002/jgrg.20047, 2013.
Drake, T. W., Raymond, P. A., and Spencer, R. G.: Terrestrial carbon inputs to inland waters: A current synthesis of estimates and uncertainty, Limnol. Oceanogr. Lett., 3, 132–142, https://doi.org/10.1002/lol2.10055, 2018.
Duvert, C., Butman, D. E., Marx, A., Ribolzi, O., and Hutley, L. B.: CO2 evasion along streams driven by groundwater inputs and geomorphic controls, Nat. Geosci., 11, 813–818, https://doi.org/10.1038/s41561-018-0245-y, 2018.
Fu, Y., Tang, C., Li, J., Zhao, Y., Zhong, W., and Zeng, X.: Sources and transport of organic carbon from the Dongjiang River to the Humen outlet of the Pearl River, southern China, J. Geogr. Sci., 24, 143–158, https://doi.org/10.1007/s11442-014-1078-2, 2014.
Geeraert, N., Omengo, F. O., Borges, A. V., Govers, G., and Bouillon, S.: Shifts in the carbon dynamics in a tropical lowland river system (Tana River, Kenya) during flooded and non-flooded conditions, Biogeochemistry, 132, 141–163, https://doi.org/10.1007/s10533-017-0292-2, 2017.
Gómez-Gener, L., Rocher-Ros, G., Battin, T., Cohen, M. J., Dalmagro, H. J., Dinsmore, K. J., Drake, T. W., Duvert, C., Enrich-Prast, A., Horgby, Å., Johnson, M. S., Kirk, L., Machado-Silva, F., Marzolf, N. S., McDowell, M. J., McDowell, W. H., Miettinen, H., Ojala, A. K., Peter, H., Pumpanen, J., Ran, L., Riveros-Iregui, D. A., Santos, I. R., Six, J., Stanley, E. H., Wallin, M. B., White, S. A., and Sponseller, R. A.: Global carbon dioxide efflux from rivers enhanced by high nocturnal emissions, Nat. Geosci., 14, 289–294, https://doi.org/10.1038/s41561-021-00722-3, 2021.
Guérin, F., Abril, G., Serça, D., Delon, C., Richard, S., Delmas, R., Tremblay, A., and Varfalvy, L.: Gas transfer velocities of CO2 and CH4 in a tropical reservoir and its river downstream, J. Mar. Syst., 66, 161–172, https://doi.org/10.1016/j.jmarsys.2006.03.019, 2007.
Ho, D. T., Engel, V. C., Ferrón, S., Hickman, B., Choi, J., and Harvey, J. W.: On factors influencing air-water gas exchange in emergent wetlands, J. Geophys.l Res.- Biogeo., 123, 178–192, https://doi.org/10.1002/2017JG004299, 2018.
Hope, D., Billett, M., and Cresser, M.: A review of the export of carbon in river water: fluxes and processes, Environ. Pollut., 84, 301–324, https://doi.org/10.1016/0269-7491(94)90142-2, 1994.
Hope, D., Palmer, S. M., Billett, M. F., and Dawson, J. J. J. H. P.: Variations in dissolved CO2 and CH4 in a first-order stream and catchment: an investigation of soil–stream linkages, J. Hydrol. Process., 18, 3255–3275, https://doi.org/10.1002/hyp.5657, 2004.
Hotchkiss, E., Hall Jr, R., Sponseller, R., Butman, D., Klaminder, J., Laudon, H., Rosvall, M., and Karlsson, J. J. N. G.: Sources of and processes controlling CO2 emissions change with the size of streams and rivers, Nat. Geosci., 8, 696–699, https://doi.org/10.1038/ngeo2507, 2015.
Jeffrey, L. C., Santos, I. R., Tait, D. R., Makings, U., and Maher, D. T.: Seasonal drivers of carbon dioxide dynamics in a hydrologically modified subtropical tidal river and estuary (Caboolture River, Australia), J. Geophys. Res.-Biogeo., 123, 1827–1849, https://doi.org/10.1029/2017jg004023, 2018.
Johnson, M. S., Weiler, M., Couto, E. G., Riha, S. J., and Lehmann, J.: Storm pulses of dissolved CO2 in a forested headwater Amazonian stream explored using hydrograph separation, Water Resour. Res., 43, W11201, https://doi.org/10.1029/2007WR006359, 2007.
Johnson, M. S., Lehmann, J., Riha, S. J., Krusche, A. V., Richey, J. E., Ometto, J. P. H., and Couto, E. G.: CO2 efflux from Amazonian headwater streams represents a significant fate for deep soil respiration, Geophys. Res. Lett., 35, L17401, https://doi.org/10.1029/2008GL034619, 2008.
Kalbitz, K. and Kaiser, K.: Contribution of dissolved organic matter to carbon storage in forest mineral soils, J. Plant Nutr. Soil Sci., 171, 52–60, https://doi.org/10.1002/jpln.200700043, 2008.
Lambert, T., Bouillon, S., Darchambeau, F., Morana, C., Roland, F. A. E., Descy, J.-P., and Borges, A. V.: Effects of human land use on the terrestrial and aquatic sources of fluvial organic matter in a temperate river basin (The Meuse River, Belgium), Biogeochemistry, 136, 191–211, https://doi.org/10.1007/s10533-017-0387-9, 2017.
Lauerwald, R., Laruelle, G. G., Hartmann, J., Ciais, P., and Regnier, P. A.: Spatial patterns in CO2 evasion from the global river network, Global Biogeochem. Cy., 29, 534–554, https://doi.org/10.1002/2014GB004941, 2015.
Le Coz, J., Pierrefeu, G., and Paquier, A.: Evaluation of river discharges monitored by a fixed side-looking Doppler profiler, Water Resour. Res., 44, W00D09, https://doi.org/10.1029/2008WR006967, 2008.
Le, T. P. Q., Marchand, C., Ho, C. T., Da Le, N., Duong, T. T., Lu, X., Doan, P. K., Nguyen, T. K., Nguyen, T. M. H., and Vu, D. A.: CO2 partial pressure and CO2 emission along the lower Red River (Vietnam), Biogeosciences, 15, 4799–4814, https://doi.org/10.5194/bg-15-4799-2018, 2018.
Li, S., Lu, X. X., and Bush, R. T.: CO2 partial pressure and CO2 emission in the Lower Mekong River, J. Hydrol., 504, 40–56, https://doi.org/10.1016/j.jhydrol.2013.09.024, 2013.
Li, S., Ni, M., Mao, R., and Bush, R. T.: Riverine CO2 supersaturation and outgassing in a subtropical monsoonal mountainous area (Three Gorges Reservoir Region) of China, J. Hydrol., 558, 460–469, https://doi.org/10.1016/j.jhydrol.2018.01.057, 2018.
Li, X., Xu, J., Shi, Z., and Li, R.: Response of Bacterial Metabolic Activity to the River Discharge in the Pearl River Estuary: Implication for CO2 Degassing Fluxes, Front. Microbiol., 10, 1026, https://doi.org/10.3389/fmicb.2019.01026, 2019.
Liang, B., Hu, J. T., Li, S. Y., Ye, Y. X., Liu, D. H., and Huang, J.: Carbon system simulation in the Pearl River Estuary, China: Mass fluxes and transformations, J. Geophys. Res.-Biogeo., 125, e2019JG005012, https://doi.org/10.1029/2019jg005012, 2020.
Luo, J., Li, S., Ni, M., and Zhang, J.: Large spatiotemporal shifts of CO2 partial pressure and CO2 degassing in a monsoonal headwater stream, J. Hydrol., 579, 124135, https://doi.org/10.1016/j.jhydrol.2019.124135, 2019.
Marx, A., Dusek, J., Jankovec, J., Sanda, M., Vogel, T., van Geldern, R., Hartmann, J., and Barth, J. A. C.: A review of CO2 and associated carbon dynamics in headwater streams: A global perspective, Rev. Geophys., 55, 560–585, https://doi.org/10.1002/2016rg000547, 2017.
Millero, F. J., Graham, T. B., Huang, F., Bustos-Serrano, H., and Pierrot, D.: Dissociation constants of carbonic acid in seawater as a function of salinity and temperature, Mar. Chem., 100, 80–94, https://doi.org/10.1016/j.marchem.2005.12.001, 2006.
Moramarco, T., Saltalippi, C., and Singh, V. P.: Estimation of Mean Velocity in Natural Channels Based on Chiu's Velocity Distribution Equation, J. Hydrol. Eng., 9, 42–50, https://doi.org/10.1061/(ASCE)1084-0699(2004)9:1(42), 2004.
Müller-Dum, D., Warneke, T., Rixen, T., Müller, M., Baum, A., Christodoulou, A., Oakes, J., Eyre, B. D., and Notholt, J.: Impact of peatlands on carbon dioxide (CO2) emissions from the Rajang River and Estuary, Malaysia, Biogeosciences, 16, 17–32, https://doi.org/10.5194/bg-16-17-2019, 2019.
Ni, M., Li, S., Luo, J., and Lu, X.: CO2 partial pressure and CO2 degassing in the Daning River of the upper Yangtze River, China, J. Hydrol., 569, 483–494, https://doi.org/10.1016/j.jhydrol.2018.12.017, 2019.
Ran, L., Lu, X. X., Yang, H., Li, L., Yu, R., Sun, H., and Han, J.: CO2 outgassing from the Yellow River network and its implications for riverine carbon cycle, J. Geophys. Res.-Biogeo., 120, 1334–1347, https://doi.org/10.1002/2015jg002982, 2015.
Ran, L., Li, L., Tian, M., Yang, X., Yu, R., Zhao, J., Wang, L., and Lu, X.: Riverine CO2 emissions in the Wuding River catchment on the Loess Plateau: Environmental controls and dam impoundment impact, J. Geophys. Res.-Biogeo., 122, 1439–1455, https://doi.org/10.1002/2016JG003713, 2017a.
Ran, L., Lu, X. X., and Liu, S.: Dynamics of riverine CO2 in the Yangtze River fluvial network and their implications for carbon evasion, Biogeosciences, 14, 2183–2198, https://doi.org/10.5194/bg-14-2183-2017, 2017b.
Ran, L., Lu, X., Fang, N., and Yang, X.: Effective soil erosion control represents a significant net carbon sequestration, Sci. Rep., 8, 12018, https://doi.org/10.1038/s41598-018-30497-4, 2018.
Ran, Y., Li, X., Lu, L., and Li, Z.: Large-scale land cover mapping with the integration of multi-source information based on the Dempster–Shafer theory, Int. J. Geogr. Inf. Sci., 26, 169–191, doi10.1080/13658816.2011.577745, 2012.
Rasera, M. d. F. F., Krusche, A. V., Richey, J. E., Ballester, M. V., and Victoria, R. L.: Spatial and temporal variability of pCO2 and CO2 efflux in seven Amazonian Rivers, Biogeochemistry, 116, 241–259, https://doi.org/10.1007/s10533-013-9854-0, 2013.
Raymond, P. A., Zappa, C. J., Butman, D., Bott, T. L., Potter, J., Mulholland, P., Laursen, A. E., McDowell, W. H., and Newbold, D.: Scaling the gas transfer velocity and hydraulic geometry in streams and small rivers, Limnol. Oceanogr.-Fluid. Environ., 2, 41–53, https://doi.org/10.1215/21573689-1597669, 2012.
Raymond, P. A., Hartmann, J., Lauerwald, R., Sobek, S., McDonald, C., Hoover, M., Butman, D., Striegl, R., Mayorga, E., and Humborg, C.: Global carbon dioxide emissions from inland waters, Nature, 503, 355–359, https://doi.org/10.1038/nature12760, 2013.
Reiman, J. H. and Xu, Y. J.: Diel Variability of pCO2 and CO2 Outgassing from the Lower Mississippi River: Implications for Riverine CO2 Outgassing Estimation, Water, 11, 43, https://doi.org/10.3390/w11010043, 2019a.
Reiman, J. H. and Xu, Y. J.: Dissolved carbon export and CO2 outgassing from the lower Mississippi River – Implications of future river carbon fluxes, J. Hydrol., 578, 124093, https://doi.org/10.1016/j.jhydrol.2019.124093, 2019b.
Rocher-Ros, G., Sponseller, R. A., Lidberg, W., Mörth, C. M., and Giesler, R.: Landscape process domains drive patterns of CO2 evasion from river networks, Limnol. Oceanogr. Lett., 4, 87–95, https://doi.org/10.1002/lol2.10108, 2019.
Sawakuchi, H. O., Neu, V., Ward, N. D., Barros, M. d. L. C., Valerio, A. M., Gagne-Maynard, W., Cunha, A. C., Less, D. F. S., Diniz, J. E. M., Brito, D. C., Krusche, A. V., and Richey, J. E.: Carbon dioxide emissions along the lower Amazon River, Front. Mar. Sci., 4, 76, https://doi.org/10.3389/fmars.2017.00076, 2017.
Stets, E. G., Butman, D., McDonald, C. P., Stackpoole, S. M., DeGrandpre, M. D., and Striegl, R. G.: Carbonate buffering and metabolic controls on carbon dioxide in rivers, Global Biogeochem. Cy., 31, 663–677, https://doi.org/10.1002/2016gb005578, 2017.
Tao, Z., Gao, Q., Wang, Z., Zhang, S., Xie, C., Lin, P., Ruan, X., Li, S., and Mao, H.: Estimation of carbon sinks in chemical weathering in a humid subtropical mountainous basin, Chin. Sci. Bull., 56, 3774–3782, https://doi.org/10.1007/s11434-010-4318-6, 2011.
Teodoru, C. R., Nyoni, F. C., Borges, A. V., Darchambeau, F., Nyambe, I., and Bouillon, S.: Dynamics of greenhouse gases (CO2, CH4, N2O) along the Zambezi River and major tributaries, and their importance in the riverine carbon budget, Biogeosciences, 12, 2431–2453, https://doi.org/10.5194/bg-12-2431-2015, 2015.
Tian, M., Yang, X., Ran, L., Su, Y., Li, L., Yu, R., Hu, H., and Lu, X. X.: Impact of land cover types on riverine CO2 outgassing in the Yellow River source region, Water, 11, 2243, https://doi.org/10.3390/w11112243, 2019.
Wanninkhof, R.: Relationship between wind speed and gas exchange over the ocean, J. Geophys. Res.-Ocean., 97, 7373–7382, https://doi.org/10.1029/92JC00188, 1992.
Weiss, R. F.: Carbon dioxide in water and seawater: the solubility of a non-ideal gas, Mar. Chem., 2, 203–215, https://doi.org/10.1016/0304-4203(74)90015-2, 1974.
Xuan, Y., Cao, Y., Tang, C., and Li, M.: Changes in dissolved inorganic carbon in river water due to urbanization revealed by hydrochemistry and carbon isotope in the Pearl River Delta, China, Environ. Sci. Pollut. Res., 27, 24542–24557, https://doi.org/10.1007/s11356-020-08454-4, 2020.
Yao, G., Gao, Q., Wang, Z., Huang, X., He, T., Zhang, Y., Jiao, S., and Ding, J.: Dynamics of CO2 partial pressure and CO2 outgassing in the lower reaches of the Xijiang River, a subtropical monsoon river in China, Sci. Total Environ., 376, 255–266, https://doi.org/10.1016/j.scitotenv.2007.01.080, 2007.
Zhang, L., Qin, X., Liu, P., Huang, Q., Lan, F., and Ji, H.: Estimation of carbon sink fluxes in the Pearl River basin (China) based on a water–rock–gas–organism interaction model, Environ. Earth Sci., 74, 945–952, https://doi.org/10.1007/s12665-014-3788-2, 2015.
Zhang, S., Lu, X. X., Higgitt, D. L., Chen, C.-T. A., Han, J., and Sun, H.: Recent changes of water discharge and sediment load in the Zhujiang (Pearl River) Basin, China, Glob. Planet. Change, 60, 365–380, https://doi.org/10.1016/j.gloplacha.2007.04.003, 2008.
Zhang, T., Li, J., Pu, J., and Yuan, D.: Carbon dioxide exchanges and their controlling factors in Guijiang River, SW China, J. Hydrol., 578, 124073, https://doi.org/10.1016/j.jhydrol.2019.124073, 2019.
Zhang, W., Li, H., Xiao, Q., and Li, X.: Urban rivers are hotspots of riverine greenhouse gas (N2O, CH4, CO2) emissions in the mixed-landscape chaohu lake basin, Water Res., 189, 116624, https://doi.org/10.1016/j.watres.2020.116624, 2021.