the Creative Commons Attribution 4.0 License.
the Creative Commons Attribution 4.0 License.
 | 27 Jan 2021
Estimating maximum fine-fraction organic carbon in UK grasslands
Kirsty C. Paterson
Joanna M. Cloy
Robert M. Rees
Elizabeth M. Baggs
Hugh Martineau
Dario Fornara
Andrew J. Macdonald
Sarah Buckingham
Soil organic carbon (SOC) sequestration across agroecosystems worldwide can contribute to mitigate the effects of climate change by reducing levels of atmospheric CO2. Stabilisation of organic carbon (OC) in the fine soil fraction (< 20 µm) is considered an important long-term store of SOC, and the saturation deficit (difference between measured OC and estimated maximum OC in the fine fraction) is frequently used to assess SOC sequestration potential following the linear regression equation developed by Hassink (1997). However, this approach is often taken without any assessment of the fit of the equation to the soils being studied. The statistical limitations of linear regression have previously been noted, giving rise to the proposed use of boundary line (BL) analysis and quantile regression (QR) to provide more robust estimates of maximum SOC stabilisation. The objectives of this work were to assess the suitability of the Hassink (1997) equation to estimate maximum fine-fraction OC in UK grassland soils of varying sward ages and to evaluate the linear regression, boundary line and quantile regression methods to estimate maximum fine-fraction OC. A chronosequence of 10 grasslands was sampled, in order to assess the relationship between sward age (time since the last reseeding event) and the measured and predicted maximum fine-fraction OC. Significantly different regression equations show that the Hassink (1997) equation does not accurately reflect maximum fine-fraction OC in UK grasslands when determined using the proportion of the fine soil fraction (< 20 µm, %) and measured fine-fraction OC (g C per kg soil). The QR estimate of maximum SOC stabilisation was almost double that of the linear regression and BL analysis (0.89 ± 0.074, 0.43 ± 0.017 and 0.57 ± 0.052 g C per kg soil, respectively). Sward age had an inconsistent effect on the measured variables and potential maximum fine-fraction OC. Fine-fraction OC across the grasslands made up 4.5 % to 55.9 % of total SOC, implying that there may be either high potential for additional C sequestration in the fine fraction of these soils or that protection in aggregates is predominant in these grassland soils. This work highlights the need to ensure that methods used to predict maximum fine-fraction OC reflect the soil in situ, resulting in more accurate assessments of carbon sequestration potential.
- Article
(1010 KB) - Full-text XML
- BibTeX
- EndNote


Carbon (C) sequestration in soils offers a significant opportunity to remove CO2 from the atmosphere and store it in long-lived C pools (Lal, 2004; Powlson et al., 2011), with co-benefits for soil structure and functioning (Lorenz and Lal, 2018; Smith, 2012; Soussana et al., 2004). To utilise soils as a CO2 drawdown mechanism, accurate estimates of their storage capability are required. With respect to soil organic carbon (SOC) sequestration, organic carbon (OC) stabilised via adsorption to mineral surfaces in the fine soil fraction (< 20 µm) is often regarded as the most important due to its longer residence time (Baldock and Skjemstad, 2000; Six et al., 2002). There is empirical evidence that there is an upper protective capacity limit or saturation point of the mineral-stabilised OC pool (Six et al., 2002; Stewart et al., 2007). Potential SOC sequestration (or saturation deficit) can be estimated by subtracting the current fine-fraction OC from the estimated maximum fine-fraction OC (Angers et al., 2011).
Hassink (1997) compared pairs of Dutch arable and grassland soils and found that while soil bulk SOC contents significantly differed among soils, fine-fraction OC did not. These findings led to the idea that the saturation point of the fine soil fraction could be estimated by linear regression using the mass proportion of the fine fraction in a soil sample (%) and the current fine-fraction OC (g C per kg soil). Several iterations of the concept have been proposed to overcome the limitations of linear regression. For example, boundary line analysis uses a defined upper or lower subset of a data set to estimate the boundary line, when a limiting response to one or more independent variables along a boundary is supported (Lark and Milne, 2016; Schmidt et al., 2000). Using the upper 90th percentile of a data set, boundary line analysis overcomes the limitation of linear regression, depicting the mean response to the independent variable (Feng et al., 2013; Shatar and Mcbratney, 2004), which is thought to cause an underestimation of sequestration potential. Quantile regression estimates the response of a specific quartile using the entire data set. It also makes no assumptions regarding homogeneity of variance, thus increasing the robustness of the estimated maximum fine-fraction OC. In quantile regression sample size is not reduced as in boundary line analysis (Beare et al., 2014; Cade and Noon, 2003). Using a forced zero intercept overcomes the contradiction of a positive intercept, indicating the presence of fine-fraction OC without any fine soil fraction (Beare et al., 2014; Feng et al., 2013; Liang et al., 2009). To our knowledge no comparisons between the equation developed by Hassink (1997) and one generated in the same way with a different data set have been done within the UK. This type of assessment would help to determine the suitability of the Hassink (1997) linear regression equation to predict maximum fine-fraction OC in UK soils. Without this, carbon sequestration potentials may be both over- and underestimated.
In the UK, human-managed grasslands are the dominant land use, covering 36 % of the land area (Ward et al., 2016). Managed grasslands are planted and maintained to increase agricultural productivity through fertiliser and liming applications and the reseeding of swards. The high levels of disturbance associated with reseeding events by mould board ploughing and harrowing in particular, resulting in changes in soil structure, nutrient cycling and SOC mineralisation (Carolan and Fornara, 2016; Drewer et al., 2017; Soussana et al., 2004). Organo-mineral associations form the basis of microaggregates (Baldock and Skjemstad, 2000). The destruction of aggregates makes the organic carbon protected within the aggregates more accessible for mineralisation by the soil microbial community. This may result in the increased mineralisation of existing SOC, known as the priming effect (Kuzyakov et al., 2000) The long-term effect of such a reseeding event on SOC dynamics is understudied; it is therefore important to understand how disturbance might affect OC in the fine fraction and the SOC sequestration ability of managed grasslands.
The objectives of this study were (i) to assess the suitability of the Hassink (1997) equation to estimate maximum fine-fraction OC in UK grassland soils; (ii) to evaluate the linear regression, boundary line and quantile regression methods to estimate maximum fine-fraction OC; and (iii) to explore the relationship between sward age (time since the last reseeding event) and current and predicted maximum fine-fraction OC. We hypothesised that (i) the linear regression equation developed using UK grassland soils would be significantly different to that of Hassink (1997) and that (ii) grasslands with an older sward age would have a greater proportion of total SOC stabilised in the fine fraction (< 20 µm) and a lower sequestration potential.
Table 1Summary of UK grassland site characteristics.
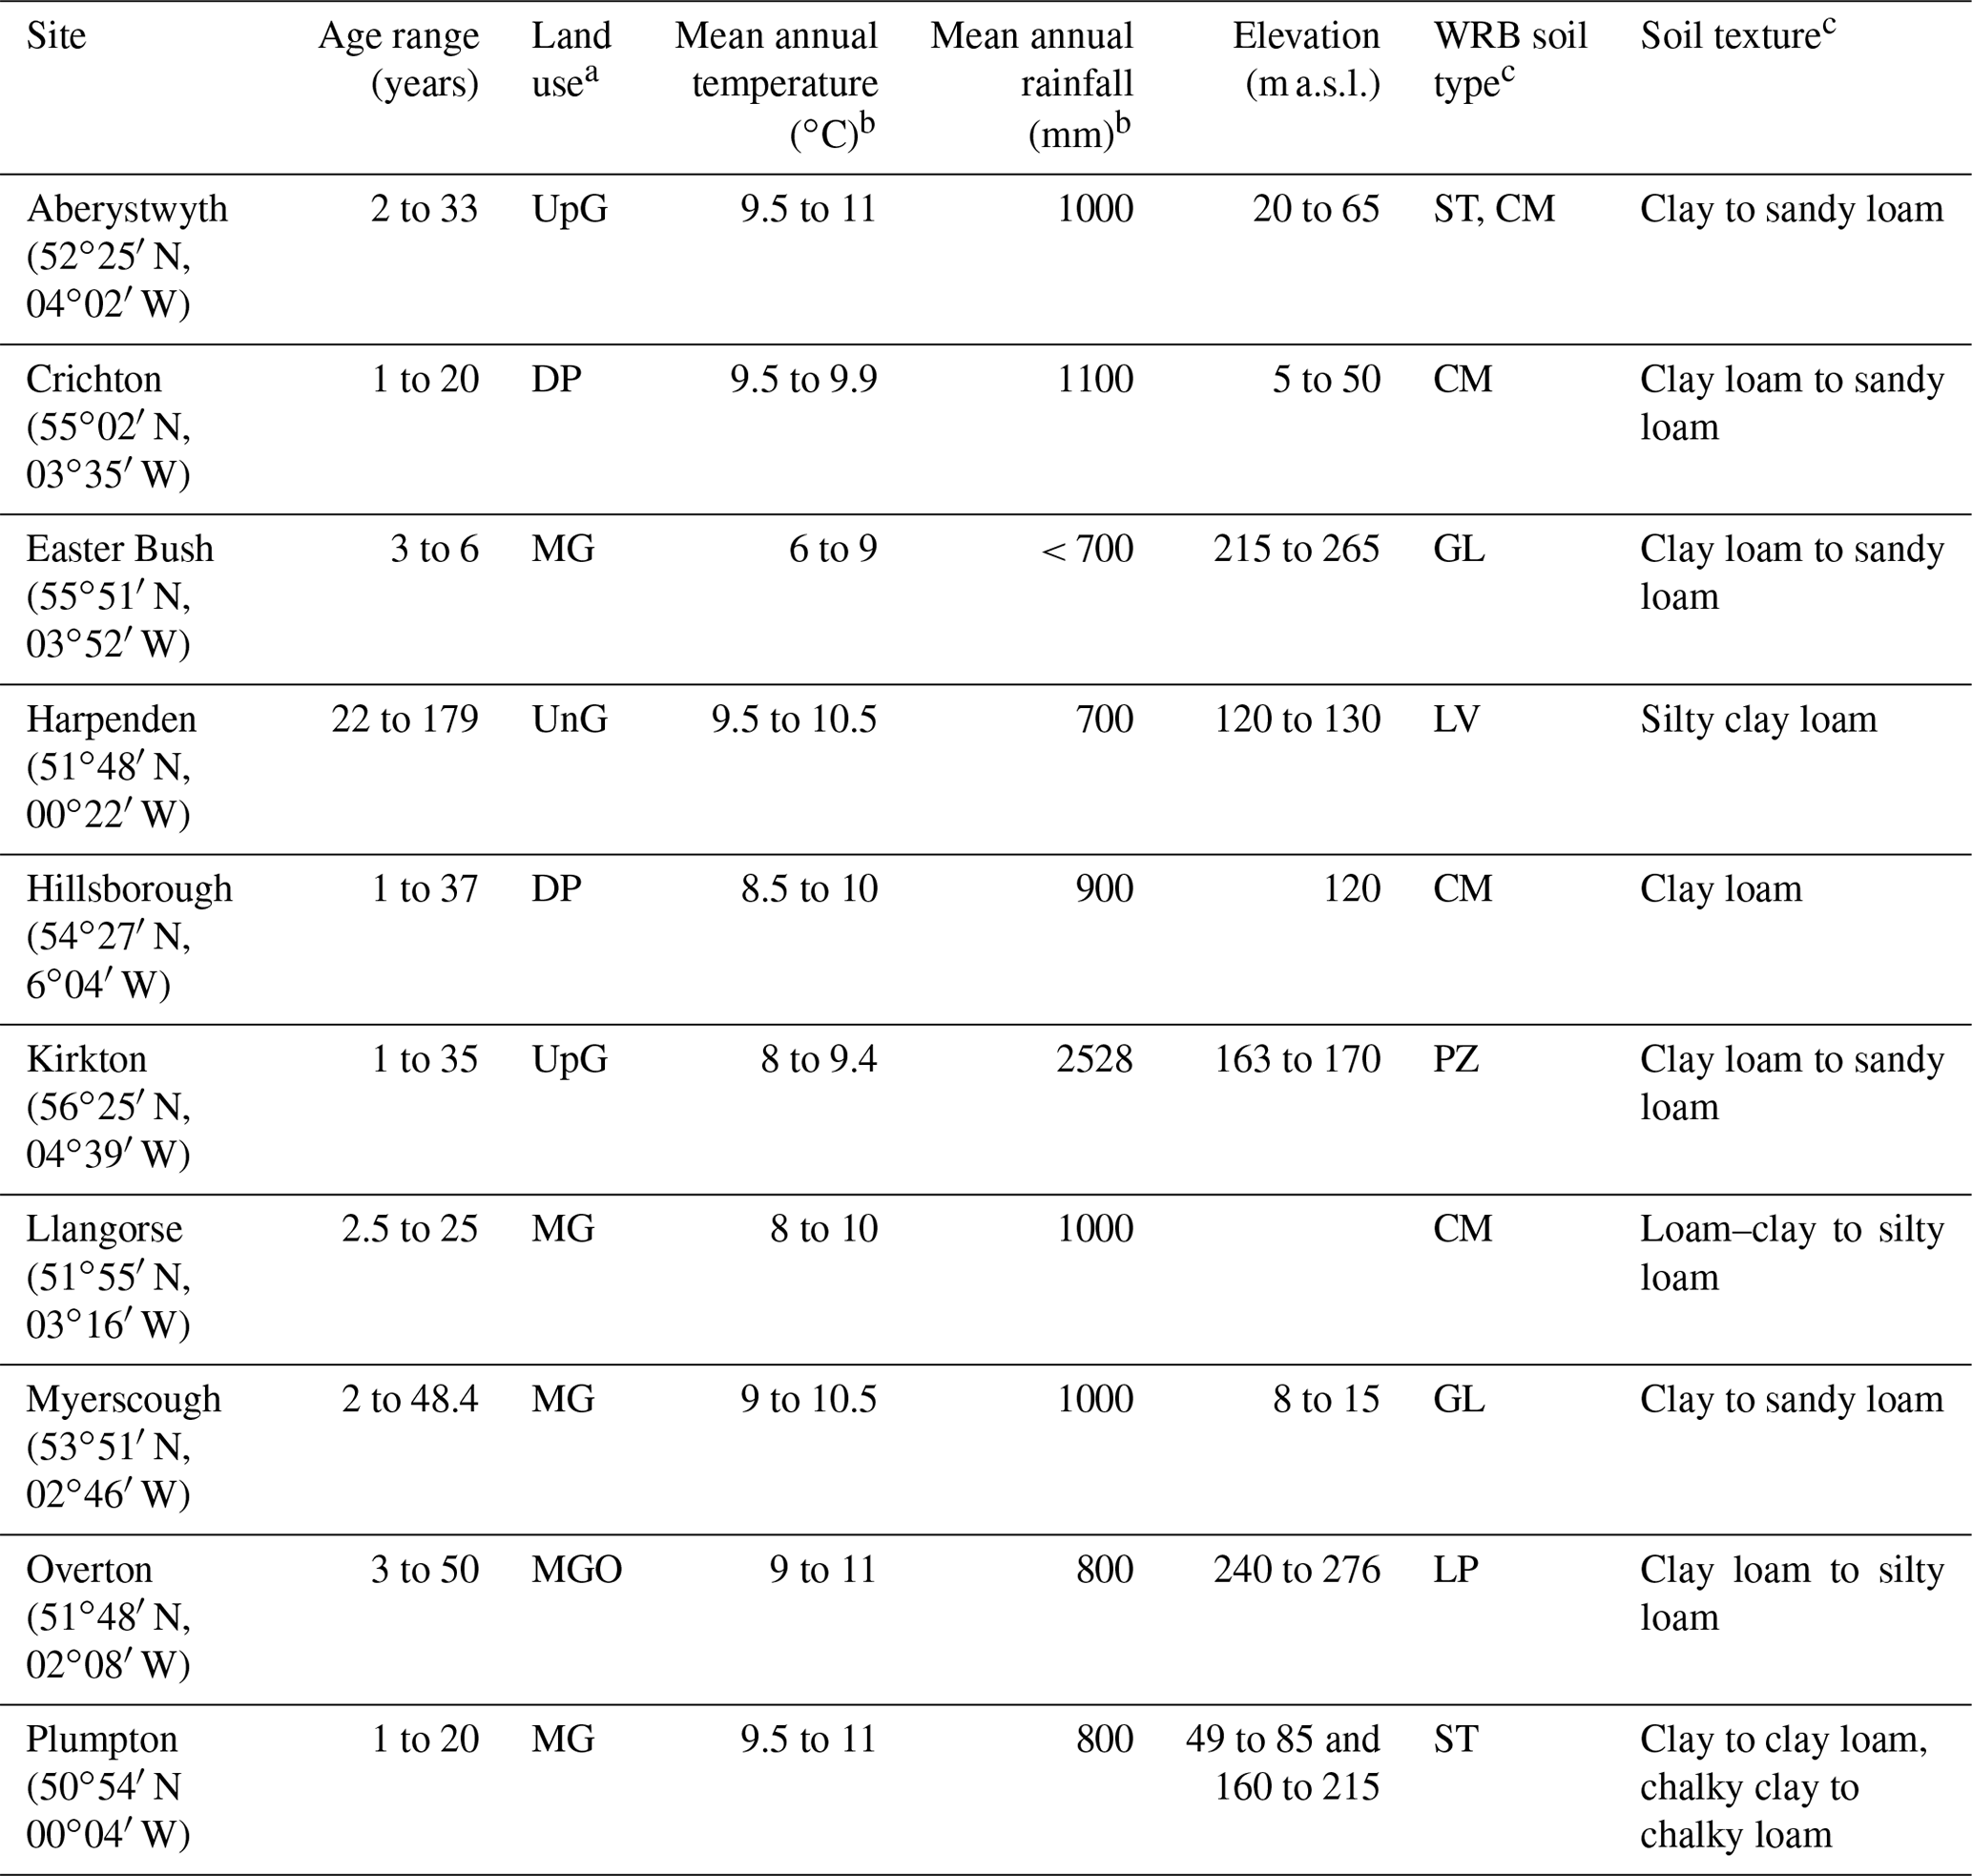
a Land use: dairy pasture (DP), mixed grazing (MG), mixed grazing organic (MGO), upland grazing (UpG), ungrazed (UnG). b Mean annual temperature and rainfall estimated from Met Office climatic-region summaries, averaged over 1981 to 2010. c World Reference Base (WRB) soil type: Stagnosols (ST), Cambisols (CM), Gleysols (GL), Luvisols (LV), Podzols (PZ), Leptosols (LP). Soil type and texture determined from GPS locations and the UK Soil Observatory Map Viewer.
2.1 Site description and sampling
Ten grassland chronosequences covering a wide range of soil types, land use and climatic conditions were identified across the UK in 2016. The sites included the range of agricultural activity associated with UK grasslands (upland grazing, dairy and mixed grazing), variations in soil type (organo-mineral, mineral and chalk) and the majority of UK climatic zones (Table 1). At each location, five to eight individual fields of different sward age (represented by years since a ploughing and reseeding event), ranging from 1 to 179 years, were identified for sampling. In each field, areas were avoided which had different applications of manure, soil types or topography, headlands, areas near gates; where lime or manure had previously been dumped; or where livestock congregate. Two replicate soil cores were collected to a depth of 30 cm using a soil auger with a 2.5 cm diameter steel core and bulked to give a single composite sample. This was repeated 10 times in each field at regular intervals in a “W” shape across the field totalling 10 replicate samples per field per site. Intact soil cores for determining bulk densities were collected at three locations in each field at two depths (10 to 15 cm and 20 to 25 cm) using intact rings (7.5 cm diameter and 5 cm height). Replicate samples were sieved to 2 mm, and fresh subsamples were used to determine soil pH in water. Remaining sieved soils were dried at 40 ∘C and ball-milled prior to determination of total C and N contents (% by mass) using a Flash 2000 Elemental Analyser. Intact soils were dried at 107 ∘C and weighed to calculate dry bulk densities. Any stones were removed.
2.2 Soil fractionation
The fine fraction (< 20 µm) of the soil was separated using a combined ultrasonic dispersion and sedimentation method adapted from Hassink (1997). Briefly, 20 g of dried sieved soil was soaked in 100 mL of deionised water for 24 h. The suspension was then sonicated with a Microson XL2000 Ultrasonic Processor for 20 min at 20 W in 50 mL centrifuge tubes, surrounded by ice to prevent overheating. The separated samples were recombined in 150 mL tubes and shaken end over end to disperse the soil water suspension. Sedimentation times were determined using a table applying Stokes' law for 20 µm particles, a particle density of 2.65 g cm−3 and sedimentation depth of 5 cm at temperatures between 20 and 35 ∘C (Jackson, 2005). After the appropriate sedimentation time, the fine fraction was siphoned off the soil suspension. The fine fraction was dried for 24 h at 107 ∘C and ball-milled prior to total C and N analysis (% by mass) using a Flash 2000 Elemental Analyser to determine the current OC content of the fine fraction. At each site, a minimum of three fields varying in age (young, intermediate and old at that location) were selected, and 3 of the 10 replicate field samples were selected at random for fractionation.
Hydrochloric acid (HCl) fumigation was used to remove carbonates from the Plumpton samples. Ball-milled samples, in silver capsules, were moistened with deionised water (1:4 sample : water ratio) to aid the efficiency of carbonate removal by HCl fumes (Dhillon et al., 2015). The samples were placed in a vacuum desiccator with a beaker of 100 mL of 12 M HCl for 24 h and subsequently dried in a ventilated oven at 60 ∘C for 16 h to remove excess moisture and HCl (Dhillon et al., 2015). Total C and N contents were determined as outlined above.
2.3 Statistical analyses
All statistical analyses were carried out using R software version 3.5.3 (Team, 2019). Significant differences were determined by ANOVA's and post hoc Tukey's tests (α=0.05). Where assumptions of normality and variance were not satisfied by testing (Shapiro–Wilk test and Levene's test), significant differences were identified using the Kruskal test and post hoc Dunn's test. A Kendall's tau (τ) correlation matrix was produced using the “corrplot” package (Wei and Simko, 2017).
2.3.1 Regression analyses
Linear regression was used to predict maximum fine-fraction OC, with the mass proportion of the fine fraction (< 20 µm, %) in a sample and the measured OC of the fine fraction (g C per kg soil) as the independent and dependent variables, respectively. Regression equations were developed for the combined UK data set and the individual sites. Linear regression with a forced zero intercept was used with data from this study and the data published in Hassink (1997).
Boundary line analyses were performed as an alternative to linear regression, both with and without a forced zero intercept to predict maximum fine-fraction OC for all UK sites. The data were organised by mass proportion of the fine fraction (%) and divided into subgroups at 5 %, 10 % and 15 % intervals. The 10 % interval reflects the method of Feng et al. (2013), whilst the 5 % and 15 % intervals were used to assess the effect of the interval on estimation of maximum fine-fraction OC. The groups were then ordered by measured fine-fraction OC (g C per kg soil), and the values in the 90th percentile were used to plot the boundary line. Boundary line analysis was not used for individual sites, as it resulted in too few data points. Quantile regression analysis was performed in RStudio using the “quantreg” package (Koenker, 2019), for the 90th and median percentiles (τ=0.90 and τ=0.50). Forcing the intercept to zero overcomes the paradox of having C stabilised as mineral-associated organic carbon (MAOC) without any fine fraction in the soil. Significant differences between slopes were identified using the “lsmeans” package (Lenth, 2016), followed by post hoc Tukey's tests (α=0.05).
2.3.2 Carbon saturation ratio
The carbon saturation ratio was determined to identify the degree of saturation across the sites. The carbon saturation ratio was calculated by dividing the current fine-fraction OC by the estimated maximum fine-fraction OC content. Values <1 were deemed undersaturated; 1 is at saturation; and values >1 were deemed oversaturated.
Table 2Correlation matrix of Kendall's tau (τ) coefficients for bulk and fine-fraction (< 20 µm) soil properties, sward age and known environmental parameters.
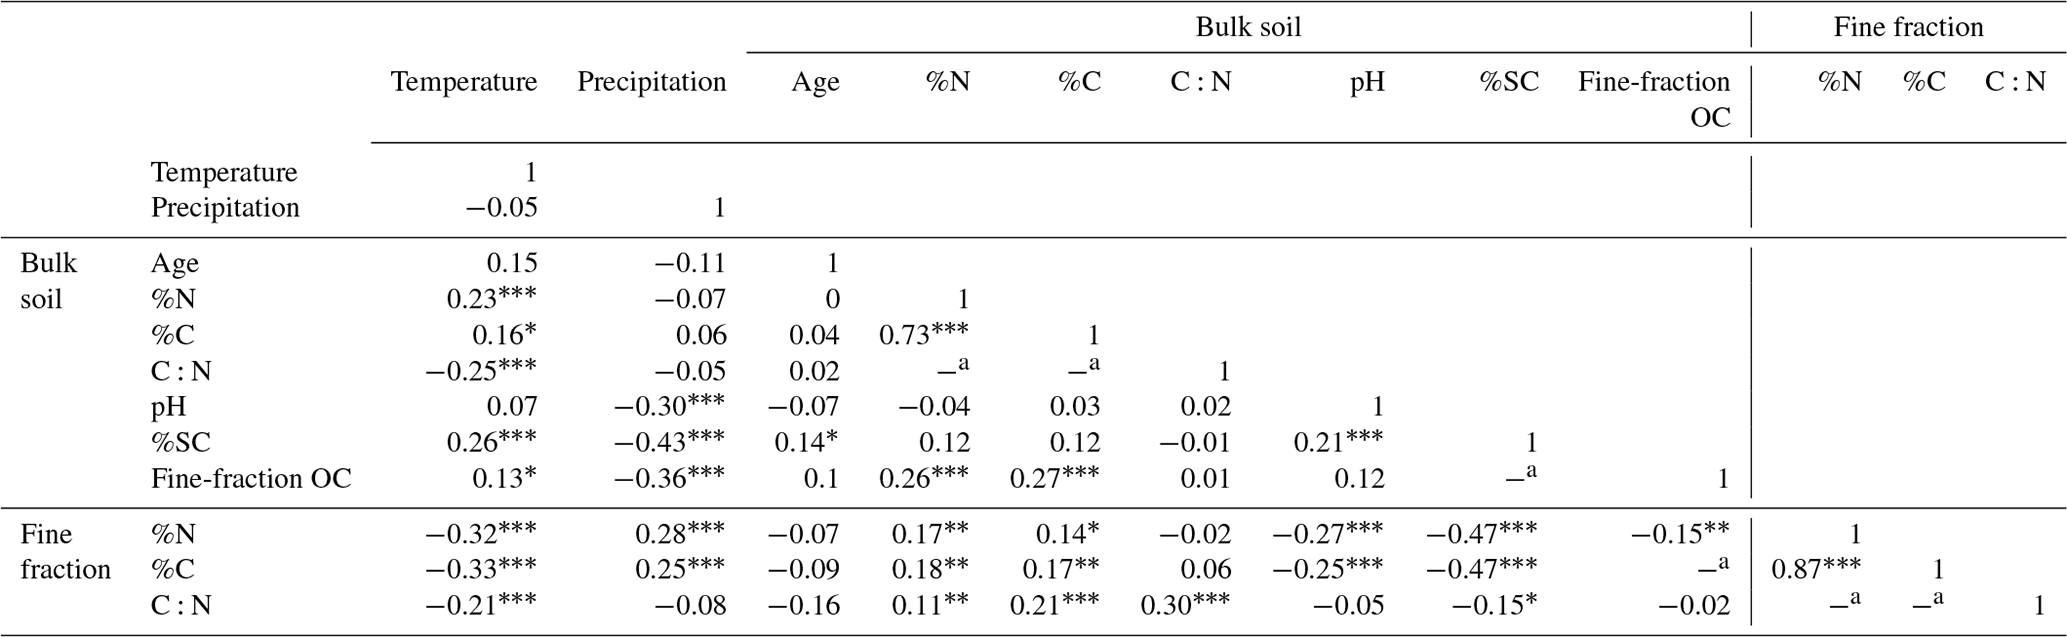
a No correlation calculated as one variable used to calculate the
other. Age: years since the last reseeding event. Temperature: median value from the mean
annual temperature range (∘C).
Precipitation: mean annual rainfall (mm).
%SC: mass proportion of the fine fraction in a sample (%). Fine-fraction
OC: measured fine-fraction OC (g C per kg bulk soil).
Level of significance:
, , .

Figure 1Measured total SOC (g C per kg soil) (a), total fine-fraction organic carbon (g C per kg soil) (b), mass proportion of the fine fraction (< 20 µm, %) (c), relative proportion of measured fine-fraction organic carbon of the total SOC content of the bulk soil (d), fine-fraction C:N ratio (e) and bulk-soil C:N ratio (f) for each of the grassland sites: Aberystwyth (A), Crichton (C), Easter Bush (E), Hillsborough (H), Harpenden (Ha), Kirkton (K), Llangorse (L), Myerscough (M), Overton (O) and Plumpton (P). Boxes represent the 25th and 75th percentile, with lines showing the median value. Whiskers show the lowest and highest values with outliers indicated as crosses (> 1.5 times the interquartile range). Lettering indicates significant differences between soils (p<0.05).
3.1 Current C concentrations
The measured total SOC and fine-fraction OC concentrations varied within the grassland sites (Fig. 1). Total SOC ranged from 8.2 to 85.8 g C per kg soil, with a median of 32.7 g C per kg soil. Hillsborough, Overton and Plumpton had significantly higher total SOC, whilst Harpenden and Llangorse had the lowest total SOC (p<0.05) (Fig. 1). The measured fine-fraction OC ranged from 1.4 to 20.9 g C per kg soil, with a median of 6.2 g C per kg soil. Overton had the highest total fine-fraction OC (p<0.05) and was the only organically managed site (Fig. 1). The proportion of OC stabilised in the fine fraction (< 20 µm) had high variability across the UK sites accounting for 4.5 % to 50.1 % of total SOC with a median of 17.5 %. The proportion of total SOC stabilised in the fine fraction (< 20 µm) and the proportion of the fine fraction in a sample did not significantly differ in Harpenden and Overton. However they have significantly different measured fine-fraction OC contents (g C per kg soil) (p<0.05), indicating different saturation potentials (Fig. 1). The soil C:N ratio was positively correlated with the fine-fraction C:N ratio (0.30, p<0.0001; Table 2); however there was no relationship between the bulk-soil C:N ratio and proportion of the fine fraction (data not shown). The fine-fraction and bulk-soil C:N ratios were significantly different between the sites (Fig. 1). The mean value of the fine fraction showed little deviation at 9.84 ± 1.00 (mean ± standard deviation). Full details of all the measured properties of the bulk and fine fraction per field are presented in Table A1 in the Appendix.
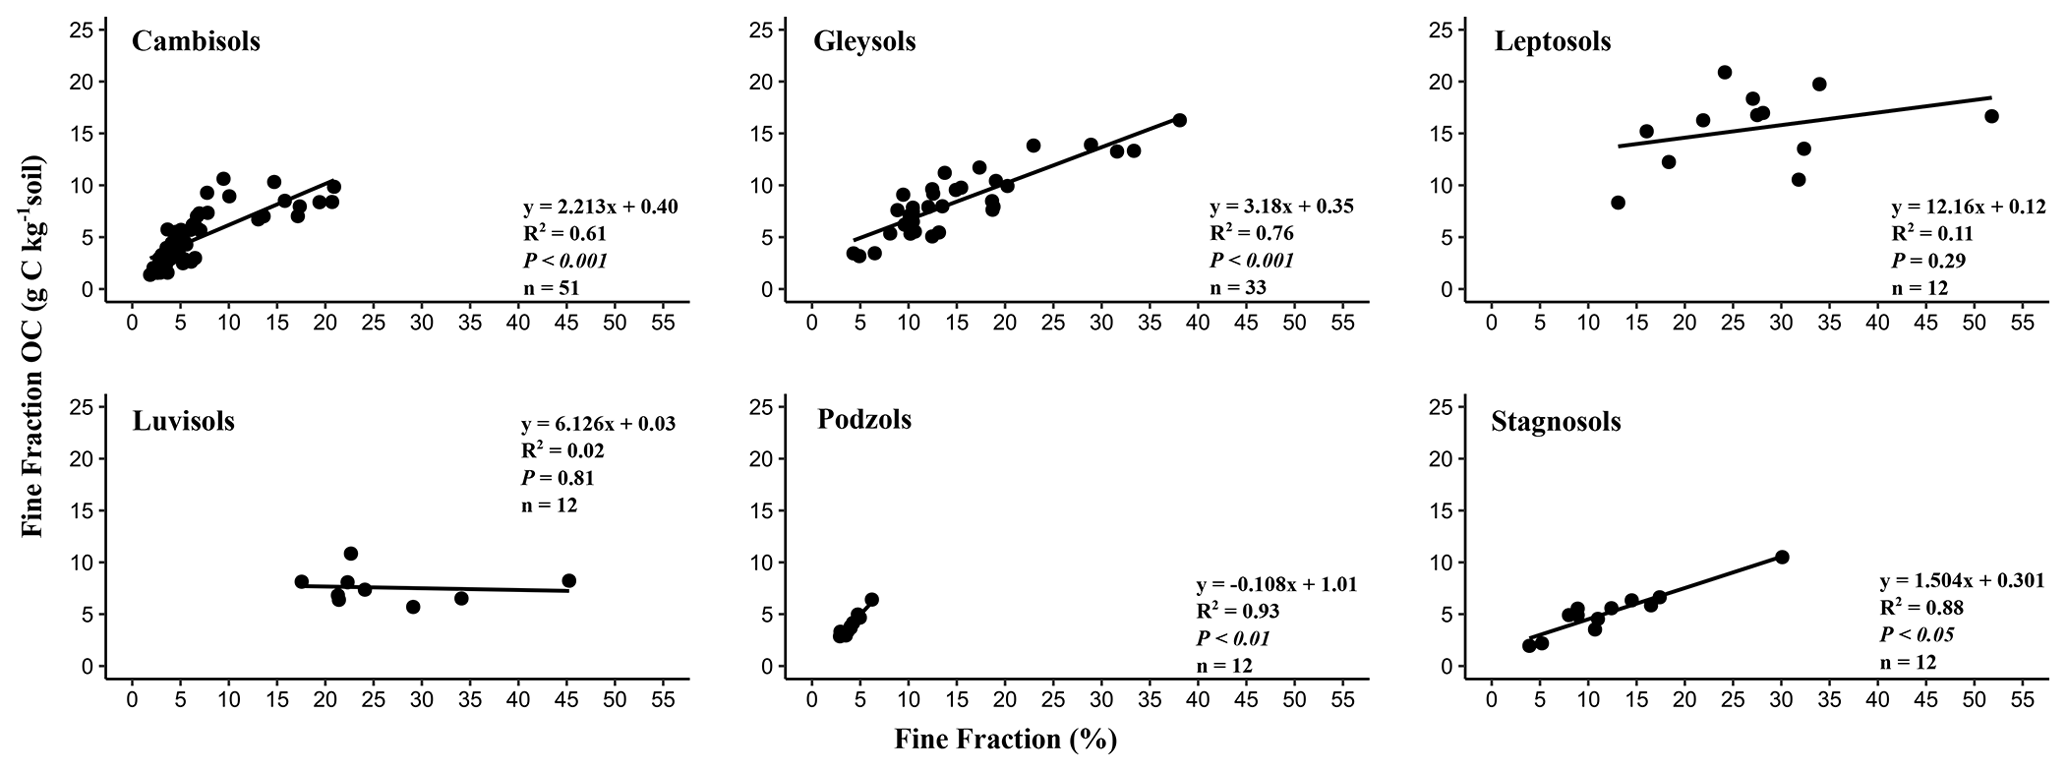
Figure 2Relationships between mass proportion of the fine fraction (%) and fine-fraction organic carbon (g C per kg soil) in the soil types used in this study.
The significance of correlations between the measured soil properties, time since reseeding and known environmental factors were analysed. The matrix of Kendall's tau (τ) correlation coefficients in Table 2 revealed that measured fine-fraction OC was positively correlated with median annual temperature (τ=0.13, p<0.05), %N (τ=0.26, p<0.0001) and %C (τ=0.27, p<0.0001) in the bulk soil and negatively correlated with mean annual rainfall (, p<0.0001) and %N (, p<0.05) in the fine fraction. The mass proportion of the fine fraction and measured fine-fraction OC (g C per kg soil) were positively correlated in Cambisols (R2=0.61, p<0.05), Gleysols (R2=0.76, p<0.05), Podzols (R2=0.93, p<0.05) and Stagnosols (R2=0.88, p<0.05) (Fig. 2). However, the proportion of total SOC stabilised in the fine fraction (< 20 µm) was greatest in Luvisols (p<0.05) (Fig. 3).
Table 3Analysis coefficients for the estimation of maximum fine-fraction organic carbon by linear regression (LR), linear regression with a forced zero intercept (LR_0), boundary line (BL) and quantile regression (QR). Lettering indicates slopes that were significantly different within a method (p<0.05).
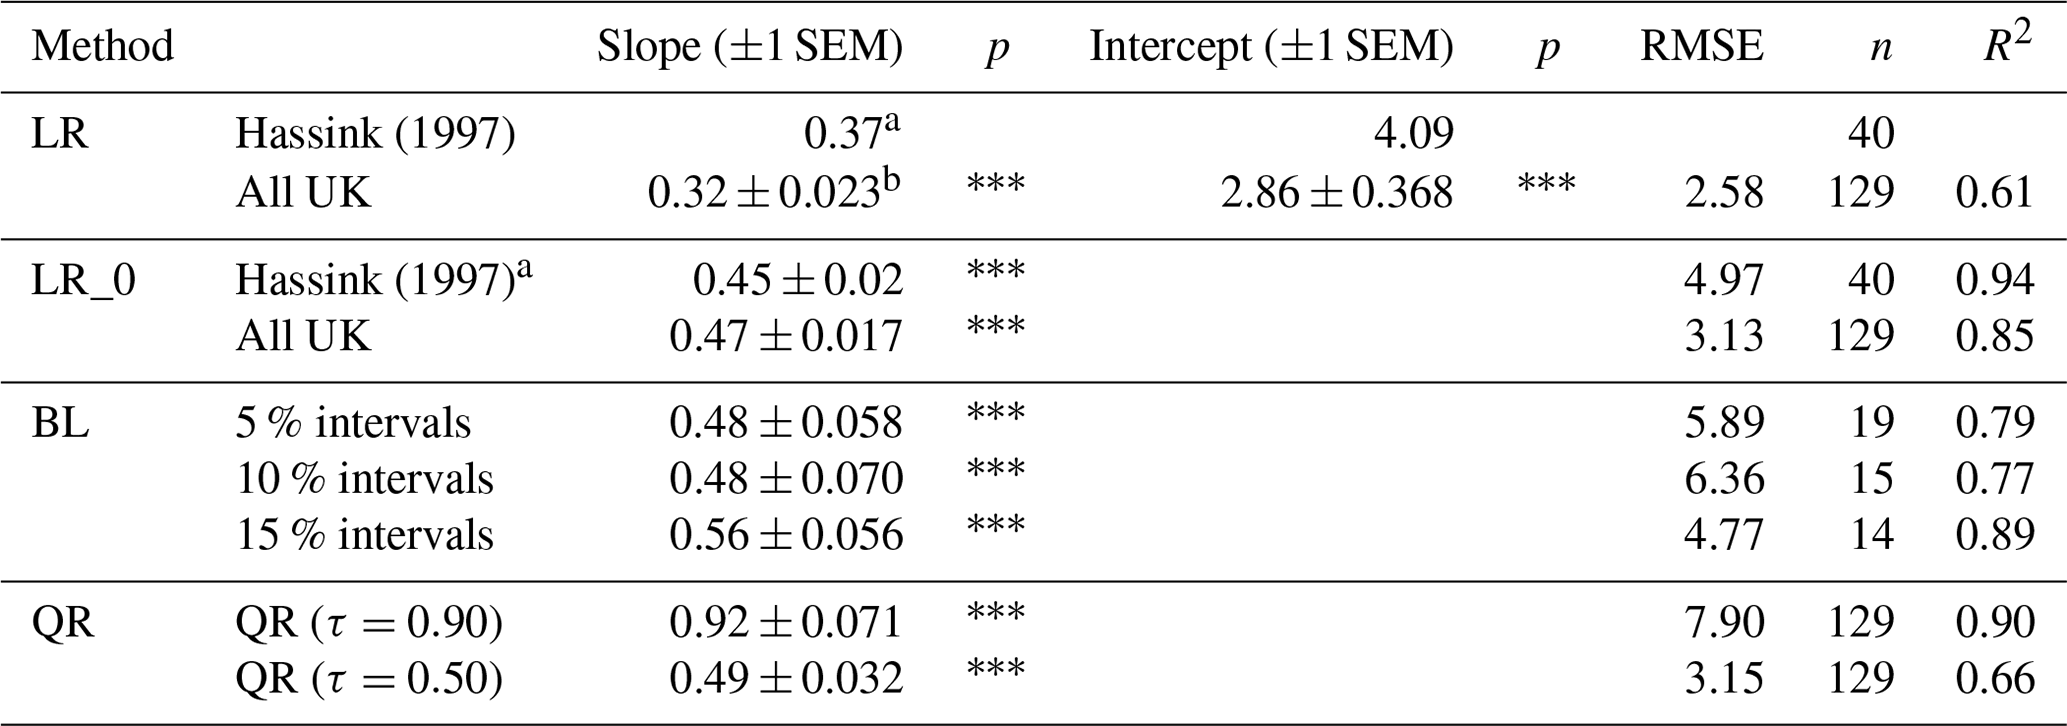
SEM: standard error of the mean. RMSE: root mean square error. Level of significance: . a Data extracted from Hassink (1997) used to generate slope value with a forced zero intercept.
3.2 Estimated maximum fine-fraction organic carbon
The slope generated from the UK data used to estimate maximum fine-fraction OC (Table 3) was significantly different (p<0.05) to the slope reported in Hassink (1997). There was no significant difference between the slopes generated from the UK data and the data from Hassink (1997) when estimated by linear regression with a forced zero intercept. Significantly, different (p<0.05) slopes were found between the individual UK sites, owing to the range in the proportion of the fine fraction within each sample, from 1.85 % to 51.8 % (Tables A3 and A4).
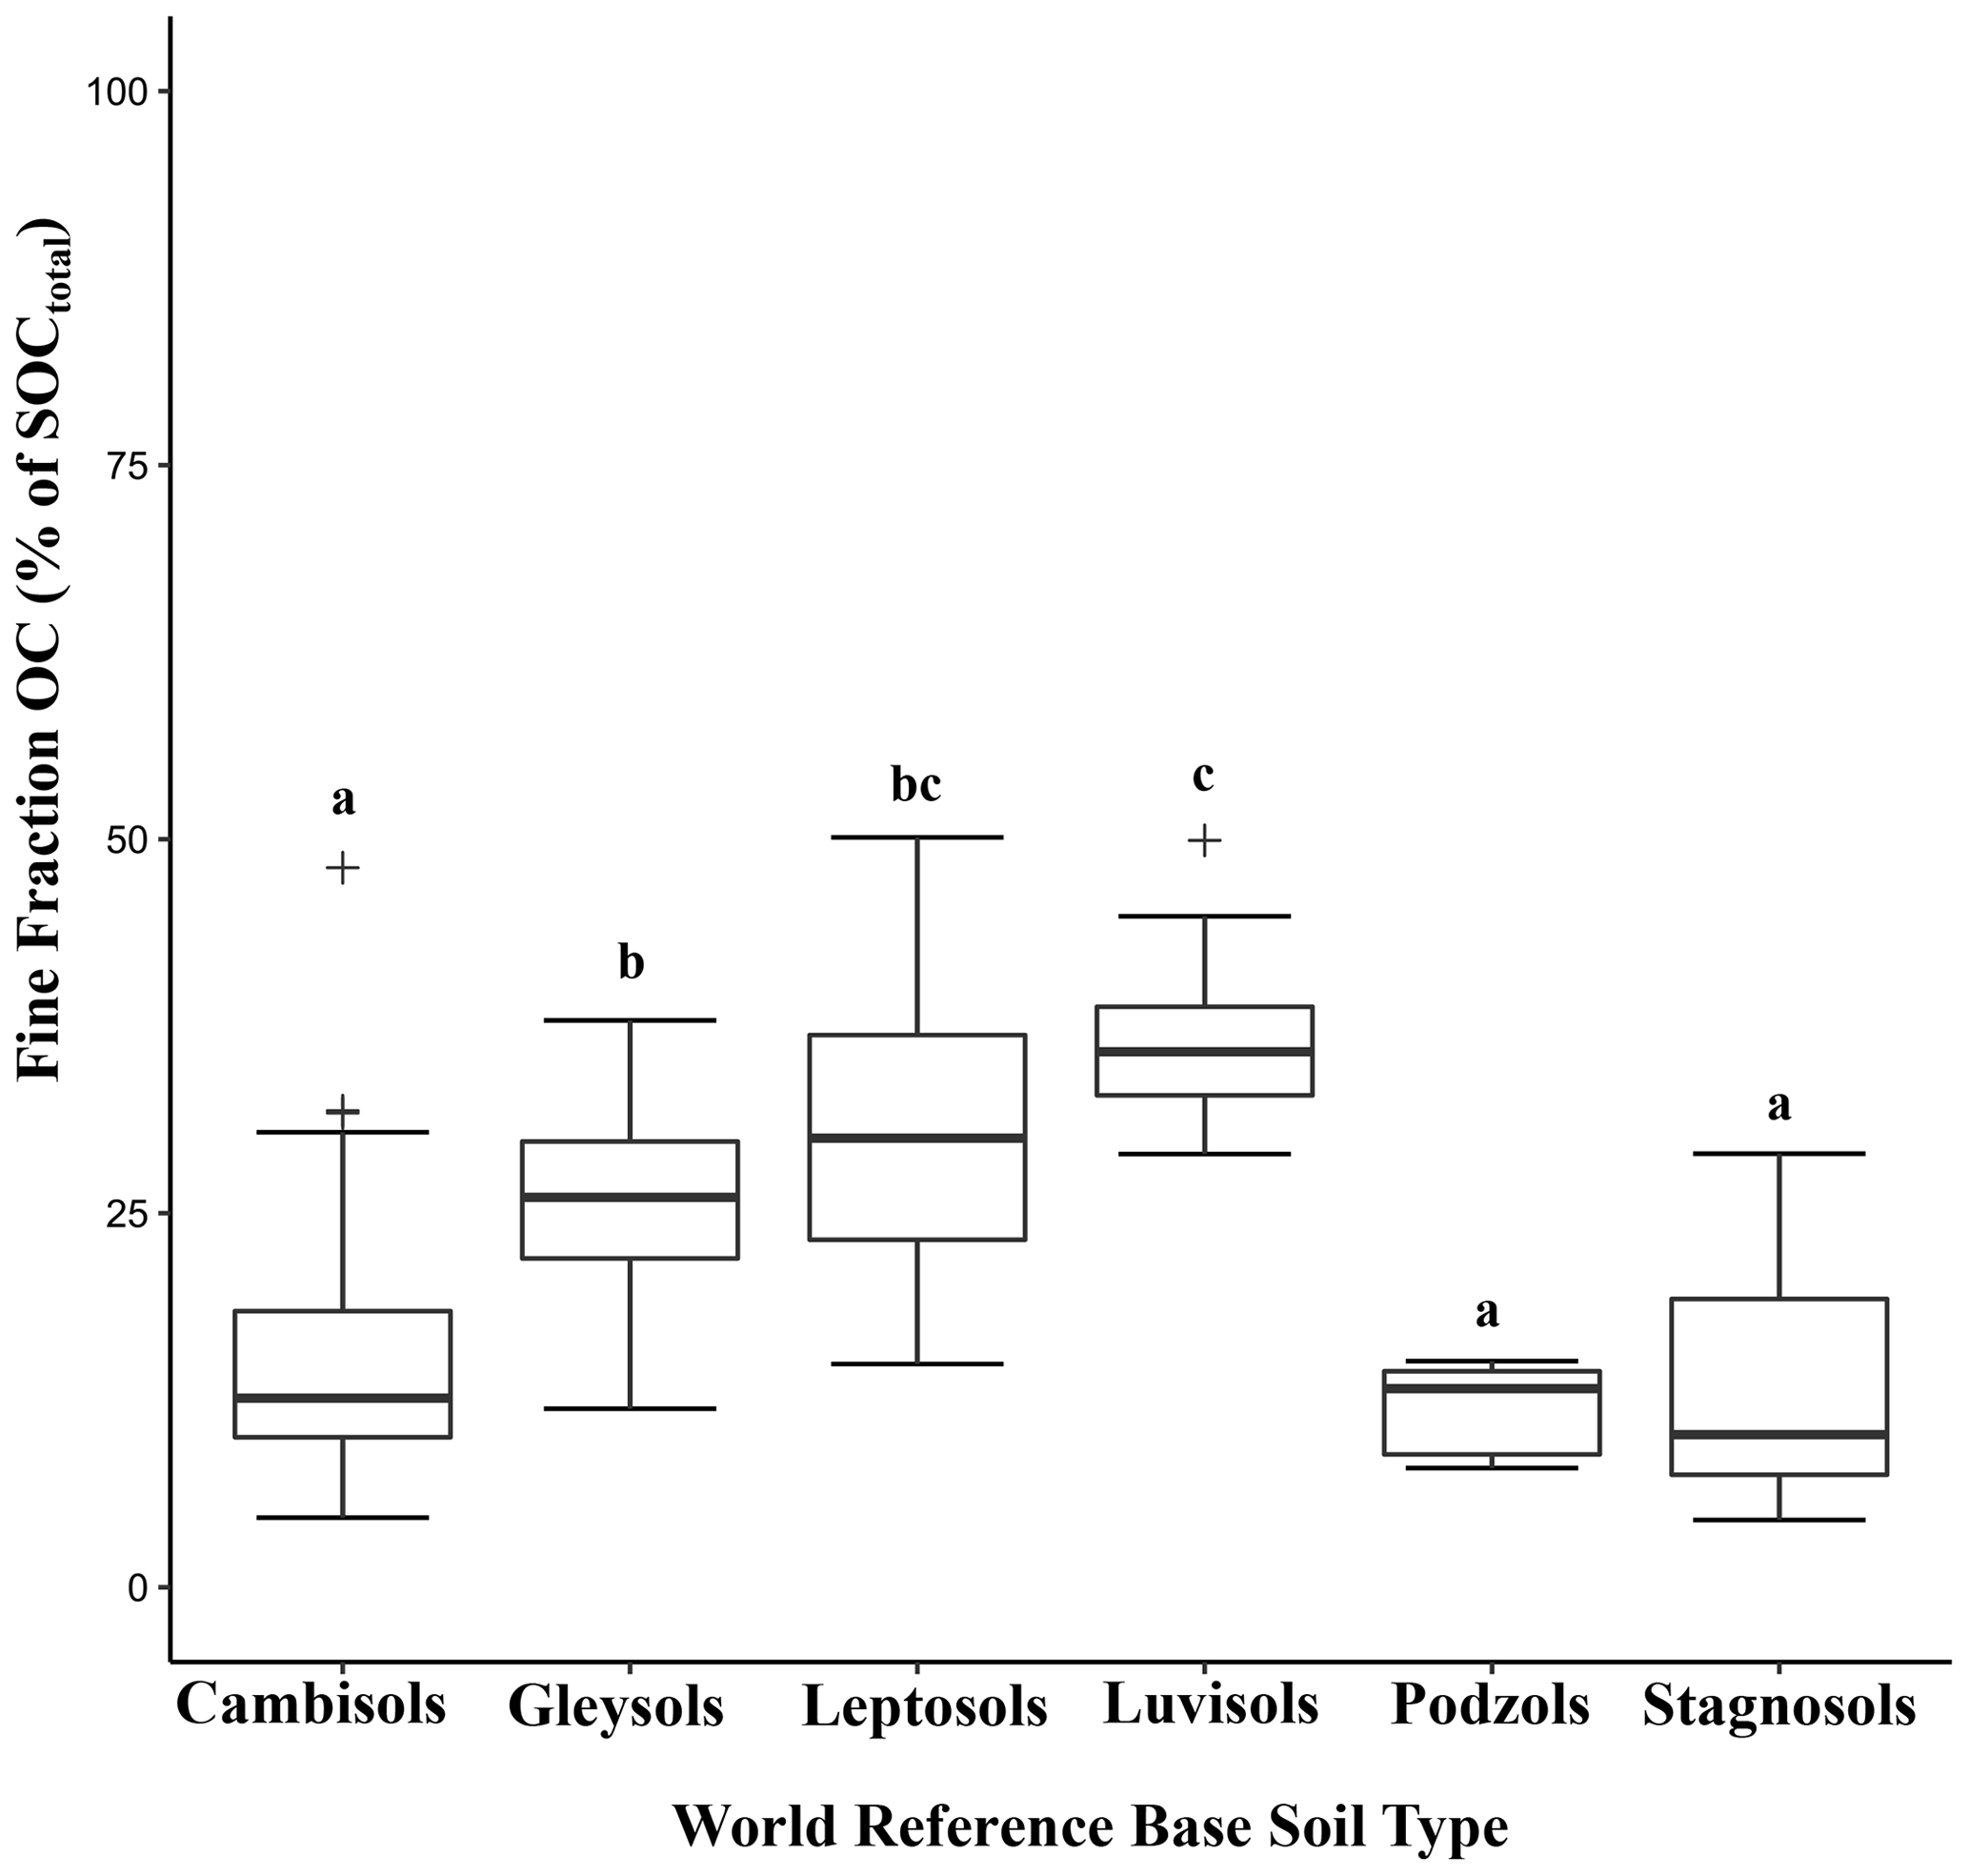
Figure 3Relative proportion of measured fine-fraction organic carbon of the total SOC content of the bulk soil for the different soil types used in this study. Lettering indicates significant differences at p<0.05.
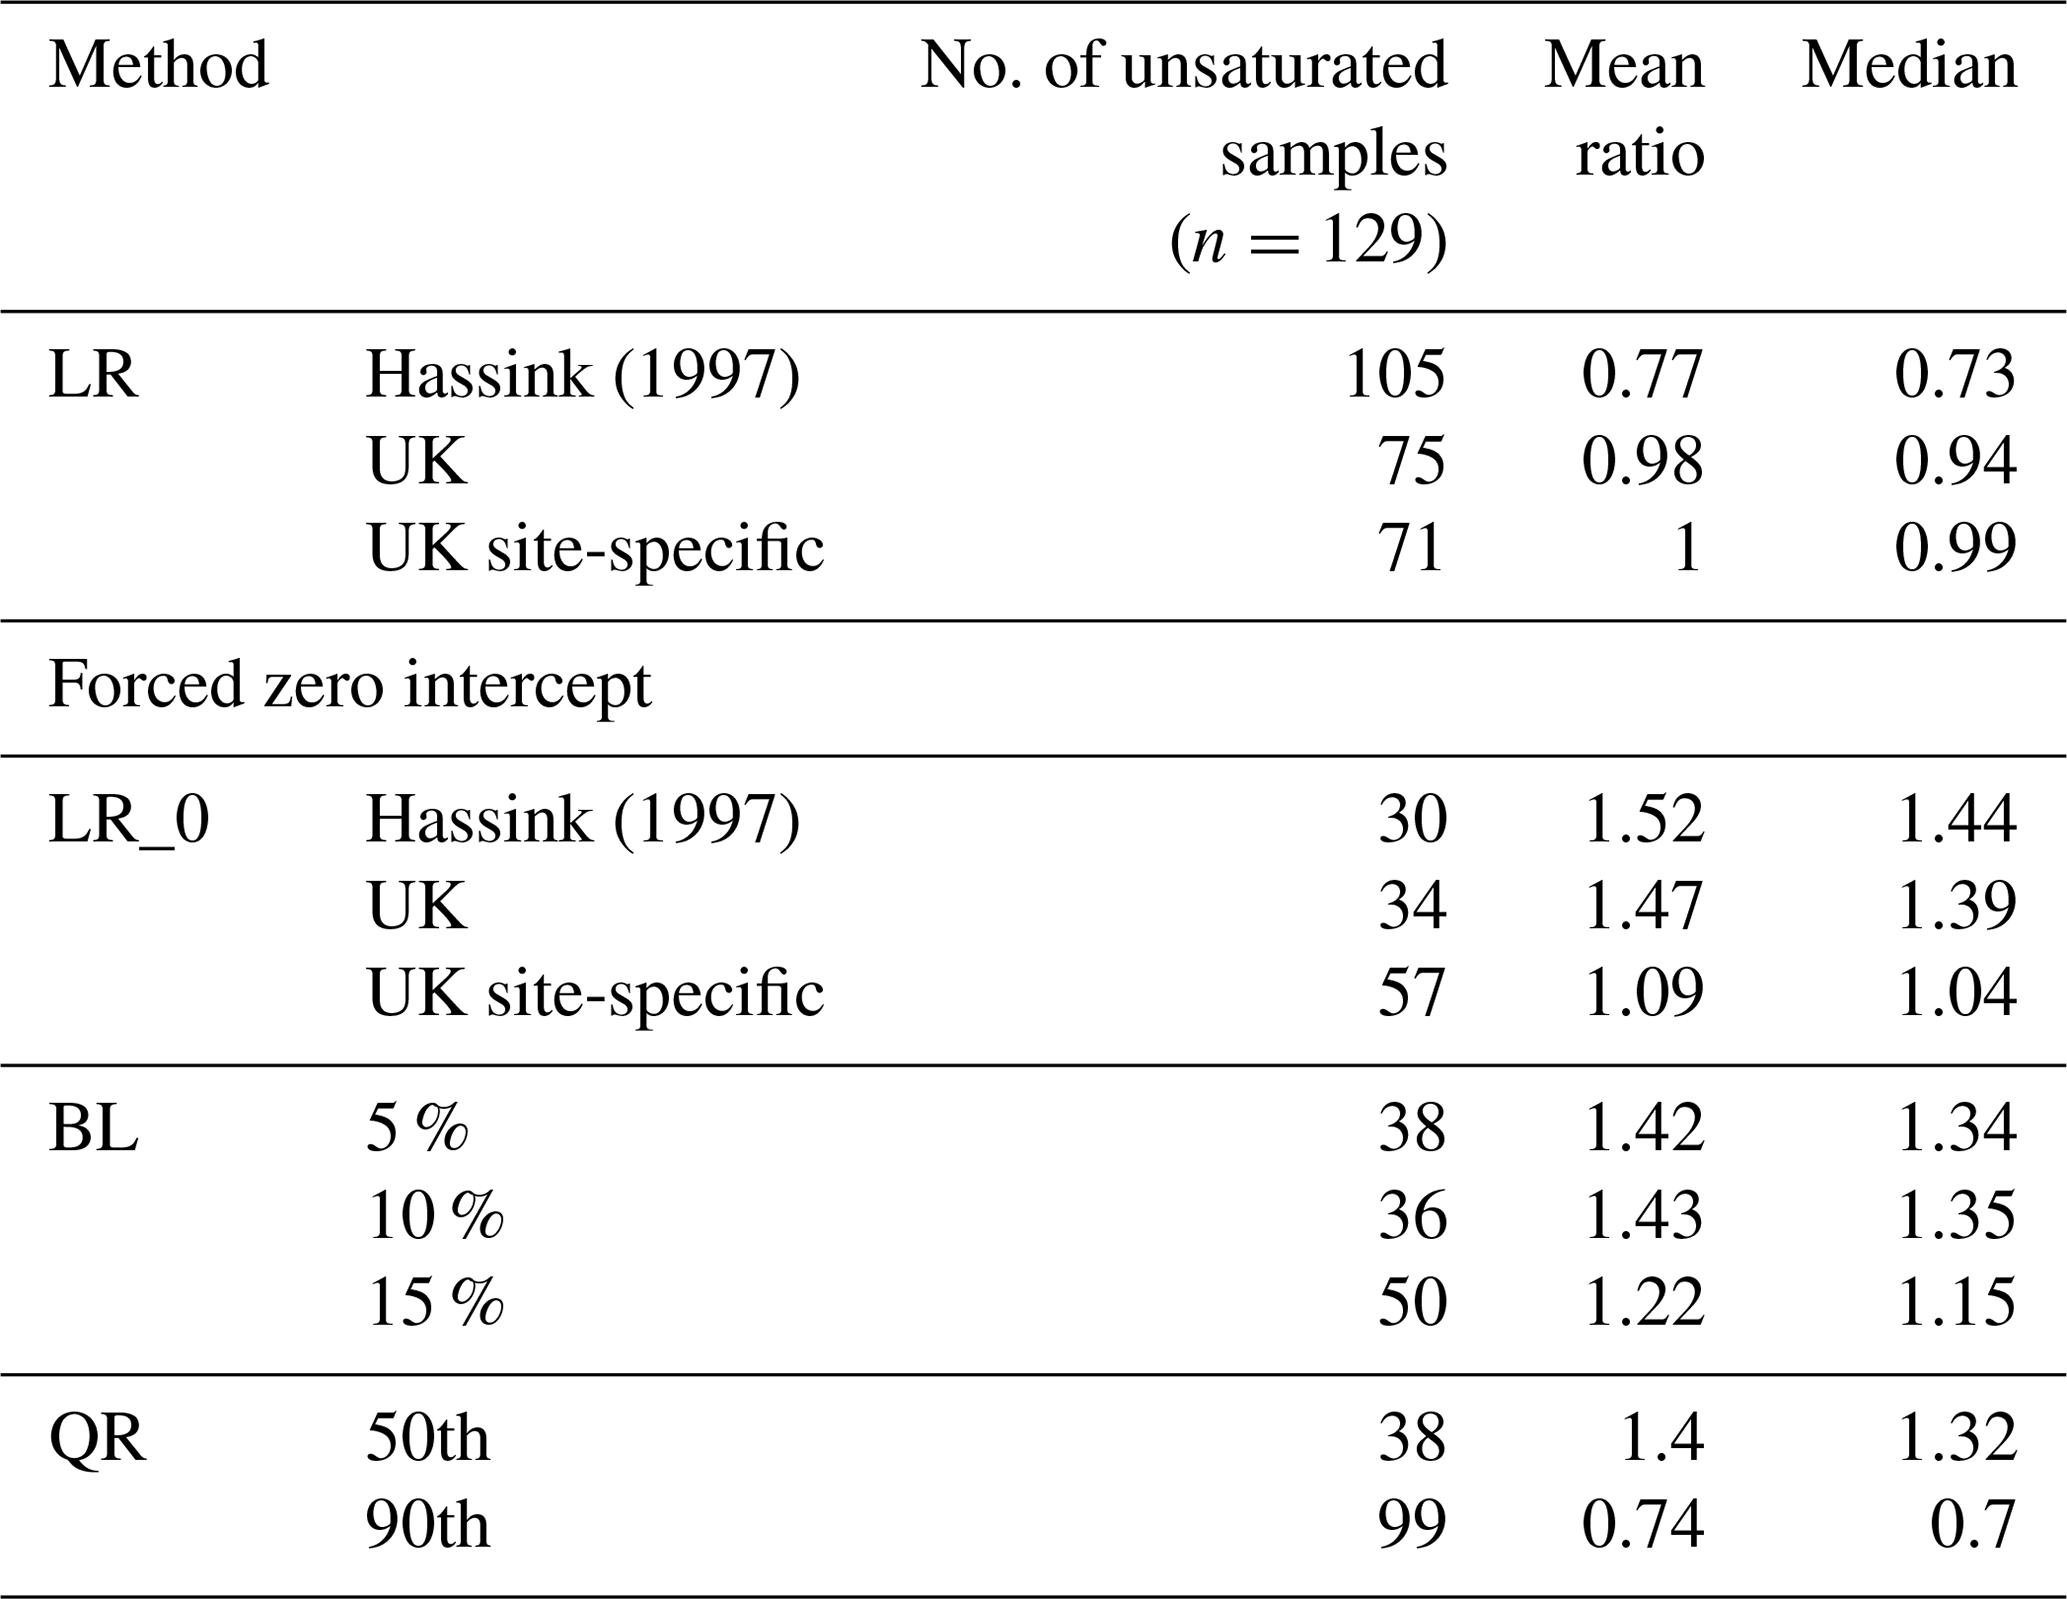
Coefficients from boundary line analysis are presented in Table 3. There was no significant difference in slopes between the 5 %, 10 % and 15 % fine-fraction intervals used. The median-percentile quantile regression analysis had a similar slope to the boundary line and linear regression with a forced zero intercept. Quantile regression using the 90th percentile resulted in the steepest slope of all estimation methods (Table 3). The C saturation ratios revealed the difference in the number of samples with the potential to sequester more C (Table 4). The Hassink (1997) linear regression equation, without a forced zero intercept, predicted the greatest number of unsaturated sites, followed by the 90th percentile quantile regression, with a forced zero intercept. There was no clear relationship between oversaturated sites and the proportion of silt and clay contents, as oversaturation occurred across all proportions, indicated by points above the lines in Fig. 4.
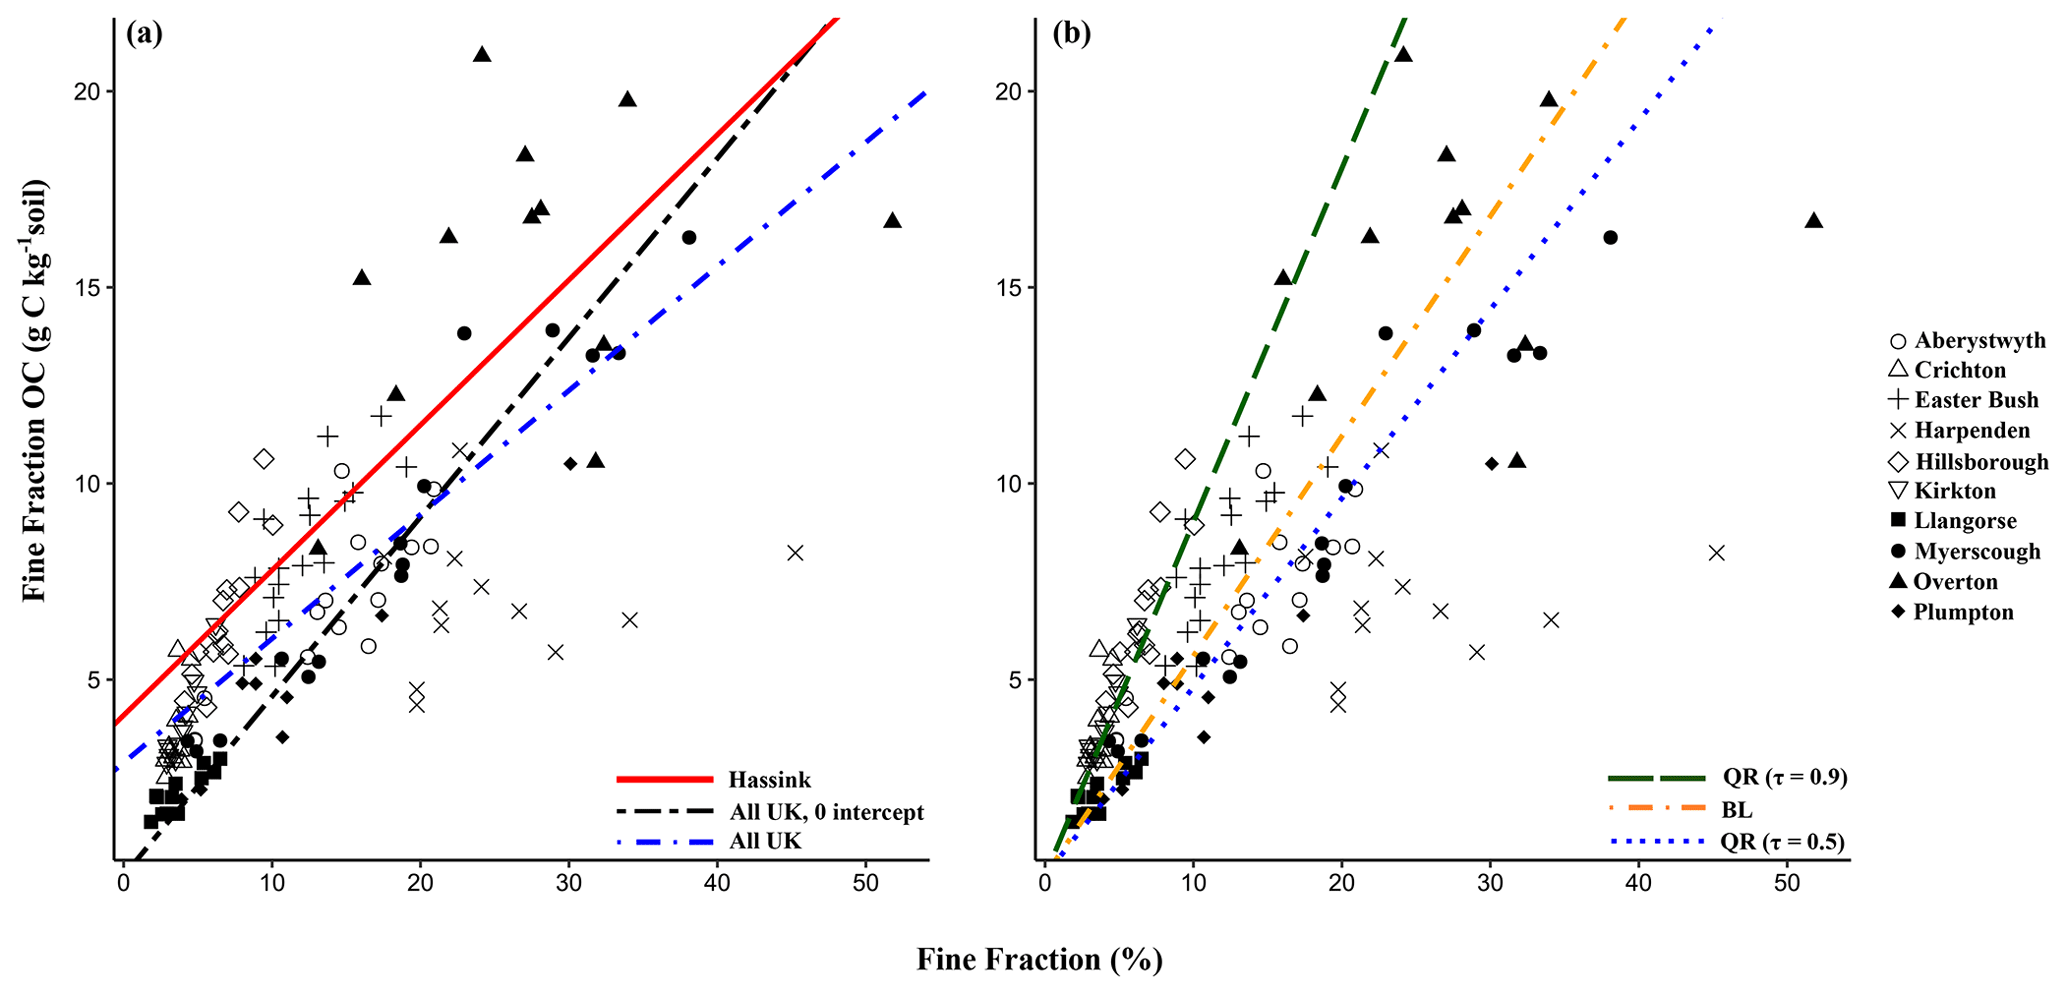
Figure 4Measured fine-fraction organic carbon (g C per kg soil) in relation to mass proportion of the fine fraction of a soil sample (%). Lines of best fit represent the (a) linear regression method of Hassink (1997) and data from this study and (b) boundary line (BL) using 15 % intervals and quantile regression analysis (QR) at the 90th and 50th percentiles.
Table 4Carbon saturation ratios calculated from the estimated maximum fine-fraction organic carbon by linear regression (LR), linear regression with a forced zero intercept (LR_0), boundary line (BL) and quantile regression (QR). Values <1 indicate unsaturated samples; 1 indicates saturation; and values >1 indicate oversaturated samples.
3.3 Effect of sward age on current C concentrations and estimated maximum fine-fraction organic carbon
Sward age (years since the last reseeding event) had a weak positive correlation with the mass proportion of the fine fraction (%) (Table 2). When grouped in 5-year intervals, significant differences were found between the age group and the mass proportion of the fine fraction (%), measured fine-fraction OC (< 20 µm) (g C per kg soil) and the C:N ratio of the fine fraction (Table 5); however there was no consistent increase or decrease with sward age. At each site, significant differences were observed between fields, for some properties, but again there was no consistent effect of sward age (Tables A3 and A4).
Table 5Effect of sward age grouped at 5-year intervals on selected soil properties. Values are means ± standard error of the mean, and different letters indicate age groups which are significantly different (p<0.05), by columns.
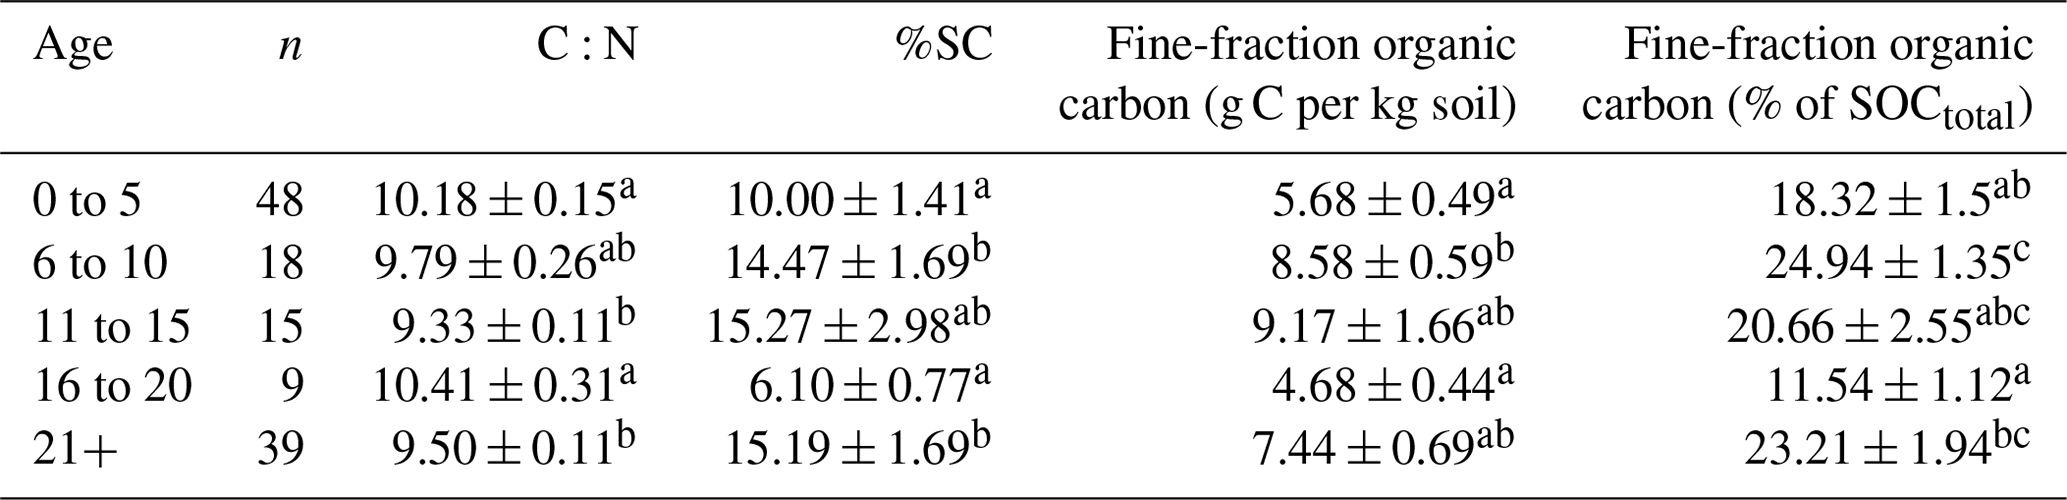
Age: years since the last reseeding event. The C:N ratio of the fine fraction. %SC: proportion of the fine fraction in a sample (%) by mass. Fine-fraction organic carbon (% of SOCtotal): relative proportion of measured fine-fraction OC of the total SOC content of the bulk soil.
4.1 Estimation of maximum fine-fraction organic carbon
Determining the potential C sequestration capacity of soils is essential to predict the influence of land management for climate change mitigation. The determination of the saturation deficit using the mass proportion of the fine fraction and current fine-fraction OC content is an established method with a strong grounding in correlation between the variables. As mentioned earlier, previous studies have examined methods to improve estimates of maximum fine-fraction OC. However so far no comparison has been made between the Hassink (1997) linear regression equation and one developed using grassland soils in the UK.
The significantly different slopes for the linear regression equations (Table 3) shows that the Hassink (1997) regression equation is not suitable for estimating maximum fine-fraction OC in UK grasslands. Previous concerns have focused on the potential for the equation developed by Hassink (1997) to underestimate maximum fine-fraction OC, as least-squares linear regression represents the mean response of the independent variable, rather than the maximum. For the UK grasslands in this study, estimating maximum fine-fraction OC using the Hassink (1997) regression approach resulted in a significant overestimation of fine-fraction OC sequestration potential. Future work using maximum fine-fraction OC prediction equations reported in the literature (e.g. Beare et al., 2014; Feng et al., 2014; Hassink, 1997; Six et al., 2002) should first conduct a validity test and determine if the regression equations match the soils in question or a subset of the data to ensure results are not significantly over- or underestimated.
To overcome the contradiction of an intercept greater than zero, indicating that C is stabilised in the fine fraction without any fine fraction, a forced zero intercept was used. The linear regression slopes with a forced zero intercept were not significantly different and were similar to that of Feng et al. (2013) at 0.42 ± 0.002. Liang et al. (2009) reported a lower slope of 0.36 in Chinese black soils, whilst Beare et al. (2014) reported a slope of 0.70 ± 0.03 in long-term New Zealand pastures. The range of reported values and differences across the UK sites (Tables A3 and A4) suggest that the effect of the proportion of the fine fraction of a sample on fine-fraction OC is not consistent and likely reflects differences in pedogenic and environmental conditions, land management and possibly the fine-fraction OC isolation method. It may be that the use of the mass proportion of the fine fraction to predict maximum fine-fraction OC is only suited for larger scales, rather than smaller, site-specific scales, as indicated by the variability in this study.
Boundary line analysis and quantile regression have been suggested as alternatives to overcome the limitations of linear regression. The estimation of maximum fine-fraction OC was greatest when using quantile regression (τ=0.90), whereas boundary line estimates at 5 % and 10 % intervals were similar to quantile regression (τ=0.50) and those estimated from linear regression (Table 3). The use of the median-percentile quantile regression highlights the closeness of linear regression predictions being more indicative of mean values, thus underestimating SOC sequestration potential. The boundary line estimate of Feng et al. (2013), 0.89 ± 0.05, was nearly double their linear regression; this was not the case in our study. Boundary line analysis uses a subset of data to estimate, in this case, an upper limit; the data set used by Feng et al. (2013) had a wider spread of measured fine-fraction OC of 0.9 to 71.7 g C per kg soil, compared to 1.72 to 18.29 g C per kg soil in our UK soils. Therefore, the upper subset of data was composed of higher values giving a steeper slope and demonstrates the range of data biases the C sequestration estimate generated by boundary line analysis.
The strength of using quantile regression analysis is that it makes no assumptions of homogeneity of variance and uses the entire data set to estimate the upper limit of a response. The measured fine-fraction OC in the UK sites lacks homogeneity of variance (Fig. 4) where the variation in the measured fine-fraction OC increases with the proportion of the fine fraction. Standard deviation of the proportion of the fine fraction in the 10th percentile is 0.4 compared to 6.9 in the 90th percentile. Of the methods explored in this study for our grassland soils, we consider the quantile regression at the 90th percentile estimate of maximum fine-fraction OC to be the most robust. This method results in the greatest number of unsaturated samples (Table 4), suggesting great potential for additional sequestration.
When examining the estimated OC input versus existing fine-fraction OC using estimates generated by quantile regression at the 90th percentile, a positive correlation between current fine-fraction OC and estimated C input (Kendall's tau (τ); 0.323, p<0.001) was observed for the entire data set. This was not the case at the site level (Fig. A1). In some instances, increasing fine-fraction OC (g C per kg soil) was associated with increased estimated C input until saturation, such as at Aberystwyth, Myerscough and Plumpton. Despite a higher fine-fraction OC content, these samples are furthest from saturation. In contrast the opposite was true for Crichton and Hillsborough (and Harpenden, Kirkton and Overton, although not statistically significant), implying that for these sites, samples with a higher fine-fraction OC are closer to or over saturation. It is unclear why this is the case particularly as in all sites; bar Harpenden, there is a positive regression between mass proportion of the fine fraction and fine-fraction OC (Table A3), meaning that higher fine-fraction OC is also associated with a higher mass proportion of the fine soil fraction. It is likely that the organic matter (OM) input to the soils with the higher mass proportion of the fine fraction is insufficient to bridge the gap between current and estimated maximum fine-fraction OC, as it is not possible to identify any other effect due to pedogenic or environmental conditions measured in this work. Further work investigating grasslands with similar soil types and textures and environmental conditions – but contrasting management in terms of fertiliser regimes, grazing densities, sward composition and management – may help to elucidate management factors that can be used to increase fine-fraction OC and explain the differences observed in this work.
Estimating maximum fine-fraction OC based on the mass proportion of the fine fraction is likely to be an oversimplification of the dynamics of fine-fraction OC accrual. Other parameters such as mineralogy, soil microbial community, environmental conditions (e.g. precipitation, Table 2) and land management can significantly influence fine-fraction OC stabilisation (Cotrufo et al., 2015; Kallenbach et al., 2016). This work has identified some soil and environmental properties that may play a role in fine-fraction OC stabilisation such as median annual temperature, %N and %C in the bulk soil, mean annual rainfall, and %N in the fine fraction (Table 2). Warmer median annual temperatures may enhance plant productivity and microbial processing, the byproducts of which are important precursors to fine-fraction OC (Cotrufo et al., 2013). It would be interesting to know at which point higher temperatures have a deleterious effect on fine-fraction OC accumulation. Mean annual rainfall and %N in the fine fraction were negatively correlated to fine-fraction OC. It was anticipated that fine-fraction OC would be positively correlated with fine-fraction N, as N-rich microbial byproducts have been found to form new organo-mineral associations onto which OC preferentially binds (Kopittke et al., 2018). These bonds may have been disturbed during the fractionation process, resulting in an N-rich fine fraction with less OC content.
The influence of soil type on fine-fraction OC was also evident in our results, as all soil types had statistically significant positive correlations between the mass proportion of the fine fraction and measured fine-fraction OC, except for Leptosols and Luvisols (Fig. 2). However, these soil types exhibited the greatest proportion of total SOC stabilised in the fine fraction (Fig. 3). Luvisols have a high base saturation facilitating more fine-fraction OC stabilisation via complexation of organic ligands by free Ca2+ (Chen et al., 2020). Identifying soils where a greater proportion of total SOC is stored in the fine fraction is important for recognising not only where fine-fraction OC needs to be protected but also where it can be enhanced.
Whilst we consider the quantile regression at the 90th percentile method to provide the most robust estimate of maximum fine-fraction OC in the sites studied, further experimental work to test the saturation level of these soils would help to validate this. Incubation studies that force an unsaturated soil to its “saturation” level and the effect of influencing variables mentioned above will help to elucidate the factors controlling fine-fraction OC saturation. Further empirical evidence of practical methods to manipulate fine-fraction OC stabilisation processes to promote the formation of new organo-mineral associations and understand their stability is necessary to guide grassland management to enhance SOC sequestration.
4.2 Effect of sward age on fine-fraction OC
It was anticipated that for fields of an older sward age, a greater proportion of total SOC would be stabilised as fine-fraction OC, as tillage breaks up macroaggregates, making OC in the fine fraction available for mineralisation. Alternatively, fine-fraction OC is less sensitive to disturbance than particulate organic matter (POM), resulting in the accumulation of POM as the fine-fraction OC pool remains stable, if sufficiently saturated. The results seem to support neither hypothesis. The proportion of total SOC stabilised in the fine fraction was not consistently higher in the oldest field and, in some instances, was significantly less, such as at Aberystwyth (Table A2). When grouped in 5-year intervals, significant differences in the C:N ratio of the fine fraction, the proportion of the fine fraction in a sample (%) by mass, measured fine-fraction OC (g C per kg soil) and the relative proportion of measured fine-fraction OC of the total SOC content of the bulk soil were found between age groups (Table 5). However, there was no consistent trend in the results. These data do not support the hypothesis that older swards will have a greater proportion of SOC stabilised in the fine soil fraction and a reduced potential for additional C sequestration. Equally, there was no negative correlation between sward age and the proportion of total SOC stabilised which would be supportive of the alternate hypothesis. From the data, fine-fraction OC makes up a greater proportion of SOC with increasing sward age when comparing the age groups of less than 5, 6 to 10 and 11 to 15 years . However there is a significant decrease in the amount of SOC that is stabilised in the fine fraction in the group of 16 to 20 years; this is likely due to fields in this age range originating from Crichton, Hillsborough and Plumpton, which have some of the lowest mass proportion of the fine fraction (Fig. 1c). The sward age analysis may also be confounded by the variation of the proportion of the fine fraction, particularly on soil properties influenced by the mass proportion of the fine fraction such as %C and %N and current fine-fraction OC (g C per kg soil). However, it was not possible to conduct robust ANOVA tests with a grouping variable with more than two levels. It may be possible to elucidate the relationship better from a wider study with more samples per age group, as our group of 16 to 20 years only has 9 values compared to 48 in the group of less than 5 years.
Fine-fraction OC only accounted for 4.5 % to 50.12 %, indicating high OC storage in other soil pools such as POM or different aggregate fractions. The fine roots of grassland flora species promote aggregate formation (O'Brien and Jastrow, 2013; Rasse et al., 2005), which may be a dominant stabilisation process in grasslands. However previous work has found no effect of sward age or the frequency of grassland reseeding on the %C in differing aggregate fractions (> 2000, 250–2000, 53–250 and < 53 µm) (Carolan and Fornara, 2016; Fornara et al., 2020). The impact of reseeding disturbance may be offset due to the high density of roots in grasslands by facilitating aggregate reformation. Additionally, dissolved organic carbon from belowground inputs is more efficiently stabilised in organo-mineral associations than aboveground dissolved organic carbon (litter leachate) (Sokol and Bradford, 2019). The narrow rhizosphere to the bulk-soil ratio in grasslands may make the fine-fraction OC in grasslands more resilient to disturbance events.
Estimating the long-term sequestration of soil C in the fine fraction is difficult due to the lack of reliable methodologies that can be widely applied to all soils. Our study has demonstrated that the Hassink (1997) linear regression equation is not suitable to estimate maximum fine-fraction OC in a range of UK grassland soils. Therefore, caution should be applied to estimates of maximum fine-fraction OC obtained using the Hassink (1997) equation, in instances where it may not accurately reflect fine-fraction OC of the soil in situ. After exploring various univariate estimation methods, we recommend the use of quantile regression at the 90th percentile to overcome the shortfalls of least-squares linear regression. However, such a simple estimate is unlikely to accurately reflect the dynamics of fine-fraction OC stabilisation. This work has helped to identify some key parameters that play a role in fine-fraction OC stabilisation, such as median annual temperature, mean annual precipitation, bulk-soil %C and %N and fine-fraction %N. Further work to understand how these parameters influence fine-fraction OC dynamics will help to accurately assess the feasibility of achieving soil carbon sequestration targets. Our results showed little evidence of the impact of time since the last reseeding event on the OC in the fine soil fraction. However, improving our understanding of SOC stabilisation processes and their resilience to grassland management is essential to ensure that current SOC is not only enhanced but also protected.
Table A1Bulk-soil properties for each UK site. Values are means of 10 replicated in each field ± 1 standard error of the mean, except for Harpenden, where values are means of five replicates per field. Lettering indicates values that are significantly different, within a site (p<0.05).
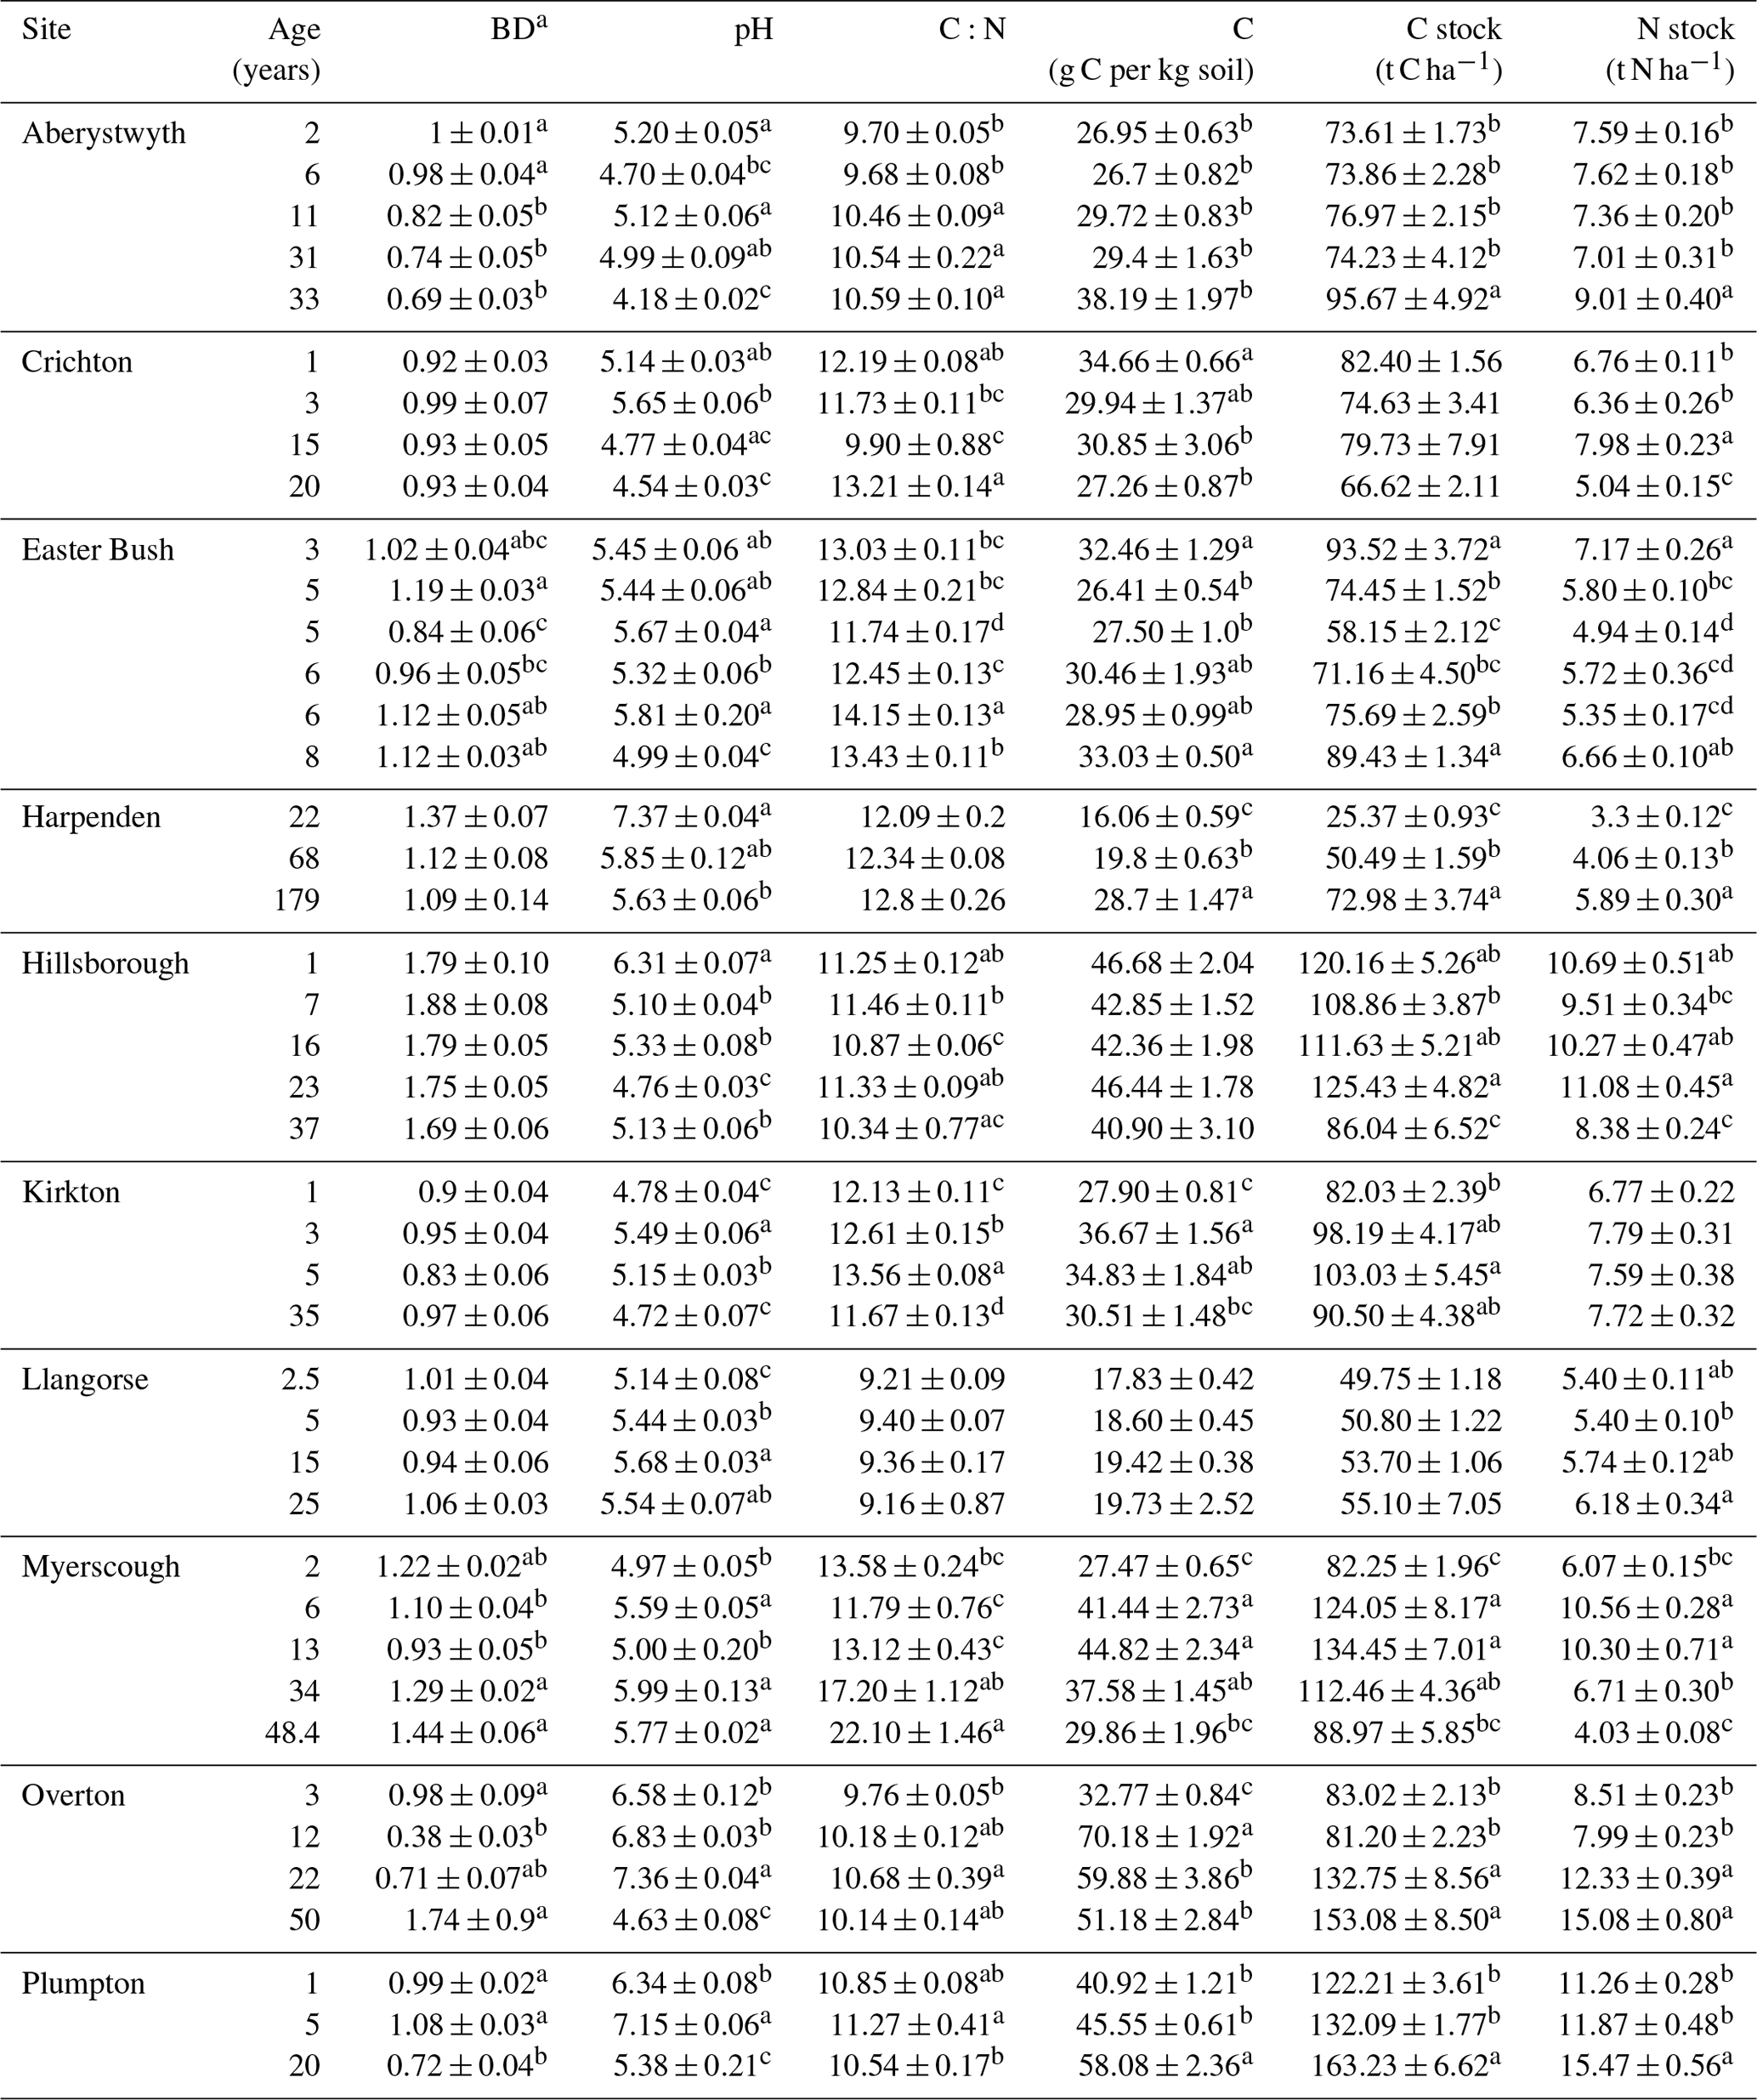
a Bulk density (BD) means and SEM of six samples, except for Harpenden with two samples per field. Corrected for stones.
Table A2Fine-fraction (< 20 µm) soil properties for each UK site. Values are means of three replicates in each field ± 1 standard error of the mean. Lettering indicates values that are significantly different, within a site (p<0.05).
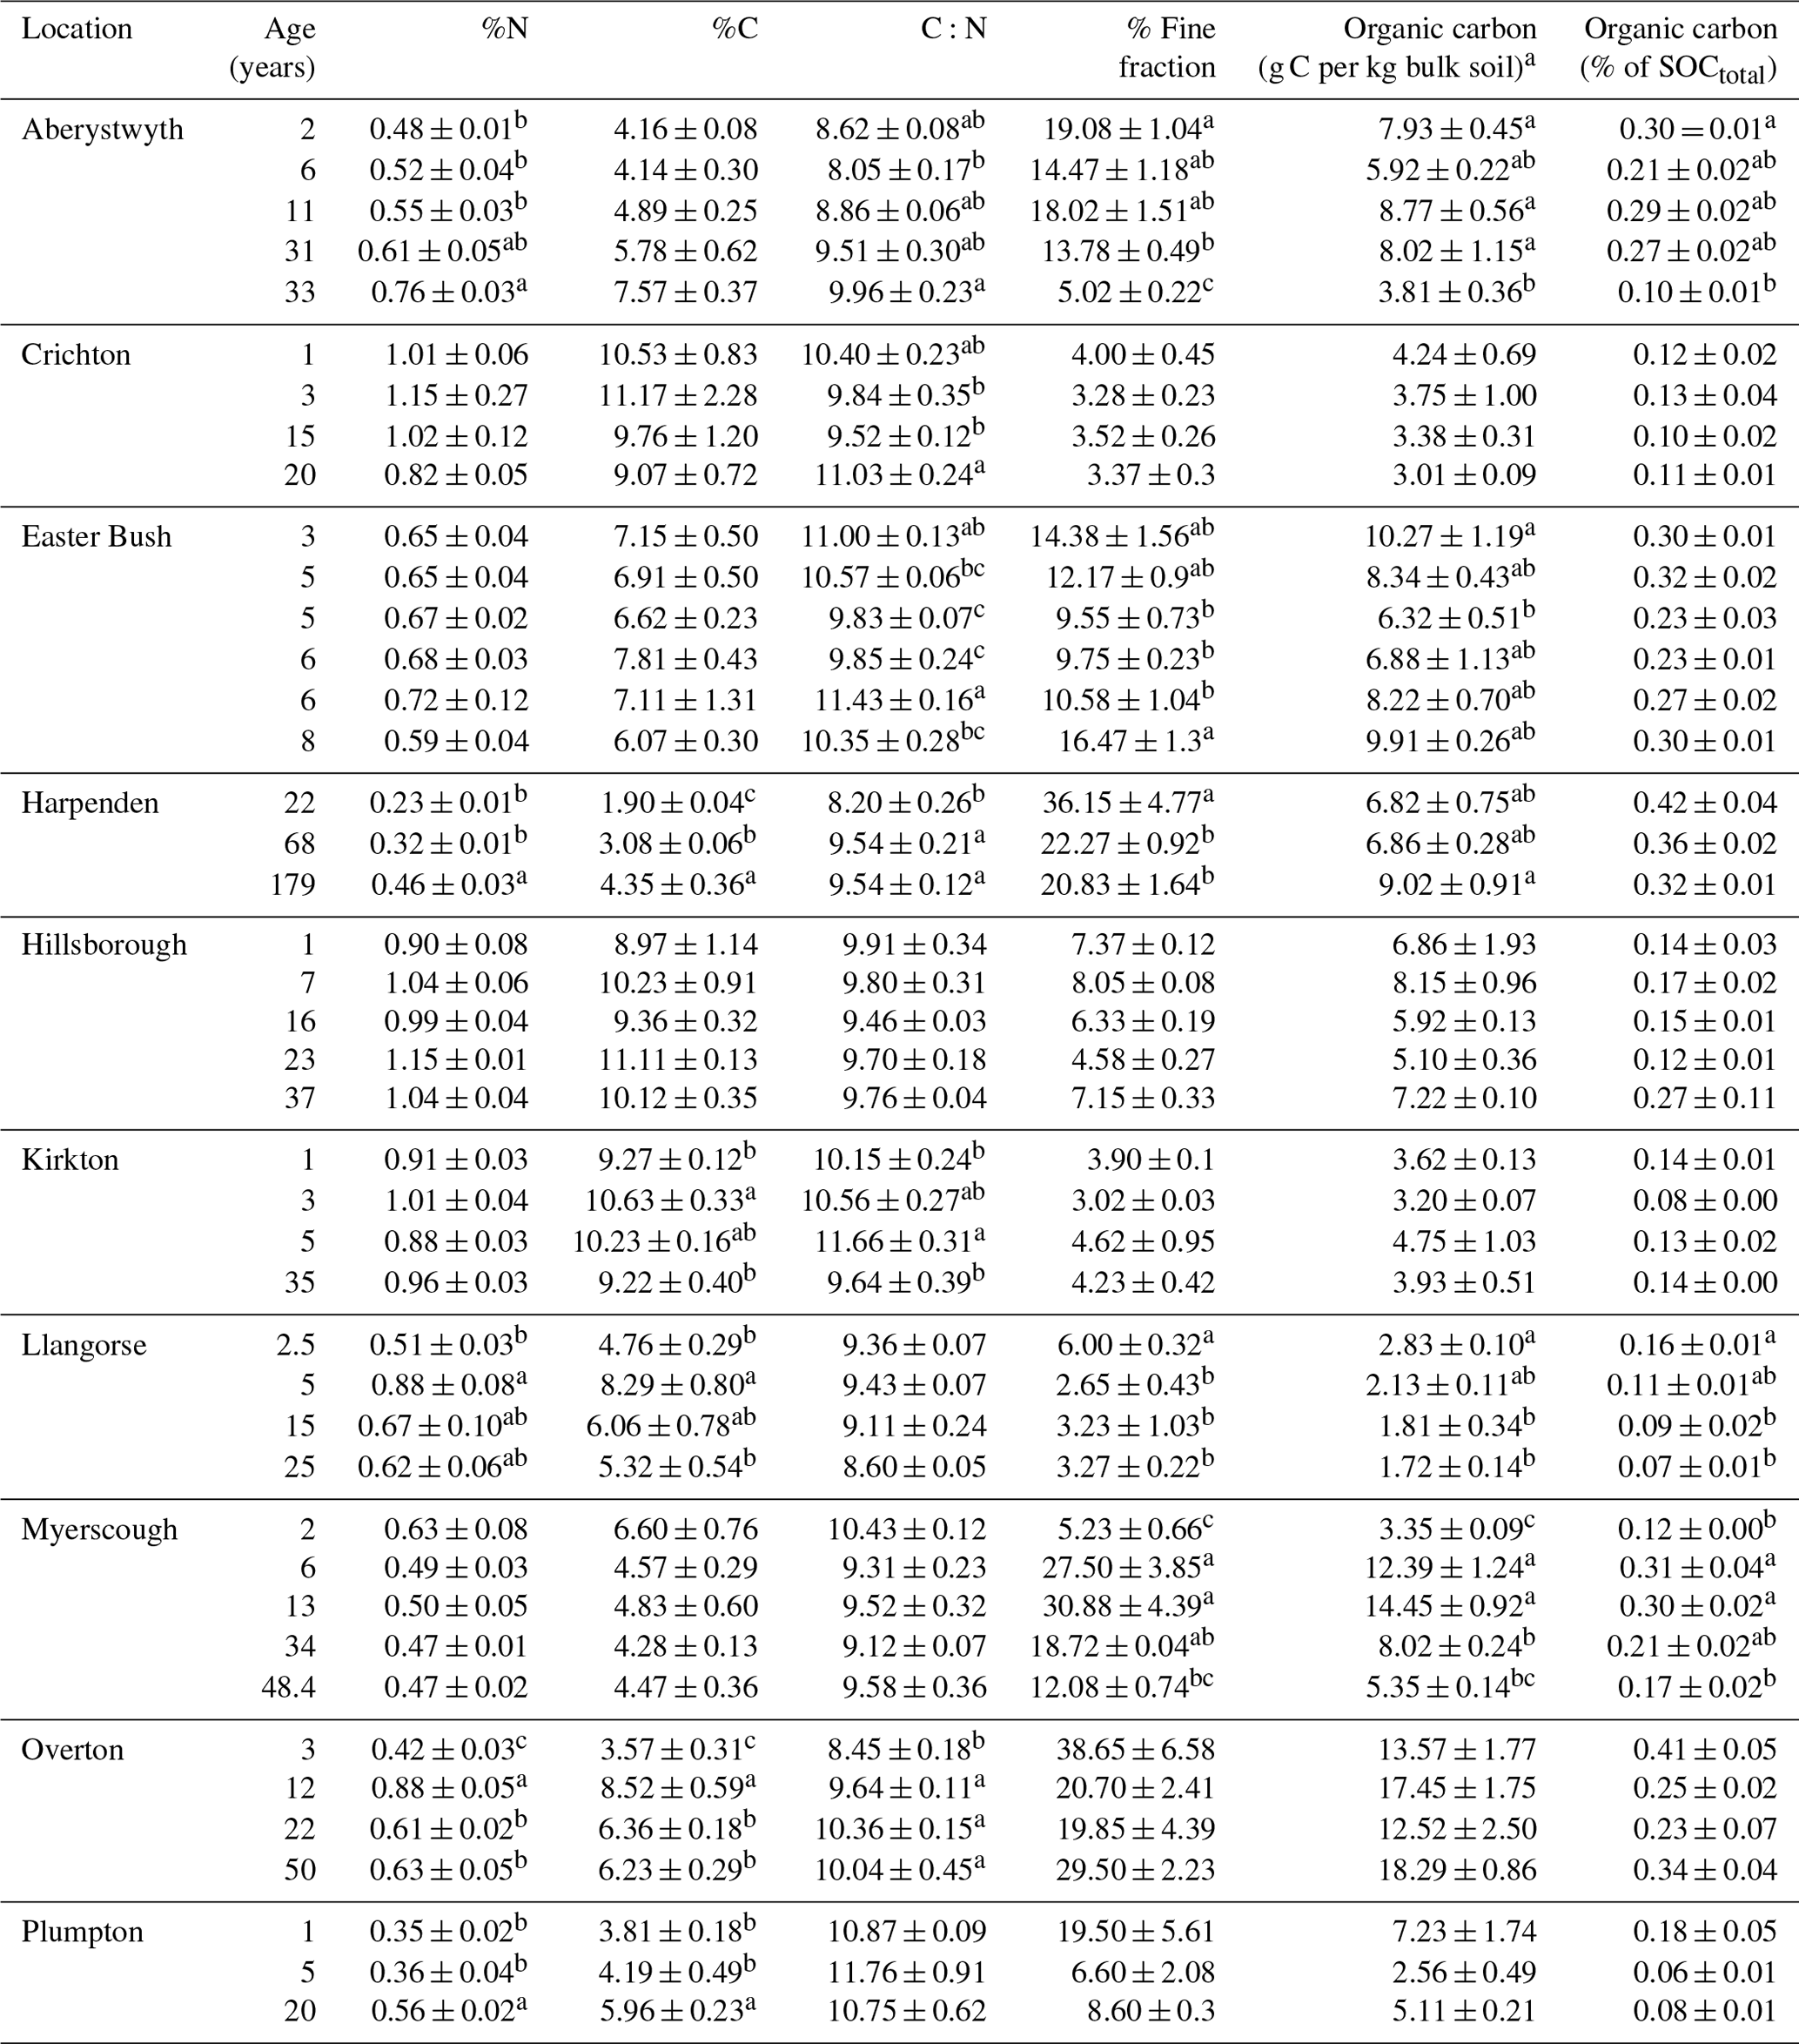
% Fine fraction: mass proportion of the fine fraction in a sample (%). a Organic carbon (g C per kg bulk soil) accounts for the proportion of the fine fraction per kilogram of bulk soil.
Table A3Linear regression coefficients for the estimation of maximum fine-fraction organic carbon (g C per kg soil). Lettering indicates slopes that are significantly different (p<0.05).
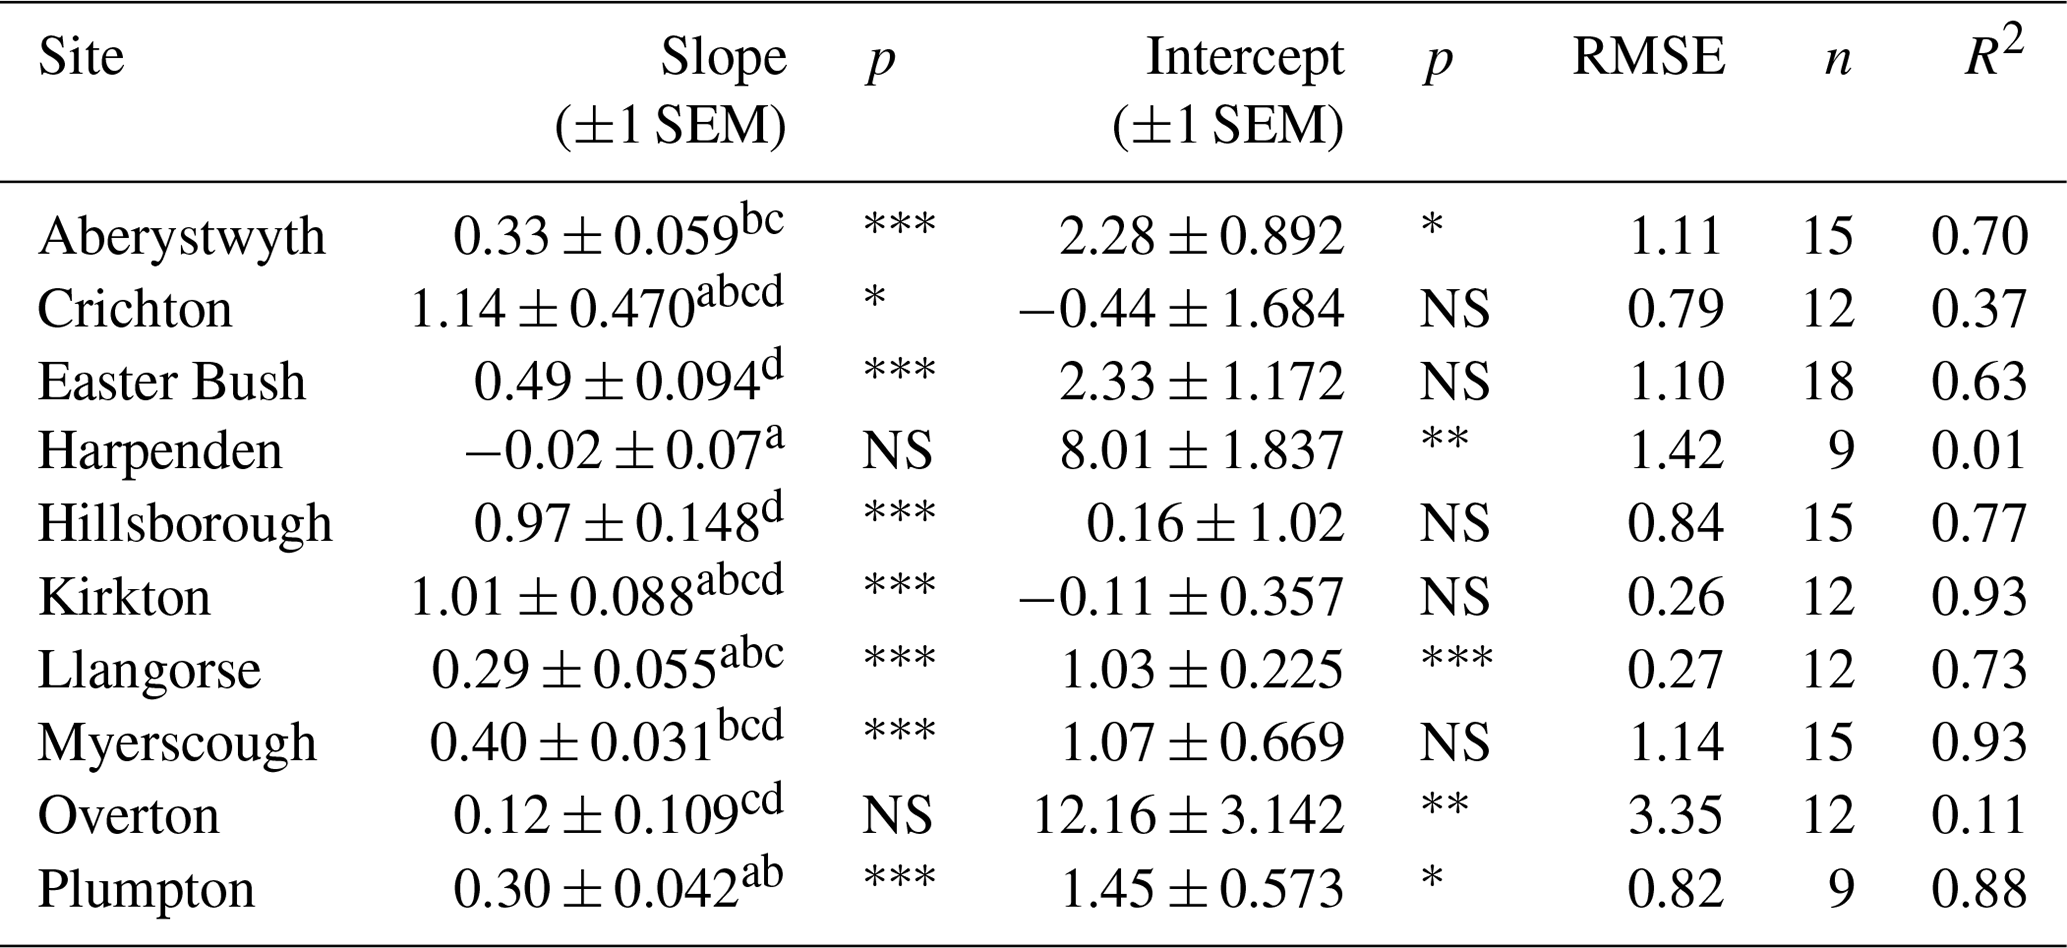
RMSE: root mean square error. Level of significance: , , . NS: not significant.
Table A4Linear regression coefficients for the estimation of maximum fine-fraction organic carbon (g C per kg soil) with a forced zero intercept. Lettering indicates slopes that are significantly different (p<0.05).
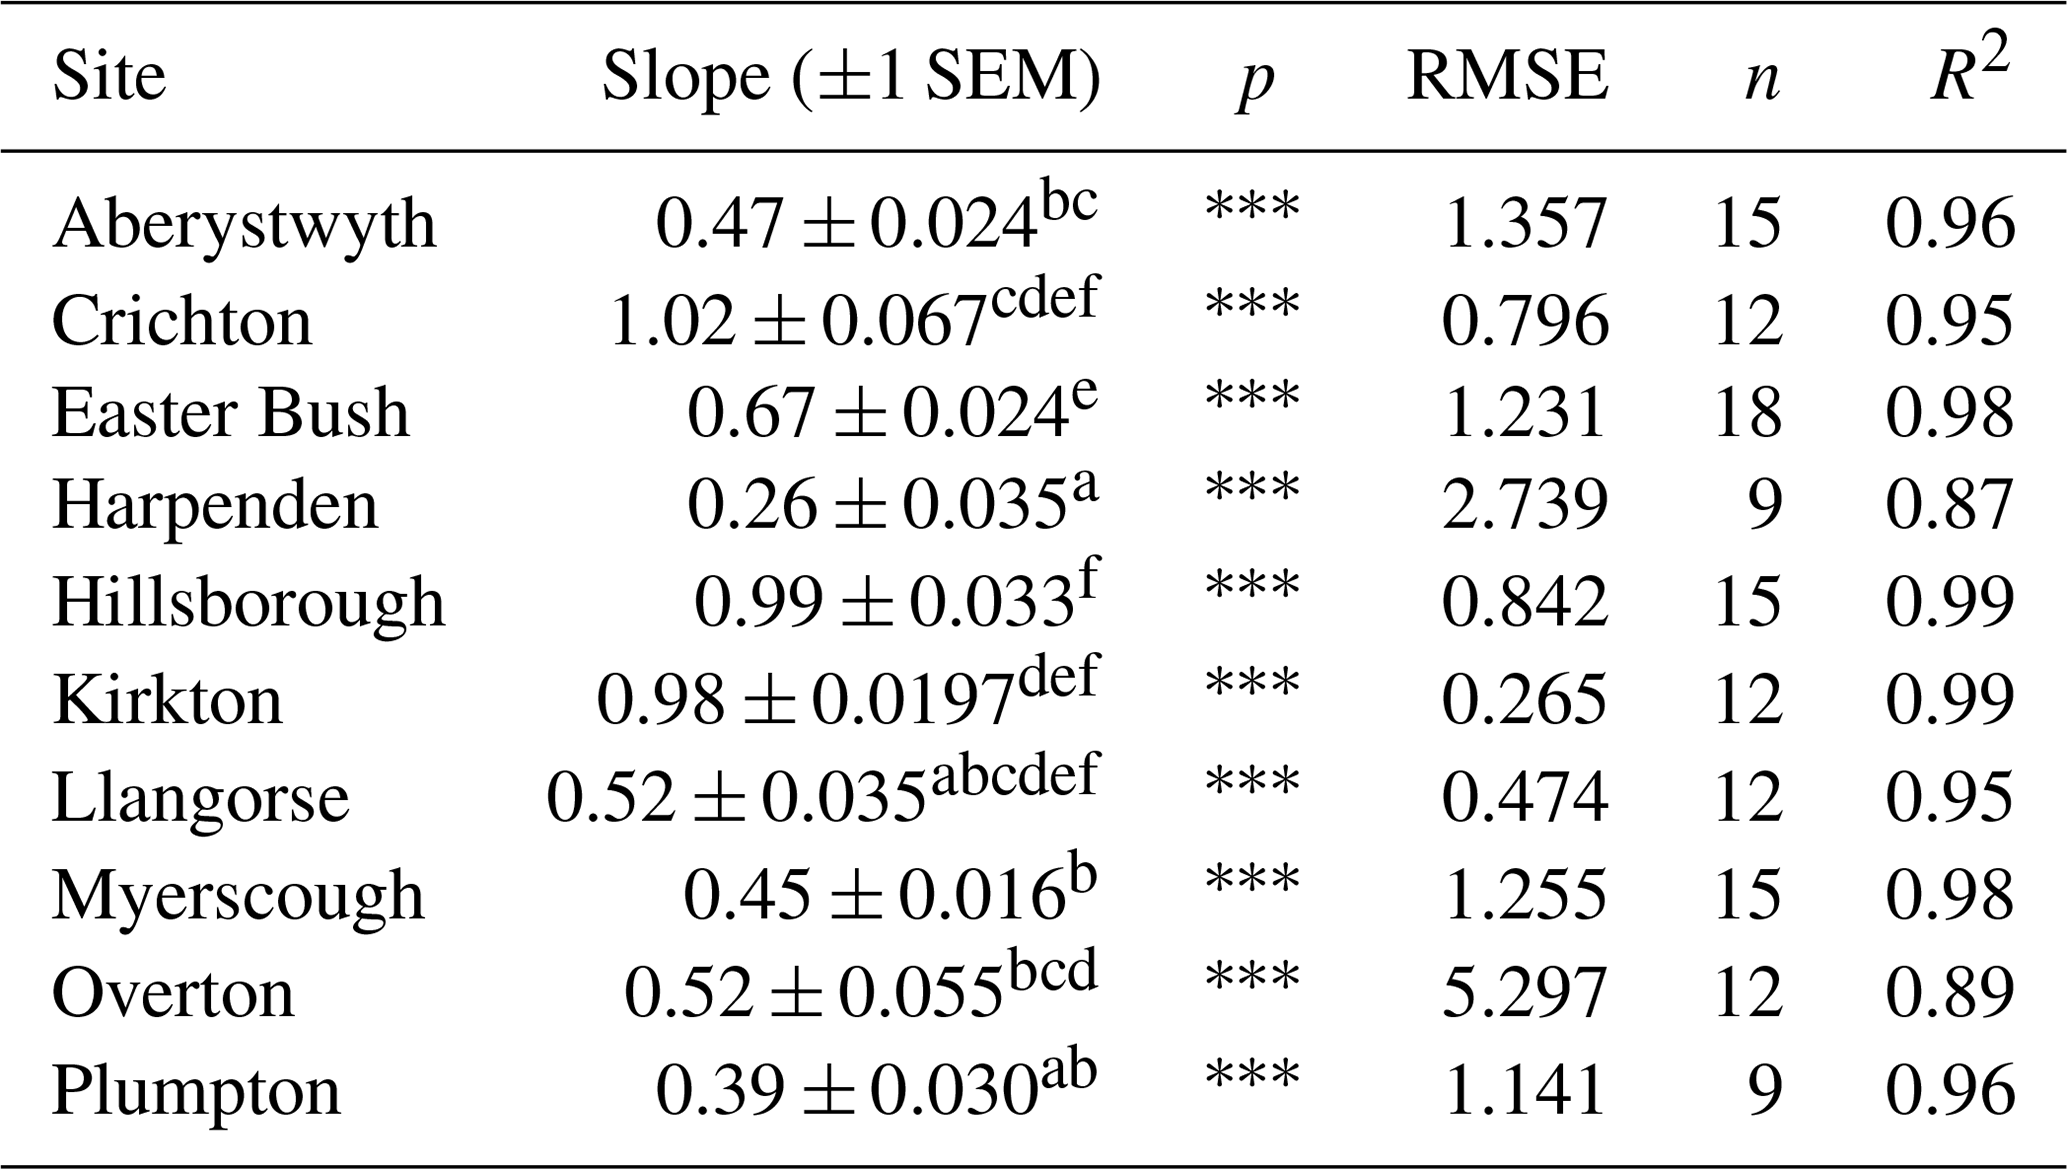
RMSE: root mean square error. Level of significance: , , .
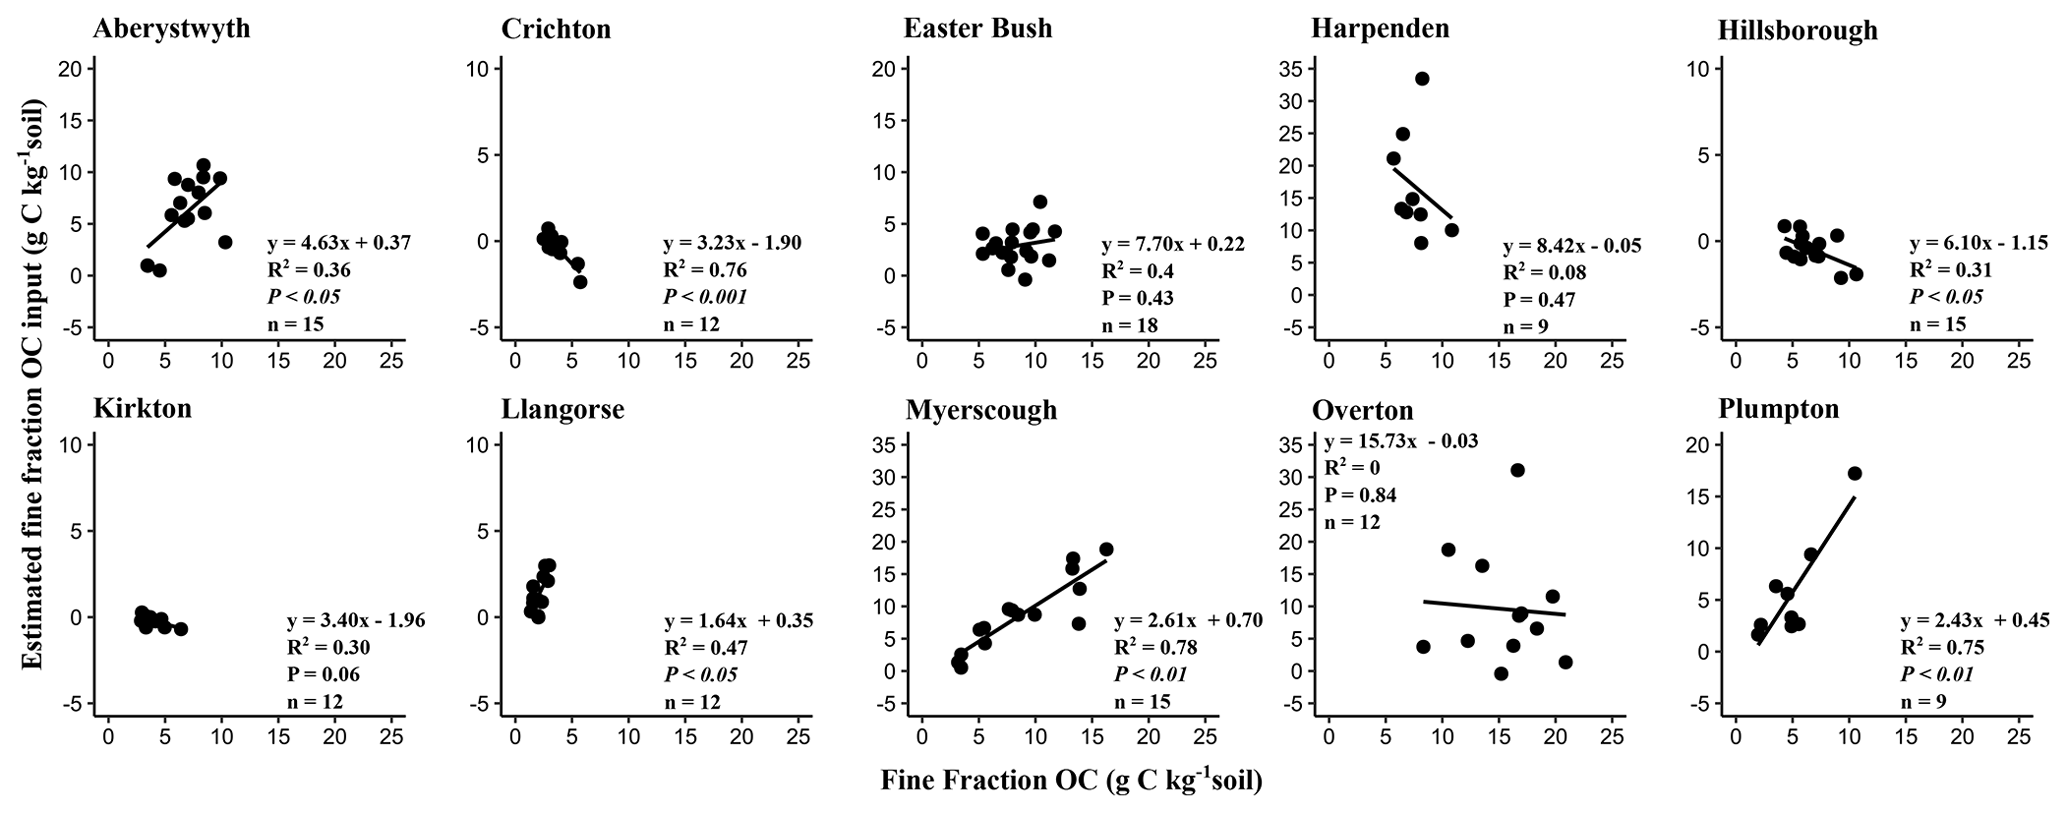
Figure A1Estimated fine-fraction OC input (g C per kg soil) compared to measured fine-fraction OC (g C per kg soil) in each of the sites studied. The estimated fine-fraction OC input (g C per kg soil) was calculated by subtracting the maximum fine-fraction OC (g C per kg soil) from the current fine-fraction OC (g C per kg soil). The maximum fine-fraction OC (g C per kg soil) was estimated using the quantile regression equation (τ=0.90), where maximum fine-fraction OC equals 0.92 multiplied by the mass proportion fine fraction (%).
All data resulting from this study are available from the authors upon request to Sarah Buckingham (sarah.buckingham@sruc.ac.uk).
KCP, SB, JMC, RMR and EMB formulated the research question and study design. KCP conducted the experimental work, data analysis and prepared the draft of the paper. All authors contributed to editing and reviewing of the paper.
The authors declare that they have no conflict of interest.
We are grateful to John Parker and Lydia Guo for their assistance in both the field and laboratory. We also thank Steve Freeman for technical assistance and Margaret Glendining and Sarah Perryman for access to information and data from the electronic Rothamsted Archive (e-RA). The Rothamsted Long Term Experiments National Capability (LTE-NCG) is supported by the UK Biotechnology and Biological Sciences Research Council (grant no. BBS/E/C/000J0300) and the Lawes Agricultural Trust. The authors are also grateful to collaborators at the local field sites for supplying soil samples and management information.
This research has been supported by SRUC's postgraduate studentship programme and the Global Academy of Agriculture and Food Security, University of Edinburgh. Funding has also been provided by Business Environment, Industry and Strategy (grant no. TRN1133); Ricardo-AEA; and the Rural & Environment Science & Analytical Services Division of the Scottish government.
This paper was edited by Sara Vicca and reviewed by Emanuele Lugato and Steffen A. Schweizer.
Angers, D. A., Arrouays, D., Saby, N. P. A., and Walter, C.: Estimating and mapping the carbon saturation deficit of French agricultural topsoils, Soil Use Manage., 27, 448–452, https://doi.org/10.1111/j.1475-2743.2011.00366.x, 2011.
Baldock, J. A. and Skjemstad, J. O.: Role of the soil matrix and minerals in protecting natural organic materials against biological attack, Org. Geochem., 31, 697–710, https://doi.org/10.1016/S0146-6380(00)00049-8, 2000.
Beare, M. H., McNeill, S. J., Curtin, D., Parfitt, R. L., Jones, H. S., Dodd, M. B., and Sharp, J.: Estimating the organic carbon stabilisation capacity and saturation deficit of soils: A New Zealand case study, Biogeochemistry, 120, 71–87, https://doi.org/10.1007/s10533-014-9982-1, 2014.
Cade, B. S. and Noon, B. R.: A gentle introduction to quantile regression for ecologists, Front. Ecol. Environ., 1, 412–420, https://doi.org/10.1890/1540-9295(2003)001[0412:AGITQR]2.0.CO;2, 2003.
Carolan, R. and Fornara, D. A.: Soil carbon cycling and storage along a chronosequence of re-seeded grasslands: Do soil carbon stocks increase with grassland age?, Agric. Ecosyst. Environ., 218, 126–132, https://doi.org/10.1016/j.agee.2015.11.021, 2016.
Chen, J., Xiao, W., Zheng, C., and Zhu, B.: Nitrogen addition has contrasting effects on particulate and mineral-associated soil organic carbon in a subtropical forest, Soil Biol. Biochem., 142, 107708, https://doi.org/10.1016/j.soilbio.2020.107708, 2020.
Cotrufo, M. F., Wallenstein, M. D., Boot, C. M., Denef, K., and Paul, E.: The Microbial Efficiency-Matrix Stabilization (MEMS) framework integrates plant litter decomposition with soil organic matter stabilization: Do labile plant inputs form stable soil organic matter?, Global Change Biol., 19, 988–995, https://doi.org/10.1111/gcb.12113, 2013.
Cotrufo, M. F., Soong, J. L., Horton, A. J., Campbell, E. E., Haddix, M. L., Wall, D. H., and Parton, W. J.: Formation of soil organic matter via biochemical and physical pathways of litter mass loss, Nat. Geosci., 8, 776–779, https://doi.org/10.1038/ngeo2520, 2015.
Dhillon, G. S., Amichev, B. Y., de Freitas, R., and Van Rees, K.: Accurate and Precise Measurement of Organic Carbon Content in Carbonate-Rich Soils, Commun. Soil Sci. Plant Anal., 46, 2707–2720, https://doi.org/10.1080/00103624.2015.1089271, 2015.
Drewer, J., Anderson, M., Levy, P. E., Scholtes, B., Helfter, C., Parker, J., Rees, R. M., and Skiba, U. M.: The impact of ploughing intensively managed temperate grasslands on N2O, CH4 and CO2 fluxes, Plant Soil, 411, 193–208, https://doi.org/10.1007/s11104-016-3023-x, 2017.
Feng, W., Plante, A. F., and Six, J.: Improving estimates of maximal organic carbon stabilization by fine soil particles, Biogeochemistry, 112, 81–93, https://doi.org/10.1007/s10533-011-9679-7, 2013.
Feng, W., Plante, A. F., Aufdenkampe, A. K., and Six, J.: Soil organic matter stability in organo-mineral complexes as a function of increasing C loading, Soil Biol. Biochem., 69, 398–405, https://doi.org/10.1016/j.soilbio.2013.11.024, 2014.
Fornara, D., Olave, R., and Higgins, A.: Evidence of low response of soil carbon stocks to grassland intensification, Agric. Ecosyst. Environ., 287, 106705, https://doi.org/10.1016/j.agee.2019.106705, 2020.
Hassink, J.: The capacity of soils to preserve organic C and N by their association with clay and silt particles, Plant Soil, 191, 77–87, https://doi.org/10.1023/A:1004213929699, 1997.
Jackson, M. L.: Soil chemical analysis: advanced course, University of Wisconsin, Wisconsin, USA, 930 pp., 2005.
Kallenbach, C. M., Frey, S. D., and Grandy, A. S.: Direct evidence for microbial-derived soil organic matter formation and its ecophysiological controls, Nat. Commun., 7, 1–10, https://doi.org/10.1038/ncomms13630, 2016.
Koenker, R.: quantreg: Quantile Regression, available at: https://cran.r-project.org/package=quantreg (last access: 14 November 2020), 2019.
Kopittke, P. M., Hernandez-Soriano, M. C., Dalal, R. C., Finn, D., Menzies, N. W., Hoeschen, C., and Mueller, C. W.: Nitrogen-rich microbial products provide new organo-mineral associations for the stabilization of soil organic matter, Global Change Biol., 24, 1762–1770, https://doi.org/10.1111/gcb.14009, 2018.
Kuzyakov, Y., Friedel, J. K., and Stahr, K.: Review of mechanisms and quantification of priming effects, Soil Biol. Biochem., 32, 1485–1498, https://doi.org/10.1016/S0038-0717(00)00084-5, 2000.
Lal, R.: Agricultural activities and the global carbon cycle, Nutr. Cycl. Agroecosystems, 70, 103–116, 2004.
Lark, R. M. and Milne, A. E.: Boundary line analysis of the effect of water-filled pore space on nitrous oxide emission from cores of arable soil, Eur. J. Soil Sci., 67, 148–159, https://doi.org/10.1111/ejss.12318, 2016.
Lenth, R. V.: Least-Squares Means: The R Package (lsmeans), J. Stat. Softw., 69, 1–33, https://doi.org/10.18637/jss.v069.i01, 2016.
Liang, A., Yang, X., Zhang, X., McLaughlin, N., Shen, Y., and Li, W.: Soil organic carbon changes in particle-size fractions following cultivation of Black soils in China, Soil Tillage Res., 105, 21–26, https://doi.org/10.1016/j.still.2009.05.002, 2009.
Lorenz, K. and Lal, R.: Carbon Sequestration in Agricultural Soils, 397 pp., 2018.
O'Brien, S. L. and Jastrow, J. D.: Physical and chemical protection in hierarchical soil aggregates regulates soil carbon and nitrogen recovery in restored perennial grasslands, Soil Biol. Biochem., 61, 1–13, https://doi.org/10.1016/j.soilbio.2013.01.031, 2013.
Powlson, D. S., Whitmore, A. P., and Goulding, K. W. T.: Soil carbon sequestration to mitigate climate change: A critical re-examination to identify the true and the false, Eur. J. Soil Sci., 62, 42–55, https://doi.org/10.1111/j.1365-2389.2010.01342.x, 2011.
Rasse, D. P., Rumpel, C., and Dignac, M. F.: Is soil carbon mostly root carbon?, Mechanisms for a specific stabilisation, Plant Soil, 269, 341–356, https://doi.org/10.1007/s11104-004-0907-y, 2005.
Schmidt, U., Thoni, H., and Kaupenjohann, M.: Using a boundary line approach to analyze N2O flux data from agricultural soils, Nutr. Cycl. Agroecosyst., 57, 119–129, https://doi.org/10.1201/9780203739310, 2000.
Shatar, T. M. and Mcbratney, A. B.: Boundary-line analysis of field-scale yield response to soil properties, J. Agric. Sci., 142, 553–560, https://doi.org/10.1017/S0021859604004642, 2004.
Six, J., Conant, R. T., Paul, E. A., and Paustian, K.: Stabilization mechanisms of SOM implications for C saturation of soils, Plant Soil, 241, 155–176, https://doi.org/10.1023/A:1016125726789, 2002.
Smith, P.: Soils and climate change, Curr. Opin. Environ. Sustain., 4, 539–544, https://doi.org/10.1007/978-94-017-7453-6_10, 2012.
Sokol, N. W. and Bradford, M. A.: Microbial formation of stable soil carbon is more efficient from belowground than aboveground input, Nat. Geosci., 12, 46–53, https://doi.org/10.1038/s41561-018-0258-6, 2019.
Soussana, J.-F., Soussana, J.-F., Loiseau, P., Vuichard, N., Ceschia, E., Balesdent, J., Chevallier, T., and Arrouays, D.: Carbon cycling and sequestration opportunities in temperate grasslands, Soil Use Manage., 20, 219–230, https://doi.org/10.1079/SUM2003234, 2004.
Stewart, C. E., Paustian, K., Conant, R. T., Plante, A. F., and Six, J.: Soil carbon saturation: Concept, evidence and evaluation, Biogeochemistry, 86, 19–31, https://doi.org/10.1007/s10533-007-9140-0, 2007.
Team, R. C.: A Language and Environment for Statistical Computing, available at: https://www.r-project.org/ (last access: 4 November 2020), 2019.
Ward, S. E., Smart, S. M., Quirk, H., Tallowin, J. R. B., Mortimer, S. R., Shiel, R. S., Wilby, A., and Bardgett, R. D.: Legacy effects of grassland management on soil carbon to depth, Global Change Biol., 22, 2929–2938, https://doi.org/10.1111/gcb.13246, 2016.
Wei, T. and Simko, V.: R package “corrplot”: Visualization of a Correlation Matrix, available at: https://github.com/taiyun/corrplot (last access: 4 November 2020), 2017.