the Creative Commons Attribution 4.0 License.
the Creative Commons Attribution 4.0 License.
 | 21 Mar 2022
Grazing enhances carbon cycling but reduces methane emission during peak growing season in the Siberian Pleistocene Park tundra site
Wolfgang Fischer
Christoph K. Thomas
Nikita Zimov
Large-herbivore grazing has been shown to substantially alter tundra soil and vegetation properties as well as carbon fluxes, yet observational evidence to quantify the impact of herbivore introduction into Arctic permafrost ecosystems remains sparse. In this study we investigated growing-season CO2 and CH4 fluxes with flux chambers on a former wet tussock tundra inside Pleistocene Park, a landscape experiment in northeast Siberia with a 22-year history of grazing. Reference data for an undisturbed system were collected on a nearby ungrazed tussock tundra. Linked to a reduction in soil moisture, topsoil temperatures at the grazed site reacted 1 order of magnitude faster to changes in air temperatures compared to the ungrazed site and were significantly higher, and the difference strongly decreased with depth. Overall, both GPP (gross primary productivity, i.e., CO2 uptake by photosynthesis) and Reco (ecosystem respiration, i.e., CO2 release from the ecosystem) were significantly higher at the grazed site with notable variations across plots at each site. The increases in CO2 component fluxes largely compensated for each other, leaving NEE (net ecosystem exchange) similar across grazed and ungrazed sites for the observation period. Soil moisture and CH4 fluxes at the grazed site decreased over the observation period, while in contrast the constantly waterlogged soils at the ungrazed site kept CH4 fluxes at significantly higher levels. Our results indicate that grazing of large herbivores may promote topsoil warming and drying, in this way effectively accelerating CO2 turnover while decreasing methane emissions in the summer months of peak ecosystem activity. Since we lack quantitative information on the pre-treatment status of the grazed ecosystem, however, these findings need to be considered qualitative trends for the peak growing season, and absolute differences between treatments are subject to elevated uncertainty. Moreover, our experiment did not include autumn and winter fluxes, and thus no inferences can be made for the annual NEE and CH4 budgets in tundra ecosystems.
- Article
(4459 KB) - Full-text XML
- BibTeX
- EndNote


In the context of global climate change, surface air temperatures in polar regions have been shown to have risen about twice as fast as the global mean in the past (Overland et al., 2015). Since this trend is expected to continue in the future, Northern Hemisphere permafrost ecosystems are at exceptional risk of degradation. The Arctic permafrost region stores about 50 % of the belowground organic carbon stocks on Earth (Hugelius et al., 2014), with an estimated pool of organic C of between 1307 and 1672 Gt (Hugelius et al., 2014; Tarnocai et al., 2009). Based on several independent approaches, it is estimated that 130 to 160 Gt C could be released by 2100 under a high warming scenario (i.e., Representative Concentration Pathway scenario 8.5; Schuur et al., 2015), so even a partial release of this currently deep-frozen material would constitute a substantial positive feedback with ongoing warming trends.
Warming of the active layer facilitates the enhanced decomposition of soil organic carbon, leading to higher rates of ecosystem respiration (Reco) that contribute to higher CO2 emissions (Natali et al., 2015; Schädel et al., 2016; Schuur et al., 2009). Moreover, warming-induced permafrost thaw may make organic matter that was previously perennially frozen vulnerable to mineralization (Natali et al., 2014, 2015; Harden et al., 2012; Schuur et al., 2009). At the same time, warmer and longer growing seasons have the potential to change vegetation species composition (e.g., from graminoid-/moss- to shrub-dominated; Myers-Smith et al., 2011; Hollister et al., 2015; Mekonnen et al., 2021) and increase living plant biomass, leading to an increase in gross primary productivity (GPP) (Epstein et al., 2012). Deeper thaw depths may also open up nutrient reservoirs (Chapin et al., 2005; Salmon et al., 2016; Hollister et al., 2015), in this way promoting vegetation growth and carbon uptake. Interactions with various other influencing factors, for example changes in snow cover (Grogan, 2012) or soil moisture (Oberbauer et al., 2007; Natali et al., 2015; Kwon et al., 2016), further complicate an assessment of the net effect of these changes.
Large herbivores (reindeer, muskoxen, horses, bison, etc.) are an additional forcing which may substantially alter the characteristics of high-latitude landscapes, but their potential influence is rarely considered in studies predicting the future state of Arctic permafrost ecosystems. Herbivores can trigger distinct shifts in vegetation communities, e.g., from shrub- or moss-dominated ecosystems to graminoid tundra dominated by dense grass tillers (Manseau et al., 1996; Olofsson, 2006; Ylänne et al., 2018; Kitti et al., 2009; Falk et al., 2015; Raillard and Svoboda, 2000; Gornall et al., 2009). Grazing has been shown to promote certain Carex species that produce a high belowground biomass (Tolvanen and Henry, 2000), allowing reliable compensation for growth after being grazed off (Raillard and Svoboda, 1999; Kitti et al., 2009). Shifts in vegetation composition are usually associated with an increase in albedo (Te Beest et al., 2016; Chapin et al., 2005; Cohen et al., 2013). Regarding belowground ecosystem properties, previous studies have reported an increased annual amplitude in soil temperatures (higher in summer, lower in winter) and significant shifts in soil moisture and texture (Olofsson et al., 2004; Te Beest et al., 2016; Zimov et al., 1995, 2012; Beer et al., 2020; Olofsson et al., 2001), which in combination with snow trampling in winter (Beer et al., 2020) tend to reduce annual permafrost temperatures. Finally, herbivore grazing can cause an increase in nutrient availability and acceleration in nutrient cycling (Olofsson et al., 2004, 2001; Raillard and Svoboda, 1999, 2000). The combinations of these changes leads to strong and variable alterations in carbon cycle processes (higher Reco, higher/lower GPP, higher/lower NEE) (Falk et al., 2015; Metcalfe and Olofsson, 2015; Väisänen et al., 2014; Cahoon et al., 2012; Ylänne et al., 2018; Ylänne and Stark, 2019), with net effects highly dependent on site-specific characteristics.
Most existing studies focusing on grazing effects were conducted in Scandinavian upland tundra, while other Arctic domains, and particularly wet tundra ecosystems (e.g., Falk et al., 2015; Raillard and Svoboda, 2000; Kitti et al., 2009), remain sparsely examined to date. A long-term, landscape-scale experiment called “Pleistocene Park”, established in northeastern Siberia in 1996, provides an opportunity to address this research gap. While initially designed to reestablish a “mammoth steppe” ecosystem which dominated this region in the Pleistocene (Zimov et al., 2012), the experiment also allows us to study the impact of large herds of herbivores as an agent to stabilize permafrost ecosystems against degradation linked to Arctic warming. Some of the underlying hypotheses related to the Pleistocene Park project are that herbivore grazing (a) increases carbon sequestration by simultaneously increasing productivity and root formation during the growing season, (b) increases the surface albedo by decreasing shrub and tree cover, and (c) decreases CH4 emissions by decreasing soil moisture through condensing soils and increased evapotranspiration by more active vegetation.
While all the grazing effects listed above have the potential to reduce future positive feedbacks between alterations of the permafrost carbon cycling and the changing climate, so far only limited observational evidence has been presented that allows for evaluating the management effects inside Pleistocene Park. The main objective of the presented study is therefore to provide new insights into the effects of herbivore grazing on carbon cycle processes and ecosystem characteristics within the park. For this purpose, we compare growing-season carbon fluxes from flux chamber measurements along with soil parameters and radiation balance components across an intensively grazed area within Pleistocene Park and a nearby undisturbed site.
2.1 Site description
The study area is located in the Kolyma Lowland region in northeastern Siberia (68.51∘ N, 161.50∘ E), close to the town of Chersky, Sakha Republic, Russia, which is situated around 100 km south of the Arctic Ocean. The weather patterns frequently switch between maritime air masses from the north and continental air masses from the southeast, with the former dominating the wintertime conditions and the latter dominating in the summer. The mean daily air temperature can remain at or below −40 ∘C for several days during December to February, while daily means of more than 20 ∘C can be reached around the peak of summer. The mean annual temperature (averaged for 1960–2009) is approximately −11.0 ∘C. The total amount of annual precipitation (averaged for 1950–1999) is between 200 and 215 mm, with 80 to 110 mm falling as rain (Göckede et al., 2017). Snowmelt leads to an annual flooding event in the Kolyma River and its tributaries, usually inundating large parts of the study area between middle to late May and late June (Kwon et al., 2016).
In the context of this study, we compared carbon fluxes and ecosystem characteristics between two measurement sites in the Chersky region. Both sites are wetland ecosystems situated within the Kolyma Lowland region that are waterlogged for the largest part of the growing season, affected by the flooding regime of the Kolyma River. Our undisturbed reference ecosystem is a tussock tundra site situated about 15 km south of Chersky on the floodplain of the Kolyma River. Due to the very low natural abundance of grazing herbivores in the region, the influence of grazing disturbance on this dataset can be considered negligible. Situated about 15 km further south at the margins of the floodplain, the Pleistocene Park site, hosting a variety of herbivores (sheep, yaks, cows, horses, bison, muskoxen, reindeer), was used to study the effects of grazing on permafrost ecosystems.
The Pleistocene Park area (https://pleistocenepark.ru, last access: 14 March 2022) was established in 1996 on 144 km2 of permafrost territory mainly consisting of ecotonal upland forest–tundra, wet lowland tundra, and small lakes and rivers. About 2000 ha has been fenced in to concentrate animals on the core domain of the park; accordingly grazing disturbance has influenced these sections for about 25 years. Inside the lowland section on a former wet tussock tundra ecosystem, we selected one of the longest and most intensively grazed areas as our grazing study site, hereafter labeled as “GR”, with data being collected at three plots (GR-1 to GR-3) placed within a radius of approximately 6 m. This site, which similarly to the reference site is flooded every year in spring during snowmelt, is a moist or wet meadow almost without shrubs and also featuring decaying tussocks. The vegetation at this site primarily consists of grasses and sedges, including Calamagrostis langsdorfii, Carex appendiculata and Eriophorum spp. (Euskirchen et al., 2017). Before the introduction of grazing herbivores, this site used to be dominated by tussocks and saturated with water during the whole year (Sergey Zimov, personal communication, 2019). Prior to disturbance, the study site therefore represented the typical lowland wet tussock tundra ecosystem dominating large parts of the Kolyma Lowland region.
The reference site, hereafter labeled as ungrazed site “UGR”, is located outside the Pleistocene Park domain on a wet tussock tundra floodplain along the Ambolikha River, a small tributary of the Kolyma River. Here, a long-term monitoring site was installed to investigate drainage effects on wet tundra ecosystems (Kwon et al., 2016; Kittler et al., 2016; Göckede et al., 2019). The reference site for our study is the non-drained control area of this experiment. The dominant vegetation species are tussock-forming Carex appendiculata and C. lugens and Eriophorum angustifolium, with Betula nana and Salix spp. growing on elevated areas with a lower water table. An organic peat layer (15–20 cm deep) has accumulated on top of alluvial material soils (silty clay) (Kwon et al., 2017). In the context of this study, we assume this site reflects the status that the grazed site would have if herbivores had not been introduced there since both sites showed a similar ecosystem structure in the early 1990s (Sergey Zimov, personal communication, 2019). Observations were collected at two plots (UGR-1, UGR-2) to capture some variability concerning vegetation structure and soil properties. Based on results of a previous study evaluating small-scale flux variability across a transect of 10 quasi-randomly selected locations (Kwon et al., 2016), flux rates and environmental conditions within these two plots were shown to be close to the average at this site. In terms of spatial flux variability, UGR-1 (Control-0 site in Kwon et al., 2016) featured a relatively high productivity, while UGR-2 (Control-2) showed comparatively reduced flux rates.
2.2 Measuring radiation and soil parameters
Soil temperatures at 5, 15, 25 and 35 cm depth were recorded at 1 Hz during the time when flux measurements were conducted (Th3-s Soil Temperature Profile Probe, UMS GmbH, Munich, Germany). While the two UGR sites were equipped with one probe each, a single probe was used for the three GR sites due to their proximity. To create a gapless dataset for the full experiment period, TS, 25 cm and TS, 35 cm were interpolated linearly (GR sites) or modeled based on a moving average of Tair (UGR sites). TS, 5 cm and TS, 15 cm have been modeled based on air temperature, and in the case of TS, 5 cm incoming shortwave radiation and corresponding TS, 35 cm were used additionally in the course of stepwise linear regressions to improve the prediction.
For soil moisture (SM) measurements, we installed a set of three TDR (time-domain reflectometry) probes (models CS640, CS630 and CS605; Campbell Scientific, Logan, UT, USA) combined for all three GR sites at depths of 7.5, 15 and 30 cm close to the soil temperature sensor and recorded at 1 Hz intervals. At the UGR site, due to the waterlogged conditions, soil moisture was permanently saturated, and no measurements were used within the context of this study. SM values at GR were flagged using plausibility limits, and systematic offsets were corrected. Since the soil moisture data were also only collected during times of flux measurements, values were subsequently linearly interpolated to create continuous time series. For both soil temperature and soil moisture sensors, the surface height between tussocks was used as the reference (0 cm).
Thaw depths were measured with a metal pole that was stuck into the ground, directly next to the chamber plot, to avoid disturbance, until it hit the frozen bottom of the active layer. The measured thaw depth was defined as the distance between this point and the ground surface, which included the organic layer on top, and loose material was softly pressed down until more or less stable ground was touched.
Radiation budget components for the GR sites in Pleistocene Park were measured using a net radiometer (model CNR1, Campbell Scientific, Logan, UT, USA) installed at 4 m height on a pole approximately 15 m away from the flux sampling sites. At the UGR sites located at the Ambolikha site, a net radiometer (model CNR4, Campbell Scientific, Logan, UT, USA) permanently installed on a 5 m tall flux tower located approximately 50 m away from the sampling sites provided radiation observations.
Measurements were stored as 10 min averaged intervals. Albedo was derived by dividing the average upwelling shortwave radiation by the average downwelling component for each single day. Then, these daily averages were averaged over the observation period. While photosynthetically active radiation (PAR) was measured directly at the UGR site, at GR it was converted from incoming shortwave radiation data using a single conversion factor provided as a function within the R package “LakeMetabolizer” (Winslow et al., 2016) following an approach described by, e.g., Britton and Dodd (1976). Calculations with this statistical package, as for the other R packages listed below, were conducted using R Version 4.1.1 (R Core Team, 2021).
2.3 Measuring fluxes using chambers
Directly prior to measurements at GR, wooden fences were constructed to protect the sites from grazing animals during chamber operation. At both GR and UGR sites, walking boards were placed around the setup to prevent damaging plants and to minimize influences on measurements by disturbing the soil. Our flux chamber approach closely followed Kwon et al. (2016, 2017) and is therefore only briefly outlined in the following paragraphs.
Carbon dioxide, CO2 and methane (CH4) fluxes were determined with a non-steady-state flow-through method using an Ultra-Portable Greenhouse Gas Analyzer (UGGA, Los Gatos Research, USA) for in situ measurements of gas concentrations at 1 Hz. PVC collars of 60 cm × 60 cm, which have a socket at the top for the chamber, were installed in the ground at each plot to prevent leaking of air during chamber measurements. The cubic chamber hoods with a 60 cm side length, made of 4 mm thick plexiglass, were placed on these collars to capture gases exchanged with the surface. They featured an opening valve on the top to avoid pressure effects when the chamber is placed onto the collars. Inside the chamber, three electric fans were installed to ensure well-mixed conditions. Air was pumped from the chamber to the gas analyzer through three tubes installed at different heights inside the chamber hood. Sensors for air temperature (Tair), relative air humidity (RH), air pressure (pair) and photosynthetically active radiation (PAR) were attached to one side of the chamber. For measurements, the chamber was oriented in a way to minimize shading the vegetation with the instruments.
Each flux measurement was conducted for a period of about 2 min. This period was chosen in order to minimize disturbance effects such as temperature increases or moisture saturation within the chamber (e.g., Kutzbach et al., 2007) while at the same time collecting enough information for the derivation of a stable flux rate. After completing one measurement, the chamber was lifted and tilted for ventilation until ambient CO2 concentrations were reached. Ecosystem respiration (Reco) was determined by covering the hood with a white polyethylene tarp that completely blocked incoming radiation. For each plot, one measurement iteration consisted of three NEE measurements and two Reco measurements.
On each sampling day at GR, we rotated between chamber locations, with about 1 full hour needed to complete the five individual measurements at each of the three plots. Since the two plots at UGR were located further apart, we conducted several individual measurements at one location before switching to the other to minimize the time needed for relocating instrumentation. On each day, only one of the study sites (UGR vs. GR) was sampled.
2.4 Calculation and interpolation of carbon fluxes
Each chamber measurement resulted in a 1 Hz time series of CO2 and CH4 concentrations. After excluding the equilibration period of at least 20 s, periods with a minimum length of 40 s and a linear concentration change in greenhouse gases were identified based on the change point detection algorithm provided by the R package “changepoint” (Killick et al., 2016). Subsequently, using the R package “boot” (Canty and Ripley, 2021) we generated 1000 combinations of start and end times within this period and calculated an ensemble of stationarities (slopes) using a bootstrapping approach. The final slope used for flux computations was identified as the frequency distribution's median. Implausible or disturbed signals were manually flagged and excluded from further analysis. Such cases included for example unstable signals without a distinctly discernible, steady slope, which are not clearly interpretable, or signals obviously disturbed by leakage. The total quantity of measurements is shown in Table 1.
Table 1Number of light (NEE) and dark (Reco) measurements for each chamber site and total number of measurement days that passed the quality screening. The lower data coverage of UGR-2 reflects the distribution of raw data collected and is not related to data quality screening.

The median slope () of greenhouse gas concentration change over time was transformed to a flux using the following formula:
Vch and Ach are the volume and surface area of the chamber, respectively. R is the ideal gas constant (8.3144 J K−1 mol−1); Tair and pair are the mean air temperature (K) and pressure (Pa) inside the chosen interval. Fluxes are derived in units of µmol C–CO2 m−2 s−1 and µmol C–CH4 m−2 s−1, respectively.
While fluxes of Reco and NEE could be calculated based on dark and light chamber measurements, respectively, the photosynthetic uptake portion of the flux (GPP) was calculated as the difference between measured NEE and the mean of measured Reco for one measurement. The root mean square error (RMSE) of each flux measurement was calculated using all bootstrapped slopes, distinguishing between Reco and NEE measurements. The slope error for GPP was taken as the summed errors in Reco and NEE measurements. Error values are given in Table B1 in the Appendix.
To analyze the implications of the grazing disturbance on net CO2 and CH4 exchange across the sites, the time series of flux estimates for each plot was interpolated across the entire measurement period of 17 d at a resolution of 10 min. Both Reco and CH4 fluxes were interpolated using empirical plot-specific linear models linking flux rates to environmental parameters (TS, Tair and SM). Parameters minimizing the fit uncertainty were not uniform across plots even at one site (see Appendix B for an exact description of this approach, including the derivation of formulas, and Sect. 4.2 for evaluation). The following formulas were derived to interpolate Reco and CH4 fluxes:
In each formula, a0 is the slope of the first applied model, and a1 is that of the second. b0 and b1 are corresponding intercepts. Total errors for all fluxes were derived considering the standard error from the final model compared to observed values (linear regression), further considering the standard error from the bootstrapping approach used to transform measured concentration slopes into fluxes and the standard error from modeled TS (for Reco and CH4 fluxes). A detailed error calculation is shown in Appendix B3.
GPP was modeled as a function of PAR, using a rectangular hyperbolic function (Runkle et al., 2013).
The fit parameters α and Pmax represent the initial canopy quantum efficiency (the initial slope of the GPP–PAR curve at PAR = 0) and the maximum canopy photosynthetic potential, respectively, the latter of which is the hypothetical maximum of GPP at infinite PAR. Both α and Pmax are assumed to have positive values, necessitating the negative sign on the equation's right-hand side to allow GPP to fit the NEE sign convention. In this context, positive fluxes imply carbon losses from the ecosystem into the atmosphere. This model contains the explicit assumption that GPP is insensitive to light stress or temperature effects (Runkle et al., 2013). For each site, α and Pmax were determined by fitting PAR against the GPP fluxes from chamber measurements and applying a non-linear least-squares (nls) optimization. Implausible PAR values from chamber measurements were replaced by PAR derived from the net radiometer measurements. With these parameters, a continuous GPP time series could be modeled for the entire observation period.
2.5 Statistics
To visualize and compare carbon fluxes between plots and study sites, daily means for GPP, Reco, NEE and CH4 fluxes were calculated. Prior to post hoc pairwise t tests and a correction of p values with Holm's method (Holm, 1979), a repeated measures ANOVA was conducted using the package “ez” in R (Lawrence, 2016); herein the approach is based on Bakeman (2005) and Glover and Dixon (2004). In this way, we can provide evidence that the measurements were independent between days and can correct the results of the pairwise comparisons for multiplicity problems. Statistics and further explanations are given in Appendix B3. This approach was used to analyze fluxes, soil temperatures and radiation (i.e., upwelling and downwelling shortwave radiation) measurements.
3.1 Environmental conditions and ecosystem characteristics
3.1.1 Albedo and energy fluxes
Linked to the differences in vegetation community structure described in Sect. 2, the average daily albedo was slightly higher at GR, with an average value of 0.217±0.008, compared to the UGR (0.192±0.006). The difference between SWd (downwelling shortwave radiation) between sites was insignificant (p=0.23), while the difference between SWu (upwelling shortwave radiation) was significant (p<0.0001). This enhanced reflectivity of the surface increased the upward-directed shortwave radiation by an average of 6.3±3.8 W m−2 over the course of the observation period (mean SWu for GR, 48.6±13.9 W m−2; for UGR, 42.3±13.0 W m−2), in effect reducing the net radiative energy available to the grazed ecosystem.
3.1.2 Soil moisture
Soil hydrologic conditions were distinctly different between grazed and ungrazed sites. At the beginning of the observation period, both sites were primarily waterlogged since the water levels from the preceding spring flooding had not fully receded. From this starting point, we observed deviating temporal dynamics in drying between both ecosystems during the peak of the growing season. Water levels declined only marginally, or not at all, within the ungrazed reference area, with water levels remaining above the ground. Soil moisture at the grazed ecosystem (GR), on the other hand, gradually decreased across all measured depths over the period of observation, especially in the topsoil (SM7.5 cm, 63.1 %–49.9 %; SM15 cm, 64.3 %–54.2 %; SM30 cm, 60.7 %–56.7 %, changes from the first to the last measurement day).
3.1.3 Air and soil temperatures
A change in the general weather pattern around mid-July 2019 split our observation period roughly into a warm and sunny first half, and a cool and cloudy second half. Regarding the mean air temperatures, during the first period (7–15 July), daily average Tair ranged between 14.3–26.9 ∘C, while conditions during the second period (16–22 July) were much cooler (6.9–10.9 ∘C). Mean air temperatures at the grazed site were observed to be about 1 ∘C warmer compared to the ungrazed site, with similar daily minima, while daily maxima were distinctly higher at GR.
The trends in soil temperatures matched those described for air temperature: while Tsoil across the observed vertical profile was rising during the first part of the observation period, in the second half it declined (see also Fig. 1). We found topsoil temperatures at 5 cm depth at the grazed site (GR max 19.6 ∘C, min 9.0 ∘C) to be significantly higher (p<0.0001) compared to the ungrazed reference (UGR-1 max 15.4 ∘C, min 5.6 ∘C; UGR-2 max 11.6 ∘C, min 4.3 ∘C) during the whole observation period. Fitting interpolation equations to the observational data also revealed that the time lag of Tsoil reacting to Tair was 1 order of magnitude shorter at GR – moving averages of air temperatures explaining Tsoil at 5 cm showed best fits when integrated over the last 4.3 h at GR, while they reached back 40.7 h at UGR-1 and even 86.7 h at UGR-2.
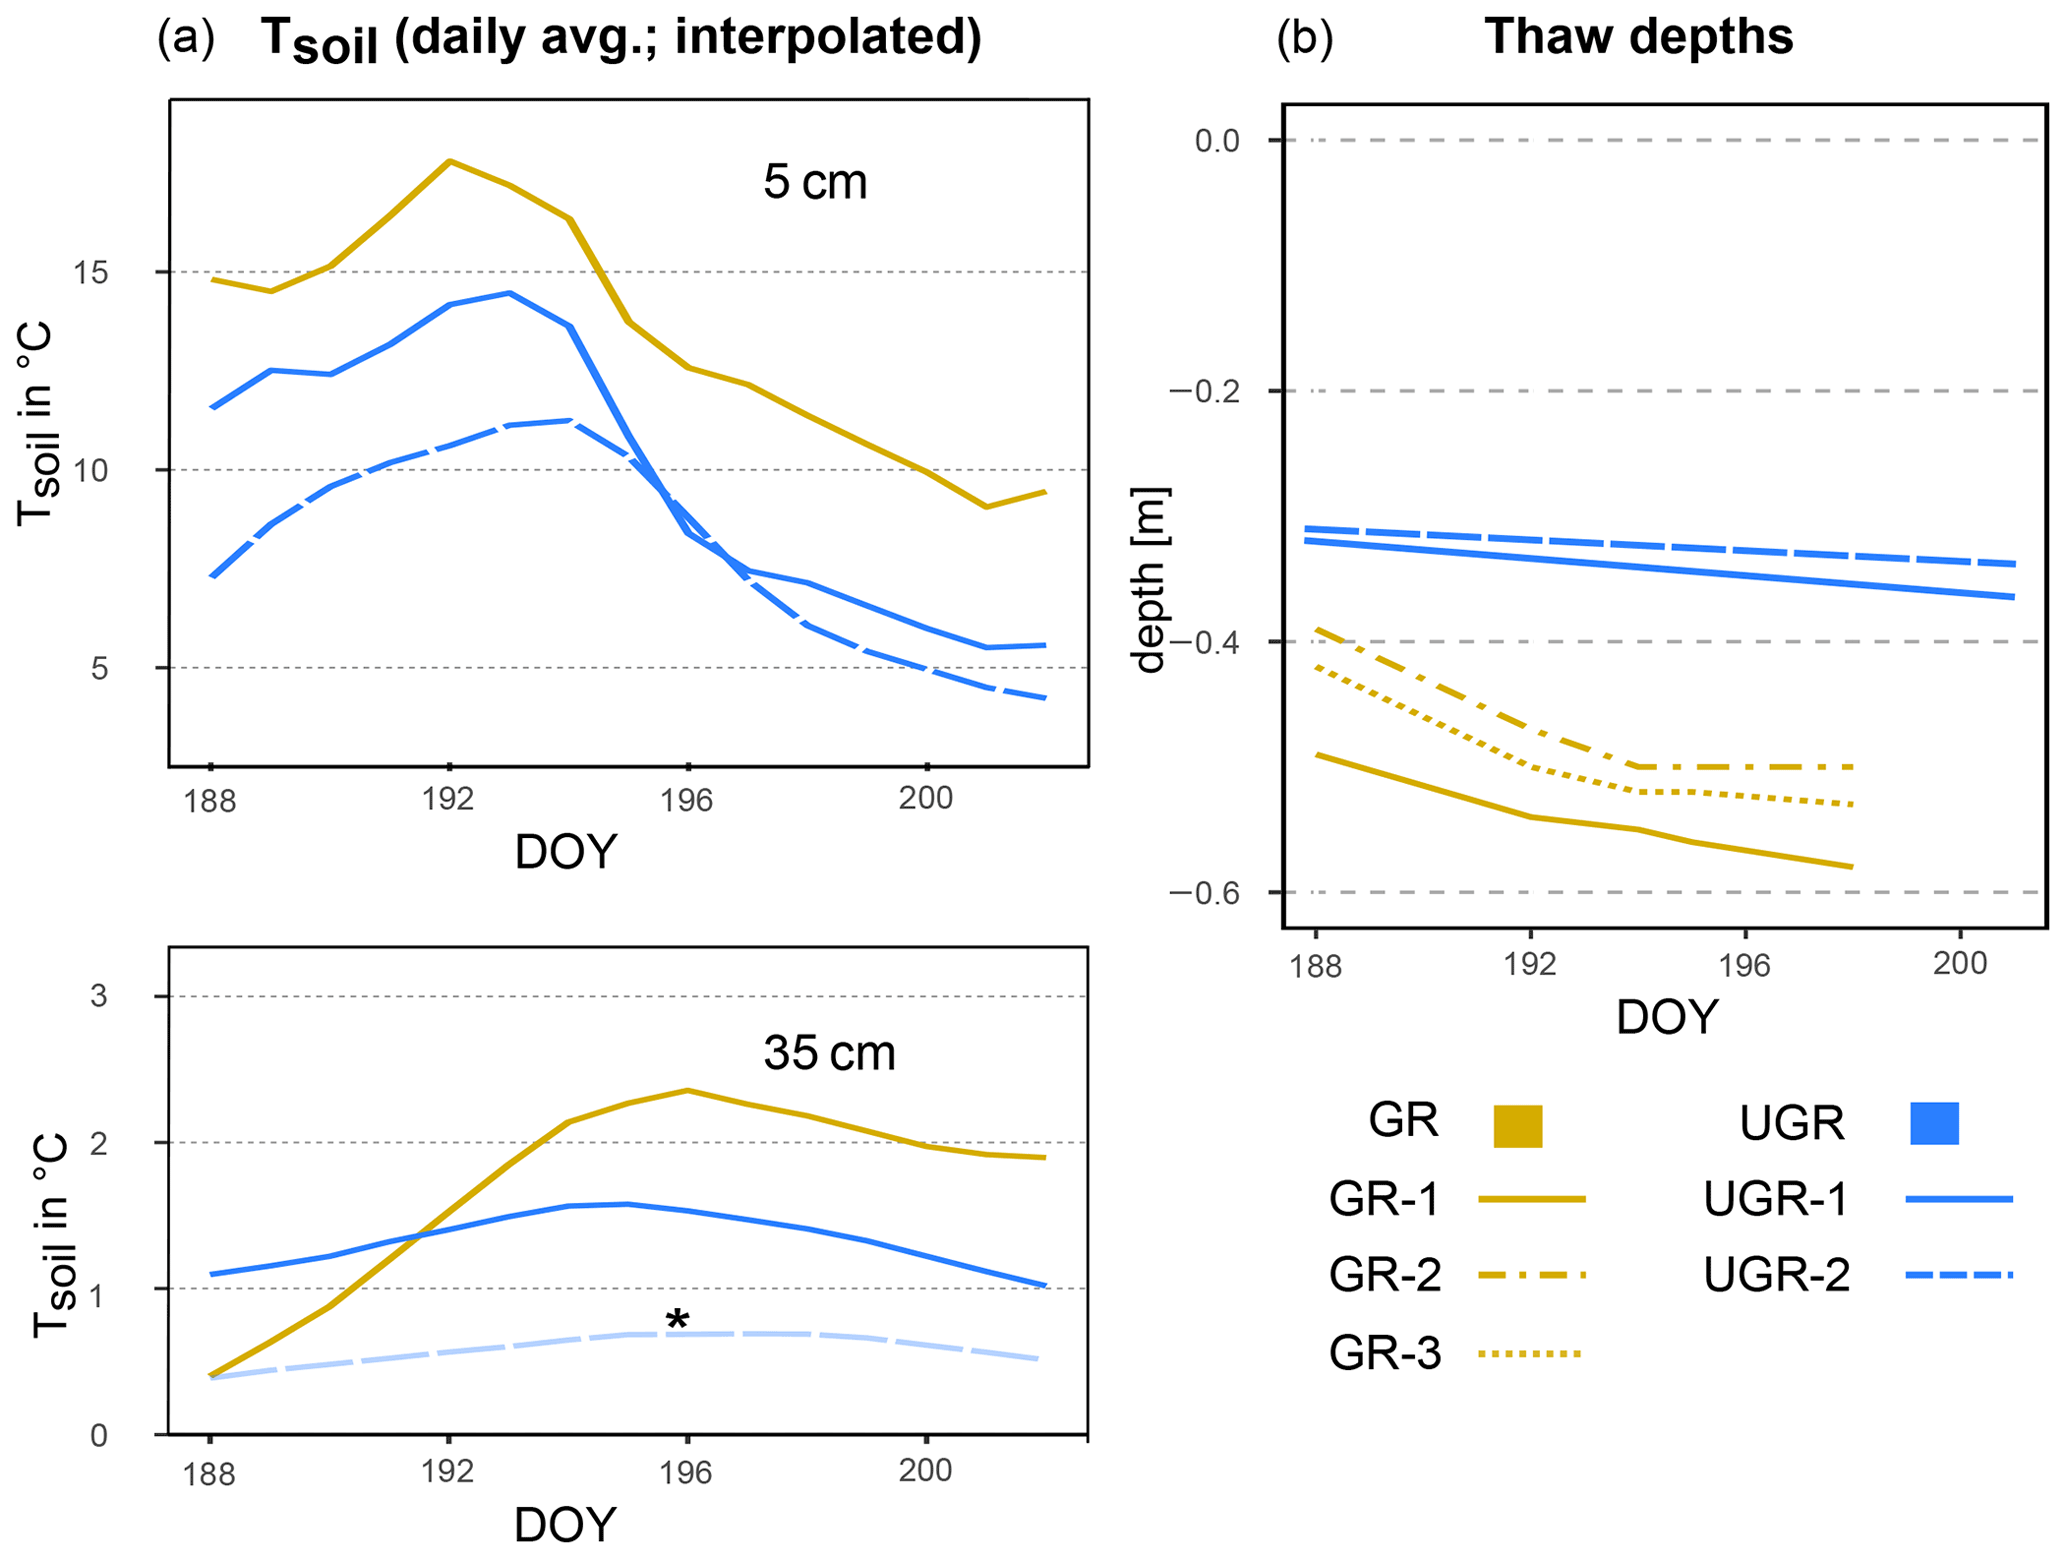
Figure 1(a) Soil temperature (Tsoil) at GR, UGR-1 and UGR-2 at 5 and 35 cm depth. The interpolation model of Tsoil at 35 cm at UGR-2 (*) is not based on a significant fit but follows the expected course closely and is therefore included here for overview. (b) Evolution of thaw depths at all plots.
In the deeper soil layers (15, 25, 35 cm), the temperatures at the UGR-2 site were consistently lower than observed at all other sites (GR, UGR-1). Comparing observations from GR and UGR-1 sites showed similar average soil temperatures during the first week, while during the second week soils became warmer for the drier grazed site. Notably, Tsoil values at 35 and 25 cm at GR were lower compared to UGR-1 during the first measurement days, but due to a steeper warming rate at the grazed site, this changed after 5 d into the observations.
3.1.4 Thaw depths
Measured thaw depths were greater at all GR sites compared to all UGR sites throughout the observation period: while the values within the ungrazed reference area varied between 31–36 cm over time and across sites, that range was 39–58 cm at the grazed site. Importantly, the temporal dynamics as well as the variability across sites also differed strongly between these two study areas. At UGR, the average increase in thaw depths was 0.25 cm d−1 during the observation period. Even though both observation plots were situated about 50 m apart, conditions were fairly uniform between them, and thaw depths did not differ by more than 2 cm. In contrast, the GR sites showed a higher average thaw depth increase (0.91 cm d−1). Differences in measurements between plots reached up to 11 cm, even though sites were only separated by about 3 m and vegetation and soil conditions seemed similar.
3.2 Carbon fluxes
All interpolation models described in Sect. 2.4 yielded a significant linear regression fit between observed and calculated values (for details, see Table 2).
Table 2R2 and p values for linear regressions between final modeled fluxes and measured fluxes at ungrazed (UGR) and grazed (GR) sites.
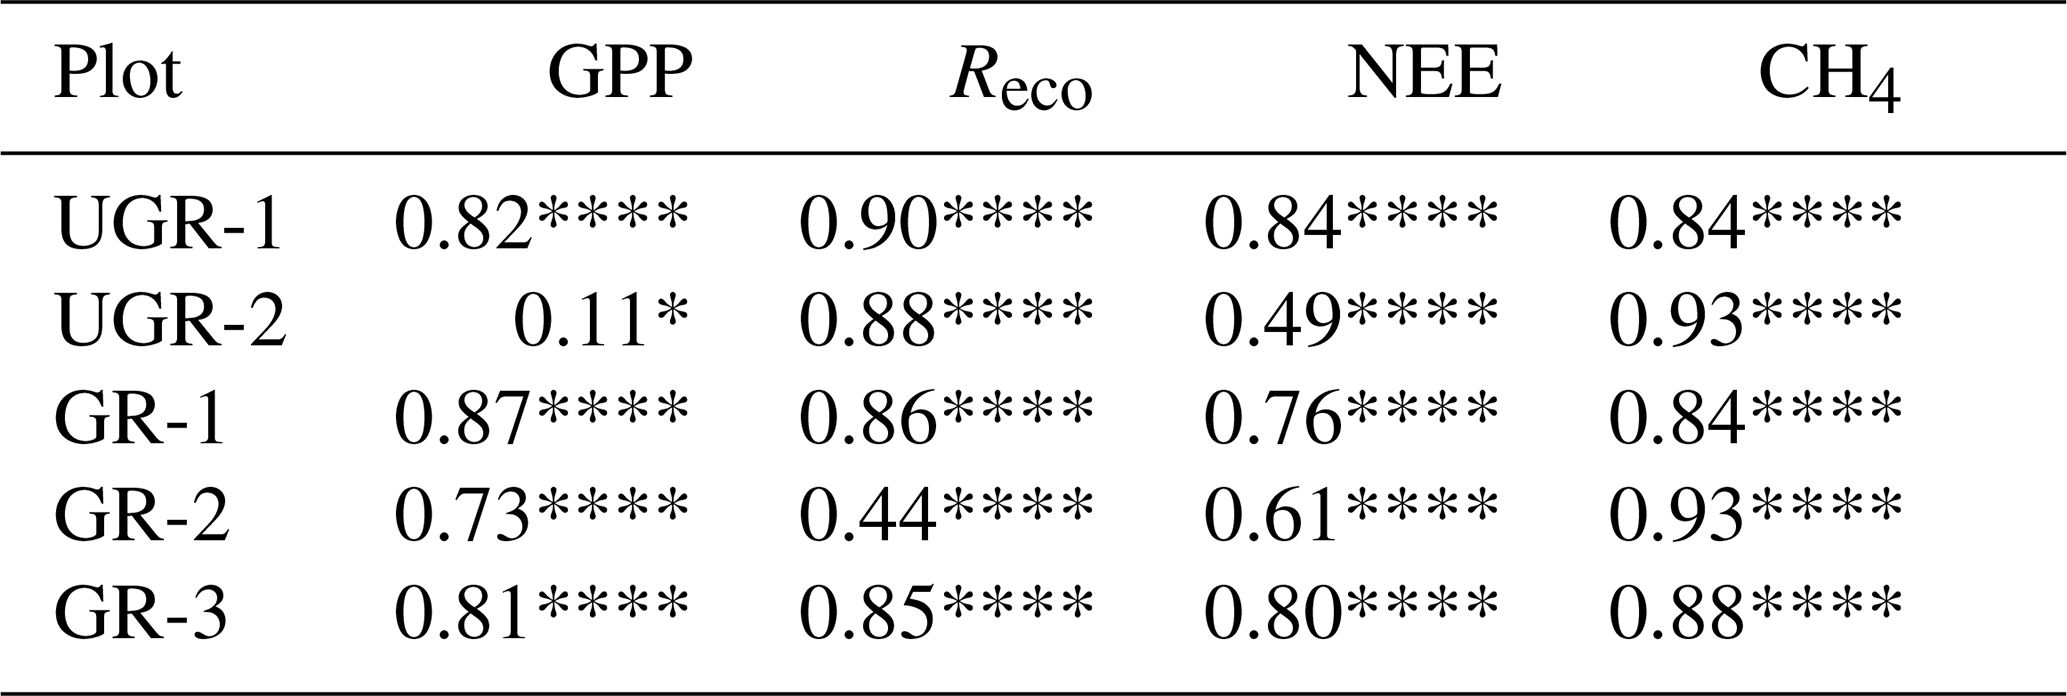
****, ***, **, * and ns indicate p<0.0001, p<0.001, p<0.01, p<0.05, p>0.05 and non-significant, respectively.
3.2.1 CO2 fluxes
As reflected in the strong enhancement in both component fluxes of NEE, i.e., GPP and Reco, the carbon turnover rates in the grazed ecosystem increased as a response to the warmer and drier conditions in the topsoil layers (see Fig. A1). Regarding photosynthetic uptake of CO2, the average GPP was significantly higher at GR compared to UGR (p<0.0001; see Fig. 2). While all three GR plots show higher GPP compared to the UGR sites, the difference in average GPP between the sites is dominated by differences between the greater fluxes at plot GR-2 and lower fluxes at UGR-2, while differences between GR-1, GR-3 and UGR-1 were significant (at least with the pairwise t tests used) but rather small to negligible.
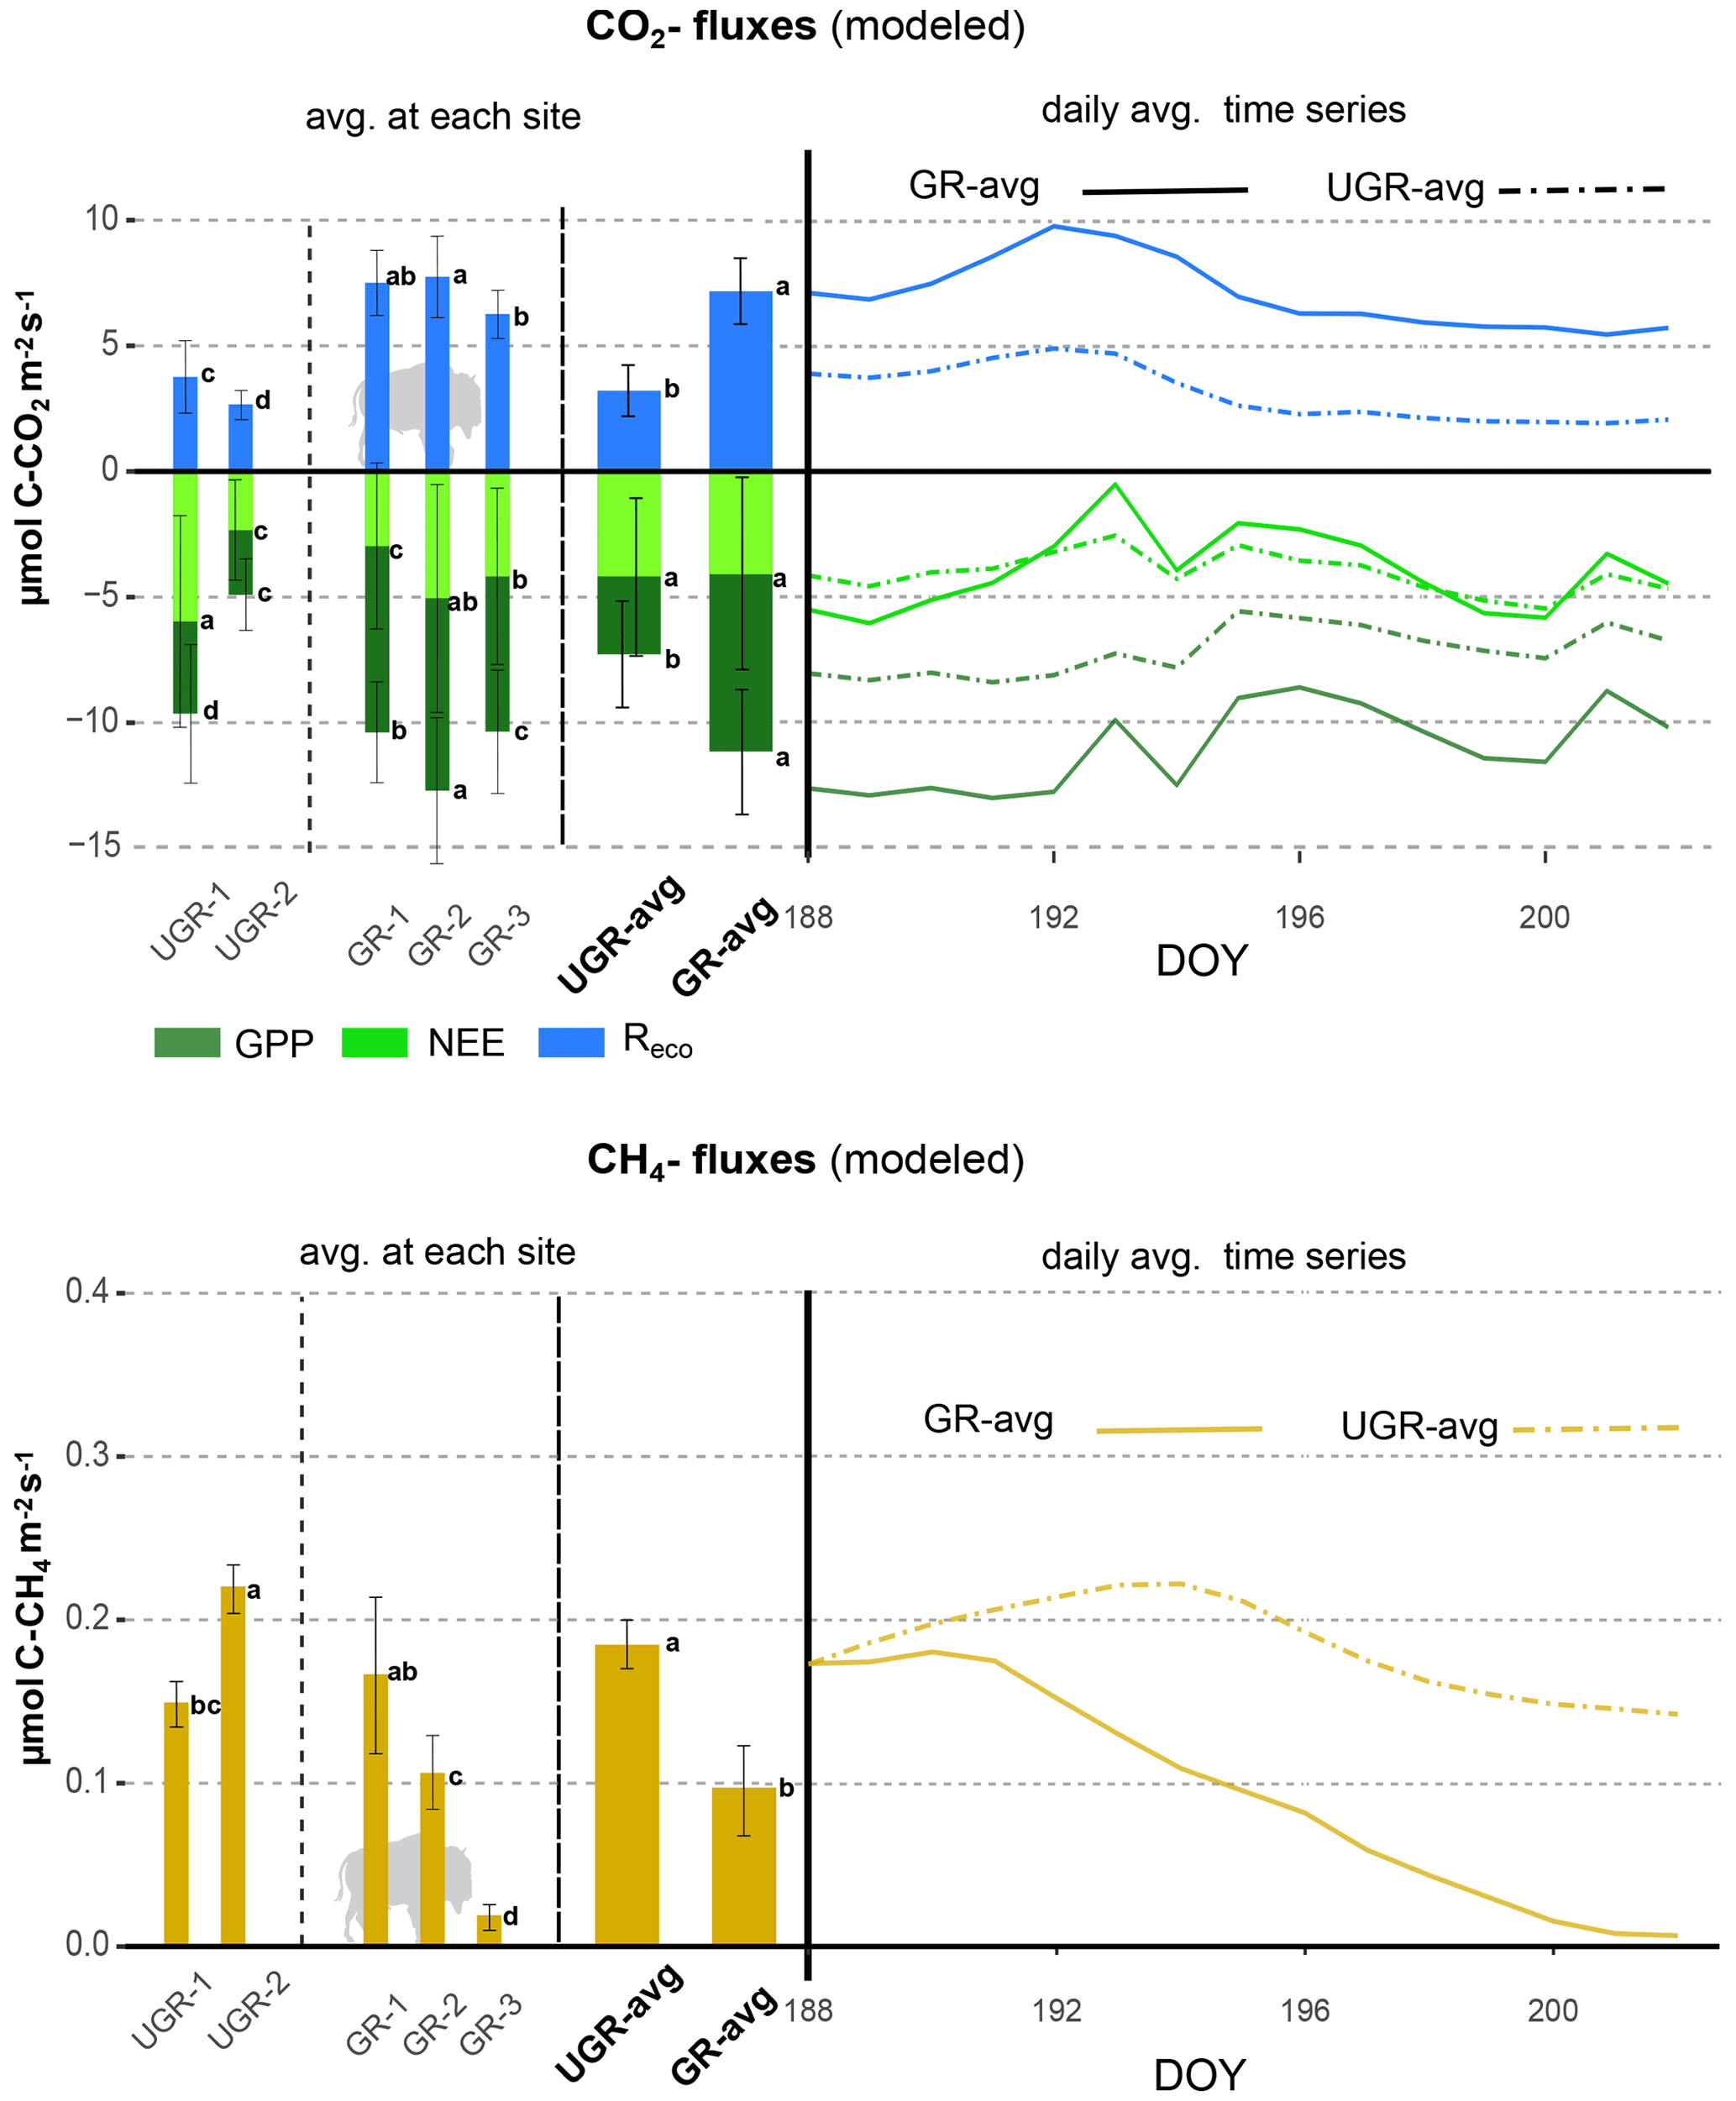
Figure 2Overview of C fluxes at all chamber plots from 7 to 21 July. Differing letters indicate significant differences between plots (p<0.01; please also see Table B3 for details). Overall (site average), NEE did not differ significantly between GR and UGR, while GPP and Reco were significantly larger at GR. Daily average CH4 emissions at grazed plots strongly decrease over time, leading to a substantial net reduction in methane emissions at the GR plots, compared to the UGR reference.
Across the entire measurement period, ecosystem respiration Reco was distinctly higher at GR compared to UGR. In this case, site differences were more consistent; i.e., differences in flux rates between plots for each site were minor. Greater Tsoil and decreasing SM were identified as the main controls for the higher Reco at the GR sites, except for GR-3 where Reco did not increase in response to drying. Possible reasons for that are discussed in Sect. 4.2.
For NEE, the observed differences in both GPP and Reco canceled out, resulting in no significant changes in NEE as a function of grazing disturbance. Temporal dynamics in NEE largely matched each other across sites, including a decrease in net uptake rates during the first and warmer week of the observation period and an increased uptake during the subsequent, cooler days. GR-2 was found to be the strongest carbon sink in the first period, while NEE at UGR-1 was largest during the second. Overall, all sites were consistent sinks for atmospheric CO2 during the observation period.
3.2.2 CH4 fluxes
We observed strong variations in CH4 fluxes between the plots at GR and UGR sites. While flux rates at both GR and UGR were similarly large at the beginning of the experiment, average CH4 fluxes at GR plots started to decline within the first week of observation, in close correlation with decreasing soil moisture. In contrast, the high water table at UGR facilitated high CH4 fluxes throughout the observation period, and changes in time were mostly connected to changes in soil temperatures.
At both sites, the variability in CH4 fluxes across plots for each site was larger compared to the CO2 fluxes. Particularly for GR, flux estimates even between closely co-located plots changed from virtually zero to rates similar to those found at the ungrazed site. Fluxes at GR-3 were smallest throughout the observation period. During the first days of the experiment, characterized by high soil moisture, CH4 emissions at GR-1 and UGR-2 were largest, while in the second period, when soils at GR dried, they were largest at UGR-2 and UGR-1.
4.1 Assessing the quality of flux chamber measurements
The application of flux chambers may lead to biases in the ecosystem fluxes themselves (Kutzbach et al., 2007). Installing collars in the ground before starting the experiment, while necessary to prevent leaking of air, can disturb the soil and plant roots. At Pleistocene Park, we had to cut a shallow slit in the ground to be able to tightly fit in collars. In a long-term study assessing both chamber and eddy-covariance fluxes conducted in the Alaskan tundra, disturbing roots and soil when the chamber was set up was shown to have a depressing effect on both Reco and, to a stronger extent, GPP. The chamber fluxes only caught up with the eddy-covariance fluxes a few years after installing the chambers, most likely linked to a regeneration of belowground structures after the initial disturbance (Celis et al., 2017). In the case of our study, the collars at UGR had already been installed 6 years before the start of the experiment, and accordingly the disturbance effect should have been negligible. In contrast, installation artifacts are likely at GR, where collars were only installed days before starting the 2019 measurement campaign, potentially leading to underestimated fluxes, mainly considering GPP. The observed enhancement in both GPP and Reco following drainage may therefore be a conservative finding. A net effect on the derived shifts in NEE is also possible, since GPP and Reco can be affected in different ways, but a quantification of the potential bias cannot be performed without a longer-term observational dataset.
Another important aspect concerning representativeness of chamber-based carbon flux measurements is small-scale heterogeneity in the ecosystem, which may exist even within plots that are seemingly homogeneous. This heterogeneity is observable at sub-meter scales and can be a result of disturbances by soil fauna, pockets of fine-root proliferation, moisture gradients, freeze–thaw dynamics, spatial structures in vegetation distribution such as those introduced by tussock-forming plants or remnants of decaying organic matter (Davidson et al., 2002). In the Arctic tundra, this small-scale heterogeneity is common (Aalto et al., 2013; Zona et al., 2011) and is, e.g., reflected by variations in soil temperature, soil moisture and thaw depths. To account for it in flux uncertainties, more than one chamber is needed to adequately assess the mean and variance of surface–atmosphere exchange fluxes (Davidson et al., 2002). At UGR, spatial variability in carbon fluxes and environmental conditions was analyzed in detail along a transect of 10 flux chamber plots in a previous study (Kwon et al., 2016), including a description of the vegetation community structure and hydrologic status at each plot. Based on these findings, we selected two positions for the presented study (IDs 2-0, 2-2) which best represent the vegetation composition of a waterlogged tussock tundra that dominated the grazed site before the Pleistocene Park experiment was started in the 1990s. At GR, the relatively low number of plots available for this study, combined with the lack of previous studies within the area, implies that a larger-scale representativeness of this part of the dataset cannot be validated. In combination with the short temporal coverage, the GR dataset should therefore be regarded as a snapshot in both space and time, demonstrating that there is the potential for significant changes in carbon cycle processes following grazing disturbance in permafrost wetlands while not necessarily providing representative flux quantification for a larger domain. As a guideline to evaluate the captured variability across plots, coefficients of variance (CVs) can be computed. CVs of Reco measurements in seemingly homogeneous ecosystems typically range around 30 % and reach higher values for CH4 fluxes, which tend to be more location-specific (Davidson et al., 2002). For our study, the CV for Reco at GR was 11 % but reached 20 % at UGR. For CH4, CVs were 77 % and 32 %, respectively. The characteristics found in our dataset are therefore generally in line with findings presented by Davidson et al. (2002), with the low CVs for Reco potentially linked to the relatively low number of plots observed. However, one has to keep in mind that the GR sites feature more plots than UGR and also a higher number of observations, both of which may influence a comparison of derived CVs.
4.2 Environmental parameters controlling carbon fluxes – implications for interpolation
Generally, Reco in wet tundra and peatlands is enhanced by warmer temperatures due to increased microbial activity (Ueyama et al., 2014; Aurela et al., 2007; Kwon et al., 2016), and it may also increase due to drying, with increased potential for aerobic respiration (Lafleur, 2009; Kittler et al., 2017; Kwon et al., 2016). Identifying and comparing the controls for Reco resulted in different equations across the GR and UGR sites, linked to the fact that their vegetation and soil structures differed, as described in detail below.
The GR site is a flat meadow with dense grass tillers, some decaying tussocks, and relatively dry and warm soils. At UGR, soils are waterlogged and interspersed with tussocks raised above the water level, and the relatively cool, wet soils are covered by a thick organic layer. These differences justify the use of different sets of controls to explain temporal variability in Reco. At UGR, we used only Tair as a driver for interpolating Reco, since the water table was constantly above the ground, and accordingly fluctuations in soil moisture were ruled out. At GR, we used Tsoil at 5 cm and SM at 7.5 cm instead to explain variability in Reco. Our choice is in line with other studies correlating Tsoil and SM with Reco (Huemmrich et al., 2010). Here it is important to remember that we had only one set of instruments to measure Tsoil and SM at GR. However, thaw depths and CH4 fluxes (an indicator for wet/anaerobic conditions; Kwon et al., 2016) at the grazed plots varied strongly at this small scale. Therefore, we concluded that the measured soil conditions are not fully representative across the three sub-plots. For that reason, at GR-3 Tair was also used to interpolate Reco, since the coefficient of determination was much higher compared to that of Tsoil. No statistical relationship between Reco and SM could be found for this plot.
Also CH4 fluxes varied strongly between GR plots, being highest at GR-1 and lowest at GR-3. Principally, high Tsoil and water-saturated conditions promote a high CH4 release (Kwon et al., 2017). We observed an almost continuous cooling trend from warm to cold across the whole observation period. At the same time, soil moisture also continuously decreased. Therefore, high SM was always accompanied by high Tsoil and low SM by low Tsoil. This made it difficult to disentangle their effects on CH4 fluxes.
4.3 Chamber fluxes in Arctic tundra ecosystems
Estimates of carbon fluxes obtained by chamber measurements in this study cover a similar range compared to recent reference studies related to grazing in the Arctic tundra (see Table 4). Still, when directly comparing the results between studies, one has to keep in mind inter- and intra-annual variability in environmental conditions and therefore also in carbon fluxes, which are highly pronounced in tundra ecosystems (López-Blanco et al., 2017; Falk et al., 2015). Differences in experimental approaches regarding how to assess and display the fluxes further aggravate the comparison of fluxes across studies. Furthermore, many studies cover longer timescales compared to this study.
Values presented by Kwon et al. (2016), obtained during flux chamber campaigns from the period 2013–2015 at the Ambolikha site that served as the UGR reference within the context of the presented study, largely agree with our findings. A wet Carex meadow (grazed by geese) in a subarctic coastal tundra showed very similar values compared to values at UGR (Kelsey et al., 2016). Most of the other studies displayed in Table 3 were conducted in the high Arctic; therefore flux magnitudes are expected to be lower compared to our study (Cassidy et al., 2016; Falk et al., 2015; Curasi et al., 2016). Falk et al. (2015) observed similar patterns concerning the amplification of both GPP and Reco as a response to grazing compared to our study for a wet tundra ecosystem. However, we are not aware of studies examining carbon fluxes on a similar type of grazed ecosystem to that at Pleistocene Park, in corresponding climatic conditions.
Table 3Mean daily C fluxes for each chamber site (total SE in brackets). Values in µmol C m−2 s−1.
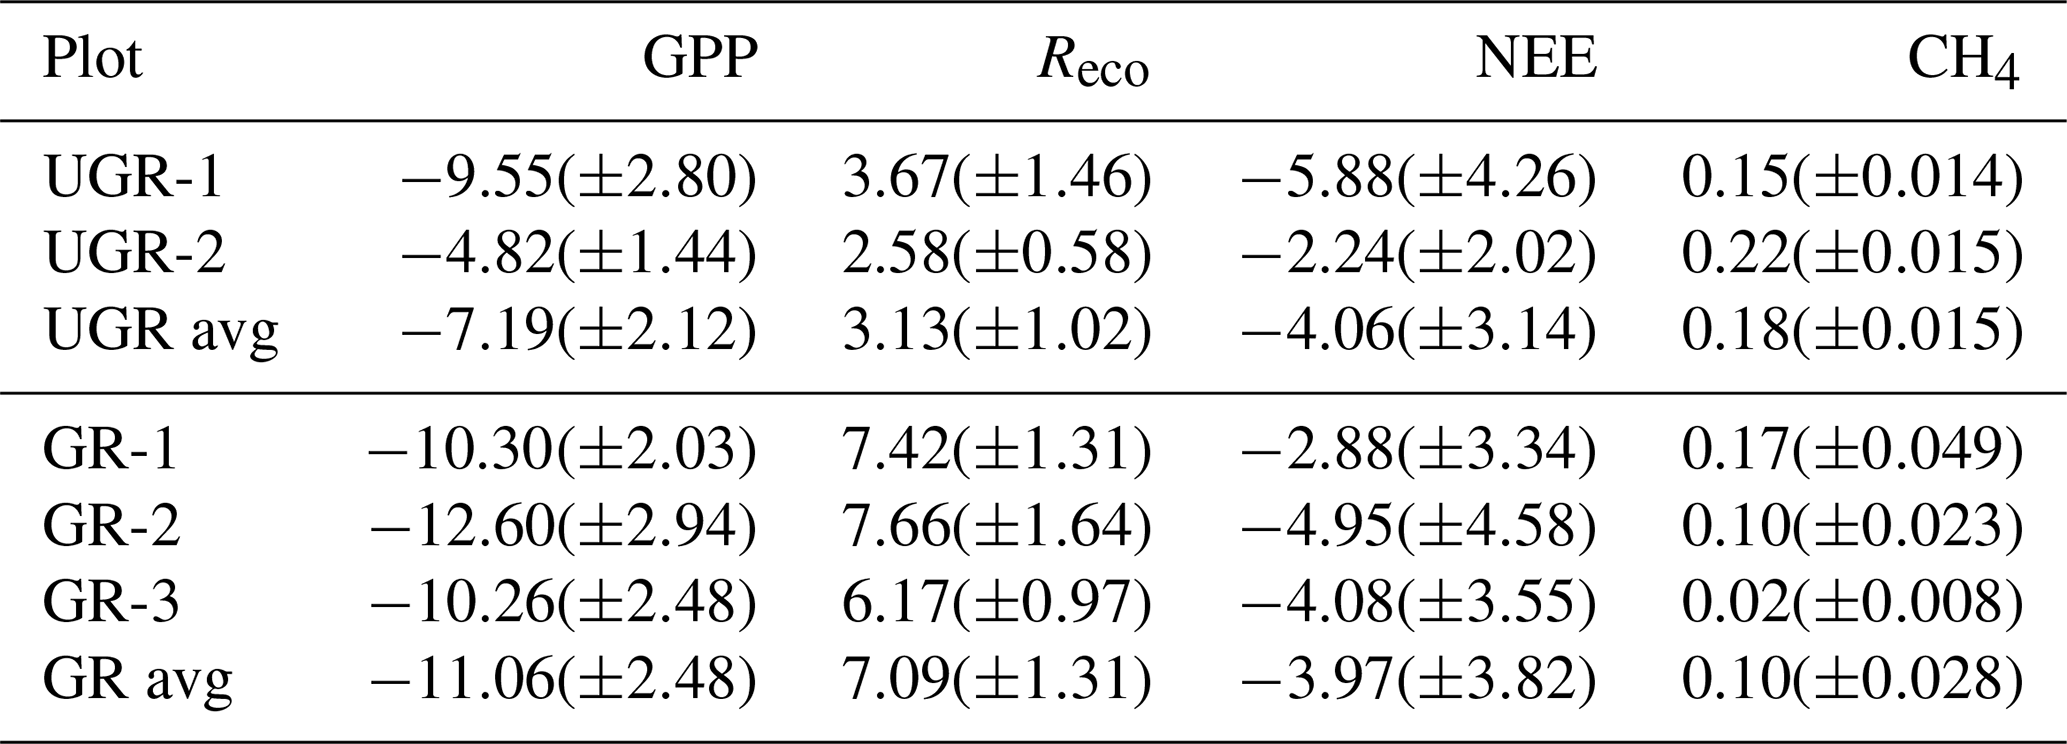
Table 4Comparison of mean growing-season fluxes (chamber measurements) in recent studies. Values in µmol C m−2 s−1.
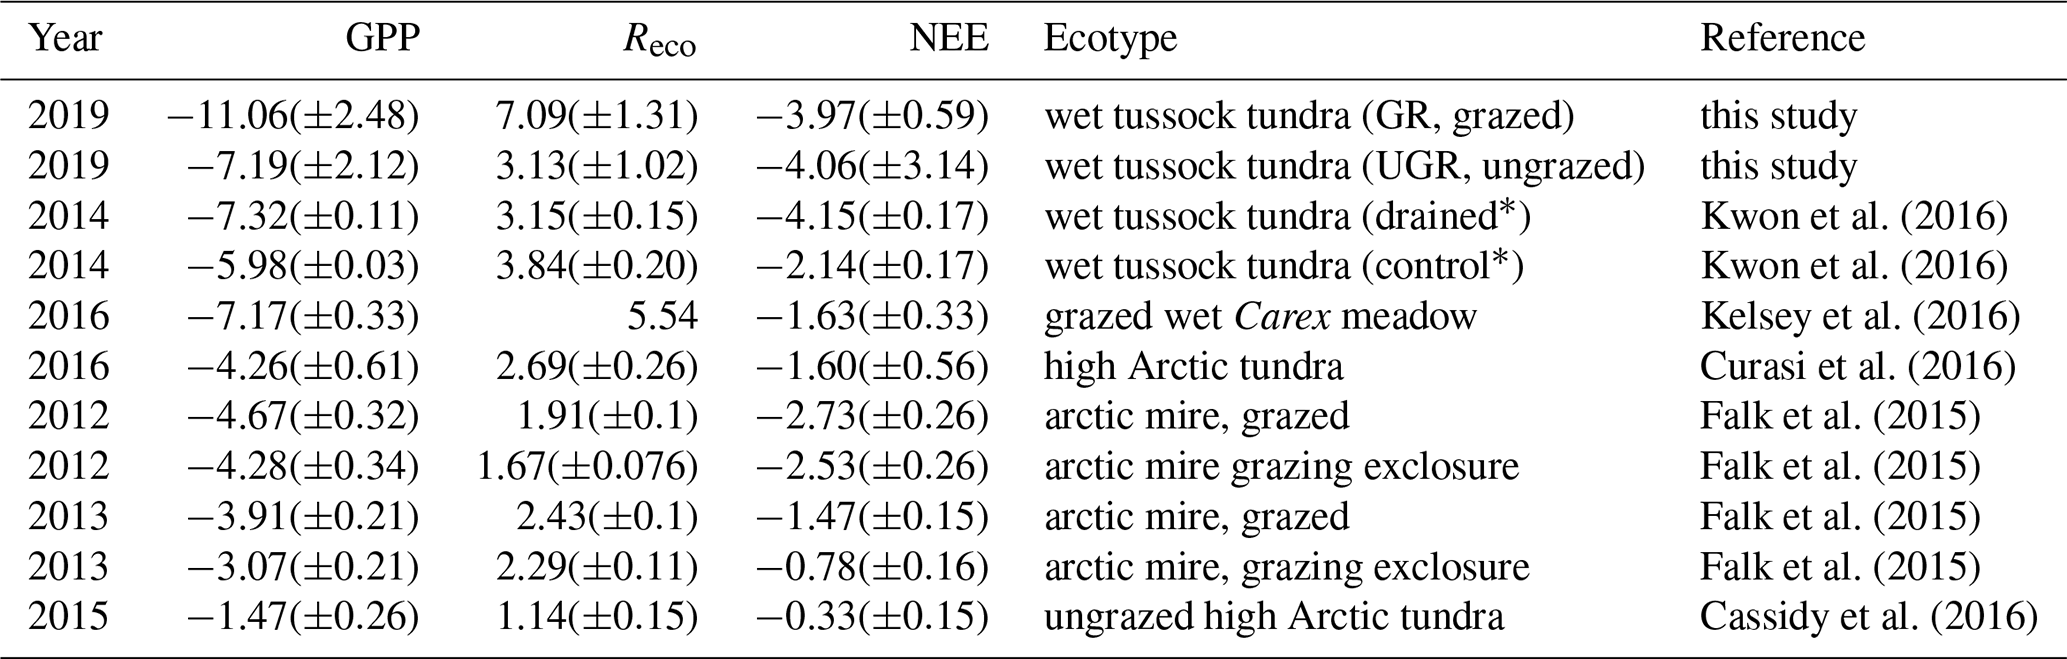
* Indicates sites in the same area as UGR in this study.
4.4 Grazing impacts on vegetation and albedo at Pleistocene Park
Grazing by large herbivores had a number of obvious impacts on the vegetation in Pleistocene Park. However, one issue that complicates the attribution of the herbivore influence on the vegetation is the year-long human disturbance by the park operations, such as operation of vehicles or feeding animals in winter. While this influence is mostly restricted to selected areas and transects across the park and no major direct impact was apparent for the study plots used within the context of this study, one cannot completely disentangle the impacts of anthropogenic and grazing disturbances. Another issue that needs to be considered when interpreting the presented intercomparison of GR and UGR sites is potential differences in site characteristics that were already present before grazing management in the Pleistocene Park areas started. Lacking pre-treatment flux datasets for both sites, the only reference that is available is the similar appearance of both GR and UGR sites in photographs from the early 2000s, i.e., a time when ecosystem transformation due to grazing was still in an initial stage. Accordingly, while the differences in aboveground ecosystem characteristics described below can clearly be attributed to grazing pressure over the past 2 decades, the highlighted differences in carbon fluxes may at least partially have been present in the pre-treatment state. While unlikely to affect the qualitative tendencies of higher carbon turnover and reduced methane emissions, this potential systematic bias clearly needs to be considered when evaluating and interpreting the flux numbers.
Around our chamber site at GR, almost all sedge tussocks were in a state of decay or had disappeared nearly completely. In place of them or between their remnants, many single plant tillers (mainly Carex spp. and Calamagrostis langsdorfii) grew. These apparent changes in soil and vegetation properties in Pleistocene Park are in accordance with previously reported observations documenting grazing impacts. For example, the transformation from tussocks to grass mats by grazing, accompanied by a strong increase in belowground biomass, has already been observed for montane biomes (Hofstede and Rossenaar, 1995; Pucheta et al., 2004). Some sedges found in Arctic environments, such as Carex aquatilis, were shown to benefit from muskox grazing, since they feature strong root production and the ability to produce dense grass tillers and therefore more easily recover from grazing (Raillard and Svoboda, 1999; Kitti et al., 2009). This ability gives them an advantage over other species (Tolvanen and Henry, 2000), leading to a more turf-like vegetation structure that gradually replaces the original plant community.
Fertilization of tundra ecosystems through available nutrients from urine and faeces also influences vegetation communities under grazing pressure (Raillard and Svoboda, 1999, 2000). Accelerated urea-nutrient uptake by living plants has been reported for upland tundra (Barthelemy et al., 2018), where graminoids were more efficient in using these resources compared to shrubs. At ungrazed sites such as UGR, the aboveground parts of the plant die off, wither and accumulate on the topsoil, where they rot slowly, leading to a thick organic layer (Kwon et al., 2016). In comparison, at grazed sites such as GR, the plant shoots were regularly removed by the animals, resulting in reduced litter accumulation. Linked to the same effect, valleys in the Canadian Arctic which are regularly grazed by muskoxen give the impression of a productive meadow, while ungrazed sites in the same region appear overgrown and rather nutrient starved (Raillard and Svoboda, 2000). Similar effects were observed by Falk et al. (2015), where excluding muskoxen from an Arctic mire decreased the number of plant tillers and increased litter and moss cover. In both upland and lowland tundra ecosystems, herbivores, mostly reindeer or muskoxen, have been shown to reduce moss cover and decrease shrub cover by trampling and browsing, promoting the expansion of graminoids (Kitti et al., 2009; Manseau et al., 1996; Olofsson, 2006; Ylänne et al., 2018; Falk et al., 2015). Landscapes covered by graminoids usually have a higher albedo compared to shrub-covered ones (Te Beest et al., 2016; Chapin et al., 2005). Accordingly, herbivore grazing can systematically increase the surface reflectivity and therefore reduce ecosystem energy input. This observation agrees with our results, which show a significantly higher albedo at GR compared to UGR. Within Pleistocene Park, we are confident that in more shrubby, heavily browsed upland tundra and taiga areas, the increase in albedo following the grazing impact is even more pronounced due to the expansion of graminoids. Since the grazing history of about 22 years at Pleistocene Park is still relatively short, the ecosystem is most probably still in a transition state. We therefore expect further changes in vegetation community structure over the coming decades, given a persistent grazing pressure, i.e., a further condensing of the grass mat and accordingly increased tiller formation and living belowground biomass. Denser grass cover is likely to further enhance the albedo and will also more effectively shade the soil surface. In the long term, both effects should therefore contribute to altering the energy budget, potentially leading to a cooling of shallow soil layers (see also below).
4.5 Grazing impacts on soil properties
We found overall Tsoil, especially in the topsoil, to be higher at the grazed sites, as well as temperature gradients to be steeper and thaw depths to be greater. At the same time, GR was relatively dry compared to UGR, where the water table was above the ground throughout our observation period. Ultimately, TS, 5 cm at GR reacted 1 order of magnitude faster to changes in Tair compared to UGR-1 and UGR-2. Overall, we suggest there were two processes dominating how grazing pressure transformed the soil at GR: compacting the soil by trampling the organic peat layer (plus related effects on vegetation) and the reduction in soil moisture. A long-term drainage experiment conducted at UGR demonstrated that the topsoil peat layer can strongly influence the soil thermal regime within tundra ecosystems (Göckede et al., 2019). When drying out the organic layer, it warms up faster but poorly conducts the heat to deeper soil layers (Kwon et al., 2016). When this peat layer is trampled by herbivores, as observed at GR, the soil thermal regime may be significantly modified, with effects on both thermal conductivity and diffusivity.
A reduction in soil moisture, which was observed at GR, generally leads to a decrease in thermal conductivity and heat capacity in organic soils (Ochsner et al., 2001; Kwon et al., 2016). Since the warming of the soil was stronger overall at GR, the effects of lower water content on reducing the soil heat capacity along with the higher conductivity caused by topsoil compaction may have taken over as the dominant control. Accordingly, higher temperatures and temperature fluctuations are likely, since less energy is needed to warm up the soil and increase thaw depths. In previous studies, trampling and grazing in the tundra were already shown to lead to the diminishing of the organic litter/moss layer on the topsoil, a decrease in shading by shrubs, and consequently higher soil temperatures and more compact soils (Ylänne et al., 2018; Olofsson et al., 2001, 2004; Te Beest et al., 2016; Falk et al., 2015). The important role of soil moisture conditions is also highlighted in the results by Windirsch et al. (2021), who investigated places with different grazing pressure within the same thermokarst basin in Pleistocene Park as where our GR sites were located. The drier locations showed a deeper thaw depth in their study, even though the grazing pressure at these sites was actually lower. In accordance with Windirsch et al. (2021), we therefore conclude that both grazing pressure and soil moisture differences have the potential to substantially influence soil properties, and their co-existing influence needs to be tested in further experiments.
The lower soil moisture observed at GR can be linked to an increase in evapotranspiration. The transpiration rate correlates with observed stronger photosynthetic activity (i.e., GPP) due to the adjustment of stomatal conductance to match the biochemical potential for photosynthesis (Farquhar and Sharkey, 1982; Field et al., 1992). Additionally, evaporation increases due to a decrease in litter as a result of grazing (Larson and Whitman, 1942; Dyksterhuis and Schmutz, 1947). Accordingly, a decline in soil moisture is reported for tundra ecosystems under grazing influence (Ylänne et al., 2018) and also for other grazed biomes (Vandandorj et al., 2017; Yan et al., 2018; Larson and Whitman, 1942; Dyksterhuis and Schmutz, 1947) where soil structural (i.e., compaction) and subsequent hydrological changes have been reported. In summary, our results for the grazed site within Pleistocene Park, which show drier soils and a higher GPP compared to UGR, agree with previous findings, emphasizing that grazing can exert strong changes in the thermal and hydrological regimes.
4.6 Grazing influence on carbon fluxes
Our findings confirm that grazing in tundra ecosystems can lead to higher Tsoil and lower soil moisture, which is usually related to an increase in Reco (Ylänne and Stark, 2019; Väisänen et al., 2014; Metcalfe and Olofsson, 2015; Cahoon et al., 2012). This increase in Reco was similar in experiments studying warming and drainage effects on tundra ecosystems exclusively (Christensen et al., 2000; Huemmrich et al., 2010; McEwing et al., 2015; Oechel et al., 1998; Zona et al., 2011; Natali et al., 2015). In addition to triggering these biogeophysical shifts in soil properties, grazing was also shown to lead to faster nutrient cycling in both upland and lowland tundra ecosystems (Ylänne et al., 2018; Olofsson et al., 2001, 2004; Stark et al., 2007; Barthelemy et al., 2018; Raillard and Svoboda, 2000). Higher nutrient availability (Olofsson et al., 2001; Ylänne and Stark, 2019; Raillard and Svoboda, 2000), along with soil thermal and hydrological changes, might therefore be an explanation for high GPP fluxes observed in our Pleistocene Park study plots. As discussed earlier, these increases may even be more pronounced after full recovery from the disturbance inflicted by installing the chamber collars.
Accordingly, despite the reported increases in GPP, our experiments did not yield an enhancement in net carbon uptake by grazing, i.e., a more negative NEE, during the growing season. In contrast, in other wet Arctic graminoid communities (Falk et al., 2015), NEE was greatly enhanced by grazing. In upland tundra ecosystems, however, net uptake was often lower at grazed compared to ungrazed or only lightly grazed sites. The main explanations for these shifts were either a simultaneous increase in Reco at grazed sites (Ylänne and Stark, 2019; Väisänen et al., 2014; Metcalfe and Olofsson, 2015; Cahoon et al., 2012) balancing GPP gains or a decrease in GPP linked to a decrease in plant biomass and leaf area index (Metcalfe and Olofsson, 2015; Cahoon et al., 2012) following grazing. However, at the same time grazed upland tundra exhibits stable or even increased belowground carbon storage (Ylänne et al., 2018), indicating that decreased Reco in the non-growing season possibly (over-)compensates for the decreased NEE in the growing season. It can be speculated that the reported differences in ecosystem properties between grazed and non-grazed areas have further implications for carbon fluxes in the non-growing season that have not yet been studied in detail.
GR is an ecosystem in transition from a tussock tundra topped by a thick organic layer to a grassland with dense tillers. At the same time, the mean water table during the growing season has been lowered. These shifts may lead to a change in which soil horizon carbon is primarily accumulated, with stronger accumulation in deeper soil layers, as observed by Hofstede and Rossenaar (1995) and Pucheta et al. (2004). The decay of the remnants of tussocks, as well as the decomposition of large carbon pools in the now drier organic topsoil, may contribute to the high ecosystem respiration rates observed. These fluxes, however, have the potential to decrease in the future, leading to decreasing rates of Reco and therefore increased NEE.
In contrast to the current situation in most circum-Arctic ecosystems, Pleistocene Park exhibits a high diversity of herbivores that are absent from the landscape elsewhere. Previous studies have indicated that herbivore diversity leads to a more balanced use of food plants (Chang et al., 2018, 2020; Larter and Nagy, 2001; Sitters et al., 2020; Cromsigt et al., 2018) and correlates with increased carbon uptake and soil carbon storage (Chang et al., 2018, 2020; Sitters et al., 2020). While such shifts have yet to be shown for permafrost ecosystems, the first observations in Pleistocene Park hint at positive long-term effects of big herbivore introduction on carbon sequestration. These insights and also questions emerging from ongoing studies call for future research concerning the influence of big herbivores on the carbon balance of permafrost ecosystems, with a focus on long-term, year-round monitoring.
In this study, we investigated the impact of long-term grazing disturbance on a previously wet tussock tundra ecosystem underlain by permafrost in the Siberian Arctic using flux chamber observations over 2.5 weeks during the growing season in summer 2019. Over the past 22 years, introduction of large herds of herbivores in the context of the so-called Pleistocene Park experiment has altered vegetation and soil properties within the affected area, in this way initiating an ongoing transformation from a waterlogged, overgrown tussock tundra towards a drier ecosystem featuring more turf-like vegetation. We compared the managed ecosystem inside Pleistocene Park to a nearby undisturbed reference site, focusing our study on differences in soil thermal and hydrological properties and how these influenced the exchange fluxes of carbon between the ecosystem and the atmosphere.
We measured a significantly lower albedo at the grazed site compared to the undisturbed reference, which can be mostly explained by a lower abundance of shrubs. Soil compaction as a result of trampling, in combination with higher evapotranspiration losses, led to a decrease in soil moisture. Linked to the associated reduction in soil heat capacity, topsoil temperatures in the park were higher and reacted 1 order of magnitude faster to changes in air temperatures compared to the undisturbed tundra. Due to warmer and drier conditions in the soil, both GPP and Reco during July were significantly higher at the grazed site in the park compared to an undisturbed wet tussock tundra, while no substantial differences in NEE were found. CH4 emissions, following the shift in hydrological properties, were distinctly lower in the park but also highly variable between plots.
With respect to the hypotheses postulated for the net impact of grazing disturbance within the Pleistocene Park, our findings agree with the assumed acceleration of carbon turnover, a reduction in albedo linked to shifts in vegetation communities and a reduction in methane emissions; however, due to the short observation period, our results cannot be regarded as proofs of this concept, and more experiments are required to evaluate spatial and temporal representativeness. The effect of grazing on nutrient availability and associated responses of the vegetation community remain open questions that must be quantitatively assessed at Pleistocene Park. Furthermore, it is essential that carbon fluxes will be investigated over longer timescales, with year-round data coverage. Especially fluxes during autumn and early winter, which account for a significant part of the annual carbon budget, need to be included to enable a more comprehensive assessment of the net effects of grazing management on carbon sequestration in the Arctic tundra. Accordingly, future experiments are planned to address these research topics.
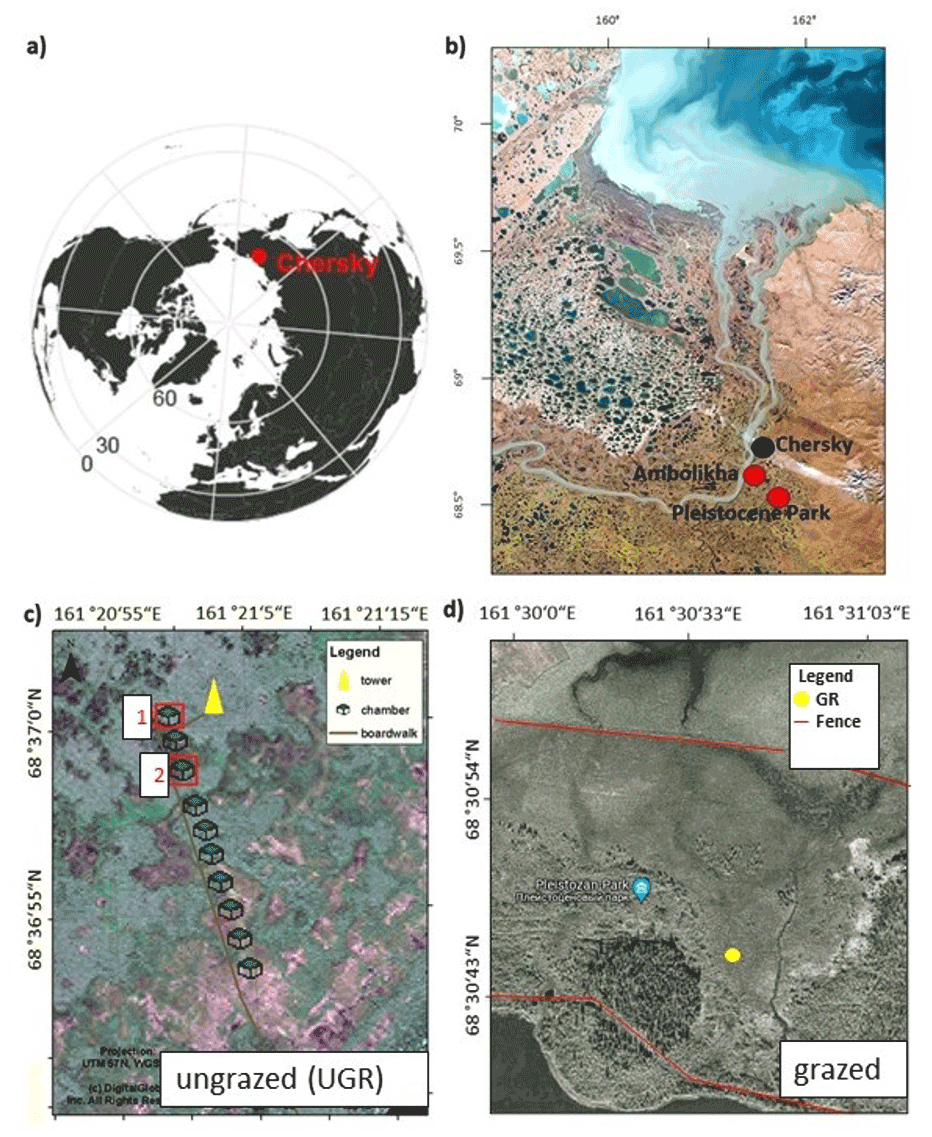
Figure A1Location of study sites. (a) Circum-polar map showing the location of the study site near Chersky in northeast Siberia. (b) Landsat composite image of the study region close to Chersky. (c) Aerial photograph of the Ambolikha site; the location of the meteorological tower and eddy-covariance system and chamber plots are indicated. Plot numbers 1 (UGR-1) and 2 (UGR-2), which denote sites used in this study, are framed in red boxes. (d) Location of the GR observation sites inside Pleistocene Park. The area between the fences (red) is the core area with the highest grazing pressure.
B1 Modeling Reco
Investigating the environmental drivers and their evolution in correlation with Reco measurements revealed that there is no uniform set of drivers across observation sites yielding optimum regression fits. Regarding input data, for sites UGR-1 and UGR-2 soil temperatures measured individually at each plot were used, while a single time series was used for all three GR sites. This setup was chosen since the two UGR sites are spaced 50 m apart, while all three GR sites were placed within a radius of approximately 6 m.
For GR-1 and GR-2, in contrast to all other sites, changes in SM apparently exerted a strong influence on Reco (see Fig. B1). However, both high and low Tsoil or Tair were not measured in all SM ranges. Therefore, for each site we first selected Reco fluxes for a moisture interval that shows a wide spectrum of soil temperatures (SM7.5 cm at GR-1, 54 %–61 %; at GR-2, 57.5 %–62 %). Next, an exponential regression (Tsoil at 5 cm ∼Reco) was fit to the data within this interval (blue dots, left graphs, Fig. B1). The resulting formula was applied to the Tsoil at 5 cm of the whole SM range, which yielded a simulated set of values for Reco if soil moisture did not change. This set of values was subtracted from the original flux values, and residuals were utilized for a second linear regression (residuals ∼ SM7.5 cm, central graphs, Fig. B1) to account for the influence of variable soil moisture on fluxes. Huemmrich et al. (2010) observed a similar correlation between the soil water regime, soil temperature and soil moisture to that proposed here, substantiating the approach. For Reco estimates at GR-3, UGR-1 and UGR-2, fits were optimal when utilizing air temperatures in combination with an exponential regression, while no significant correlation could be found when trying to explain residuals with SM, thaw depth or other variables (Fig. B2).

Figure B1Depiction of the relationship between TS, 5 cm and SM and Reco for GR-1 (a, c, e) and GR-2 (b, d, f). Interpolation models are formed by the equations of depicted regression curves. The graphs on the right (e, f) show modeled vs. measured fluxes.

Figure B2Depiction of the relationship between Tair and Reco for GR-3 (a), UGR-1 (b) and UGR-2 (c). Interpolation models are formed by the equation of the depicted regression curve. The graphs on the right (d, e, f) show modeled vs. measured fluxes.
B2 Modeling CH4 fluxes
CH4 fluxes showed a strong correlation to both TS (all sites) and SM at all depths (GR-1, GR-2, GR-3). However, there was a strong co-linearity between TS and SM. Therefore, to reach the best possible fit for interpolating CH4 fluxes, at GR, while accounting for both drivers, data were split up into two moisture groups (SM15 cm>60 % and SM15 cm<60 %) to apply a pseudo-stepwise regression. Then, for each plot, a linear regression between CH4 fluxes of the lower-moisture group and TS, 25 cm was computed (Fig. B4b, e, h). Second, the resulting linear equation was applied to the complete dataset for each plot, integrating both moisture groups. The residuals between these calculated values and the measured values were fit against SM15 cm, applying another linear regression and resulting in a second linear equation. These two resulting equations were used to interpolate CH4 fluxes for each plot. Since soil moisture did not change at UGR-1 and UGR-2, the linear regression between CH4 fluxes and TS, 15 cm yielded the linear equations used to model fluxes at these sites (Fig. B3).

Figure B3Exponential regressions between CH4 fluxes and TS, 15 cm for UGR-1 (a) and UGR-2 (b).
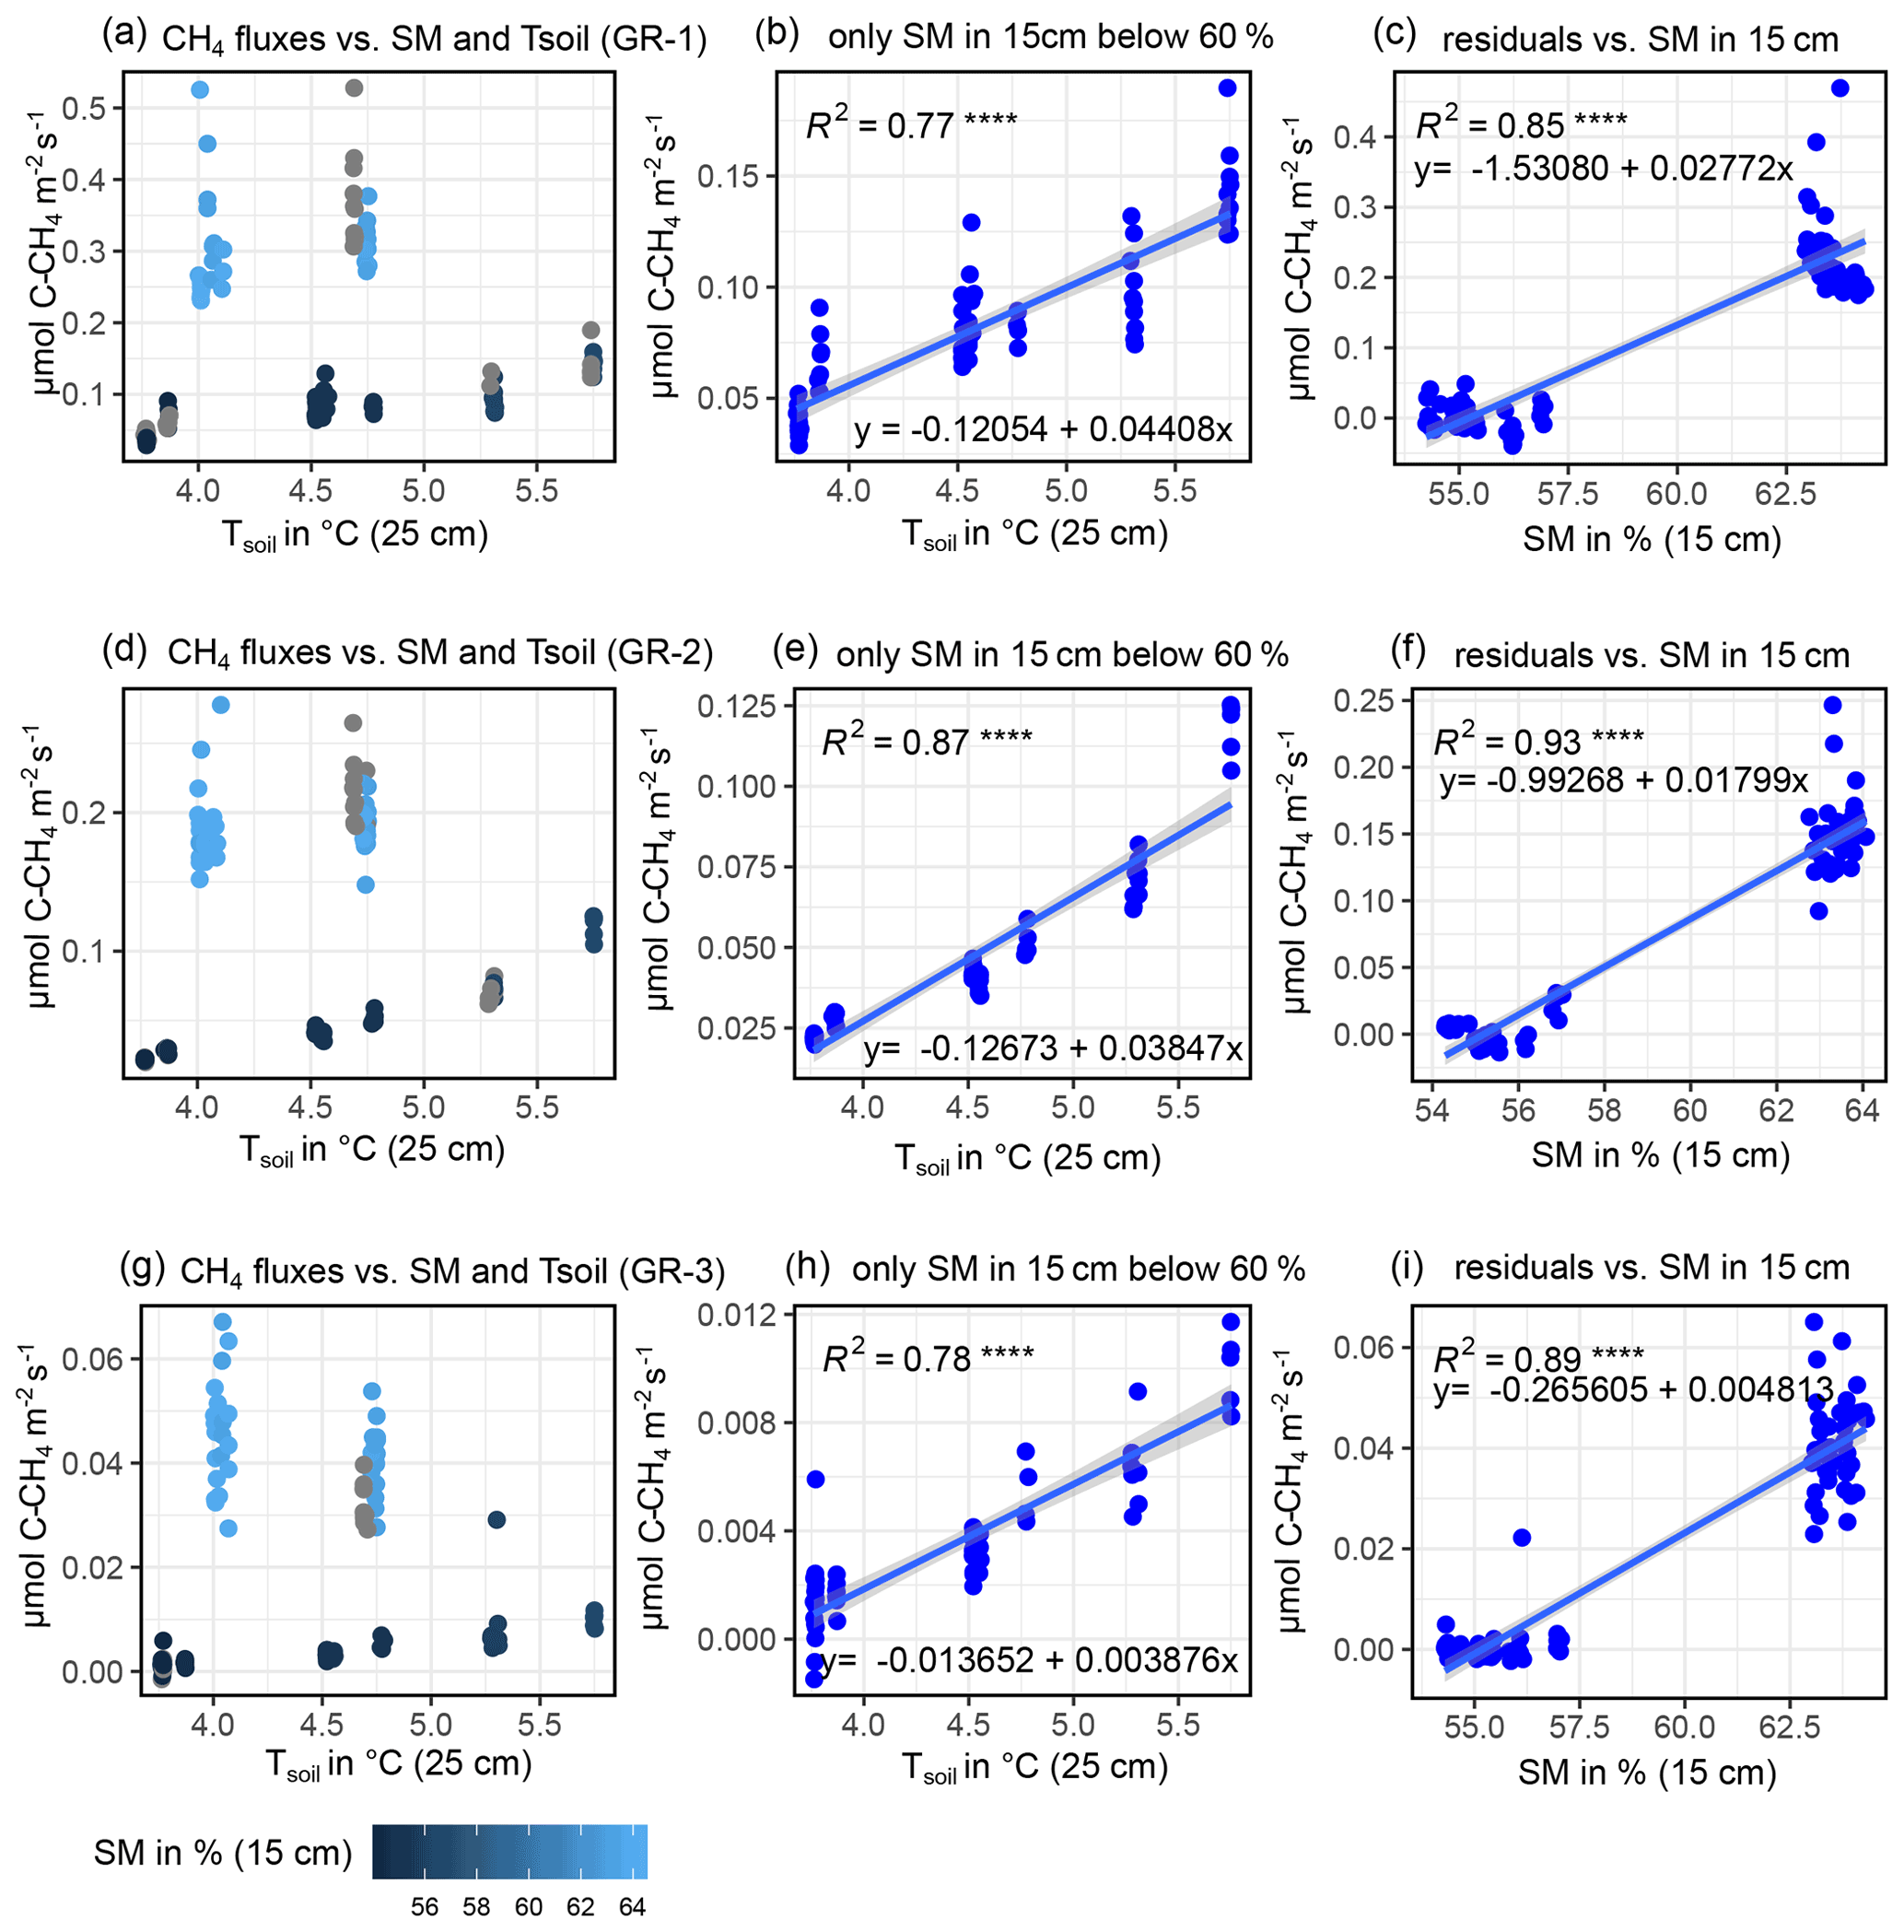
Figure B4Depiction of influencing drivers of CH4 fluxes (GR-1: a, b, c; GR-2: d, e, f; GR-3: g, h, i) and the following derivation of formulas for the interpolation process, showing how the magnitude of fluxes is higher for high soil moisture (a, d, g) and how SM15 cm and TS, 25 cm jointly explain CH4 fluxes.
B3 Comparison of daily means of fluxes, soil temperatures, radiation and albedo
As stated in the “Materials and methods” section, a repeated measures ANOVA was conducted to make sure measurements were independent in between days (effect is day of year (DOY); see Table B1). Statistics for all compared daily means are shown in Table B1. Tables B2 to B4 display corrected p values of pairwise t tests used to compare fluxes, soil temperatures and radiation between sites and/or plots. We used Holm's method for the post correction of p values, since Bonferroni's method (or also Tukey's test instead of t tests), which is by definition more conservative, resulted in p values of 1 on some occasions, which might hint at possible type II errors. However, the significance level was set to 0.01 for a more conservative interpretation of the results.
Table B1Statistics of repeated measures ANOVA applied to the daily means of modeled fluxes, radiation measurements and Tsoil at 5 cm at all sites over the whole observation period. (DOY denotes day of year; SWd denotes downwelling shortwave radiation; SWu denotes upwelling shortwave radiation; DFn denotes degrees of freedom in the numerator; DFd denotes degrees of freedom in the denominator; SSn denotes sum of squares in the numerator; SSd denotes sum of squares in the denominator; ges denotes generalized eta squared (η2).)
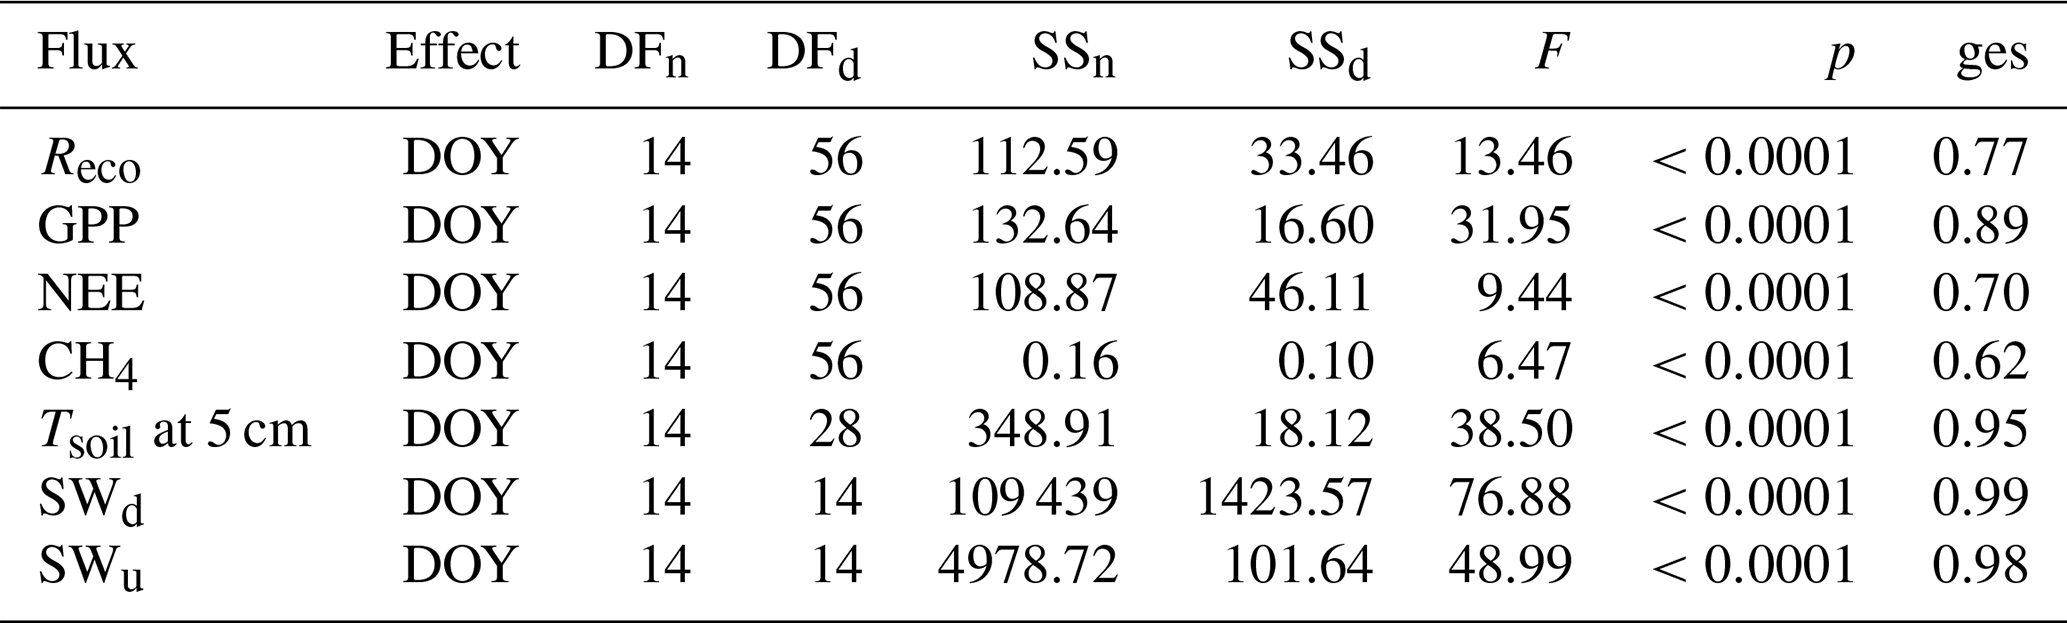
Table B2Corrected p values (insignificant values marked bold) of pairwise t tests applied to daily means of Tsoil at 5 cm, SWu (upwelling shortwave radiation) and SWd (downwelling shortwave radiation).
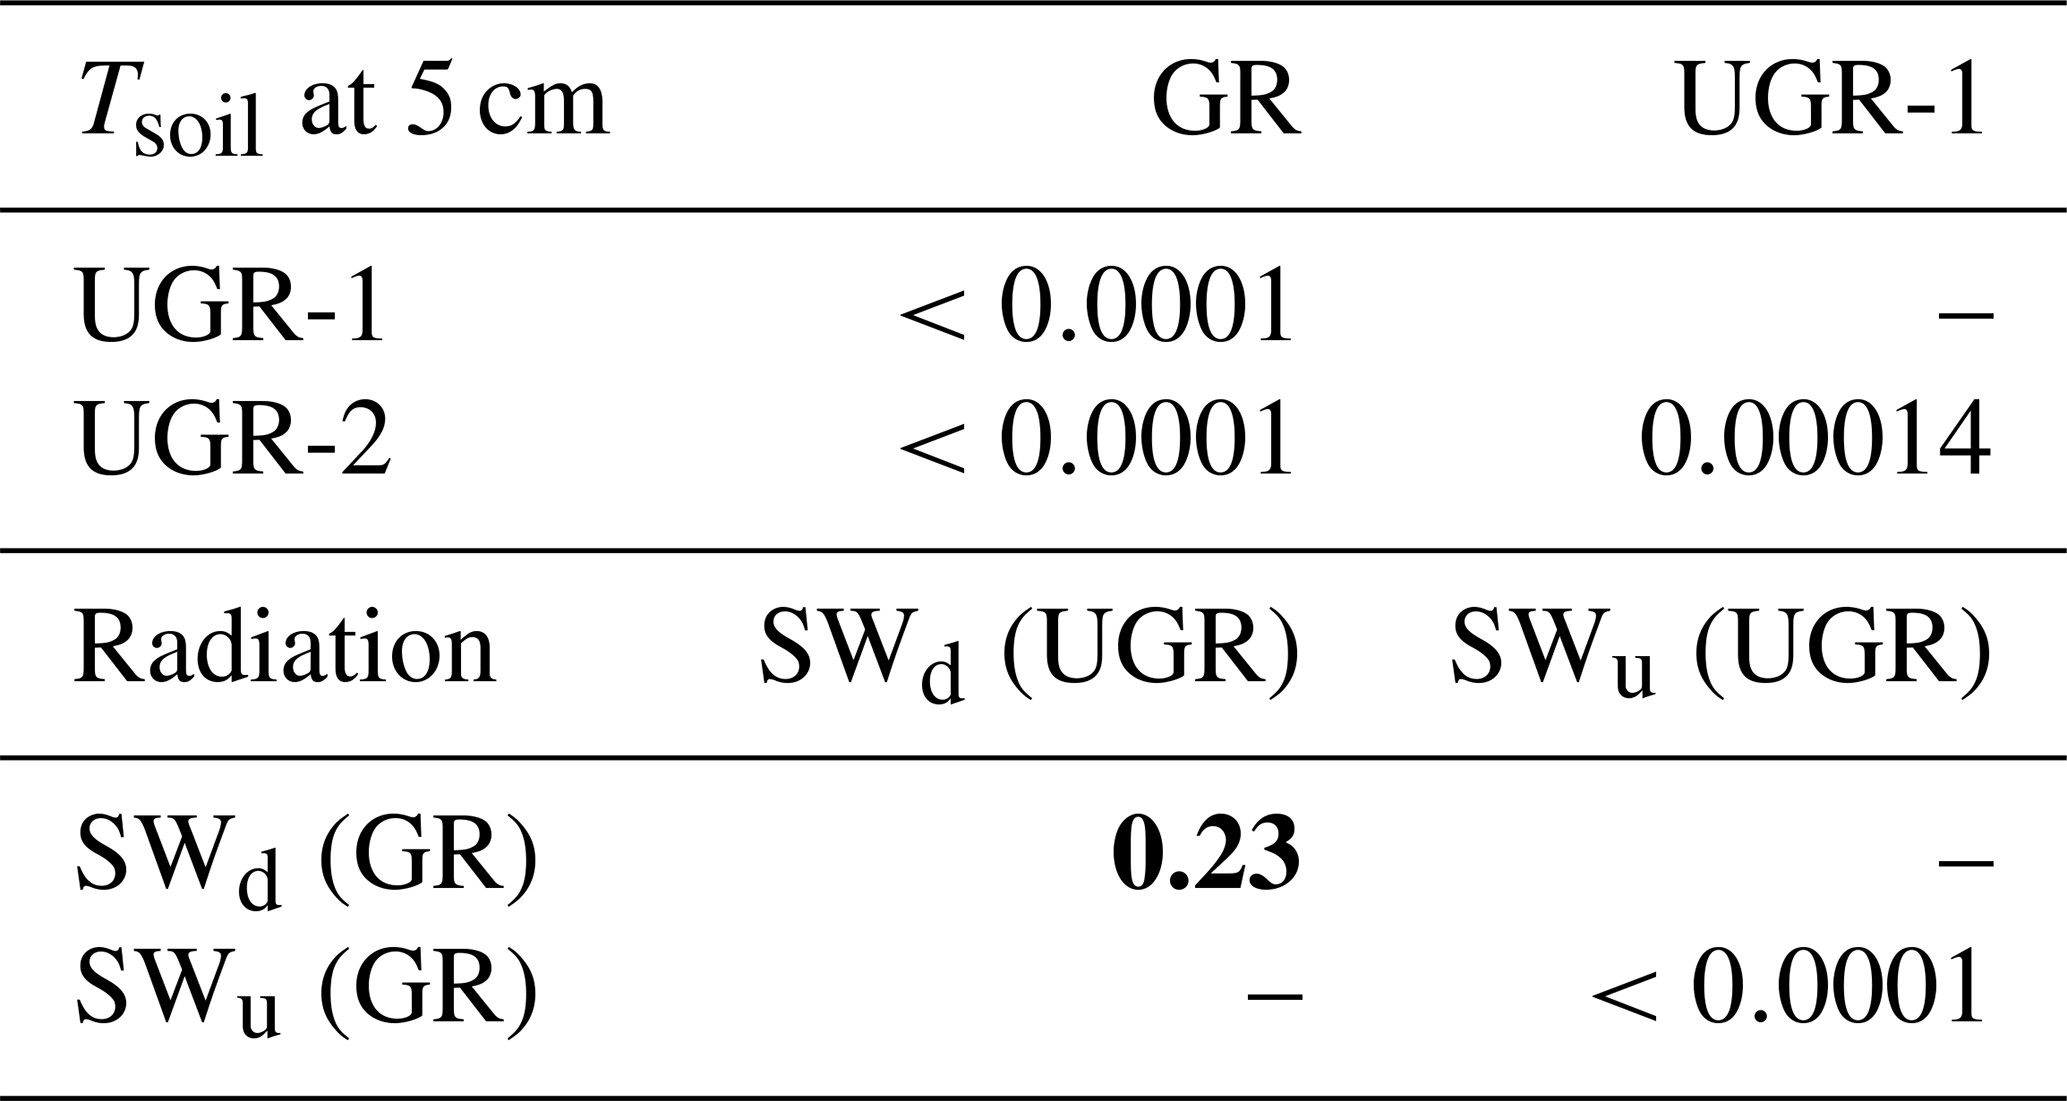
Table B3Corrected p values (insignificant values – above 0.01 – marked bold) of pairwise t tests applied to daily means of modeled fluxes at all sites over the whole observation period. UGR avg and GR avg were compared separately.

B4 Error calculation
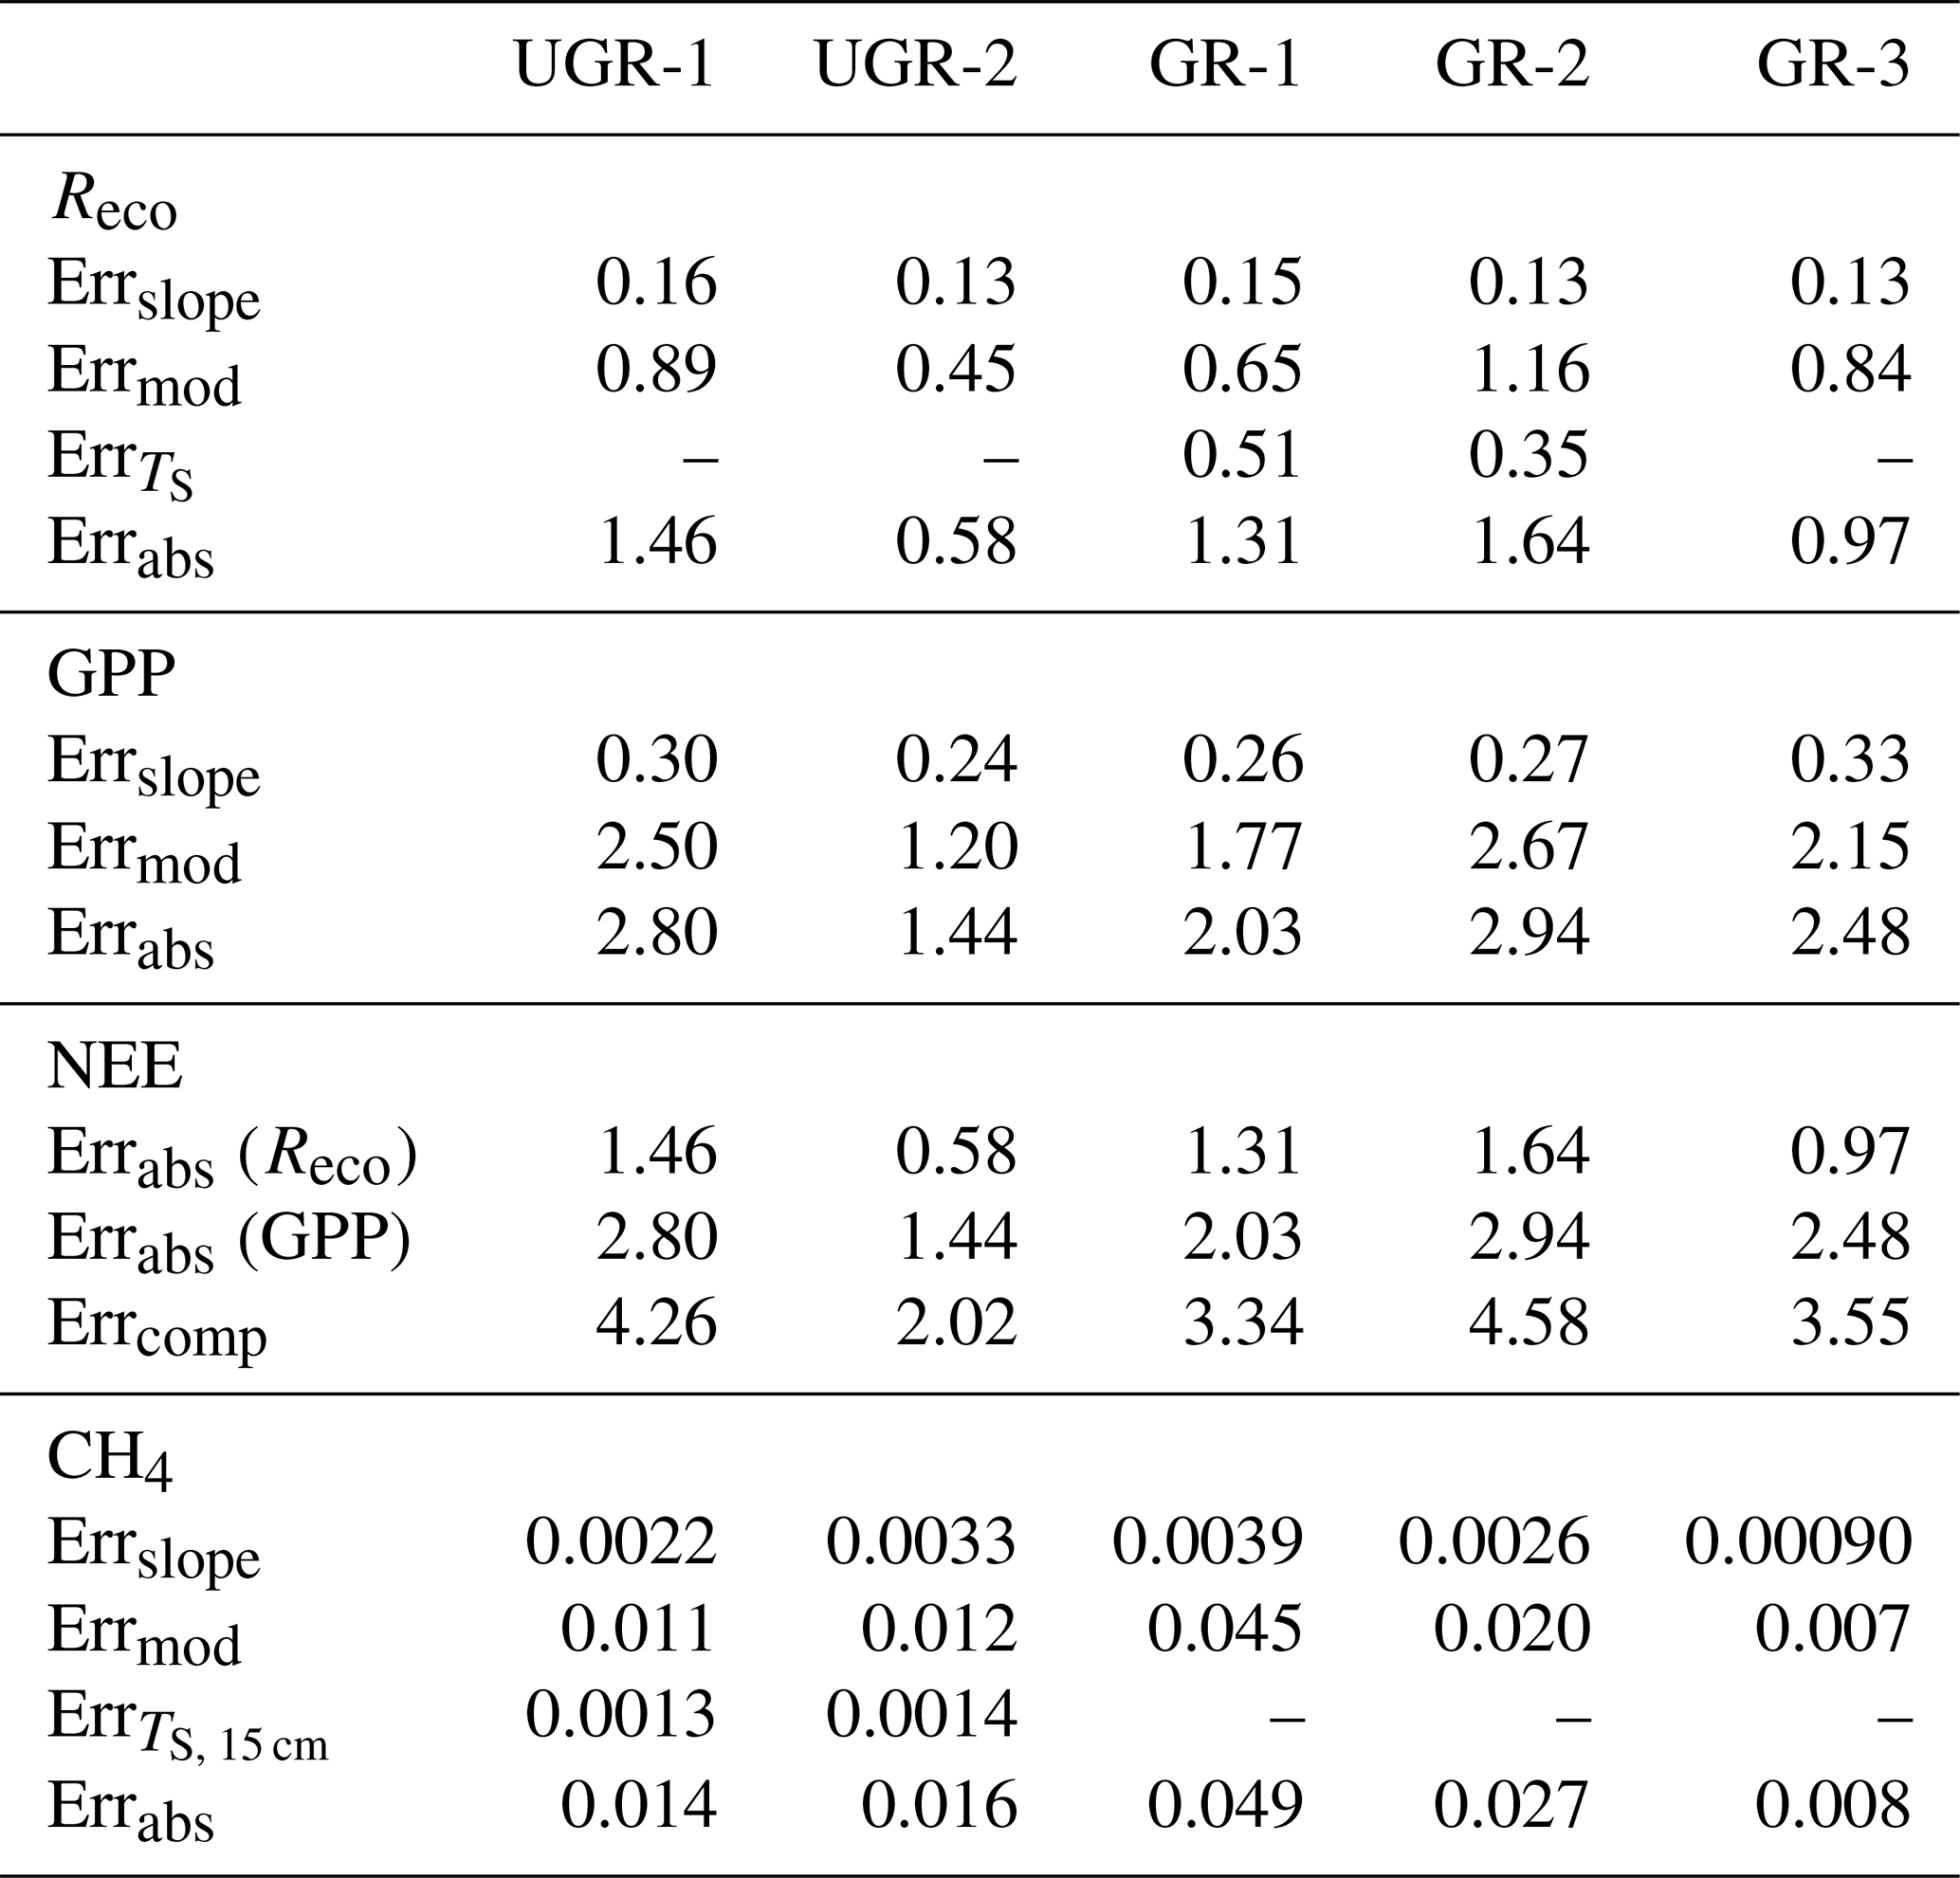
For the final modeled fluxes, which provide the basis to calculate daily average fluxes, a series of error sources was identified (see Table B4). First, a bootstrapping approach to obtain a median slope of CO2 and CH4 concentration changes (see also “Materials and methods” section) allows us to generate an error range for observed flux rates. The standard error of the calculated slopes was transformed into a flux by the same formula applied to the median slope, averaged over all measurements, and is called Errslope. For GPP, Errslope is composed of the Errslope of both NEE measurements and Reco measurements, since these two direct flux measurements needed to be combined for GPP. Second, modeling the chamber fluxes in order to have a continuous time series results in deviations from the modeled vs. the measured fluxes. Here, a linear regression (modeled vs. measured) was applied to evaluate the model quality and to obtain a standard error. Third, to model and interpolate Reco (at GR-1 and GR-2) and CH4 fluxes (at UGR-1 and UGR-2), interpolated soil temperatures were used. Therefore, the RMSE of these models was considered by adding it to the TS term in the interpolation formula for Reco (TS, 5 cm) and CH4 fluxes (TS, 15 cm, TS, 25 cm). In a last step, the initial flux was subtracted from this “enhanced” flux, and the result was defined as the TS error (Err). All these errors are summarized by Errabs and are depicted in Table B1. NEE errors are summed Errabs values from Reco and GPP.
Table B4Error range of C fluxes, with values given in µmol C m−2 s−1. Errabs describes the final cumulative error that is also used in the results section.
The observational data used within the context of this study have been published on Edmond – The Open Research Data Repository operated by the Max Planck Society (https://edmond.mpdl.mpg.de, last access: 14 March 2022) (Göckede and Fischer , 2022). The dataset archived there is openly accessible through https://doi.org/10.17617/3.91. The code used to process the data is available from the corresponding author upon request.
MG was responsible for study conception. WF, MG and CKT contributed to development of the methodology. NZ provided logistics at the study site and has an overall prominent role in designing permafrost studies within Pleistocene Park. WF conducted the fieldwork, with support from MG and NZ. Formal data analysis and interpretation were carried out by WF under supervision of MG and CKT. WF led the drafting of the manuscript with contributions from MG. All authors contributed to refining the manuscript.
The contact author has declared that neither they nor their co-authors have any competing interests.
Publisher’s note: Copernicus Publications remains neutral with regard to jurisdictional claims in published maps and institutional affiliations.
This work was supported through funding by the European Commission (INTAROS project, H2020-BG-09-2016 (grant no. 727890), Nunataryuk project, H2020-BG-11-2016/17 (grant no. 773421)) and the German Ministry of Education and Research (KoPf project (grant no. 03F0764D)). Further funding was provided by the Max Planck Institute for Biogeochemistry (MPI-BGC) in Jena, Germany. The authors appreciate the technical support of Olaf Kolle and Martin Hertel from the Field Experiments and Instrumentation service group at MPI-BGC and also the contribution of staff members of the Northeast Scientific Station in Chersky for facilitating the field experiments.
The article processing charges for this open-access publication were covered by the Max Planck Society.
This paper was edited by Sara Vicca and reviewed by Torben Windirsch and one anonymous referee.
Aalto, J., Le Roux, P. C., and Luoto, M.: Vegetation mediates soil temperature and moisture in arctic-alpine environments, Arct. Antarct. Alp. Res., 45, 429–439, https://doi.org/10.1657/1938-4246-45.4.429, 2013. a
Aurela, M., Riutta, T., Laurila, T., Tuovinen, J. P., Vesala, T., Tuittila, E. S., Rinne, J., Haapanala, S., and Laine, J.: CO2 exchange of a sedge fen in southern Finland – The impact of a drought period, Tellus B, 59, 826–837, https://doi.org/10.1111/j.1600-0889.2007.00309.x, 2007. a
Bakeman, R.: Recommended effect size statistics for repeated measures designs, Behav. Res. Methods, 37, 379–384, 2005. a
Barthelemy, H., Stark, S., Michelsen, A., and Olofsson, J.: Urine is an important nitrogen source for plants irrespective of vegetation composition in an Arctic tundra: Insights from a 15N-enriched urea tracer experiment, J. Ecol., 106, 367–378, https://doi.org/10.1111/1365-2745.12820, 2018. a, b
Beer, C., Zimov, N., Olofsson, J., Porada, P., and Zimov, S.: Protection of Permafrost Soils from Thawing by Increasing Herbivore Density, Sci. Rep., 10, 4170, https://doi.org/10.1038/s41598-020-60938-y, 2020. a, b
Britton, C. M. and Dodd, J. D.: Relationships of Photosynthetically Active Radiation, Agr. Meteorol., 17, 1–7, https://doi.org/10.1016/0002-1571(76)90080-7, 1976. a
Cahoon, S. M., Sullivan, P. F., Post, E., and Welker, J. M.: Large herbivores limit CO2 uptake and suppress carbon cycle responses to warming in West Greenland, Glob. Change Biol., 18, 469–479, https://doi.org/10.1111/j.1365-2486.2011.02528.x, 2012. a, b, c, d
Canty, A. and Ripley, B. D.: boot: Bootstrap R (S-Plus) Functions, r package version 1.3–28, 2021. a
Cassidy, A. E., Christen, A., and Henry, G. H. R.: The effect of a permafrost disturbance on growing-season carbon-dioxide fluxes in a high Arctic tundra ecosystem, Biogeosciences, 13, 2291–2303, https://doi.org/10.5194/bg-13-2291-2016, 2016. a
Celis, G., Mauritz, M., Bracho, R., Salmon, V. G., Webb, E. E., Hutchings, J., Natali, S. M., Schädel, C., Crummer, K. G., and Schuur, E. A.: Tundra is a consistent source of CO2 at a site with progressive permafrost thaw during 6 years of chamber and eddy covariance measurements, J. Geophys. Res.-Biogeo., 122, 1471–1485, https://doi.org/10.1002/2016JG003671, 2017. a
Chang, Q., Wang, L., Ding, S., Xu, T., Li, Z., Song, X., Zhao, X., Wang, D., and Pan, D.: Grazer effects on soil carbon storage vary by herbivore assemblage in a semi-arid grassland, J. Appl. Ecol., 55, 2517–2526, https://doi.org/10.1111/1365-2664.13166, 2018. a, b
Chang, Q., Xu, T., Ding, S., Wang, L., Liu, J., Wang, D., Wang, Y., Li, Z., Zhao, X., Song, X., and Pan, D.: Herbivore Assemblage as an Important Factor Modulating Grazing Effects on Ecosystem Carbon Fluxes in a Meadow Steppe in Northeast China, J. Geophys. Res.-Biogeo., 125, 1–12, https://doi.org/10.1029/2020JG005652, 2020. a, b
Chapin III, F. S., Sturm, M., Serreze, M. C., McFadden, J. P., Key, J. R., Lloyd, A. H., McGuire, A. D., Rupp, T. S., Lynch, A. H., Schimel, J. P., Beringer, J., Chapman, W. L., Epstein, H. E., Euskirchen, E. S., Hinzman, L. D., Jia, G., Ping, C. L., Tape, K. D., Thompson, C. D., Walker, D. A., and Welker, J. M.: Role of land-surface changes in arctic summer warming, Science, 310, 657–660, https://doi.org/10.1126/science.1117368, 2005. a, b, c
Christensen, T. R., Friborg, T., Sommerkorn, M., Kaplan, J., Illeris, L., Soegaard, H., Nordstroem, C., and Jonasson, S.: Trace gas exchange in a high-Arctic valley: 1. Variations in CO2 and CH4 Flux between tundra vegetation types, Global Biogeochem. Cy., 14, 701–713, https://doi.org/10.1029/1999GB001134, 2000. a
Cohen, J., Pulliainen, J., Ménard, C. B., Johansen, B., Oksanen, L., Luojus, K., and Ikonen, J.: Effect of reindeer grazing on snowmelt, albedo and energy balance based on satellite data analyses, Remote Sens. Environ., 135, 107–117, https://doi.org/10.1016/j.rse.2013.03.029, 2013. a
Cromsigt, J. P., Kemp, Y. J., Rodriguez, E., and Kivit, H.: Rewilding Europe's large grazer community: how functionally diverse are the diets of European bison, cattle, and horses?, Restor. Ecol., 26, 891–899, https://doi.org/10.1111/rec.12661, 2018. a
Curasi, S. R., Loranty, M. M., and Natali, S. M.: Water track distribution and effects on carbon dioxide flux in an eastern Siberian upland tundra landscape, Environ. Res. Lett., 11, 045002, https://doi.org/10.1088/1748-9326/11/4/045002, 2016. a, b
Davidson, E. A., Savage, K., Verchot, L. V., and Navarro, R.: Minimizing artifacts and biases in chamber-based measurements of soil respiration, Agr. Forest Meteorol., 113, 21–37, 2002. a, b, c, d
Dyksterhuis, E. J. and Schmutz, E. M.: Natural Mulches or “Litter” of Grasslands: With Kinds and Amounts on a Southern Prairie, Ecology, 28, 163–179, https://doi.org/10.2307/1930949, 1947. a, b
Epstein, H. E., Raynolds, M. K., Walker, D. A., Bhatt, U. S., Tucker, C. J., and Pinzon, J. E.: Dynamics of aboveground phytomass of the circumpolar Arctic tundra during the past three decades, Environ. Res. Lett., 7, 015506, https://doi.org/10.1088/1748-9326/7/1/015506, 2012. a
Euskirchen, E. S., Edgar, C. W., Syndonia Bret-Harte, M., Kade, A., Zimov, N., and Zimov, S.: Interannual and Seasonal Patterns of Carbon Dioxide, Water, and Energy Fluxes From Ecotonal and Thermokarst-Impacted Ecosystems on Carbon-Rich Permafrost Soils in Northeastern Siberia, J. Geophys. Res.-Biogeo., 122, 2651–2668, https://doi.org/10.1002/2017JG004070, 2017. a
Falk, J. M., Schmidt, N. M., Christensen, T. R., and Ström, L.: Large herbivore grazing affects the vegetation structure and greenhouse gas balance in a high arctic mire, Environ. Res. Lett., 10, 045001, https://doi.org/10.1088/1748-9326/10/4/045001, 2015. a, b, c, d, e, f, g, h, i, j
Farquhar, G. D. and Sharkey, T. D.: Stomatal conductance and photosynthesis, Annu. Rev. Plant Phys., 33, 317–345, 1982. a
Field, C. B., Chapin III, F. S., Matson, P. A., and Mooney, H. A.: Responses of terrestrial ecosystems to the changing atmosphere: a resource-based approach, Annu. Rev. Ecol. Syst., 23, 201–235, 1992. a
Glover, S. and Dixon, P.: Likelihood ratios: A simple and flexible statistic for empirical psychologists, Psychon. B. Rev., 11, 791–806, 2004. a
Göckede, M., Kittler, F., Jung Kwon, M., Burjack, I., Heimann, M., Kolle, O., Zimov, N., and Zimov, S.: Shifted energy fluxes, increased Bowen ratios, and reduced thaw depths linked with drainage-induced changes in permafrost ecosystem structure, Cryosphere, 11, 2975–2996, https://doi.org/10.5194/tc-11-2975-2017, 2017. a
Göckede, M., Kwon, M. J., Kittler, F., Heimann, M., Zimov, N., and Zimov, S.: Negative feedback processes following drainage slow down permafrost degradation, Global Change Biol., 25, 3254–3266, 2019. a, b
Goeckede, M. and Fischer, W.: Flux chamber data and ancillary measurements from Pleistocene Park, Northeast Siberia, Edmond, V1 [data set], https://doi.org/10.17617/3.91, 2022. a
Gornall, J. L., Woodin, S. J., Jónsdóttir, I. S., and van der Wal, R.: Herbivore impacts to the moss layer determine tundra ecosystem response to grazing and warming, Oecologia, 161, 747–758, https://doi.org/10.1007/s00442-009-1427-5, 2009. a
Grogan, P.: Cold season respiration across a low arctic landscape: The influence of vegetation type, snow depth, and interannual climatic variation, Arct. Antarct. Alp. Res., 44, 446–456, https://doi.org/10.1657/1938-4246-44.4.446, 2012. a
Harden, J. W., Koven, C. D., Ping, C. L., Hugelius, G., McGuire, A. D., Camill, P., Jorgenson, T., Kuhry, P., Michaelson, G. J., O'Donnell, J. A., Schuur, E. A. G., Tarnocai, C., Johnson, K., and Grosse, G.: Field information links permafrost carbon to physical vulnerabilities of thawing, Geophys. Res. Lett., 39, 1–6, https://doi.org/10.1029/2012GL051958, 2012. a
Hofstede, R. G. and Rossenaar, A. J.: Biomass of Grazed, Burned, and Undisturbed Páramo Grasslands, Colombia. II. Root Mass and Aboveground:Belowground Ratio, Arctic Alpine Res., 27, 13–18, https://doi.org/10.2307/1552063, 1995. a, b
Hollister, R. D., May, J. L., Kremers, K. S., Tweedie, C. E., Oberbauer, S. F., Liebig, J. A., Botting, T. F., Barrett, R. T., and Gregory, J. L.: Warming experiments elucidate the drivers of observed directional changes in tundra vegetation, Ecol. Evol., 5, 1881–1895, https://doi.org/10.1002/ece3.1499, 2015. a, b
Holm, S.: A simple sequentially rejective multiple test procedure, Scand. J. Stat., 6, 65–70, 1979. a
Huemmrich, K. F., Kinoshita, G., Gamon, J. A., Houston, S., Kwon, H., and Oechel, W. C.: Tundra carbon balance under varying temperature and moisture regimes, J. Geophys. Res.-Biogeo., 115, G00I02, https://doi.org/10.1029/2009jg001237, 2010. a, b, c
Hugelius, G., Strauss, J., Zubrzycki, S., Harden, J. W., Schuur, E. A. G., Ping, C.-L., Schirrmeister, L., Grosse, G., Michaelson, G. J., Koven, C. D., O'Donnell, J. A., Elberling, B., Mishra, U., Camill, P., Yu, Z., Palmtag, J., and Kuhry, P.: Estimated stocks of circumpolar permafrost carbon with quantified uncertainty ranges and identified data gaps, Biogeosciences, 11, 6573–6593, https://doi.org/10.5194/bg-11-6573-2014, 2014. a, b
Kelsey, K. C., Leffler, A. J., Beard, K. H., Schmutz, J. A., Choi, R. T., and Welker, J. M.: Interactions among vegetation, climate, and herbivory control greenhouse gas fluxes in a subarctic coastal wetland, J. Geophys. Res.-Biogeo., 121, 2960–2975, https://doi.org/10.1002/2016JG003546, 2016. a, b
Killick, R., Haynes, K., and Eckley, I.: Changepoint: an R package for changepoint analysis, R package version 2.2., 2, 2016. a
Kitti, H., Forbes, B. C., and Oksanen, J.: Long- and short-term effects of reindeer grazing on tundra wetland vegetation, Polar Biol., 32, 253–261, https://doi.org/10.1007/s00300-008-0526-9, 2009. a, b, c, d, e
Kittler, F., Burjack, I., Corradi, C. A. R., Heimann, M., Kolle, O., Merbold, L., Zimov, N., Zimov, S., and Göckede, M.: Impacts of a decadal drainage disturbance on surface–atmosphere fluxes of carbon dioxide in a permafrost ecosystem, Biogeosciences, 13, 5315–5332, https://doi.org/10.5194/bg-13-5315-2016, 2016. a
Kittler, F., Heimann, M., Kolle, O., Zimov, N., Zimov, S., and Göckede, M.: Long-Term Drainage Reduces CO2 Uptake and CH4 Emissions in a Siberian Permafrost Ecosystem, Global Biogeochem. Cy., 31, 1704–1717, https://doi.org/10.1002/2017GB005774, 2017. a
Kutzbach, L., Schneider, J., Sachs, T., Giebels, M., Nykänen, H., Shurpali, N. J., Martikainen, P. J., Alm, J., and Wilmking, M.: CO2 flux determination by closed-chamber methods can be seriously biased by inappropriate application of linear regression, Biogeosciences, 4, 1005–1025, https://doi.org/10.5194/bg-4-1005-2007, 2007. a, b
Kwon, M. J., Heimann, M., Kolle, O., Luus, K. A., Schuur, E. A. G., Zimov, N., Zimov, S. A., and Göckede, M.: Long-term drainage reduces CO2 uptake and increases CO2 emission on a Siberian floodplain due to shifts in vegetation community and soil thermal characteristics, Biogeosciences, 13, 4219–4235, https://doi.org/10.5194/bg-13-4219-2016, 2016. a, b, c, d, e, f, g, h, i, j, k, l, m
Kwon, M. J., Beulig, F., Ilie, I., Wildner, M., Küsel, K., Merbold, L., Mahecha, M. D., Zimov, N., Zimov, S. A., Heimann, M., Schuur, E. A., Kostka, J. E., Kolle, O., Hilke, I., and Göckede, M.: Plants, microorganisms, and soil temperatures contribute to a decrease in methane fluxes on a drained Arctic floodplain, Glob. Change Biol., 23, 2396–2412, https://doi.org/10.1111/gcb.13558, 2017. a, b, c
Lafleur, P. M.: Connecting atmosphere and wetland: Trace gas exchange, Geography Compass, 3, 560–585, https://doi.org/10.1111/j.1749-8198.2008.00212.x, 2009. a
Larson, F. and Whitman, W.: A Comparison of Used and Unused Grassland Mesas in the Badlands of South Dakota, Ecology, 23, 438–445, 1942. a, b
Larter, N. C. and Nagy, J. A.: Variation between Snow Conditions at Peary Caribou and Muskox Feeding Sites and Elsewhere in Foraging Habitats on Banks Island in the Canadian High Arctic, Arct. Antarct. Alp. Res., 33, 123–130, https://doi.org/10.1080/15230430.2001.12003414, 2001. a
Lawrence, M. A.: ez: Easy Analysis and Visualization of Factorial Experiments, https://CRAN.R-project.org/package=ez (last access: 14 March 2022), r package version 4.4-0, 2016. a
López-Blanco, E., Lund, M., Williams, M., Tamstorf, M. P., Westergaard-Nielsen, A., Exbrayat, J.-F., Hansen, B. U., and Christensen, T. R.: Exchange of CO2 in Arctic tundra: impacts of meteorological variations and biological disturbance, Biogeosciences, 14, 4467–4483, https://doi.org/10.5194/bg-14-4467-2017, 2017. a
Manseau, M., Huot, J., and Crete, M.: Effects of Summer Grazing by Caribou on Composition and Productivity of Vegetation: Community and Landscape Level, J. Ecol., 84, 503, https://doi.org/10.2307/2261473, 1996. a, b
McEwing, K. R., Fisher, J. P., and Zona, D.: Environmental and vegetation controls on the spatial variability of CH4 emission from wet-sedge and tussock tundra ecosystems in the Arctic, Plant Soil, 388, 37–52, https://doi.org/10.1007/s11104-014-2377-1, 2015. a
Mekonnen, Z. A., Riley, W. J., Berner, L. T., Bouskill, N. J., Torn, M. S., Iwahana, G., Breen, A. L., Myers-Smith, I. H., Criado, M. G., Liu, Y., Euskirchen, E. S., Goetz, S. J., Mack, M. C., and Grant, R. F.: Arctic tundra shrubification: a review of mechanisms and impacts on ecosystem carbon balance, Environ. Res. Lett., 16, 053001, https://doi.org/10.1088/1748-9326/abf28b, 2021. a
Metcalfe, D. B. and Olofsson, J.: Distinct impacts of different mammalian herbivore assemblages on arctic tundra CO2 exchange during the peak of the growing season, Oikos, 124, 1632–1638, https://doi.org/10.1111/oik.02085, 2015. a, b, c, d
Myers-Smith, I. H., Forbes, B. C., Wilmking, M., Hallinger, M., Lantz, T., Blok, D., Tape, K. D., Macias-Fauria, M., Sass-Klaassen, U., Lévesque, E., Boudreau, S., Ropars, P., Hermanutz, L., Trant, A., Collier, L. S., Weijers, S., Rozema, J., Rayback, S. A., Schmidt, N. M., Schaepman-Strub, G., Wipf, S., Rixen, C., Ménard, C. B., Venn, S., Goetz, S., Andreu-Hayles, L., Elmendorf, S., Ravolainen, V., Welker, J., Grogan, P., Epstein, H. E., and Hik, D. S.: Shrub expansion in tundra ecosystems: Dynamics, impacts and research priorities, Environ. Res. Lett., 6, 045509, https://doi.org/10.1088/1748-9326/6/4/045509, 2011. a
Natali, S. M., Schuur, E. A., Webb, E. E., Pries, C. E., and Crummer, K. G.: Permafrost degradation stimulates carbon loss from experimentally warmed tundra, Ecology, 95, 602–608, https://doi.org/10.1890/13-0602.1, 2014. a
Natali, S. M., Schuur, E. A., Mauritz, M., Schade, J. D., Celis, G., Crummer, K. G., Johnston, C., Krapek, J., Pegoraro, E., Salmon, V. G., and Webb, E. E.: Permafrost thaw and soil moisture driving CO2 and CH4 release from upland tundra, J. Geophys. Res.-Biogeo., 120, 525–537, https://doi.org/10.1002/2014JG002872, 2015. a, b, c, d
Oberbauer, S. F., Tweedie, C. E., Welker, J. M., Fahnestock, J. T., Henry, G. H., Webber, P. J., Hollister, R. D., Walker, M. D., Kuchy, A., Elmore, E., and Starr, G.: Tundra CO2 fluxes in response to experimental warming across latitudinal and moisture gradients, Ecol. Monogr., 77, 221–238, https://doi.org/10.1890/06-0649, 2007. a
Ochsner, T. E., Horton, R., and Ren, T.: A New Perspective on Soil Thermal Properties, Soil Sci. Soc. Am. J., 65, 1641–1647, https://doi.org/10.2136/sssaj2001.1641, 2001. a
Oechel, W. C., Vourlitis, G. L., Hastings, S. J., Ault, R. P., and Bryant, P.: The effects of water table manipulation and elevated temperature on the net CO2 flux of wet sedge tundra ecosystems, Glob. Change Biol., 4, 77–90, https://doi.org/10.1046/j.1365-2486.1998.00110.x, 1998. a
Olofsson, J.: Short- and long-term effects of changes in reindeer grazing pressure on tundra heath vegetation, J. Ecol., 94, 431–440, https://doi.org/10.1111/j.1365-2745.2006.01100.x, 2006. a, b
Olofsson, J., Kitti, H., Rautiainen, P., Stark, S., and Oksanen, L.: Effects of summer grazing by reindeer on composition of vegetation, productivity and nitrogen cycling, Ecography, 24, 13–24, https://doi.org/10.1034/j.1600-0587.2001.240103.x, 2001. a, b, c, d, e
Olofsson, J., Stark, S., and Oksanen, L.: Reindeer influence on ecosystem processes in the tundra, Oikos, 105, 386–396, https://doi.org/10.1111/j.0030-1299.2004.13048.x, 2004. a, b, c, d
Overland, J., Francis, J. A., Hall, R., Hanna, E., Kim, S.-J., and Vihma, T.: The melting Arctic and midlatitude weather patterns: Are they connected?, J. Climate, 28, 7917–7932, 2015. a
Pucheta, E., Bonamici, I., Cabido, M., and Díaz, S.: Below-ground biomass and productivity of a grazed site and a neighbouring ungrazed exclosure in a grassland in central Argentina, Austral Ecol., 29, 201–208, https://doi.org/10.1111/j.1442-9993.2004.01337.x, 2004. a, b
Raillard, M. C. and Svoboda, J.: Exact Growth and Increased Nitrogen Compensation by the Arctic Sedge Carex aquatilis var. stans after Simulated Grazing, Arct. Antarct. Alp. Res., 31, 21–26, https://doi.org/10.1080/15230430.1999.12003277, 1999. a, b, c, d
Raillard, M. and Svoboda, J.: High Grazing Impact, Selectivity, and Local Density of Muskoxen in Central Ellesmere Island, Canadian High Arctic, Arct. Antarct. Alp. Res., 32, 278–285, https://doi.org/10.1080/15230430.2000.12003365, 2000. a, b, c, d, e, f, g
R Core Team: R: A Language and Environment for Statistical Computing, version 4.1.1, R Foundation for Statistical Computing, Vienna, Austria, https://www.R-project.org/ (last access: 14 March 2022), 2021. a
Runkle, B. R. K., Sachs, T., Wille, C., Pfeiffer, E.-M., and Kutzbach, L.: Bulk partitioning the growing season net ecosystem exchange of CO2 in Siberian tundra reveals the seasonality of its carbon sequestration strength, Biogeosciences, 10, 1337–1349, https://doi.org/10.5194/bg-10-1337-2013, 2013. a, b
Salmon, V. G., Soucy, P., Mauritz, M., Celis, G., Natali, S. M., Mack, M. C., and Schuur, E. A.: Nitrogen availability increases in a tundra ecosystem during five years of experimental permafrost thaw, Glob. Change Biol., 22, 1927–1941, https://doi.org/10.1111/gcb.13204, 2016. a
Schädel, C., Bader, M. K., Schuur, E. A., Biasi, C., Bracho, R., Capek, P., De Baets, S., Diáková, K., Ernakovich, J., Estop-Aragones, C., Graham, D. E., Hartley, I. P., Iversen, C. M., Kane, E., Knoblauch, C., Lupascu, M., Martikainen, P. J., Natali, S. M., Norby, R. J., O'Donnell, J. A., Chowdhury, T. R., Šantrucková, H., Shaver, G., Sloan, V. L., Treat, C. C., Turetsky, M. R., Waldro, M. P., and Wickland, K. P.: Potential carbon emissions dominated by carbon dioxide from thawed permafrost soils, Nat. Clim. Change, 6, 950–953, https://doi.org/10.1038/nclimate3054, 2016. a
Schuur, E. A., Vogel, J. G., Crummer, K. G., Lee, H., Sickman, J. O., and Osterkamp, T. E.: The effect of permafrost thaw on old carbon release and net carbon exchange from tundra, Nature, 459, 556–559, https://doi.org/10.1038/nature08031, 2009. a, b
Schuur, E. A., McGuire, A. D., Schädel, C., Grosse, G., Harden, J. W., Hayes, D. J., Hugelius, G., Koven, C. D., Kuhry, P., Lawrence, D. M., Natali, S. M., Olefeldt, D., Romanovsky, V. E., Schaefer, K., Turetsky, M. R., Treat, C. C., and Vonk, J. E.: Climate change and the permafrost carbon feedback, Nature, 520, 171–179, https://doi.org/10.1038/nature14338, 2015. a
Sitters, J., Kimuyu, D. M., Young, T. P., Claeys, P., and Olde Venterink, H.: Negative effects of cattle on soil carbon and nutrient pools reversed by megaherbivores, Nature Sustainability, 3, 360–366, https://doi.org/10.1038/s41893-020-0490-0, 2020. a, b
Stark, S., Julkunen-Tiitto, R., and Kumpula, J.: Ecological role of reindeer summer browsing in the mountain birch (Betula pubescens ssp. czerepanovii) forests: Effects on plant defense, litter decomposition, and soil nutrient cycling, Oecologia, 151, 486–498, https://doi.org/10.1007/s00442-006-0593-y, 2007. a
Tarnocai, C., Canadell, J. G., Schuur, E. A. G., Kuhry, P., Mazhitova, G., and Zimov, S.: Soil organic carbon pools in the northern circumpolar permafrost region, Global Biogeochem. Cy., 23, GB2023, https://doi.org/10.1029/2008gb003327, 2009. a
Te Beest, M., Sitters, J., Ménard, C. B., and Olofsson, J.: Reindeer grazing increases summer albedo by reducing shrub abundance in Arctic tundra, Environ. Res. Lett., 11, 125013, https://doi.org/10.1088/1748-9326/aa5128, 2016. a, b, c, d
Tolvanen, A. and Henry, G. H. R.: Population Structure of Three Dominant Sedges under Muskox Herbivory in the High Arctic, Arct. Antarct. Alp. Res., 32, 449–455, https://doi.org/10.1080/15230430.2000.12003389, 2000. a, b
Ueyama, M., Iwata, H., and Harazono, Y.: Autumn warming reduces the CO2 sink of a black spruce forest in interior Alaska based on a nine-year eddy covariance measurement, Glob. Change Biol., 20, 1161–1173, https://doi.org/10.1111/gcb.12434, 2014. a
Vandandorj, S., Eldridge, D. J., Travers, S. K., Val, J., and Oliver, I.: Microsite and grazing intensity drive infiltration in a semiarid woodland, Ecohydrology, 10, e183, https://doi.org/10.1002/eco.1831, 2017. a
Väisänen, M., Ylänne, H., Kaarlejärvi, E., Sjögersten, S., Olofsson, J., Crout, N., and Stark, S.: Consequences of warming on tundra carbon balance determined by reindeer grazing history, Nat. Clim. Change, 4, 384–388, https://doi.org/10.1038/nclimate2147, 2014. a, b, c
Windirsch, T., Grosse, G., Ulrich, M., Forbes, B. C., Göckede, M., Wolter, J., Macias-Fauria, M., Olofsson, J., Zimov, N., and Strauss, J.: Large Herbivores Affecting Permafrost – Impacts of Grazing on Permafrost Soil Carbon Storage in Northeastern Siberia, Biogeosciences Discuss. [preprint], https://doi.org/10.5194/bg-2021-227, in review, 2021. a
Winslow, L. A., Zwart, J. A., Batt, R. D., Dugan, H. A., Woolway, R. I., Corman, J. R., Hanson, P. C., and Read, J. S.: LakeMetabolizer: an R package for estimating lake metabolism from free-water oxygen using diverse statistical models, Inland Waters, 6, 622–636, 2016. a
Yan, Y., Yan, R., Chen, J., Xin, X., Eldridge, D. J., Shao, C., Wang, X., Lv, S., Jin, D., Chen, J., Guo, Z., Chen, B., and Xu, L.: Grazing modulates soil temperature and moisture in a Eurasian steppe, Agr. Forest Meteorol., 262, 157–165, https://doi.org/10.1016/j.agrformet.2018.07.011, 2018. a
Ylänne, H. and Stark, S.: Distinguishing Rapid and Slow C Cycling Feedbacks to Grazing in Sub-arctic Tundra, Ecosystems, 22, 1145–1159, https://doi.org/10.1007/s10021-018-0329-y, 2019. a, b, c, d
Ylänne, H., Olofsson, J., Oksanen, L., and Stark, S.: Consequences of grazer-induced vegetation transitions on ecosystem carbon storage in the tundra, Funct. Ecol., 32, 1091–1102, https://doi.org/10.1111/1365-2435.13029, 2018. a, b, c, d, e, f, g
Zimov, S. A., Chuprynin, V. I., Oreshko, A. P., Chapin, F. S., Reynolds, J. F., and Chapin, M. C.: Steppe-Tundra Transition – a Herbivore-Driven Biome Shift at the End of the Pleistocene, Am. Nat., 146, 765–794, https://doi.org/10.1086/285824, 1995. a
Zimov, S. A., Zimov, N. S., Tikhonov, A. N., and Chapin III, F. S.: Mammoth steppe: A high-productivity phenomenon, Quaternary Sci. Rev., 57, 26–45, https://doi.org/10.1016/j.quascirev.2012.10.005, 2012. a, b
Zona, D., Lipson, D. A., Zulueta, R. C., Oberbauer, S. F., and Oechel, W. C.: Microtopographic controls on ecosystem functioning in the Arctic Coastal Plain, J. Geophys. Res.-Biogeo., 116, 1–12, https://doi.org/10.1029/2009JG001241, 2011. a, b
- Abstract
- Introduction
- Materials and methods
- Results
- Discussion
- Conclusions
- Appendix A: Location of study sites
- Appendix B: Derivation of models for the interpolation of C fluxes
- Code and data availability
- Author contributions
- Competing interests
- Disclaimer
- Acknowledgements
- Financial support
- Review statement
- References