the Creative Commons Attribution 4.0 License.
the Creative Commons Attribution 4.0 License.
 | 13 May 2022
Climatic variation drives loss and restructuring of carbon and nitrogen in boreal forest wildfire
Johan A. Eckdahl
Jeppe A. Kristensen
Daniel B. Metcalfe
The boreal forest landscape covers approximately 10 % of the earth's land area and accounts for almost 30 % of the global annual terrestrial sink of carbon (C). Increased emissions due to climate-change-amplified fire frequency, size, and intensity threaten to remove elements such as C and nitrogen (N) from forest soil and vegetation at rates faster than they accumulate. This may result in large areas within the region becoming a net source of greenhouse gases, creating a positive feedback loop with a changing climate. Meter-scale estimates of area-normalized fire emissions are limited in Eurasian boreal forests, and knowledge of their relation to climate and ecosystem properties is sparse. This study sampled 50 separate Swedish wildfires, which occurred during an extreme fire season in 2018, providing quantitative estimates of C and N loss due to fire along a climate gradient. Mean annual precipitation had strong positive effects on total fuel, which was the strongest driver for increasing C and N losses. Mean annual temperature (MAT) influenced both pre- and postfire organic layer soil bulk density and C : N ratio, which had mixed effects on C and N losses. Significant fire-induced loss of C estimated in the 50 plots was comparable to estimates in similar Eurasian forests but approximately a quarter of those found in typically more intense North American boreal wildfires. N loss was insignificant, though a large amount of fire-affected fuel was converted to a low C : N surface layer of char in proportion to increased MAT. These results reveal large quantitative differences in C and N losses between global regions and their linkage to the broad range of climate conditions within Fennoscandia. A need exists to better incorporate these factors into models to improve estimates of global emissions of C and N due to fire in future climate scenarios. Additionally, this study demonstrated a linkage between climate and the extent of charring of soil fuel and discusses its potential for altering C and N dynamics in postfire recovery.
- Article
(5208 KB) - Full-text XML
-
Supplement
(1322 KB) - BibTeX
- EndNote


Worldwide, boreal forests cover approximately 10 % of land area (Keenan et al., 2015) and account for a net carbon (C) sink into plants and soil of 0.31 ± 0.19 Pg C yr−1, equivalent to 27.3 ± 16.7 % of the planet's terrestrial C sink (Tagesson et al., 2020). This sink plays a pivotal role in the greenhouse gas content of the atmosphere (Lemprière et al., 2013). Low temperatures and often waterlogged soil conditions reduce the rate of decomposition relative to litter additions, resulting in the buildup of thick layers of soil organic material where the majority of C is stored (Malhi et al., 1999; Rapalee et al., 1998). The balance of C transferred between atmospheric and terrestrial stocks on the yearly timescale is dictated by rates of terrestrial net primary production and respiration, which are themselves controlled by temperature, moisture, and nitrogen (N) availability (Deluca and Boisvenue, 2012).
The predominant disturbance to this C balance in the boreal region is outbreaks of wildfires which reoccur in individual forest stands at the centurial timescale (Bond-Lamberty et al., 2007). Among the immediate effects of fire are a substantial release of C to the atmosphere from soil and vegetation (Schultz et al., 2008) as well as physical restructuring of the habitat through varying degrees of over- and understory removal and changes in soil properties such as bulk density (Certini, 2005). Further, bioavailability of energy sources and nutrients is substantially affected as elements such as C and N are lost and their chemical structure is altered by heating, i.e., charred (Pellegrini et al., 2021; Neff et al., 2005). Along with a changing climate, these effects influence community structure and processes such as soil respiration and nutrient cycling, which can shape future forest C and N cycles on decadal to centurial timescales (Johnstone et al., 2020; Mekonnen et al., 2019). Changing patterns of temperature and precipitation in recent decades have caused increases in frequency, intensity, and size of fires across the global boreal region, with further amplification predicted in the future (de Groot et al., 2013b; Gillett et al., 2004; Kelly et al., 2013; de Groot et al., 2003). Increasing emissions of C to the atmosphere due to fire and changing C cycling in recovering ecosystems may accelerate climate change (Li et al., 2017).
Both long-term (interannual variability) and short-term (intra-annual variability) processes have been identified as drivers of the dynamics of fire events. In particular, in North American boreal forests, the strongest driver of area-normalized emissions of C from wildfires appears to be total fuel (i.e., potentially combustible organic material) (Walker et al., 2018, 2020a, b). Fuel accumulation has been found to be strongly related to stand age and longer-term moisture levels (a factor of drainage conditions, evapotranspiration, and inputs through precipitation and lateral water flow) (Walker et al., 2018, 2020a, b). However, in order for this fuel to be available to be ignited and sustain fire, it must be both adequately dried and located within sufficient proximity to high heat and oxygen exposure during an active fire. This instantaneous proportion of total fuel that is readily combustible is termed fuel availability. Therefore, boreal wildfire models often incorporate short-term fire weather variables (e.g. drought indices, temperature, wind speed, relative humidity) and separate soil fuel loads into distinct compartments such as surface litter (influencing ignition and rate of spread) and the more compactly arranged layers below (acting as a heat reservoir that supports extended smoldering over days to weeks) (de Groot et al., 2003; Van Wagner, 1987; Rabin et al., 2017; Kasischke et al., 2005; Wiggins et al., 2021). Composition of tree species, with their associated fire adaptation strategies, has also been shown to have a strong impact on fire severity and intensity and distinguishes the boreal wildfire regimes of the North American and Eurasian continents (Rogers et al., 2015). Furthermore, climate has been observed to have a conditioning effect on fuel chemical composition through its control over vegetation characteristics and the decomposition state of their detrital inputs, which are often represented by the C : N weight ratio in soils (Vanhala et al., 2008; Kohl et al., 2018). Fuel chemical composition, arrangement, moisture content, applied heat, and oxygen availability in turn have all been related to the efficiency of the combustion reaction during fire and therefore emission chemistry and the charring of remaining fuel, which can form a surface pyrogenic layer with C and N weight concentrations that differ from the original material (Santín et al., 2016; Dymov et al., 2021; Schmidt and Noack, 2000). Production of charred material is an innately fire-driven process and a representative measure of these interrelated effects. Because additions of char to soils have been observed to have strong impacts on C storage and nutrient cycling (Pellegrini et al., 2021; Schmidt and Noack, 2000; Preston and Schmidt, 2006), this fire-induced transformation of remaining fuel is valuable to study alongside its loss from the ecosystem during wildfire.
A general approach to estimating boreal C emissions due to a single wildfire can be taken by multiplying total area burned by estimates of area-normalized C emissions (French et al., 2004; van der Werf et al., 2017). While total area burned may be evaluated directly through remote sensing (Giglio et al., 2018; Ruiz et al., 2012), estimating area-normalized C emissions entails a variety of approaches. These approaches are most often derived from the results of labor-intensive wildfire field sampling or controlled burns which are extrapolated to the larger scale either directly or through weighting by remotely sensed data (e.g. topography, vegetation cover, aerosol density) or poorly constrained parameters such as total fuel load (French et al., 2004; Soja et al., 2004; van der Werf et al., 2017; Veraverbeke et al., 2015; Kaiser et al., 2012). This field sampling has been regionally limited and biased towards a few high-intensity burn complexes in North America (Veraverbeke et al., 2021), which may in turn bias global emission estimates (van Leeuwen et al., 2014; Akagi et al., 2011). For example, the Eurasian boreal region is dominated by relatively fire-resistant overstory vegetation that avoids excessive heating by promoting lower-intensity ground and surface fires than that in boreal North America, which is more prone to spread rapid flaming combustion throughout the canopy (Rogers et al., 2015; de Groot et al., 2013a). C losses in surface fires in Siberian boreal pine forests were found to be 0.88 and 1.69 kg C m−2 under experimental and wild conditions, respectively (Ivanova et al., 2011; Kukavskaya et al., 2017). These are between one-quarter to half of what is typical in North American wildfire (3.3 kg C m−2) (Boby et al., 2010; Walker et al., 2020a). Although Eurasia contains over 70 % of the boreal global land area (de Groot et al., 2013a) and about 50 % (20 Mha yr−1) of its yearly burnt area (Rogers et al., 2015), methodologies for estimating global and regional C emissions are severely lacking ground validation and meter-scale assessments of drivers of C loss variability from this continent (Veraverbeke et al., 2021; van der Werf et al., 2017; Kaiser et al., 2012). Additionally, field measurements of total N loss from wildfire are rare in all boreal regions despite its recognized role as a limiting nutrient and evidence of its immediate removal in similar percentages to C (Boby et al., 2010). Lastly, direct field sampling of boreal wildfire has often focused on individual or small groups of fires located relatively close to each other, with little information about the representativeness of the observations or context of the results within the broader spectrum of fire impacts across the wider region, especially those relating to variation in climate. This knowledge gap has thus far been addressed with conglomerated studies spanning different fire seasons, ecosystem types, and research methodologies (Walker et al., 2020a; Gaboriau et al., 2020). Therefore, widely replicated, systematic field measurements of single-season fire processes in undersampled regions, with particular attention to climate, are needed to derive more robust, generalizable conclusions about boreal forest responses to wildfire.
This study sampled 50 separate fire complexes spanning broad gradients of mean annual temperature (MAT) and precipitation (MAP) which ignited in Sweden during summer 2018 (Fig. 1). This summer, along with that of 2014, were two of the most extreme fire seasons within Sweden in recent history, driven by severe drought conditions (Wilcke et al., 2020). The goal of this study is to distinguish the effects of climate on fire-induced changes in C and N stocks in an undersampled region with in situ, fine-scale measurements that both provide insight into local processes and allow for global comparison. Space-for-time substitution (De Frenne et al., 2013) along with a paired-sample design (Boby et al., 2010; Granath et al., 2021) provided insight into possible future conditions of Fennoscandian forests under a changing climate and fire regime. Specifically, the following was hypothesized:
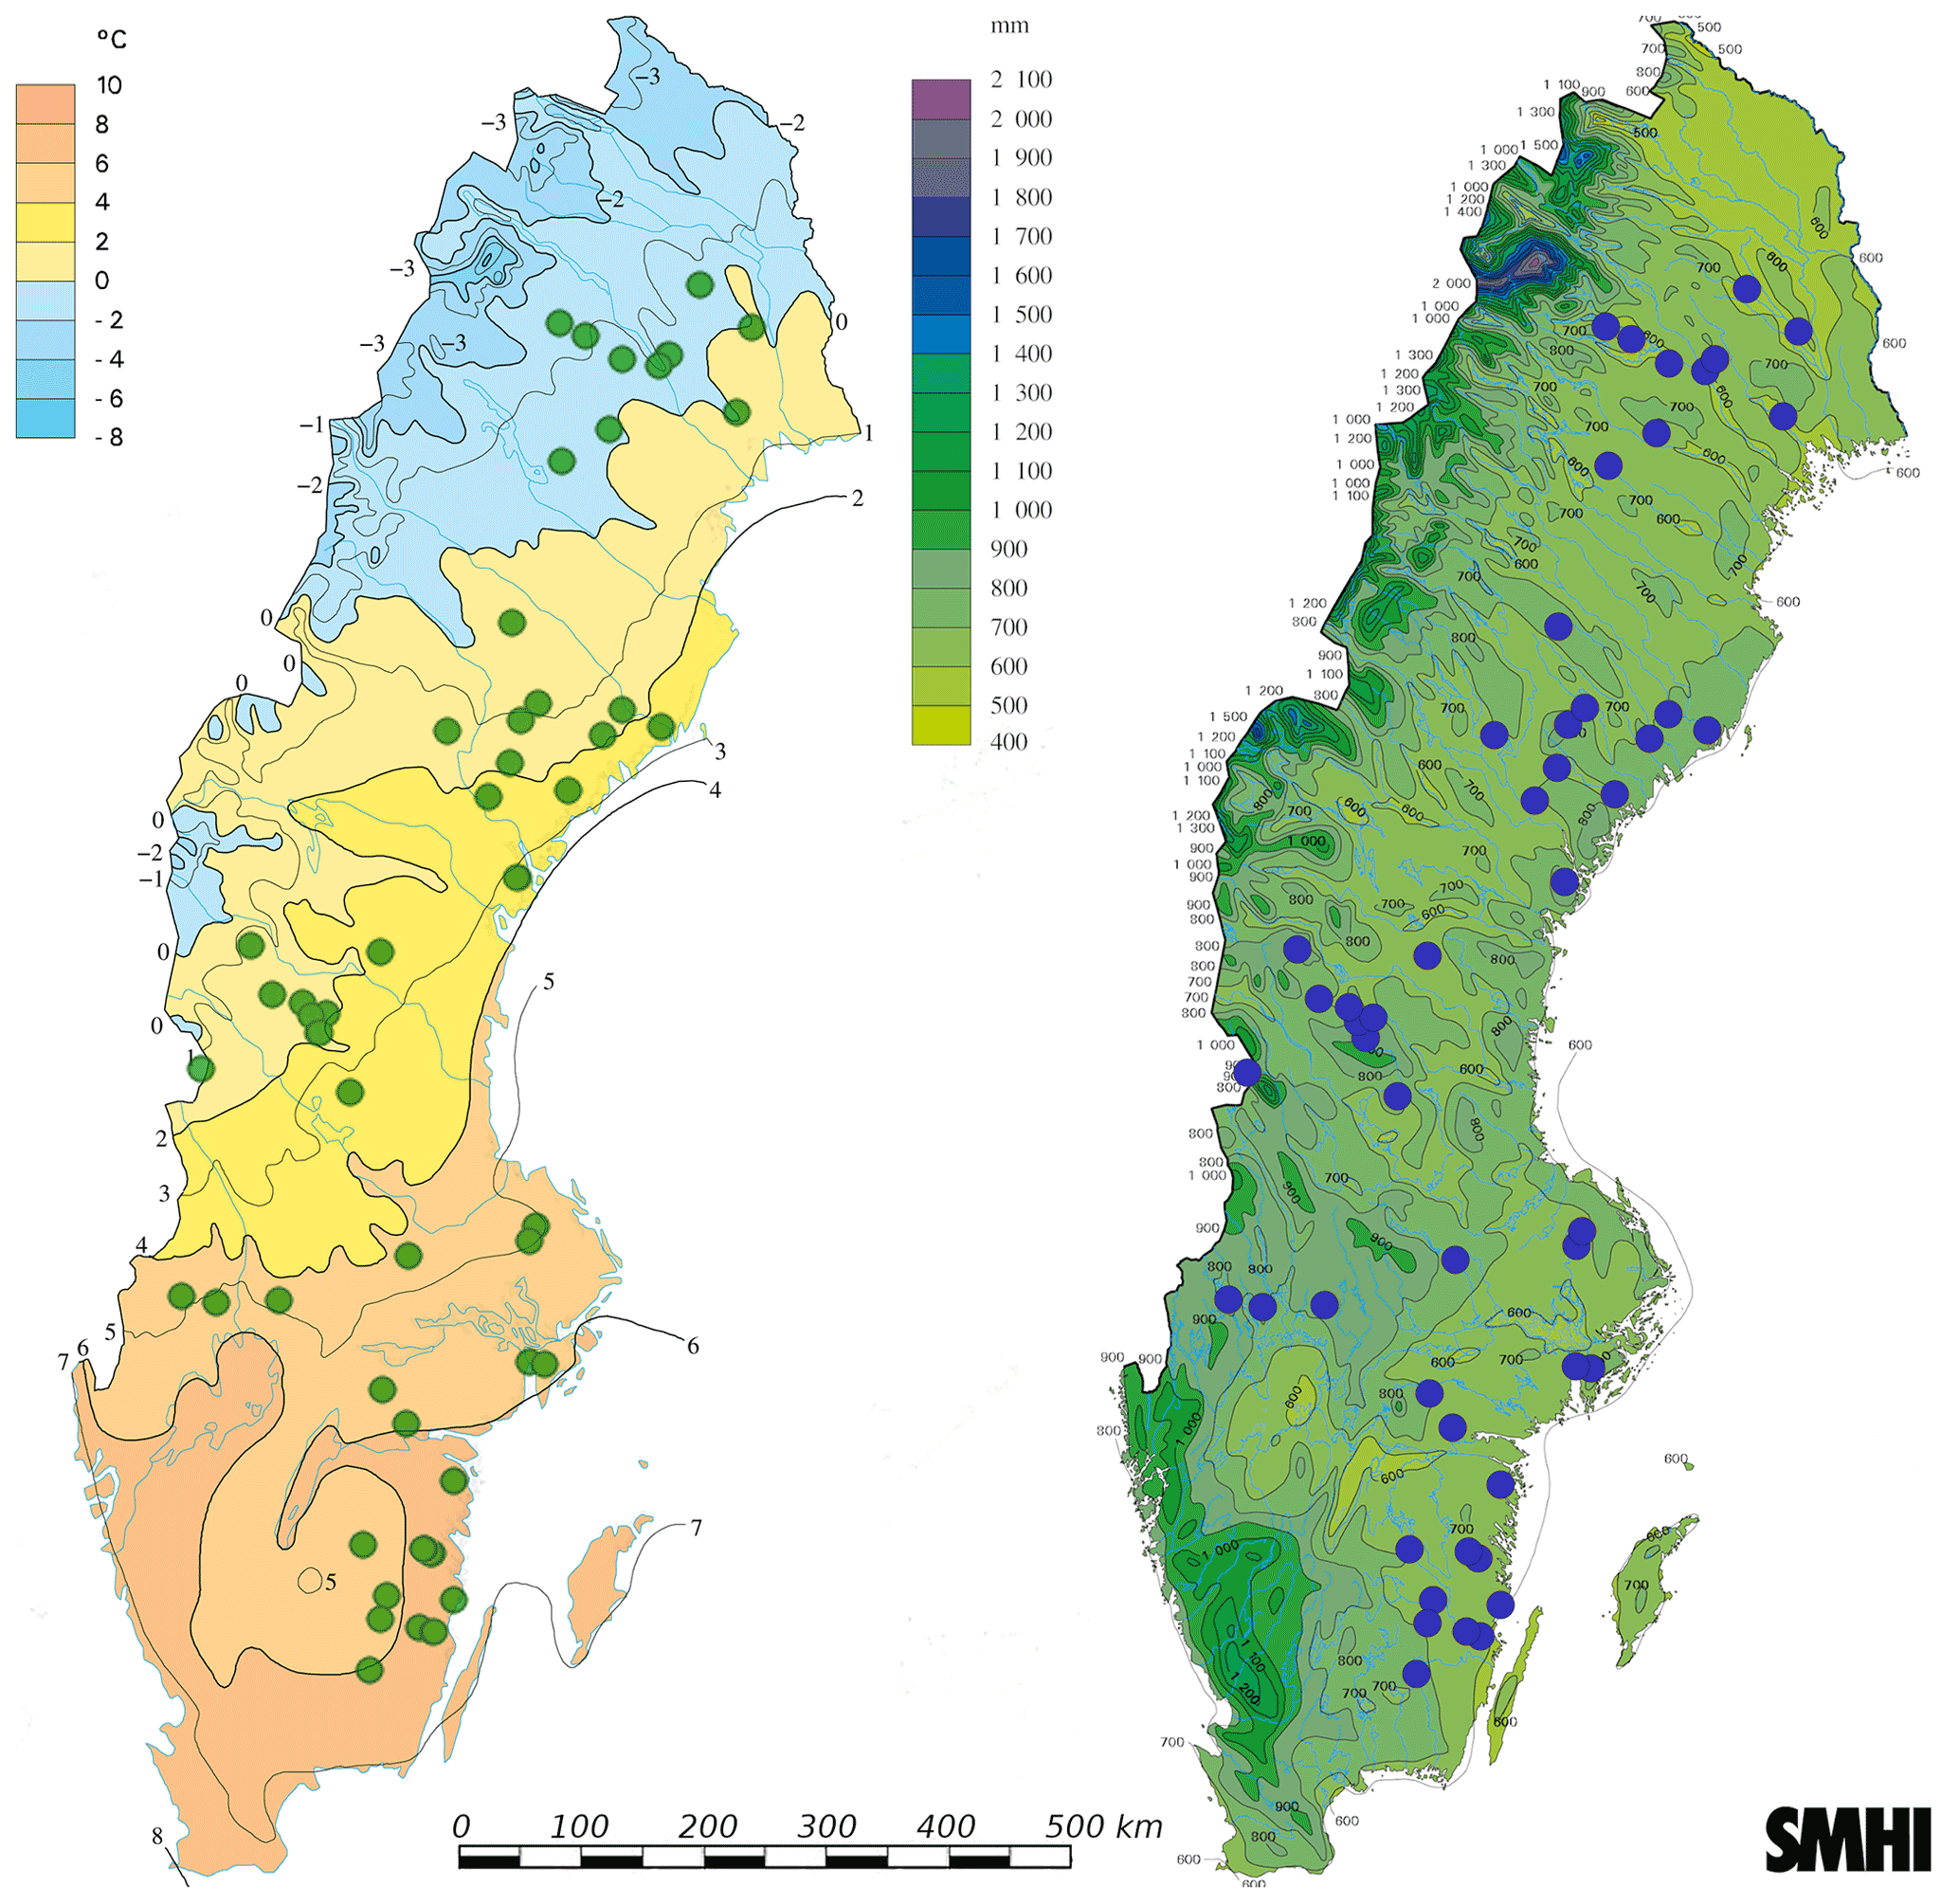
Figure 1Using climate data averaged over the period 1961–2017 provided by the Swedish Meteorological and Hydrological Institute (SMHI) for plot selection, mean annual temperature (MAT; left image) had a range of 0.43–7.77 ∘C and mean annual precipitation (MAP; right image) of 539–772 mm over an approximately 57–67∘ latitudinal change. The 50 plot pairs were added as points to a figure provided by SMHI of MAT and MAP gradients over the last normal period 1961–1990.
-
Fire significantly reduced C and N stocks across forest compartments.
-
Fire restructured organic layer C and N stocks by increasing overall bulk density and adjusting their weight concentrations across residual compartments and a newly formed pyrogenic layer.
-
Loss of soil and understory C and N stocks and their transfer to the surface pyrogenic layer were correlated to prefire total fuel amount, composition, and distribution amongst forest compartments.
-
A direct relation between climate variables and fire-induced C and N stock changes exists.
-
The relation between climate and fire-driven C and N stock changes is mediated by long-term ecosystem properties that affect the amount of forest fuel removed during fire.
2.1 Experimental design and field site selection
A total of 50 burnt plots were selected from a pool of 325 fires identified during the summer 2018 period that had perimeters manually mapped by the Swedish Forest Agency. Perimeters were drawn around burn scars identified using normalized burn ratio (NBR) values derived from Sentinel-2 bottom-of-atmosphere corrected bands 8 and 12. Each of the 20 × 20 m2 plots were located within distinct burn scars (greater than 2 km separation) to reduce potential for pseudoreplication or spatial autocorrelation (Bataineh et al., 2006) and allow for increased spread across the climate gradients (Schweiger et al., 2016). Constraints were placed on plot selection using spatial data within the QGIS (QGIS Development Team, 2019) and ArcGIS (Esri Inc., 2019) software environments. Plot-wide values for raster data were taken as the average pixel value within a 20 m diameter circle centered on the plot.
The first constraints on site selection were to avoid wetland or steeply sloping areas. Topo-edaphically derived soil moisture data (TEM) were provided at 10 m resolution by the Swedish Environmental Protection Agency (Naturvårdsverket, 2018). TEM was given as integer values ranging from 0 to 240 (in order of increasing moisture potential) and was based on the soil topographic wetness index (Buchanan et al., 2014) in areas where soil type information was available and on the two topographic indices depth to water (Murphy et al., 2007) and the topographic wetness index (Beven and Kirkby, 1979) where soil information was unavailable. These measures gave an estimate of soil drainage, which can be predictive of long-term soil moisture patterns (Walker et al., 2020b). Elevation data were provided by the Swedish Mapping, Cadastral and Land Registration Authority from a 50 m resolution digital elevation model (Lantmäteriet, 2021). Slope was calculated using the “slope” function within the ArcGIS software environment. Using these datasets, all plots were selected to have below both 150 plot-averaged TEM units and 15∘ slope. This restricted the study to non-wetland ecosystem types, since wetlands tend to have markedly differing ecosystem functioning than relatively drier forested regions and to retain focus on climate-driven effects and their space-for-time substitution by reducing the effects of exogenous variables such as topography on models. To further isolate fire effects in response to variation within a single ecosystem type, Swedish Forest Agency data on tree species were used to select only stands dominated by Scots pine (Pinus sylvestris). These stands were determined to be at least 30 years of age using data from the Swedish University of Agricultural Sciences (Dept. of Forest Resource Management, Swedish University of Agricultural Sciences, 2015). The relatively dry Swedish forested area is predominantly made up of podzols with distinct separation of a low-C mineral layer from a high-C organic layer above (Olsson et al., 2009). It is assumed the dominant properties of these layers that affect fire severity are soil drainage (TEM) and fuel loading (organic layer C). Additional soil property data sources were not available at a high enough resolution, and, therefore, no further classification of soil properties between and across plot pairs was performed to determine site selection.
Next, sites with postfire salvage logging were omitted using recent visual imagery along with Swedish Forest Agency records. Burnt plots were selected to maximize spacing over latitude, MAT, and MAP gradients (Schweiger et al., 2016). MAT and MAP values were derived from daily records averaged over the period 1961–2017 that were extracted from a 4 km resolution hydrological modeling dataset provided by the Swedish Meteorological and Hydrological Institute (Olsson et al., 2013). The above mentioned Sentinel-2 imagery was used to locate burnt plots as close to the highest NBR pixel values within each of their mapped final burn scar perimeters while satisfying all other plot selection requirements. This method intended to add consistency to plot selection by placing sampled regions within the most highly fire-impacted regions as measured by NBR. Thereby, the potential for observed differences in fire effect between burn scars due to varied spatial proximity to these most highly impacted regions is assumed to be reduced. NBR values were otherwise not used for comparison across separate burn scars. Visual and infrared image processing was performed in May 2019 through the brandkarta web application provided by the Swedish Forest Agency. No criteria for fire severity were used for plot selection outside of their detectability using the above methods and data sources.
In order to estimate the effects of fire, prefire properties of each burnt plot were approximated using measurements from an identically sized, adjacent control plot centered between 15 and 150 m (58 m average) outside the fire boundaries (100 plots total, i.e., 50 plot pairs). A major limitation to this approximation is that observed differences within plot pairs may be skewed through inaccurate or imprecise representation of prefire burnt plot properties by control plot measurements. An attempt to reduce these errors was made by incorporating a large sample size (n=50) and strict controls on the matching of important ecosystem variables. In order to reduce disparities between control and prefire burnt plot properties, the following restrictions were placed on control plot selection. Control plot locations were selected to minimize elevation, slope, and TEM differences from the adjacent burnt plot. Swedish Forest Agency data regarding tree species, overstory biomass, and basal area (collected during 2014) were used to best match properties of control and burnt plot pairs. As a complement to the quantitative overstory data, aerial and satellite images provided by the Swedish National Land Survey were examined. This gave quick visual verification that plot pairs, and the area between them, had not been disturbed by fire or logging over the past 30 years and that stand structure appeared homogeneous and uninterrupted by roads or other artificial structures.
Due to their documented effects on C emissions (Walker et al., 2018), metrics related to both short-term and long-term soil moisture conditions were considered in this study. Long-term moisture conditions were separated into a topo-edaphic component (i.e., TEM) and a climatic component (i.e., MAP and MAT). TEM was considered to be representative of the soil drainage, which has been observed to relate to C emissions in a separate study (Walker et al., 2018). MAP and MAT were considered to have an additional effect on moisture balance through their controls on direct water input and evapotranspiration. The shorter-term moisture balance of summer 2018 was assessed with the Standardised Precipitation–Evapotranspiration Index (SPEI) due to its observed relationship to fuel drying and fire activity in boreal Eurasia (Chen et al., 2021; Ponomarev et al., 2016). SPEI was calculated over the first 6 months of 2018 at 0.5∘ spatial resolution within the SPEIBase data source to capture the extended desiccation process leading up to each fire (Beguería et al., 2019). Due to limited temporal information on 2018 fire activity, common fire weather metrics were unavailable and were instead approximated by summer 2018 anomalies in temperature (ΔMAT) and precipitation (ΔMAP), i.e., the difference in the 2018 June, July, and August average of these values from those during the same months averaged over the period from 1961 to 2017. These two metrics were used in regression for direct comparison to SPEI and to explain C and N losses.
2.2 Sampling
Site visits occurred approximately 1 year postfire between 5 and 20 August 2019. This 1-year delay intended to capture the more immediate effects of fire due to potential rapid spikes in nutrient losses and tree mortality, which generally occur within the first year, but avoid the accumulation of discrepancies in C and N stocks relative to control plots due to any longer-term differences in rates of decomposition, leaching, and litter addition (Granath et al., 2021; Certini, 2005; Sidoroff et al., 2007).
Sampling and analysis were broken into six forest compartments. The compartments included four soil layers (i.e., mineral, duff, moss/litter, and char) as well as the two aboveground compartments (i.e., understory and overstory vegetation). The organic layer was defined as the duff, moss/litter, and char layers grouped together while the soil category was considered the organic layer grouped with the mineral layer. The category called “total” refers to the grouping of the soil and understory but excludes the overstory due to its minimal combustion (as judged by observed scarcity of canopy blackening). Woody debris mixed in the moss/litter layer was sampled in this study, though not the coarse woody debris laying on top of this layer. While larger dead wood lying on top of the forest floor can contribute to C and N stocks and their losses due to fire, this material is typically of low prevalence in Sweden (Jonsson et al., 2016) and difficult to accurately measure, and standard methodology to estimate its consumption by fire is only beginning to be developed (Dieleman et al., 2020). Therefore, focus remained on the variation in the larger and more readily measurable ecosystem C and N pools in soil and living vegetation.
2.2.1 Soil
Soil horizon depths (i.e., the distance from bottom to top of each individual layer) of the mineral, duff, moss/litter, and char layers were measured at 20 points per plot from 10 equally spaced excavations along each plot diagonal (Kristensen et al., 2015). The mineral layer was measured from its highest rock obtrusion to the bottom of the duff layer. The duff layer was considered the grouping of the F (partially decomposed material) and H (humic material) layers in accordance with the Canadian system of soil classification (Canada Soil Survey Committee, 1978), as is common in boreal wildfire literature. The moss/litter layer was all unburnt material on top of the duff layer, including visually identifiable detritus and living moss. In all burnt sites, a layer of conglomerated char formed a clear boundary on top of the moss/litter, allowing for distinct measurement. Here, char is defined as fully blackened, brittle material with apparent high heat exposure due to fire. This separation was made based on large observed differences in C and N concentrations in surface pyrogenic layers compared to lower residual layers in similar ecosystems (Santín et al., 2016; Dymov et al., 2021; Bodí et al., 2014).
Samples were acquired for all four soil layers. Four mineral soil samples were taken using a 3 cm diameter, 40 cm long gouge auger corer at four corners of a square each 15 m from the plot center. Where feasible, at least 10 cm vertical mineral cores were taken; however in shallower layers a minimum depth of 5 cm each was collected. Duff samples were collected at the same plot corners as the mineral cores by excavating four soil volumes of approximately 25 × 25 cm2 area and at least the full depth of the organic layer. This volume was trimmed to discard the mineral and moss/litter layers off the bottom and top of the volumes, respectively. Right angles were then gently cut with sharp scissors, and the three dimensions were measured in millimeters (collected samples were at least 400 cm3 each and aimed to sample the entire in situ depth). Duff and mineral soils were kept frozen until portions were freeze dried for separate analysis. Moss/litter samples were collected by cutting squares, with attention to preservation of the natural in situ volume, until filling a 553 cm3 steel container. Char layer samples were similarly collected in a 112 cm3 container. At least one sample each of moss/litter and char were acquired from each plot quadrant, though more were taken at equal spacing along a transect to fill the containers if the layer was thin. On the upper surface of the char layer were small portions of dry, unburnt material, which were likely postfire additions of litter to the forest floor. This material was discarded from the char collection and was not included in C and N stock estimates.
2.2.2 Vegetation
Individual tree bole diameter (sampled at 130 cm height above the forest floor) and species were recorded within each plot perimeter for all trees of at least 5 cm diameter at measurement height. Trees less than 5 cm were uncommon and assumed to contribute negligibly to biomass and C emissions. A tree was recorded as living if standing upright and having any proportion of green needles (Sidoroff et al., 2007). If a fallen tree was charred only on its lower (in standing orientation) portions, it was deemed standing during fire ignition, and its measurements were included if its base was within plot boundaries. In burnt plots, the percentage of brown and black needles in each tree canopy was visually approximated as 0 %, 25 %, 50 %, 75 %, or 100 %, with these individual values averaged to give an estimate of total plot canopy browning and blackening. Overstory biomass was calculated by entering bole diameters into allometric equations for Scots pine (Pinus sylvestris), Norway spruce (Picea abies), silver birch (Betula pendula), and downy birch (Betula pubescens) (Marklund, 1987). Birch allometric equations were applied to 7 of the 1716 trees sampled in burnt plots that were not one of these four species (which were unidentified and deciduous). From the results of the equations, aboveground biomass was considered to be the categories stem wood, stem bark, living branches, dead branches, stump, and needles while belowground was coarse roots (≥5 cm) and fine roots (<5 cm). Stump, needle, coarse root, and fine root categories were inapplicable for birch, and its biomass was calculated only from the remaining categories. To estimate overstory total aboveground C and N, CR (ratio of sample C weight to total weight) for all components was set to 0.5 and NR (ratio of sample N weight to total weight) to 0.01 for needles and 0.004 for all other parts (Boby et al., 2010). Bole diameters from the burnt plots were used to investigate the influence of overstory vegetation C, N, and composition on C and N loss. Bole diameters from adjacent control plots provided plot-pair estimates of increased canopy blackening/browning and mortality as well as differences in species dominance and C and N to be tested for their influence on C and N losses over the 50 plot network.
Understory samples were taken from control plots by cutting all non-moss, non-tree plant material at the surface of the soil within four 40 × 40 cm2 patches, each from a separate plot quadrant. To reduce sampling error due to low plot coverage, the sample patches were chosen by performing four quadrant-wide surveys noting visual estimates of coverage and proportions of plant functional groups (i.e., graminoids, forbs, shrubs, and pteridophytes). These were applied in selecting representative patches for the portion of the quadrant that was vegetated, which was always all non-bare rock surface. The conglomerated biomass density and composition for the four samples were applied to the visually estimated non-bare rock surface area of an entire burnt plot to approximate its prefire understory coverage.
2.3 Sample processing
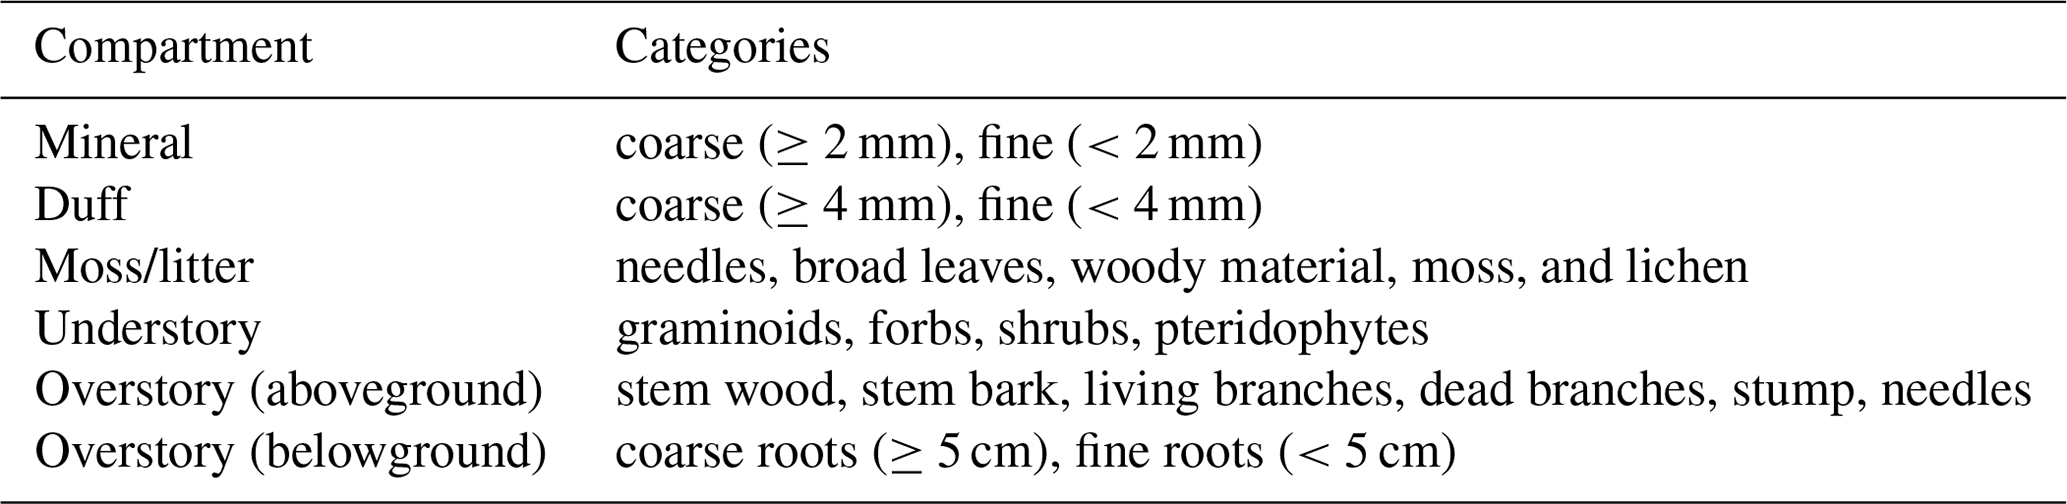
During sample processing each ecosystem compartment was sorted by weight into categories to produce rough metrics of their composition and structure, here called compartment composition variables (CCVs). This sorting is described in the immediately following and summarized in Table 1. All samples were dried at 40 ∘C for at least 3 d. Dry moss/litter samples were weighed, and visual estimates for percentage volume of needles, broad leaves, woody material, moss, and lichen were multiplied by total weight to form CCVs. This broadly categorized visual estimation, along with the assumption of equal category density, is meant to test for general effects of variation in proportions of surface fuel types on total soil fuel buildup and fire severity. CCVs for understory were determined by sorting the sampled understory plant material and measuring dried weights of the functional groups graminoid, forb, shrub, and pteridophyte. Mineral and duff samples were sieved to 2 and 4 mm, respectively. The weights of the coarse and fine fractions formed a pair of CCVs for each of the layers. CCVs for the overstory were collected as the individual aboveground and belowground categories from the allometric equations.
Table 1CCV categories for ecosystem compartments given in dry weight (kg).
Bulk density of each soil layer per plot was calculated as the total dry weight of its samples divided by their total volume as measured during collection. All samples were pulverized, except the mineral soil where only the fine earth fraction (<2 mm) was analyzed (CR and NR were set to 0 for the coarse fraction), and packed in tin capsules. The capsules were combusted in a Costech ECS 4010 elemental analyzer, equipped with a 2 m packed chromatographic column for gas separation, to produce CR and NR values. After every 10 samples, standardized acetanilide (provided by the company Elemental Microanalysis, Okehampton, United Kingdom) was run to calibrate the machine within 1 %. Duff and mineral layer elemental weight ratios were recalculated by the sum of C or N in each of their fine and coarse fractions and divided by total compartment weight. The C : N ratio for each ecosystem compartment was calculated by dividing its total weight of C by total weight N.
2.4 Data analysis
2.4.1 C and N stock calculation
The measurable properties used in C and N stock calculations within soil compartments are the depth, bulk density, and CR or NR. Total C and N stocks per soil compartment were calculated as a product of these properties using the equation
where subscript Z is substituted with C or N for reference to C or N stocks, d is the soil layer depth in meters, ρ is the layer bulk density (kg m−3), and ZR is CR or NR. Understory compartment C and N stock calculations were performed with the equation
where m is the sampled mass in kilograms, A is sampled area (m2), ZR is CR or NR, and F is the estimated fractional vegetation coverage of the 20 × 20 m2 plot.
2.4.2 Plot-pair differences and confidence intervals
Unless otherwise noted, all measured changes between control and burnt plots were first calculated by subtracting control plot values of a variable from those of its burnt pair, thereby forming a single distribution of 50 elements for statistical testing. These distributions were approximated as normal, and all confidence intervals were constructed at the 95 % level, unless otherwise noted, using the formula
where is the sample mean, z is always 1.96 for the 95 % interval, σ its standard deviation, and n is the sample size (always 50). Differences between control and burnt plots were significant when their interval did not include zero. When described as losses, C and N stock differences between control and burnt plots were expressed as a positive number.
2.4.3 Statistical model construction
All regression analyses used the ordinary least-squares approach to estimate a function for a single response variable based on linear combinations of the predictor variables and an intercept term. Simple regression was performed using the stats.linregress method from SciPy (Virtanen et al., 2020) providing significance (p), correlation (r), and slope (b). Multiple regression was carried out with the OLS class in the Python 3 statsmodels package (Seabold and Perktold, 2010), with models evaluated in order of increasing Akaike information criterion (AIC) (Akaike, 1974). Standardized regression coefficients (β) were produced by normalizing all variables (i.e., converting to z scores) before regression. When multicollinearity of explanatory variables in multiple regression was present, the condition number of the model provided by the corresponding OLS object was required to be less than 10 (Alin, 2010). Regression variables were also assessed in their squared, square-root, natural log, exponential, and reciprocal transformations.
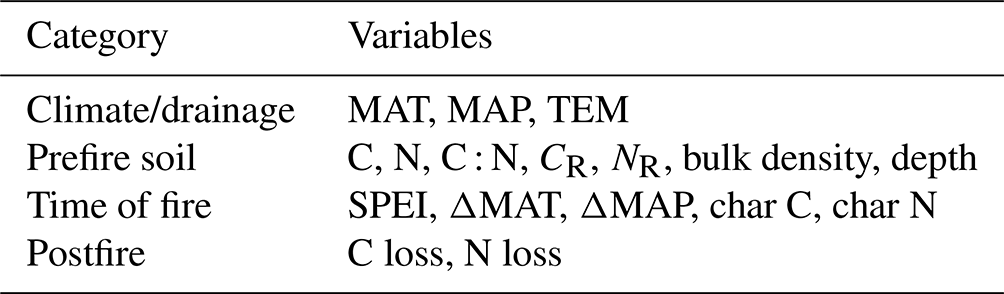
Multiple regression results were organized into path diagrams based on the assumption that regional climate (i.e., MAT and MAP at the kilometer scale) and soil drainage (TEM) could have a causal influence on the development of measured forest and fire attributes with negligible reverse effect. A clear potential causal direction of prefire forest properties influencing time-of-fire processes, which together influence C and N losses, is established by the temporal division of these measures across and within a discrete fire event. Therefore, variables in path diagrams are grouped into a causal order of climate/drainage to prefire to time-of-fire to postfire (i.e., C and N losses) properties. The main variables used in model construction are presented in Table 2.
Table 2Main variables used in path diagram construction listed and grouped by category. Each category row is assumed to have a potential causal effect on lower rows.
Once causal models using the main variables were established, CCVs were added to the prefire variable category to test for their significance (p<0.05) and increased explanatory power (decreased AIC) of C and N losses in multiple regression as well as their direct correlation to all model variables. This was done by using the original variables from each compartment as well as additional testing of the moss/litter, understory, and overstory compartments with their first two principal components produced by the PCA class in statsmodels. This same analysis was performed using ratios of C and N stocks present in the sampled control plot compartments. These ratios were aboveground (overstory, understory) to belowground (soil), moss/litter to duff, understory plus overstory to duff, and organic to mineral.
3.1 Survey of burnt plot vegetation
The 50 burnt plot overstories were largely dominated by pine with a percentage of spruce stems between 25 %–50 % in five plots, between 50 %–75 % in three plots, and greater than 75 % in two plots. Birch stems were less than 25 % in 44 plots and between 25 %–50 % in six plots, of which only one was spruce dominant. All plots showed some visible charring of tree boles, though only three plots had greater than 1 % plot-wide canopy blackening. These plots were pine dominant, with two having less than 1 % spruce stems while the other had six spruce stems of the 27 stems within the sampled area. Prefire aboveground overstory C and N were estimated as 4.46 ± 0.74 kg C m−2 and 0.0385 ± 0.0062 kg N m−2, respectively, with 5.31 % of C (0.237 ± 0.032 kg C m−2) and 12.3 % of N (0.00474 ± 0.00064 kg N m−2) coming from pine and spruce needles. The 50 burnt plots had a large percentage of tree mortality (45.0 ± 8.8 %) compared to control plots (4.21 ± 1.63 %). Total C and N loss, as well as char layer mass, were not correlated to canopy browning, blackening, or increased mortality in burnt plots relative to control plots.
Understory coverage was reduced to 10.2 ± 5.2 % of its estimated prefire values. This left a surface layer of charred material exposed in all plots. The char layer was conglomerated and easily separable from lower layers and thin clumps of litter additions on top which were mostly needles. Upon breaking apart the layer, it was found to be completely blackened throughout. Example photographs of four burnt plots are provided in Fig. 2.
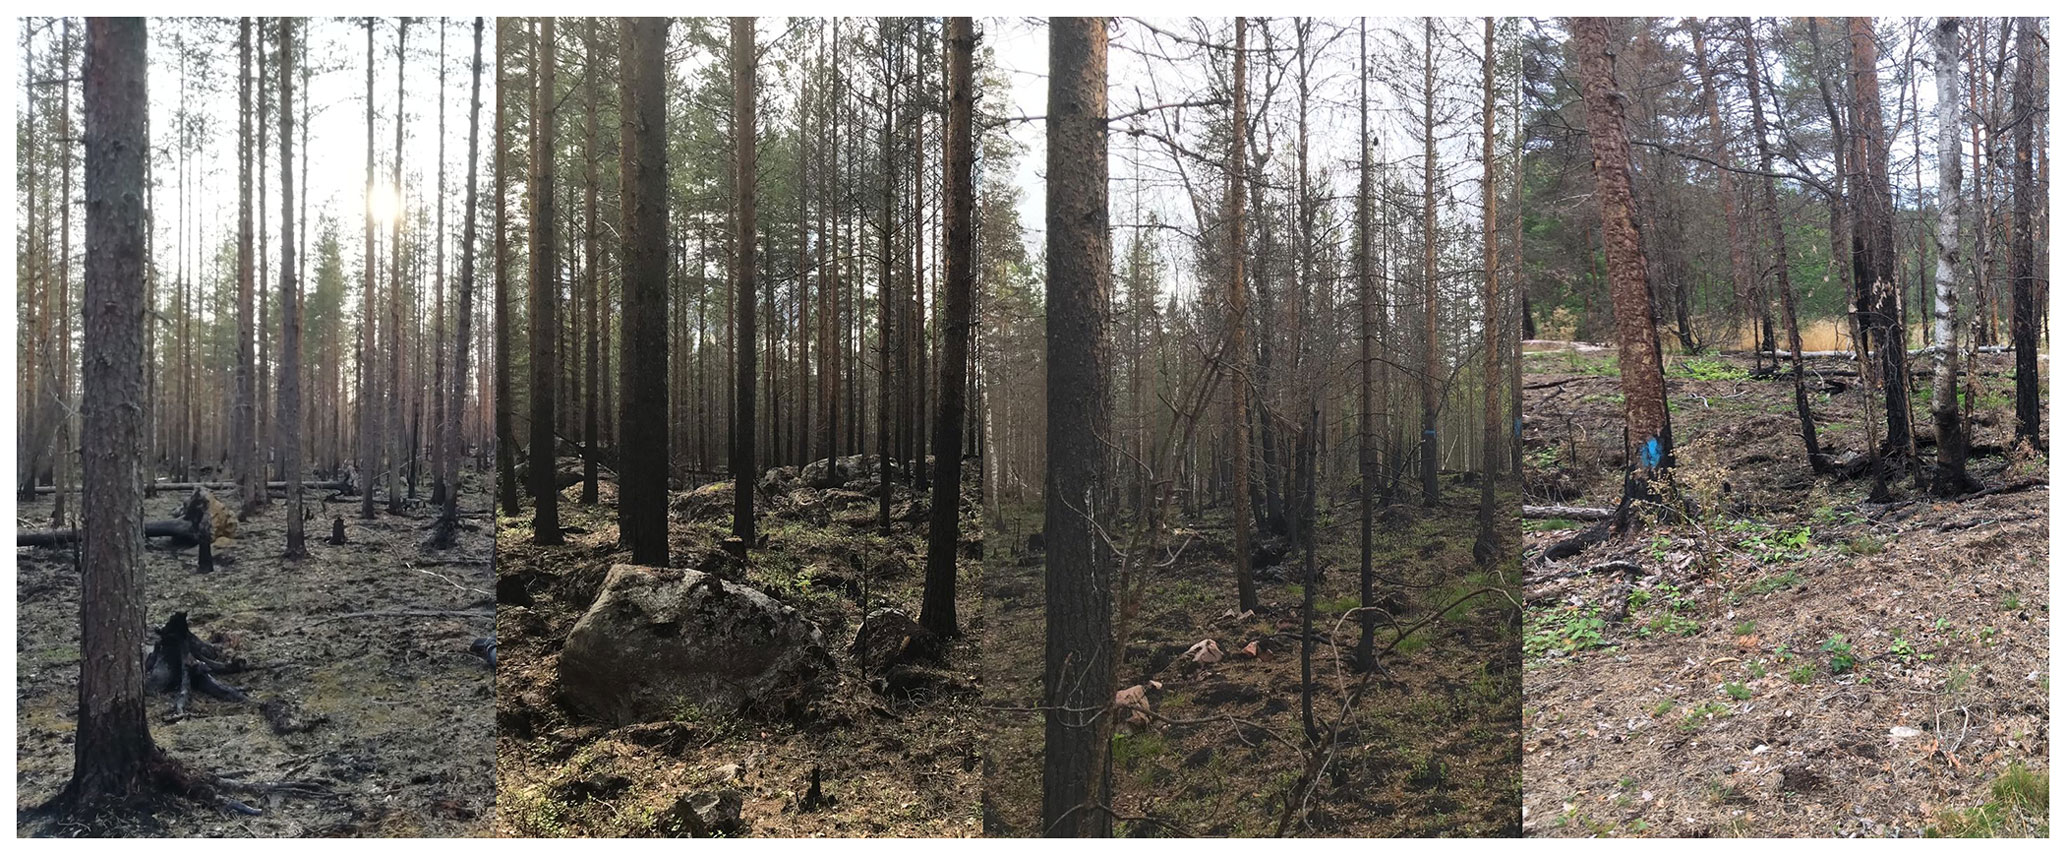
Figure 2Field pictures from four separate burnt plots taken approximately 1 year after fire. Trees show charring of boles and enhanced exposure of roots due to fire-reduced organic layer height. Upon a surface char layer are new litter additions composed of mostly needles. Patchy regrowth of understory was present in many plots.
Control plot soil C was not correlated to its overstory aboveground C (p=0.959), understory C (p=0.285), or their sum (p=0.962). These relationships regarding N also showed no significant correlations. However, percentage of spruce stems in control plots was correlated to organic layer C (p=0.033, r=0.302) and N (p=0.007, r=0.378), though with noticeable heteroscedasticity in the regression fit. Regardless, individual plot-pair differences of estimated overstory C (p=0.824), understory prefire plot coverage (p=0.384), and the percentage of spruce stems (p=0.971) were not related to C losses. The same is true for N. Therefore, there is likely no significant impact of plot-pair vegetation mismatch on the estimates made in this study over the 50-plot network.
3.2 C and N stock losses and restructuring
Averaging across all sites sampled, fire caused significant restructuring of C and N stocks, particularly through changing soil depth and bulk density, which increased the mass per volume of both C and N. Significant differences in total C stocks of −0.815 ± 0.652 kg C m−2 in burnt plots from their paired control plots were observed, but differences in N were insignificant (0.00208 ± 0.01840 kg N m−2). Fire clearly converted large amounts of C and N from lower soil layers to the high-NR surface layer of char. Organic layer CR was unaffected by fire; however strong changes in NR were measured, resulting in an overall significant increase in the C : N ratio of this layer. Mean values and confidence intervals of the differences between control and burnt plots highlighted in this section for all measured compartments are shown in Table 3 with soil-specific properties shown in Table 4.
3.2.1 Total C
The largest total loss of C in burnt plot compartments due to fire was from the duff layer (Fig. 3a). A total of 72.0 % of the moss/litter C was removed from burnt plots, comprising an equivalent of 51.7 % of the total amount of C that was removed from the duff layer. Understory C removal due to fire was near complete but had a relatively small contribution to overall C stocks and their changes. Char layer C averaged across the 50 burnt plots was equivalent to 54.3 % of the average C lost due to fire from the combined understory and organic compartments. Burnt plot mineral layers had no significant overall change in C between control and burnt plots.
3.2.2 Total N
Fire adjusted the proportions of total N stored in burnt plot forest compartments despite having no overall significant effect on its total amount (Fig. 3b). Similar percentages of N and C were lost from the duff, moss/litter, and understory compartments. Char layer N was equivalent to 100.8 % of average combined N loss from these combined compartments. Change in N in the mineral layer from control to burnt plots was insignificant.
3.2.3 C : N ratio
The greater proportional reduction of C relative to N from control to burnt plots caused significant decreases in the C : N ratio in all compartments except the duff layer, which was unchanged (Fig. 3c). The low C : N ratio in the char layer (29.78 ± 1.70) made a strong contribution to the overall reduction in this value in burnt plot organic layers compared to those in control plots.
Table 3Mean values of distributions (n=50) formed by subtracting control plot variables from their paired burnt plot. In parentheses are first the 95 % confidence interval of the distribution and then the percentage change calculated from the overall means of control and burnt plots. Statistically significant fire-induced changes are in bold.

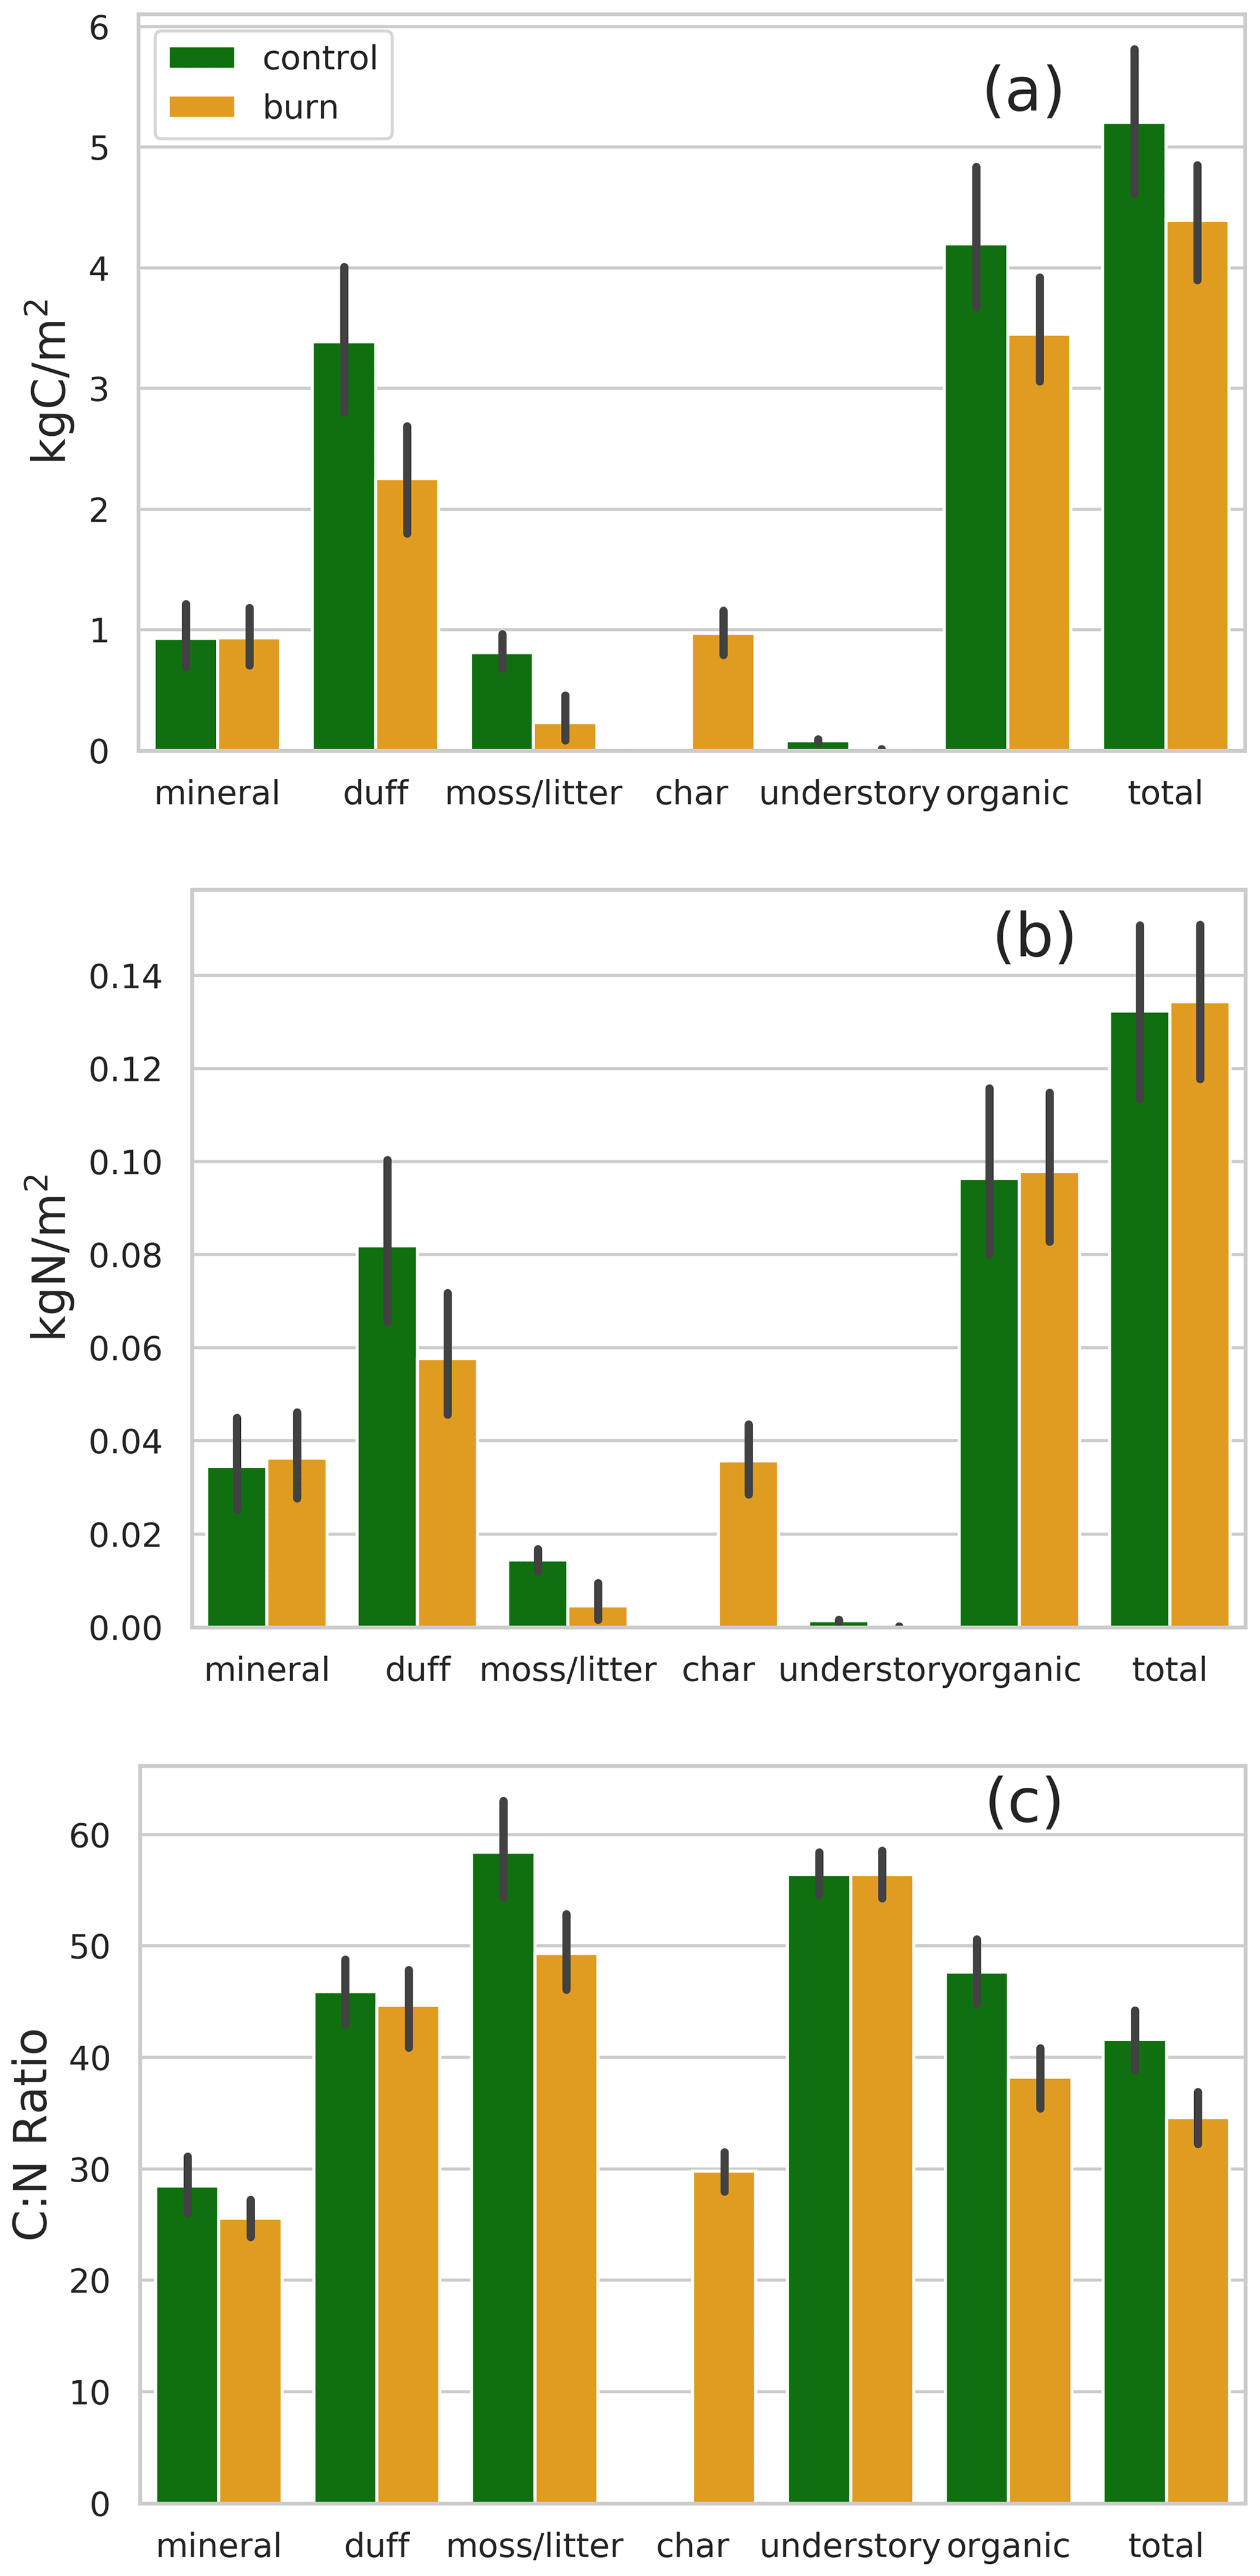
Figure 3Mean C (a) and N (b) stocks and their ratio (c) between burnt and control plots amongst forest compartments. The organic category is considered the grouping of the duff, moss/litter, and char layers while the total category is the grouping of the organic and mineral soil layers along with the understory. Error bars are the bootstrapped 95 % confidence interval of the mean.
3.2.4 CR and NR
The duff layer CR and NR did not change significantly, though the moss/litter layer showed a significant increase in both values in burnt plots compared to their paired control plots (Fig. 4c, d). These layers together with the char layer CR (0.498 ± 0.019) and NR (0.0173 ± 0.0011) resulted in the organic layer having no change in CR but a significant increase in NR in burnt plots. The mineral layer had significantly lower CR and NR in burnt plots both overall and in the fine fraction CR (−0.0210 ± 0.0145, −33.7 %) and NR (−0.000509 ± 0.000415, −24.1 %) compared to the control plots.
3.2.5 Soil layer depths and bulk density
Fire had a strong effect on reducing soil layer depths with removal of nearly the entire moss/litter layer and about one-third of the duff thickness (Fig. 4a). Together with the formation of the char layer and insignificant mineral layer depth changes, fire removed about a quarter of total soil depth and nearly 40 % of the organic layer depth in burnt plots. Bulk density of both the duff and moss/litter layers increased significantly, and, along with producing a dense char layer, fire had a strong densifying effect on the organic layer (Fig. 4b). No significant change in bulk density occurred in the mineral layer due to fire.
3.2.6 Statistical contribution of measured changes to C and N losses
To quantify the relative statistical contributions of the variation in fire-induced changes in organic layer depth, bulk density, and elemental weight ratios, they were used as predictor variables in multiple regression to explain organic layer C and N losses. The C loss regression produced a model of fit of R2=0.865 and standardized regression coefficients for changes in depth (), bulk density (), and CR (). N loss produced a model fit of R2=0.777 and coefficients for loss of depth (), bulk density (), and NR (). This shows that changes of these variables due to fire all had a strong effect on C and N stock loss estimates. Measured change in organic layer depth is the strongest determinant of losses of N. However, for C, bulk density and elemental weight ratios are nearly as important as depth.
Table 4Mean values of distributions (n=50) formed by subtracting control plot variables from their paired burnt plot. In parentheses are first the 95 % confidence interval of the distribution and then the percentage change calculated from the overall means of control and burnt plots. Statistically significant fire-induced changes are in bold.
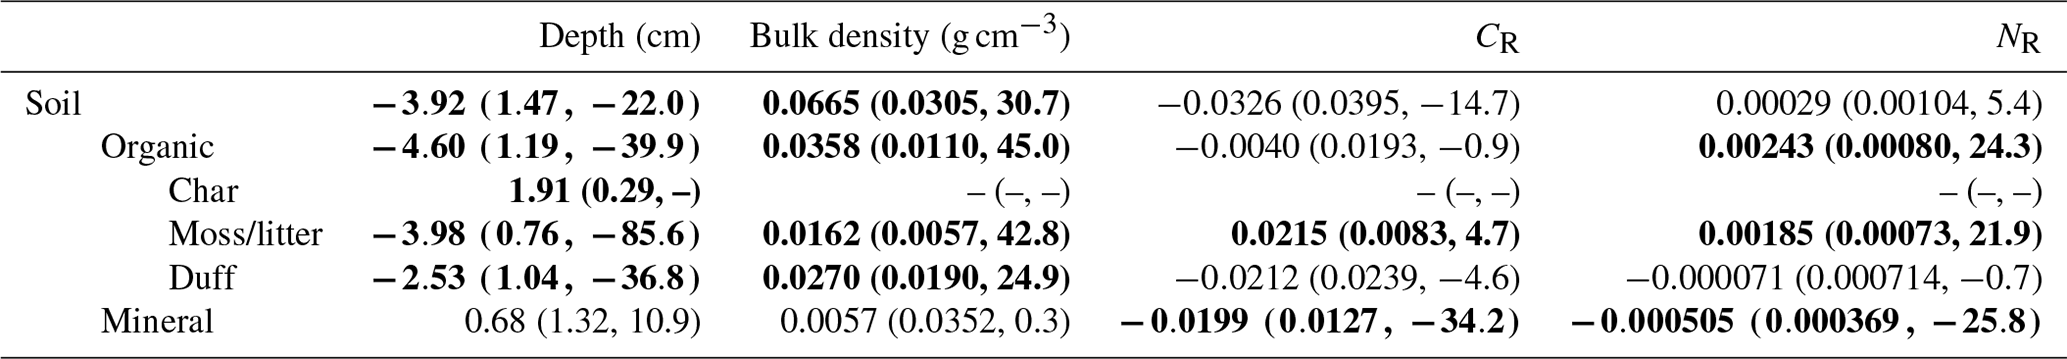
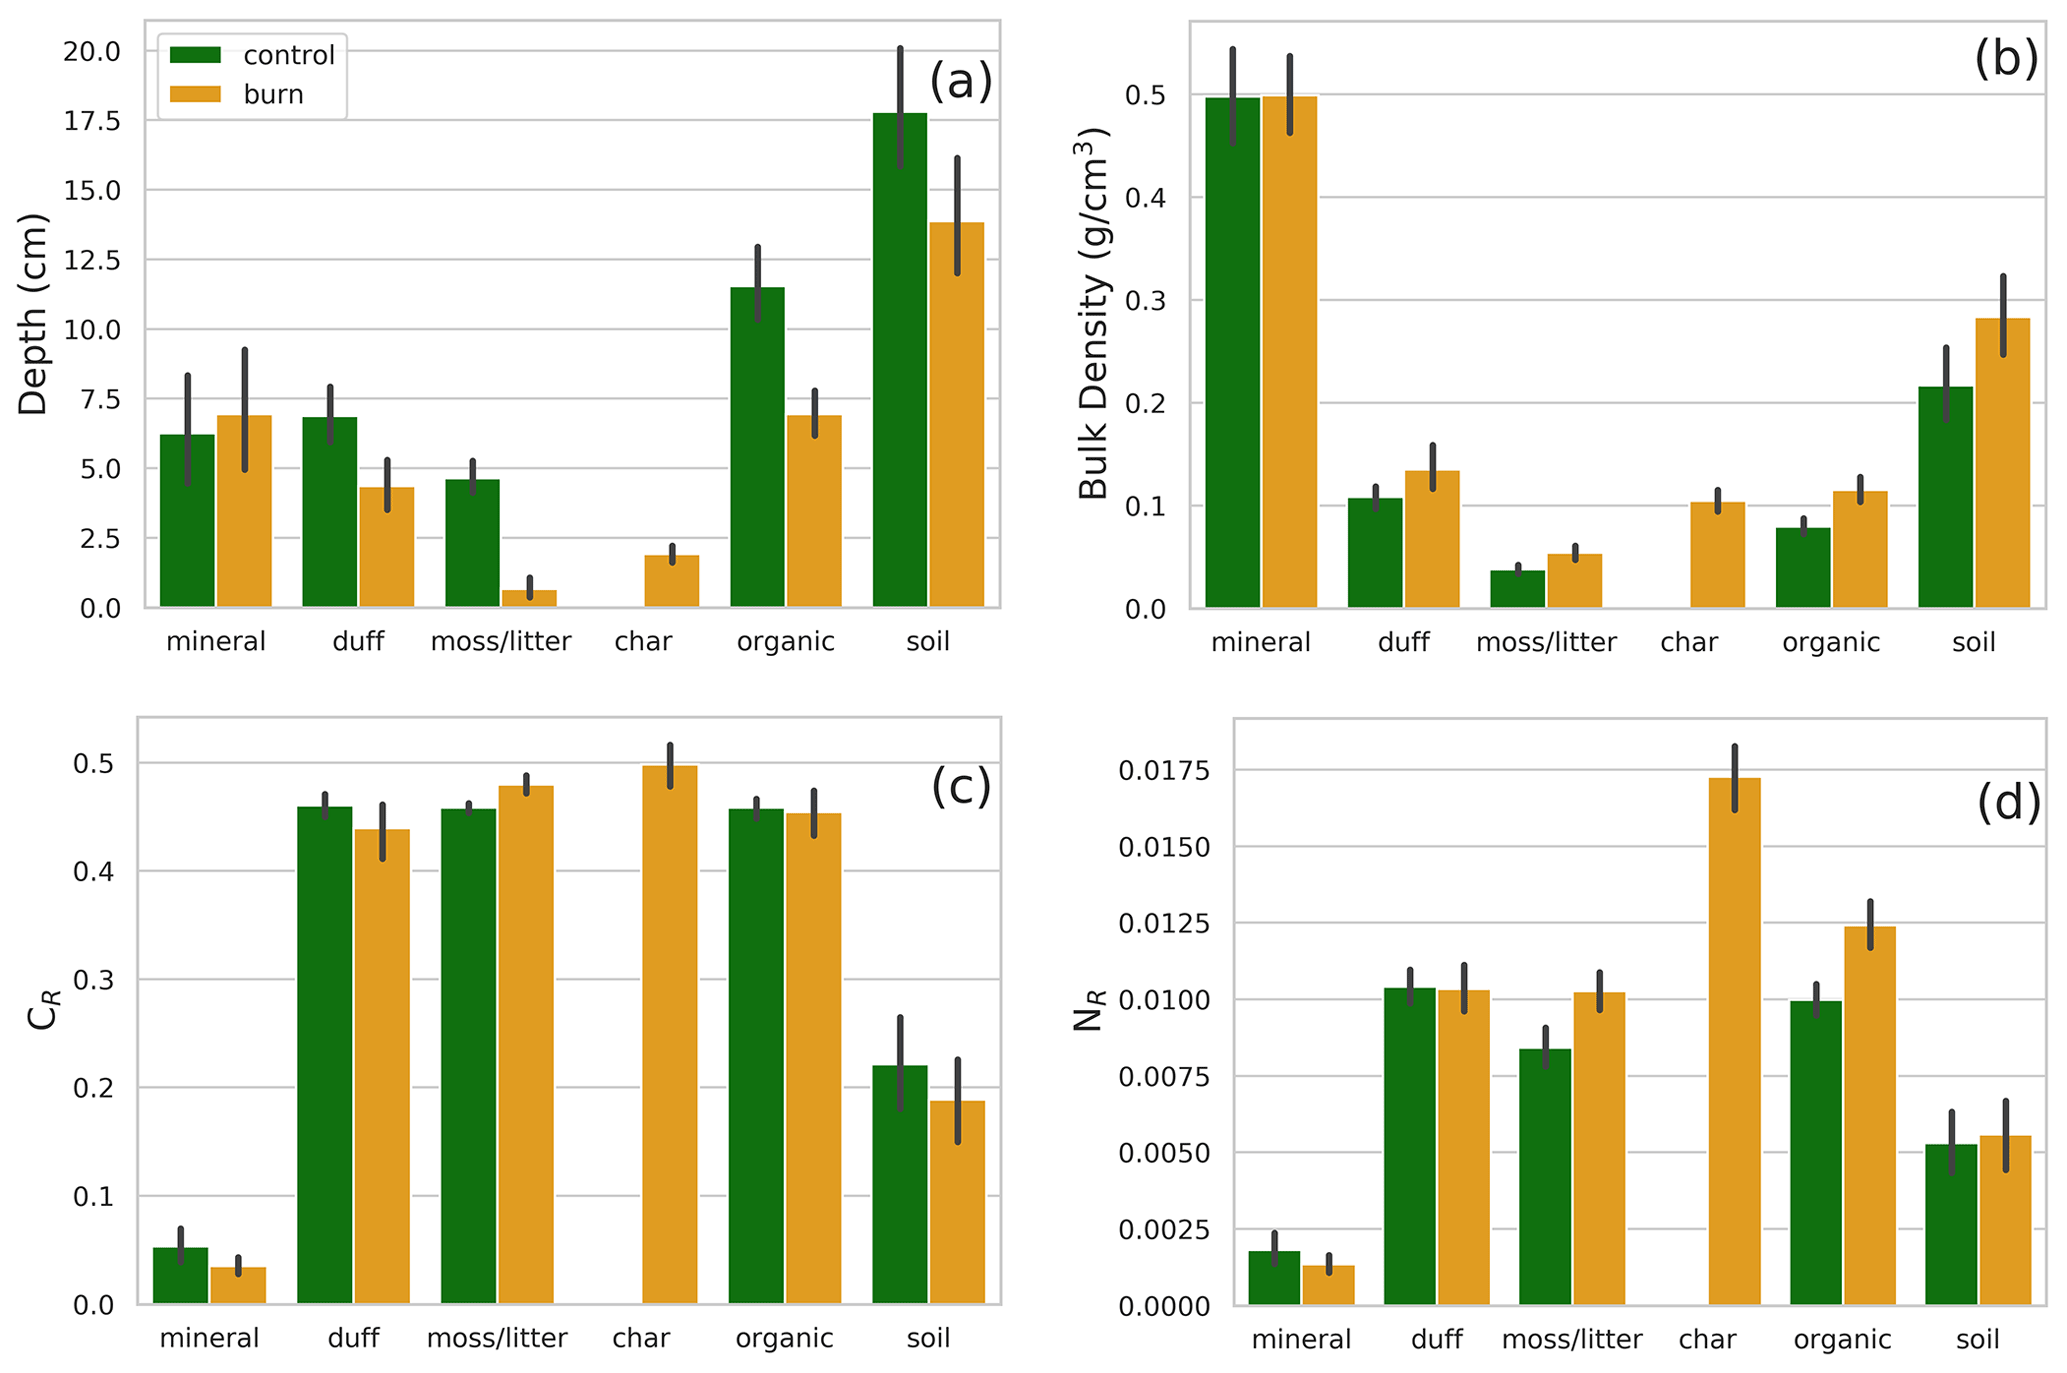
Figure 4Mean soil compartment depths (a), bulk density (b), CR (c), and NR (d) in burnt and control plots. The organic category is considered the grouping of the duff, moss/litter, and char layers while the soil category is the grouping of the organic and mineral soil layers. Error bars are the bootstrapped 95 % confidence interval of the mean.
3.3 Forest level drivers of fire-induced C and N loss
The strongest correlator to total C and N losses among long-term ecosystem properties was total paired control plot C (p<0.001, r=0.703, b=0.744) and N stocks (p<0.001, r=0.585, b=0.574), respectively. An even stronger correlation was found between control plot organic layer C and N stocks (here abbreviated CO and NO) and estimated losses of CO (p<0.001, r=0.736, b=0.762) and NO (p<0.001, r=0.653, b=0.665) (Figs. S3, S4 in the Supplement). Due to this increased explanatory power, and because the majority of fire-affected C and N stocks were located in organic soil layers, the focus of analysis was placed on this C pool. Variables used in regression with percentage changes in C and N stocks tended to have less explanatory power than total C and N stock losses and also were sensitive to outliers having erratic changes in model fit with removal of data points. Therefore only total C and N stock losses were assessed.
The ratio of CO to NO (CO : NO) was added to improve model fit. CO and CO : NO strongly explained CO losses (p<0.001, R2=0.588) while NO and CO : NO explained NO losses with slightly less strength (p<0.001, R2=0.519). Multicollinearity between CO : NO and CO (p=0.003, , kg C m−2) and NO (p<0.001, , kg N m−2) did not produce a high condition number in these models (1.55 for C, 1.93 for N), suggesting they are robust to these covariations (Alin, 2010).
Total char layer C was not significantly related to loss of CO (p=0.137); however a significant correlation using simple regression was found between char layer N and losses of NO (p=0.011, , ).
CCVs and ratios of C and N stocks amongst control plot compartments could not improve these models explaining CO and NO losses in multiple regression with CO and NO, respectively, nor could they significantly explain the buildup of organic layer fuel in control plots or production of char C or N. Relations either did not suitably meet the basic assumptions of regression, were deemed to be confounding, or lacked supporting causal mechanisms and were at a high risk of omitted-variable bias.
3.4 Climatic drivers of fire-induced C and N loss
MAP had a directly proportional relation to both CO (p<0.001, R2=0.465, b=0.0194 kg C m−2 mm−1) and NO (p=0.012, R2=0.352, b=0.000416 kg N m−2 mm−1) losses (Figs. S5, S6). In multiple regression, MAT and MAT2 explained CO (p=0.008, R2=0.186) and NO (p=0.002, R2=0.233) loss. Using these model fits, CO and NO losses were plotted as functions of MAT as negative parabolas both with a peak near 4 ∘C (Figs. S7, S8). In multiple regression of the three variables, the MAT and MAT2 terms lost significance, and MAP was the dominant explaining factor of CO and NO losses. MAT and MAP were not significantly related in simple regression (p=0.829); however MAT and MAT2 in multiple regression explained MAP (p<0.001, R2=0.407). Using these results, plotting MAP as a function of MAT again showed a negative parabola peaking near 4 ∘C (Fig. S9). This suggests that the direct climate dependence of CO and NO losses was driven by MAP, with MAT relating indirectly through its association with MAP.
Control plot CO and NO were broken down into the three measured aspects of depth, bulk density, and elemental weight ratio and entered as a linear combination in multiple regression within path diagrams (Fig. 5a, b). MAT and MAP enhanced fire-induced CO and NO loss by promoting development of a denser, more voluminous fuel load with additional direct effects on losses by MAT. MAT mitigates CO loss by reducing CR; however variation in this value does not affect CO loss as strongly as depth and bulk density. Conversely, MAT promotes NO loss through a higher NR fuel but exerts a stronger direct effect on reduction of NO removal due to fire than in the CO model. Accordingly, a separate multiple regression showed strong negative effects of MAT and MAP on CO : NO (Fig. 6a) along with a direct effect of MAT (p<0.001, , ∘C−1). CCVs could not strongly link MAT or MAP with CR, NR, or CO : NO.
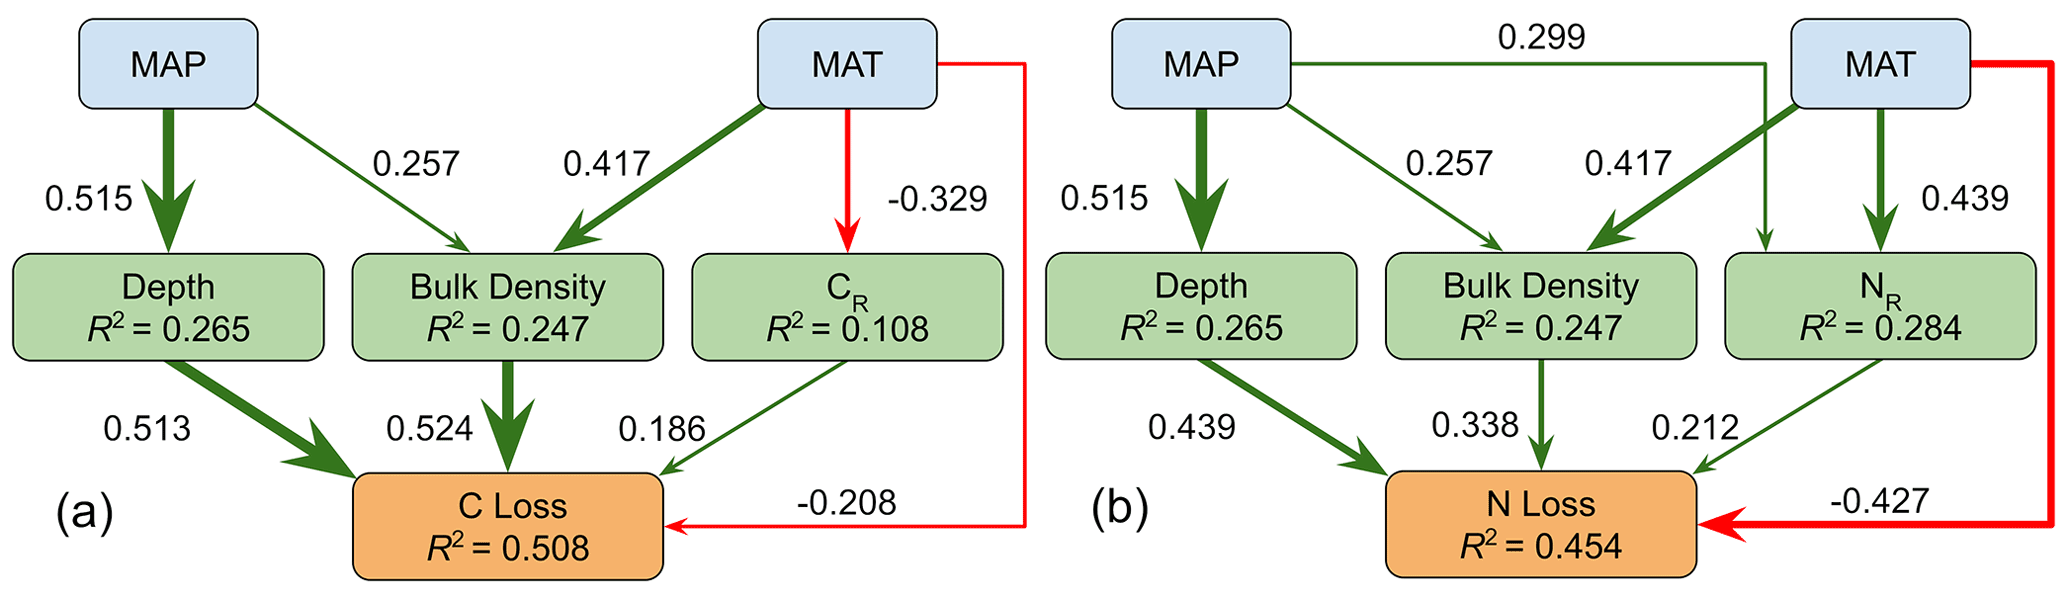
Figure 5Diagram of proposed pathways for the effects of mean annual precipitation and mean annual temperature on C (a) and N (b) loss. Non-climate variables regard the organic layer. Each variable node is labeled with the R2 from simple or multiple regression using explanatory variables represented by all incoming arrows. Arrows are labeled by and sized in proportion to the magnitude of their standardized regression coefficients and are significant. Green arrows represent positive relationships while red represent negative relationships. Omitted for simplicity are direct correlations between bulk density to CR (p=0.010, r=0.356) and depth to NR (p=0.010, ).
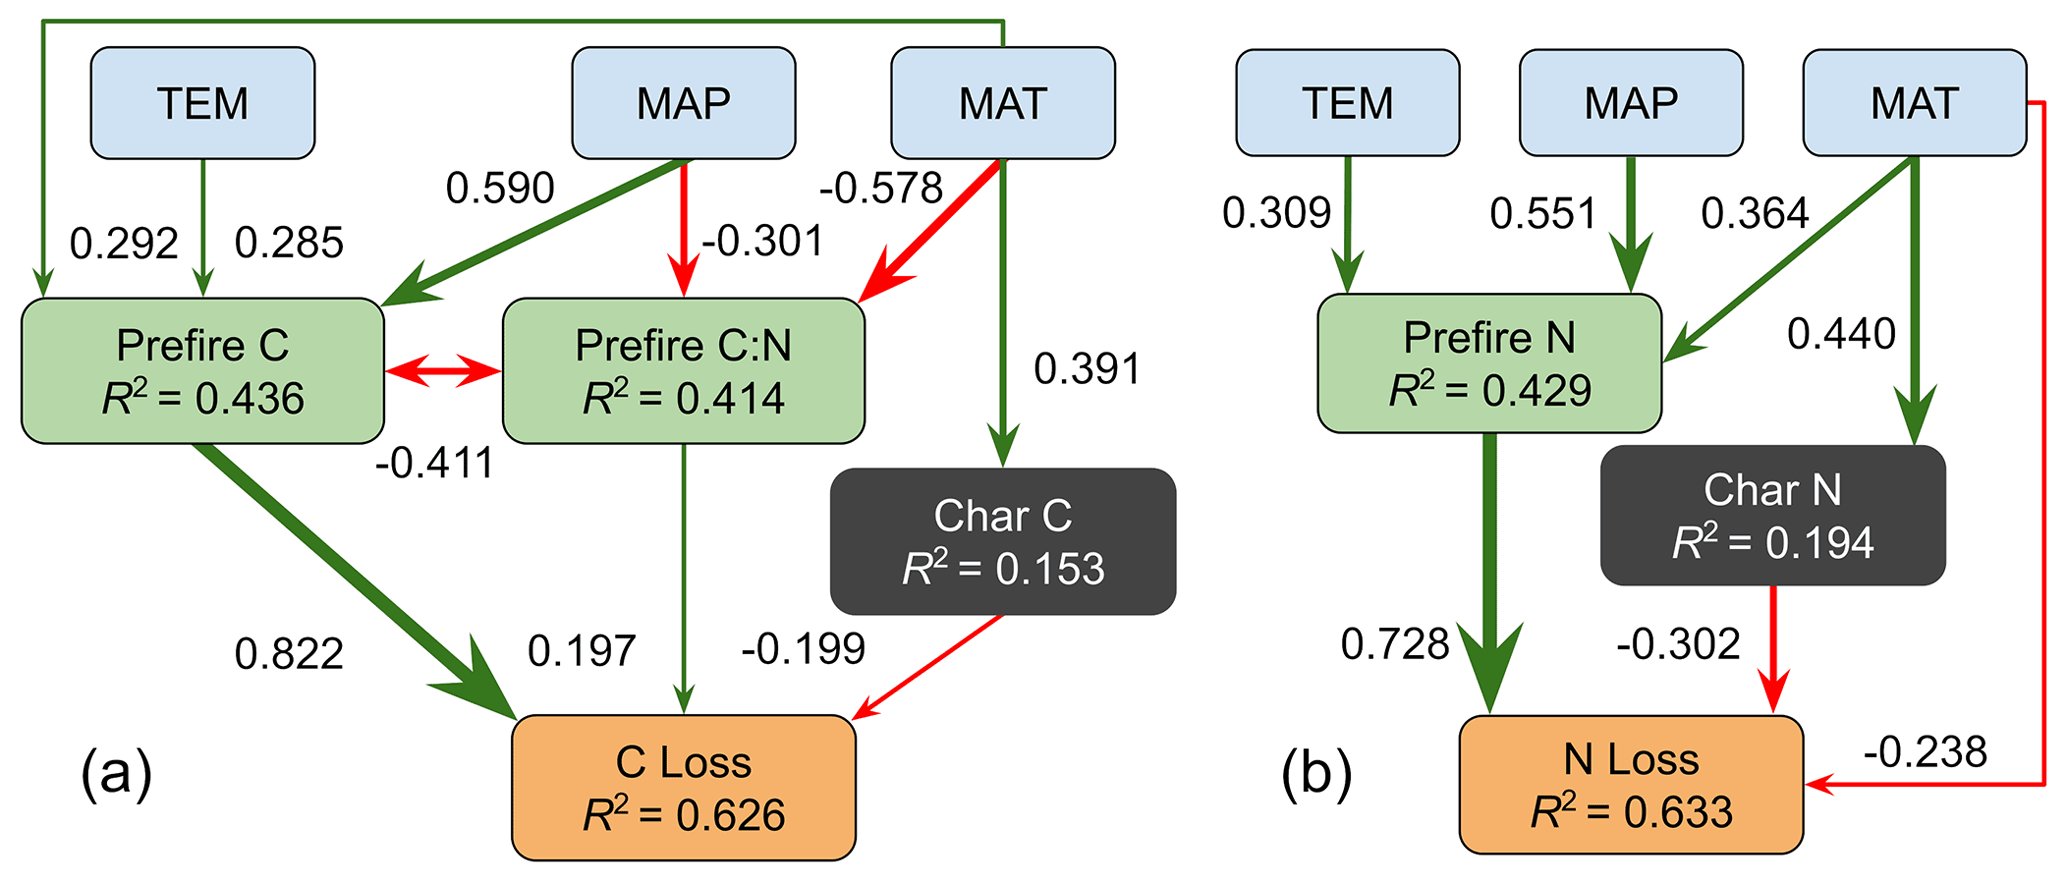
Figure 6Path diagrams for C (a) and N (b) loss including char and C : N variables. Prefire C, N, and C : N as well as losses of C and N are regarding the organic layer. Each variable node is labeled with the R2 from simple or multiple regression using explanatory variables represented by all incoming arrows. Arrows are labeled by and sized in proportion to the magnitude of their standardized regression coefficients and are significant. Green arrows represent positive relationships while red represent negative relationships.
Total char layer mass (p<0.001, r=0.453, b= 0.316 kg m−2 ∘C−1) and char CR (p=0.002, , ∘C−1) were correlated with MAT but not the total mass of prefire fuel. This means that warmer regions produced larger amounts of lower CR material irrespective of total fuel amount. In a multiple regression using CO, CO : NO, MAT, MAP, and total char layer C production to explain CO loss, direct effects of MAT lost significance and overall model fit were improved (Fig. 6a). This suggested that, while controlling for CO and CO : NO, CO loss from this layer was reduced by MAT through the creation of char. Similarly, NO loss is further explained by additions of char layer N to the climate model, but a large direct effect of MAT remains (Fig. 6b). Adding CO : NO to this model increased the AIC and resulted in the individual p values of CO : NO and MAT reaching greater than 0.15, which is suggestive of a confounding influence of CO : NO on MAT and NO loss. Again, CCVs and fuel distribution ratios could not improve either model.
3.5 Moisture and summer 2018 anomalies
TEM was not directly related to CO (p=0.248) or NO (p=0.259) stocks in control plots, though it slightly improved model fit when joined with MAT and MAP in explaining these variables (Fig. 6a, b). TEM differences between paired burnt and control plots were observed to increase both with control and burnt plot TEM levels, however not along gradients of MAT (p=0.198), MAP (p=0.771), CO (p=0.302), or NO (p=0.423). TEM differences between paired burnt and control plots were entered into simple regression with losses in CO (p=0.088, , kg C m−2) and NO (p=0.035, , b=0.00415 kg N m−2). However correction for these slopes by using non-standardized coefficients of regression for TEM, MAT, and MAP against CO and NO produced no significant change in losses of CO or NO.
SPEI was related to MAT (p<0.001, ), ΔMAT (p<0.001, ), and ΔMAP (p=0.002, ) but not to MAP (p=0.725), or losses of CO (p=0.712) and NO (p=0.644) due to fire. When included in multiple regression with MAP, MAT, char C or N, and CO or NO to explain fire-induced CO or NO stock losses, respectively, SPEI either did not improve model fit or promoted high uncertainty of variables (increased p values). SPEI was directly related to char C (p=0.013, ) and N (p=0.012, ) but had increased p values when explaining these variables in multiple regression with MAT, which suggests SPEI is a confounding variable. Additionally, ΔMAT (p<0.001, r=0.956) and ΔMAP (p<0.001, ) were strongly correlated to their respective long-term values, with ΔMAT offering improved explanation of total char production (p<0.001, r=0.477, b=0.179 kg m−2 ∘C−1) over MAT.
4.1 Trends in ecosystem C and N stocks
Significant overall reduction in C stocks was found in burnt plots relative to their paired controls, with the largest removals from the duff layer. Averaged total C loss was relatively low at 0.815 ± 0.652 kg C m−2 (15.6 %) compared to estimates from inland Alaskan black spruce stands (3.3 kg C m−2) (Boby et al., 2010). However, they were comparable to averaged losses from experimental Scots pine stands in Siberia (0.992 kg C m−2) (Ivanova et al., 2011), though half that of surface wildfire in Siberian pine (Pinus sibirica) stands (1.69 kg C m−2) (Kukavskaya et al., 2017). Interestingly, this study found average C stock reduction to be nearly equivalent to that estimated in a Scots pine crown fire, selected for its high severity, within the largest, most extreme wildfire occurring in Sweden during 2018 (0.80 kg C m−2) (Kelly et al., 2021). In contrast, the largest wildfire occurring in Sweden during 2014 released an estimated 4.50 kg C m−2 from Scots-pine-dominated stands, which lies just above the 93rd percentile of C loss estimates within the 50-plot network of the current study (Granath et al., 2021). The extreme value of the 2014 fire was produced from an averaging of regularly spaced ground samples across large portions of the burn scar and found no relationship between extent of crown fire and C emission levels (Granath et al., 2021; Gustafsson et al., 2019). These combined observations from Sweden exhibit an emission heterogeneity encompassing the entirety of typical pan-boreal variation that cannot be explained by presence of crown fire, overstory species, fire size, or perhaps their combined effect on observable fire intensity. This emphasizes the need to increase the context of studies of individual fire events by further sampling over broader environmental gradients, which may thereby give greater predictive power to known, and yet to be observed, sets of drivers of boreal wildfire C emissions (Veraverbeke et al., 2021).
Unlike C, however, N stocks were not significantly different overall in burnt plots compared to controls. This contrasts with the abovementioned Alaskan study which estimated percentage removal from soils of N (49.8 %) to be similar to C (52.9 %) at an average loss of 0.09 kg N m−2 (Boby et al., 2010). Averaging over the 50 burnt plots, fire clearly reduced N in large amounts within the residual duff and moss/litter layers but captured it within the high-NR char layer, preventing differences when considering the overall soil profile. Proximity to the soil surface suggests a portion of the char layer was likely always derived from fire interacting with the understory and moss/litter layer; however averaged char layer C and N stocks were greater than losses from the two layers combined, suggesting there were large contributions also from the duff. In burnt plots with residual moss/litter, an upwards mixing of mobilized duff C and N (e.g. in the form of vapor or soot) may have occurred due to heating of lower portions of the fuel bed. Because the char layer was conglomerated and completely blackened, it is unlikely that material was incorporated postfire. However, material may have been added from downward movement of overstory components during the time of fire or deposition of aerosols coming from outside the plot. By selecting plots well within the final fire perimeter, it was assumed that incoming and outgoing aerosols during the fire would be approximately equal and that extended aerosol deposition from more remote sources would accumulate equally on control and burnt plots. The abovementioned study in Alaskan black spruce forests, which are known for their great extent of canopy damage (Walker et al., 2020a; Boby et al., 2010), showed C and N loss from the canopy to be about an order of magnitude lower than losses from soil while also assuming that losses from the tree bole are negligible and that a large fraction of these overstory losses were released to the atmosphere (Boby et al., 2010). An experimental high-intensity crown fire in a Canadian jack pine (Pinus banksiana) forest with relatively low soil C stores (1.97 kg C m−2) had minimal C losses from tree boles at 0.08 kg C m−2, though needle C losses were substantial at 0.51 kg C m−2 (94.4 % needle C) (Santín et al., 2015). In the current study, despite a substantial portion of C and N stored in needles, low levels of overstory blackening and its lack of correlation with char layer mass suggest that the large majority of C and N stock changes between control and burnt plots were captured within the sampled soil and understory compartments.
The lack of change in total N stock due to fire is consistent with available evidence from an existing study in Fennoscandian forests where fire had only slight effects on total N over extended periods (Palviainen et al., 2017). N losses in non-boreal forests have been related to fire temperature during time of fire, with lower-intensity fires transferring a greater proportion of pools of organic N into soil ammonium and nitrate rather than removing N in gaseous forms (Neary et al., 1999). Laboratory studies have linked the amount of N transferred from organic to inorganic forms during heat exposure to both applied temperature and fuel type (Gundale and DeLuca, 2006; Makoto et al., 2011). Therefore, the N cycle in boreal systems may be highly dependent on active fire properties, fuel type, and resulting fuel transformation. The greater N losses in Alaska compared to Eurasia could be explained by its dissimilar fuel and the characteristically more intense crown fires across the North American boreal zone (de Groot et al., 2013a; Wooster and Zhang, 2004). Fire intensity and temperature have also been linked to both C and overall fuel transformation in experimental forest fire (Santín et al., 2016), so it is of interest to compare remote measurements (i.e., satellite data) of these time-of-fire properties to on-site-measured ecosystem changes. This can lead to a more complete predictive understanding of wildfire in the entire Fennoscandian region and beyond.
4.2 Soil restructuring
In addition to removals, C and N were densified by fire in the organic layers due to their significant drops in depth and increased bulk density in burnt plots. The lower mean CR in burnt plot organic layers relative to control plots is assumed to be due to the increased ratio of remaining incombustible material to remaining organic material. However, large variability of duff CR in burnt plots contributed to the statistical insignificance of this change and appeared to be related to extreme volume reductions which reduced the duff layer to exceptionally ashy, rocky material in some plots. The large, significant increase in NR in the organic layer can be attributed to the formation of the high-NR char layer. The strong alteration of char layer C : N relative to prefire fuel is comparable to results from studies that have incorporated similar pyrogenic layers that are observed to be a mixture of organic or inorganic material types across broad ranges of combustion completeness (Bodí et al., 2014). For example, the C : N ratio in a pyrogenic layer 1 year after a low-intensity Siberian larch (Larix sibirica) forest surface fire in Russia was 31.4 (prefire 49.1), which is much lower than the 43.8 C : N ratio (prefire 39.4) observed the day after an experimental high-intensity jack pine crown fire in Canada (Dymov et al., 2021; Santín et al., 2016), further suggesting general differences in thermolability of soil C and N under regionally varied characteristic heating regimes.
Fire-induced morphological change of fuel has been shown to play a strong role in N retention where highly porous char material adsorbs inorganic N, preventing its leaching loss from the system until its reuptake into organic forms by plants or microbes (Makoto et al., 2012). This sorptive power has been observed to fade over the interval between fire events, suggesting newly produced char is required for this retention effect (Zackrisson et al., 1996). The high NR of the char layer may therefore be due in part to adsorption of fire-mineralized N or preserved, prefire mineral N and act as a steady source of bioavailable nutrients to plant and microbial communities during succession. In addition to these inorganic forms, N may be stored in this layer in partially combusted or depolymerized organic forms (Certini, 2005). This study employed coarse-scale sampling of char based on soil horizon identification with separation in the field, and a more rigorously defined assessment of char production in all layers may provide further detail, relating it to climate and soil processes.
4.3 Climate-linked effects of fire
Both MAP and MAT had significant direct relations to total C and N removals from plots, with the strongest mediator being estimated prefire C and N stocks in the organic layer. MAP had a stronger effect on the buildup of control plot fuel, namely through a positive correlation with total organic layer depth. MAT affected C and N losses through increasing bulk density, reducing CR, and increasing NR, thus reducing the C : N ratio in the organic layer in control plots, suggesting warmer conditions had a fuel conditioning effect through greater decomposition of organic soils (Callesen et al., 2007). When controlling for control plot organic layer C and N stocks and their ratios using multiple regression, MAT had a direct negative effect on C and N losses from this layer. This direct effect was largely mediated by the incorporation of measures of fire-induced fuel transformation into the models, i.e., production of char layer C or N. These models suggest that warmer regions tended to conserve larger pools of fire-affected fuel as charred material rather than release it from the ecosystem either in gaseous, particulate, or dissolved forms over the 1-year postfire period. This fuel restructuring in turn may have extended effects on C and N turnover through links to nutrient availability and the biotic community, which in turn affect process rates such as primary production and soil decomposition (Makoto and Koike, 2021; Schmidt and Noack, 2000).
4.4 Considering representativeness and prediction of future wildfire impacts
A caveat of the pair plot matching methodology is that burnt plots may have had a greater tendency to ignite due to specific properties that heighten their fire susceptibility relative to control plots. As a result, underestimation of C and N losses may have occurred via burnt plots being biased to a greater prefire fuel load than their paired control plots (systematic error) rather than these differences being approximately random (random error). This was evident in the fact that N losses were centered near 0 by their mean yet had a strong correlation with control plot total N despite the improbability that fire actually increased total N within nearly half of the burnt plot sample pool. Contrarily, control plots were biased towards higher TEM, which was observed to be related to greater fuel loading in measured control plots, though the magnitude of this bias did not increase along gradients of climate or fuel loading, nor did attempts to correct for it significantly affect C and N loss estimates. Therefore, control plot matching appears to have been performed adequately within the scope of data collected, with any potential bias coming from unknown parameters. Further investigation of these unknowns is merited in order to improve control plot matching methodology and better constrain emission estimates in this region.
Further support of trends identified within the pair plot methodology was provided by separating analysis of the pyrogenic char layer, which was unique to burnt plots, from the soil profile as a whole. Counter to expectation, the large shifts in NR and the C : N ratio in the char layer relative to lower layers in burnt plots show a clear preferential removal of C relative to N due to fire. This C : N ratio reduction was opposite to the C : N increases observed in a pyrogenic layer in a more intense North American crown fire, which may be due to differences in fire temperature and heating duration (Santín et al., 2016). Therefore, until more predictive knowledge is gained over the proportional losses of C and N, accurate estimates of their stock changes due to fire may require measurements of densities of these individual elements throughout the residual soil profile in burnt plots.
Variation in many ecosystem properties could not be statistically linked to C and N losses, though that does not mean they are without role in determining extent of emissions and ecosystem change. A cross-regional boreal wildfire study has shown variables such as the abundance of spruce to strongly affect C emissions across regions, but within a single region the abundance may be too homogeneous to show an effect (Walker et al., 2020a). Furthermore, ratios of fine to heavy fuel loads have been manipulated in experimental burns to produce varying fire severity (Alexander et al., 2018; Ludwig et al., 2018). Accordingly, CCVs and fuel distribution amongst compartments in this study may have been simply too homogeneous to produce significant results but may nevertheless still provide valuable statistical signals for understanding drivers of fire processes across regions and fire severities. Of particular interest would be further investigation of the potential effect of dead wood structure on C and N stocks and fire severity, which remains understudied in boreal wildfire research.
Previous studies have demonstrated strong effects of moisture on boreal wildfire C emissions. For example, a study including several large North American fire complexes found C emissions to increase along gradients of topo-edaphic derived soil moisture (due to its positive relation to total fuel) until reaching high-moisture sites where the trend inverted and began to decrease due to the inhibiting effects of this increased moisture on fuel availability (Walker et al., 2018). The position of this point of inflection along the long-term moisture curve is likely dictated by short-term moisture levels, which are in turn controlled by the extremity of drying during a fire season. Accordingly, fuel availability, and therefore C emissions, is strongly dependent on drying processes specific to individual stand composition and structure and its local fire weather. By incorporating measures of long-term (TEM, MAT, MAP) and short-term moisture balance (SPEI), climate-based path models gained only slight improvements in explaining fuel buildup and no increased explanatory power regarding C and N losses. Therefore, the study design distinguished climate-driven effects on fire severity with only minimal restrictions on site selection (non-sloping, non-wetland), thereby providing results that are generally representative for Fennoscandian, non-wetland forests under similar drought conditions of summer 2018. However, with its strong correlations to drought indices, anomalies of temperature and precipitation, and fuel charring and remaining direct effects on emissions, more remains to be understood about how MAT (and in addition intra-annual distribution of MAP) relates to the fire regime across the conditions of fire seasons of differing extremity.
Fuel loading has been found to have a varied strength of control on boreal wildfire C loss globally. This study found total C loss to relate to belowground C in simple regression with an R2 of 0.494 and to aboveground C insignificantly. These results are within the broad range found in Walker et al. (2020a) where total C losses across four North American boreal ecoregions were directly related to prefire belowground C with R2 values of 0.024 (insignificant), 0.07, 0.051, and 0.579 and to respective prefire aboveground C with R2 values of 0.229, 0.005 (insignificant), 0.101, and 0.336. Little is known about which factors dictate the strength of these controls and what portions of unexplained variation can be attributed to either additional measurable factors, methodological error, or stochastic fire processes for a particular wildfire event. This study attempted to address these issues by testing many measurable ecosystem properties across several ecosystem C storage compartments, finding the organic layer C stock along with its climate-related prefire fuel conditioning and combustion susceptibility to be most predictive of C loss (Fig. 5a). These trends were demonstrated using a consistent methodology that incorporates high replication and broad spatial coverage, thereby offering better constraints on remaining unexplained variation across the region than might be provided by sampling a single burn scar or comparing results from different study designs.
Boreal wildfire literature has tended to focus on highly flammable forest ecosystems with intense burning of several hundred hectares or more despite the vast majority of fires in the boreal region being less than 200 ha (Stocks et al., 2002; Valendik, 1996). This research bias may limit knowledge to a particular population by studying fire events only at their utmost extremes and effectively masking important signals of ecosystem heterogeneity on fire severity at differing intensities. The only restriction this study placed on wildfire intensity and size was that the fire activity could be remotely confirmed using Sentinel-2 infrared data. This has the potential to affect comparability of results to separate studies in terms of both total C and N losses and their drivers, which may exhibit differing patterns and strengths over ranges of fire intensity. It may therefore be beneficial for wildfire studies to be examined and compared within categories of absolute severity and intensity. This methodology might be particularly useful in gaining understanding of the drivers of fire severity as it increases in traditionally fire-protected ecosystems such as wetlands (Zoltai et al., 1998), which tend to store vastly larger amounts of C per area than their dryer forested counterparts in the boreal region (Deluca and Boisvenue, 2012).
This study measured wildfire impacts across current climatic gradients of precipitation and temperature to show that climate controls total releases of C and N during fire events mainly due to its effect on increasing organic layer fuel load. The role of MAP is focused on the total quantity of this fuel load, whereas MAT has a more qualitative effect by influencing bulk density, CR, and NR in the organic layer. When controlling for total organic layer fuel, increasing MAT, and to a lesser extent MAP, reduces C loss due to fire through preconditioning of the organic layer as measured by a lowered C : N ratio. Additionally, both C and N losses are mitigated by increased MAT through the sequestering of fire-affected fuel into a surface layer of charred material. This conservation effect is stronger for N, which had no overall significant loss in stocks due to fire, and which also had stronger unexplained direct mitigating effects of MAT on its loss that were hypothesized to be related to time-of-fire properties such as fire intensity and temperature. While remaining ecosystem variables regarding fuel composition and distribution could not be strongly linked to total C and N losses, it is of interest to analyze their role in cross-regional comparisons and to investigate whether they influence other fire-related properties such as ignition likelihood, fire propagability, and fire intensity. Advancing knowledge of the intricate ties between instantaneous processes of fire events and their long-term effects on C and N cycling demands comprehensive research approaches that pay particular attention to climate sensitivity. This knowledge is imperative for producing accurate predictions of boreal forest functioning under future climate scenarios.
All data used to produce the results in this document are original unless otherwise stated in the text. They are found freely available through https://doi.org/10.5281/zenodo.5078669 (Eckdahl et al., 2021).
The supplement related to this article is available online at: https://doi.org/10.5194/bg-19-2487-2022-supplement.
Author contributions using the CRediT contributor roles taxonomy are as follows: conceptualization (JAE, JAK, DBM), data curation (JAE), formal analysis (JAE), funding acquisition (JAK, DBM), investigation (JAE, JAK, DBM), methodology (JAE, JAK, DBM), project administration (JAE, JAK, DBM), resources (JAE, DBM), software (JAE), supervision (JAE, JAK, DBM), validation (JAE, JAK, DBM), visualization (JAE), writing – original draft preparation (JAE), and writing – review and editing (JAE, JAK, DBM).
The contact author has declared that neither they nor their co-authors have any competing interests.
Publisher’s note: Copernicus Publications remains neutral with regard to jurisdictional claims in published maps and institutional affiliations.
This article is part of the special issue “The role of fire in the Earth system: understanding interactions with the land, atmosphere, and society (ESD/ACP/BG/GMD/NHESS inter-journal SI)”. It is a result of the EGU General Assembly 2020, 3–8 May 2020.
C and N analyses were performed in the Department of Geology, Lund University under supervision of Karl Ljung. Valuable information was provided by representatives from the Swedish Forest Agency and Swedish Civil Contingencies Agency. Thank you to Geerte Fälthammar-de Jong for dedicated assistance in fieldwork planning and execution. Crucial field and lab assistance was provided by Rieke Madsen, Femke Pijcke, Lotte Wendt, Julia Iwan, and Henni Ylänne. Guidance from Karl Ljung, Åsa Wallin, Patrik Vestin, and Michael Gundale in sample collection and processing was critical and highly appreciated. Thanks are given to the three anonymous reviewers, who provided helpful suggestions for improvement during manuscript development. Friends, family, and colleagues were vital sources of support and inspiration throughout this work.
Johan A. Eckdahl was supported by the strategic research area Biodiversity and Ecosystems in a Changing Climate, BECC, at Lund University. Jeppe A. Kristensen was supported by the Carlsberg Foundation (grant CF20-0238). Daniel B. Metcalfe was supported by funding from the European Research Council under the European Union's Horizon 2020 research and innovation programme (ECOHERB; grant no. 682707).
This paper was edited by Sander Veraverbeke and reviewed by three anonymous referees.
Akagi, S. K., Yokelson, R. J., Wiedinmyer, C., Alvarado, M. J., Reid, J. S., Karl, T., Crounse, J. D., and Wennberg, P. O.: Emission factors for open and domestic biomass burning for use in atmospheric models, Atmos. Chem. Phys., 11, 4039–4072, https://doi.org/10.5194/acp-11-4039-2011, 2011. a
Akaike, H.: A new look at the statistical model identification, IEEE T. Automat. Contr., 19, 716–723, https://doi.org/10.1109/TAC.1974.1100705, 1974. a
Alexander, H. D., Natali, S. M., Loranty, M. M., Ludwig, S. M., Spektor, V. V., Davydov, S., Zimov, N., Trujillo, I., and Mack, M. C.: Impacts of increased soil burn severity on larch forest regeneration on permafrost soils of far northeastern Siberia, Forest Ecol. Manage., 417, 144–153, https://doi.org/10.1016/j.foreco.2018.03.008, 2018. a
Alin, A.: Multicollinearity, WIREs Computational Statistics, 2, 370–374, https://doi.org/10.1002/wics.84, 2010. a, b
Bataineh, A. L., Oswald, B. P., Bataineh, M., Unger, D., Hung, I.-K., and Scognamillo, D.: Spatial autocorrelation and pseudoreplication in fire ecology, Fire Ecol., 2, 107–118, https://doi.org/10.4996/fireecology.0202107, 2006. a
Beguería, S., Latorre, B., Reig, F., and Vicente-Serrarno, S. M.: Global SPEI database, https://spei.csic.es/database.html, last access: 15 July 2019. a
Beven, K. J. and Kirkby, M. J.: A physically based, variable contributing area model of basin hydrology, Hydrol. Sci. B., 24, 43–69, https://doi.org/10.1080/02626667909491834, 1979. a
Boby, L. A., Schuur, E. A. G., Mack, M. C., Verbyla, D., and Johnstone, J. F.: Quantifying fire severity, carbon, and nitrogen emissions in Alaska's boreal forest, Ecol. Appl., 20, 1633–1647, https://doi.org/10.1890/08-2295.1, 2010. a, b, c, d, e, f, g, h
Bodí, M. B., Martin, D. A., Balfour, V. N., Santín, C., Doerr, S. H., Pereira, P., Cerdà, A., and Mataix-Solera, J.: Wildland fire ash: Production, composition and eco-hydro-geomorphic effects, Earth-Sci. Rev., 130, 103–127, https://doi.org/10.1016/j.earscirev.2013.12.007, 2014. a, b
Bond-Lamberty, B., Peckham, S. D., Ahl, D. E., and Gower, S. T.: Fire as the dominant driver of central Canadian boreal forest carbon balance, Nature, 450, 89–92, https://doi.org/10.1038/nature06272, 2007. a
Buchanan, B. P., Fleming, M., Schneider, R. L., Richards, B. K., Archibald, J., Qiu, Z., and Walter, M. T.: Evaluating topographic wetness indices across central New York agricultural landscapes, Hydrol. Earth Syst. Sci., 18, 3279–3299, https://doi.org/10.5194/hess-18-3279-2014, 2014. a
Callesen, I., Raulund-Rasmussen, K., Westman, C., and Tau-Strand, L.: Nitrogen pools and C : N ratios in well-drained Nordic forest soils related to climate and soil texture, Boreal Environ. Res., 12, 681–692, 2007. a
Canada Soil Survey Committee: The Canadian system of soil classification, Research Branch, Canada Department of Agriculture, ISBN-13 978-0-66001-620-7, 1978. a
Certini, G.: Effects of fire on properties of forest soils: a review, Oecologia, 143, 1–10, https://doi.org/10.1007/s00442-004-1788-8, 2005. a, b, c
Chen, D., Zhang, P., Seftigen, K., Ou, T., Giese, M., and Barthel, R.: Hydroclimate changes over Sweden in the twentieth and twenty-first centuries: a millennium perspective, Geogr. Ann. A, 103, 103–131, https://doi.org/10.1080/04353676.2020.1841410, 2021. a
De Frenne, P., Graae, B. J., Rodríguez-Sánchez, F., Kolb, A., Chabrerie, O., Decocq, G., De Kort, H., De Schrijver, A., Diekmann, M., Eriksson, O., Gruwez, R., Hermy, M., Lenoir, J., Plue, J., Coomes, D. A., and Verheyen, K.: Latitudinal gradients as natural laboratories to infer species' responses to temperature, J. Ecol., 101, 784–795, https://doi.org/10.1111/1365-2745.12074, 2013. a
de Groot, W., Bothwell, P., Carlsson, D., and Logan, K.: Simulating the effects of future fire regimes on western Canadian boreal forests, J. Veg. Sci., 14, 355–364, https://doi.org/10.1111/j.1654-1103.2003.tb02161.x, 2003. a, b
de Groot, W. J., Cantin, A. S., Flannigan, M. D., Soja, A. J., Gowman, L. M., and Newbery, A.: A comparison of Canadian and Russian boreal forest fire regimes, Forest Ecol. Manage., 294, 23–34, https://doi.org/10.1016/j.foreco.2012.07.033, 2013a. a, b, c
de Groot, W. J., Flannigan, M. D., and Cantin, A. S.: Climate change impacts on future boreal fire regimes, Forest Ecol. Manage., 294, 35–44, https://doi.org/10.1016/j.foreco.2012.09.027, 2013b. a
Deluca, T. H. and Boisvenue, C.: Boreal forest soil carbon: distribution, function and modelling, Forestry, 85, 161–184, https://doi.org/10.1093/forestry/cps003, 2012. a, b
Dept. of Forest Resource Management, Swedish University of Agricultural Sciences: SLU Forest Map, https://www.slu.se/centrumbildningar-och-projekt/riksskogstaxeringen/statistik-om-skog/slu-skogskarta/om-slu-skogskarta/ (last access: 15 July 2019), 2015. a
Dieleman, C. M., Rogers, B. M., Potter, S., Veraverbeke, S., Johnstone, J. F., Laflamme, J., Solvik, K., Walker, X. J., Mack, M. C., and Turetsky, M. R.: Wildfire combustion and carbon stocks in the southern Canadian boreal forest: Implications for a warming world, Glob. Change Biol., 26, 6062–6079, https://doi.org/10.1111/gcb.15158, 2020. a
Dymov, A., Startsev, V., Milanovsky, E., Valdes-Korovkin, I., Farkhodov, Y., Yudina, A., Donnerhack, O., and Guggenberger, G.: Soils and soil organic matter transformations during the two years after a low-intensity surface fire (Subpolar Ural, Russia), Geoderma, 404, 115278, https://doi.org/10.1016/j.geoderma.2021.115278, 2021. a, b, c
Eckdahl, J., Kristensen, J., and Metcalfe, D.: Dataset for “Climatic Variation Drives Loss and Restructuring of Carbon and Nitrogen in Boreal Forest Wildfire”, Zenodo [data set], https://doi.org/10.5281/zenodo.5078669, 2021. a
Esri Inc.: ArcGIS Pro, Esri Inc., https://www.esri.com/en-us/arcgis/products/arcgis-pro/, last access: 15 July 2019. a
French, N. H., Goovaerts, P., and Kasischke, E. S.: Uncertainty in estimating carbon emissions from boreal forest fires, J. Geophys. Res.-Atmos., 109, D14S08, https://doi.org/10.1029/2003JD003635, 2004. a, b
Gaboriau, D. M., Remy, C. C., Girardin, M. P., Asselin, H., Hély, C., Bergeron, Y., and Ali, A. A.: Temperature and fuel availability control fire size/severity in the boreal forest of central Northwest Territories, Canada, Quaternary Sci. Rev., 250, 106697, https://doi.org/10.1016/j.quascirev.2020.106697, 2020. a
Giglio, L., Boschetti, L., Roy, D. P., Humber, M. L., and Justice, C. O.: The Collection 6 MODIS burned area mapping algorithm and product, Remote Sens. Environ., 217, 72–85, https://doi.org/10.1016/j.rse.2018.08.005, 2018. a
Gillett, N., Weaver, A., Zwiers, F., and Flannigan, M.: Detecting the effect of climate change on Canadian forest fires, Geophys. Res. Lett., 31, L18211, https://doi.org/10.1029/2004GL020876, 2004. a
Granath, G., Evans, C. D., Strengbom, J., Fölster, J., Grelle, A., Strömqvist, J., and Köhler, S. J.: The impact of wildfire on biogeochemical fluxes and water quality in boreal catchments, Biogeosciences, 18, 3243–3261, https://doi.org/10.5194/bg-18-3243-2021, 2021. a, b, c, d
Gundale, M. J. and DeLuca, T. H.: Temperature and source material influence ecological attributes of ponderosa pine and Douglas-fir charcoal, Forest Ecol. Manage., 231, 86–93, https://doi.org/10.1016/j.foreco.2006.05.004, 2006. a
Gustafsson, L., Berglind, M., Granström, A., Grelle, A., Isacsson, G., Kjellander, P., Larsson, S., Lindh, M., Pettersson, L. B., Strengbom, J., Stridh, B., Sävström, T., Thor, G., Wikars, L.-O., and Mikusiński, G.: Rapid ecological response and intensified knowledge accumulation following a north European mega-fire, Scand. J. Forest Res., 34, 234–253, https://doi.org/10.1080/02827581.2019.1603323, 2019. a
Ivanova, G., Conard, S., Kukavskaya, E., and McRae, D.: Fire impact on carbon storage in light conifer forests of the Lower Angara region, Siberia, Environ. Res. Lett., 6, 045203, https://doi.org/10.1088/1748-9326/6/4/045203, 2011. a, b
Johnstone, J., Celis, G., Chapin III, F., Hollingsworth, T., Jean, M., and Mack, M.: Factors shaping alternate successional trajectories in burned black spruce forests of Alaska, Ecosphere, 11, e03129, https://doi.org/10.1002/ecs2.3129, 2020. a
Jonsson, B. G., Ekström, M., Esseen, P.-A., Grafström, A., Ståhl, G., and Westerlund, B.: Dead wood availability in managed Swedish forests – Policy outcomes and implications for biodiversity, Forest Ecol. Manage., 376, 174–182, https://doi.org/10.1016/j.foreco.2016.06.017, 2016. a
Kaiser, J. W., Heil, A., Andreae, M. O., Benedetti, A., Chubarova, N., Jones, L., Morcrette, J.-J., Razinger, M., Schultz, M. G., Suttie, M., and van der Werf, G. R.: Biomass burning emissions estimated with a global fire assimilation system based on observed fire radiative power, Biogeosciences, 9, 527–554, https://doi.org/10.5194/bg-9-527-2012, 2012. a, b
Kasischke, E. S., Hyer, E. J., Novelli, P. C., Bruhwiler, L. P., French, N. H., Sukhinin, A. I., Hewson, J. H., and Stocks, B. J.: Influences of boreal fire emissions on Northern Hemisphere atmospheric carbon and carbon monoxide, Global Biogeochem. Cy., 19, GB1012, https://doi.org/10.1029/2004GB002300, 2005. a
Keenan, R. J., Reams, G. A., Achard, F., de Freitas, J. V., Grainger, A., and Lindquist, E.: Dynamics of global forest area: Results from the FAO Global Forest Resources Assessment 2015, Forest Ecol. Manage., 352, 9–20, https://doi.org/10.1016/j.foreco.2015.06.014, 2015. a
Kelly, J., Ibáñez, T. S., Santín, C., Doerr, S. H., Nilsson, M.-C., Holst, T., Lindroth, A., and Kljun, N.: Boreal forest soil carbon fluxes one year after a wildfire: Effects of burn severity and management, Glob. Change Biol., 27, 4181–4195, https://doi.org/10.1111/gcb.15721, 2021. a
Kelly, R., Chipman, M. L., Higuera, P. E., Stefanova, I., Brubaker, L. B., and Hu, F. S.: Recent burning of boreal forests exceeds fire regime limits of the past 10,000 years, P. Natl. Acad. Sci. USA, 110, 13055–13060, https://doi.org/10.1073/pnas.1305069110, 2013. a
Kohl, L., Philben, M., Edwards, K. A., Podrebarac, F. A., Warren, J., and Ziegler, S. E.: The origin of soil organic matter controls its composition and bioreactivity across a mesic boreal forest latitudinal gradient, Glob. Change Biol., 24, e458–e473, https://doi.org/10.1111/gcb.13887, 2018. a
Kristensen, T., Ohlson, M., Bolstad, P., and Nagy, Z.: Spatial variability of organic layer thickness and carbon stocks in mature boreal forest stands—implications and suggestions for sampling designs, Environ. Monit. Assess., 187, 1–19, https://doi.org/10.1007/s10661-015-4741-x, 2015. a
Kukavskaya, E., Buryak, L., Kalenskaya, O., and Zarubin, D.: Transformation of the ground cover after surface fires and estimation of pyrogenic carbon emissions in the dark-coniferous forests of Central Siberia, Contemp. Probl. Ecol., 10, 62–70, https://doi.org/10.1134/S1995425517010073, 2017. a, b
Lantmäteriet: Markhöjdmodell Nedladdning, grid 50+, https://www.lantmateriet.se/sv/Kartor-och-geografisk-information/geodataprodukter/produktlista/markhojdmodell-nedladdning-grid-50/#steg=1 (last access: 10 May 2022), 2021. a
Lemprière, T., Kurz, W., Hogg, E., Schmoll, C., Rampley, G., Yemshanov, D., McKenney, D., Gilsenan, R., Beatch, A., Blain, D., Bhatti, J., and Krcmar, E.: Canadian boreal forests and climate change mitigation, Environ. Rev., 21, 293–321, https://doi.org/10.1139/er-2013-0039, 2013. a
Li, F., Lawrence, D. M., and Bond-Lamberty, B.: Impact of fire on global land surface air temperature and energy budget for the 20th century due to changes within ecosystems, Environ. Res. Lett., 12, 044014, https://doi.org/10.1088/1748-9326/aa6685, 2017. a
Ludwig, S. M., Alexander, H. D., Kielland, K., Mann, P. J., Natali, S. M., and Ruess, R. W.: Fire severity effects on soil carbon and nutrients and microbial processes in a Siberian larch forest, Glob. Change Biol., 24, 5841–5852, https://doi.org/10.1111/gcb.14455, 2018. a
Makoto, K. and Koike, T.: Charcoal ecology: Its function as a hub for plant succession and soil nutrient cycling in boreal forests, Ecol. Res., 36, 4–12, https://doi.org/10.1111/1440-1703.12179, 2021. a
Makoto, K., Choi, D., Hashidoko, Y., and Koike, T.: The growth of Larix gmelinii seedlings as affected by charcoal produced at two different temperatures, Biol. Fert. Soils, 47, 467–472, https://doi.org/10.1007/s00374-010-0518-0, 2011. a
Makoto, K., Shibata, H., Kim, Y., Satomura, T., Takagi, K., Nomura, M., Satoh, F., and Koike, T.: Contribution of charcoal to short-term nutrient dynamics after surface fire in the humus layer of a dwarf bamboo-dominated forest, Biol. Fert. Soils, 48, 569–577, https://doi.org/10.1007/s00374-011-0657-y, 2012. a
Malhi, Y., Baldocchi, D., and Jarvis, P.: The carbon balance of tropical, temperate and boreal forests, Plant Cell Environ., 22, 715–740, https://doi.org/10.1046/j.1365-3040.1999.00453.x, 1999. a
Marklund, L.: Biomass functions for Norway spruce (Picea abies (L.) Karst.) in Sweden [biomass determination, dry weight], Rapport-Sveriges Lantbruksuniversitet, Institutionen foer Skogstaxering, Sweden, ISBN 91-576-3207-3, 1987. a
Mekonnen, Z. A., Riley, W. J., Randerson, J. T., Grant, R. F., and Rogers, B. M.: Expansion of high-latitude deciduous forests driven by interactions between climate warming and fire, Nat. Plants, 5, 952–958, https://doi.org/10.1038/s41477-019-0495-8, 2019. a
Murphy, P. N., Ogilvie, J., Connor, K., and Arp, P. A.: Mapping wetlands: a comparison of two different approaches for New Brunswick, Canada, Wetlands, 27, 846–854, https://doi.org/10.1672/0277-5212(2007)27[846:MWACOT]2.0.CO;2, 2007. a
Naturvårdsverket: Markfuktighetsindex producerat som del av Nationella marktäckedata, NMD, https://metadatakatalogen.naturvardsverket.se/metadatakatalogen/GetMetaDataById?id=cae71f45-b463-447f-804f-2847869b19b0 (last access: 15 July 2019), 2018. a
Neary, D. G., Klopatek, C. C., DeBano, L. F., and Ffolliott, P. F.: Fire effects on belowground sustainability: a review and synthesis, Forest Ecol. Manage., 122, 51–71, https://doi.org/10.1016/S0378-1127(99)00032-8, 1999. a
Neff, J., Harden, J., and Gleixner, G.: Fire effects on soil organic matter content, composition, and nutrients in boreal interior Alaska, Can. J. Forest Res., 35, 2178–2187, https://doi.org/10.1139/x05-154, 2005. a
Olsson, J., Södling, J., and Wetterhall, F.: Högupplösta nederbördsdata för hydrologisk modellering: en förstudie, SMHI [data set], https://www.smhi.se/publikationer/hogupplosta-nederbordsdata-for-hydrologisk-modellering-en-forstudie-1.32746 (last access: 15 July 2019), 2013. a
Olsson, M. T., Erlandsson, M., Lundin, L., Nilsson, T., Nilsson, Å., and Stendahl, J.: Organic carbon stocks in Swedish Podzol soils in relation to soil hydrology and other site characteristics, Silva Fenn., 43, 209–222, https://doi.org/10.14214/sf.207, 2009. a
Palviainen, M., Pumpanen, J., Berninger, F., Ritala, K., Duan, B., Heinonsalo, J., Sun, H., Köster, E., and Köster, K.: Nitrogen balance along a northern boreal forest fire chronosequence, PloS one, 12, e0174720, https://doi.org/10.1371/journal.pone.0174720, 2017. a
Pellegrini, A. F., Harden, J., Georgiou, K., Hemes, K. S., Malhotra, A., Nolan, C. J., and Jackson, R. B.: Fire effects on the persistence of soil organic matter and long-term carbon storage, Nat. Geosci., 15, 5–13, https://doi.org/10.1038/s41561-021-00867-1, 2021. a, b
Ponomarev, E. I., Kharuk, V. I., and Ranson, K. J.: Wildfires Dynamics in Siberian Larch Forests, Forests, 7, 125, https://doi.org/10.3390/f7060125, 2016. a
Preston, C. M. and Schmidt, M. W. I.: Black (pyrogenic) carbon: a synthesis of current knowledge and uncertainties with special consideration of boreal regions, Biogeosciences, 3, 397–420, https://doi.org/10.5194/bg-3-397-2006, 2006. a
QGIS Development Team: QGIS Geographic Information System, QGIS Association, https://www.qgis.org, last access: 15 July 2019. a
Rabin, S. S., Melton, J. R., Lasslop, G., Bachelet, D., Forrest, M., Hantson, S., Kaplan, J. O., Li, F., Mangeon, S., Ward, D. S., Yue, C., Arora, V. K., Hickler, T., Kloster, S., Knorr, W., Nieradzik, L., Spessa, A., Folberth, G. A., Sheehan, T., Voulgarakis, A., Kelley, D. I., Prentice, I. C., Sitch, S., Harrison, S., and Arneth, A.: The Fire Modeling Intercomparison Project (FireMIP), phase 1: experimental and analytical protocols with detailed model descriptions, Geosci. Model Dev., 10, 1175–1197, https://doi.org/10.5194/gmd-10-1175-2017, 2017. a
Rapalee, G., Trumbore, S. E., Davidson, E. A., Harden, J. W., and Veldhuis, H.: Soil carbon stocks and their rates of accumulation and loss in a boreal forest landscape, Global Biogeochem. Cy., 12, 687–701, https://doi.org/10.1029/98GB02336, 1998. a
Rogers, B. M., Soja, A. J., Goulden, M. L., and Randerson, J. T.: Influence of tree species on continental differences in boreal fires and climate feedbacks, Nat. Geosci., 8, 228–234, https://doi.org/10.1038/ngeo2352, 2015. a, b, c
Ruiz, J. A. M., Riaño, D., Arbelo, M., French, N. H., Ustin, S. L., and Whiting, M. L.: Burned area mapping time series in Canada (1984–1999) from NOAA-AVHRR LTDR: A comparison with other remote sensing products and fire perimeters, Remote Sens. Environ., 117, 407–414, https://doi.org/10.1016/j.rse.2011.10.017, 2012. a
Santín, C., Doerr, S. H., Preston, C. M., and González-Rodríguez, G.: Pyrogenic organic matter production from wildfires: a missing sink in the global carbon cycle, Glob. Change Biol., 21, 1621–1633, https://doi.org/10.1111/gcb.12800, 2015. a
Santín, C., Doerr, S. H., Merino, A., Bryant, R., and Loader, N. J.: Forest floor chemical transformations in a boreal forest fire and their correlations with temperature and heating duration, Geoderma, 264, 71–80, https://doi.org/10.1016/j.geoderma.2015.09.021, 2016. a, b, c, d, e
Schmidt, M. W. and Noack, A. G.: Black carbon in soils and sediments: analysis, distribution, implications, and current challenges, Global Biogeochem. Cy., 14, 777–793, https://doi.org/10.1029/1999GB001208, 2000. a, b, c
Schultz, M. G., Heil, A., Hoelzemann, J. J., Spessa, A., Thonicke, K., Goldammer, J. G., Held, A. C., Pereira, J. M. C., and van het Bolscher, M.: Global wildland fire emissions from 1960 to 2000, Global Biogeochem. Cy., 22, GB2002, https://doi.org/10.1029/2007GB003031, 2008. a
Schweiger, A. H., Irl, S. D. H., Steinbauer, M. J., Dengler, J., and Beierkuhnlein, C.: Optimizing sampling approaches along ecological gradients, Methods Ecol. Evol., 7, 463–471, https://doi.org/10.1111/2041-210X.12495, 2016. a, b
Seabold, S. and Perktold, J.: statsmodels: Econometric and statistical modeling with python, in: 9th Python in Science Conference, edited by: van der Walt, S. and Millman, J., SciPy.org, https://doi.org/10.25080/Majora-92bf1922-011, 2010. a
Sidoroff, K., Kuuluvainen, T., Tanskanen, H., and Vanha-Majamaa, I.: Tree mortality after low-intensity prescribed fires in managed Pinus sylvestris stands in southern Finland, Scand. J. Forest Res., 22, 2–12, https://doi.org/10.1080/02827580500365935, 2007. a, b
Soja, A. J., Cofer, W. R., Shugart, H. H., Sukhinin, A. I., Stackhouse, P. W., McRae, D. J., and Conard, S. G.: Estimating fire emissions and disparities in boreal Siberia (1998–2002), J. Geophys. Res.-Atmos., 109, D14S06, https://doi.org/10.1029/2004JD004570, 2004. a
Stocks, B. J., Mason, J. A., Todd, J. B., Bosch, E. M., Wotton, B. M., Amiro, B. D., Flannigan, M. D., Hirsch, K. G., Logan, K. A., Martell, D. L., and Skinner, W. R.: Large forest fires in Canada, 1959–1997, J. Geophys. Res.-Atmos., 107, FFR 5-1–FFR 5-12, https://doi.org/10.1029/2001JD000484, 2002. a
Tagesson, T., Schurgers, G., Horion, S., Ciais, P., Tian, F., Brandt, M., Ahlström, A., Wigneron, J.-P., Ardö, J., Olin, S., Fan, L., Wu, Z., and Fensholt, R.: Recent divergence in the contributions of tropical and boreal forests to the terrestrial carbon sink, Nat. Ecol. Evol., 4, 202–209, https://doi.org/10.1038/s41559-019-1090-0, 2020. a
Valendik, E.: Temporal and spatial distribution of forest fires in Siberia, in: Fire in Ecosystems of Boreal Eurasia, edited by: Goldammer, J. G. and Furyaev, V. V., 129–138, Springer, https://doi.org/10.1007/978-94-015-8737-2_9, 1996. a
van der Werf, G. R., Randerson, J. T., Giglio, L., van Leeuwen, T. T., Chen, Y., Rogers, B. M., Mu, M., van Marle, M. J. E., Morton, D. C., Collatz, G. J., Yokelson, R. J., and Kasibhatla, P. S.: Global fire emissions estimates during 1997–2016, Earth Syst. Sci. Data, 9, 697–720, https://doi.org/10.5194/essd-9-697-2017, 2017. a, b, c
van Leeuwen, T. T., van der Werf, G. R., Hoffmann, A. A., Detmers, R. G., Rücker, G., French, N. H. F., Archibald, S., Carvalho Jr., J. A., Cook, G. D., de Groot, W. J., Hély, C., Kasischke, E. S., Kloster, S., McCarty, J. L., Pettinari, M. L., Savadogo, P., Alvarado, E. C., Boschetti, L., Manuri, S., Meyer, C. P., Siegert, F., Trollope, L. A., and Trollope, W. S. W.: Biomass burning fuel consumption rates: a field measurement database, Biogeosciences, 11, 7305–7329, https://doi.org/10.5194/bg-11-7305-2014, 2014. a
Van Wagner, C.: Development and structure of the canadian forest fire weather index system, in: Can. For. Serv., Forestry Tech. Rep, Citeseer, ISBN 0-662-15198-4, 1987. a
Vanhala, P., Karhu, K., Tuomi, M., Björklöf, K., Fritze, H., and Liski, J.: Temperature sensitivity of soil organic matter decomposition in southern and northern areas of the boreal forest zone, Soil Biol. Biochem., 40, 1758–1764, https://doi.org/10.1016/j.soilbio.2008.02.021, 2008. a
Veraverbeke, S., Rogers, B. M., and Randerson, J. T.: Daily burned area and carbon emissions from boreal fires in Alaska, Biogeosciences, 12, 3579–3601, https://doi.org/10.5194/bg-12-3579-2015, 2015. a
Veraverbeke, S., Delcourt, C. J., Kukavskaya, E., Mack, M., Walker, X., Hessilt, T., Rogers, B., and Scholten, R. C.: Direct and longer-term carbon emissions from arctic-boreal fires: A short review of recent advances, Current Opinion in Environmental Science & Health, 23, 100277, https://doi.org/10.1016/j.coesh.2021.100277, 2021. a, b, c
Virtanen, P., Gommers, R., Oliphant, T. E., Haberland, M., Reddy, T., Cournapeau, D., Burovski, E., Peterson, P., Weckesser, W., Bright, J., van der Walt, S. J., Brett, M., Wilson, J., Millman, K. J., Mayorov, N., Nelson, A. R. J., Jones, E., Kern, R., Larson, E., Carey, C. J., Polat, İ., Feng, Y., Moore, E. W., VanderPlas, J., Laxalde, D., Perktold, J., Cimrman, R., Henriksen, I., Quintero, E. A., Harris, C. R., Archibald, A. M., Ribeiro, A. H., Pedregosa, F., van Mulbregt, P., and SciPy 1.0 Contributors: SciPy 1.0: Fundamental Algorithms for Scientific Computing in Python, Nat. Methods, 17, 261–272, https://doi.org/10.1038/s41592-019-0686-2, 2020. a
Walker, X. J., Rogers, B. M., Baltzer, J. L., Cumming, S. G., Day, N. J., Goetz, S. J., Johnstone, J. F., Schuur, E. A. G., Turetsky, M. R., and Mack, M. C.: Cross-scale controls on carbon emissions from boreal forest megafires, Glob. Change Biol., 24, 4251–4265, https://doi.org/10.1111/gcb.14287, 2018. a, b, c, d, e
Walker, X., Rogers, B., Veraverbeke, S., Johnstone, J., Baltzer, J., Barrett, K., Bourgeau-Chavez, L., Day, N., Groot, W., Dieleman, C., Goetz, S., Hoy, E., Jenkins, L., Kane, E., Parisien, M.-A., Potter, S., Schuur, E., Turetsky, M., Whitman, E., and Mack, M.: Fuel availability not fire weather controls boreal wildfire severity and carbon emissions, Nat. Clim. Change, 10, 1130–1136, https://doi.org/10.1038/s41558-020-00920-8, 2020a. a, b, c, d, e, f, g
Walker, X. J., Baltzer, J. L., Bourgeau-Chavez, L., Day, N. J., Dieleman, C. M., Johnstone, J. F., Kane, E. S., Rogers, B. M., Turetsky, M. R., Veraverbeke, S., and Mack, M. C.: Patterns of Ecosystem Structure and Wildfire Carbon Combustion Across Six Ecoregions of the North American Boreal Forest, Frontiers in Forests and Global Change, 3, 87, https://doi.org/10.3389/ffgc.2020.00087, 2020b. a, b, c
Wiggins, E. B., Andrews, A., Sweeney, C., Miller, J. B., Miller, C. E., Veraverbeke, S., Commane, R., Wofsy, S., Henderson, J. M., and Randerson, J. T.: Boreal forest fire CO and CH4 emission factors derived from tower observations in Alaska during the extreme fire season of 2015, Atmos. Chem. Phys., 21, 8557–8574, https://doi.org/10.5194/acp-21-8557-2021, 2021. a
Wilcke, R. A. I., Kjellström, E., Lin, C., Matei, D., Moberg, A., and Tyrlis, E.: The extremely warm summer of 2018 in Sweden – set in a historical context, Earth Syst. Dynam., 11, 1107–1121, https://doi.org/10.5194/esd-11-1107-2020, 2020. a
Wooster, M. J. and Zhang, Y. H.: Boreal forest fires burn less intensely in Russia than in North America, Geophys. Res. Lett., 31, L20505, https://doi.org/10.1029/2004GL020805, 2004. a
Zackrisson, O., Nilsson, M.-C., and Wardle, D. A.: Key ecological function of charcoal from wildfire in the Boreal forest, Oikos, 77, 10–19, https://doi.org/10.2307/3545580, 1996. a
Zoltai, S., Morrissey, L., Livingston, G., and Groot, W. D.: Effects of fires on carbon cycling in North American boreal peatlands, Environ. Rev., 6, 13–24, https://doi.org/10.1139/a98-002, 1998. a