the Creative Commons Attribution 4.0 License.
the Creative Commons Attribution 4.0 License.
 | 06 Jul 2022
Episodic N2O emissions following tillage of a legume–grass cover crop mixture
Jennifer Blesh
Nitrogen (N) fertilizer inputs to agricultural soils are a leading cause of nitrous oxide (N2O) emissions. Legume cover crops are an alternative N source that can reduce agricultural N2O emissions compared to fertilizer N. However, our understanding of episodic N2O flux following cover crop incorporation by tillage is limited and has focused on single-species cover crops. Our study explores whether increasing cover crop functional diversity with a legume–grass mixture can reduce pulse emissions of N2O following tillage. In a field experiment, we planted crimson clover (Trifolium incarnatum L.), cereal rye (Secale cereal L.), a clover–rye mixture, and a no-cover control at two field sites with contrasting soil fertility properties in Michigan. We hypothesized that N2O flux following tillage of the cover crops would be lower in the mixture and rye compared to the clover treatment because rye litter can decrease N mineralization rates. We measured N2O for approximately 2 weeks following tillage to capture the first peak in N2O emissions in each site. Across cover crop treatments, the higher-fertility site, CF, had greater cover crop biomass, 2-fold-higher aboveground biomass N, and higher cumulative N2O emissions than the lower-fertility site, KBS (413.4±67.5 vs. 230.8±42.5 g N2O-N ha−1; P=0.004). There was a significant treatment effect on daily emissions at both sites. At CF, N2O fluxes were higher following clover than the control 6 d after tillage. At KBS, fluxes from the mixture were higher than rye 8 and 11 d after tillage. When controlling for soil fertility differences between sites, clover and mixture led to approximately 2-fold-higher N2O emissions compared to rye and fallow treatments. We found partial support for our hypothesis that N2O would be lower following incorporation of the mixture than clover. However, treatment patterns differed by site, suggesting that interactions between cover crop functional types and background soil fertility influence N2O emissions during cover crop decomposition.
- Article
(872 KB) - Full-text XML
- BibTeX
- EndNote


Nitrogen (N) losses from grain agroecosystems contribute to climate change through nitrous oxide (N2O) emissions (Robertson and Vitousek, 2009). Globally, N2O emissions from agricultural soils increased by 11 % from 1990 to 2005 and are projected to increase by another 35 % between 2005 and 2030 (USEPA, 2012). In the USA, approximately 75 % of N2O emissions come from agricultural soils (USEPA, 2021), and the amount of N added to soil from synthetic fertilizers is the primary driver of these high emissions (Millar et al., 2010; Han et al., 2017; Eagle et al., 2020). Generally, total N inputs are correlated with N losses from agroecosystems (Robertson and Vitousek, 2009). However, diversified grain rotations with legume N sources, which add biologically fixed N2 to fields, better balance N inputs with harvested exports and have lower potential for N losses compared to synthetic fertilizers (Drinkwater et al., 1998; Blesh and Drinkwater, 2013; Robertson et al., 2014). Legumes can be added to rotations as overwintering cover crops, which are unharvested crops planted in the fall and terminated in the spring in temperate regions. As an organic N source, legume litter supplies organic substrates to support microbial processes that can increase soil organic matter (SOM) pools and N retention in SOM (Drinkwater et al., 1998; Syswerda et al., 2012; Blesh and Drinkwater, 2013). Further, diversified rotations with legume N sources could reduce or replace the use of synthetic N fertilizers, thereby reducing greenhouse gas emissions associated with fertilizer production and application (Norskov and Chen, 2016).
Two key factors that affect N2O emissions are soil disturbance through tillage and crop functional traits (Gelfand et al., 2016). In agroecosystems, even small increases in crop functional diversity (e.g., two to three species in cover crop mixtures with complementary traits) can substantially impact ecosystem functions such as SOM accrual, N-cycling processes, and weed suppression (Drinkwater et al., 1998; McDaniel et al., 2014; Tiemann et al., 2015; Blesh, 2017). For example, the timing and rate of N release from different cover crop functional types (i.e., C4 vs. C3 grasses, N-fixing legumes) during decomposition affect the potential for N losses (Millar et al., 2004; White et al., 2017) through effects on soil N availability. Interactions between the biochemical composition of fresh litter inputs and background soil properties, including the microbial community, are key drivers of microbial decomposition dynamics and N mineralization rates (Cheng, 2009; Kallenbach et al., 2019). Consequently, legume cover crops, which have a high N concentration, may result in higher production of N2O after disturbances like tillage compared to cover crops that include non-legume species (Alluvione et al., 2010; Huang et al., 2004; Millar et al., 2004; Gomes et al., 2009). The effects of litter on N mineralization and N2O flux may be particularly evident when comparing sole legumes with lower ratios (e.g., ) to grass cover crops with higher (e.g., >30) (Baggs et al., 2003). For example, prior research on legume–grass mixtures revealed that they reduced N leaching compared to sole legumes while enhancing N supply compared to sole grasses, providing multiple ecosystem functions (Kaye et al., 2019). However, there are limited data on N2O losses following cover crops in organically managed agroecosystems, and the effects of mixtures of complementary functional types on N2O emissions are poorly understood.
Understanding the timing of N2O emissions is also key to reducing N losses from crop rotations (Wagner-Riddle et al., 2020). Millar et al. (2004) found that N2O fluxes are episodic in a cropping system with corn and legume cover crops as the sole source of new N. Specifically, 65 %–90 % of N2O emissions occurred during the first 28 d following tillage of legume cover crops over an 84 d measurement period. Similarly, Gomes et al. (2009) found greater N2O emissions during the first 45 d after terminating cover crops with a roller cutter and herbicide compared to the rest of the year. Gelfand et al. (2016) observed high temporal variability in N2O fluxes measured for 20 years in different temperate grain cropping systems and suggested that emissions following tillage were a primary driver of this variation in the two agroecosystems with cover crops. Therefore, there is a need to measure N2O in the weeks following cover crop termination to understand pulse N2O fluxes, particularly when legumes are the sole, or primary, source of N additions. Further, to our knowledge no studies have tested whether legume–grass mixtures reduce pulse N2O during this critical period compared to sole legume cover crops.
Variability in soil conditions also plays an important role in soil N2O flux. Edaphic characteristics, such as soil texture (Gaillard et al., 2016), soil organic carbon (SOC) (Bouwman et al., 2002; Dhadli et al., 2016), and interannual rainfall patterns can often explain more variation in N2O emissions than treatment differences (Basche et al., 2014; Ruser et al., 2017). One study with synthetic N fertilizer additions on clayey Oxisols in Brazil found higher N2O losses from more intensively managed fields with lower labile SOM fractions and total C content (de Figueiredo et al., 2018). In fields with organic N sources, SOM fractions with relatively short turnover times (i.e., years to decades) likely influence N mineralization following cover crop incorporation and resulting N2O emissions. Free particulate organic matter (fPOM) and occluded particulate organic matter (oPOM), the latter of which is physically protected in soil aggregates, are both indicators of nutrient cycling capacity in soil (Marriott and Wander, 2006). Prior studies have found that particulate organic matter (POM) N concentrations are positively correlated with potential N mineralization rates (Blesh, 2019) and that this relationship varies with soil texture and management history (St. Luce et al., 2016). It is therefore critical to assess N2O emissions in soils with different properties, such as in terms of SOM, POM, and nutrient stocks, which reflect the environmental context and land management histories.
In this field experiment, we tested the effects of a legume–grass cover crop mixture on agroecosystem N-cycling processes compared to each species grown alone during the first flux of N2O following tillage. The experiment was conducted at two sites in Michigan with contrasting soil fertility properties. Our specific objectives were to (1) quantify cover crop functional traits, including and legume N inputs from biological N fixation (BNF), and (2) test the effects of cover crop treatment on pulse N2O fluxes following spring tillage, when emissions are expected to be greatest in agroecosystems that rely on legume N sources. Our hypothesis was that the legume–grass mixture would result in lower pulse N2O fluxes than the sole legume due to a higher and a smaller new N input to soil from BNF.
2.1 Site description and experimental design
The study was conducted on two sites in two regions of Michigan, USA. The first site (CF) was located at the University of Michigan's Campus Farm ( N, W; elevation 259.08 m) and was previously in a grass fallow with periodic mowing for over 45 years. The experiment at CF was conducted in the 2017/18 overwintering cover crop season. The site resides on a glacial till plain with well-drained sandy loam soils in the Fox series which are mixed, superactive, mesic Typic Hapludalfs. The soil had 2.5 % organic matter, 21.5 % clay, and a pH of 6.35. The site received 1030 mm of rainfall during the experiment (August 2017–September 2018) with an average temperature of 10.2 ∘C. The second site (KBS) was located in the biologically based cropping system in the Main Cropping System Experiment (MCSE) of the Kellogg Biological Station Long-term Ecological Research site ( N, W; elevation 288 m). The field has been in a corn–soy–winter wheat rotation managed using organic practices for over 30 years. The experiment at KBS was conducted in the 2019/20 overwintering cover crop season. This site is on a glacial outwash plain with well-drained loam, sandy loam, and sandy clay loam soils in the Kalamazoo and Oshtemo series which are mixed, mesic Typic Hapludalfs (Crum and Collins, 1995). The soil had 1.74 % organic matter, 19.4 % clay, and a pH of 6.59. The site receives an average of 933 mm yr−1 with an average temperature of 9.2 ∘C. Neither field received any fertilizer or manure applications before or during the experiment.
In a randomized complete block design, we planted four cover crop treatments in 4.5 m×6 m plots at CF – (1) cereal rye (seeding rate 168 kg ha−1), (2) crimson clover (seeding rate 34 kg ha−1), (3) clover–rye mixture (seeding rate 67 kg ha−1 rye and 17 kg ha−1 clover), and (4) a weedy fallow control – in four blocks by broadcasting seed on 16 August 2017. We planted four cover crop treatments into 3.1 m×12.2 m plots at KBS – (1) cereal rye (seeding rate 100.9 kg ha−1), (2) crimson clover (seeding rate 16.8 kg ha−1), (3) clover–rye mixture (seeding rate 50.4 kg ha−1 rye and 9.0 kg ha−1 clover), and (4) a weedy fallow control – in four blocks with a grain drill on 31 July 2019. Seeding rates were reduced for the site planted with a grain drill due to higher likelihood of germination. The cover crops overwintered and were rototilled into the soil on 24 May 2018 (CF) and on 26 May 2020 (KBS) followed by corn planting on 14 June 2018 (CF) and on 1 June 2020 (KBS). Cover crops had 4501 growing degree days at KBS and 3898 at CF.
2.2 Baseline soil sampling
Prior to planting, we collected a composite, baseline soil sample from each replicate block at CF and from each treatment plot within each replicate block at KBS to determine initial soil conditions and characterize soil fertility status at both experimental sites. In each plot, we estimated bulk density from the fresh mass of 10 composited soil cores (2 cm×20 cm) and adjusted for soil moisture, determined gravimetrically. Subsamples of ∼50 g were also analyzed for soil texture using the hydrometer method. Air-dried soil was mixed and soaked with 100 mL of sodium hexametaphosphate and blended for 5 min. The mixture was transferred to a glass sedimentation cylinder and filled to 1 L with tap water. The slurry was mixed with a metal plunger, and hydrometer readings were taken 40 s and 2 h after the plunger was removed. The percentage of sand was calculated from the 40 s reading and the percentage of clay from the 2 h reading.
At sampling, we sieved a subsample of fresh soil to 2 mm and measured extractable and potentially mineralizable N in triplicate for each soil sample. We immediately extracted inorganic N ( + ) in 2 mol L−1 KCl. The amount of + in each sample was analyzed colorimetrically on a discrete analyzer (AQ2; Seal Analytical, Mequon, WI, USA). We also performed a 7 d anaerobic N incubation and then extracted in 2 mol L−1 KCl. Soil weights for extractions and incubations were adjusted for soil moisture. Potentially mineralizable N (PMN) was calculated by subtracting the initial amount of in the soil from the released during the 7 d incubation (Drinkwater et al., 1996).
Particulate organic matter (POM) (>53 µm) was separated from triplicate 40 g subsamples of unsieved, air-dried soil based on size and density (Marriott and Wander, 2006; Blesh, 2019). To isolate the light fraction POM (also called free POM or fPOM), the subsamples were gently shaken for 1 h in sodium polytungstate (1.7 g cm−3) and allowed to settle for 16 h, and free POM floating on top of the solution was removed by aspiration. To separate the physically protected, or occluded, POM fraction (oPOM), the remaining soil sample was shaken with 10 % sodium hexametaphosphate to disperse soil aggregates and then rinsed through a 53 µm filter (Marriott and Wander, 2006). Protected POM was then separated from sand by decanting. The C and N of both POM fractions (fPOM and oPOM) were measured on an ECS 4010 CHNSO analyzer (Costech Analytical Technologies, Valencia, California, USA). Total soil C and N (to 20 cm) were measured by dry combustion on a LECO TruMac CN analyzer (LECO Corporation, St. Joseph, Michigan, USA) (Blesh, 2019).
2.3 Aboveground biomass sampling and analysis
We sampled aboveground biomass from all treatments on 22 May 2018 (CF) and on 26 May 2020 (KBS) from one 0.25 m2 quadrat randomly placed in each plot, avoiding edges. Shoot biomass was cut at the soil surface, separated by species (with weeds grouped together), dried at 60 ∘C for 48 h, weighed, and coarsely ground (<2 mm) in a Wiley mill. We analyzed the biomass for total C and N by dry combustion on a LECO TruMac CN analyzer (LECO Corporation, St. Joseph, Michigan, USA).
2.4 Legume N fixation by natural abundance
We estimated BNF by crimson clover using the natural abundance method (Shearer and Kohl, 1986). Shoot biomass from the clover in monoculture and mixture and rye in monoculture (the non-N2-fixing reference plant) were collected in the field, dried, weighed, and finely ground (<0.5 mm). Samples were analyzed for total N and δ15N enrichment using a continuous-flow isotope ratio mass spectrometer at the UC Davis Stable Isotope Facility. The percentage of N derived from the atmosphere (i.e., %Ndfa) was calculated using the following mixing model (Eq. 1):
where δ15Nref is the δ15N signature of the reference plant (rye), δ15Nlegume is the δ15N signature of the clover and B is defined as the δ15N signature of a legume when dependent solely on atmospheric N2. B values were determined by growing crimson clover species in the greenhouse in a N-free medium following methods in Blesh (2017). After conducting two B-value experiments with crimson clover (one per site), we found a mean B value of −1.57, which we used in our calculation of %Ndfa. We estimated BNF (kg N ha−1) by multiplying field values for aboveground biomass by shoot percentage of N and then by %Ndfa. The natural abundance method is generally considered reliable when the δ15N signatures of the legume and reference plants are separated by 2 ‰ (Unkovich et al., 2008). At the KBS site, this criterion was met; however, we did not find adequate separation between the legume and reference species at CF. We therefore estimated BNF at CF using the mean %Ndfa values from KBS for clover in mixture and monoculture. Given this, we also conducted a sensitivity analysis to determine how variation in %Ndfa at CF would affect model outcomes.
2.5 N2O flux following soil disturbance
We used the static chamber method (Kahmark et al., 2018) to measure the first pulse of N2O emissions in each field following tillage of all experimental plots. All measurements occurred between 09:00 EST and noon. At CF, we measured N2O once before and five times after cover crop incorporation over 18 d. At KBS, we measured N2O seven times after cover crop incorporation over 15 d. These periods captured the main episode of N2O flux following tillage and initial decomposition of cover crop residues. During the N2O measurement period, each site received the same amount of precipitation (15 mm) and had the same average temperature (20.6 ∘C).
Static chambers at KBS were made from stainless steel cylinders (diameter 28.5 cm), and chambers at CF were made from Letica 3.5 gal (11.35 L) pails with the bottom removed to create a cylinder (diameter at top 28.5 cm, diameter at bottom 26 cm). Chamber lids were fitted with O-ring seals to create an airtight container during sampling. Each lid was equipped with a rubber septum port for extraction of gas samples. Before each sampling date, static chambers were installed in the ground and allowed to rest for at least 24 h to reduce the impact of soil disturbance on measured emissions. The morning before each sampling event, the depth from the lip of the chamber to the ground was measured at three locations inside the chamber to calculate the internal volume. Lids were then placed securely on the chamber, and 10 mL samples were extracted using a syringe every 20 min over a period of 60 min. Each 10 mL sample was stored, overpressurized, in a 5.9 mL graduated glass vial with an airtight rubber septum (Labco Limited, Lampeter, UK). We analyzed samples for N2O using a gas chromatograph equipped with an electron capture detector (Agilent, Santa Clara, California, USA). N2O flux was calculated as the change in headspace N2O concentration over the 60 min time period. Each set of four data points (0, 20, 40, and 60 min) was analyzed using linear regression and screened for non-linearity.
2.6 Soil inorganic nitrogen sampling
On the day after tillage and again 12–13 d later, we measured soil inorganic N ( + ) near the static chambers at both sites. We collected four to six 2 cm diameter soil cores to 10 cm depth, within 1 m of each static chamber. Samples were immediately homogenized, sieved to 2 mm, extracted with 2 M KCl, and analyzed for soil moisture using the gravimetric method. Extractions were stored at −20 ∘C and later thawed and analyzed for and colorimetrically on a discrete analyzer (AQ2; Seal Analytical, Mequon, Wisconsin, USA).
2.7 Data analysis
For all variables, we calculated descriptive statistics (mean, standard error (SE), and interquartile ranges (IQRs)) and checked all variables and models for normality of residuals and homoscedasticity. We transformed data using a log function for all variables. Within each site, we used repeated-measures ANOVA models to test for differences in N2O flux (g N2O-N ha−1 d−1) across treatments for all time points. Models included day as the repeated measure, cover crop treatment as the fixed effect, and block as the random effect. We estimated mean cumulative N2O emissions (g N2O-N ha−1) for all treatments by calculating the area under the curve (Gelfand et al., 2016) using the following (Eq. 2):
where t0 is the initial sampling date, tfinal is the final sampling date, xt is N2O flux at time t, and xt+1 is N2O flux on the following sampling date. In the absence of continuous sampling, this approach allowed us to approximate a total flux over the sampling window and better visualize treatment patterns within and across sites.
Within each site, we determined the effects of cover crop treatments on cumulative N2O, total biomass (kg ha−1), total biomass N (kg N ha−1), the shoot ratio, clover N (kg N ha−1), BNF (kg N ha−1), and soil inorganic N using separate ANOVA models for a randomized complete block design, with cover crop treatment as the fixed effect and block as the random effect. To understand the effects of cover crop treatments on all response variables across both sites, we used two-way ANOVA models with site and treatment as fixed effects, along with their interaction, and block nested in site as a random effect. We tested for differences in soil inorganic N concentrations by site for each treatment between sampling dates using a t test. For all ANOVAs, post hoc comparison of least-squares means was performed using Tukey's honestly significant difference (HSD) test, and results were reported as statistically significant at α=0.05. For models including N2O fluxes we used α=0.1, following previous work identifying high variability from unidentified sources in ecological field experiments measuring N2O emissions (Gelfand et al., 2016; Han et al., 2017). All statistical analyses were performed with JMP Pro 15 software (SAS Institute, Cary, North Carolina, USA). Excel and JMP Pro 15 were used to make figures.
3.1 Soil fertility
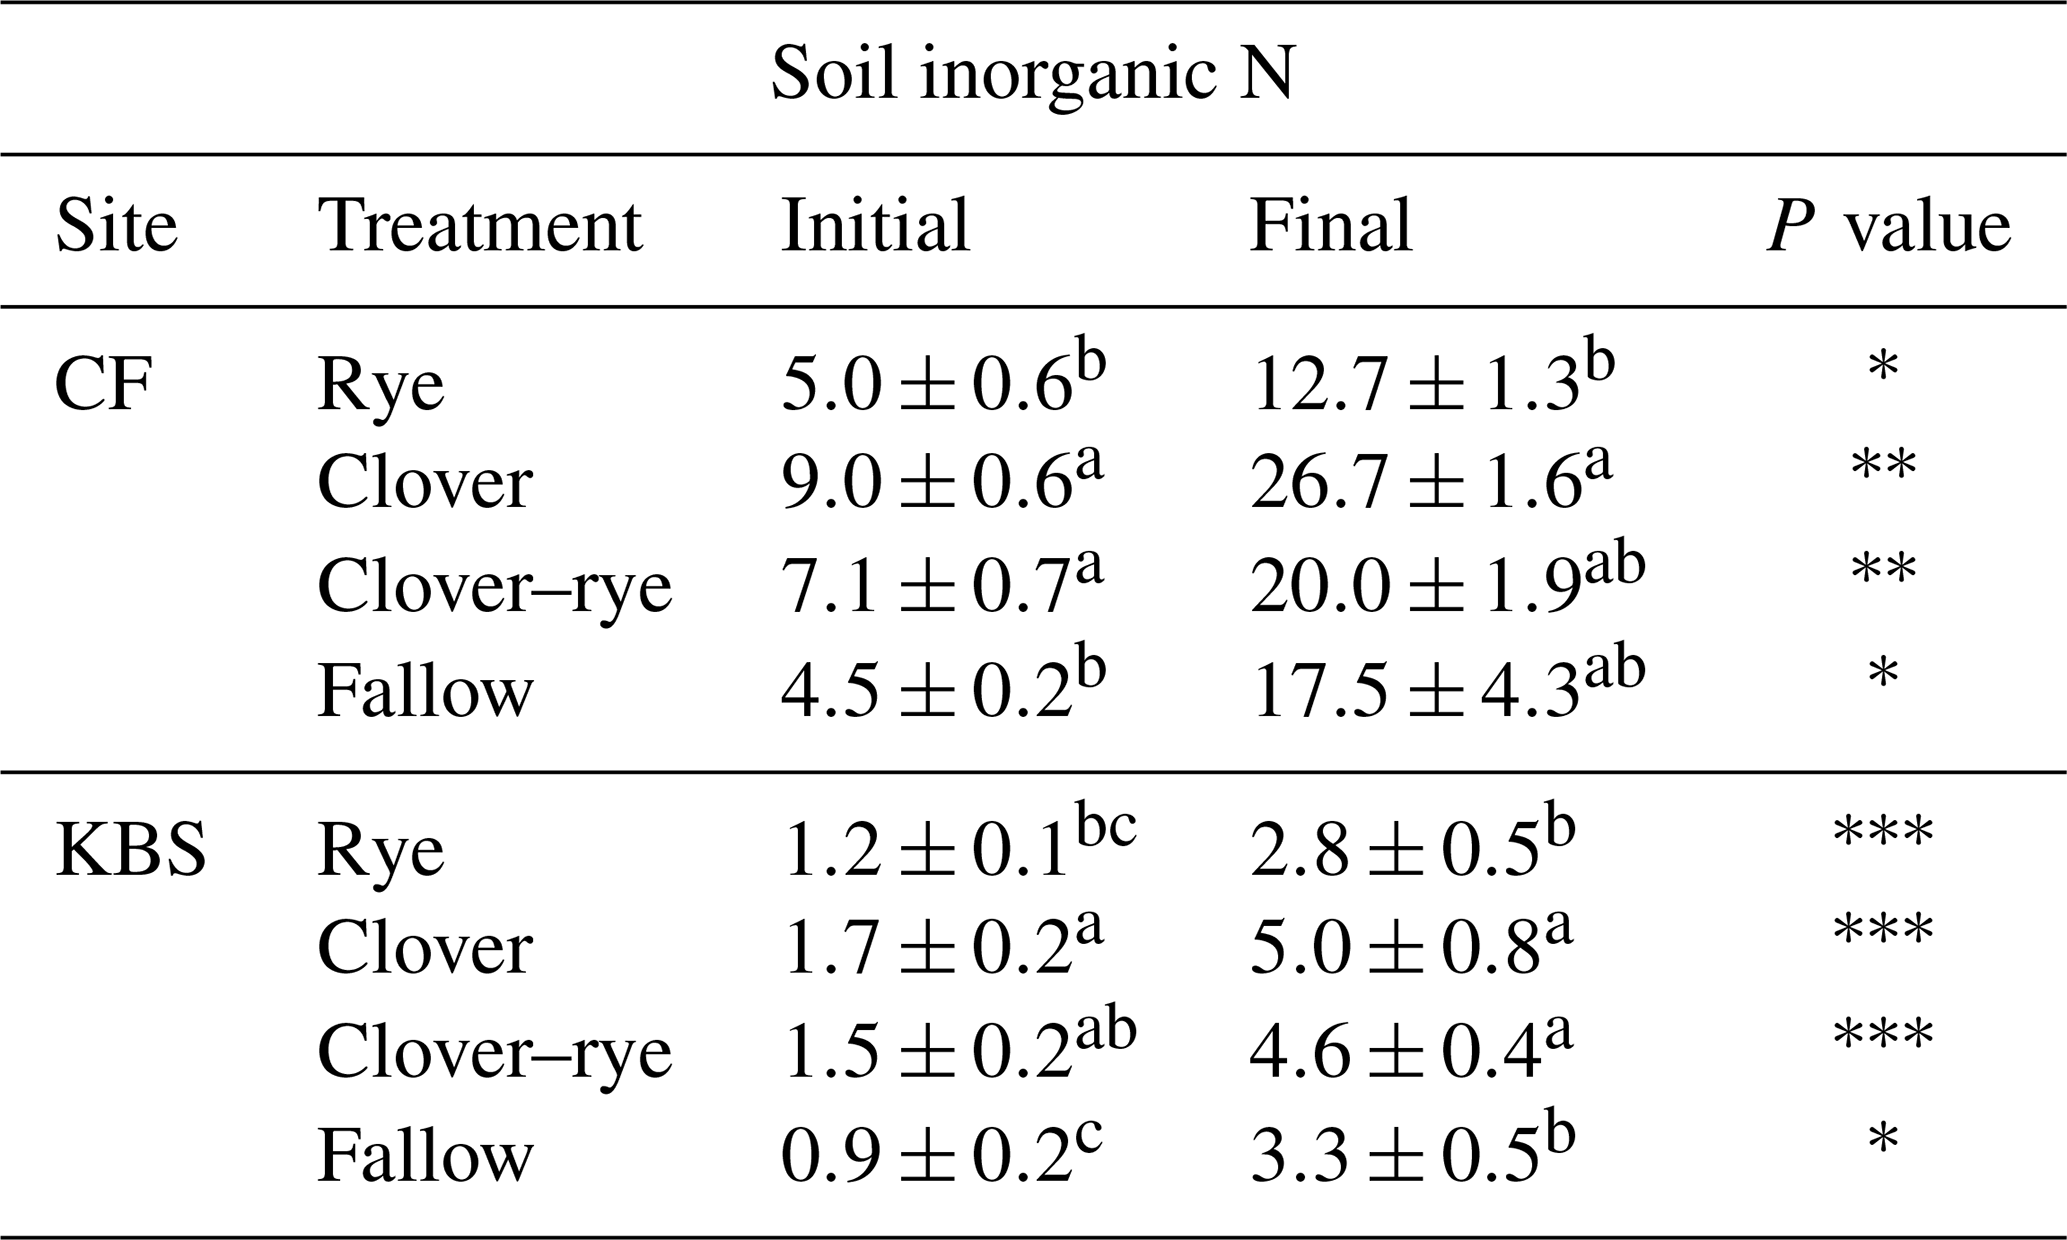
The CF site had higher soil fertility compared to the KBS site (Table 1). Total organic C was 34 % higher at CF (P=0.0003). Similarly, we found that CF had significantly larger POM pools than KBS. The concentration of free particulate organic matter (fPOM) was 44 % higher (P=0.011) and occluded particulate organic matter (oPOM) was 29 % higher at CF (P=0.006). The fPOM N concentration was 30 % higher at CF than KBS (P=0.041), and PMN was 46 % higher at CF than at KBS (P=0.004). However, oPOM N was not significantly different between CF and KBS (P=0.295). Soil inorganic N increased during the N2O sampling period in all treatments at both sites. We found a significantly larger inorganic N pool at CF than KBS on both sampling dates (P<0.001) (Table 2).
Table 1Soil fertility indicators at each site. P values are indicated as follows: and for differences between sites.

Table 2Mean ± standard error for soil inorganic N (mg N kg−1 soil) at initial and final sampling points separated by site and treatment. There was a significant difference between sites at both time points (<0.0001). P values are indicated as follows: , , and for differences between time points for each treatment in the last column. Significant treatment differences (within each site) are indicated by different letters.
3.2 Cover crop biomass and traits ( and BNF)
There was a significant effect of site (P=0.0005) and treatment (P<0.0001) and a significant interaction between site and treatment (P=0.008) for total shoot biomass, which included both cover crops and weed species. Across all cover crop treatments, mean biomass was 40 % higher at CF (5430±499 kg ha−1) than at KBS (3260±289 kg ha−1), with nearly 3 times more rye biomass and 1.5 times more mixture biomass at CF than KBS. At CF, rye biomass (7709±387 kg ha−1) was 37 % higher than biomass in the clover treatment (4846±477 kg ha−1), and almost 3-fold higher than in fallow (2775±245 kg ha−1) (P<0.0001). Rye and mixture (6392±206 kg ha−1) were not significantly different from each other, nor were the mixture and clover treatments. At KBS, clover (3972±580 kg ha−1) and mixture (4219±297 kg ha−1) treatments had approximately 2-fold more biomass than fallow (2006±388 kg ha−1) (P=0.007). However, mixture and clover biomass did not differ significantly from rye (2842±212 kg ha−1), and rye was not significantly different from fallow (Fig. 1). At both sites, clover performed well in the mixture, representing 54 % of the total mixture biomass at KBS and 53 % of total mixture biomass at CF (Table A1).
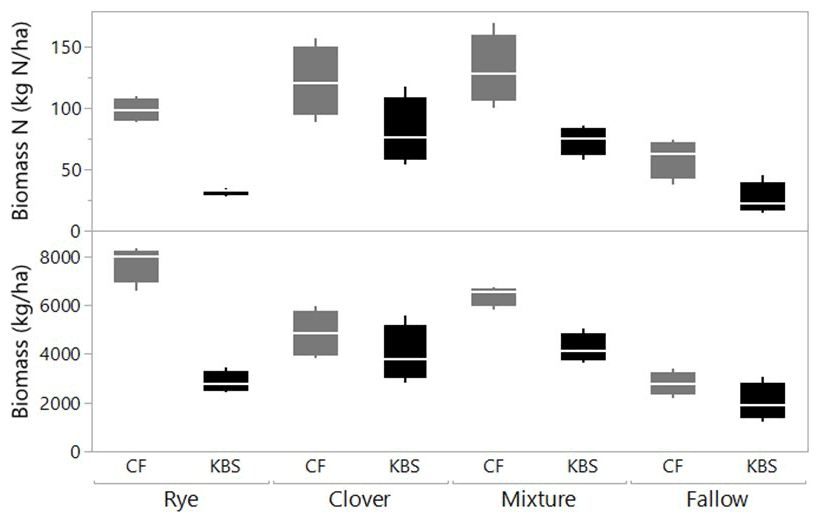
Figure 1Biomass (kg ha−1) and biomass N (kg N ha−1) by treatment (including cover crops and weeds) at two sites (CF and KBS).
We also found a significant effect of site (P=0.0005), treatment (P<0.0001) and a significant site by treatment interaction (P=0.048) for total shoot N (including both cover crop and weed biomass). Across sites, there was 2-fold-higher biomass N at CF (102.6±8.7 kg N ha−1) than at KBS (53.0±7.2 kg N ha−1), with 68 % higher N in rye biomass, 44 % higher N in mixture, and 56 % higher N in fallow at CF compared to KBS. At CF, there was a significant difference in biomass N between treatments, in which clover (121.2±14.4 kg N ha−1) accumulated 2-fold more N than the weeds in fallow (59.0±14.4 kg N ha−1) (P=0.006); however, clover, mixture (131.3±14.3 kg N ha−1), and rye (98.6±4.6 kg N ha−1) treatments did not significantly differ from each other. At KBS, we found significantly higher aboveground N in the clover (80.8±13.5 kg N ha−1) and mixture (73.4±5.8 kg N ha−1) treatments compared to the rye (31.9±1.4 kg N ha−1) and weedy fallow (26.0±6.6 kg N ha−1) (P=0.0004) (Fig. 1).
There was also a significant effect of site (P=0.001) and treatment (P<0.0001) and a significant interaction between site and treatment (P=0.005) for cover crop . Across sites for all treatments combined, was 26 % higher at KBS (30.7±2.0) than CF (23.7±1.8). At CF, the of rye biomass was 34.7±1.6, while the mixture had a significantly lower (21.7±1.8). The mixture did not differ from that in clover (17.2±0.7) or weeds in fallow (21.1±1.6; P<0.0001). At KBS, we also found a lower in treatments with legumes (40.3±1.3 in rye and 34.8±1.9 in fallow vs. 25.6±1.1 in mixture and 21.8±0.3 in clover; P<0.0001). At KBS, the difference between clover and mixture was not significant.
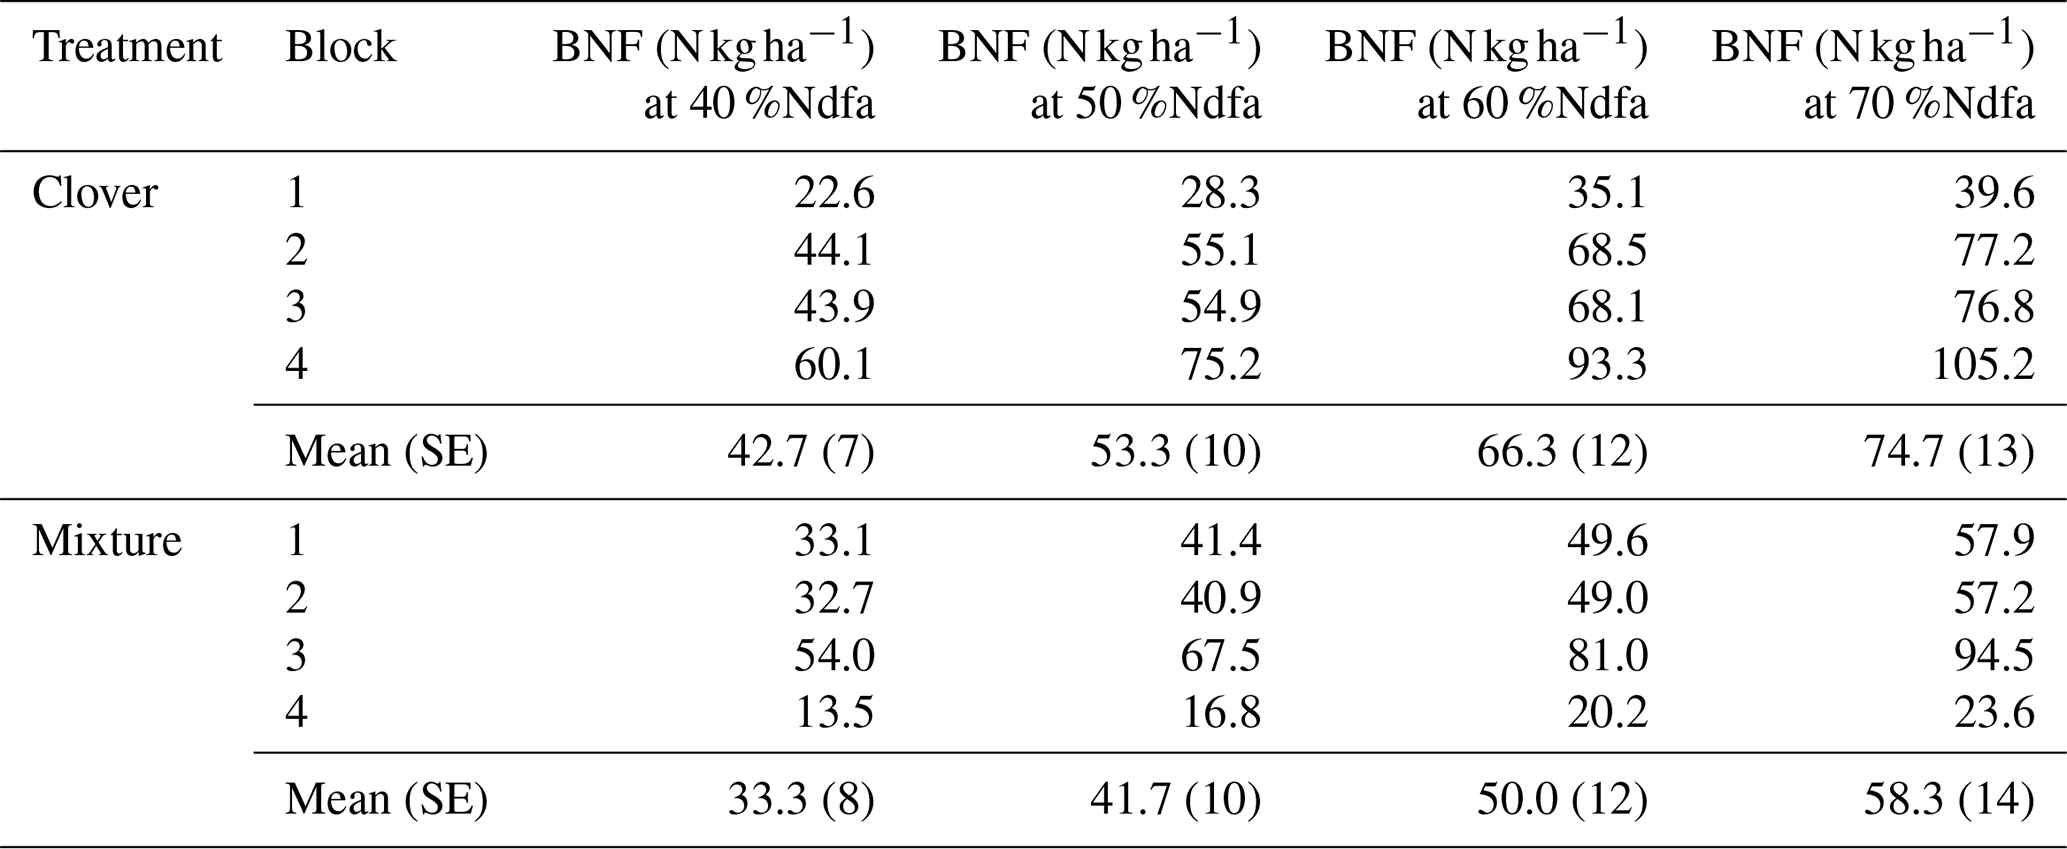
Using stable isotope methods at KBS, we estimated that the clover shoot N derived from fixation was 43.3 % when grown alone and 63.3 % when grown in mixture with rye, which we applied to estimates of N supply from BNF at both sites. There was a weakly significant effect of site (P=0.053) on N supplied by BNF in clover but no significant effect of treatment (P=0.704) and no significant interaction (P=0.936). Between sites, with mixture and clover treatments combined, aboveground N from BNF was 38 % higher at CF (49.5±7.3 kg N ha−1) than at KBS (30.6±3.5 kg N ha−1) (P=0.053). At KBS, BNF values in clover (29.2±6.0 kg N ha−1) and mixture (32.1±4.4 kg N ha−1) were not significantly different (P=0.677). Similarly, at CF, clover (46.2±8.3 kg N ha−1) and mixture (52.7±13.1 kg N ha−1) supplied similar BNF inputs (P=0.865). In a sensitivity analysis for BNF at CF spanning 40 %Ndfa–70 %Ndfa, N from fixation ranged from 42.7 to 74.7 kg N ha−1 for the sole clover treatment and from 33.3 to 58.3 kg N ha−1 for the clover in the mixture treatment (Table A3).
3.3 Effects of a legume–grass cover crop mixture on daily N2O emissions
In the repeated-measures model for daily N2O flux at CF, we found a significant effect of the cover crop treatment (P=0.070) and day (P<0.0001) and a significant interaction between the day and treatment (P=0.005). At KBS, there was a significant effect of the cover crop treatment (P=0.016) and day (P<0.0001). Individual ANOVA models for each sampling date at CF showed that N2O emissions were higher in the clover (4.5±0.5 g N2O-N ha−1), mixture (4.8±1.3 g N2O-N ha−1), and rye (7.7±2.2 g N2O-N ha−1) treatments than in fallow (1.2±0.3 g N2O-N ha−1) at the baseline sampling point prior to tillage (P=0.002). N2O emissions in the clover treatment peaked at 55.1±16.4 g N2O-N ha−1 6 d after incorporating the cover crops by tillage, whereas fluxes in the other treatments had started to decline (Fig. 2a). On day 6, emissions in the clover treatment were significantly higher than in fallow (16.8±6.2 g N2O-N ha−1) (P=0.032), whereas the mixture (21.0±3.5 g N2O-N ha−1) and rye (16.5±2.2 g N2O-N ha−1) treatments were not different from fallow. Emissions in the clover treatment remained elevated for the rest of the measurement period; however, the difference in emissions between clover, mixture, and rye treatments was not statistically significant on the last sampling date, 18 d after tillage (P=0.151) (Fig. 2a).
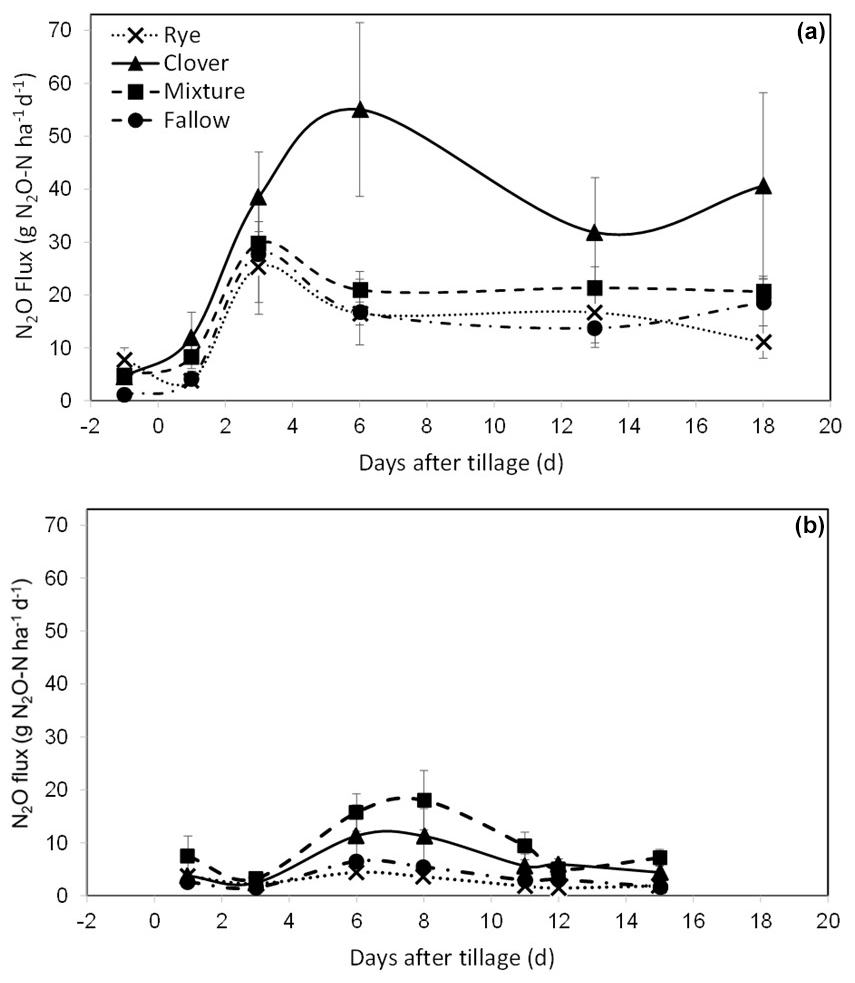
Figure 2(a) Mean net nitrous oxide (N2O) flux from the soil (with standard error) over 18 d at CF, measured once the day before () tillage on 23 May 2018 (d=0) and then five times following tillage and incorporation of cover crop biomass. (b) Mean net nitrous oxide (N2O) flux from the soil (with standard error) over 15 d at KBS, measured seven times following tillage on 26 May 2020 (d=0). The lines connecting the sampling points are intended to aid in visualizing treatment patterns for cumulative N2O and do not indicate continuous data collection (Eq. 2).
At KBS, N2O emissions were 5 times higher in the mixture (18.0±5.6 g N2O-N ha−1) than in rye (3.6±1.0 g N2O-N ha−1) at the peak flux 8 d after tillage (P=0.049) and were also 5 times higher in mixture (9.4±2.6 g N2O-N ha−1) than rye (1.8±0.4 g N2O-N ha−1) 11 d after tillage (P=0.018). At 12 d after tillage, emissions were 4 times higher in clover (5.9±1.1 g N2O-N ha−1) than rye (1.5±0.6 g N2O-N ha−1) (P=0.018). By the 15th and last day, clover (4.4±1.3 g N2O-N ha−1) and mixture (7.2±1.6 g N2O-N ha−1) were higher than rye (1.9±0.4 g N2O-N ha−1) and fallow (1.7±0.3 g N2O-N ha−1) (P=0.007) (Fig. 2b).
3.4 Cumulative N2O emissions
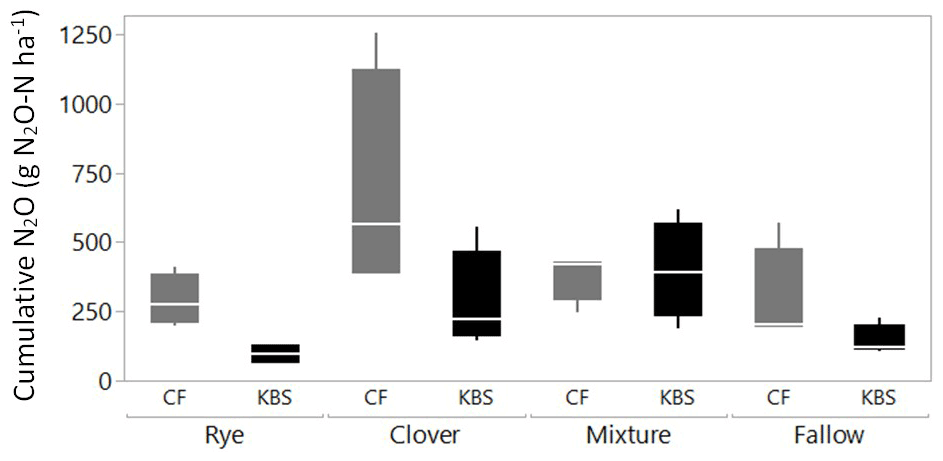
Both the cover crop treatment (P=0.002) and the site (P=0.004) had a significant effect on cumulative N2O emissions, with no significant interaction (P=0.138). The mean N2O flux following tillage was 1.8 times higher at CF (413.4±67.5 vs. 230.8±42.5 g N2O-N ha−1; P=0.004), which had both higher rates of potentially mineralizable N and larger free and occluded POM fractions (Fig. 3). On average across both sites, the clover (488.5±129.4 g N2O-N ha−1) and mixture (388±46.2 g N2O-N ha−1) treatments led to significantly higher emissions than rye (193.0±43.4 g N2O-N ha−1) and fallow (218.0±52.5 g N2O-N ha−1), with emissions more than 2.5 times higher and 2 times higher for clover and the mixture, respectively, than rye (P=0.002). Emissions from clover and mixture were statistically similar, and emissions from rye and fallow also did not differ significantly.

Figure 3Cumulative N2O plotted against fPOM (g kg−1), oPOM (g kg−1), and PMN ( per hectare per week) at both sites (KBS and CF). Open symbols are values by replicate block, and closed symbols are overall site means. Error bars represent standard error of the means for each site.
When evaluating treatment effects within each site, at CF, cumulative N2O flux tended to be lower in the fallow (291.5±92.0 g N2O-N ha−1), rye (288.9±48.1 g N2O-N ha−1), and clover–rye mixture (380.2±44.4 g N2O-N ha−1) treatments compared to clover grown alone (692.9±204.7 g N2O-N ha−1), although these differences were not statistically significant (P=0.112). At KBS, cumulative N2O fluxes were lower in the fallow (144.5±28.2 g N2O-N ha−1) and rye (97.1±18.3 g N2O-N ha−1) treatments compared to the clover–rye mixture (397.7±89.1 g N2O-N ha−1) and clover grown alone (284.1±91.5 g N2O-N ha−1) (P=0.008). At this site, the mixture and clover produced emissions 4 times higher and 3 times higher, respectively, than rye (Fig. 4).
3.5 N2O fluxes normalized by soil fertility indicators or cover crop biomass
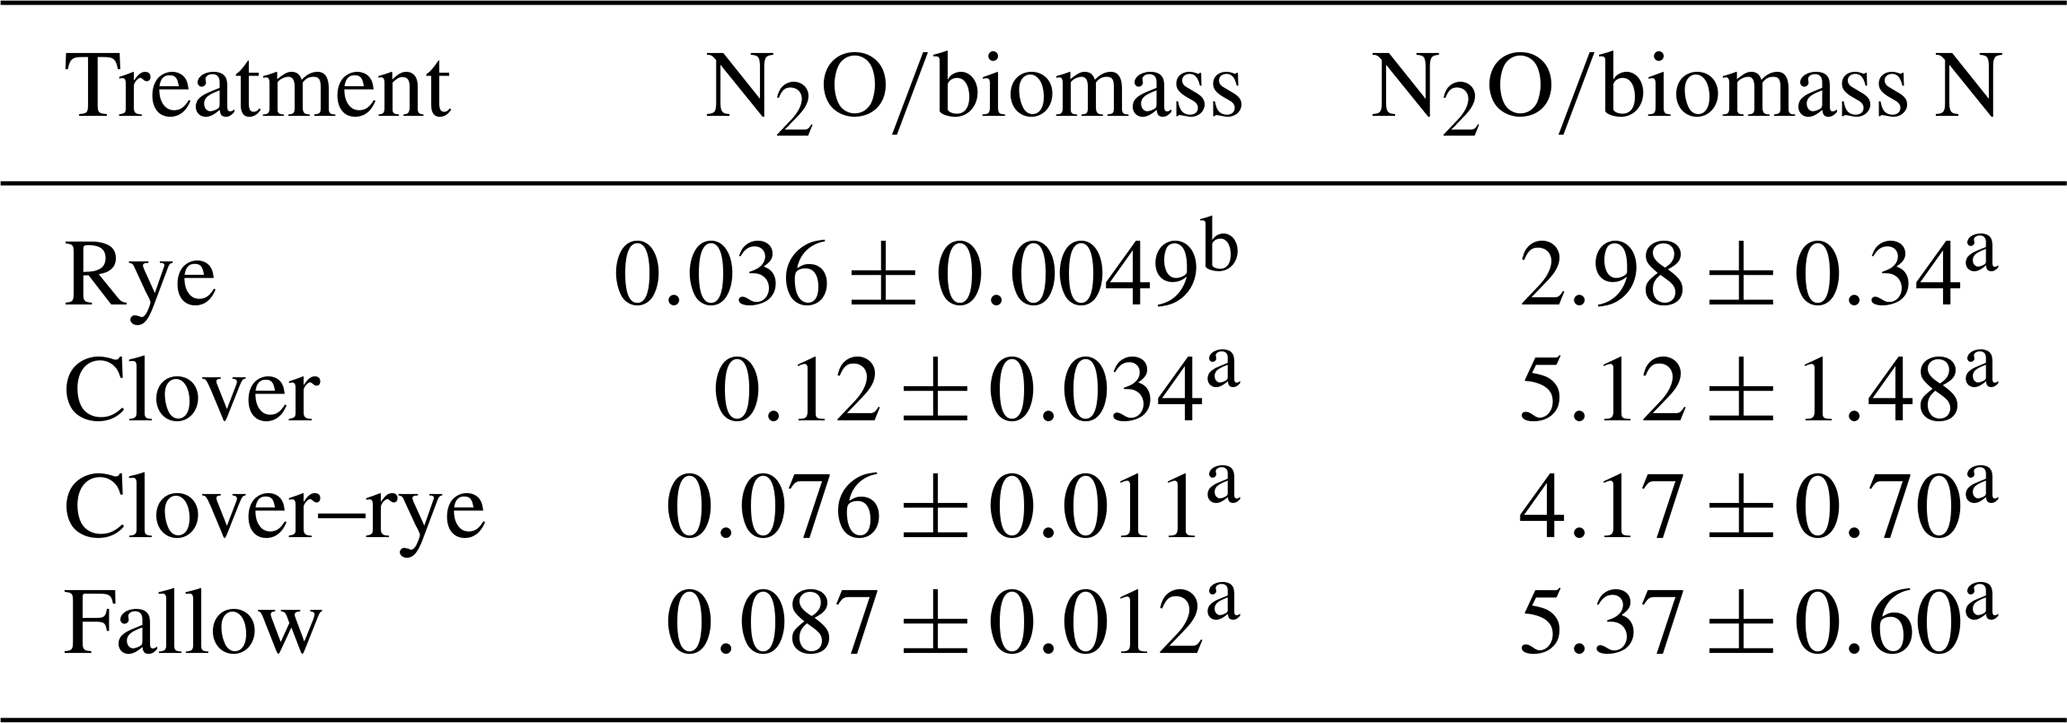
Given the contrasting soil fertility properties at the two experimental sites, we normalized N2O emissions by POM levels and PMN rates (i.e., cumulative N2O-to-POM or N2O-to-PMN ratios). When controlling for differences in soil fertility, all ratios had significant treatment effects, with clover resulting in the highest N2O emissions at CF and mixture producing the highest emissions at KBS (Table 3). There was no significant effect of site on cumulative N2O when expressed per unit fPOM or PMN. However, when normalizing for differences in oPOM, oPOM N, and fPOM N across sites, there was a significant site effect. Specifically, compared to KBS, mean N2O emissions at CF were 22 % higher when normalizing for oPOM (P=0.011), 43 % higher for oPOM N (P=0.001), and 26 % higher for fPOM N (P=0.027). When normalized by POM fractions or PMN, the cumulative N2O emissions across sites were 1.9–2.8 times higher in clover and mixture than in fallow or rye (Table 4). When N2O was normalized by cover crop biomass, the site was not significant (P=0.180), but we found a significant treatment effect (P=0.003) with lower emissions following rye than the other treatments. There was no effect of either treatment (P=0.171) or site (P=0.467) when expressing N2O emissions as a ratio of cover crop biomass N (Table 5). Daily N2O fluxes normalized by cover crop biomass and biomass N are presented in the Appendix (Table A2).
Table 3Mean ± standard error for ratios of grams of N2O per gram of POM and grams of N2O per kilogram of PMN by treatment and site. P values are indicated as follows: and for differences between treatments and a<0.05 for differences between sites.
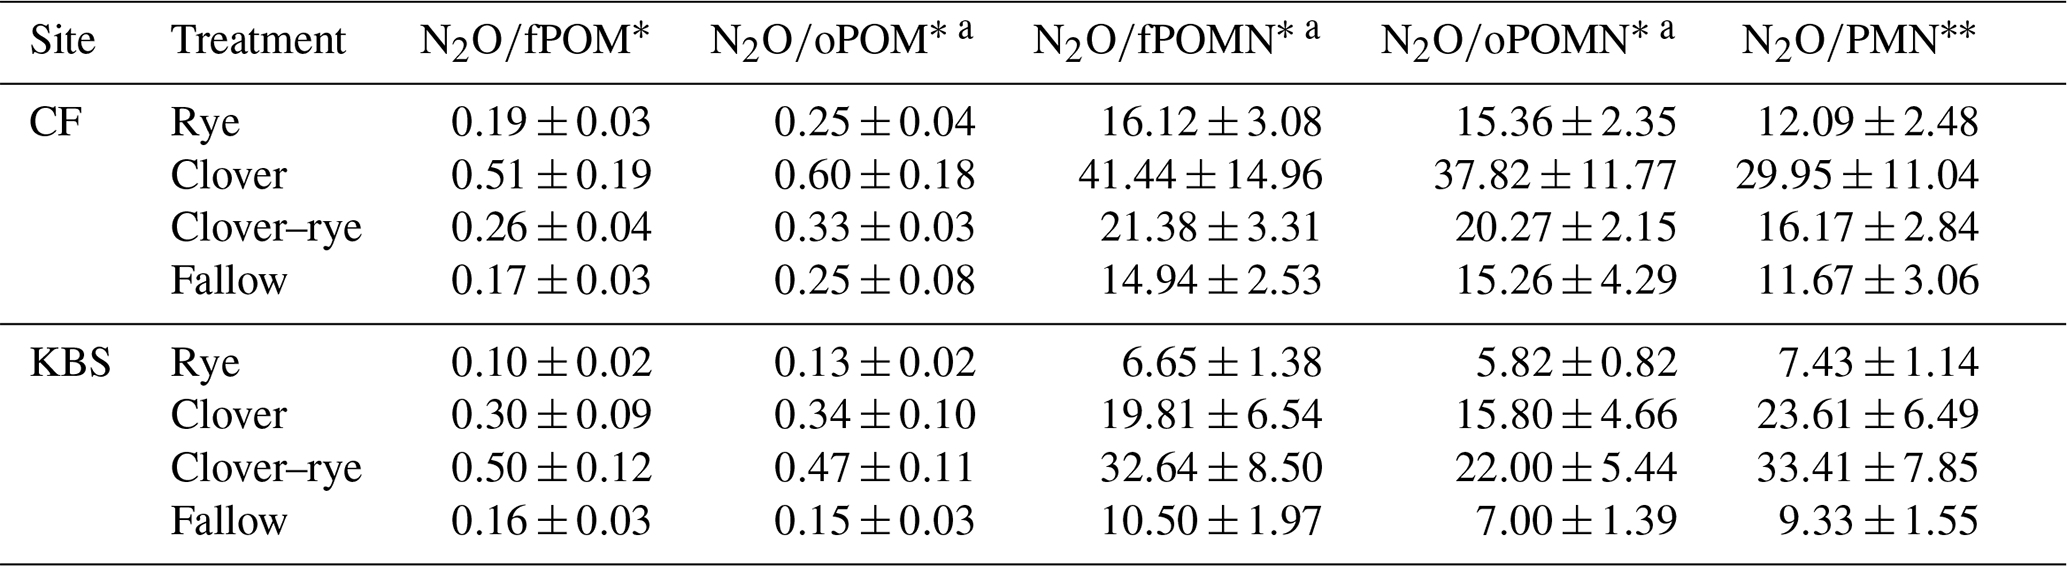
Table 4Mean ± standard error for ratios of grams of N2O per gram of POM and grams of N2O per kilogram of PMN averaged across both sites by treatment. Significant treatment differences are indicated by different letters.

Table 5Mean ± standard error for ratios of grams of N2O to kilograms of cover crop biomass and grams of N2O to kilograms of cover crop biomass N averaged across both sites by treatment. Significant treatment differences are indicated by different letters.
Reducing greenhouse gas emissions from agriculture is necessary to meet global targets for limiting climate change (IPCC, 2019). Generally, greenhouse gas emissions are greater from grain agroecosystems with fertilizer additions compared to legume N sources (Robertson et al., 2014; Han et al., 2017; Westphal et al., 2018) and are higher in rotations with only annual crops compared to those with perennial crops (Gelfand et al., 2016). Overwintering cover crops can help “perennialize” annual agroecosystems by providing continuous plant cover, building SOC (King and Blesh, 2018), and supporting related functions such as soil nutrient supply and storage. In diversified rotations with cover crops, however, N2O emissions can peak during the weeks following tillage when cover crop biomass is incorporated into the soil, increasing N mineralization rates (Han et al., 2017). There is growing evidence that small increases in cover crop functional diversity can simultaneously enhance multiple agroecosystem functions, including nutrient retention (Storkey et al., 2015; Blesh, 2017; Kaye et al., 2019). For instance, Storkey et al. (2015) found that low to intermediate levels of species richness (one to four species) provided an optimal balance of multiple ecosystem services when species exhibited contrasting functional traits related to growth habit and phenology. Our experiment tested whether increasing cover crop functional diversity with a legume–grass mixture, compared to a sole legume, would reduce pulse N2O emissions following cover crop incorporation by tillage at two field sites. Understanding these critical moments of N2O flux can inform decisions about how to adapt management of diversified cropping systems to reduce N losses and further reap their environmental benefits compared to fertilizer-based management practices.
4.1 Effects of a legume–grass cover crop mixture on N2O flux
The sampling period (15–18 d) of this experiment captured the first peak in N2O emissions following tillage of cover crop biomass at both sites. Our analysis of cover crop treatment effects on cumulative N2O emissions in this period shows the strong influence of biomass N inputs, particularly for the legume species, which supplied an external N source through BNF. When normalized for differences in soil fertility across sites, the clover and mixture treatments led to significantly higher pulse losses of N2O than rye or fallow (Table 4), providing strong evidence that BNF inputs from the treatments that included clover were a driving factor of N2O losses. While our study tested the role of legume N inputs, prior research, summarized in recent meta-analyses, has been dominated by studies with synthetic fertilizer and manure N sources (Han et al., 2017; Eagle et al., 2017; Basche et al., 2014). The only studies included in these meta-analyses that had legumes as the sole N source were Robertson et al. (2000) and Alluvione et al. (2010), both using tillage to terminate cover crops. Gelfand et al. (2016) extended the data reported in the Robertson et al. (2000) study by another decade and found that legume N sources did not significantly reduce N2O fluxes from soil compared to fertilizer N sources. Our findings contribute evidence that legume cover crops release more N2O compared to treatments without legumes, within the context of agroecosystems that have only received legume N inputs for several decades.
Despite clear differences between treatments with clover and those without, we did not find strong support for our hypothesis that the legume–grass mixture would reduce pulse N2O flux. This may be explained by the lack of difference in total BNF inputs between clover grown alone and in mixture within each site, as well as by the similar ratios of litter biomass in both treatments. Litter chemistry for both clover and mixture fell into the intermediate range (17.2–25.6) expected to lead to net N mineralization compared to the much higher in rye (31.5–44.1) across sites, which likely led to net N immobilization (Robertson and Groffman, 2015; Kramberger et al., 2009; Rosecrance et al., 2000). Indeed, the soil inorganic N concentration, which exerts a direct control on N2O flux (Robertson et al., 2000), increased at both sites over the sampling period and was significantly higher in clover compared to rye, while clover and mixture were not different.
When N2O fluxes were normalized by aboveground biomass N, emissions were the same for all treatments regardless of the source of N (internal cycling of soil N or external inputs of fixed N2). Furthermore, rye biomass N, which was 3-fold higher at CF than at KBS, corresponded to 1.6–2.6-times-higher N2O emissions at CF when normalized to control for differences in soil fertility across sites. BNF inputs in the clover treatment were 1.5 times higher at CF, which corresponded to 1.2–2.3-times-higher N2O emissions when normalized by soil fertility properties. Greater clover biomass in both treatments with clover at CF corresponded to significantly higher BNF inputs and N2O emissions at that site. However, when N2O fluxes were normalized by aboveground biomass, emissions were significantly lower following rye than the other treatments, including weeds in fallow, indicating that residue traits such as influence N2O emissions. Higher mean litter in the rye litter compared to the other treatments may have reduced N2O emissions per unit biomass input. These results reflect the importance of cover crop functional type and the impact of legume N fixation inputs on episodic N2O emissions, which is supported by prior studies showing that higher total N inputs lead to higher N mineralization rates and higher N2O fluxes (e.g., Han et al., 2017) and that legume cover crops can lead to pulse N2O fluxes following incorporation by tillage (Baggs et al., 2003; Millar et al., 2004; Basche et al., 2014).
Within each site, the specific treatment effects differed. At CF, the clover treatment produced the highest pulse of N2O, while at KBS, the mixture produced the highest flux, with the magnitude of the treatment effect being much more pronounced. N2O fluxes were 4 times higher following mixture than rye at KBS, compared to just over 2 times higher in clover than rye at CF, suggesting that the new N input from BNF was a stronger driver of treatment differences in the lower-fertility soil (KBS). At CF, the mixture slightly reduced cumulative N2O emissions compared to clover (380.2 vs. 692.9 g N2O-N ha−1), a difference which was likely ecologically meaningful even though it was not statistically significant. In contrast, at KBS, both treatments with clover produced significantly higher N2O emissions than the non-legume treatments.
In addition, differences between cover crop treatments may have been even greater at CF than our data suggest. We likely underestimated cumulative N2O emissions during the first peak following tillage at CF because emissions had not yet returned to the baseline, especially for the clover treatment. By extending our empirical measurements using regression models, we estimated the trajectory of N2O emissions to approximately 19–26 d after tillage depending on the cover crop treatment and replicate. Cumulative N2O emissions at CF could have reached 822.8±253.2 g N2O-N ha−1 in clover, 461.6±59.2 g N2O-N ha−1 in mixture, 340.4±63.4 g N2O-N ha−1 in rye, and 355.0±77.4 g N2O-N ha−1 in fallow. These higher estimates also further increase differences in cumulative N2O emissions between sites.
At both sites, the clover was competitive in mixture, representing just over half of the total stand biomass in this treatment. Although similar mixture composition allowed for better comparison of this treatment between sites, there is a need for future studies to assess a range of legume-to-grass ratios because mixture composition influences the quality of cover crop residue inputs to soil (Finney et al., 2016) and mixture evenness is related to agroecosystem multifunctionality (Blesh et al., 2019). For example, it is possible that if rye had produced more biomass in the mixture in our experiment, we would have observed lower N2O emissions in the mixture compared to the clover treatment at both sites.
4.2 Differences in N2O flux between sites
The different treatment patterns for daily emissions between sites, as well as the larger pulse emissions overall at CF, provide insights into mechanisms governing N2O fluxes following cover crop incorporation. Although new N inputs to agroecosystems are a primary driver of soil N2O emissions (e.g., Han et al., 2017; Robertson and Groffman, 2015), in our study mean BNF inputs did not significantly differ between clover and mixture treatments. Thus, the different baseline soil fertility levels and rhizosphere interactions that drive N mineralization likely played a key role in the contrasting effects of the mixture across sites. For instance, prior studies have found positive correlations between total SOC and N2O flux (Bouwman et al., 2002; Dhadli et al., 2016) and Basche et al. (2014) found that both SOC and cover crop biomass had a significant effect on denitrification potential and N2O emissions. These studies highlight the important role of ecosystem state factors that influence fertility, such as soil parent material and organic C content, in driving N2O emissions.
Here, we found approximately 2-fold-higher cumulative N2O fluxes at the site with larger soil POM fractions and higher POM N concentrations (CF) (Fig. 3), suggesting that POM fractions influence cover crop growth and N2O fluxes. POM fractions are robust indicators of soil fertility that respond to changes in management over shorter timescales than total SOM and play an important functional role in soil N cycling and N availability to crops (Wander, 2004; St. Luce et al., 2016). For instance, the CF site also had approximately 2-fold-higher rates of N mineralization (PMN) and 5-times-higher soil inorganic N concentrations compared to KBS. The total amount of soil N assimilated by cover crops (in the absence of external N inputs) is also an integrated indicator of soil inorganic N availability over the cover crop season. Rye aboveground biomass N was 3-fold higher at CF, while N in weed biomass in the fallow control was 2.3 times higher at CF than at KBS. In diversified agroecosystems, plant-mediated N acquisition from SOM pools can couple the release of inorganic N with plant N uptake in the rhizosphere (Paterson et al., 2006), making organic N inputs, such as those from legume residues, less susceptible to loss than inorganic fertilizer inputs (Drinkwater and Snapp, 2007). Cover crops in higher-fertility soils are thus likely to have higher net primary productivity and to release more root C into the soil, which increases microbial growth and turnover rates and mineralizes more soil N. The roots, in turn, take up more N and produce more biomass (Hodge et al., 2000; Paterson et al., 2006). This positive feedback loop may have led to the significantly higher cover crop biomass production at CF, which was especially pronounced in the rye treatment (7709 kg ha−1 at CF compared to 2842 kg ha−1 at KBS).
Mechanistically, interactions between background soil fertility and cover crop functional types likely drive soil inorganic N availability and N2O emissions. For instance, the highest N2O emissions measured in our study were from the clover treatment at CF, which had both the highest new N inputs to soil from BNF and the largest POM pools. This site also showed a small reduction in emissions with the legume–grass mixture. After clover incorporation, the large and relatively labile C and N input to soil, in combination with larger background POM pools, may have primed greater overall N mineralization at CF compared to KBS, with some of this N lost as N2O. Since corn had not yet become established during this 2-week period after tillage, there were no active roots to couple N release with N uptake, allowing soil inorganic N pools to increase (Table 2) and leaving a window of opportunity for N losses.
Even when controlling for fertility differences across sites (i.e., the analysis of N2O to POM or PMN ratios), we found that cumulative N2O emissions per unit oPOM, oPOM N, and fPOM N were significantly higher at CF. This site difference was highest for the oPOM N stock, with about 43 % more emissions per oPOM N at CF. Prior studies have shown that oPOM N is a strong indicator of SOM quality, N fertility, and soil inorganic N availability from microbial turnover of SOM (Marriott and Wander, 2006; Bu et al., 2015; Blesh, 2019). Our contrasting findings across experimental sites indicate a need for future studies that assess the effects of cover crops on N2O emissions across soils with a wide range of POM pool sizes.
4.3 Episodic N2O emissions following tillage of cover crops
To understand the relative importance of N2O fluxes following cover crop incorporation, it is important to interpret the magnitude of these episodic emissions within the context of N2O fluxes for a complete crop rotation. In a 20-year study in the biologically based cropping system in the MCSE at KBS (the KBS site in our experiment), Gelfand et al. (2016) reported mean annual N2O emissions of approximately 1.08 during a corn year, which was defined as the 380 d window between corn planting and soybean planting the following year. They also calculated an average of 2.2 over the course of the 3-year corn–soy–wheat crop rotation at this site (Gelfand et al., 2016). These values are likely a slight underestimate because their sampling did not include emissions during winter thaws and occurred every 2 weeks, potentially missing periods of high emissions. In a meta-analysis, Han et al. (2017) reported a similar average annual N2O flux of 2.3–3.1 for annual cropping systems with inorganic fertilizer additions.
Using the Gelfand et al. (2016) estimate of 1.08 , the 2-week cumulative flux we measured post-tillage of clover would represent 62.6 % of crop year emissions at CF and 26.3 % at KBS, while the flux following tillage of the mixture biomass would represent 33.9 % of the crop year estimate at CF and 37.8 % at KBS. Using the estimate of 2.2 for the complete crop rotation, the 2-week cumulative flux we measured post-tillage of clover would represent 30.7 % of annual emissions at CF and 12.9 % at KBS, while the flux following tillage of the mixture biomass is 16.7 % of that annual estimate at CF and 18.1 % at KBS. After incorporating sole clover biomass, the average daily flux was 37.6 at CF and 18.9 at KBS, and after mixture biomass, it was 20.4 at CF and 26.5 at KBS; these rates are approximately 3- to 12-fold greater than the mean daily flux reported for the organic cropping system at KBS (Gelfand et al., 2016). Taken together, these comparisons highlight the relative importance of episodic N2O emissions following tillage of cover crops.
Additionally, we used long-term measurements of N2O emissions from the biologically based cropping system at KBS as further context for interpreting our single-season results. Between 2014 and 2020, following the red clover cover crop, there were 3 different years in which N2O fluxes were measured roughly 2 weeks apart within a month after tillage. These 2-week periods of N2O emissions after incorporating red clover represented 19.9 %±2.1 % of the annual emissions from this cropping system (Robertson, 2020). These N2O measurements from past years at the KBS site were not collected until at least 8 d after tillage and likely missed the initial flux immediately following soil disturbance, which may explain why we found a slightly higher proportion of annual emissions (26.3 %) following clover incorporation at KBS. These historical data suggest that we indeed captured the peak N2O flux following soil disturbance by tillage in our 1-year experiment. Sampling frequently during the days and weeks following tillage of cover crops is therefore important for advancing knowledge of episodic emissions.
We tested the impacts of cover crop functional type on short-term N-cycling dynamics following tillage in the context of diversified agroecosystems that rely on legume N. Given that gaseous N fluxes are episodic, it is critical to understand how they are influenced by management practices during periods of high susceptibility to N losses. Overall, N2O flux was higher in the clover and mixture treatments than in rye and fallow when emissions were normalized by soil fertility properties. We found that the legume–grass cover crop led to a small reduction in N2O losses at CF but not at KBS. In contrast to our hypothesis, at KBS, the mixture led to higher N2O emissions than the clover treatment at the peak flux following tillage. We also found a more pronounced treatment effect at KBS, indicating that new N inputs from both treatments with legumes were a larger driver of N2O emissions at the site with lower soil fertility. Overall, the clover treatment at CF led to the highest emissions across sites, suggesting a synergistic effect of BNF inputs and soil fertility on N2O. These contrasting findings across sites shed light on the drivers of N2O losses following cover crop incorporation. Our results show that higher aboveground cover crop biomass can lead to higher N2O emissions during cover crop decomposition, particularly for cover crops that include legumes.
Table A1Means (standard error) for aboveground biomass, biomass nitrogen, and biological nitrogen fixation (BNF) by species across treatments at CF (a) and KBS (b).
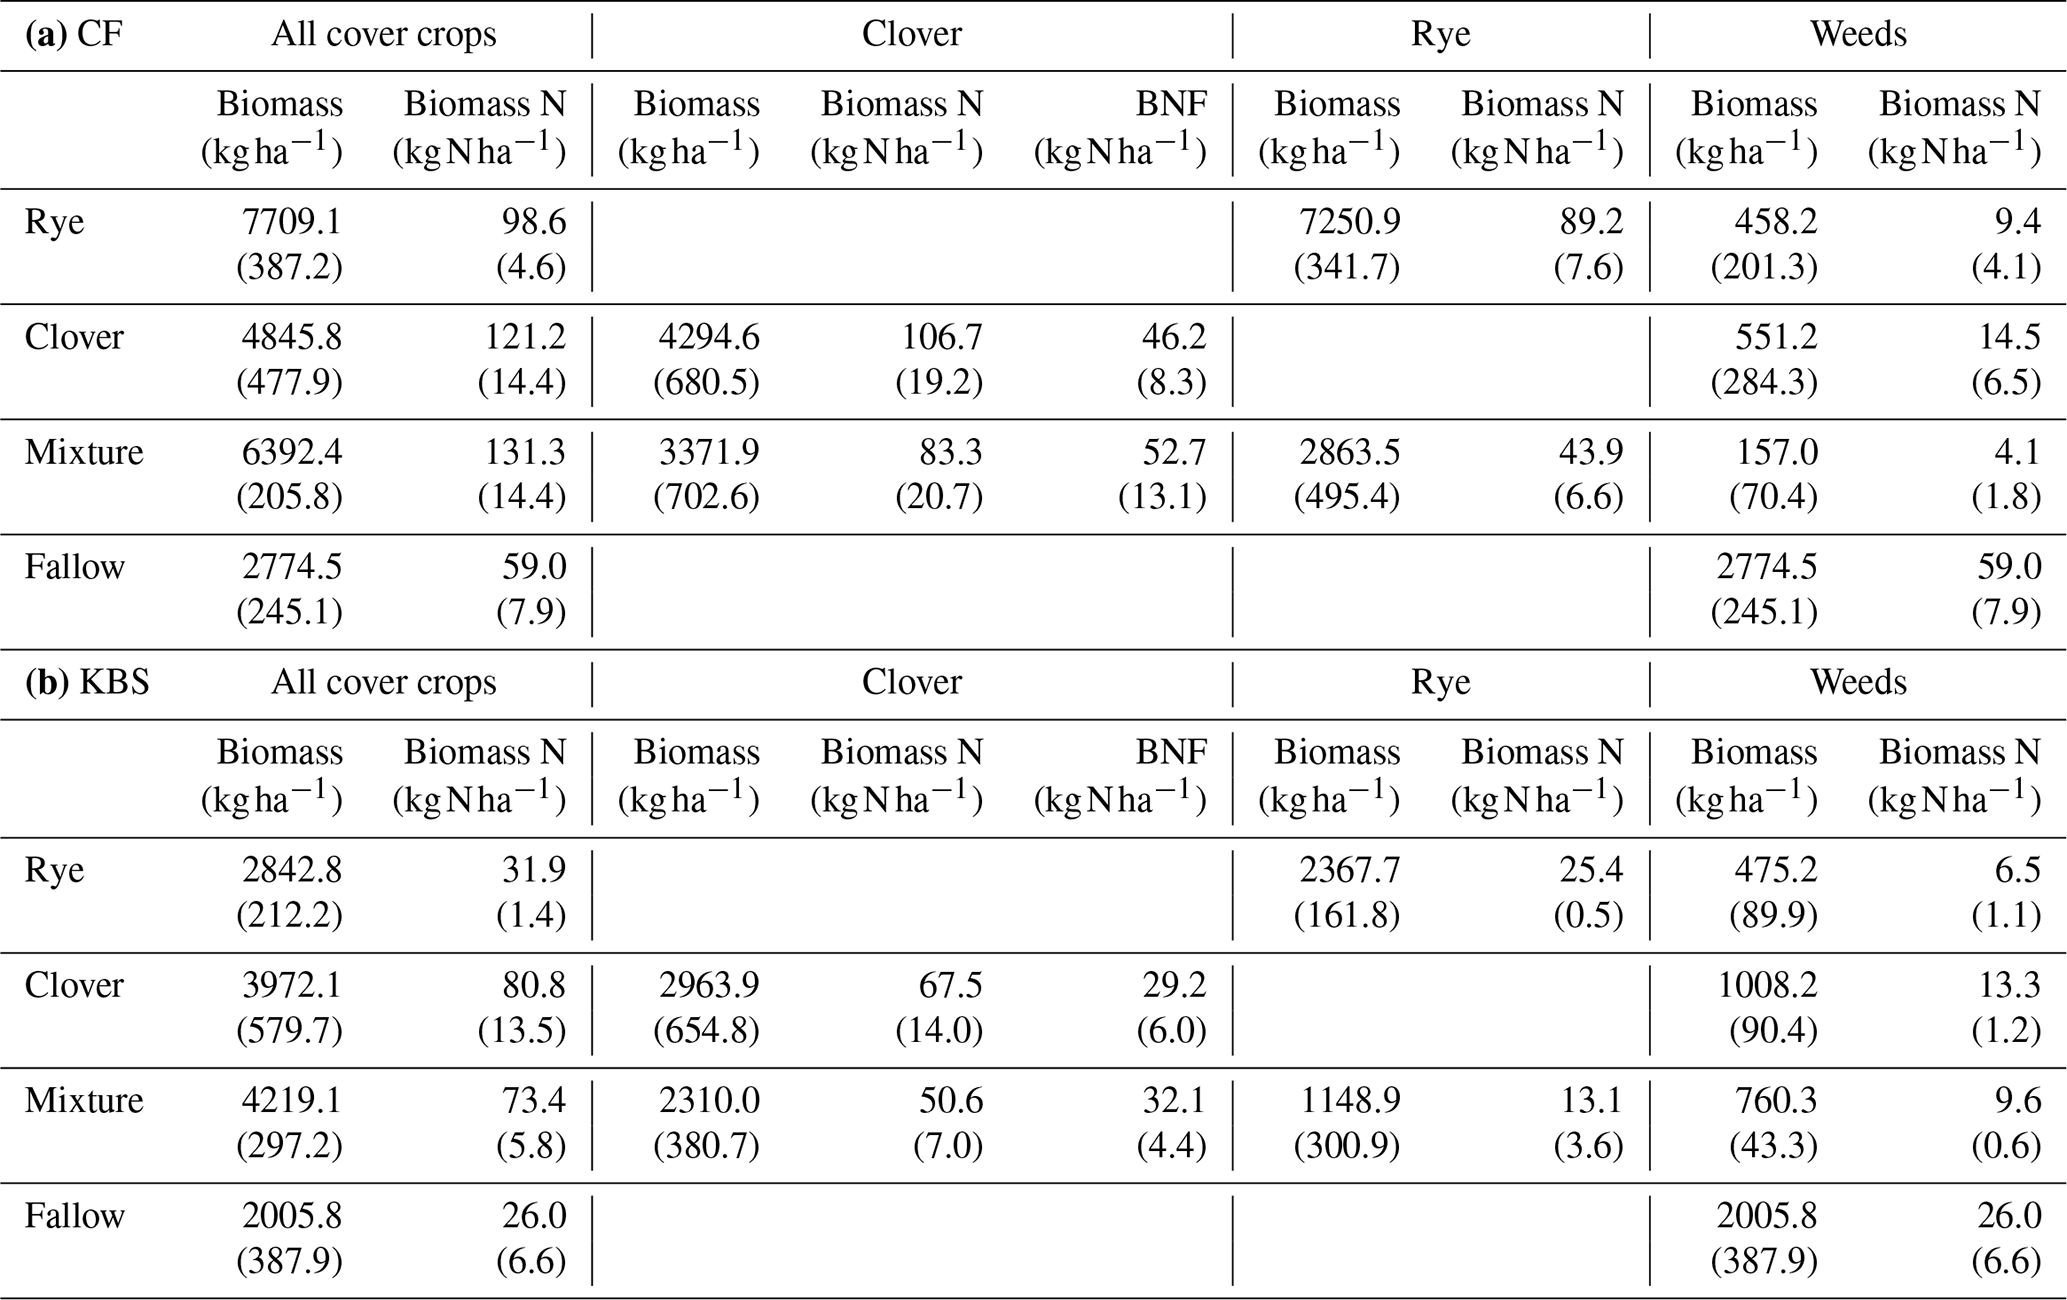
Table A2Means (standard error) for ratios of milligrams of N2O to kilograms of cover crop biomass (a) and for ratios of milligrams of N2O to kilograms of biomass N (b) by site and by treatment for each N2O sampling date (month/day/year).
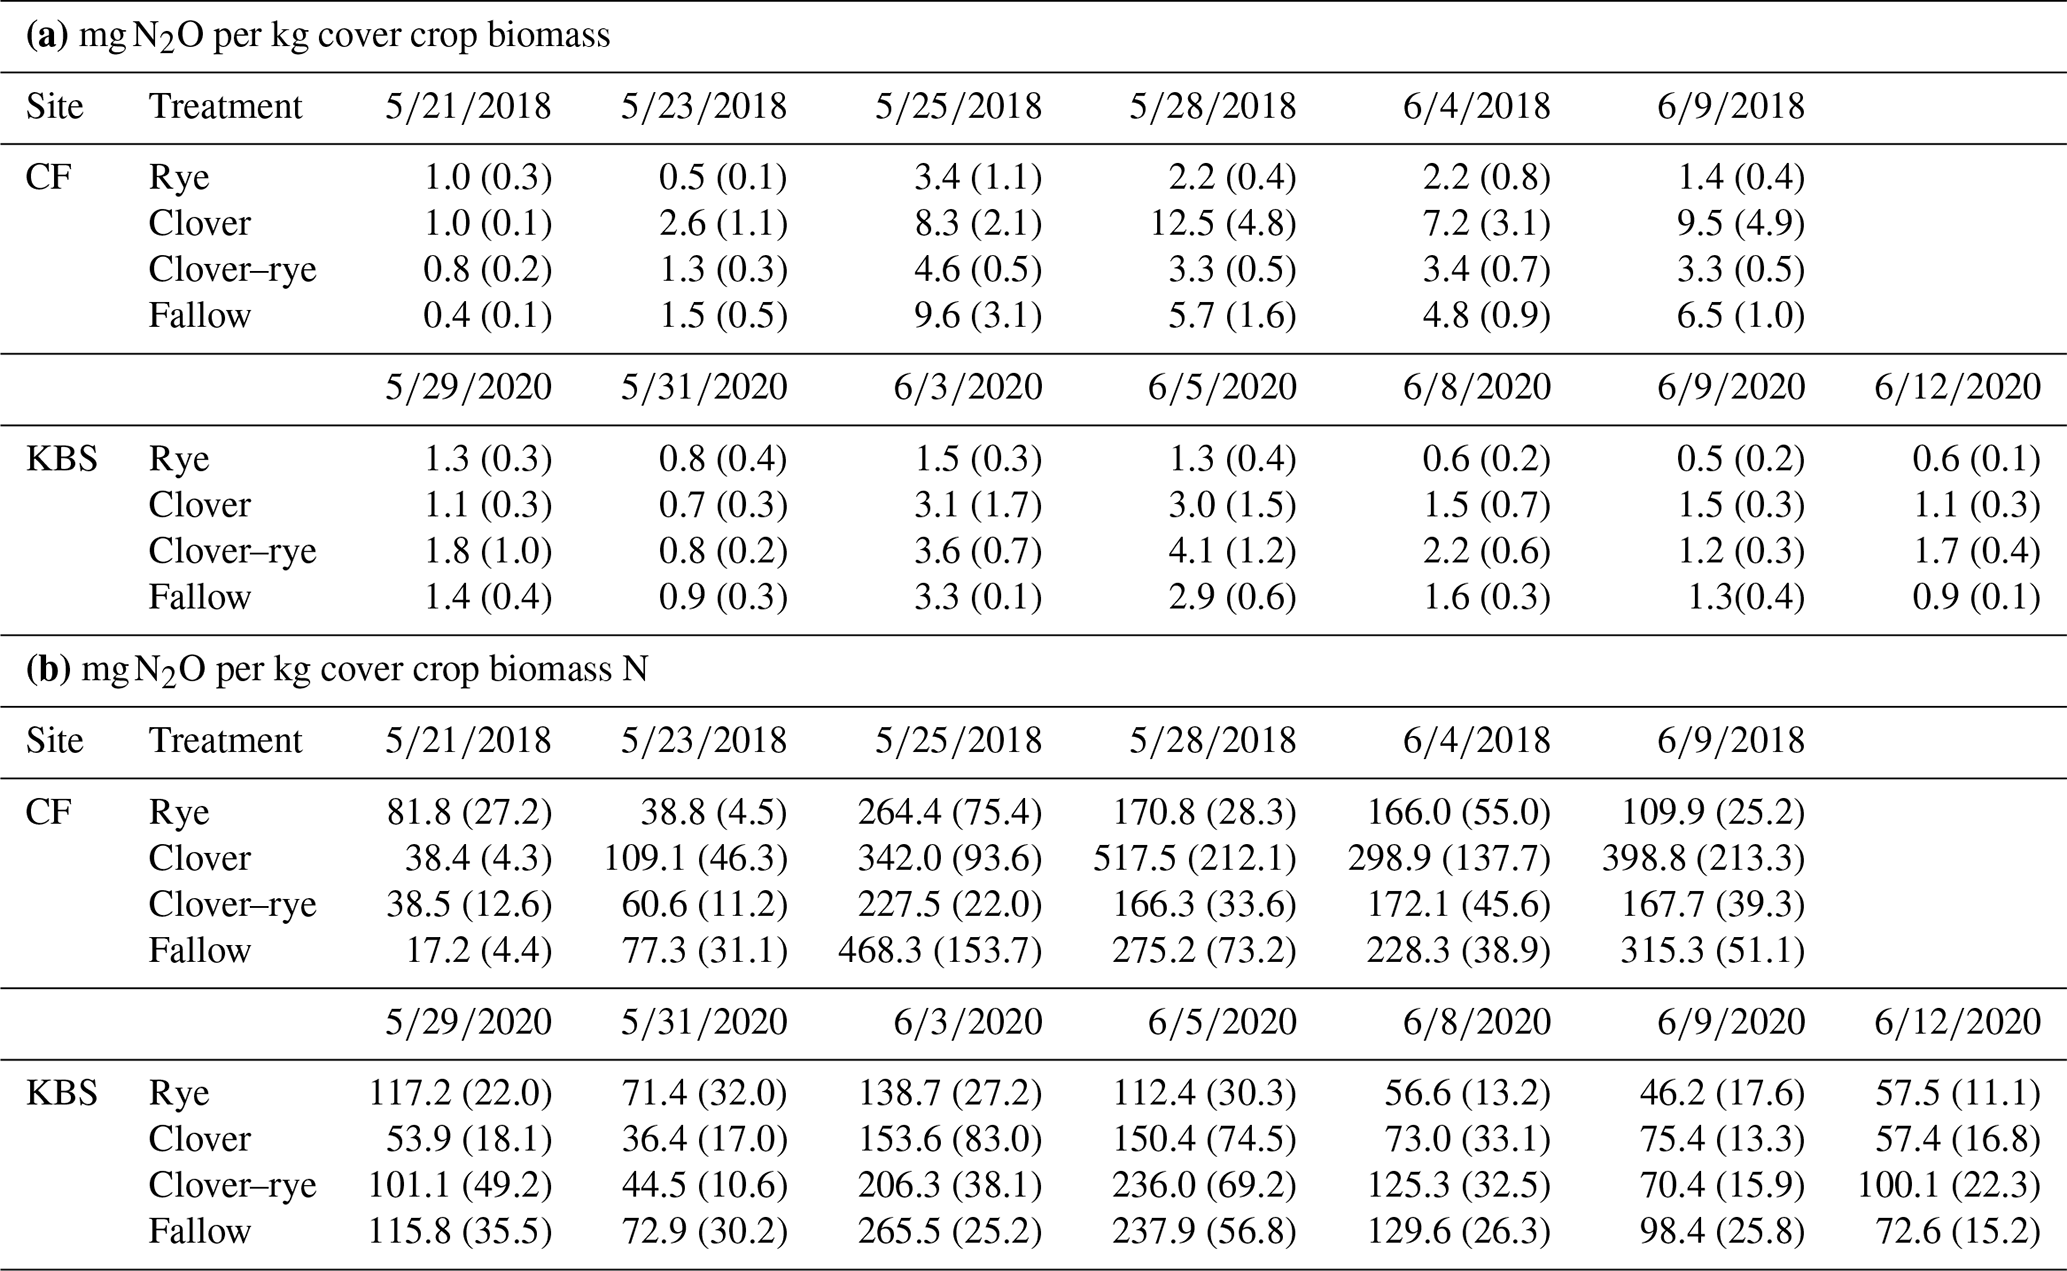
Table A3Sensitivity analysis for the CF site where we estimated BNF at 40 %Ndfa, 50 %Ndfa, 60 %Ndfa, and 70 %Ndfa for the clover grown alone and in mixture.
Data are available in Deep Blue repositories at https://doi.org/10.7302/hv7v-4378 (Bressler and Blesh, 2022).
AB and JB developed the research questions, experimental design, and methods. AB conducted the fieldwork and lab work and led data analysis with input from JB. AB and JB wrote and edited the manuscript.
The contact author has declared that neither of the authors has any competing interests.
Publisher's note: Copernicus Publications remains neutral with regard to jurisdictional claims in published maps and institutional affiliations.
We thank Brendan O'Neill and Kevin Kahmark for assistance with the N2O sampling protocol, Jeremy Moghtader and Joe Simmons for managing field operations, and Beth VanDusen for technical support in the field and the lab. We would also like to thank Dev Gordin, Kent Connell, Marta Plumhoff, Etienne Herrick, Luyao Li, Nicole Rhoads, Kristen Hayden, Danielle Falling, Riley Noble, Alice Elliott, Ben Iuliano, Dahlia Rockowitz, Ellie Katz, Naveen Jasti, and Nisha Gudal for assistance in the field and lab and Don Zak for input on a draft of the manuscript. Support for this research was also provided by the NSF Long-term Ecological Research program (DEB 1832042) at the Kellogg Biological Station and by Michigan State University AgBioResearch.
This work was supported by Research Funding for Conservation Studies from the Matthaei Botanical Gardens, University of Michigan; a Rackham Graduate Student Research Grant from the University of Michigan; and a United States Department of Agriculture (USDA) NIFA grant (award no. 2019-67019-29460).
This paper was edited by Lutz Merbold and reviewed by two anonymous referees.
Alluvione, F., Bertora, C., Zavattaro, L., and Grignani, C.: Nitrous oxide and carbon dioxide emissions following green manure and compost fertilization in corn, Soil Sci. Soc. Am. J., 74, 384–395, https://doi.org/10.2136/sssaj2009.0092, 2010.
Baggs, E. M., Stevenson, M., Pihlatie, M., Regar, A., Cook, H., and Cadisch, G.: Nitrous oxide emissions following application of residues and fertilizer under zero and conventional tillage, Plant Soil, 254, 361–370, https://doi.org/10.1023/A:1025593121839, 2003.
Basche, A. D., Miguez, F. E., Kasper, T. C., and Castellano, M. J.: Do cover crops increase or decrease nitrous oxide emissions? A meta-analysis, J. Soil Water Conserv., 69, 471–482, https://doi.org/10.2489/jswc.69.6.471, 2014.
Blesh, J.: Functional traits in cover crop mixtures: Biological nitrogen fixation and multifunctionality, J. Appl. Ecol., 55, 38–48, https://doi.org/10.1111/1365-2664.13011, 2017.
Blesh, J.: Feedbacks between nitrogen fixation and soil organic matter increase ecosystem functions in diversified agroecosystems, Ecol. Appl., e01986, https://doi.org/10.1002/eap.1986, 2019.
Blesh, J. and Drinkwater, L. E.: The impact of nitrogen source and crop rotation on nitrogen mass balances in the Mississippi River Basin, Ecol. Appl., 23, 1017–1035, https://doi.org/10.1890/12-0132.1, 2013.
Blesh, J., VanDusen, B. M., and Brainard, D. C.: Managing ecosystem services with cover crop mixtures on organic farms, Agron. J., 111, 1–15, https://doi.org/10.2134/agronj2018.06.0365, 2019.
Bressler, A. and Blesh, J.: Data from: Episodic N2O emissions following tillage of a legume-grass cover crop mixture, Deep Blue Data [data set], https://doi.org/10.7302/hv7v-4378, 2022.
Bouwman, A. F., Boumans, L. J. M., and Batjas, N. H.: Emissions of N2O and NO from fertilized fields: Summary of available measurement data, Global Biogeochem. Cy., 16, 1058, https://doi.org/10.1029/2001GB001811, 2002.
Bu, R., Lu, J., Ren, T., Liu, B., Li, X., and Cong, R.: Particulate organic matter affects soil nitrogen mineralization under two crop rotation systems, PLoS ONE, 10, e0143835, https://doi.org/10.1371/journal.pone.0143835, 2015.
Cheng, W.: Rhizosphere priming effect: Its functional relationships with microbial turnover, evapotranspiration, and C-N budgets, Soil Biol. Biochem., 41, 1795–1801, https://doi.org/10.1016/j.soilbio.2008.04.018, 2009.
Crum, J. R. and Collins, H. P.: KBS Soils. Kellogg Biological Station Long-term Ecological Research Special Publication, Zenodo, https://doi.org/10.5281/zenodo.2581504, 1995.
de Figueiredo, C. C., de Oliveira, A. D., Dos Santos, I. L., Ferreira, E. A. B., Malaquias, J. V., de Sá, M. A. C, de Carvalho, A. M., and Dos Santos Jr., J. D. G.: Relationships between soil organic matter pools and nitrous oxide emissions of agroecosystems in the Brazilian Cerrado, Sci. Total Environ., 618, 1572–1582, https://doi.org/10.1016/j.scitotenv.2017.09.333, 2018.
Dhadli, H., Brar, B. S., and Black, T. A.: N2O emissions in a long-term soil fertility experiment under maize-wheat cropping system in Northern India, Geoderma Reg., 7, 102–109, https://doi.org/10.1016/j.geodrs.2016.02.003, 2016.
Drinkwater, L. E. and Snapp, S. S.: Understanding and managing the rhizosphere in agroecosystems, in: The Rhizosphere: An Ecological Perspective, edited by: Cardon, Z. G. and Whitbeck, J. L., Elsevier Inc., 127–153, https://doi.org/10.1016/B978-0-12-088775-0.X5000-9, 2007.
Drinkwater, L. E., Cambardella, C. A., Redder, J. D., and Rice, C. W.: Potentially mineralizable nitrogen as an indicator of biologically active soil nitrogen, in: Methods for Assessing Soil Quality, SSSA Special Publication 49, Soil Science Society of America, Madison, WI, 1996.
Drinkwater, L. E., Wagoner, P., and Sarrantonio, M.: Legume-based cropping systems have reduced carbon and nitrogen losses, Nature, 396, 262–264, https://doi.org/10.1038/24376, 1998.
Eagle, A. J., Olander, L. P., Locklier, K. L., Heffernan, J. B., and Bernhardt, E. S.: Fertilizer management and environmental factors drive N2O and losses in corn: a meta-analysis, Soil Sci. Soc. Am. J., 81, 1191–1202, https://doi.org/10.2136/sssaj2016.09.0281, 2017.
Eagle, A. J., McLellan, E. L., Brawner, E. M., Chantigny, M. H., Davidson, E. A., Dickey, J. B., Linquist, B. A., Maaz, T. M., Pelster, D. E., Pittelkow, C. M., van Kessel, C., Vyn, T. J., and Cassman, K. G.: Quantifying on-farm nitrous oxide emission reductions in food supply chains, Earths Future, 8, e2020EF001504, https://doi.org/10.1029/2020EF001504, 2020.
Finney, D. M., White, C. M., and Kaye, J. P.: Biomass production and carbon/nitrogen ratio influence ecosystem services from cover crop Mixtures, Agron. J., 108, 39–52, https://doi.org/10.2134/agronj15.0182, 2016.
Gaillard, R., Duval, B. D., Osterholz, W. R., and Kucharik, C. J.: Simulated effects of soil texture on nitrous oxide emission factors from corn and soybean agroecosystems in Wisconsin, J. Environ. Qual., 45, 1540–1548, https://doi.org/10.2134/jeq2016.03.0112, 2016.
Gelfand, I., Shcherbak, I., Millar, N., Kravchenko, A. N., and Robertson, G. P.: Long-term nitrous oxide fluxes in annual and perennial agricultural and unmanaged ecosystems in the upper Midwest USA, Glob. Change Biol., 22, 3594–3607, https://doi.org/10.1111/gcb.13426, 2016.
Gomes, J., Bayer, C., Costa, F. D., Piccolo, M. D., Zanatta, J. A., Vieira, F. C. B., and Six, J.: Soil nitrous oxide emissions in long-term cover crops-based rotations under subtropical climate, Soil Till. Res., 106, 35–44, https://doi.org/10.1016/j.still.2009.10.001, 2009.
Han, Z., Walter, M. T., and Drinkwater, L. E.: N2O emissions from grain cropping systems: a meta-analysis of the impacts of fertilizer-based and ecologically-based nutrient management strategies, Nutr. Cycl. Agroecosys., 107, 335–355, https://doi.org/10.1007/s10705-017-9836-z, 2017.
Hodge, A., Stewart, J., Robinson, D., Griffiths, B. S., and Fitter, A. H.: Competition between roots and soil micro-organisms for nutrients from nitrogen-rich patches of varying complexity, J. Ecol., 88, 150–164, http://www.jstor.org/stable/2648492 (last access: 27 June 2022), 2000.
Huang, Y., Zou, J. W., Zheng, X. H., Wang, Y. S., and Xu, X. K.: Nitrous oxide emissions as influenced by amendment of plant residues with different C:N ratios, Soil Biol. Biochem., 36, 973–981, https://doi.org/10.1016/j.soilbio.2004.02.009, 2004.
IPCC: Climate Change and Land: an IPCC special report on climate change, desertification, land degradation, sustainable land management, food security, and greenhouse gas fluxes in terrestrial ecosystems, edited by: Shukla, P. R., Skea, J., Calvo Buendia, E., Masson-Delmotte, V., Pörtner, H.-O., Roberts, D. C., Zhai, P., Slade, R., Connors, S., van Diemen, R., Ferrat, M., Haughey, E., Luz, S., Neogi, S., Pathak, M., Petzold, J., Portugal Pereira, J., Vyas, P., Huntley, E., Kissick, K., Belkacemi, M., and Malley, J., in press, 2019.
Kahmark, K., Millar, N., and Robertson, G. P.: Greenhouse gas fluxes – static chamber method. Michigan State University Kellogg Biological Station, https://lter.kbs.msu.edu/protocols/113 (last access: 27 June 2022), 2018.
Kallenbach, C. M., Wallentein, M. D., Schipanski, M. E., and Grandy, A. S.: Managing agroecosystems for soil microbial carbon use efficiency: ecological unknowns, potential outcomes, and a path forward, Front. Microbiol., 10, 1146, https://doi.org/10.3389/fmicb.2019.01146, 2019.
Kaye, J., Finney, D., White, C., Bradley, B., Schipanski, M., Alonso-Ayuso, M., Hunter, M., Burgess, M., and Mejia, C.: Managing nitrogen through cover crop species selection in the U. S. mid-Atlantic, PLoS ONE, 14, e0215448, https://doi.org/10.1371/journal.pone.0215448, 2019.
King, A. E. and Blesh, J.: Crop rotations for increased soil carbon: perenniality as a guiding principle, Eco. Appl., 28, 249–261, https://doi.org/10.1002/eap.1648, 2018.
Kramberger, B., Gselman, A., Janzekovic, M., Kaligaric, M., and Bracko, B.: Effects of cover crops on soil mineral nitrogen and on the yield and nitrogen content of corn, Eur. J. Agron., 31, 103–109, https://doi.org/10.1016/j.eja.2009.05.006, 2009.
Marriott, E. E. and Wander M. M.: Total and labile soil organic matter in organic and conventional farming systems, Soil Sci. Soc. Am. J., 70, 950–959, https://doi.org/10.2136/sssaj2005.0241, 2006.
McDaniel, M. D., Tiemann, L. K., and Grandy, A. S.: Does agricultural crop diversity enhance soil microbial biomass and organic matter dynamics? A meta-analysis, Ecol. Appl., 24, 560–570, https://doi.org/10.1890/13-0616.1, 2014.
Millar, N., Ndufa, J. K., Cadisch, G., and Baggs, E. M.: Nitrous oxide emissions following incorporation of improved-fallow residues in the humid tropics, Global Biogeochem. Cy., 18, GB1032, https://doi.org/10.1029/2003GB002114, 2004.
Millar, N., Robertson, G. P., Grace, P. R., Gehl, R., and Hoben, J.: Nitrogen fertilizer management for nitrous oxide (N2O) mitigation in intensive corn (maize) production: an emissions reduction protocol for US Midwest agriculture, Mitig. Adapt. Strat. Gl., 15, 185–204, https://doi.org/10.1007/s11027-010-9212-7, 2010.
Norskov, J. and Chen, J.: Sustainable Ammonia Synthesis, US DoE Round Table Report, https://www.osti.gov/servlets/purl/1283146 (last access: 27 June 2022), 2016.
Paterson, E., Sim, A., Standing, D., Dorward, M., and McDonald, A. J. S.: Root exudation from hordeum vulgare in response to localized nitrate supply, J. Exp. Bot., 57, 2413–2420, https://doi.org/10.1093/jxb/erj214, 2006.
Robertson, G.: Trace Gas Fluxes on the Main Cropping System Experiment at the Kellogg Biological Station, Hickory Corners, MI (1991 to 2019) ver 46, Environmental Data Initiative, https://doi.org/10.6073/pasta/b1feb30692eb31b7f8a27615d18e0fa8, 2020.
Robertson, G. P. and Groffman, P. M.: Nitrogen transformations, in: Soil Microbiology, Ecology, and Biochemistry, 4th edn., edited by: Paul, E. A., Academic Press, Burlington, MA, 421–446, https://doi.org/10.1016/B978-0-12-415955-6.00014-1, 2015.
Robertson, G. P. and Vitousek, P. M.: Nitrogen in agriculture: balancing the cost of an essential resource, Annu. Rev. Env. Resour., 34, 97–125, https://doi.org/10.1146/annurev.environ.032108.105046, 2009.
Robertson, G. P., Paul, E. A., and Harwood, R. R.: Greenhouse gases in intensive agriculture: contributions of individual gases to the radiative forcing of the atmosphere, Am. Assoc. Adv. Sci., 289, 1922–1925, http://www.jstor.org/stable/3077685 (last access: 27 June 2022), 2000.
Robertson, G. P., Gross, K. L., Hamilton, S. K., Landis, D. A., Schmidt, T. M., Snapp, S. S., and Swinton, S. M.: Farming for ecosystem services: an ecological approach to production agriculture, Bioscience, 64, 404–415, https://doi.org/10.1093/biosci/biu037, 2014.
Rosecrance, R. C., McCarty, G. W., Shelton, D. R., and Teasdale, J. R.: Denitrification and N mineralization from hairy vetch (Vicia villosa Roth) and rye (Secale cereale L.) cover crop monocultures and bicultures, Plant Soil, 227, 283–290, https://doi.org/10.1023/A:1026582012290, 2000.
Ruser, R., Fuß, R., Andres, M., Hegewald, H., Kesenheimer, K., Köbke, S., Räbiger, T., Suarez Quinones, T., Augustin, J., Christen, O., Dittert, K., Kage, H., Lewandowski, I., Prochnow, A., Stichnothe, H., and Flessa, H.: Nitrous oxide emissions from winter oilseed rape cultivation, Agr. Ecosyst. Environ., 249, 57–69, https://doi.org/10.1016/j.agee.2017.07.039, 2017.
Shearer, G. and Kohl, D. H.: N2-fixation in field settings: Estimations based on natural 15N abundance, Aust. J. Plant Physiol., 13, 699–756, https://doi.org/10.1071/PP9860699, 1986.
St. Luce, M., Whalen, J. K., Ziadi, N., and Zebarth, B. J.: Net nitrogen mineralization enhanced with the addition of nitrogen rich particulate organic matter, Geoderma, 262, 112–118, https://doi.org/10.1016/j.geoderma.2015.08.017, 2016.
Storkey, J., Doring, T., Baddeley, J., Collins, R., Roderick, S., Jones, H., and Watson, C.: Engineering a plant community to deliver multiple ecosystem services, Ecol. Appl., 25, 1034–1043, https://doi.org/10.1890/14-1605.1, 2015.
Syswerda, S. P., Basso, B., Hamilton, S. K., Tausig, T. B., and Robertson, G. P.: Long-term nitrate loss along an agricultural intensity gradient in the Upper Midwest USA, Agr. Ecosyst. Environ., 149, 10–19, https://doi.org/10.1016/j.agee.2011.12.007, 2012.
Tiemann, L. K., Grandy, A. S., Atkinson, E. E., Marin-Spiotta, E., and McDaniel, M. D.: Crop rotational diversity enhances belowground communities and functions in agroecosystems, Ecol. Lett., 18, 761–771, https://doi.org/10.1111/ele.12453, 2015.
Unkovich, M., Herridge, D., Peoples, M., Cadisch, G., Boddey, B., Giller, K., Alves, B., and Chalk, P. M.: Measuring plant-associated nitrogen fixation in agricultural systems, Australian Centre for International Agricultural Research, Canberra, Australia, http://hdl.handle.net/102.100.100/121643?index=1 (last access: 27 June 2022), 2008.
USEPA: Global Anthropogenic Non-CO2 Greenhouse Gas Emissions: 1990–2030, Office of Atmospheric Programs (EPA 430-R-12-006), Climate Change Division, Washington, D.C., 2012.
USEPA: Inventory of U. S. Greenhouse Gas Emissions and Sinks: 1990–2019 (430-R-21-005), Agriculture, Washington, D.C., 2021.
Wagner-Riddle, C., Baggs, E. M., Clough, T. J., Fuchs, K., and Peterson, S. O.: Mitigation of nitrous oxide emissions in the context of nitrogen loss reduction from agroecosystems: managing hot spots and hot moments, Curr. Opin. Env. Sust., 47, 46–53, https://doi.org/10.1016/j.cosust.2020.08.002, 2020.
Wander, M.: Soil organic matter fractions and their relevance to soil function, in: Soil Organic Matter in Sustainable Agriculture, edited by: Magdoff, F. and Weil, R. R., CRC Press, Boca Raton, FL, 67–102, https://doi.org/10.1201/9780203496374, 2004.
Westphal, M., Tenuta, M., and Entz, M. H.: Nitrous oxide emissions with organic crop production depends on fall soil moisture, Agr. Ecosyst. Environ., 254, 41–49, https://doi.org/10.1016/j.agee.2017.11.005, 2018.
White, C. M., DuPont, S. T., Hautau, M., Hartman, D., Finney, D. M., Bradley, B., LaChance, L. C., and Kaye, J. P.: Managing the trade-off between nitrogen supply and retention in cover crop mixtures, Agr. Ecosyst. Environ., 237, 121–133, https://doi.org/10.1016/j.agee.2016.12.016, 2017.