the Creative Commons Attribution 4.0 License.
the Creative Commons Attribution 4.0 License.
 | 13 Jul 2022
The European forest carbon budget under future climate conditions and current management practices
Roberto Pilli
Ramdane Alkama
Alessandro Cescatti
Werner A. Kurz
Giacomo Grassi
To become carbon neutral by 2050, the European Union (EU27) net carbon sink from forests should increase from the current level of about −360 to −450 Mt CO2eq yr−1 by 2050. Reaching this target requires additional efforts, which should be informed by the expected interactions between current age-class distributions, the effect of forest management practices and the expected impacts of future climate change. However, modelling the combined effect of these drivers is challenging, since it requires a mechanistic assessment of climate impacts on primary productivity and heterotrophic respiration and a detailed representation of the forest age structure and of the management practices across the entire EU. To achieve this goal, we combined the output provided by four land–climate models – run under two different Representative Concentration Pathway scenarios (RCP2.6 and RCP6.0) – to parameterize the input data used in an empirical forest growth model. This hybrid modelling approach aims to quantify the impact of climate change and forest management on the long-term (i.e. to 2100) evolution of the EU27 + UK forest carbon budget. This approach was tested using a business-as-usual (BAU) scenario, based on the continuation of the management practices applied by EU member states within the historical period 2000–2015. We emphasize that our study does not explore a specific policy scenario but describes a methodological framework.
Our results highlight that, under our BAU case, the EU27 + UK forest C sink would decrease to about −250 Mt CO2eq yr−1 in 2050 and −80 Mt CO2eq yr−1 by 2100. The main driver of the long-term evolution of the forest C sink is the ongoing ageing process of the European forests, mostly determined by past and ongoing management. In addition, climate change may further amplify or mitigate this trend. Due to the large uncertainty in climate projections, in 2050 the net C sink may range from −100 to −400 Mt CO2eq yr−1 under RCP2.6 and from −100 to −300 Mt CO2eq yr−1 under RCP6.0. These results suggest that while a change in management practices would be needed to reverse an otherwise declining trend in the sink, climate change adds a considerable uncertainty, potentially nearly doubling or halving the sink associated with management.
- Article
(9643 KB) - Full-text XML
-
Supplement
(2648 KB) - BibTeX
- EndNote


The key role of forests to meet the Paris Agreement's climate targets is widely recognized by the scientific community (IPCC, 2019). This is also relevant for major industrialized countries, where the carbon uptake by forests, including preserving or strengthening the carbon sink and the use of wood to substitute other emissions-intensive materials, will be crucial to compensate any remaining emissions from industrial and agricultural sectors (Dugan et al., 2021). To become carbon neutral by 2050, on top of a drastic decarbonization of the energy, transport and industrial sectors, the European Union (EU27) net sink from forest land should increase to about −450 Mt CO2eq yr−1 by 2050 (EC, 2020a). Considering the recent evolution of this sink – declining from about −410 Mt CO2eq in the period 2010–2012 (excluding harvested wood products; HWPs) to about −360 Mt CO2eq in 2016–2018 – a new regulation for the land use, land-use change and forestry (LULUCF) sector has been proposed (EC, 2021b) to stimulate additional efforts for reversing the current trend. The emerging debate on the role of forests in climate change mitigation requires comprehensive analyses on the expected evolution of the forest sink over the next decades (Verkerk et al., 2020).
The short-term evolution of the forest C sink is directly determined by forest management practices and stochastic natural disturbances, which determine forest composition and age structure (Pilli et al., 2016). However, assessing the impact of forest management practices is challenging because of the uncertainties linked to policy and economic drivers, which directly affect the future harvest rate (see Grassi et al., 2018). For this reason, various studies based on empirical forest stand growth models may provide different, and sometimes opposite, results (Skytt et al., 2021). For example, Nabuurs et al. (2017) estimated that the EU28 forest C sink could potentially increase by about 172 Mt CO2 yr−1 by 2050. In contrast, Jonsson et al. (2021), based on different methodological assumptions and harvest scenarios, estimated a reduction in the EU28 forest C sink by 50 to 180 Mt CO2 yr−1 in 2030, compared to 2015. Even assuming the same harvest level – e.g. a business-as-usual (BAU) scenario based on constant harvest – similar models may produce different results because of different assumptions about the management strategies applied at the local level, which may, in turn, also affect the long-term evolution of the age-class distribution (Blujdea et al., 2021a). Therefore, determining a common, possibly “neutral”, management scenario that represents a benchmark for the development of further management strategies is also challenging (Pukkala, 2020).
When assessing the long-term evolution of the forest C sink, we also need to consider the scientific uncertainties about the evolution of environmental drivers (i.e. temperature, precipitation and atmospheric CO2 concentration) and their impact on future forest growth (including, for example, species composition and frequency of natural disturbances) and the increasing expectations placed on forests by the ongoing EU policy initiatives (Mubareka et al., 2022). These include not only the climatic policy, where wood removals are part of a climate-neutral bioeconomy, but also the EU biodiversity strategy, where the old-growth forests play a key role (EC, 2020b).
Modelling all these drivers is clearly challenging. For modelling the medium- to short-term evolution of these variables, empirical forest stand growth models are generally best suited (Nabuurs et al., 2000; Böttcher et al., 2008). These models, however, by simulating the forest growth based on past observations, cannot easily determine the potential variations in primary productivity induced by climate changes (Cuddington et al., 2013). On the other hand, modelling the long-term evolution of the forest C sink to identify large-scale management strategies under climate change conditions generally requires the use of process-based climate models, grounded in ecological theories. These models, however, generally miss detailed information on management practices and forest conditions, as determined from direct field measurements (Pretzsch et al., 2008).
A compromise solution is to build a meta-modelling framework that merges the strategic information provided by process-based models, with the accuracy provided by empirical models (Cuddington et al., 2013).
Here we aim to investigate the medium- to long-term (i.e. 2050 and beyond) evolution of the forest C sink, as affected by the complex interactions between climatic variables and forest ecosystems. Due to the uncertainty about the future evolution of environmental variables and the relative impact of these variables on forest growth and mortality, we determine a range of outcomes by combining different climatic scenarios and process-based models. The main objective of our study is to quantify the EU carbon sink dynamics as affected by climate change, forest management and disturbances under the business-as-usual scenario that is used to test our modelling framework. We emphasize that our study does not explore a specific policy scenario but describes a methodological framework. To achieve this, we downscale the output provided by a process-based modelling framework to the empirical growth functions and management practices applied by a stand-level forest growth model. This meta-modelling approach uses state-of-the-art modelling tools to analyse the combined impacts of climate change and forest management on the long-term (i.e. to 2100) evolution of the forest carbon budget of the EU (hereafter including the EU27 member states and the UK), under a scenario of continuation of the current management practices.
2.1 Modelling framework
The modelling framework used in this study, summarized in Fig. S1 (see the Supplement), integrates statistics of land carbon fluxes from the Inter-Sectoral Impact Model Intercomparison Project (ISIMIP2b, Warszawski et al., 2013), which combines dynamic global vegetation models (DGVMs) and process-based climate models, in the parameterization of the empirical yield curves used within a forest carbon budget model (CBM-CFS3, Carbon Budget Model of the Canadian Forest Sector; see Kurz et al., 2009, and Sect. B in the Supplement). Specifically, we used outputs from the LPJ-GUESS DGVM (Lund–Potsdam–Jena General Ecosystem Simulator; Smith et al., 2014), which is the only model in ISIMIP that provides all the required variables (i.e. forest net growth and frequency of fires). This DGVM model is forced by six different climate variables (2 m air temperature, precipitation, incoming solar radiation, incoming long-wave radiation, surface wind and humidity) coming from four different process-based climate models (IPSL-CM5, Institut Pierre Simon Laplace Coupled Model, Dufresne et al., 2013; GFDL, Geophysical Fluid Dynamics Laboratory Global Atmosphere and Land Model, Zhao et al., 2018; HadGEM2, Hadley Centre Global Environmental Model version 2, Collins et al., 2011; and MIROC 5.2, Model for Interdisciplinary Research on Climate, Kawamiya et al., 2020), which were run under the Coupled Model Intercomparison Project Phase 5 (CMIP5). In the ISIMIP framework, this climate forcing is interpolated to a 0.5∘ × 0.5∘ spatial resolution and then bias-corrected to ensure long-term statistical agreement with the observation-based forcing data (Warszawski et al., 2013). This combination of climate simulations and the LPJ-GUESS DGVM from ISIMIP2b was used to predict the annual variation in net forest growth and frequency of fires, in the period 2016–2100, compared to the historical period 2000–2015, which was assumed as the reference period within this overall modelling framework. The net forest growth was estimated as the annual change in the total carbon in vegetation biomass. Losses from fires are included in the DGVM simulations but not from harvest, while both harvest and fires are included in the CBM simulations. Each simulation was run under two different Representative Concentration Pathway scenarios for greenhouse gases, RCP2.6 and RCP6.0, as defined by Taylor et al. (2012) and including the CO2 fertilization effect.
As in other studies (see for example Sun and Mu, 2014), to explore the impact of climate change on forest ecosystems, we combined the carbon in vegetation (cveg) simulated at the level of plant functional types (PFTs) from LPJ-GUESS, with the forest types (FTs) considered by CBM, distinguished between broadleaved and coniferous groups. This aggregation is made according to the spatial distribution of the climatic units (CLUs, defined from specific values of MAT – mean annual temperature – and total annual precipitation) considered within the CBM model (Pilli et al., 2018). Using this approach, the DGVM input (MAT) and output (cveg as a proxy for net growth and fire area as a proxy for frequency of fires) can be directly and consistently integrated with the forest growth model.
In particular, the MAT of each CLU was assumed to be constant until 2015 (equal to the average of the MAT values of the historical period as considered from each climate model; see Fig. S3 in the Supplement) and varying by year – compared to the average of the historical period – from 2016 onward (see Fig. S4 in the Supplement). This variable affects the decay rates of dead organic matter (DOM) within the CBM model run.
Based on the annual biomass carbon stock per hectare estimated from each LPJ-GUESS simulation, we estimated the relative annual stock change from 2016 onward, compared to the average of the historical period. We derived from this parameter a set of growth multipliers (GMs, further distinguished between broadleaved species and conifers and scaled at the CLU level) for each country directly proportional to the relative variation in the biomass stock as estimated from LPJ-GUESS under each RCP. Starting from 2016, these GMs were applied in CBM to the species-specific growth functions derived from national forest inventory (NFI) increment data. In this way, the relative net growth of each FT in CBM varies according to the impact of climatic conditions as predicted by LPJ-GUESS. In a few cases, where data from process-based models were missing (e.g. for coniferous species in Portugal and Ireland), the GMs were derived from other conterminous regions with similar climatic conditions (see Figs. S5 and S6 in the Supplement).
CO2 emissions due to fires provided from LPJ-GUESS and further scaled at the CLU level were used as a proxy to estimate the relative variation in burned area considered by CBM from 2016 onward for six Mediterranean countries, in comparison to the average burned area of the historical period (see Fig. S7 in the Supplement). Other natural disturbances, such as windstorms and bark beetle outbreaks, were not accounted in this analysis because the current modelling framework is still rather uncertain in representing the rates of change in these disturbance types under climate change.
The CBM model was preliminarily calibrated according to the annual harvest rate reported for the historical period 2000–2015 from each EU27 member state plus the UK and excluding Malta and Cyprus, where no detailed data are available. All FTs considered by CBM were spatially distributed between 35 CLUs and assigned to broadleaved or coniferous groups, according to the leading species reported from the countries' NFI data. The calibration was performed at the country level, defining a set of species-specific silvicultural treatments applied to each FT (i.e. thinning and clear-cutting for even-aged forests, partial cutting for uneven-aged forests, etc.) in order to satisfy the historical harvest demand as defined for each country. For further details on the CBM model parameterization, we refer to Sect. B in the Supplement.
2.2 Defining a business-as-usual scenario for forest management
For forest management, defining a business-as-usual scenario means assuming the continuation, beyond 10 to 15 years into the future, of the current management practices and policies. To achieve this objective, we used the same approach proposed for the definition of the Forest Reference Level within Regulation EU 2018/841 (Vizzarri et al., 2021). This approach can be considered a “business-as-usual” continuation of the forest management practices documented within a certain period of time, defined as the reference period (RP; see Grassi et al., 2018). This approach is based on a country-specific assessment of specific forest management practices, characteristics and age-related dynamics. As such, it can inherently incorporate the impact of polices and markets enhanced during the RP, excluding at the same time any additional assumption of the possible impact of future policy and market scenarios (Grassi et al., 2018).
In the present study, after the calibration stage, we quantified for each country the intensity (in terms of proportion of available biomass harvested for each FT and management type; see Grassi et al., 2018) of each management practice applied during the historical period 2000–2015 (RP for our study). The same intensity was applied to the amount of biomass available for wood supply within the following simulation period 2016–2100 (see Grassi et al., 2018). This is, in turn, determined from the evolution of the age-class distribution, linked to the natural ageing process of forests and to the specific management practices applied at the country level. Thus, the absolute harvest level applied from 2016 to 2100 was not linked to some policy scenario or preliminarily defined as a constant amount of biomass, but it may vary according to the theoretical evolution of the age-class distribution within each country.
The CBM model was run, for each country, informed by the output (growth multipliers and area burnt) derived from each LPJ-GUESS simulation, for both RCP scenarios (i.e. eight climate runs per country). One additional model run was simulated as reference scenario (RS) to compare the LPJ-GUESS outputs with a benchmark, excluding any additional effect of climate change (see Fig. S1).
2.3 Ecosystem indicators
To quantify the combined effect of climatic impacts and management activities on forest ecosystems, we identified a series of key variables derived from the CBM model runs. From an ecosystem perspective, the yearly sum of all biomass production is estimated as net primary production (NPP), equal to the difference between the carbon assimilated by plants through photosynthesis (i.e. the gross primary production, GPP) and the carbon released by plants through autotrophic respiration (Ra; see Kirschbaum et al., 2001). CBM does not quantify photosynthesis and autotrophic respiration, but the model indirectly estimates NPP as the sum of net growth (NG), which is the net biomass increment before losses from disturbances (i.e. it is a measure of biomass C-stock change) plus the biomass turnover (TO), i.e. the growth that replaces material lost due to biomass turnover, during the year (Kurz et al., 2009):
The net ecosystem production (NEP) is defined as the difference between GPP and the total ecosystem respiration (Chapin et al., 2006). The CBM model estimates NEP by subtracting from NPP all the C losses due to heterotrophic respiration (Rh, i.e. decomposition):
In the modelling framework applied in the present study, both growth rates and decomposition rates are modified during the model run to account for the effects of climate change.
The overall ecosystem C balance is the net biome production (NBP), which is the difference between NEP and the direct losses due to harvest (H) and natural disturbances (D, e.g. fires):
The CBM model calculates NBP as the total ecosystem stock change, estimated in annual time steps, as gains from net growth increment and losses from the ecosystem due to decay, direct atmospheric emissions caused by fires and transfers to the products sector (Kurz et al., 2009). Harvest transfers are directly linked to the continuation of management practices applied within the historical period; fire emissions vary during the model run – at least for Mediterranean countries – informed by output from climate models. No other disturbance event was considered for the period 2016–2100.
All main model outputs were compared with the reference scenario (RS) to estimate the average annual rate of variation for each RCP derived from the four climate models and the corresponding range of variation, defined as the interval between the minimum and the maximum difference with the RS.
Section 3.1 reports an overview of the main forest ecosystem indicators within the historical period 2000–2015 (RP), as modelled by CBM, and summarizes the simulated evolution of these parameters until 2100 within the RS. Section 3.2 reports the main differences between the RS and the RCP scenarios, highlighting the additional effects of climate change on each ecosystem driver. The combined effect of the continuation of the current management practices, as defined within the RS, and climate change on the overall EU27 + UK net CO2 forest emissions is presented on Sect. 3.3.
3.1 Reference scenario: historical and long-term evolution
Net growth (NG) is a key variable determining the evolution of all the main ecosystem indicators under different management regimes and climatic conditions. Within the historical period 2000–2015 NG is equal on average to 1.7 and 1.6 t C ha−1 yr−1 for broadleaved and coniferous species, respectively. Since these values represent net biomass increment before losses from disturbances, they are also directly proportional to the net annual increment (NAI) reported from NFI data and used to initialize the CBM model. This explains the lower values generally estimated for Mediterranean and northern European countries and the higher values estimated for central European regions and Ireland, at least for conifers (see upper panels of Fig. 1). Indeed, despite the methodological differences between various European countries (Tomter et al., 2016), the NAI reported from Mediterranean countries and northern European countries is generally lower than the NAI reported from central European countries (e.g. Lanz and Marchetti, 2020).
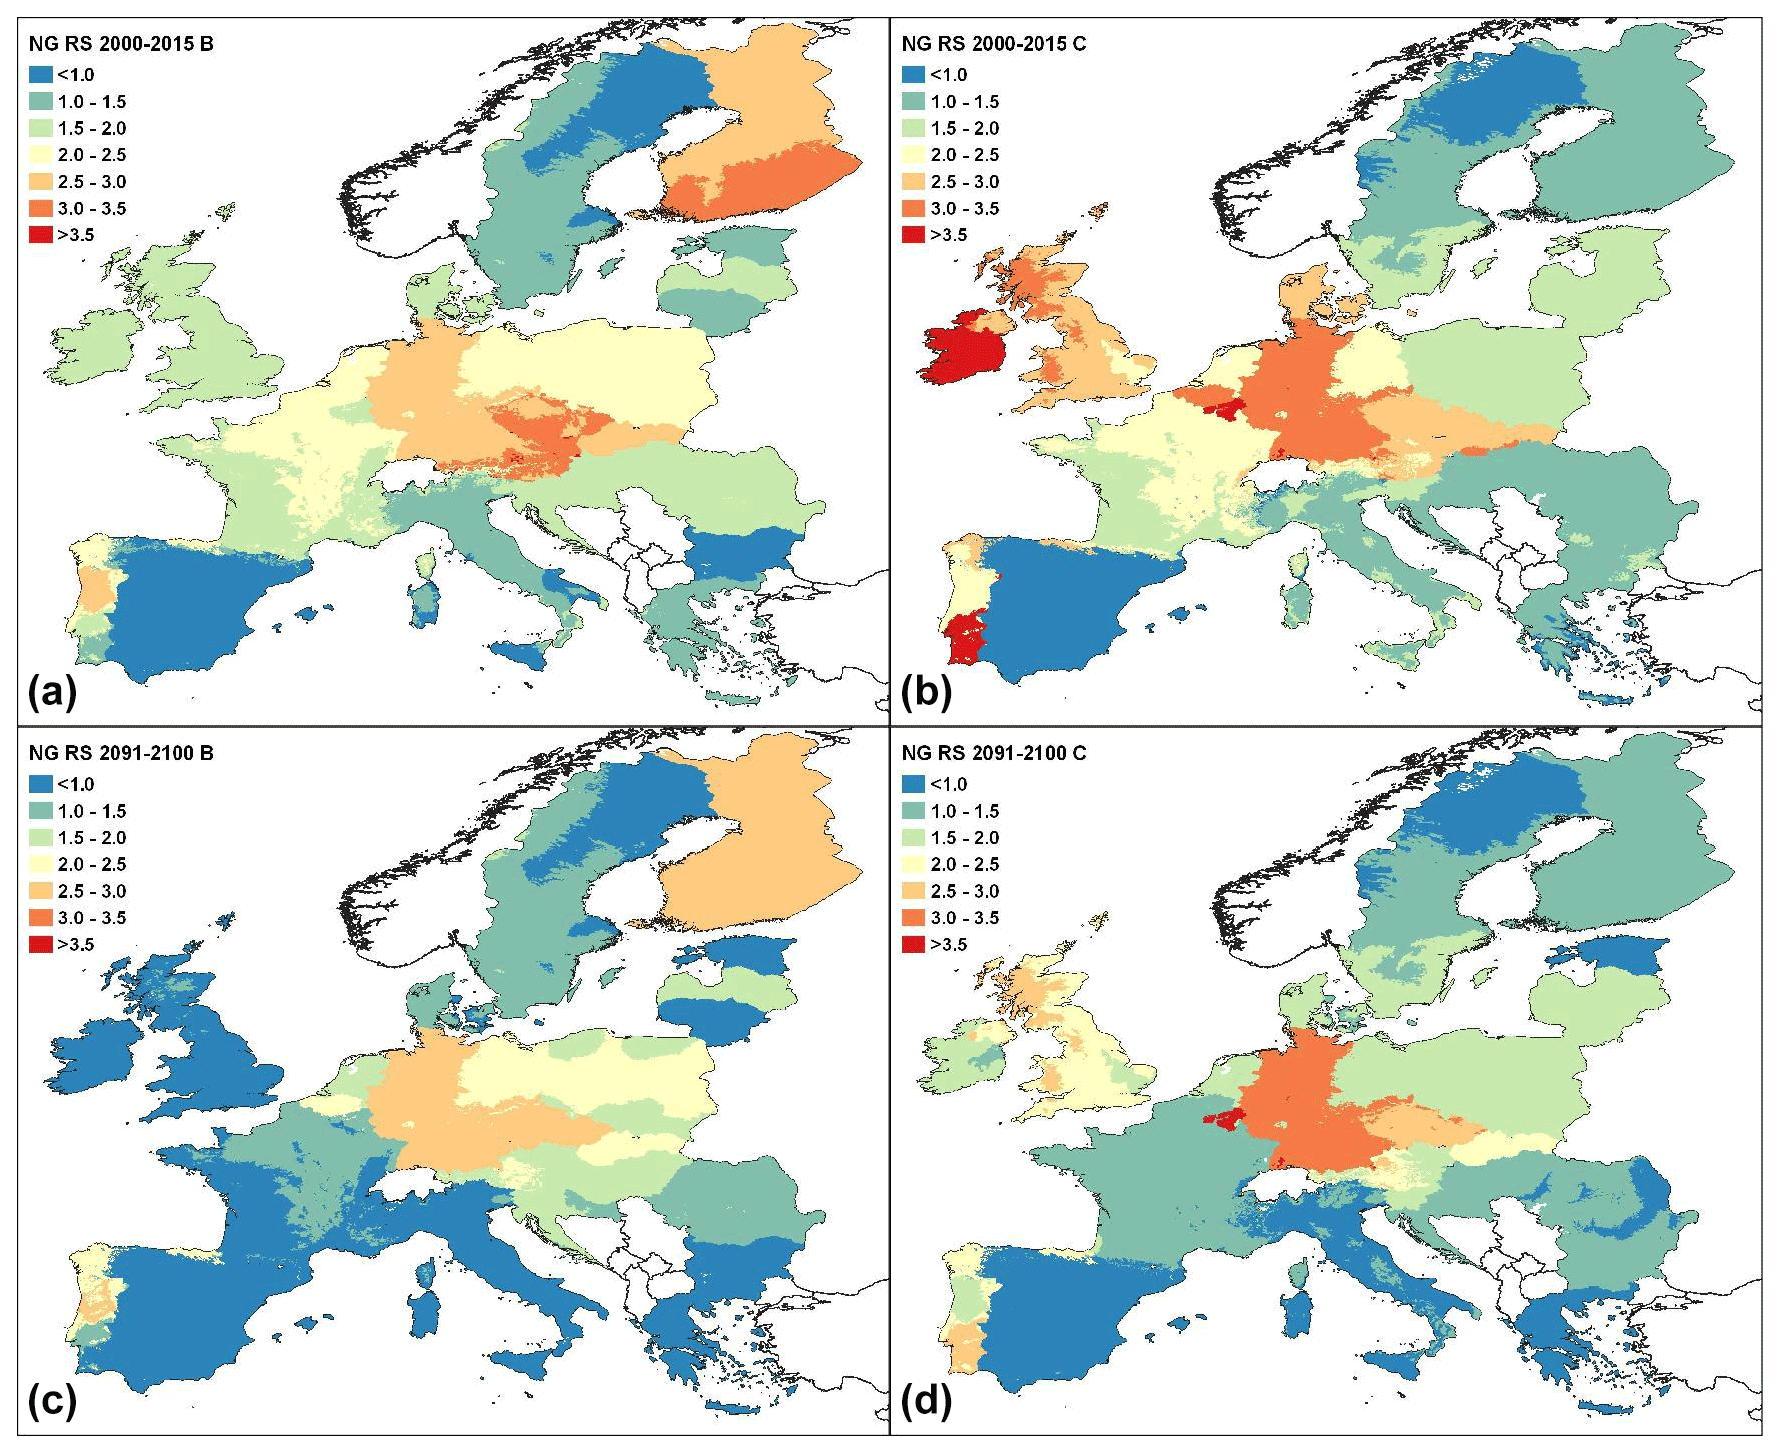
Figure 1Geographical distribution of the average net growth (NG, in t C ha−1 yr−1) estimated by CBM within the historical period 2000–2015 (a, b) and within the decade 2091–2100 (c, d) under the RS (i.e. excluding climate change). Broadleaved species are reported on the left side, and conifers are on the right side.
NG also represents a fraction of NPP, and summing up the net litterfall, we estimated an average NPP equal to 4.4 t C ha−1 yr−1 for the historical period. NPP varies from less than 2 t C ha−1 yr−1, estimated for the internal regions of the Iberian Peninsula, to more than 7 t C ha−1 yr−1, estimated for broadleaved species in central European countries (see upper panels of Fig. 2).
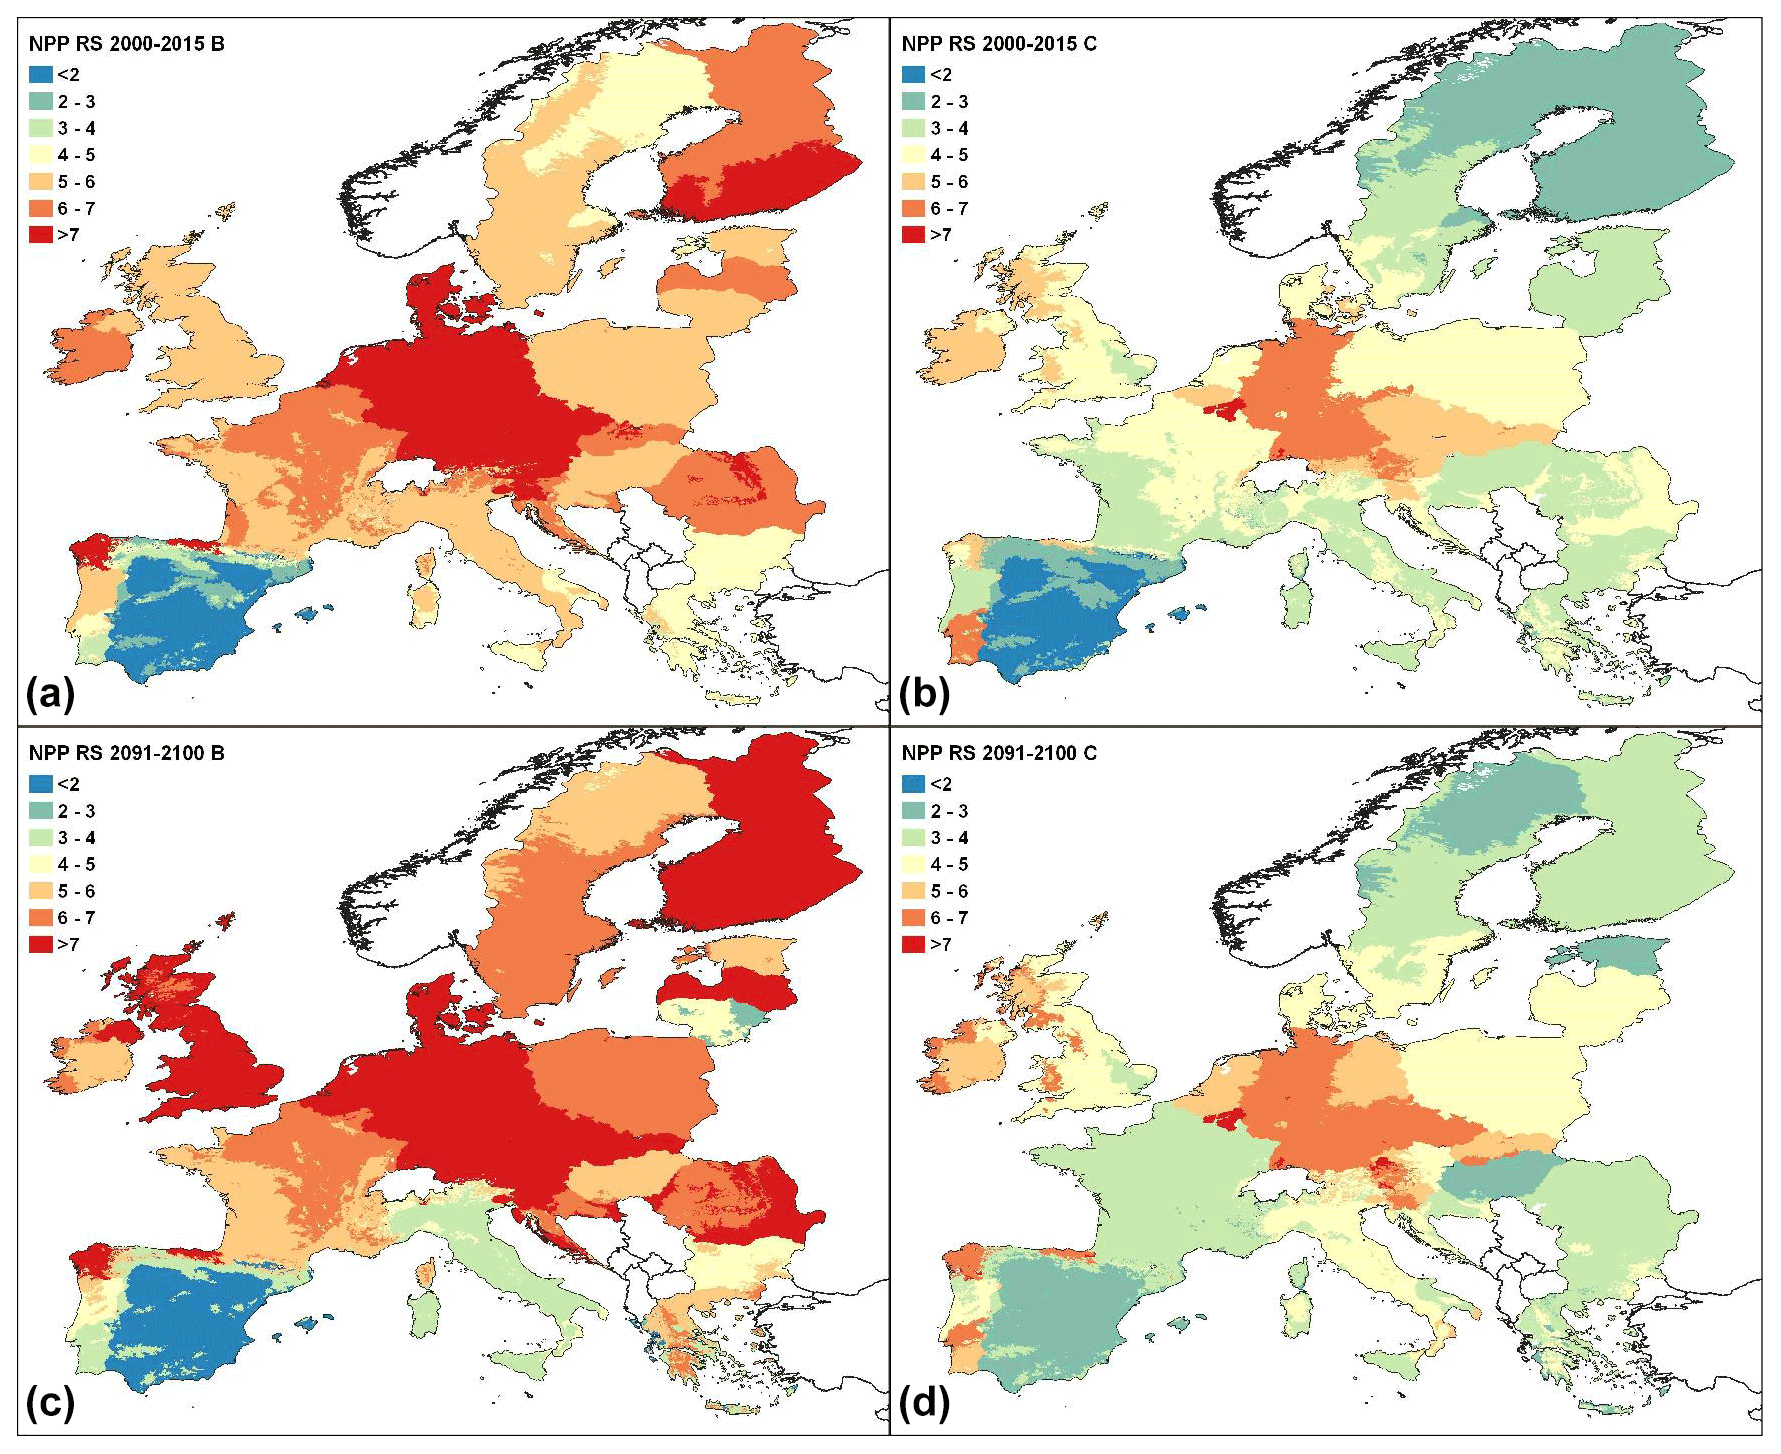
Figure 2Geographical distribution of the average net primary production (NPP, in t C ha−1 yr−1) estimated by CBM within the historical period 2000–2015 (a, b) and within the decade 2091–2100 (c, d) under the RS (i.e. excluding climate change). Broadleaved species are reported on the left side, and conifers are on the right side.
Under the continuation of the current management practices as detected within the historical period, CBM's output shows that NG generally decreases in most of the EU regions (lower panels of Fig. 1). This is mostly due to the ongoing ageing process of existing forests, which may be partially compensated, in some regions, from management practices, which may rejuvenate the current age structure. This is, for example, the case for some central European countries, where NG is quite stable until the end of the century. On the other hand, of course, management practices may also temporarily reduce NG at the stand level, when rejuvenation activities move the biomass stock of a stand below the maximum increment.
Within the period 2016–2100, the share of NPP contributed by NG progressively decreases from about 38 % within the historical period to 28 % in 2100. However, due to the parallel increasing amount of the material loss due to the turnover rate, the average NPP increases to 4.7 t C ha−1 yr−1 in 2100 (+9 % compared with the historical period). This is due to various, and sometimes opposite, patterns estimated for different European regions and species (see lower panels of Fig. 2).
By subtracting from NPP all C losses due to heterotrophic respiration (increasing from about 3.1 t C ha−1 yr−1 in 2015 to 3.8 t C ha−1 yr−1 in 2100; see Fig. S8) we estimate NEP, which represents the net change in C stocks prior to harvest or other disturbances. This is equal on average to 1.5 and 1.2 t C ha−1 yr−1, for broadleaved and conifer species, respectively, within the historical period. While NG is generally decreasing in time, under the continuation of the current management practices NEP is generally increasing in Mediterranean regions, is quite stable in northern European countries, and is partially decreasing in central European regions and in the British Isles (see lower panels of Fig. S9).
At the European level, within the period 2016–2100 the overall NEP decreases from about 1.3 t C ha−1 yr−1 within the historical period to 0.97 t C ha−1 yr−1 in 2100 (i.e. −28 %; see Fig. 3a). This is due to the larger share of forest land distributed in central and northern European countries, where NEP is stable or decreasing, compared with the Mediterranean regions, where it is generally increasing. This trend is further amplified by the continuous reduction in the broadleaved species' NEP (−39 % in 2100 compared to the historical period) and a smaller reduction (−17 % in 2100 compared to the historical period, mostly after 2070) of the conifers' NEP (Fig. 3b–c).

Figure 3Net ecosystem production (NEP), net biomass production (NBP) and harvest removals (all reported in t C ha−1 yr−1 on the left axis) estimated within the reference period 2000–2015 (RP) and from 2016 to 2100 under the reference scenario (RS) (a), further distinguished by conifers (b) and broadleaved species (c). The figure also reports (see the axis on the right side) the ratio between the amount of harvested material removed and the NEP, as considered within the historical period and from 2016 onwards, assuming the continuation of the current management practices detected within the period 2000–2015.
We can estimate NBP by subtracting from NEP the amount of C removed by harvest and further losses due to fires. Since the absolute amount of harvested material is varying on single CLUs, we cannot compare the temporal evolution of the NBP at the CLU level between different scenarios, but we can compare it at the EU level. Under the RS, NBP is directly affected by the management practices applied within the historical period and their continuation, until the end of the century. Similarly at the felling rate reported in official statistics (see for example Forest Europe, 2020), the ratio between the amount of C removed through harvest and NEP represents the intensity of the management practices carried out within a certain period. This ratio varies according to the amount of harvested material reported by each country within the historical period (further corrected to account for possible inconsistencies between official statistics and other data sources) and its evolution until the end of the century (which is, in turn, determined from the evolution of the age-class distribution). At the European level the ratio increases from about 0.48 within the historical period (average 2000–2015) to about 0.77 in 2100 (see right axis of Fig. 3a). This is due to an increasing harvest level applied to broadleaved species (+25 % in 2100 compared to the historical period) and after 2065 also to conifers (+14 % in 2100 compared to the historical period).
The direct consequence of this increasing harvest, combined, for both species groups, with a decreasing NEP, is a reduction by 78 % of the overall NBP estimated at the European level within the RS (−83 % for broadleaved species and −70 % for conifers; see Fig. 3). Despite this reduction, the overall living biomass C stock estimated at the EU level is continuously increasing within the entire period of analysis, both for broadleaved and for coniferous species (Fig. 4). However, the percentage of annual biomass increment is progressively decreasing above all for broadleaved species, and since 2070 we may observe a progressive saturation effect in the evolution of the living biomass C stock.
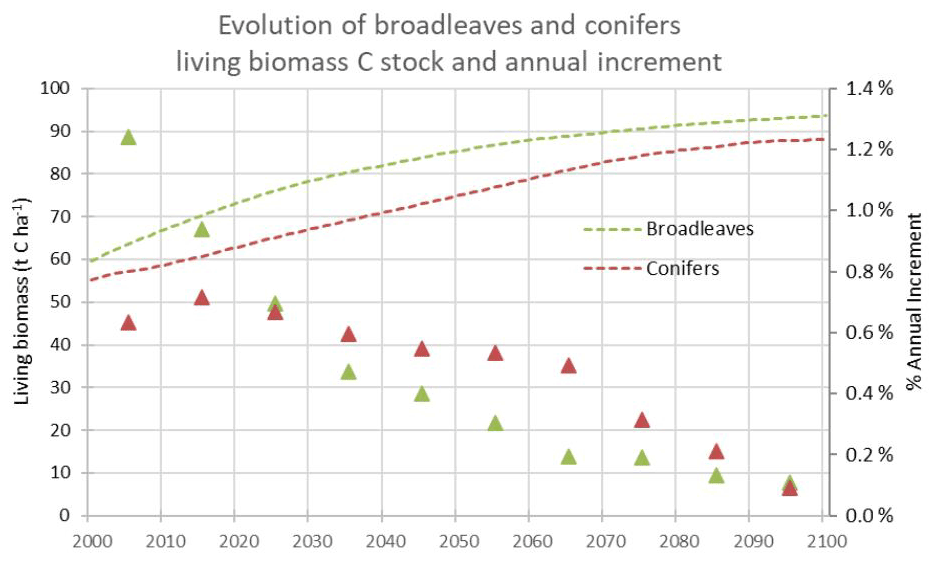
Figure 4Temporal evolution of broadleaved species and conifers living biomass C stock (reported in t C ha−1 on the left axis – dashed lines), as estimated by CBM within the RS between 2000 and 2100. The right axis reports the evolution of the average percentage annual C-stock change estimated in 10-year time intervals (triangles).
3.2 Climate change conditions
The additional impact of climate change on the continuation of the current management practices may partially compensate, in the case of broadleaved species, or amplify, in the case of conifers, the decreasing NG estimated within the RS (Fig. 5). Indeed, under both RCP scenarios, the broadleaved species' NG generally increases compared to the RS, especially in northern European regions. In contrast, the conifers' NG seems to be quite stable – ranging between ± 5 % in comparison to the RS for most of the European countries – or slightly decreasing, especially in central-eastern European regions and within the first half of the century. As a consequence, at the European level, under climate change conditions, the broadleaved species' NPP increases, compared with the RS, by 12 % and 14 % in 2100, under RCP2.6 and RCP6.0, respectively (see Fig. S10). At the same time, the conifers' NPP decreases, by 2 % in 2100, under both RCP scenarios. Due to these opposite responses, in 2100 the overall NPP increases by about 5 % under RCP2.6 and 6 % under RCP6.0, compared with the RS.
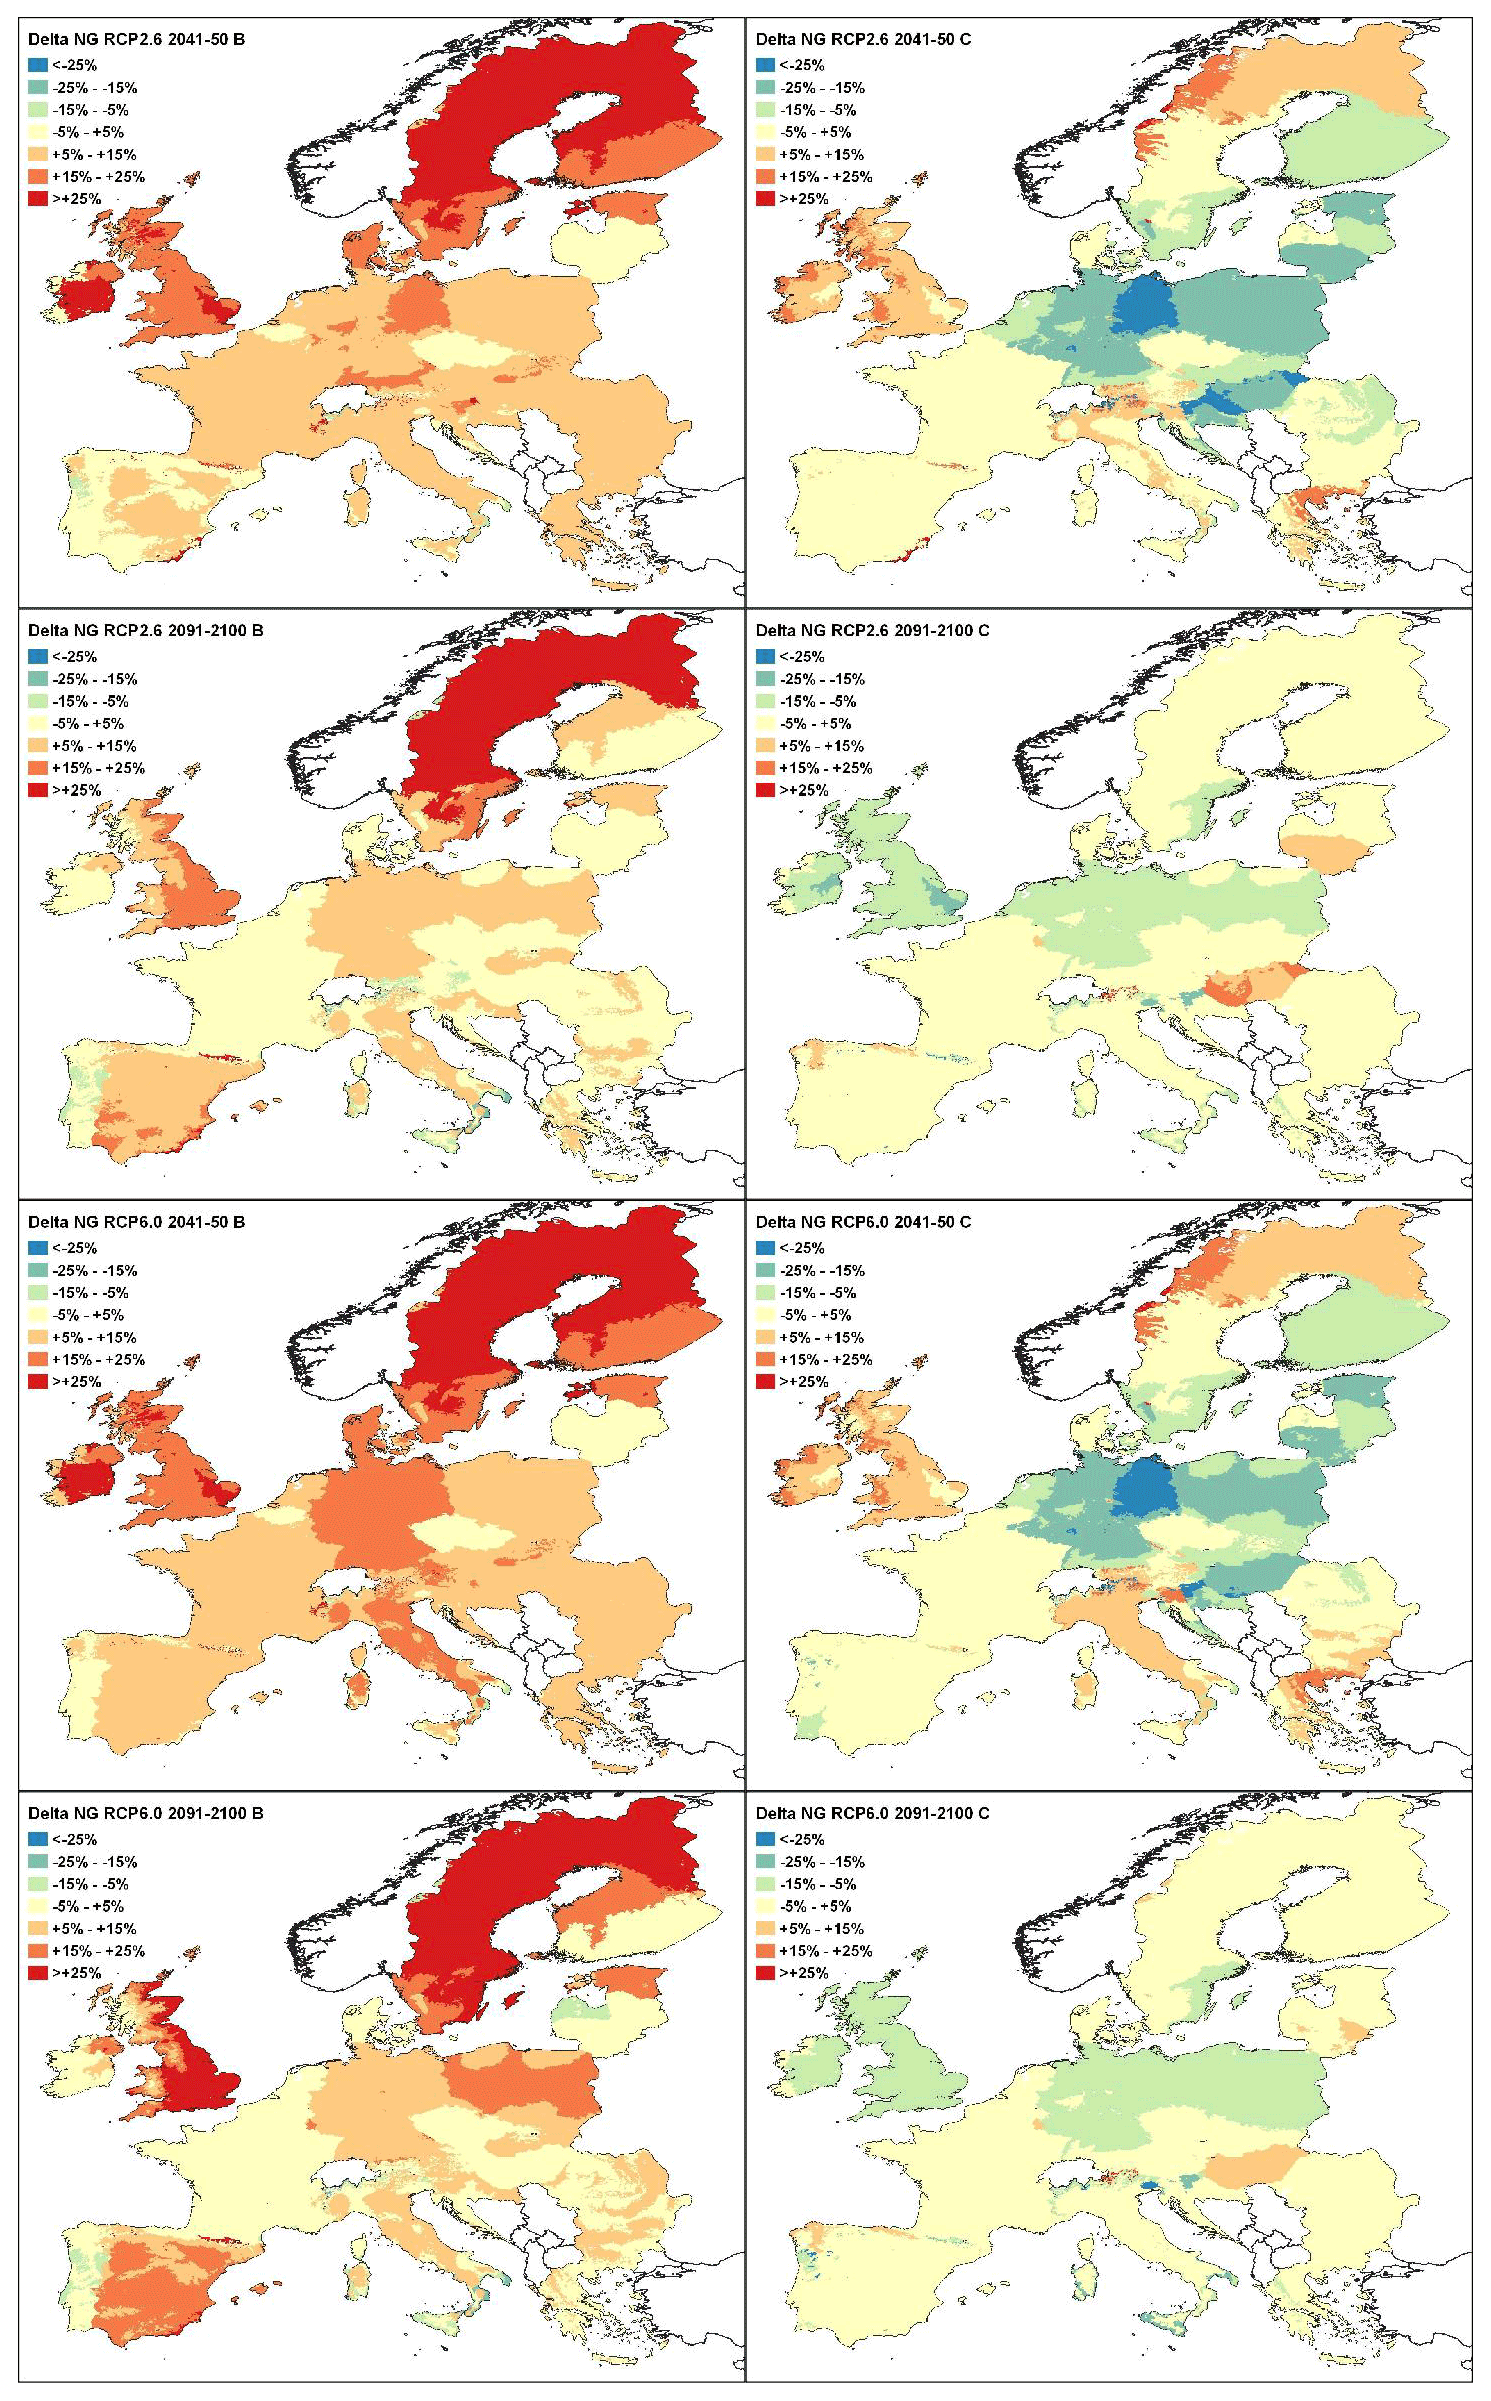
Figure 5Relative variation in NG due to climate change for broadleaved species (B, on the left side) and conifers (C, on the right side). The relative variation is estimated, for each country and CLU, as the average percentage difference between the NG of the RS and the average NG estimated from the four climatic models within the periods 2041–2050 and 2091–2100. The upper four panels refer to RCP2.6, and the lower four panels refer to RCP6.0.
Such as for NG, climatic drivers also increase the broadleaved species' NPP within the entire period and under both RCP scenarios, above all within the Mediterranean and northern European regions (see left panels of Fig. 6). This may amplify the increasing NPP highlighted under the RS (see Fig. 2). Coniferous species show a different pattern, with a stable NPP within most countries, except Sweden and the British Isles (see right panels of Fig. 6).
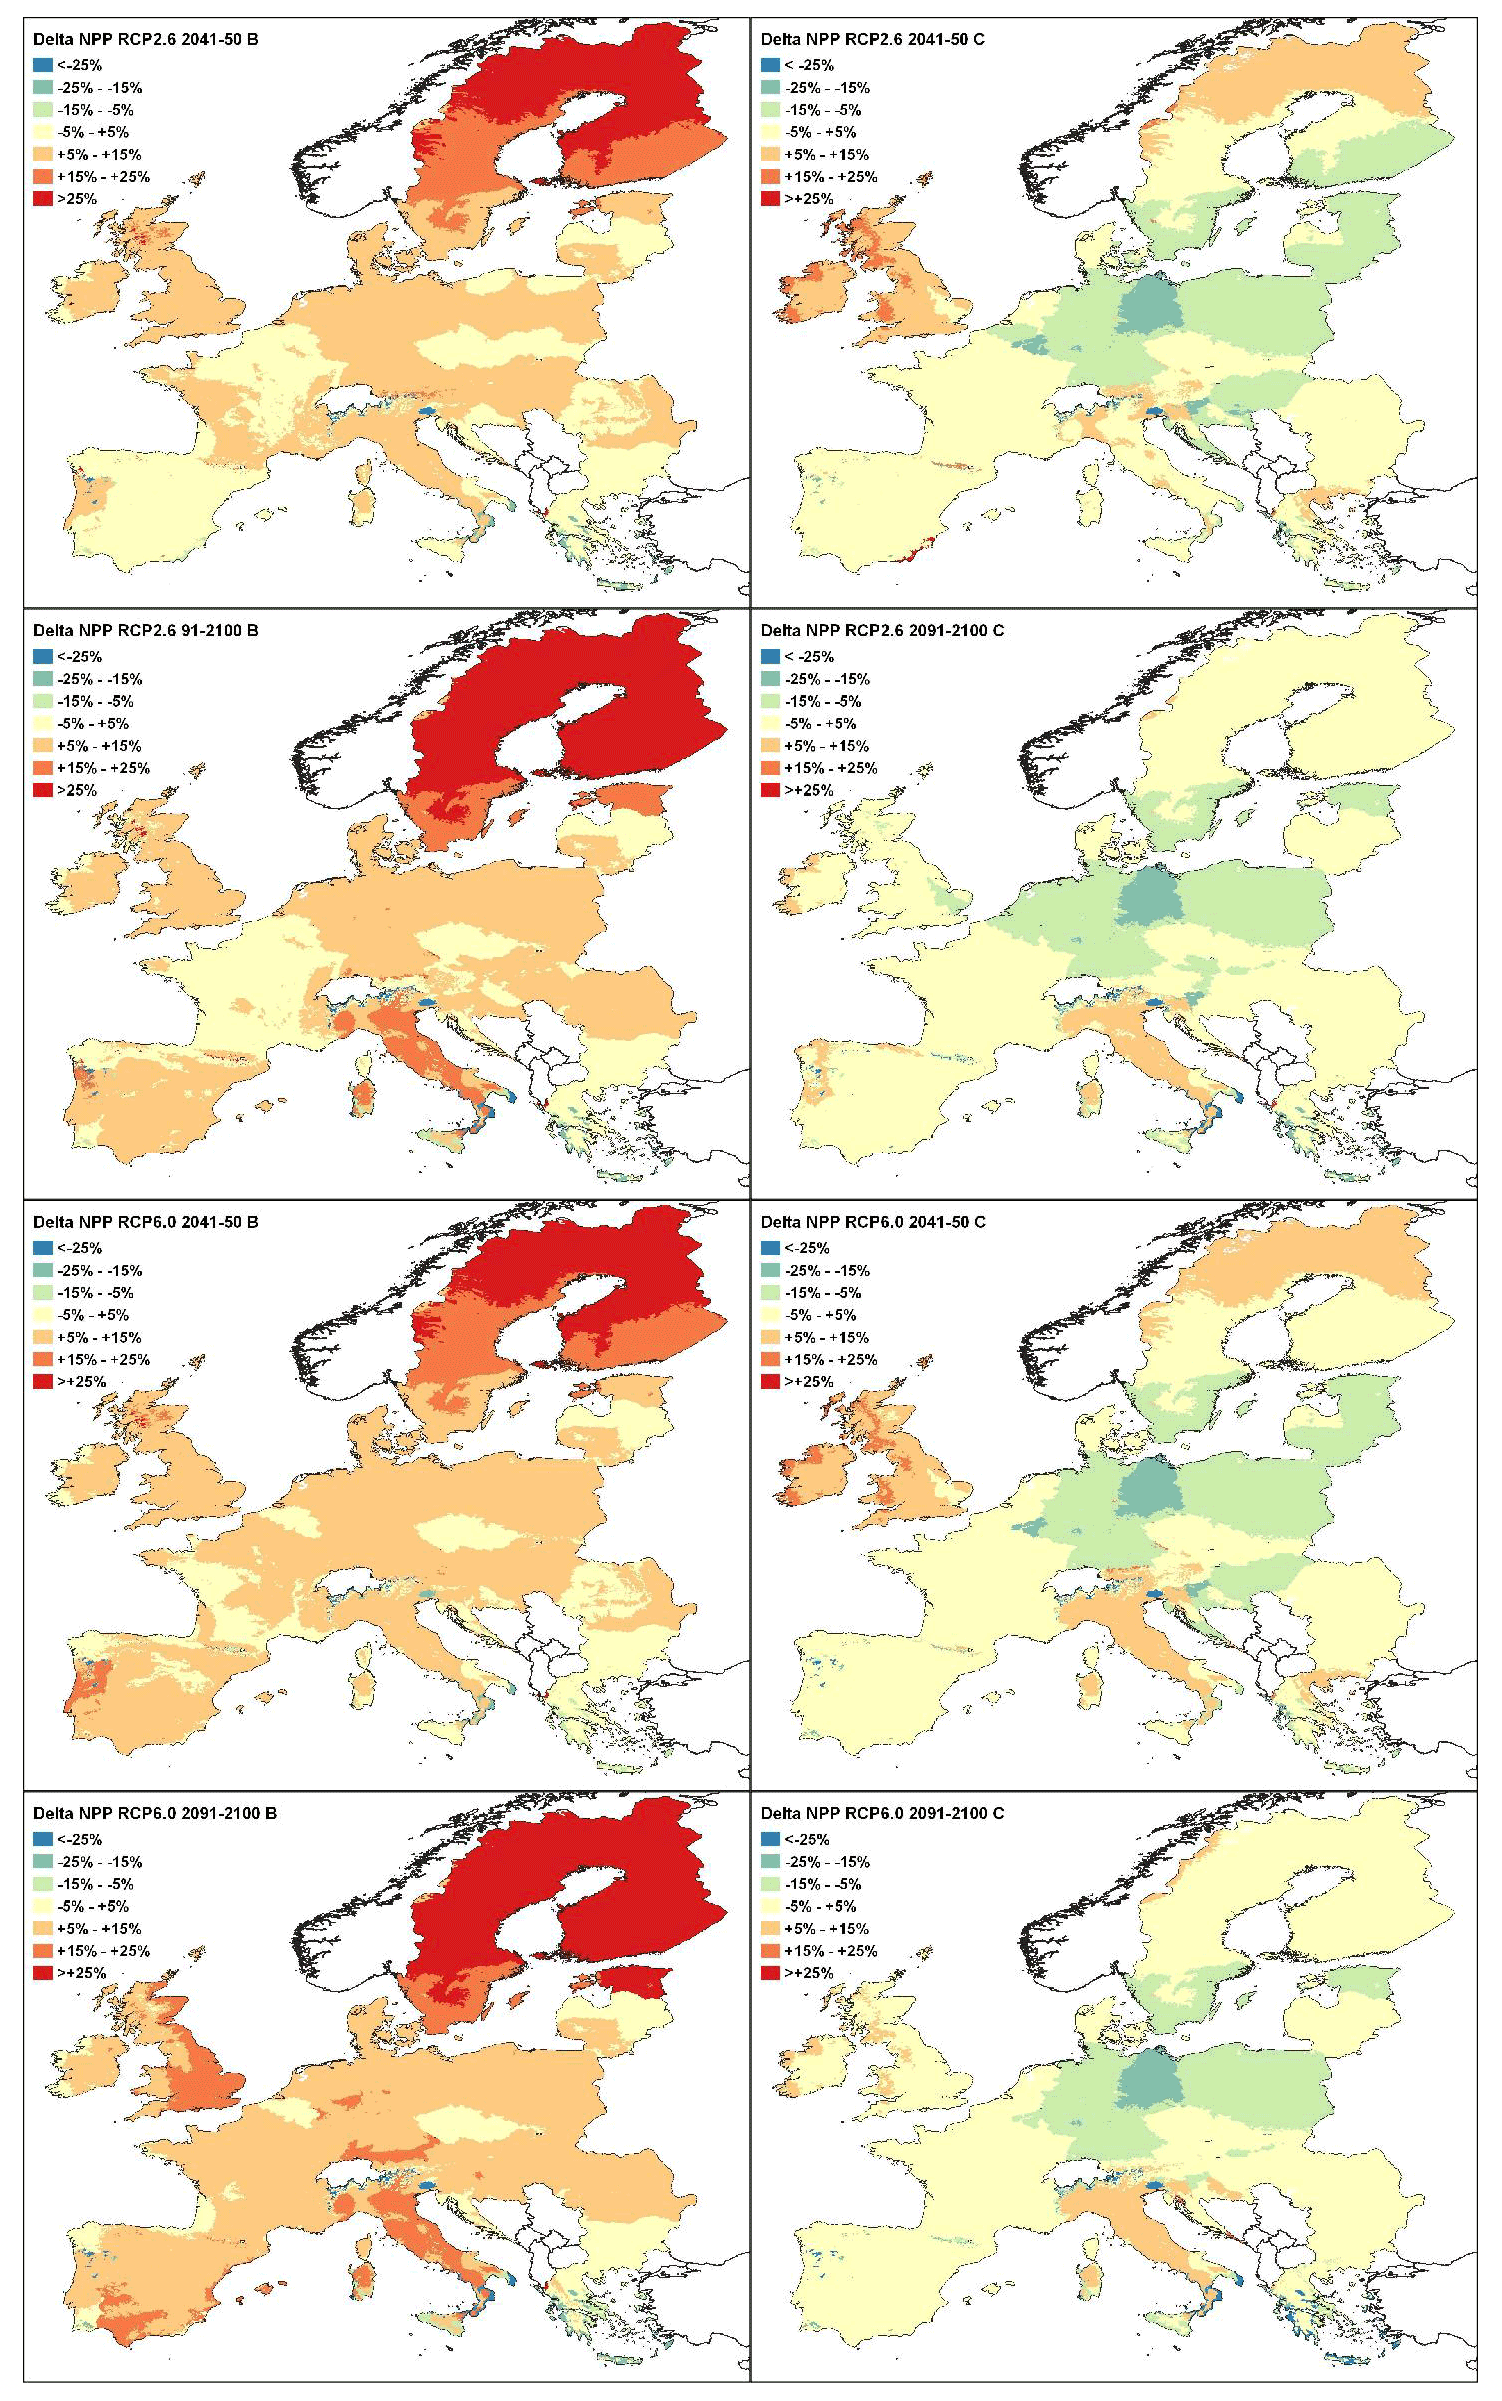
Figure 6Relative variation in NPP due to climate change for broadleaved species (B, on the left side) and conifers (C, on the right side). The relative variation is estimated, for each country and CLU, as the average percentage difference between the NPP of the RS and the average NPP estimated from the four climatic models within the periods 2041–2050 and 2091–2100. The upper four panels refer to RCP2.6, and the lower four panels refer to RCP6.0.
When estimating the additional effect of climate change on heterotrophic respiration (increasing by about 10 % in 2100 under climate change scenarios compared with the RS conditions; see Fig. S8), the resulting evolution of the NEP becomes more complex (see Fig. S11). For broadleaved species, we generally detected an increasing NEP until the period 2071–2080, with the exception of some specific CLUs. This means that the combined effects of climate changes on net growth and heterotrophic respiration may compensate the decreasing NEP. By the end of the century, however, especially under RCP2.6 this trend could be attenuated or even be reversed, at least within some eastern European countries and in some other regions. Moreover, when considering the maximum and minimum values derived from single climatic models, our analysis highlights strong interannual variations in the NEP, from +60 % to −40 % for broadleaved species (Fig. 7). This suggests that the effect of climate change may overcome, in single years, the evolution of NEP due to biological processes and forest management practices. For conifers, NEP is generally quite stable or decreasing within all the European regions and under both RCP scenarios, except the Italian Peninsula for the entire period and British Isles until 2050 (see Fig. S11). This means that climate change may amplify the loss of C stored within the coniferous forests – or potentially available for harvesting – reducing, by the end of the century, the average NEP by about 7 % and 8 %, under RCP2.6 and RCP6.0, respectively (Fig. 7). The overall effect at the European level is a compensation between different regions with opposite trends, at least until 2090, when, especially under RCP2.6, we estimated a percentage reduction in the average NEP, equal to −10 % in 2100. In all cases, however, we highlighted that interannual variation in the average NEP estimated under the RS due to the effects of climate change is considerably larger than the effects detected on NPP (see Figs. S10 and 7). This is due to the combined effects of climate variables on NG and heterotrophic respiration (see again Fig. S8).
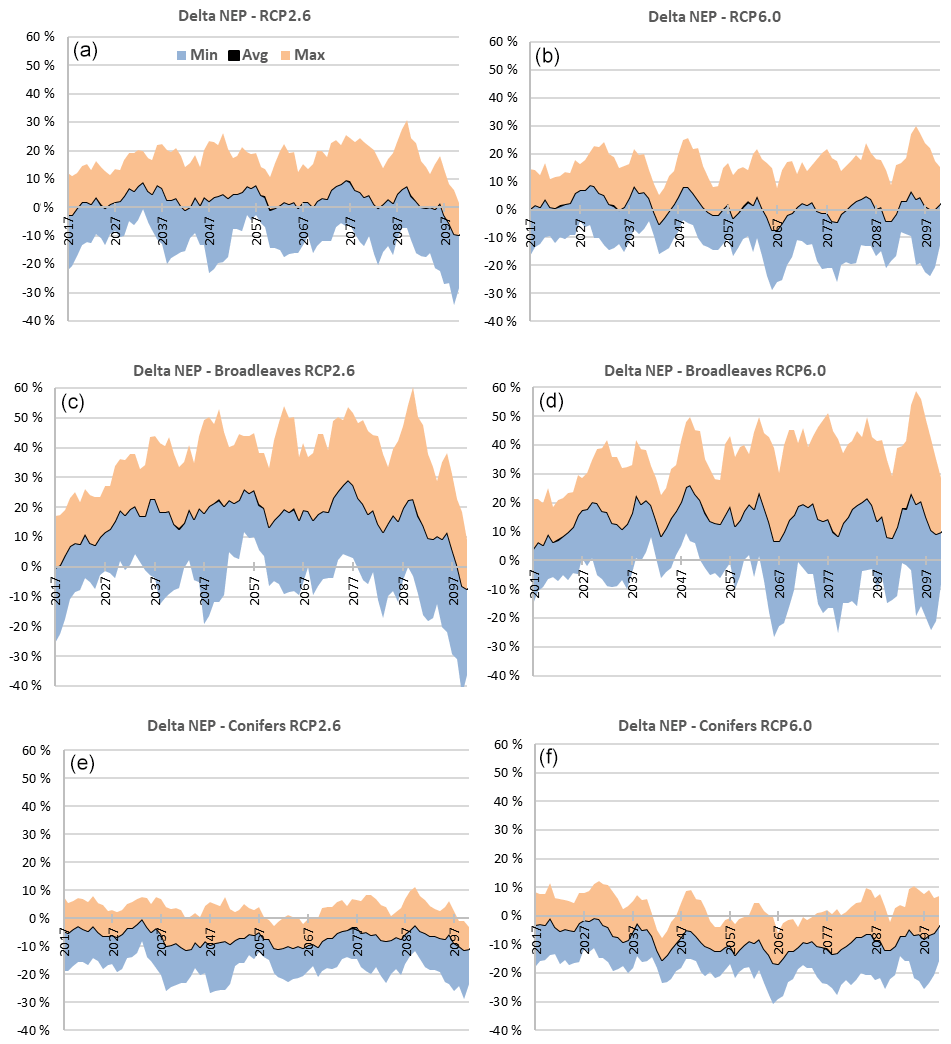
Figure 7Average annual rate of variation in the net ecosystem production (NEP), compared to the RS, derived from the four climate models, at the EU level (a, b), for broadleaved species and for conifers, under different RCP scenarios. Minimum (min) and maximum (max) percentage values correspond to the interval between the minimum and maximum difference with the RS for each year. All values are reported as 5-year moving averages.
Considering the additional effect of harvest (which does not vary between reference and climate scenarios) and wildfires, until 2090 the resulting NBP estimated at the European level is slightly increasing (on average +11 % between 2016 and 2090 under RCP2.6 and +6 % between 2016 and 2090 under RCP6.0; see Fig. 8). Within the last decade of the century, however, under RCP2.6 we estimated a marked reduction in NBP equal to about −14 % between 2091 and 2100, while under RCP6.0 we estimated the opposite pattern (+18 % between 2091 and 2100). This is the result of the opposite effects of climatic impact on the NBP dynamics of broadleaved species and conifers. Indeed, despite strong interannual variations, climatic drivers generally increase NBP estimated for broadleaved species – at least until 2090 – and slightly decrease NBP estimated for conifers.
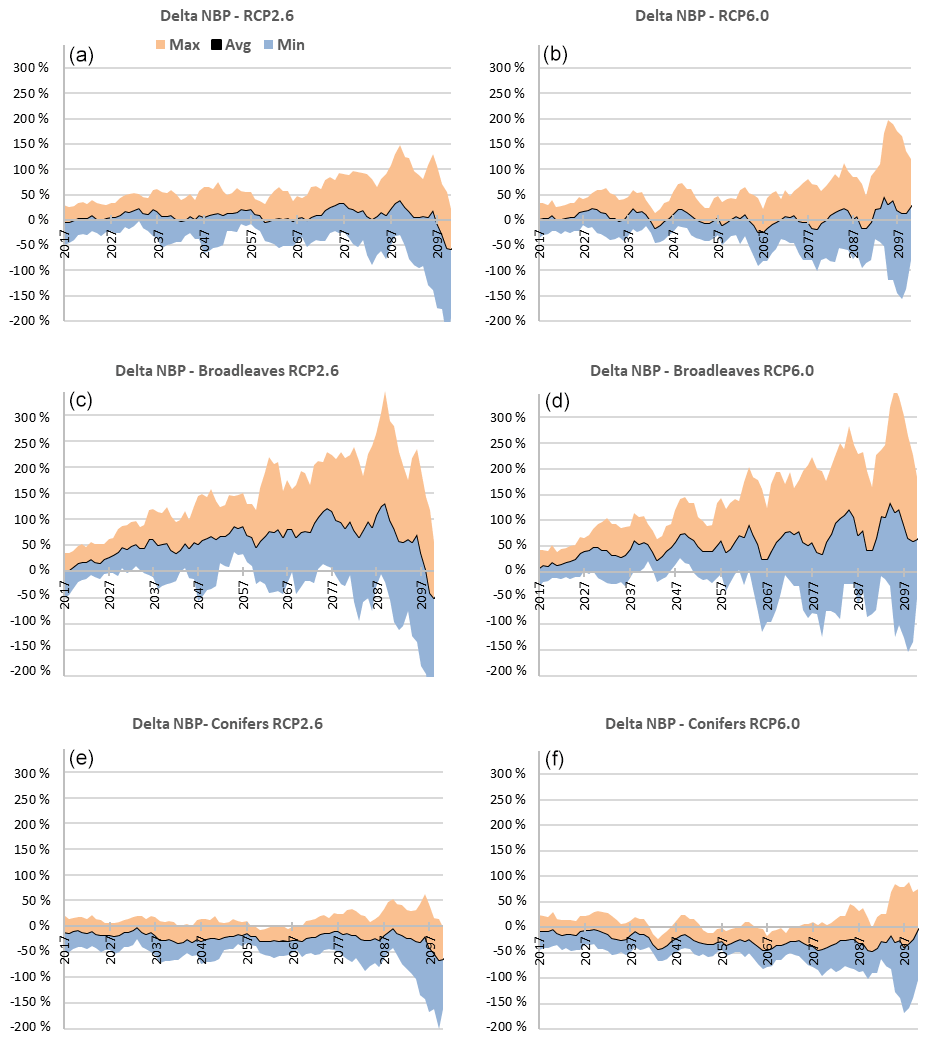
Figure 8Average annual rate of variation in the net biomass production (NBP), compared to the RS, as derived from the four climate models, at the EU level (a, b), for broadleaves and for conifers, under different RCP scenarios. Minimum (min) and maximum (max) percentage values correspond to the interval between the minimum and maximum difference with the RS for each year. All values are reported as 5-year moving averages.
3.3 Net CO2 emissions
The long-term dynamic of the CO2 emissions estimated within the RS is mostly driven by the changes in the age-class distribution and by the specific management practices applied within the period 2016–2100. These practices directly determine the net CO2 emissions because NBP is calculated from the difference between NEP and removals (plus other losses due to natural disturbances). Forest management also affects the annual growth rate, modifying both the age-class distribution – through clear cuts or single-tree selection systems – and the overall density of the forest stands – through thinnings. Assuming the continuation of the management practices applied between 2000 and 2015, we estimated a reduction in the forest sink, from about −353 CO2eq yr−1 within the historical period (average of 2000–2015) to −79 Mt CO2eq yr−1 in 2100 (i.e. −78 %; see Fig. 9). When considering the additional effect of climate change, since coniferous species – where we estimated a decreasing NBP – cover about 60 % of the total forest area, the overall net CO2 emissions decrease to −34 Mt CO2eq yr−1 as estimated within RCP2.6 in 2100 (i.e. −57 % compared to the RS). The average trend based on RCP6.0 is similar to the one estimated under RCP2.6, even if in both RCP scenarios interannual variations largely exceed the difference between the RS and the average derived from the four climate models. This is due to the large uncertainty in climate projections. For clarity, Fig. 9 highlights only the range between the minimum and maximum values of the ensemble of climate models estimated under RCP2.6. Similar results for RCP6.0, with a larger magnitude of variation in the net CO2 emission estimated under climate change conditions, are reported in Fig. S11.
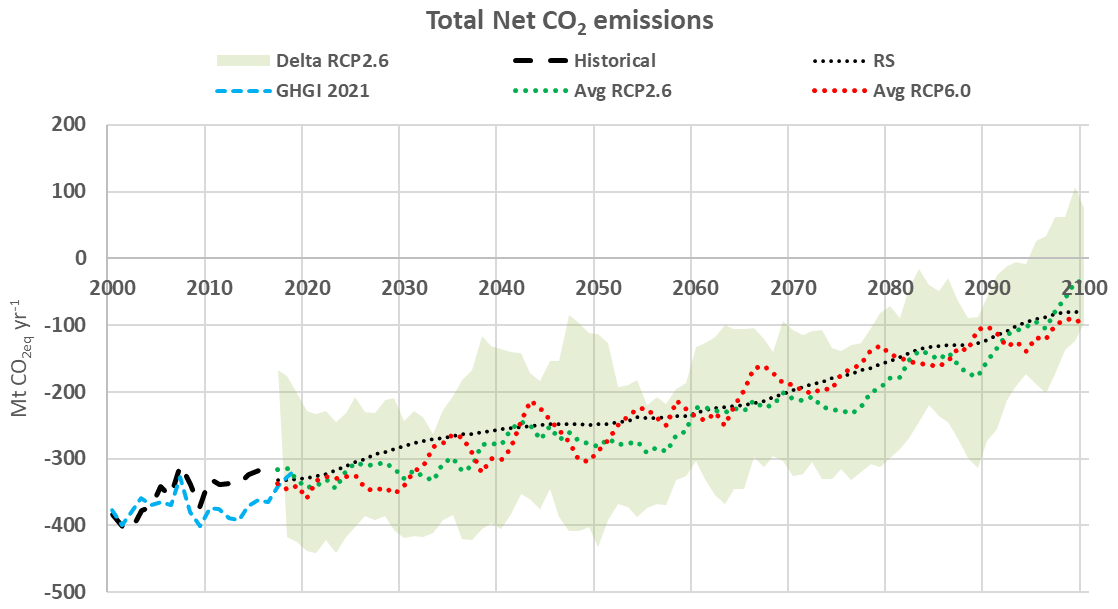
Figure 9Net CO2 emissions (reported as Mt CO2eq yr−1, with negative values conventionally highlighting CO2 removals from the atmosphere) estimated within the historical period, under the reference scenario (RS) and under RCP2.6 and RCP6.0 (reported as the average values estimated from different climate model within each RCP scenario). The figure also reports the net emissions reported from the EU27 member states and the UK, according to the Greenhouse Gas Inventory 2021 (GHGI 2021, referring to the category Forest Land Remaining Forest Land, as reported in UNFCCC CRF Tables, 2021), and the range between the minimum and maximum values estimated under RCP2.6. All values derived from the present study are reported as 5-year moving averages, referring to the category Forest Land Remaining Forest Land, excluding HWP net emissions.
4.1 Net primary production, litterfall and net growth
NPP is a key variable for understanding the forest carbon cycle and for assessing the potential timber supply, as affected by climate change. There are different data sources and methods to assess NPP: process-based models, such as the ones used within the present study; remote-sensed approaches, such as MODIS NPP (Running et al., 2004); inventory-based models, like CBM (Kurz et al., 2009) or EFISCEN (European Forest Information SCENario Model; Schelhaas et al., 2007); and indirect estimates based on field measurements provided from NFI data. Of course, each approach has specific pros and cons, and different studies have compared various estimates at the European and country level. Neumann et al. (2016) developed a regional MODIS NPP dataset for the European forests, named MODIS EURO, combining remotely sensed satellite-driven data with terrestrial NFI data and tree carbon estimations. Based on this assessment, Neumann et al. (2016) estimated an average NPP, at the European level, equal to about 5.8 and 5.4 t C ha−1 yr−1, according to MODIS EURO and NFI data, respectively. Similar results are reported, for the period 2000–2012, from Hasenauer et al. (2017), combining MODIS EURO data with the field measurements provided from 13 NFIs. These values are generally higher than previous estimates provided by Ťupek et al. (2010), who compared the average forest NPP estimated from EFISCEN for 2005 with three different process-based models. These authors report an average NPP for 26 European countries (mostly overlapping with the present study) equal to about 5.1 t C ha−1 yr−1 (SD = 1.8), 4.9 t C ha−1 yr−1 (SD = 1.2), 5.5 t C ha−1 yr−1 (SD = 1.6) and 4.2 t C ha−1 yr−1 (SD = 0.9), based on the EFISCEN, BIOME-BGC (BioGeochemical Cycles), ORCHIDEE (Organising Carbon and Hydrology In Dynamic Ecosystems) and JULES (Joint UK Land Environment Simulator) models, respectively.
The average NPP estimated by CBM in our study, equal to 4.4 t C ha−1 yr−1 within the period 2000–2015, lies within the range of values reported by Ťupek et al. (2010), even if it is generally lower. The differences between various approaches are further amplified when comparing these estimates at the country level (see Fig. S13). This is due to various reasons. First, some models, such as MODIS EURO, also cover non-forest-lands such as crops, shrubs or grasslands (Neumann et al., 2016). Other models, such as EFISCEN or NFI approaches, may have been mostly calibrated against data collected within the forest area available for wood supply (FAWS), where increment and NPP values may differ from unmanaged forest lands. Within the present study, we also considered about 12×106 ha of unmanaged forest lands, mostly located within northern European countries and the Iberian Peninsula and generally having a lower NPP. This can also explain the differences with a previous study, always based on the application of the CBM model at the European level (Pilli et al., 2017a), reporting an average NPP equal to about 5.1 ± 1.4 t C ha−1 yr−1. This last value, however, was not estimated from a spatial distribution of NPP between different CLUs, such as in the present study, but from the average NPP values estimated at the country level. If considered the same way, the average NPP estimated within the present study, equal to 5.2 t C ha−1 yr−1, is well in line with the previous estimates based on the CBM model. Natural disturbances, such as windstorms and wildfires are not directly considered in EFISCEN, except if directly affecting harvest removals through salvage logging, and they may also have not been considered by process-based models or by NFI data, which refer to specific time intervals, generally within the period 2000–2010. In contrast, all major disturbance events affecting the European forests within the historical period were included in our model runs. Refining the representation of fires and other natural disturbances may considerably improve the estimates reported from earth system models, which are probably overestimating the forest biomass C accumulation, at least within boreal ecosystems (Wang et al., 2021).
The results obtained from process-based models may also be partially biased because of the spatial distribution of FLUXNET forest sites, mostly concentrated in western, northern and middle European countries (Ťupek et al., 2010). However, CBM results – like those from EFISCEN – are strongly affected by the quality of input data, including both NFI measurements of volume and increment and harvest statistics (see Pilli et al., 2016). As noted by various authors, information on harvest reported from official statistics are, in many cases, largely biased (see for example Camia et al., 2020). For this reason, in our study official statistics reported from FAOSTAT (Food and Agriculture Organization Corporate Statistical Database; http://www.fao.org/faostat/en/#data/FO, last access: 1 June 2020) were further compared and eventually corrected according to other data sources (Pilli et al., 2015). Nevertheless, some recent additional information provided by countries on harvest, increment and forest management was not included in our assessment, but it could further improve our analysis, above all for the historical period 2000–2015 and the definition of the RS (Korosuo et al., 2021). Other factors, such as the quantification of litterfall and fine-root turnover rates, may explain the differences between our results and other estimates, based for example on NFI data. Neumann et al. (2016) derived the total litterfall from a meta-analysis based on 471 Eurasian stands, as reported in Liu et al. (2004). For boreal and temperate forests (further distinguished between continental, mountain and oceanic), Liu et al. (2004) report an average total aboveground litterfall ranging from a minimum of 1.9 ± 0.8 t C ha−1 yr−1 to a maximum of 3.5 ± 1.1 t C ha−1 yr−1. For the historical period, we estimated an average litterfall equal to about 2.6 t C ha−1 yr−1, which lies within the range reported from these authors, but it also includes belowground biomass turnover. Despite the differences between the absolute NPP values reported by different authors, we notice that the spatial distribution reported for the historical period by our study (Fig. 2) is mostly in line with the results provided from Hasenauer et al. (2017; cf. Fig. 2 in that study) and Neumann et al. (2016; cf. Fig. 2 in that study) even if these studies do not distinguish between broadleaved species and conifers. Of course, in our case, since the CBM model is not spatially explicit, the spatial resolution of our estimates is limited to the spatial scale attributed to each CLU, as considered at the country level within our study, and it was not further interpolated with a forest map. Integrating these results with other maps reporting forest composition and biomass distribution may certainly improve our estimates (Avitabile et al., 2020).
When analysing the long-term evolution of NPP under the RS, while the average NG decreases, from about 1.7 t C ha−1 yr−1 within the historical period to 1.4 t C ha−1 yr−1 in 2100, the absolute amount of litterfall increases from 2.6 to 3.3 t C ha−1 yr−1 in 2100. For this reason, the share of NPP contributed by material loss progressively increases, from about 62 % within the historical period to 72 % in 2100. This is mostly due to the ongoing ageing process, which is increasing the biomass standing stock but progressively decreasing the percentage of annual biomass increment (see Fig. 4). Indeed, when forest stands are getting older, a larger proportion of NPP is allocated to the replacement of the material lost to turnover (Köhler et al., 2008). Because of these opposite but interdependent trends, the final NPP increases to 4.7 t C ha−1 yr−1 in 2100. By subtracting the increasing losses due to the heterotrophic respiration, the total amount of C potentially available for storage or for harvesting in 2100, i.e. NEP, decreases within most of the European regions (see Fig. S8).
4.2 Net ecosystem production and net biomass production
Similar to NPP, the average NEP estimated by CBM within the historical period, equal to 1.3 t C ha−1 yr−1, is generally lower than the values estimated from eddy covariance measurements (2 ± 2.6 t C ha−1 yr−1) or from NFI data (1.6 ± 0.2 t C ha−1 yr−1) (see Luyssaert et al., 2010). Our estimates, however, are within the range of values reported from Zaehle et al. (2006) through the application of a modified LPJ approach (NEP = 1.3 ± 0.4 t C ha−1 yr−1). Interestingly, while coniferous' NEP is quite stable until 2070, broadleaved species show a continuously decreasing NEP within the entire period (Fig. 3). Taking into account the ongoing evolution of the living biomass C stock and of the corresponding percentage increment (as reported in Fig. 4), this may suggest that, due to management practices, the age-class distribution of broadleaved species' stands ages faster than that of conifer stands. Indeed, assuming the continuation of the current management practices until 2100, part of the broadleaved species' forest area will not be rejuvenated, and the current age structure is projected to get considerably older than the coniferous' age structure. For this reason, in our study, the growth functions derived from NFI data were also preliminarily updated to mimic the long-term evolution of NPP in ageing forests, according to the data reported from Tang et al. (2014; see Sect. B in the Supplement and Fig. S2). Even if the potential old-growth forest C sink is still debated within the literature (Gundersen et al., 2021; Luyssaert et al., 2021), our estimates confirm that with increasing age, these forests show a decreasing net biomass accumulation rate, a result supported by other studies (see for example Zaehle et al., 2006; Tang et al., 2014; Gao et al., 2016).
Considering further losses due to harvest and natural disturbances, we estimated an average NBP equal to 0.60 t C ha−1 yr−1 within the historical period. Apart from comparing this value with similar estimates reported from previous studies (see Luyssaert et al., 2010), we can also calculate the corresponding total net CO2 emissions of the EU27 member states and the UK. As highlighted in Fig. 9, our estimates are well in line with the net CO2 emissions reported from the EU27 member states and the UK within their greenhouse gas inventories (GHGIs, as derived from UNFCCC CRF Tables, 2021), with an average difference equal to about −6 %, mostly concentrated within the period 2008–2015. Part of this difference is due to slightly different assumptions about the forest area considered in our study and those reported in countries' GHGIs. Other differences are linked to the harvest level and to the impact of natural disturbances – including the share of salvage logging – taken into account within our modelling exercise, which may slightly diverge from countries' data, in particular after 2010. Despite that, however, it is important to notice that the absolute net emissions reported in the RS after 2015 are in line with the recent values reported from GHGIs for the period 2017–2019, even if they could be based on a slightly different harvest level.
4.3 Climate change scenarios, limitations and uncertainties
Comparing our estimates with other studies considering the dynamics of the European forests to the end of the century, under different management regimes and climatic conditions, is more challenging because, at least to our knowledge, there are not many studies assessing both these aspects together and within such a long time horizon. Some studies assessed different forest management regimes until 2030 (Rüter et al., 2016; Jonsson et al., 2021) or 2050 (Nabuurs et al., 2017), but they did not consider climate change. Reyer et al. (2013) analysed the forest productivity change, under different climatic conditions, for 4 tree species and 10 environmental zones in Europe, using the process-based model 4C (FORESEE – Forest Ecosystems in a Changing Environment) calibrated against the data provided from three different climate models and two different assumptions about CO2 effects on productivity. According to their results, northern European productivity – dominated by Scots pine and Norway spruce – will generally increase, while southern European productivity will mostly decrease. These results are not fully in line with our estimates and other studies (i.e. Sperlich et al., 2020). Indeed, as reported in Fig. 6, for broadleaved species we predicted an increasing NPP both within the Mediterranean regions and northern European countries, and for conifers we predicted a quite stable NPP within western European countries or a decreasing NPP in central European countries. Interestingly, the tipping point when initial gains in NPP turned into losses, which we detected at the European level in coniferous species around 2030, was also noticed within a recent study analysing forest productivity in Germany under climate change conditions (Sperlich et al., 2020).
Other nationwide studies, based on direct field measurements, are well in line with our results. For example, Bosela et al. (2021) highlight the negative impact of climate warming and other environmental factors, across a biogeographical gradient, on Norway spruce productivity in central European regions.
Various reasons may explain the differences between these studies. Reyer et al. (2013) focused on the physiological response to global change, and they did not consider Mediterranean tree species but only boreal and temperate species (European beech and oak) that occur in the Mediterranean regions. Most importantly, our results account for the combined effect of forest management and climate change, while previous studies mostly focused on either different management strategies or climate change conditions. Combining both these aspects within a hybrid modelling framework constitutes, in our opinion, the main added value of our work. Even if, within the present study, we did not aim to provide any policy scenario analysis, we do suggest that to maximize the overall contribution of the forest sector to climate change mitigation, we need to maximize the “net sector productivity”, including NEP and the net contribution of HWP emissions. Both of these factors are clearly linked to management practices. Other studies have previously used the CBM model to conduct scenario analyses of changes in harvest rates in different regions and have demonstrated that harvest rates do affect forest age-class structures and therefore also future NEP (see for example Pilli et al., 2017a; Jevšenak et al., 2020).
Simulating the continuation of the current management practices from the historical period and excluding additional effects due to climate change, we estimated a CO2 net C sink decreasing from −331 Mt CO2eq yr−1 in 2016 to −79 Mt CO2eq yr−1 in 2100. Part of this reduction is certainly due to the amount of C removed with management in the RS, increasing from about 100 Mt C yr−1 within the historical period to 118 Mt C yr−1 in 2100.
A fraction of these harvest removals, which amount to a cumulative amount of about 9200×106 t C (removed under the RS between 2016 and 2100), will be temporarily stored within the pool of harvested wood products, which is not considered within the present analysis but may only partially compensate the reduction in the forest C sink directly provided by forest ecosystems (Jonsson et al., 2021).
The ongoing ageing process of the European forests, however, plays a key role. Indeed, as reported in Fig. 3, while the NBP of coniferous species shows a stable trend until 2065 and then decreases according to the increasing removal level, the NBP of broadleaved species continuously decreases throughout the entire period, despite the stable removal level applied within the RS (equal to about 0.6 t C ha−1 yr−1 from 2030). This suggests that, at least for broadleaved species, reversing this process to maintain or enhance the current forest mitigation potential will be quite challenging. This could also be the result of the different management regimes for this group of species within the last decades, including for example the abandonment of large coppice areas within many Mediterranean regions (Müllerová et al., 2015).
Our findings are clearly affected by our methodological assumptions, including the frequency and intensity of specific management practices applied at the country level, the reliability of the age-class distribution as considered by our model and the growth functions applied within the model run as derived from NFI data. In particular our assumptions about the long-term dynamics of uneven-aged forests – mostly distributed within the Mediterranean countries – and about the real impact of stand-replacing management practices – which can rejuvenate the current age structure – could have reduced the final NG and, as a consequence, also the NBP, estimated within such a long-term model run. Despite these uncertainties, however, our results are substantially in line with the main findings proposed by other studies carried out both at national (e.g. Jandl et al., 2018) and at the European level. Assuming the continuation of the management practices and harvest intensity detected within the period 2013–2017, Welle et al. (2020) estimated a biomass C sink equal to about −245 Mt CO2eq yr−1 in 2050, which is consistent with our results (Böttcher and Frelih-Larsen, 2021). Valade et al. (2017) assessed the optimal forest management strategies for mitigating climate change using a conceptual empirical model of sequestration efficiency and concluded that, in the long term, the EU forest sector (including HWP and material substitution benefits) remains a net C sink in 99 % of the simulations but that in 25 % of the simulations the forests themselves become a source and that only in 25 % of the simulations the sink efficiency was found to be enhanced. Overall, all these studies, including the main finding our study, suggest the urgency to develop management strategies to partially reverse the declining C sink that is expected under the continuation of current management practices.
Climate change could amplify or mitigate this ongoing trend. At the European level the impact of climatic drivers could be negligible on the long-term dynamics of NPP, at least if compared with the ongoing changes in the age-class distribution (see Fig. S10). The impact of climate change, however, would certainly be higher on NEP (see Fig. 7) and on NBP (see Fig. 8) because the cumulative effects of different climatic drivers on net growth, heterotrophic respiration (see Fig. S8) and natural disturbances – even if these were limited in our study to changes in the fire frequency in Mediterranean countries. A high NEP is generally an indication that the forest operates as a strong C sink, at least excluding the possible impact of natural disturbances. As noted in Eq. (2), NEP is given from the difference between NPP and heterotrophic respiration. In our study, both these parameters were varying and directly assessed through CBM, taking into account both of the effect of harvesting and other disturbance events and of the temperature which directly affects Rh.
As a result, the total net CO2 emissions estimated at the European level – and even more if considered at the country level – are predicted to vary because of the interannual variations due to climatic variability and stochastic natural disturbances (see Fig. 9). Different, and sometimes opposite, climatic impacts on broadleaved species and conifers, also in different regions, suggest that, in some cases, substituting the current species, for example increasing the share of broadleaved species in central European and Mediterranean regions (see also Bosela et al., 2021), could be part of specific forest management strategies developed at regional and local levels (see Nabuurs et al., 2017). Apart from modifying the current forest composition, which was assumed to be constant within our study (see Morin et al., 2018), other options to rejuvenate the current age structure may include, for conifers, a gradual shift towards a continuous cover forestry system based on an uneven-aged structure (Valkonen et al., 2020) and, for broadleaved species, a gradual recovery of past management practices dismissed, at least in some regions, after the Second World War (Müllerová et al., 2015). This could partly compensate the continuously declining percentage C-stock change estimated for broadleaved species (see Fig. 4). On the other hand, the percentage C-stock change in coniferous species is quite stable until 2070, despite the higher harvest level (see Figs. 5b and c and 4). Both these solutions could also provide other additional ecosystem benefits, but they need to be further assessed as part of a broader forest strategy, which also includes protecting primary and old-growth forests (as stated within the EU Biodiversity Strategy), new afforestation activities (such as the “3 Billion Trees Pledge” promoted within the new EU Forest Strategy), restoring existing forests, and reducing the impact of natural disturbances (EC, 2020a, b, 2021a). In particular, the expected increasing impacts of windstorms, insect outbreaks and wildfires in central and northern European countries were not considered in our study, but these will further reduce the future forest C sink (Forzieri et al., 2021; Senf and Seidl, 2021).
Our results may also be biased by the gap between the growth functions applied by CBM, based on input data derived from NFI field measurements – in particular NAI – and the current growth of the forest species. In some cases, NFI data are quite outdated, since they may be based on NFI concluded between 2005 and 2010 (or, in a few cases, even before 2005). As a consequence, the growth functions derived from these increment data do not properly consider the most recent direct effects of climate change on the current growth rate. As highlighted by some studies (see for example Bosela et al., 2021), these effects are already quite evident in some European regions, and they should be properly represented in inventory-based models, such as CBM, which are mostly based on NFI data. Finally, we need to highlight that the assessment of soil C dynamic, which was performed within the CBM model, is particularly uncertain in particular when taking into account the effect of climate change on future heterotrophic respiration (see also Gautam et al., 2022). Some of these aspects were assessed in other studies, such as Smyth et al. (2009), Hararuk et al. (2017) and Blujdea et al. (2021b).
Our study successfully combines a stand-level, inventory-based model, particularly suited for simulating various forest management strategies and disturbance regimes, with the output provided by a DGVM, driven by four process-based climate models, and applies this to all of Europe. This meta-modelling approach highlights that, under the continuation of the current management practices, the EU27 + UK forest C sink will be reduced by about 77 % by the end of the century. The additional effect of climate change may either amplify or mitigate this trend at the local level, resulting in strong interannual variations, which may double, or halve, the EU-wide forest C sink. The impact of climatic drivers, generally lower on NPP and gradually larger on NEP and NBP – because of a cumulative effect on various physiological processes and disturbances – may vary, according to the species composition and the geographical impact of climate change. Both RCP scenarios yield a similar pattern, in particular in the first half of the century. In some cases, the combined effects of these factors on net growth and on heterotrophic respiration may compensate the decreasing NEP due to the ageing process that results from the continuation of the current management practices.
To become climate neutral by 2050, the EU27 net C sink from forest land should increase to −450 Mt CO2eq yr−1 by 2050 (EC, 2020a), but, according to our estimates, under the continuation of the forest management regime applied within the period 2000–2015, this sink (including the UK) would decrease to about −250 Mt CO2eq yr−1 in 2050. These results are consistent with the main findings from other studies (Valade et al., 2017; Welle et al., 2020). By assuming additional mitigation initiatives, such as different management regimes and a further expansion of the forest area, other studies report a potential increasing forest C sink ranging between −150 and −400 Mt CO2 yr−1 in 2050 (Nabuurs et al., 2017; EC, 2020a). These figures do not account for the possible increasing impact of climate change and natural disturbances, but they include the additional mitigation potential provided from carbon storage in harvested wood products and material and energy substitution. While both these elements were not considered in our study, it is unlikely that they would compensate for the reduction in the C sink directly provided by forest ecosystems (Leturcq, 2020; Jonsson et al., 2021; Grassi et al., 2021; Köhl et al., 2021).
The main driver of the long-term dynamics of the forest C sink seems to be the ongoing ageing process of the European forests, mostly determined by historical management (McGrath et al., 2015) and current silvicultural practices (e.g. harvest) and partly by our specific methodological assumptions (i.e. on forest management and uneven-aged forests). Climate change, however, apart from contributing to strong interannual variations, may further reduce the EU forest net C sink or mitigate this trend. Due to the uncertainty about the future evolution of environmental variables and the relative impact of these variables on forest growth and mortality, in 2050 the EU27 + UK forest net C sink may range from −100 to −400 Mt CO2eq yr−1, under RCP2.6, and from −100 to −300 Mt CO2eq yr−1, under RCP6.0. This means that reversing this process to maintain or enhance the current forest mitigation potential will be quite challenging and urgently requires alternative management strategies (Yousefpour et al., 2017) and new modelling tools which merge traditional scientific objectives – generally linked to a climate change perspective – with practical applications to forest management and planning activities (Shifley et al., 2017).
We emphasize that our study does not explore a policy scenario but describes a methodological framework. In this sense, despite the uncertainty and some methodological limitations of this study, e.g. excluding the additional impact of windstorms and insect outbreaks or possible effects of climate change on trees' species composition, our framework may help other studies that explore policy scenarios to produce more realistic outcomes which consider at least in part the expected impact of climate change. Further steps could include (i) a sensitivity analysis on different forest management options and the consequent effects on the overall harvest levels, also linked to different policy scenarios; (ii) an assessment of the direct effect of these removals on the HWP net C-stock change; and, possibly, (iii) a first assessment of the indirect substitution benefits. This is in line with the new EU Forest Strategy, where climate change mitigation and adaptation should be part of a broader roadmap, including biodiversity, conservation and a sustainable use of forest resources (EC, 2021a). Failure to achieve the planned forest sinks by 2050 will make achieving net-zero goals even more difficult.
The EU Archive Index Database used by the CBM model, such as detailed information on the spatial distribution of climatic units, is available at https://data.jrc.ec.europa.eu/dataset/jrc-cbm-eu-aidb (Pilli et al., 2017b). Other data input and simulation outputs used for this study are available upon request to the corresponding author. All CBM model runs are based on CBM versions 1.2.7739.338 and 1.2.7271.303.
The supplement related to this article is available online at: https://doi.org/10.5194/bg-19-3263-2022-supplement.
RP and RA designed the methodology, in collaboration with AC, WAK and GG. RA carried out the data analysis on the land–climate models and described the corresponding methodological approach. RP carried out the analysis on the forest growth model and wrote the paper, in collaboration with RA, AC, WAK and GG, who helped in the interpretation and discussion of the results. All authors read and approved the final paper.
The contact author has declared that none of the authors has any competing interests.
The views expressed are purely those of the authors and may not
in any circumstances be regarded as stating an official position of the
European Commission or Natural Resources Canada.
Publisher’s note: Copernicus Publications remains neutral with regard to jurisdictional claims in published maps and institutional affiliations.
The authors sincerely thank two anonymous reviewers for their useful and constructive comments. This work was carried out for the Joint Research Centre.
This paper was edited by Ben Bond-Lamberty and reviewed by two anonymous referees.
Avitabile, V., Pilli, R., and Camia, A.: The biomass of European forests, EUR 30462 EN, Publications Office of the European Union, Luxembourg, 52 pp., https://doi.org/10.2760/758855, 2020.
Blujdea, V. N., Sikkema, R., Dutca, I., and Nabuurs, G. J.: Two large-scale forest scenario modelling approaches for reporting CO2 removal: a comparison for the Romanian forests, Carbon Balance and Management, 16, 1–17, https://doi.org/10.1186/s13021-021-00188-1, 2021a.
Blujdea, V. N., Viskari, T., Kulmala, L., Gârbacea, G., Dutcǎ, I., Miclǎuş, M., Marin, G., and Liski, J.: Silvicultural interventions drive the changes in soil organic carbon in Romanian forests according to two model simulations, Forests, 12, 795, https://doi.org/10.3390/f12060795, 2021b.
Bosela, M., Tumajer, J., Cienciala, E., Dobor, L., Kulla, L., Marčiš, P., Popa, I., Sedmák, R., Sedmáková, D., Sitko, R., S̆eben̆, V., Štěpánek, P., and Büntgen, U. : Climate warming induced synchronous growth decline in Norway spruce populations across biogeographical gradients since 2000, Sci. Total Environ., 752, 141794, https://doi.org/10.1016/j.scitotenv.2020.141794, 2021.
Böttcher, H. and Frelih-Larsen, A.: Options for Strengthening Natural Carbon Sinks and Reducing Land Use Emissions in the EU, Öko-Institut e.V., Working paper, 66 pp., https://www.oeko.de/en/publications/p-details/options-for-strengthening-natural-carbon-sinks-and-reducing-land-use-emissions-in-the-eu (last access: 27 June 2022), 2021.
Böttcher, H., Kurz, W. A., and Freibauer, A.: Accounting of forest carbon sink and sources under a future climate protocol-factoring out past disturbance and management effects on age-class structure, For. Ecol. Manage, 11, 669–686, https://doi.org/10.1016/j.envsci.2008.08.005, 2008.
Camia, A., Giuntoli, J., Jonsson, K., Robert, N., Cazzaniga, N., Jasinevičius, G., Avitabile, V., Grassi, G., Barredo Cano, J. I., and Mubareka, S.: The use of woody biomass for energy production in the EU, EUR 30548 EN, Publications Office of the European Union, Luxembourg, 182 pp., https://doi.org/10.2760/831621, 2020.
Chapin, F. S., Woodwell, G. M., Randerson, J. T., Rastetter, E. B., Lovett, G. M., Baldocchi, D. D., Clark, D. A., Harmon, M. E., Schimel, D. S., Valentini, R., Wirth, C., Aber, J. D., Cole, J. J., Goulden, M. L., Harden, J. W., Heimann, M., Howarth, R. W., Matson, P. A., McGuire, A. D., Melillo, J. M., Mooney, H. A., Neff, J. C., Houghton, R. A., Pace, M. L., Ryan, M. G., Running, S. W., Sala, O. E., Schlesinger, W. H., and Schulze, E. D.: Reconciling carbon-cycle concepts, terminology, and methods, Ecosystems, 9, 1041–1050, https://doi.org/10.1007/s10021-005-0105-7, 2006.
Collins, W. J., Bellouin, N., Doutriaux-Boucher, M., Gedney, N., Halloran, P., Hinton, T., Hughes, J., Jones, C. D., Joshi, M., Liddicoat, S., Martin, G., O'Connor, F., Rae, J., Senior, C., Sitch, S., Totterdell, I., Wiltshire, A., and Woodward, S.: Development and evaluation of an Earth-System model – HadGEM2, Geosci. Model Dev., 4, 1051–1075, https://doi.org/10.5194/gmd-4-1051-2011, 2011.
Cuddington, K., Fortin, M. J., Gerber, L. R., Hastings, A., Liebhold, A., O'connor, M., and Ray, C.: Process-based models are required to manage ecological systems in a changing world, Ecosphere, 4, 1–12, https://doi.org/10.1890/ES12-00178.1, 2013.
Dufresne, J.-L., Foujols, M.-A., Denvil, S., Caubel, A., Marti, O., Aumont, O., Balkanski, Y., Bekki, S., Bellenger, H., Benshila, R., Bony, S., Bopp, L., Braconnot, P., Brockmann, P., Cadule, P., Cheruy, F., Codron, F., Cozic, A., Cugnet, D., de Noblet, N., Duvel, J.-P., Ethé, C., Fairhead, L., Fichefet, T., Flavoni, S., Friedlingstein, P., Grandpeix, J.-Y., Guez, L., Guilyardi, E., Hauglustaine, D., Hourdin, F., Idelkadi, A., Ghattas, J., Joussaume, S., Kageyama, M., Krinner, G., Labetoulle, S., Lahellec, A., Lefebvre, M.-P., Lefevre, F., Levy, C., Li, Z.X., Lloyd, J., Lott, F., Madec, G., Mancip, M., Marchand, M., Masson, S., Meurdesoif, Y., Mignot, J., Musat, I., Parouty, S., Polcher, J., Rio, C., Schulz, M., Swingedouw, D., Szopa, S., Talandier, C., Terray, P., Viovy, N., and Vuichard, N.: Climate change projections using the IPSL-CM5 Earth System Model: from CMIP3 to CMIP5, Clim. Dynam., 40, 2123–2165, https://doi.org/10.1007/s00382-012-1636-1, 2013.
Dugan, A. J., Lichstein, J. W., Steele, A., Metsaranta, J. M., Bick, S., and Hollinger, D. Y.: Opportunities for forest sector emissions reductions: a state-level analysis, Ecol. Appl., 31, e02327, https://doi.org/10.1002/eap.2327, 2021.
EC: Communication from the Commission to the European Parliament, the Council, the European Economic and Social Committee and the Committee of the Regions – Stepping up Europe's 2030 climate ambition. Investing in a climate-neutral future for the benefit of our people, COM(2020)562 final, https://ec.europa.eu/transparency/regdoc/rep/10102/2020/EN/SWD-2020-176-F1-EN-MAIN-PART-1.PDF (last access: 27 June 2022), 2020a.
EC: EU Biodiversity Strategy for 2030, Bringing nature back into our lives, Communication from the Commission to the European Parliament, the Council, the European Economic and Social Committee and the Committee of the Regions, COM(2020) 380 final, Brussels, European Commission, https://eur-lex.europa.eu/legal-content/EN/TXT/?uri=CELEX:52020DC0380 (last access: 27 June 2022), 2020b.
EC: New EU Forest Strategy for 2030, Communication from the Commission to the European Parliament, the Council, the European Economic and Social Committee and the Committee of the Regions, COM(2021) 572 final, Brussels, European Commission, https://eur-lex.europa.eu/legal-content/EN/ALL/?uri=CELEX:52021DC0572 (last access: 27 June 2022), 2021a.
EC: Proposal for a Regulation of the European Parliament and of the Council amending Regulations (EU) 2018/841 as regards the scope, simplifying the compliance rules, setting out the targets of the Member States for 2030 and committing to the collective achievement of climate neutrality by 2035 in the land use, forestry and agriculture sector, and (EU) 2018/1999 as regards improvement in monitoring, reporting, tracking of progress and review, COM(2021) 554 final, Brussels, European Commission, https://ec.europa.eu/info/sites/default/files/revision-regulation-ghg-land-use-forestry_with-annex_en.pdf (last access: 27 June 2022), 2021b.
FAOSTAT: https://www.fao.org/faostat/en/#data/FO (last access: 27 June 2022), 2020.
Forest Europe: State of Europe's Forests 2020, https://foresteurope.org/state-europes-forests-2020/ (last access: 27 June 2022), 2020.
Forzieri, G., Girardello, M., Ceccherini, G., Spinoni, J., Feyen, L.,Hartmann, H., Beck, P. S. A., Campus-Valls, G., Chirici, G., Mauri, A., and Cescatti, A.: Emergent vulnerability to climate-driven disturbances in European forests, Nat. Commun., 12, 1081, https://doi.org/10.1038/s41467-021-21399-7, 2021.
Gao, S., Zhou, T., Zhao, X., Wu, D., Li, Z., Wu, H., Du, L., and Luo, H.: Age and climate contribution to observed forest carbon sinks in East Asia, Environ. Res. Lett., 11, 034021, https://doi.org/10.1088/1748-9326/11/3/034021, 2016.
Gautam, S., Mishra, U., Scown, C. D., Wills, S. A., Adhikari, K., and Drewniak, B. A.: Continental United States may lose 1.8 petagrams of soil organic carbon under climate change by 2100, Global Ecol. Biogeogr., 31, 1147–1160, https://doi.org/10.1111/geb.13489, 2022.
Grassi, G., Pilli, R., House, J., Federici, S., and Kurz, W. A.: Science-based approach for credible accounting of mitigation in managed forests, Carbon Balance and Management, 13, 8, https://doi.org/10.1186/s13021-018-0096-2, 2018.
Grassi, G., Fiorese, G., Pilli, R., Jonsson, K., Blujdea, V., Korosuo, A., and Vizzarri, M.: Brief on the role of the forest-based bioeconomy in mitigating climate change through carbon storage and material substitution, edited by: Sánchez López, J., Jasinevičius, G., and Avraamides, M., European Commission, 16 pp., https://publications.jrc.ec.europa.eu/repository/handle/JRC124374 (last access: 27 June 2022), 2021.
Gundersen, P., Thybring, E. E., Nord-Larsen, T., Vesterdal, L., Nadelhoffer, K. J., and Johannsen, V. K.: Old-growth forest carbon sinks overestimated, Nature, 591, 21–23, https://doi.org/10.1038/nature07276, 2021.
Hararuk, O., Shaw, C., and Kurz, W. A.: Constraining the organic matter decay parameters in the CBM-CFS3 using Canadian National Forest Inventory data and a Bayesian inversion technique, Ecol. Model., 364, 1–12, https://doi.org/10.1016/j.ecolmodel.2017.09.008, 2017.
Hasenauer, H., Neumann, M., Moreno, A., and Running, S.: Assessing the resources and mitigation potential of European forests, Energy Proced., 125, 372–378, https://doi.org/10.1016/j.egypro.2017.08.052, 2017.
IPCC, Climate change and land: An IPCC special report on climate change, desertification, land degradation, sustainable land management, food security, and greenhouse gas fluxes in terrestrial ecosystems, Intergovernmental Panel on Climate Change, https://www.ipcc.ch/srccl/ (last access: 27 June 2022), 2019.
Jandl, R., Ledermann, T., Kindermann, G., Freudenschuss, A., Gschwantner, T., and Weiss, P.: Strategies for climate-smart forest management in Austria, Forests, 9, 592, https://doi.org/10.3390/f9100592, 2018.
Jevšenak, J., Klopčič, M., and Mali, B.: The effect of harvesting on national forest carbon sinks up to 2050 simulated by the CBM-CFS3 model: a case study from Slovenia, Forests, 11, 1090, https://doi.org/10.3390/f11101090, 2020.
Jonsson, R., Rinaldi, F., Pilli, R., Fiorese, G., Hurmekosksi, E., Cazzaniga, N. E., Robert, N., and Camia, A.: Boosting the EU forest-based bioeconomy: market, climate change mitigation, and employment impacts, Technol. Forecast. Soc., 163, 120478, https://doi.org/10.1016/j.techfore.2020.120478, 2021.
Kawamiya, M., Hajima, T., Tachiiri, K., Watanabe, S., and Yokohata, T.: Two decades of Earth system modeling with an emphasis on Model for Interdisciplinary Research on Climate (MIROC), Progress in Earth and Planetary Science, 7, 1–13, https://doi.org/10.1186/s40645-020-00369-5, 2020.
Kirschbaum, M. U. F., Eamus, D., Gifford, R. M., Roxburgh, S. H., and Sands, P. J.: Definitions of some ecological terms commonly used in carbon accounting, Cooperative Research Centre for Carbon Accounting, Canberra, 2–5, http://hdl.handle.net/102.100.100/202607?index=_1 (last access: 27 June 2022), 2001.
Köhler, L., Hölscher, D., and Leuschner, C.: High litterfall in old-growth and secondary upper montane forest of Costa Rica, Plant Ecol., 199, 163–173, https://doi.org/10.1007/s11258-008-9421-2, 2008.
Köhl, M., Linser, S., Prins, K., and Talarczyk, A.: The EU climate package “Fit for 55”-a double-edged sword for Europeans and their forests and timber industry, Forest Policy Econ., 132, 102596, https://doi.org/10.1016/j.forpol.2021.102596, 2021.
Korosuo, A., Vizzarri, M., Pilli, R., Fiorese, G., Colditz, R., Abad Viñas, R., Rossi, S., and Grassi, G.: Forest reference levels under Regulation (EU) 2018/841 for the period 2021–2025, EUR 30403 EN, Publications Office of the European Union, Luxembourg, 278 pp., https://doi.org/10.2760/0521, 2021.
Kurz, W. A., Dymond, C. C., White, T. M., Stinson, G., Shaw, C. H., Rampley, G. J., and Apps, M. J.: CBM-CFS3: a model of carbon-dynamics in forestry and land-use change implementing IPCC standards, Ecol. Model., 220, 480–504, https://doi.org/10.1016/j.ecolmodel.2008.10.018, 2009.
Lanz, A. and Marchetti, M.: Criterion 3: Maintenance and Encouragement of Productive Functions of Forests (Wood and Non-Wood), In FOREST EUROPE, 2020: State of Europe's Forests 2020, https://foresteurope.org/state-europes-forests-2020/ (last access: 27 June 2022), 2020.
Leturcq, P.: GHG displacement factors of harvested wood products: the myth of substitution, Sci. Rep., 10, 1–9, https://doi.org/10.1038/s41598-020-77527-8, 2020.
Liu, C., Westman, C. J., Berg, B., Kutsch, W., Wang, G. Z., Man, R., and Ilvesniemi, H.: Variation in litterfall-climate relationships between coniferous and broadleaf forests in Eurasia, Glob. Ecol. Biogeogr., 13, 105–114, https://doi.org/10.1111/j.1466-882X.2004.00072.x, 2004.
Luyssaert, S., Ciais, P., Piao, S. L., Schulze, E.-D., Jung, M., Zaehle, S., Schelhaas, M. J., Reichstein, M., Churkina, G., Papale, D., Abril, G., Beer, C., Grace, J., Loustau, D., Matteucci, G., Magnani, F., Nabuurs, G. J., Verbeeck, H., Sulkava, M., Van der werf, G. R., Janssens, I. A., and members of the CARBOEUROPE-IP SYNTHESIS TEAM: The European carbon balance, Part 3: forests, Global Change Biol., 16, 1429–1450, https://doi.org/10.1111/j.1365-2486.2009.02056.x, 2010.
Luyssaert, S., Schulze, E., Knohl, A., Law, B. E., Ciais, P., and Grace, J.: Reply to: Old-growth forest carbon sinks overestimated, Nature, 591, 24–25, https://doi.org/10.1038/s41586-021-03266-z, 2021.
McGrath, M. J., Luyssaert, S., Meyfroidt, P., Kaplan, J. O., Bürgi, M., Chen, Y., Erb, K., Gimmi, U., McInerney, D., Naudts, K., Otto, J., Pasztor, F., Ryder, J., Schelhaas, M.-J., and Valade, A.: Reconstructing European forest management from 1600 to 2010, Biogeosciences, 12, 4291–4316, https://doi.org/10.5194/bg-12-4291-2015, 2015.
Morin, X., Fahse, L., Jactel, H., Scherer-Lorenzen, M., García-Valdés, R., and Bugmann, H.: Long-term response of forest productivity to climate change is mostly driven by change in tree species composition, Sci. Rep., 8, 5627, https://doi.org/10.1038/s41598-018-23763-y, 2018.
Mubareka, S., Barredo, J. I., Giuntoli, J., Grassi, G., Migliavacca, M., Robert, N., and Vizzarri, M.: The role of scientists in EU forest-related policy in the Green Deal era, One Earth, 5, 10–13, https://doi.org/10.1016/j.oneear.2021.12.013, 2022.
Müllerová, J., Hédl, R., and Szabó, P.: Coppice abandonment and its implications for species diversity in forest vegetation, Forest Ecol. Manag., 343, 88–100, https://doi.org/10.1016/j.foreco.2015.02.003, 2015.
Nabuurs, G. J., Schelhaas, M. J., and Pussinen, A.: Validation of the European Forest Information Scenario Model (EFISCEN) and a projection of Finnish forests, Silva Fenn., 34, 167–179, https://doi.org/10.14214/sf.638, 2000.
Nabuurs, G. J., Delacote, P., Ellison, D., Hanewinkel, M., Hetemäki, L., and Lindner, M.: By 2050 the Mitigation Effects of EU Forests Could Nearly Double through Climate Smart Forestry, Forests, 8, 484, https://doi.org/10.3390/f8120484, 2017.
Neumann, M., Moreno, A., Thurnher, C., Mues, V., Härkönen, S., Mura, M., and Hasenauer, H.: Creating a regional MODIS satellite-driven net primary production dataset for European forests, Remote Sens., 8, 554, https://doi.org/10.3390/rs8070554, 2016.
Pilli, R., Fiorese, G., and Grassi G.: EU mitigation potential of harvested wood products, Carbon Balance and Management, 10, 1–16, https://doi.org/10.1186/s13021-015-0016-7, 2015.
Pilli, R., Grassi, G., Kurz, W. A., Moris, J. V., and Viñas, R. A.: Modelling forest carbon stock changes as affected by harvest and natural disturbances. II. EU-level analysis, Carbon Balance and Management, 11, 1–19, https://doi.org/10.1186/s13021-016-0059-4, 2016.
Pilli, R., Grassi, G., Kurz, W. A., Fiorese, G., and Cescatti, A.: The European forest sector: past and future carbon budget and fluxes under different management scenarios, Biogeosciences, 14, 2387–2405, https://doi.org/10.5194/bg-14-2387-2017, 2017a.
Pilli, R., Kull, S., Blujdea, V., and Grassi, G.: The EU Archive Index Database customised for the Carbon Budget Model (CBM-CFS3), European Commission, Joint Research Centre (JRC) [data set], https://data.jrc.ec.europa.eu/dataset/jrc-cbm-eu-aidb (last access: 1 June 2020), 2017b.
Pilli, R., Kull, S. J., Blujdea, V. N., and Grassi, G.: The carbon Budget model of the Canadian forest sector (CBM-CFS3): customization of the archive index database for European Union countries, Ann. Forest Sci., 75, 1–7, https://doi.org/10.1007/s13595-018-0743-5, 2018.
Pretzsch, H., Grote, R., Reineking, B., Rötzer, T. H., and Seifert, S. T.: Models for Forest Ecosystem Management: A European Perspective, Ann. Bot-London, 101, 1065–1087, https://doi.org/10.1093/aob/mcm246, 2008.
Pukkala, T.: Calculating the additional carbon sequestration of Finnish forestry, J. Sustain. Forest., 0, 1–18, https://doi.org/10.1080/10549811.2020.1792935, 2020.
Reyer, C., Lasch-Born, P., Suckow, F., Gutsch, M., Murawski, A., and Pilz, T.: Projections of regional changes in forest net primary productivity for different tree species in Europe driven by climate change and carbon dioxide, Ann. For. Sci., 71, 211–225, https://doi.org/10.1007/s13595-013-0306-8, 2013.
Running, S. W., Nemani, R. R., Heinsch, F. A., Zhao, M., Reeves, M., and Hashimoto, H.: Continuous Satellite-Derived Measure of Global Terrestrial Primary Production, BioScience, 54, 547–560, https://doi.org/10.1641/0006-3568(2004)054[0547:ACSMOG]2.0.CO;2, 2004.
Rüter, S., Werner, F., Forsell, N., Prins, C., Vial, E., and Levet, A. L.: ClimWood2030 – Climate benefits of material substitution by forest biomass and harvested wood products: Perspective 2030, Final report, Thünen Report 42, Thünen Institute, Braunschweig, Germany, 148 pp., https://doi.org/10.3220/REP1468328990000, 2016.
Schelhaas, M.-J., Eggers, J., Lindner, M., Nabuurs, G.-J., Pussinen, A., Päivinen, R., Schuck, A., Verkerk, P. J., van der Werf, D. C., and Zudin, S.: Model documentation for the European Forest Information Scenario model (EFISCEN 3.1.3), Alterra report 1559 and EFI technical report 26, Alterra and European Forest Institute, Wageningen and Joensuu, 118 pp., https://efi.int/publications-bank/model-documentation-european-forest-information-scenario-model-efiscen-313 (last access: 27 June 2022), 2007.
Senf, C. and Seidl, R.: Persistent impacts of the 2018 drought on forest disturbance regimes in Europe, Biogeosciences, 18, 5223–5230, https://doi.org/10.5194/bg-18-5223-2021, 2021.
Shifley, S. R., He, H. S., Lischke, H., Wang, W. J., Jin, W., Gustafson, E. J., Thompson, J. R., Thompson III, F. R., Dijak, W. D., and Yang, J.: The past and future of modeling forest dynamics: from growth and yield curves to forest landscape models, Landscape Ecol., 32, 1307–1325, https://doi.org/10.1007/s10980-017-0540-9, 2017.
Skytt, T., Englund, G., and Jonsson, B. G.: Climate mitigation forestry – temporal trade-offs, Environ. Res. Lett., 16, 114037, https://doi.org/10.1088/1748-9326/ac30fa, 2021.
Smith, B., Wårlind, D., Arneth, A., Hickler, T., Leadley, P., Siltberg, J., and Zaehle, S.: Implications of incorporating N cycling and N limitations on primary production in an individual-based dynamic vegetation model, Biogeosciences, 11, 2027–2054, https://doi.org/10.5194/bg-11-2027-2014, 2014.
Smyth, C. E., Trofymow, J. A., Kurz, W. A., and CIDET Working Group: Decreasing uncertainty in CBM-CFS3 estimates of forest soil C sources and sinks through use of long-term data from the Canadian Intersite Decomposition Experiment, https://publications.gc.ca/site/eng/9.619535/publication.html (last access: 27 June 2022), 2009.
Sperlich, D., Nadal-Sala, D., Gracia, C., Kreuzwieser, J., Hanewinkel, M., and Yousefpour, R.: Gains or Losses in Forest Productivity under Climate Change? The Uncertainty of CO2 Fertilization and Climate Effects, Climate, 8, 141, https://doi.org/10.3390/cli8120141, 2020.
Sun, G. and Mu, M.: The analyses of the net primary production due to regional and seasonal temperature differences in eastern China using the LPJ model, Ecol. Model., 289, 66–76, https://doi.org/10.1016/j.ecolmodel.2014.06.021, 2014.
Tang, J., Luyssaert, S., Richardson, A. D., Kutsch, W., and Janssens, I. A.: Steeper declines in forest photosynthesis than respiration explain age-driven decreases in forest growth, P. Natl. Acad. Sci. USA, 111, 8856–8860, https://doi.org/10.1073/pnas.1320761111, 2014.
Taylor, K. E., Stouffer, R. J., and Meehl, G. A.: An overview of CMIP5 and the experiment design, B. Am. Meteorol. Soc., 93, 485–498, https://doi.org/10.1175/BAMS-D-11-00094.1, 2012.
Tomter, S. M., Kuliešis, A., and Gschwantner, T: Annual volume increment of the European forests – description and evaluation of the national methods used, Annals Forest Sci., 73, 849–856, https://doi.org/10.1007/s13595-016-0557-2, 2016.
Ťupek, B., Zanchi, G., Verkerk, P. J., Churkina, G., Viovy, N., Hughes, J. K., and Lindner, M.: A comparison of alternative modelling approaches to evaluate the European forest carbon fluxes, Forest Ecol. Manag., 260, 241–251, https://doi.org/10.1016/j.foreco.2010.01.045, 2010.
UNFCCC CRF Tables: UNFCCC Common reporting format tables, https://unfccc.int/ghg-inventories-annex-i-parties/2021 (last access: 27 June 2022), 2021.
Valade, A., Bellassen, V., Magand, C., and Luyssaert, S.: Sustaining the sequestration efficiency of the European forest sector, Forest Ecol. Manag., 405, 44–55, https://doi.org/10.1016/j.foreco.2017.09.009, 2017.
Valkonen, S., Aulus Giacosa, L., and Heikkinen, J.: Tree mortality in the dynamics and management of uneven-aged Norway spruce stands in southern Finland, Eur. J. Forest. Res., 139, 989–998, https://doi.org/10.1007/s10342-020-01301-8, 2020.
Verkerk, P. J., Costanza, R., Hetemäki, L., Kubiszewski, I., Leskinen, P., Nabuurs, G. J., Potočnik, J. and Palahí, M.: Climate-Smart Forestry: the missing link, Forest Policy Econ., 115, 102164, https://doi.org/10.1016/j.forpol.2020.102164, 2020.
Vizzarri, M., Pilli, R., Korosuo, A., Blujdea, V. N., Rossi, S., Fiorese, G., Abad-Viñas, R., Coldiz, R. R., and Grassi, G.: Setting the forest reference levels in the European Union: overview and challenges, Carbon Balance and Management, 16, 1–16, https://doi.org/10.1186/s13021-021-00185-4, 2021.
Wang, J. A., Baccini, A., Farina, M., Randerson, J. T., and Friedl, M.A.: Disturbance suppresses the aboveground carbon sink in North American boreal forests, Nat. Clim. Change, 11, 435–441, https://doi.org/10.1038/s41558-021-01027-4, 2021.
Warszawski, L., Frieler, K., Huber, V., Piontek, F., Serdeczny, O., and Schewe, J.: The inter-sectoral impact model intercomparison project (ISI–MIP): project framework, P. Natl. Acad. Sci. USA, 111, 3228–3232, https://doi.org/10.1073/pnas.1312330110, 2013.
Welle, T., Leinen, L., Bohr, Y. E. M. B., and Vorländer, A. K.: Waldvision für die Europäische Union, edited by: Naturwaldakademie on behalf of Greenpeace, https://greenwire.greenpeace.de/system/files/2020-12/eu_waldvision_english.pdf (last access: 27 June 2022), 2020.
Yousefpour, R., Temperli, C., Jacobsen, J. B., Thorsen, B. J., Meilby, H., Lexer, M. J., Lindner, M., Bugmann, H., Borges, J. G., Palma, J. H. N., Ray, D., Zimmermann, N. E., Delzon, S., Kremer, A., Kramer, K., Reyer, C. P. O., Lasch-Born, P., Garcia-Gonzalo, J., and Hanewinkel, M.: A framework for modeling adaptive forest management and decision making under climate change, Ecol. Soc., 22, 40, https://doi.org/10.5751/ES-09614-220440, 2017.
Zaehle, S., Sitch, S., Prentice, I. C., Liski, J., Cramer, W., Erhard, M., Hickler, T., and Smith, B.: The importance of age-related decline in forest NPP for modeling regional carbon balances, Ecol. Appl., 16, 1555–1574, https://doi.org/10.1890/1051-0761(2006)016[1555:TIOADI]2.0.CO;2, 2006.
Zhao, M., Golaz, J.-C., Held, I. M., Guo, H., Balaji, V., Benson, R., Chen, J.-H., Chen, X., Donner, L. J., Dunne, J. P., Dunne, K., Durachta, J., Fan, S.-M., Freidenreich, S. M., Garner, S. T., Ginoux, P., Harris, L. M., Horowitz, L. W., Krasting, J. P., Langenhorst, A. R., Liang, Z., Lin, P., Lin, S.-J., Malyshev, S. L., Mason, E., Milly, P. C. D., Ming, Y., Naik, V., Paulot, F., Paynter, D., Phillipps, P., Radhakrishnan, A., Ramaswamy, V., Robinson, T., Schwarzkopf, D., Seman, C. J., Shevliakova, E., Shen, Z., Shin, H., Silvers, L. G., Wilson, J. R., Winton, M., Wittenberg, A. T., Wyman, B., and Xiang, B.: The GFDL global atmosphere and land model AM4.0/LM4.0: 2. Model description, sensitivity studies, and tuning strategies, J. Adv. Model. Earth Sy., 10, 735–769, https://doi.org/10.1002/2017MS001209, 2018.