the Creative Commons Attribution 4.0 License.
the Creative Commons Attribution 4.0 License.
 | 15 Jul 2022
Controls on autotrophic and heterotrophic respiration in an ombrotrophic bog
Tracy E. Rankin
Nigel T. Roulet
Tim R. Moore
Northern peatlands are globally significant carbon stores, but the sink strength may vary from year-to-year due to variations in environmental and biogeochemical conditions. This variation is mainly brought about by changes in primary production and in autotrophic respiration (AR; respiration by plant parts), components that we understand reasonably well. Heterotrophic respiration (HR; respiration by the soil microbial community, mycorrhizal fungi, etc.), on the other hand, is crudely measured and simulated, which may lead to biased estimates if a change favours one form of respiration over another. HR has only recently been shown to be more intimately linked to vegetation dynamics than once thought, particularly in wetter, oligotrophic, sedge-dominated ecosystems. The objective of this study is to determine the factors that relate to the spatial and temporal variability in respiration and its autotrophic and heterotrophic components in an ombrotrophic bog (Mer Bleue) where woody shrubs are dominant and to see if the more dynamic nature of HR in sedges also exists in this bog. Plot level measurements using manual chambers were used to partition respiration from both the dominant shrubs and the sparse sedges at the site, and the controls on respiration were explored by measuring a variety of environmental variables, such as air and soil temperatures (T) and water table (WT) depth. Results show that AR and HR correlate primarily with air and soil T, with WT depth playing an important role in some cases, and that a higher variability in respiration exists for the shrub plots than the sedge plots, especially when WT levels are more variable. Our findings also show that a plant's response to changes in climate is related to the plants' root structure, which indicates different mechanisms of obtaining water resources and utilizing associations with other plants around them. These results will improve our understanding of peatland carbon cycling, as well as improve the conceptualization of HR.
- Article
(982 KB) - Full-text XML
- BibTeX
- EndNote


Northern peatlands play a significant role in the global carbon (C) cycle, covering 12 % of Canada's terrestrial surface (Tarnocai et al., 2011), and contain ∼50 % of the organic C stored in Canadian soils (Tarnocai, 2006). Slow decomposition of plant material in undisturbed peatlands leads to the accumulation of peat, making natural peatlands long-term sinks of C. Following the last glaciation, peatlands have accumulated C at an average rate of 23–26 g m−2 yr−1 (Charman et al., 2013; Loisel et al., 2014). However, on shorter timescales, a natural peatland may be a source or a sink of C depending on the environmental conditions of a given year and on biogeochemical conditions (Dorrepaal et al., 2009; Roulet et al., 2007). Although most of the variability in CO2 exchange comes from changes in gross primary production (GPP) and AR (Blodau, 2002; Heimann and Reichstein, 2008), the dynamics of heterotrophic respiration are not straightforward. HR is correlated with environmental and substrate variables, such as moisture and litter quality (e.g., Minkkinen et al., 2007; St-Hilaire et al., 2010), but has recently been shown to be more complicated, made up of various components that are likely to change differently as environmental conditions are altered. For example, Fan et al. (2013) suggest that long-term exposure to warmer conditions may lead to an increase in HR outpacing an increase in C input and C sequestration will weaken, which they attribute to root–soil interactions and a change in the transport of labile C. Similarly, Basiliko et al. (2012) highlight the difficulties in separating root respiration from HR, and organic C that is supplied as a substrate by the vascular plants, causing a priming effect (Robroek et al. 2016), is not easily discernible from root respiration. Belowground processes are more connected to aboveground production than just the slow decomposition of dead organic matter, especially when root dynamics are considered (Ryan and Law, 2005; Van Hees et al., 2005). This has been seen in sedge-dominated or forested peatlands (Järveoja et al., 2018; Kurbatova et al., 2013; Wang et al., 2014) and in permafrost ecosystems (Crow and Wieder, 2005; Hicks Pries et al., 2015). However, it is unknown whether this same level of vegetation influence on HR exists in shrub-dominated peatlands as well. This paper addresses the influence of vegetation on HR in a mid-continental, raised bog.
Ecosystem respiration (ER) dynamics have been explored in peatlands, mainly through eddy covariance techniques (e.g., Cai et al., 2010; Humphreys et al., 2014; Peichl et al., 2014) and using darkened chambers (e.g., Järveoja et al., 2018; Lai, 2012) which explore C exchange at a scale that towers cannot address. Models have been developed that attempt to predict how the components of the C balance (e.g., ER) will vary with a changing climate (e.g., Abdalla et al., 2014; Frolking et al., 2002). A peatland's response in respiration to climate change has been attributed to the plant's carbon use efficiency (Lin et al., 2014) and how the carbon accumulation will be altered (Bunsen and Loisel, 2020). However, different outcomes in a peatland's C cycle following a change in climate may also occur, depending on which respiration source dominates the response. For example, if HR dominates the response, the system will lose C to the atmosphere that had been stored for hundreds to thousands of years, creating a positive feedback to climate change. In contrast, if AR dominates the response, the system will either turn over newly photosynthesized C faster, causing a positive feedback to climate change, or may fix more C, causing a negative feedback to climate change (Hicks Pries et al., 2013). Consequently, the contributions of AR and HR to total respiration may be ecosystem specific (Griffis et al., 2000; Ojanen et al., 2012). Phillips et al. (2017) argue that creating a large database with more robust, improved soil respiration data will benefit further developments of models that aim to incorporate terrestrial C cycling.
Additionally, it is likely that a plant's response to a change in environmental conditions can also be explained by the various mechanisms in which the plants obtain water resources. Malhotra et al. (2020) suggest that environmental changes, such as warming and a lowering of the water table, can alter fine-root production, affecting water and nutrient uptake and hence ER and C storage. Oke and Hager (2020) suggest that a plant's distribution, in bogs especially, depends on physiological tolerances and ecological strategies. Some plants may even take advantage of associations they have with other plants and may fix the respired CO2 from the surrounding vegetation rather than using CO2 directly from the atmosphere in the process of photosynthesis, which has been shown to be the case for Sphagnum mosses (Kuiper et al., 2014; Shao, 2022; Turetsky and Wieder, 1999). This also indicates a problem in the conceptualization of HR: one cannot simply partition AR and HR contributions when there is clearly an intermediate form of what is traditionally thought of as HR, in that the C is assimilated from other sources, but where the rate of litter supply is related to plant production through root–soil interactions and belowground processes rather than through plant biomass (Shao et al., 2022). While some peatland carbon models have simulated the influence of hydrological, vegetation, and microbial dynamics on soil respiration (Abdalla et al., 2014; He et al., 2018; Heinemeyer et al., 2010; Shao et al., 2022), most peatland models still crudely simulate HR, and manual measurements only crudely partition AR and HR using constant ratios or fixed decomposition rates, which may lead to an overestimation of C sequestration if a change favours one form of respiration over another (Hungate et al., 1997). How the role of vegetation dynamics, and the more complex nature of HR, will change ecosystem structure is still not well documented.
The objectives of this study are to determine the factors that control the spatial and temporal variability in ecosystem respiration and its autotrophic and heterotrophic components at Mer Bleue, a mid-continental, temperate, ombrotrophic raised bog. More specifically, this paper aims to (1) determine the contributions of AR and HR at Mer Bleue, (2) establish the environmental controls on AR and HR, and (3) explore the dependence of AR and HR contributions to ER on plant functional type.
2.1 Study site
Mer Bleue is a 28 km2 ombrotrophic bog located near Ottawa, Ontario (45.41∘ N, 75.52∘ W). It is in a cool continental climate region, with a mean annual temperature of 6.4 ∘C ranging from −10.3 ∘C in January to 21.0 ∘C in July. Mean annual precipitation is 943 mm, 350 mm of which falls from May to August, with a mean annual snowfall of 223 cm (Environment Canada; 1981–2010 climate normals). Peat depth reaches about 5 to 6 m near the centre of the bog and is shallower (<0.3 m) near the beaver pond margin. Bog development began 7100–6800 years ago, and it has a hummock–lawn microtopography (Roulet et al., 2007). The surface of the bog is covered by Sphagnum mosses (Sphagnum angustifolium, Sphagnum capillifolium, Sphagnum fallax, Sphagnum magellanicum), and the vascular plant cover is dominated by low growing ericaceous evergreen shrubs that make up about 80 % of the areal coverage (mainly Chamaedaphne calyculata, with some Rhododendron groenlandicum, and Kalmia angustifolia) and an occasional mix of sedges (Eriophorum vaginatum and Carex oligosperma) (Humphreys et al., 2014; Lai et al., 2014).
The sedges have root structures that extend vertically downwards, sometimes up to 50 cm depth, and can consequently tap into the water table at deeper depths even during the drier parts of the season as well as support a greater aboveground biomass than shrubs, especially when the water table (WT) fluctuates greatly (Buttler et al., 2015; Pouliot et al., 2012). In contrast, the shrubs allocate more of their biomass to belowground roots, which tend to spread out laterally rather than vertically with root lengths limited to within the first 20–30 cm of the surface (Iversen et al., 2018; M. Murphy et al., 2009), hence supporting a greater relative belowground-to-aboveground biomass than sedges. Shrubs also allocate energy to small, needle-like stems (small in diameter but great in height) to make use of whatever water is available to the plants in the soil, while minimizing the loss of water through transpiration (Bonan, 2008). These stems are also buried annually by the mosses, contributing significantly to the greater belowground biomass (M. T. Murphy et al., 2009). Stem burial occurs mostly for shrubs like C. calyculata, the dominant shrub species at the site, while other shrubs like R. groenlandicum tend to have thick leaves to prevent desiccation during drought periods (Warren et al., 2021), highlighting differences in hydraulic strategies of species that can affect ecosystem function.
Although shrubs are quite adapted for relatively wet and dry conditions, with studies finding a shift to greater shrub cover with water table drawdown (M. Murphy et al., 2009), sedges are a more competitive plant functional type than shrubs, being one of the first colonizers in abandoned extracted peatlands as they can handle more extreme fluctuations in moisture conditions (Lavoie et al., 2003). Although the sedges cover only 3 % to 17 % of the surface area of Mer Bleue (Kalacska et al., 2013), the respiration dynamics of this plant functional type is quite important. The mosses are mixed with the other vegetation, so finding plots of just mosses was almost impossible. Therefore, the plots as described below contained either Eriophorum and mosses (the “sedge section”) or Chamaedaphne and mosses (the “shrub section”).
2.2 Chamber setup (direct CO2 fluxes)
We conducted direct CO2 measurements at the plot level using manual chambers (Pelletier et al., 2011). Nine circular collars of about 26 cm diameter were randomly placed over areas that were shrub-dominated (shrub section), and nine collars were placed over areas that were sedge-dominated (sedge section). All the collars were sampled weekly to bi-weekly (every 2 weeks), weather depending, from May through September in the 2018 and 2019 growing seasons.
Fluxes were obtained using a transparent static chamber (diameter of 26 cm and height of 50 cm) placed and sealed over permanent PVC collars inserted into the peat to a depth of 15 cm at each sampling location. The chamber contained a fan to allow for adequate mixing, and a cooling system was used to maintain ambient temperature conditions (Waddington et al., 2010). For each collar, a full light measurement was done using the transparent chamber, representing the net ecosystem exchange (NEE) for that plot, and a dark round was conducted using a covered chamber. This represented the ecosystem respiration (ER) for that plot.
In the spring of both 2018 and 2019, some of the plots were manipulated to be able to tease apart the influence of vegetation (Table 1); we applied two treatments and one control to each plot in each section. CO2 measurements were started roughly 2 weeks after the manipulations. In each section, three plots were designated as reference plots with intact vegetation, representing NEE and ER for the measurements conducted under light and dark measurements, respectively; three plots had all the aboveground vegetation removed (“clipped plots”) where measurements were conducted under dark conditions only; and three plots were deemed “shrub only” and “sedge only”, where only the mosses were removed (i.e., vascular plants remained) and where measurements were also conducted under dark conditions only. In the plots representing no vegetation (clipped plots), the roots surrounding the plots were trenched to kill the roots outside of the plots, and root exclosures were set up to prevent roots from entering the plots from below. We assumed that the clipped plots represented HR, with the understanding that there will have been a residual component from the decomposing roots. However, re-clipping and re-trenching was done periodically throughout 2018 and 2019. A layer of green mesh was also placed on top of the bare peat in the clipped plots to minimize any confounding effects of temperature and moisture. We then assumed AR = ER – HR. We followed the ecosystem sign convention, where a positive NEE value represents a gain of C to the ecosystem and a positive value for ER represents a loss of C from the ecosystem.
Table 1Manual chamber setup with descriptions of manipulations and reported measurements.
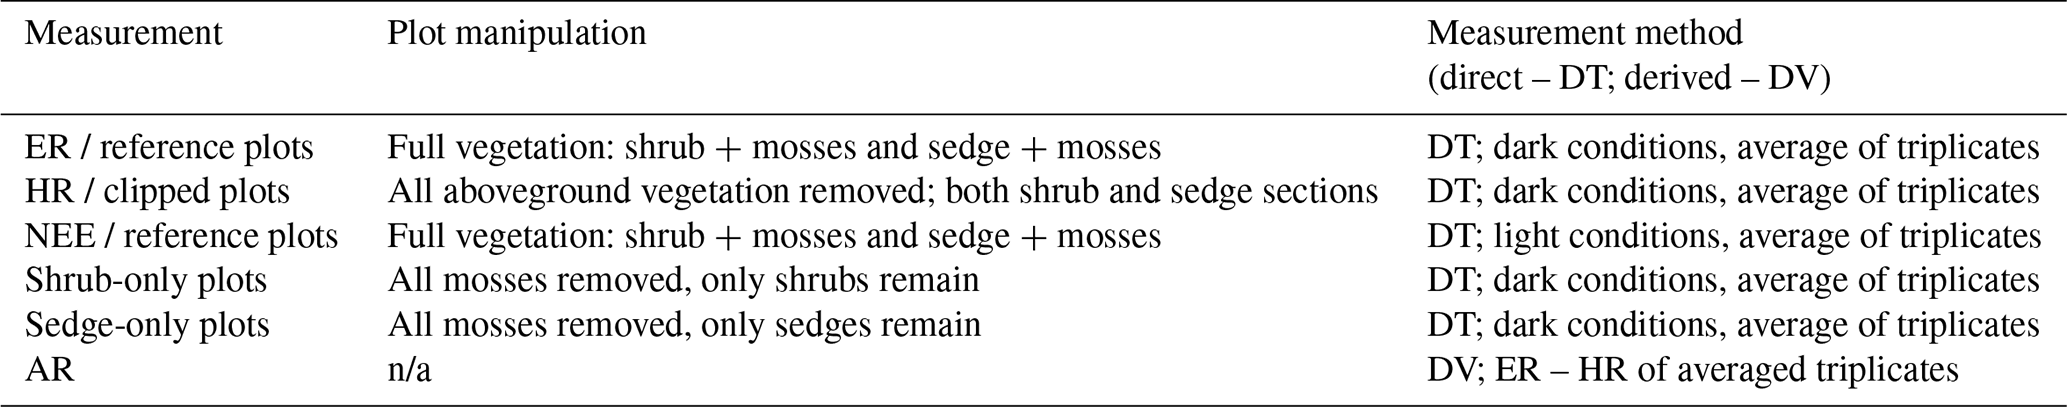
n/a stands for not applicable.
In 2018, the CO2 concentrations were measured every 5 s over a period of 5 min, using an ultra-portable greenhouse gas analyser (Los Gatos Research (LGR), San Jose, California). The LGR was calibrated beforehand, and a round started when stabilized ambient concentrations of CO2 were reached. In 2019, the site was too wet to safely carry in the LGR, so a smaller portable CO2 gas analyser (EGM-4, PP Systems, Amesbury, Massachusetts) was used instead. CO2 concentrations were measured every 10 s for the first minute, then every 30 s after that, for a total of 5 min. The EGM-4 was zeroed before each round. In September of 2018, CO2 measurements of a few collars were measured one after the other using both instruments to get a standardized set of fluxes. There was no significant difference between the fluxes measured with the two gas analysers (T=1.59, P value =0.13). In both years, linear regression equations of concentrations over time were used to calculate a flux for CO2 for each 5 min period. Only regressions with R2 values over 0.8 were kept, which resulted in less than 10 % of the values being removed. There were no instances where CO2 concentrations remained the same over the measurement period, which would have indicated a very low R2 value.
2.3 Environmental variables
At the time of sampling, water table (WT) depth was determined manually using a permanently installed perforated PVC tube beside each set of three collars. Soil temperatures were obtained using a temperature probe inserted to depths of 0, 5 and 10 cm, roughly in the same location each time just outside of each collar. Daily air temperatures were obtained from the Ottawa International Airport weather station, located about 18 km southwest of the site (Environment Canada, 2021).
To determine if there was any hysteresis between soil water content and WT depth, continuous measurements of both variables were conducted at the meteorological station next to the eddy covariance tower about 50 m away from the manual chamber setup. Measures of volumetric water content (VWC) at 40 cm depth were measured using time-domain reflectometry (TDR) probes (model CS615, Campbell Scientific, Alberta, Canada) inserted in the peatland hummocks, and water table levels were determined using capacitance water level probes (Odyssey, Dataflow Systems PTY Limited, Christchurch, New Zealand). Signals from the sensors were monitored on a CR7X and a CR10X data logger every 5 s, averaged every 30 min (Lafleur et al., 2005), and the daily averages were used in the analysis.
Thermocouples were installed in the peat to measure soil temperatures at 10 and 40 cm depths. These were measured every second, with 30 min averages as an output. However, daily daytime averages were used in the analysis (using excel pivot tables and filtering for values between 08:00 and 18:00). Continuous 30 min records of WT depths were also obtained in each area of the manual chamber locations, with capacitance water level probes, which were placed inside the same perforated PVC tubes previously inserted in the peat beside each set of three collars, as described above. Daily averages were used in the analysis.
2.4 Statistical analyses
Statistical analyses were performed using the R statistical software (RStudio, version 4.0.2). As 2018 was an anomalously warm year at Mer Bleue and elsewhere across the globe (Lees et al., 2021; Arain et al., 2022), we analysed the respiration fluxes from the plant types separately for 2018 and 2019. First, simple linear and multiple regressions were conducted among the respiration fluxes (ER, HR, and AR) and the various environmental variables using the “stats” package in R. Second, regression trees were conducted with the “rpart” package in R, which uses stepwise regression models and recursive partitioning, to determine which environmental variable best predicted the respiration response (Brieman et al., 1984), similar to the regression trees conducted by Melling et al. (2005), who determined controls on soil CO2 fluxes in tropical peatlands. Analysis of variance (ANOVA) is used to test the significance of the regression trees (Brieman et al., 1984). Third, repeated measures analysis of variance (ANOVA) tests were conducted using the “car” package in R to determine if the fluxes from the different treatments were significantly different, and two sample t tests were conducted using the “stats” package to determine whether the fluxes were significantly different between the two plant types and whether the fluxes measured with the two gas analysers were significantly different. We consider individual p values less than or equal to 0.10 as significant. Finally, coefficients of variation (standard deviation mean of population) were conducted to determine the degree of variability in AR contributions to ER as described in Abdi (2010).
3.1 Environmental variables
The growing season of 2018 was characterized by variable (more sporadic) weather conditions based on the manual measurements of WT depth and soil temperatures (soil T) at 10 cm depth and the mean daily air temperatures (air T) taken from the weather station nearby (Fig. 1a) (Environment Canada, 2021). Air temperatures ranged from 21 to 35∘, soil temperatures (at 10 cm depth) ranged between 12 and 27∘, and WT depth ranged between 23 and 47 cm depth (June–August mean WT = 34 cm depth). It was also a hot year compared to the normal averages, where the mean annual temperature for July, for example, is 21.0 ∘C (Environment Canada, 1981–2010 climate normals), and a drier start to the growing season than normal for June and July, but generally a wetter August and September than normal (Teklemariam et al., 2010), with a significant rise in WT depth following a series of large rain events.
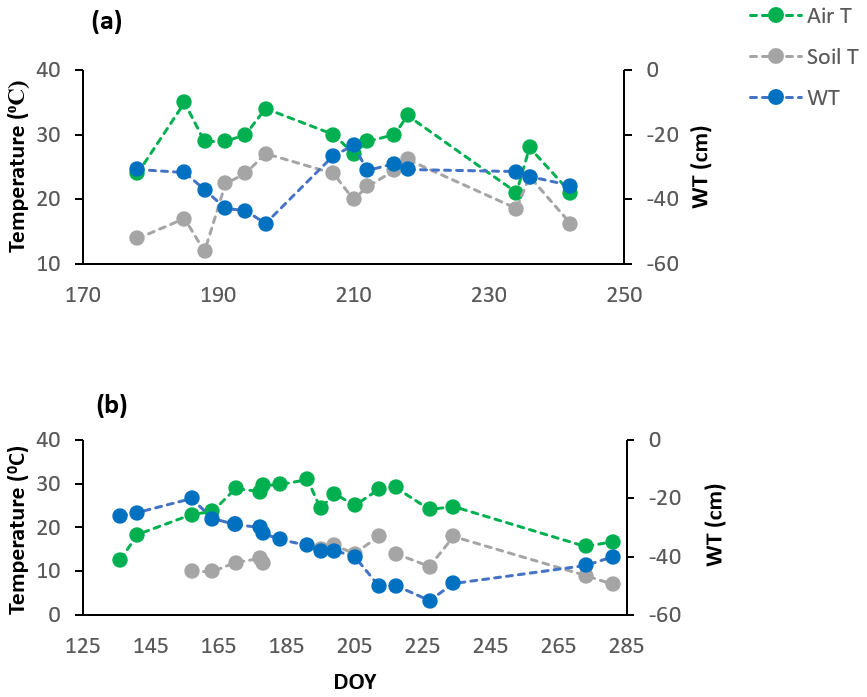
Figure 1Environmental variables for the growing seasons of (a) 2018 and (b) 2019. Soil T is soil temperature at 10 cm depth, taken manually along with WT depth, while the mean daily air temperatures (air T) were taken from the weather station nearby.
The growing season of 2019 had less variable weather conditions than 2018, despite a greater range in WT depth; it was wetter in May and June compared to the normal averages and then consistently became warmer and drier as the growing season progressed (Fig. 1b), with WT depth similar to normal averages in July and August (Teklemariam et al., 2010). Mean daily air temperatures (23 to 31∘) and soil temperatures at 10 cm depth (10 and 18∘) had a much smaller range than in 2018, and WT depth ranged between 20 and 55 cm depth (May–August mean WT = 36.5 cm depth).
A hysteresis existed between volumetric water content (VWC) and WT depth in 2018 (Fig. 2a), the growing season that showed an abrupt rise in water table position (Fig. A1a). The hysteresis was not as pronounced in 2019 (Fig. 2b); we had fewer data available for VWC and WT depth measurements in 2019, which may have led to the hysteresis being less obvious. Nonetheless, 2019 is where water table positions more consistently decreased over the growing season and only slightly rose in September with the start of the fall rains (Fig. A1), which likely also played a role in the hysteresis loop being less obvious in 2019 than 2018. We do not have VWC measurements for the different treatments unfortunately, only the data from the probes near the eddy covariance tower. Although it is important to acknowledge the hysteresis present, we could show that the relationship between WT depth and VWC is correlated (Fig. 2); thus, WT depth is a reasonable surrogate for changes in VWC.
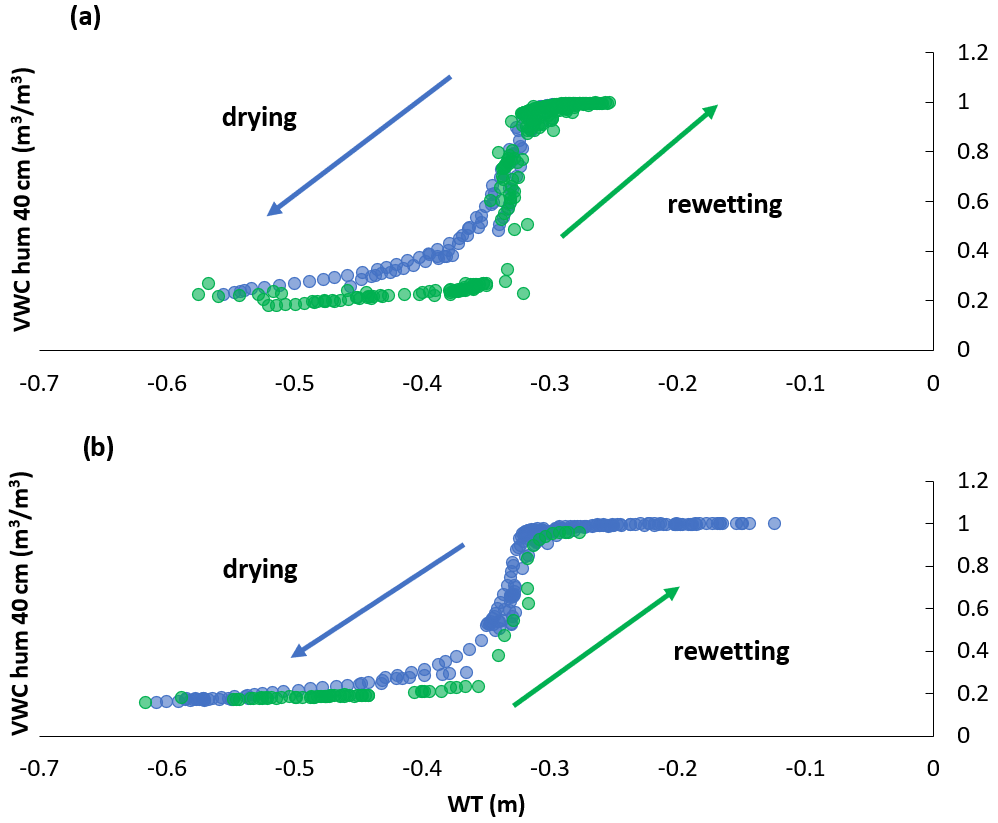
Figure 2Hysteresis (a) in 2018 and (b) in 2019, between WT depth (m) and volumetric water content (VWC, m−3 m−3) at 40 cm depth in the hummocks.
3.2 CO2 fluxes and AR contributions
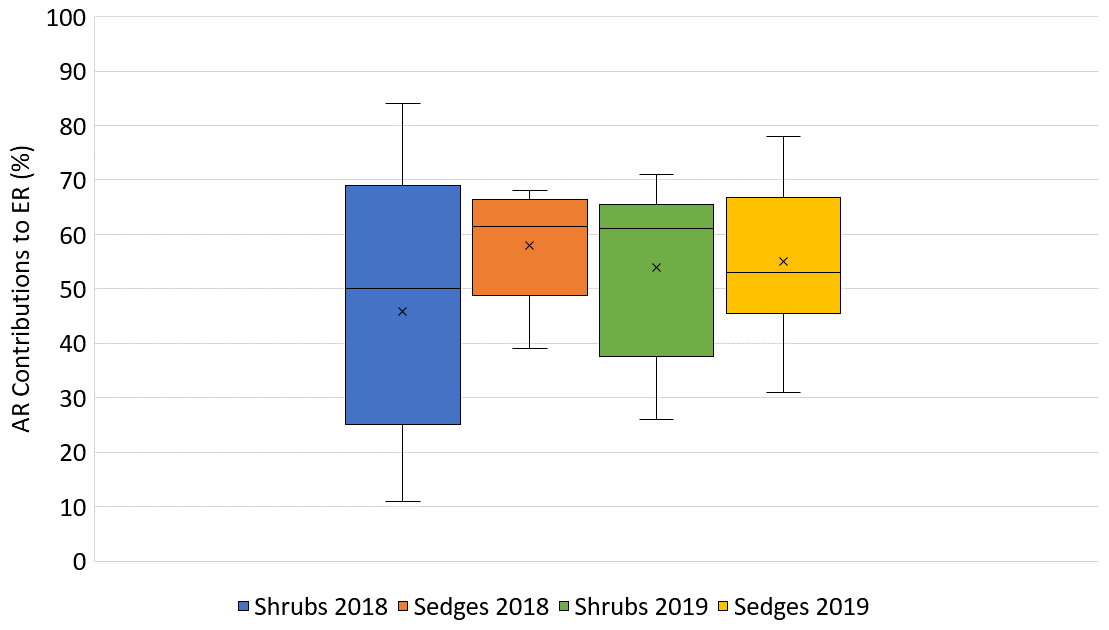
In 2018, NEE and respiration values were greater for the sedges than the shrubs but less variable (Table 2). Shrub plot NEE averaged 461 ± 103 mg CO2 m−2 h−1 (± SD), 195 ± 81 mg CO2 m−2 h−1 for HR, 414 ± 154 mg CO2 m−2 h−1 for ER, and 250 ± 69 mg CO2 m−2 h−1 in the shrub-only plots (Fig. 3a). Sedge plot NEE averaged 827 ± 139 mg CO2 m−2 h−1, 240 ± 25 mg CO2 m−2 h−1 for HR, 625 ± 131 mg CO2 m−2 h−1 for ER, and 356 ± 42 mg CO2 m−2 h−1 in the sedge-only plots (Fig. 3b). AR (derived from the difference between ER and HR measurements) averaged 187 ± 134 mg CO2 m−2 h−1 in the shrubs and 385 ± 127 mg CO2 m−2 h−1 in the sedges (Fig. A2a, b), while AR contributions to ER averaged 47 ± 24 % for the shrubs and 61 ± 10 % for the sedges in 2018 (Fig. 5a).
Table 2Annual average ecosystem respiration (ER), autotrophic respiration (AR), heterotrophic respiration (AR), and net ecosystem exchange (NEE) values for the shrubs and sedges in 2018 and 2019 (± SD).
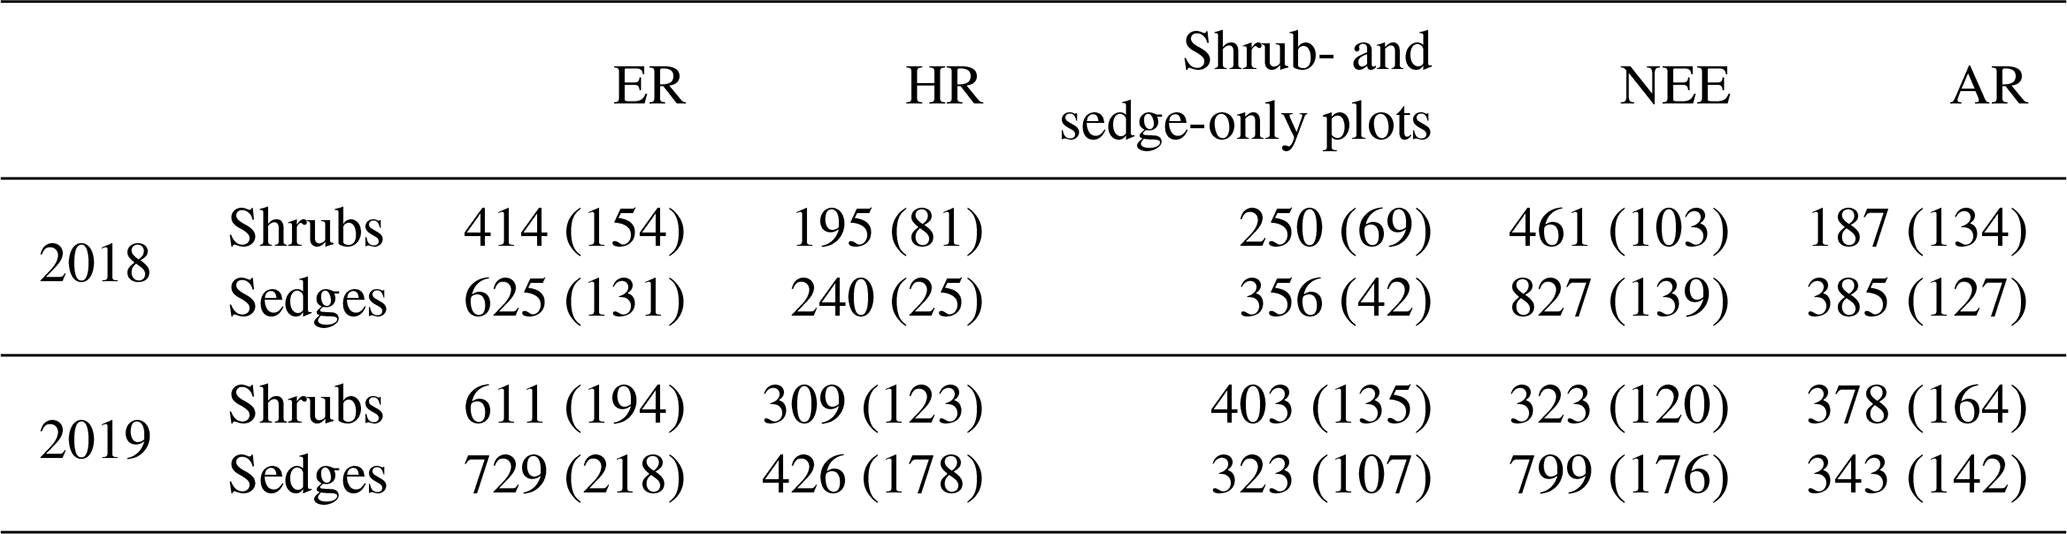
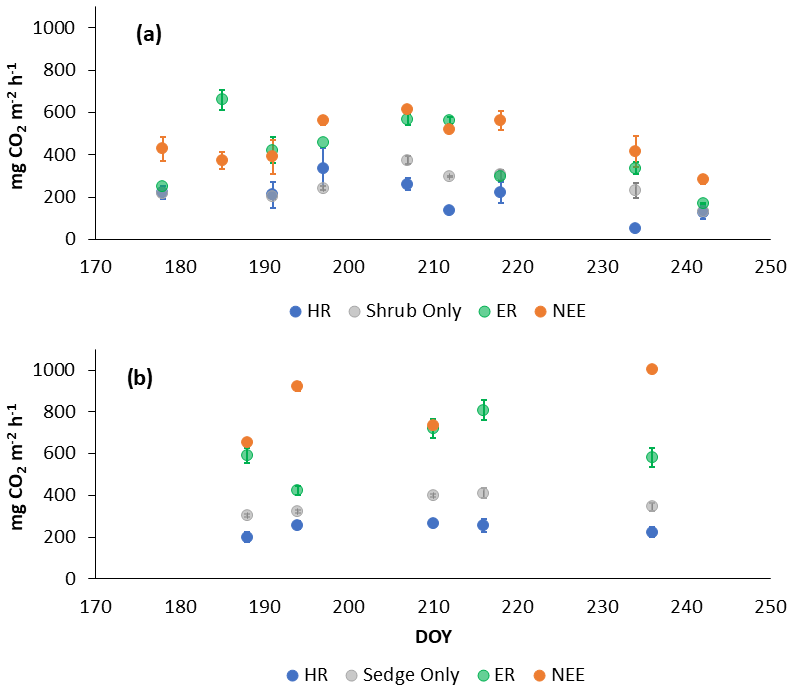
Figure 3Average CO2 fluxes in the (a) shrub plots and (b) sedge plots across the growing season of 2018 (± standard error).
In 2019, NEE and respiration values were also greater for the sedges than the shrubs, but the variability was similar between the plant types (Table 2). The shrub plot NEE averaged 323 ± 120 mg CO2 m−2 h−1, 309 ± 123 mg CO2 m−2 h−1 for HR, 611 ± 194 mg CO2 m−2 h−1 for ER, and 403 ± 135 mg CO2 m−2 h−1 in the shrub-only plots (Fig. 4a). Sedge plot NEE averaged 799 ± 176 mg CO2 m−2 h−1, 426 ± 178 mg CO2 m−2 h−1 for HR, 729 ± 218 mg CO2 m−2 h−1 for ER, and 323 ± 107 mg CO2 m−2 h−1 in the sedge-only plots (Fig. 4b). AR fluxes averaged 378 ± 164 mg CO2 m−2 h−1 in the shrubs and 343 ± 142 mg CO2 m−2 h−1 in the sedges (Fig. A2c, d), while AR contributions to ER averaged 62 ± 16 % for the shrubs and 55 ± 14 % for the sedges (Fig. 5b).
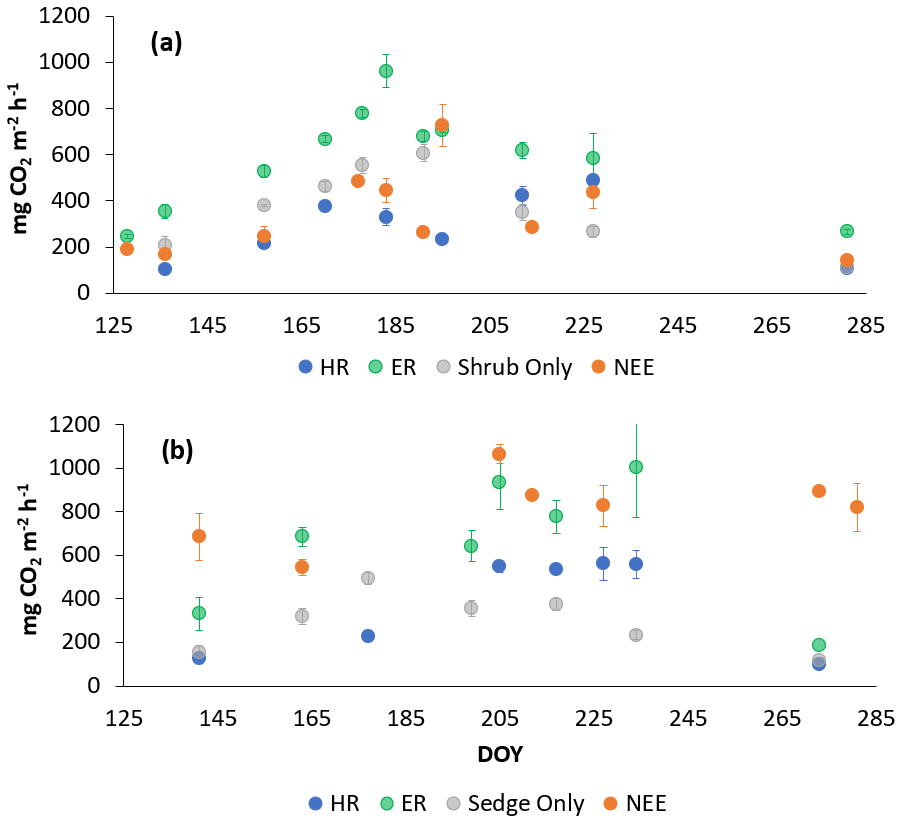
Figure 4Average CO2 fluxes in the (a) shrub plots and (b) sedge plots across the growing season of 2019 (± standard error).
3.3 Statistical analyses
Repeated measures ANOVA shows that the fluxes from the different manipulation treatments were significantly different for both the sedges (F=24.4, P=0.0004, DF = 13) and the shrubs (F=6.045, P=0.0077, DF = 23) in 2018 as well as the sedges (F=4.9, P=0.0180, DF = 20) and the shrubs (F=4.57, P=0.0210, DF = 23) in 2019. There was a significant difference in ER (, P=0.0920, DF = 15) between the sedges and the shrubs, but only for 2018 and not for 2019, whereas NEE was only significantly different between the sedges and the shrubs in 2019 and not 2018 (, P=0.0260, DF = 18). Subsequently, between the two years, NEE (, P=0.0181, DF = 18), ER (, P=0.0508, DF = 18), and respiration from the shrub-only plots (, P=0.0583, DF = 15) were significantly different but not for the sedge-only plots.
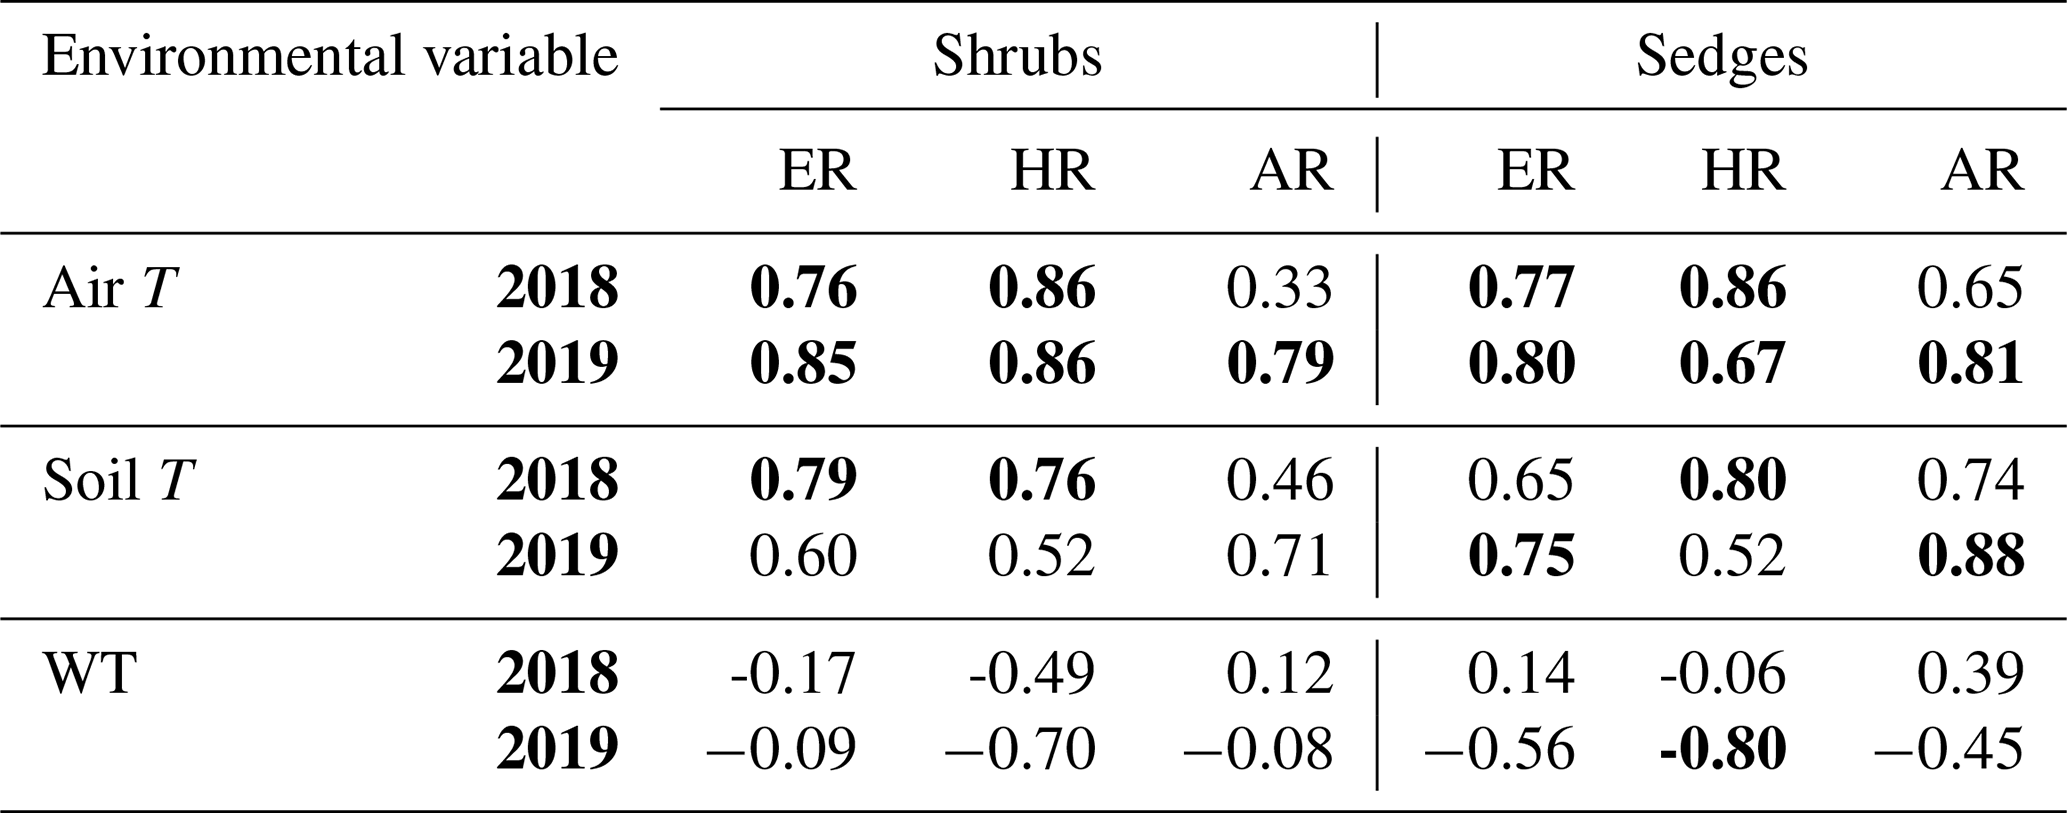
When the environmental controls on the CO2 fluxes were considered individually, the variance in fluxes of ER and HR was correlated with air temperature for both plant types and in both growing seasons and with soil temperature for the shrubs in 2018. Soil temperature was also correlated with HR in 2018 and with ER in 2019 for the sedges. The variance in AR fluxes was a bit more complex. The growing season of 2018 showed no relationships with AR fluxes for any of the environmental variables, whereas for 2019, air temperature explained much of the variance in the shrubs, and air and soil temperature explained much of the variance in the sedges (Table 3). Correlation analyses revealed a positive relationship between temperature and respiration, where warmer temperature increased ER and HR (Table A1). Combining the two years of data would have allowed for more data points and hence increased the accuracy of the results, but since 2018 was anomalously warm, this would have produced spurious relationships, especially for the shrubs, where although the slope was similar, respiration fluxes in 2019 were higher than 2018 for the same air and soil temperature (Figs. 6 and 7).
Table 3Coefficient of determination (R2) for linear regressions between respiration (ER, AR, and HR) and environmental variables in 2018 and 2019 with p values in brackets and significant relationships (p<0.1) in bold. WT is water table depth, air T is air temperature measured at the flux tower, and soil T is soil temperature at 10 cm depth.
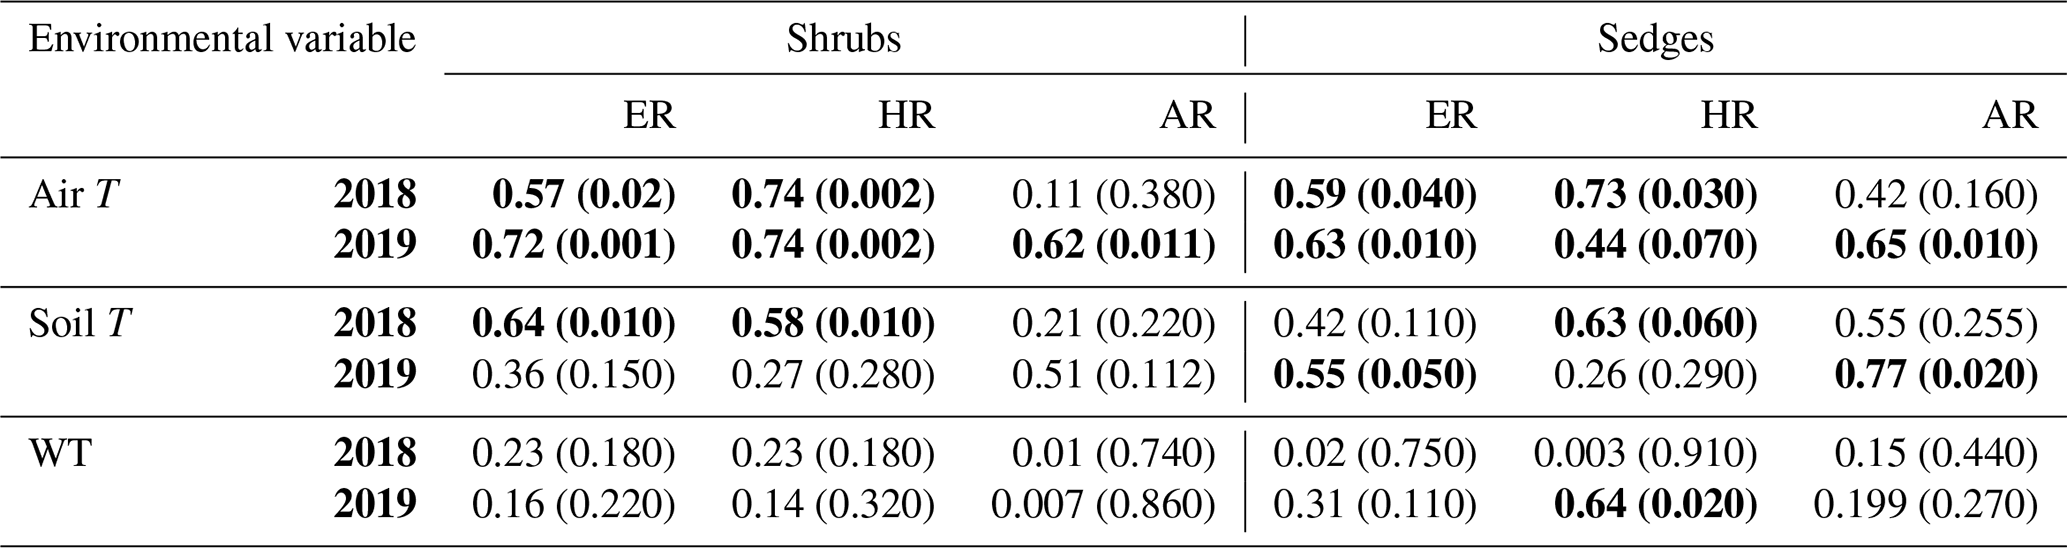

Figure 6Scatterplots with trend lines of relationships between air temperature and (a) ER, (b) HR, and (c) AR; between soil temperature and (d) ER, (e) HR, and (f) AR; and between water table (WT) depth and (g) ER, (h) HR, and (i) AR in the shrubs across the growing seasons of 2018 and 2019. High WT refers to water table positions from surface to 35 cm depth.

Figure 7Scatterplots with trend lines of relationships between air temperature and (a) ER, (b) HR, and (c) AR; between soil temperature and (d) ER, (e) HR, and (f) AR; and between water table (WT) depth and (g) ER, (h) HR, and (i) AR in the sedges across the growing seasons of 2018 and 2019. High WT refers to water table positions from surface to 35 cm depth.
Although there seemed to be only one significant linear relationship with WT depth and HR in 2019 for the sedges (Table 3), a lower WT was generally associated with increased ER, AR, and HR fluxes (Table A1, Figs. 6 and 7). Linear regression analyses from 2019 in the shrubs showed greater relationships between ER, AR, and HR and WT depths when the water table was above 35 cm (R2 increased to between 0.50 and 0.70 in all cases, with p values <0.05), whereas the relationships broke down when the water tables were below 35 cm (Fig. 6). Although technically only the relationship between HR and WT depth in 2019 for the sedges was significant (Table 3), WT depth correlated well with ER and AR too (Table A1). When the water table was above 35 cm, the relationship between HR and WT depth was similar to when all the data points were considered, but the relationships with ER and AR were better correlated, with R2 increasing to 0.71 and 0.66, respectively. While the relationships between respiration fluxes and WT depth with a low water table were worse in the sedges than when all WT depths were considered, correlations with all the WT depths considered were still greater in the sedges than in the shrubs (Figs. 6 and 7). There were not enough data points in 2018 to test the difference in linear relationships with various WT ranges for either plant type, which is a limitation of our study, where more continuous measurements of the controls on respiration components (e.g., using automatic chambers) would be beneficial.
Multiple regression analyses, though, showed the interactive effect of both temperature and WT position explained much of the variance in CO2 fluxes for ER and HR. This was true for both plant types and in both growing seasons. However, there were only strong relationships found between AR and a combination of WT depth and air and soil temperature in 2019 for both plant types and no relationships in 2018 (Table 4). The regression trees show that in 2018, air temperature was the factor that best predicted the CO2 fluxes for the sedges (explained ∼70 % of the respiration response) followed by WT depth (explained ∼30 % of the respiration response), whereas soil temperature best predicted the CO2 fluxes for the shrubs (explained ∼50 % of the respiration response) followed by air temperature (explained ∼40 % of the respiration response), for both ER and AR (all R2 values ∼0.70). Air and soil temperature seemed to be the best factors to predict HR for both plant types, where the combined explanation of the respiration response exceeded 80 % (R2∼0.80). In contrast, the regression trees show that WT depth was a much more important factor in predicting the resulting CO2 fluxes in 2019, where the explanation of the respiration response was ∼40 % in most cases (all R2 values ∼0.60). Air temperature was still the more prominent factor though, where the explanation of the respiration response was ∼60 % in most cases (R2∼0.70).
Table 4Coefficient of determination (R2) for multiple regressions between respiration (ER, AR, and HR) and environmental variables in 2018 and 2019 with p values in brackets and significant relationships (p<0.1) in bold. WT is water table depth, air T is air temperature measured at the flux tower, and soil T is soil temperature at 10 cm depth. “NaN” refers to there not being enough data points to determine significance.

Additionally, the growing season of 2018 resulted in quite variable AR contributions to ER from the shrubs, with a coefficient of variation of 54 %, whereas the AR from the sedges only had a coefficient of variation of 19 %. In contrast, the variation in AR contributions to ER in 2019 was much less variable for the shrubs, with a coefficient of variation of ∼30 % for both plants. However, if one were to remove the one very low AR contribution value from the shrub time series, which occurred at the hottest and driest part of the season, the average AR contribution for the shrubs in 2019 would be much greater than the sedges (∼70 %) and even less variable.
4.1 AR and HR contributions to ER and environmental controls on CO2 fluxes
ER and NEE were similar to those found in other studies (Bubier et al., 2007; Flanagan and Syed, 2011; Humphreys et al., 2014; Sulman et al., 2010), where the sedge plots showed greater respiration and NEE fluxes than the shrubs plots (Helbig et al., 2019; Lai, 2012). We found that average AR contributions to ER at Mer Bleue, calculated from direct plot measurements, were also consistent with findings in the literature (Maier and Kress, 2000; Schuur and Trumbore, 2006). Hardie et al. (2009), for example, reported AR contributions from a blanket bog in the UK uplands to range between 41 % and 54 % of the total ecosystem CO2 flux, using direct static chamber measurements as well.
The respiration fluxes varied, sometimes considerably, and our results show that the variability in ER and HR was driven by changes in temperature and WT position. For example, air and soil temperatures had the greatest influence on CO2 fluxes, especially for measures of ER and HR when linear regressions were conducted with individual environmental variables (Table 3). While in some studies it may seem as though temperature is the dominant factor driving changes in ecosystem functioning and peatland C cycling (Cai et al., 2010; Charman et al., 2013), others indicate that soil moisture (or the degree of wetness) may also play an important role (e.g., Belyea and Malmer, 2004). Von Buttlar et al. (2018) suggest that, together, heat and drought events lead to the strongest C sink reduction compared to any single-factor extreme. Mäkiranta et al. (2010) similarly state that a warming climate may raise respiration from peat decomposition, but only if the decrease in moisture of the surface layers is minor, thus favouring further decomposition.
Temporal and spatial variability in respiration arises because AR and HR are affected differently with climate variability. Wang et al. (2014) suggest that both HR and AR are affected by changes in air temperature but that HR does not acclimate as fast as AR, so we often see a shift towards higher ratios in warming experiments. For example, Grogan and Jonasson (2005) found that newly photosynthesized C by plants was more sensitive to changes in temperature than the C derived from older stores of soil organic matter (SOM) deeper in the peat. AR contributions to ER were highest in cooler and wetter conditions and lowest in hotter and drier conditions and varied considerably, especially in 2018 (Fig. 5). The erratic behaviour in weather conditions throughout the growing season of 2018 may explain the lack in any detectable statistical relationship relating AR to the environmental variables and the lack in statistical relationships with WT depth in general, especially in the shrubs. The greater hysteresis present would imply that the WT did not rebound as quickly during a rain event or drop as quickly when conditions became drier. However, the WT dropped even further towards the end of the growing season in 2019 than it did throughout the growing season of 2018. It seems that the less variable weather conditions and increased wetness towards the beginning of the growing season may have led to both plant types having a similar AR contribution in 2019.
Lai et al. (2014) found the relationship with temperature changed with varying moisture conditions. We found the same with an increase in the significance of the linear relationship with WT position when a certain range of WT depths were considered (Figs. 6 and 7). Multiple regression analyses also showed it was the interactive effect of both temperature and water table position that explained much of the variance. This was especially true for the sedges (Table 4). These findings are partially explained by the change in weather conditions and the functioning of the plants themselves. Where the growing season of 2018 was characterized by a sharp rise in WT midway through the season and consisted of a hotter and drier June and July than normal, the growing season of 2019 was characterized by less variable weather conditions but more wet in May and June than normal (Fig. 1). Considering that sedges can tap into deep water sources, it is reasonable that the respiration of the sedges would be more affected by water table depth than the shrubs; shrub roots spread out laterally and are thus more disconnected from the water table for large parts of the growing season, and most roots do not function well if they are in very saturated conditions (Iversen et al., 2018; Murphy and Moore, 2010). The HR fluxes seem to follow the same general trend as the ER fluxes for the shrubs, more so than for the sedges, in both years despite the more variable weather conditions in 2018, possibly highlighting the stronger influence of soil temperature than WT depth on respiration fluxes for the shrubs. Furthermore, ER was significantly different between the shrubs and the sedges in 2018, as well as significantly different between the two study years for the shrubs. This would further suggest that sporadic weather conditions and fluctuating WT depth has more of an effect on the respiration from the shrubs than it does on the sedges.
4.2 AR and HR dependence on the plant functional type
One of the keys to understanding how the vegetation responds to the surrounding environment is to determine the capacity of the plant functional types to adapt to hydrologic and temperature extremes, or hot and dry conditions (Porporato et al., 2004). The sedges have much higher productivity rates than the shrubs for this reason (Frolking et al., 1998); the vegetation not only possesses roots that can survive in semi-permanent saturated conditions but also tends to allocate a lot of its energy to aboveground leaves to increase the loss of water to the atmosphere and balance the presence of an increased water supply. Sedges have vertical root structures that can tap into the WT at deeper depths even during the drier parts of the season (Buttler et al., 2015) and can consequently support a greater aboveground biomass when WT depth fluctuates, hence showing a higher average AR contribution to ER than the shrubs in 2018 (M. Murphy et al., 2009). On the other hand, shrubs, which often dominate ecosystems like bogs that have a water table at a greater depth for longer periods of time, allocate more of their energy to belowground roots and to smaller needle-like stems so they can make use of whatever water is available to the plants in the soil, while minimizing the loss of water aboveground through transpiration (Bonan, 2008; Murphy and Moore, 2010). The shrubs seem to take advantage of this, by relying on the water retained by the mosses closer to the surface (Nijp et al., 2017), and hence show a greater variability in aboveground respiration and consequently in AR contributions to ER when the WT depths fluctuate a lot like they did in 2018 (Mccarter and Price, 2014). It also possibly explains why AR contributions to ER are greater for the shrubs than the sedges in 2019, when changes in WT depth were more consistent.
The respiration dynamics depend on the mechanisms of the different plant functional types in obtaining water resources, and the relationships of the vascular plants with the mosses seem to play a vital role in how the plants respond to a change in climate. Indeed, Järveoja et al. (2018) found in a fen in northern Sweden that it was plant phenology that drove respiration dynamics rather than abiotic factors. Our study found that in the shrubs, the CO2 fluxes were, at times, greater for HR than they were in the shrub-only plots. These instances seem to coincide with periods that were hot and dry (Figs. 3 and 4), and in 2018 it was a phenomenon only seen in the shrubs; the sedges never showed this despite measurements taken around the same time. This suggests that the shrubs are more intimately associated with the mosses around them than are the sedges, as Chiapusio et al. (2018) also found in their study. Along with a more pronounced hysteresis loop in 2018, this also supports our argument that the shrubs are more disconnected from WT dynamics than the sedges. A change in soil temperature, which affects mainly the surface, would influence the shrub's response more so than WT position or soil moisture, whereas the sedges would be more affected by changes in WT depth for most of the growing season (Figs. 6 and 7), due to the difference in root structure between the two plant types. In 2019, on the other hand, DOY 191–217 was one of the hotter parts of the growing season, where the water tables during this hot period were lower than they were for the dry period in 2018 and consisted of less sporadic rain events, indicated by the less obvious hysteresis loop. This may explain why the CO2 fluxes were, at times, greater for HR than they were in the shrub-only and sedge-only plots in 2019. While a greater HR in warmer periods could suggest increased microbial activity and/or oxygen availability (Sulman et al., 2010), these findings could also indicate that both vascular plants have some sort of relationship with the mosses, as Crow and Wieder (2005) found in their study, or it could be explained by the ability of the mosses, with their phenotypic plasticity, to cope with rising temperatures and repeated droughts (Jassey and Signarbieux, 2019).
Similar manipulations have been applied to chamber setups to determine contributions of AR and HR by removing all of the roots belowground as well, a process known as girdling (Hahn et al., 2006; Hardie et al., 2009). However, these were done mainly in forested systems where roots are more easily removed without disturbing surrounding vegetation like the mosses surrounding the vascular plants in a bog. In peatlands, this is too invasive an approach, and we opted to remove only the aboveground vegetation, while keeping in mind that residuals of the roots left behind may contribute to the fluxes we measure. There was, at times, a difference in respiration between the light and dark rounds measured from the clipped plots, especially in 2018 (data not shown). This may be explained by the slow decomposition of the roots, especially in the sedges, where constant re-clipping throughout the growing season was necessary. Stewart (2006) suggests, for example, that the soil organic matter decomposition is 1.6 to 1.9 times greater in the hollows (where the sedges mostly reside) than in the hummocks. However, we examined patterns of respiration mainly in the hummocks, which represent 70 % of the bog (Lafleur et al. 2005), and incorporated mosses, shrubs, and sedges. Marinier et al. (2004) found that re-clipping was necessary in their study but that a root exclosure helped in minimizing the ingrowth of new roots; thus, we also included a root exclosure around our plots. This re-clipping requirement may also explain why the repeated measures ANOVA analyses between the treatments was not as significantly different in 2019 than in 2018. However, we also did not find any statistically significant difference between the HR fluxes between the plants, which one would expect if a difference in root residuals were to play a major role. This finding was promising; respiration from all the plots without vegetation was showing similar values throughout the growing season. There was also no difference in HR fluxes between the two years in our study too though, which was more surprising as the WT depths seemed to have some influence on the HR fluxes, especially when considered alongside the dominant effect of temperature. Rewcastle et al. (2020), for example, did not find significant CO2 fluxes from residual root decomposition using root exclosure methods, yet they also found rather variable HR rates which they attribute to changes in water table and soil moisture. However, their study was conducted in a forested bog, where tree roots would have been the dominant contributor and whose root structure is different from short woody shrubs.
While the remnants of roots in the clipped plots may partially explain why the HR fluxes were sometimes higher in these plots than the respiration values in the shrub-only or sedge-only plots, we cannot ignore that this phenomenon occurred mostly when it was hotter and drier. Zeh et al. (2020), for example, found a higher degree of decomposition of peat under sedges than under shrubs, particularly when temperatures were higher. It may also be possible that the mosses in these conditions are inhibiting the respiration of the microbes below, with the vascular plants providing a priming effect to respiration (Robroek et al., 2016). For example, Gavazov et al. (2018) found enhanced heterotrophic decomposition of peat carbon due to rhizosphere priming, and Basiliko et al. (2012) similarly suggest that a priming effect may occur when decomposition of soil organic matter is stimulated by rhizodeposition. In our case, the mosses may be assimilating C from the roots of the vascular plants and releasing that back to the atmosphere as another source of respiration in addition to that which is derived directly from photosynthesis (Turetsky and Wieder, 1999). Metcalfe et al. (2011) also suggest that the amount of C allocated belowground is governed by the total amount of C acquired by photosynthesis, which is likely to be higher for plants that have both a greater leaf area and higher photosynthetic rates. In our study, it is clear in both growing seasons that NEE was higher in the sedges than it was in the shrubs. So, when the mosses were removed, they were no longer able to benefit from this priming effect, and when weather conditions became warmer and drier, the clipped plots, which represent HR, released more CO2 than the plots that only contained the vascular plants. This conclusion is speculative, and a further look into the link with belowground processes may help support this claim. However, Shao (2022) showed in his modelling study that when the ericoid mycorrhiza fungi around the shrub roots were removed from the model, the autotrophic respiration of the mosses increased from ∼75 to ∼125 gC m−2 yr−1, highlighting the importance of shrub–moss–mycorrhizae associations to carbon cycling in peatlands.
ER and HR seem to be primarily related to air and soil temperature for both plant types and for AR in the sedges; however, interactive effects of environmental variables occur, with WT depth playing a significant role in some cases. Additionally, there is some plant dependence on the dynamics of respiration, with the shrubs showing more variable respiration values and potentially having a greater relationship with the mosses than do the sedges. This study provided a detailed analysis of partitioning ER, especially with regards to unveiling the presence of the intermediate form of respiration we deemed plant-associated HR, and has furthered our knowledge of C cycling in peatlands.
Given the complex nature of respiration and its components, future studies should consider obtaining more continuous measurements of respiration fluxes, through an automatic chamber setup for example, and that belowground resources are seemingly quite significant to understanding respiration (e.g., root dynamics). Fenner and Freeman (2011) found in an ombrotrophic, oligotrophic Sphagnum peatland (i.e., a bog) that if demands for both water and nutrients are not met, this will lead to a higher loss of C from plants through drought-induced increases in nutrient and labile carbon levels that stimulate anaerobic decomposition. Thus, we suggest an in-depth exploration of pore water analyses, through measures of dissolved organic carbon and nutrients, such as phosphorus and nitrogen, will be helpful. Tools such as root exudate analyses and stable and radioactive isotopes have been used more frequently over the last few decades to determine the source of respired C (Hahn et al., 2006; Hardie et al., 2009), analyses for which we suggest this project would also benefit.
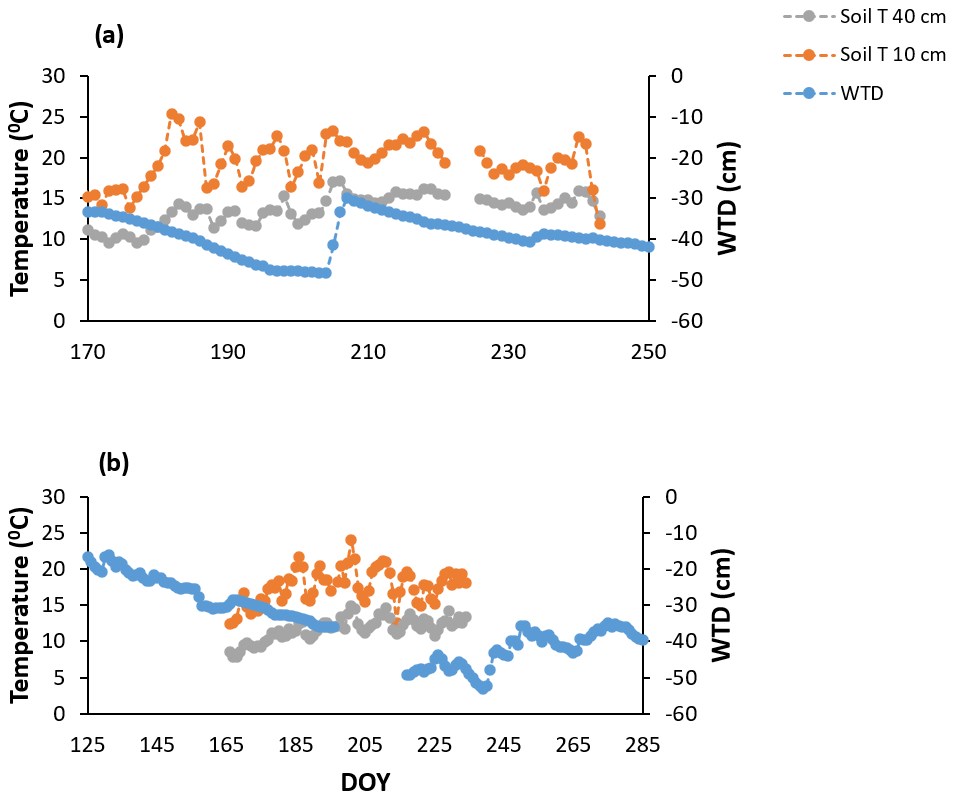
Figure A1Continuous measures of soil temperatures (soil T) at 10 and 40 cm and water table depth (WTD) for the growing seasons of (a) 2018 and (b) 2019 derived from the eddy covariance tower near the manual chamber setup.
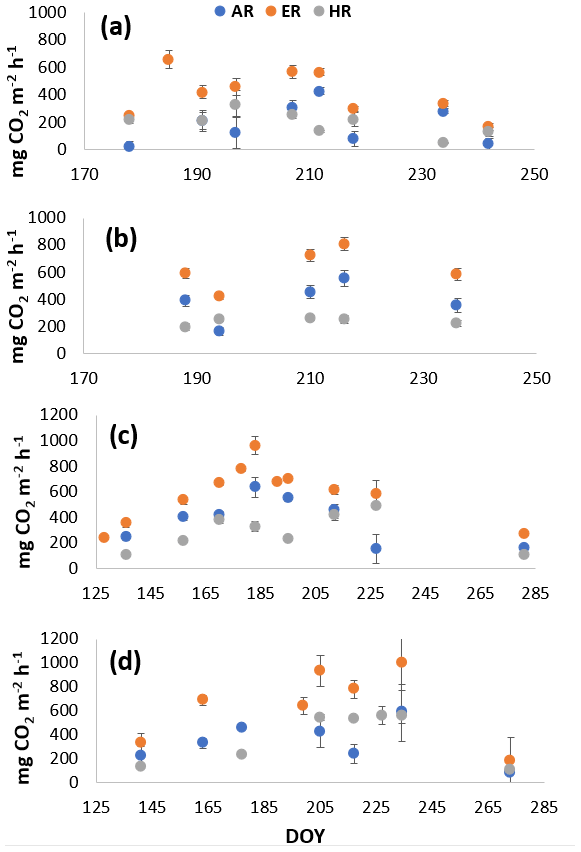
Figure A2Average CO2 fluxes in the (a) shrub plots and (b) sedge plots across the growing season of 2018, and CO2 fluxes in the (c) shrub plots and (d) sedge plots across the growing season of 2019.
Table A1Correlation coefficients for relationships between respiration (ER, AR, and HR) and environmental variables in 2018 and 2019. WT is water table depth, air T is air temperature measured at the flux tower, and soil T is soil temperature at 10 cm depth.
The software code associated with this article is available upon request from Tracy E. Rankin.
The data sets associated with this article are available upon request from Tracy E. Rankin.
TER designed the experiments, with the support of NTR, and carried them out. TER also prepared the paper with contributions from NTR and TRM.
The contact author has declared that none of the authors has any competing interests.
Publisher's note: Copernicus Publications remains neutral with regard to jurisdictional claims in published maps and institutional affiliations.
We thank the National Capital Commission for permission to work at Mer Bleue. The authors gratefully acknowledge the support from Moshe Dalva, Maya Hassa, Kevin Hutchins, and Zoe Humeau (McGill), as well as from Elyn R. Humphreys (Carleton University) for the environmental data from the eddy covariance tower.
This research has been supported by the Natural Sciences and Engineering Research Council of Canada (grant no. NSERC RGPIN 2017-04059). Tracy E. Rankin was supported by a Fonds de Recherche du Québec Nature et Technologies Scholarship, a Garnier Fellowship, and the McGill Department of Geography graduate funds.
This paper was edited by Martin De Kauwe and reviewed by two anonymous referees.
Abdalla, M., Hastings, A., Bell, M. J., Smith, J. U., Richards, M., Nilsson, M. B., Peichl, M., Löfvenius, M. O., Lund, M., Helfter, C., Nemitz, E., Sutton, M. A., Aurela, M., Lohila, A., Laurila, T., Dolman, A. J., Belelli-Marchesini, L., Pogson, M., Jones, E., Drewer, J., Drosler, M., and Smith, P.: Simulation of CO2 and attribution analysis at six european peatland sites using the ECOSSE model, Water. Air. Soil Pollut., 225, 2182, https://doi.org/10.1007/s11270-014-2182-8, 2014.
Abdi, H.: Coefficient of Variation, in: Encyclopeadia of Research Design, edited by: Salkind, N., Thousand Oaks, CA, Sage, 2010169–171, https://personal.utdallas.edu/~herve/abdi-cv2010-pretty.pdf (last access: 13 July 2022), 2010.
Arain, M. A., Xu, B., Brodeur, J. J., Khomik, M., Peichl, M., Beamesderfer, E., restrepo-Couple, N., and Thorne, R.: Heat and Drought Impact on Carbon Exchange in an Age-Sequence of temperate pine forests, Ecol. Process., 11, 7, https://doi.org/10.1186/s13717-021-00349-7, 2022.
Basiliko, N., Stewart, H., Roulet, N. T., and Moore, T. R.: Do Root Exudates Enhance Peat Decomposition?, Geomicrobiol. J., 29, 374–378, https://doi.org/10.1080/01490451.2011.568272, 2012.
Belyea, L. R. and Malmer, N.: Carbon sequestration in peatland: patterns and mechanisms of response to climate change, Glob. Change Biol., 10, 1043–1052, https://doi.org/10.1111/j.1529-8817.2003.00783.x, 2004.
Blodau, C.: Carbon cycling in peatlands – A review of processes and controls, Environ. Rev., 10, 111–134, https://doi.org/10.1139/a02-004, 2002.
Bonan, G.: Ecological Climatology: Concepts and Applications, 2nd edn., Cambridge University Press, ISBN 978-0521872218, 2008.
Brieman, L., Friedman, J., Olshen, R., and Stone, C.: Classification and regression trees, Wadsworth & Brooks, Cole Statistics/Probability series, https://doi.org/10.1201/9781315139470, 1984.
Bubier, J. L., Moore, T. R., and Bledzki, L. A.: Effects of nutrient addition on vegetation and carbon cycling in an ombrotrophic bog, Glob. Change Biol., 13, 1168–1186, https://doi.org/10.1111/j.1365-2486.2007.01346.x, 2007.
Bunsen, M. S. and Loisel, J.: Carbon storage dynamics in peatlands: Comparing recent- and long-term accumulation histories in southern Patagonia, Glob. Change Biol., 26, 5778–5795, https://doi.org/10.1111/gcb.15262, 2020.
Buttler, A., Robroek, B. J. M., Laggoun-Défarge, F., Jassey, V. E. J., Pochelon, C., Bernard, G., Delarue, F., Gogo, S., Mariotte, P., Mitchell, E. A. D., and Bragazza, L.: Experimental warming interacts with soil moisture to discriminate plant responses in an ombrotrophic peatland, J. Veg. Sci., 26, 964–974, https://doi.org/10.1111/jvs.12296, 2015.
Cai, T., Flanagan, L. B., and Syed, K. H.: Warmer and drier conditions stimulate respiration more than photosynthesis in a boreal peatland ecosystem: Analysis of automatic chambers and eddy covariance measurements, Plant Cell Environ., 33, 394–407, https://doi.org/10.1111/j.1365-3040.2009.02089.x, 2010.
Charman, D. J., Beilman, D. W., Blaauw, M., Booth, R. K., Brewer, S., Chambers, F. M., Christen, J. A., Gallego-Sala, A., Harrison, S. P., Hughes, P. D. M., Jackson, S. T., Korhola, A., Mauquoy, D., Mitchell, F. J. G., Prentice, I. C., van der Linden, M., De Vleeschouwer, F., Yu, Z. C., Alm, J., Bauer, I. E., Corish, Y. M. C., Garneau, M., Hohl, V., Huang, Y., Karofeld, E., Le Roux, G., Loisel, J., Moschen, R., Nichols, J. E., Nieminen, T. M., MacDonald, G. M., Phadtare, N. R., Rausch, N., Sillasoo, Ü., Swindles, G. T., Tuittila, E.-S., Ukonmaanaho, L., Väliranta, M., van Bellen, S., van Geel, B., Vitt, D. H., and Zhao, Y.: Climate-related changes in peatland carbon accumulation during the last millennium, Biogeosciences, 10, 929–944, https://doi.org/10.5194/bg-10-929-2013, 2013.
Chiapusio, G., Jassey, V. E. J., Bellvert, F., Comte, G., Weston, L. A., Delarue, F., Buttler, A., Toussaint, M. L., and Binet, P.: Sphagnum Species Modulate their Phenolic Profiles and Mycorrhizal Colonization of Surrounding Andromeda polifolia along Peatland Microhabitats, J. Chem. Ecol., 44, 1146–1157, https://doi.org/10.1007/s10886-018-1023-4, 2018.
Crow, S. E. and Wieder, R. K.: Sources of CO2 emission from a northern peatland: Root respiration, exudation, and decomposition, Ecology, 86, 1825–1834, https://doi.org/10.1890/04-1575, 2005.
Dorrepaal, E., Toet, S., van Logtestijn, R. S. P., Swart, E., van de Weg, M. J., Callaghan, T. V., Aerts, R., Logtestijn, V., Richard, S. P., Swart, E., Weg, V. De, Martine, J., Callaghan, T. V., Aerts, R., van Logtestijn, R. S. P., Swart, E., van de Weg, M. J., Callaghan, T. V., and Aerts, R.: Carbon respiration from subsurface peat accelerated by climate warming in the subarctic, Nature, 460, 616–619, https://doi.org/10.1038/nature08216, 2009.
Environment Canada: Historical Weather Data, Gov. Canada [data set], https://climate.weather.gc.ca/historical_data/search_historic_data_e.html (last access: 16 April 2022), 2021.
Fan, Z., Mcguire, A. D., Turetsky, M. R., Harden, J. W., Waddington, J. M., and Kane, E. S.: The response of soil organic carbon of a rich fen peatland in interior Alaska to projected climate change, Glob. Change Biol., 19, 604–620, https://doi.org/10.1111/gcb.12041, 2013.
Fenner, N. and Freeman, C.: Drought induced carbon loss in peatlands., Nat. Geosci., 4., 895–900., https://doi.org/10.1038/ngeo1323, 2011.
Flanagan, L. B. and Syed, K. H.: Stimulation of both photosynthesis and respiration in response to warmer and drier conditions in a boreal peatland ecosystem, Glob. Change Biol., 17, 2271–2287, https://doi.org/10.1111/j.1365-2486.2010.02378.x, 2011.
Frolking, S. E., Bubier, J., Moore, T. R., Ball, T., Bellisario, L. M., Bhardwaj, A., Carroll, P., Crill, P. M., Lafleur, P. M., McCaughey, J. H., Roulet, N. T., Suyker, A. E., Verma, S. B., Waddington, J. M., and Whiting, G. J.: Relationship between ecosystem productivity and photosynthetically active radiation for northern peatlands, Global Biogeochem. Cy., 12, 115–126, 1998.
Frolking, S., Roulet, N. T., Moore, T. R., Lafleur, P. M., Bubier, J. L., and Crill, P. M.: Modeling seasonal to annual carbon balance of Mer Bleue Bog, Ontario, Canada, Global Biogeochem. Cy., 16, 3, https://doi.org/10.1029/2001GB001457, 2002.
Gavazov, K., Albrecht, R., Buttler, A., Dorrepaal, E., Garnett, M. H., Gogo, S., Hagedorn, F., Mills, R. T. E., Robroek, B. J. M., and Bragazza, L.: Vascular plant-mediated controls on atmospheric carbon assimilation and peat carbon decomposition under climate change, Glob. Change Biol., 24, 3911–3921, https://doi.org/10.1111/gcb.14140, 2018.
Griffis, T. J., Rouse, W. R., and Waddington, J. M.: Interannual variability of net ecosystem CO2 exchange at a subarctic fen, Geography, 14, 1109–1121, 2000.
Grogan, P. and Jonasson, S.: Temperature and substrate controls on intra-annual variation in ecosystem respiration in two subarctic vegetation types, Glob. Change Biol., 11, 465–475, https://doi.org/10.1111/j.1365-2486.2005.00912.x, 2005.
Hahn, V., Högberg, P., and Buchmann, N.: 14C – A tool for separation of autotrophic and heterotrophic soil respiration, Glob. Change Biol., 12, 972–982, https://doi.org/10.1111/j.1365-2486.2006.001143.x, 2006.
Hardie, S. M. L., Garnett, M. H., Fallick, A. E., Ostle, N. J., and Rowland, A. P.: Bomb-14C analysis of ecosystem respiration reveals that peatland vegetation facilitates release of old carbon, Geoderma, 153, 393–401, 2009.
He, H., Meyer, A., Jansson, P.-E., Svensson, M., Rütting, T., and Klemedtsson, L.: Simulating ectomycorrhiza in boreal forests: implementing ectomycorrhizal fungi model MYCOFON in CoupModel (v5), Geosci. Model Dev., 11, 725–751, https://doi.org/10.5194/gmd-11-725-2018, 2018.
Heimann, M. and Reichstein, M.: Terrestrial ecosystem carbon dynamics and climate feedbacks, Nature, 451, 289–292, https://doi.org/10.1038/nature06591, 2008.
Heinemeyer, A., Croft, S., Garnett, M. H., Gloor, E., Holden, J., Lomas, M. R., and Ineson, P.: The MILLENNIA peat cohort model: Predicting past, present and future soil carbon budgets and fluxes under changing climates in peatlands, Clim. Res., 45, 207–226, https://doi.org/10.3354/cr00928, 2010.
Helbig, M., Humphreys, E. R., and Todd, A.: Contrasting Temperature Sensitivity of CO2 Exchange in Peatlands of the Hudson Bay Lowlands, Canada, J. Geophys. Res. Biogeo., 124, 2126–2143, https://doi.org/10.1029/2019JG005090, 2019.
Hicks Pries, C. E., Schuur, E. A. G., and Crummer, K. G.: Thawing permafrost increases old soil and autotrophic respiration in tundra: Partitioning ecosystem respiration using δ13C and 14C, Glob. Change Biol., 19, 649–661, https://doi.org/10.1111/gcb.12058, 2013.
Hicks Pries, C. E., Van Logtestijn, R. S. P., Schuur, E. A. G., Natali, S. M., Cornelissen, J. H. C., Aerts, R., and Dorrepaal, E.: Decadal warming causes a consistent and persistent shift from heterotrophic to autotrophic respiration in contrasting permafrost ecosystems, Glob. Change Biol., 21, 4508–4519, https://doi.org/10.1111/gcb.13032, 2015.
Humphreys, E. R., Charron, C., Brown, M., and Jones, R.: Two Bogs in the Canadian Hudson Bay Lowlands and a Temperate Bog Reveal Similar Annual Net Ecosystem Exchange of CO2, Arctic, Antarct. Alp. Res., 46, 103–113, https://doi.org/10.1657/1938-4246.46.1.103, 2014.
Hungate, B. A., Holland, E. A., Jackson, R. B., Chapin III, F. S, Mooney, H. A, and, Field, C. B.: The fate of carbon in grasslands under carbon dioxide enrichment, Nature, 388, 576–579, https://doi.org/10.1038/41550, 1997.
Iversen, C. M., Childs, J., Norby, R. J., Ontl, T. A., Kolka, R. K., Brice, D. J., McFarlane, K. J., and Hanson, P. J.: Fine-root growth in a forested bog is seasonally dynamic, but shallowly distributed in nutrient-poor peat, Plant Soil, 424, 123–143, https://doi.org/10.1007/s11104-017-3231-z, 2018.
Järveoja, J., Nilsson, M. B., Gažovič, M., Crill, P. M., and Peichl, M.: Partitioning of the net CO2 exchange using an automated chamber system reveals plant phenology as key control of production and respiration fluxes in a boreal peatland, Glob. Change Biol., 24, 3436–3451, https://doi.org/10.1111/gcb.14292, 2018.
Jassey, V. E. J. and Signarbieux, C.: Effects of climate warming on Sphagnum photosynthesis in peatlands depend on peat moisture and species-specific anatomical traits, Glob. Change Biol., 25, 3859–3870, https://doi.org/10.1111/gcb.14788, 2019.
Kalacska, M., Arroyo-Mora, J. P., de Gea, J., Snirer, E., Herzog, C., and Moore, T. R.: Videographic analysis of Eriophorum vaginatum spatial coverage in an Ombotrophic bog, Remote Sens., 5, 6501–6512, https://doi.org/10.3390/rs5126501, 2013.
Kuiper, J. J., Mooij, W. M., Bragazza, L., and Robroek, B. J. M.: Plant functional types define magnitude of drought response in peatland CO2 exchange, Ecology, 95, 123–131, https://doi.org/10.1890/13-0270.1, 2014.
Kurbatova, J., Tatarinov, F., Molchanov, A., Varlagin, A., Avilov, V., Kozlov, D., Ivanov, D., and Valentini, R.: Partitioning of ecosystem respiration in a paludified shallow-peat spruce forest in the southern taiga of European Russia, Environ. Res. Lett., 8, 4, https://doi.org/10.1088/1748-9326/8/4/045028, 2013.
Lafleur, P. M., Moore, T. R., Roulet, N. T., and Frolking, S.: Ecosystem Respiration in a Cool Temperate Bog Depends on Peat Temperature But Not Water Table, Ecosystems, 8, 619–629, https://doi.org/10.1007/s10021-003-0131-2, 2005.
Lai, Y. F.: Spatial and Temporal Variations of Carbon Dioxide and Methane Fluxes Measured by Autochambers at the Mer Bleue Bog, PhD thesis, McGill University, https://escholarship.mcgill.ca/concern/theses/pz50h109d (last access: 16 April 2022), 2012.
Lai, D. Y. F., Roulet, N. T., and Moore, T. R.: The spatial and temporal relationships between CO2 and CH4 exchange in a temperate ombrotrophic bog, Atmos. Environ., 89, 249–259, https://doi.org/10.1016/j.atmosenv.2014.02.034, 2014.
Lavoie, C., Grosvernier, P., Girard, M., and Marcoux, K.: Spontaneous revegetation of mined peatlands: An useful restoration tool?, Wetl. Ecol. Manag., 11, 97–107, 2003.
Lees, K. J., Artz, R. R. E., Chandler, D., Aspinall, T., Boulton, C. A., Buxton, J., Cowie, N. R., and Lenton, T. M.: Using remote sensing to assess peatland resilience by estimating soil surface moisture and drought recovery, Sci. Total Environ., 761, 143312, https://doi.org/10.1016/j.scitotenv.2020.143312, 2021.
Lin, X., Tfaily, M. M., Steinweg, J. M., Chanton, P., Esson, K., Yang, Z. K., Chanton, J. P., Cooper, W., Schadt, C. W., and Kostka, J. E.: Microbial community stratification linked to utilization of carbohydrates and phosphorus limitation in a Boreal Peatland at Marcell Experimental Forest, Minnesota, USA, Appl. Environ. Microbiol., 80, 3518–3530, https://doi.org/10.1128/AEM.00205-14, 2014.
Loisel, J., Yu, Z., Beilman, D. W., Camill, P., Alm, J., Amesbury, M. J., Anderson, D., Andersson, S., Bochicchio, C., Barber, K., Belyea, L. R., Bunbury, J., Chambers, F. M., Charman, D. J., Vleeschouwer, F. De, Fiałkiewicz-kozieł, B., Finkelstein, S. A., Gałka, M., Garneau, M., Hammarlund, D., Hinchcliffe, W., Holmquist, J., Hughes, P., Jones, M. C., Klein, E. S., Kokfelt, U., Korhola, A., Kuhry, P., Lamarre, A., Lamentowicz, M., Large, D., Lavoie, M., Macdonald, G., Mäkilä, M., Mallon, G., Mathijssen, P., Mauquoy, D., Moore, T. R., Nichols, J., Reilly, B. O., Oksanen, P., Packalen, M., Peteet, D., Richard, P. J. H., Robinson, S., Ronkainen, T., Rundgren, M., Sannel, A. B. K., Tarnocai, C., Thom, T., Tuittila, E. S., Turetsky, M. R., Valiranta, M., van der Linden, M., van Geel, B., van Bellen, S., Vitt, D. H., Zhao, Y., and Zhou, W.: A database and synthesis of northern peatland soil properties and Holocene carbon and nitrogen accumulation, Holocene Spec. Issue, 24, 1028–1042, https://doi.org/10.1177/0959683614538073, 2014.
Maier, C. A. and Kress, L. W.: Soil CO2 evolution and root respiration in 11 year-old loblolly pine (Pinus taeda) plantations as affected by moisture and nutrient availability, Can. J. For. Res., 30, 347–359, https://doi.org/10.1139/cjfr-30-3-347, 2000.
Mäkiranta, P., Riutta, T., Penttilä, T., and Minkkinen, K.: Dynamics of net ecosystem CO2 exchange and heterotrophic soil respiration following clearfelling in a drained peatland forest, Agric. For. Meteorol., 150, 1585–1596, https://doi.org/10.1016/j.agrformet.2010.08.010, 2010.
Malhotra, A., Brice, D. J., Childs, J., Graham, J. D., Hobbie, E. A., Vander Stel, H., Feron, S. C., Hanson, P. J., and Iversen, C. M.: Peatland warming strongly increases fine-root growth, P. Natl. Acad. Sci. USA, 117, 17627–17634, https://doi.org/10.1073/pnas.2003361117, 2020.
Marinier, M., Glatzel, S., and Moore, T.: The role of cotton-grass (Eriophorum vaginatum) in the exchange of CO2 and CH4 at two restored peatlands, eastern Canada, Ecoscience, 11, 141–149, 2004.
Mccarter, C. P. R. and Price, J. S.: Ecohydrology of Sphagnum moss hummocks: Mechanisms of capitula water supply and simulated effects of evaporation, Ecohydrology, 7, 33–44, https://doi.org/10.1002/eco.1313, 2014.
Melling, L., Hatano, R., and Goh, K. J.: Soil CO2 flux from three ecosystems in tropical peatland of Sarawak, Malaysia, Tellus B, 57, 1–11, https://doi.org/10.3402/tellusb.v57i1.16772, 2005.
Metcalfe, D. B., Fisher, R. A., and Wardle, D. A.: Plant communities as drivers of soil respiration: pathways, mechanisms, and significance for global change, Biogeosciences, 8, 2047–2061, https://doi.org/10.5194/bg-8-2047-2011, 2011.
Minkkinen, K., Laine, J., Shurpali, N. J., Makiranta, P., Alm, J., and Penttilä, T.: Heterotrophic soil respiration in forestry-drained peatlands, Boreal Environ. Res., 12, 115–126, 2007.
Murphy, M., Laiho, R., and Moore, T. R.: Effects of water table drawdown on root production and aboveground biomass in a boreal Bog, Ecosystems, 12, 1268–1282, https://doi.org/10.1007/s10021-009-9283-z, 2009.
Murphy, M. T. and Moore, T. R.: Linking root production to aboveground plant characteristics and water table in a temperate bog, Plant Soil, 336, 219–231, https://doi.org/10.1007/s11104-010-0468-1, 2010.
Murphy, M. T., McKinley, A., and Moore, T. R.: Variations in above-and below-ground vascular plant biomass and water table on a temperate ombrotrophic peatland, Botany, 87, 845–853, https://doi.org/10.1139/B09-052, 2009.
Nijp, J. J., Metselaar, K., Limpens, J., Teutschbein, C., Peichl, M., Nilsson, M. B., Berendse, F., and van der Zee, S. E. A. T. M.: Including hydrological self-regulating processes in peatland models: Effects on peatmoss drought projections, Sci. Total Environ., 580, 1389–1400, https://doi.org/10.1016/j.scitotenv.2016.12.104, 2017.
Ojanen, P., Minkkinen, K., Lohila, A., Badorek, T., and Penttilä, T.: Chamber measured soil respiration: A useful tool for estimating the carbon balance of peatland forest soils?, For. Ecol. Manage., 277, 132–140, https://doi.org/10.1016/j.foreco.2012.04.027, 2012.
Oke, T. A. and Hager, H. A.: Plant community dynamics and carbon sequestration in Sphagnum-dominated peatlands in the era of global change, Glob. Ecol. Biogeogr., 29, 1610–1620, https://doi.org/10.1111/geb.13152, 2020.
Peichl, M., Öquist, M., Ottosson Löfvenius, M., Ilstedt, U., Sagerfors, J., Grelle, A., Lindroth, A., and Nilsson, M. B.: A 12-year record reveals pre-growing season temperature and water table level threshold effects on the net carbon dioxide exchange in a boreal fen, Environ. Res. Lett., 9, 5, https://doi.org/10.1088/1748-9326/9/5/055006, 2014.
Pelletier, L., Garneau, M., and Moore, T. R.: Variation in CO2 exchange over three summers at microform scale in a boreal bog, Eastmain region, Quebec, Canada, J. Geophys. Res., 116, 3, https://doi.org/10.1029/2011JG001657, 2011.
Phillips, C. L., Bond-Lamberty, B., Desai, A. R., Lavoie, M., Risk, D., Tang, J., Todd-Brown, K., and Vargas, R.: The value of soil respiration measurements for interpreting and modeling terrestrial carbon cycling, Plant Soil, 413, 1–25, https://doi.org/10.1007/s11104-016-3084-x, 2017.
Porporato, A., Daly, E., and Rodriguez-Iturbe, I.: Soil water balance and ecosystem response to climate change, Am. Nat., 164, 625–632, https://doi.org/10.1086/424970, 2004.
Pouliot, R., Rochefort, L., and Karofeld, E.: Initiation of microtopography in re-vegetated cutover peatlands: Evolution of plant species composition, Appl. Veg. Sci., 15, 369–382, https://doi.org/10.1111/j.1654-109X.2011.01164.x, 2012.
Rewcastle, K. E., Moore, J. A. M., Henning, J. A., Mayes, M. A., Patterson, C. M., Wang, G., Metcalfe, D. B., and Classen, A. T.: Investigating drivers of microbial activity and respiration in a forested bog, Pedosphere, 30, 135–145, https://doi.org/10.1016/S1002-0160(19)60841-6, 2020.
Robroek, B. J. M., Albrecht, R. J. H., Hamard, S., Pulgarin, A., Bragazza, L., Buttler, A., and Jassey, V. E. J.: Peatland vascular plant functional types affect dissolved organic matter chemistry, Plant Soil, 407, 135–143, https://doi.org/10.1007/s11104-015-2710-3, 2016.
Roulet, N. T., Lafleur, P. M., Richard, P. J. H., Moore, T. R., Humphreys, E. R., and Bubier, J.: Contemporary carbon balance and late Holocene carbon accumulation in a northern peatland, Glob. Change Biol., 13, 397–411, https://doi.org/10.1111/j.1365-2486.2006.01292.x, 2007.
Ryan, M. G. and Law, B. E.: Interpreting, measuring, and modeling soil respiration, Biogeochemistry, 73, 3–27, https://doi.org/10.1007/s10533-004-5167-7, 2005.
Schuur, E. A. G. and Trumbore, S. E.: Partitioning sources of soil respiration in boreal black spruce forest using radiocarbon, Glob. Change Biol., 12, 165–176, https://doi.org/10.1111/j.1365-2486.2005.01066.x, 2006.
Shao, S.: Modeling microbial dynamics and nutrient cycles in ombrotrophic peatlands, PhD thesis, McGill University, https://escholarship.mcgill.ca/concern/theses/3r075097j (last access: 16 April 2022), 2022.
Shao, S., Wu, J., He, H., and Roulet, N.: Integrating McGill Wetland Model (MWM) with peat cohort tracking and microbial controls, Sci. Total Environ., 806, 151223, https://doi.org/10.1016/j.scitotenv.2021.151223, 2022.
Stewart, H.: Partitioning belowground respiration in a northern peatland, PhD thesis, McGill University, https://escholarship.mcgill.ca/concern/theses/m613mx86t (last access: 16 April 2022), 2006.
St-Hilaire, F., Wu, J., Roulet, N. T., Frolking, S., Lafleur, P. M., Humphreys, E. R., and Arora, V.: McGill wetland model: evaluation of a peatland carbon simulator developed for global assessments, Biogeosciences, 7, 3517–3530, https://doi.org/10.5194/bg-7-3517-2010, 2010.
Sulman, B. N., Desai, A. R., Saliendra, N. Z., Lafleur, P. M., Flanagan, L. B., Sonnentag, O., MacKay, D. S., Barr, A. G., and Van Der Kamp, G.: CO2 fluxes at northern fens and bogs have opposite responses to inter-annual fluctuations in water table, Geophys. Res. Lett., 37, 3–7, https://doi.org/10.1029/2010GL044018, 2010.
Tarnocai, C.: The effect of climate change on carbon in Canadian peatlands, Glob. Planet. Change, 53, 222–232, https://doi.org/10.1016/j.gloplacha.2006.03.012, 2006.
Tarnocai, C., Kettles, I., and Ballard, M.: Peatlands of Canada, Geol. Surv. Canada open file 6561 [data set], https://doi.org/10.4095/288786, 2011.
Teklemariam, T. A., Lafleur, P. M., Moore, T. R., Roulet, N. T., and Humphreys, E. R.: The direct and indirect effects of inter-annual meteorological variability on ecosystem carbon dioxide exchange at a temperate ombrotrophic bog, Agric. For. Meteorol., 150, 1402–1411, https://doi.org/10.1016/j.agrformet.2010.07.002, 2010.
Turetsky, M. R. and Wieder, R. K.: Boreal bog Sphagnum refixes soil-produced and respired 14CO2, Ecoscience, 6, 587–591, https://doi.org/10.1080/11956860.1999.11682559, 1999.
Van Hees, P. A. W., Jones, D. L., Finlay, R., Godbold, D. L., and Lundström, U. S.: The carbon we do not see – The impact of low molecular weight compounds on carbon dynamics and respiration in forest soils: A review, Soil Biol. Biochem., 37, 1–13, https://doi.org/10.1016/j.soilbio.2004.06.010, 2005.
von Buttlar, J., Zscheischler, J., Rammig, A., Sippel, S., Reichstein, M., Knohl, A., Jung, M., Menzer, O., Arain, M. A., Buchmann, N., Cescatti, A., Gianelle, D., Kiely, G., Law, B. E., Magliulo, V., Margolis, H., McCaughey, H., Merbold, L., Migliavacca, M., Montagnani, L., Oechel, W., Pavelka, M., Peichl, M., Rambal, S., Raschi, A., Scott, R. L., Vaccari, F. P., van Gorsel, E., Varlagin, A., Wohlfahrt, G., and Mahecha, M. D.: Impacts of droughts and extreme-temperature events on gross primary production and ecosystem respiration: a systematic assessment across ecosystems and climate zones, Biogeosciences, 15, 1293–1318, https://doi.org/10.5194/bg-15-1293-2018, 2018.
Waddington, J. M., Strack, M., and Greenwood, M. J.: Toward restoring the net carbon sink function of degraded peatlands: Short-term response in CO2 exchange to ecosystem-scale restoration, J. Geophys. Res., 115, G01008, https://doi.org/10.1029/2009JG001090, 2010.
Wang, X., Liu, L., Piao, S., Janssens, I. A., Tang, J., Liu, W., Chi, Y., Wang, J., and Xu, S.: Soil respiration under climate warming: Differential response of heterotrophic and autotrophic respiration, Glob. Change Biol., 20, 3229–3237, https://doi.org/10.1111/gcb.12620, 2014.
Warren, J. M., Jensen, A. M., Ward, E. J., Guha, A., Childs, J., Wullschleger, S. D., and Hanson, P. J.: Divergent species-specific impacts of whole ecosystem warming and elevated CO2 on vegetation water relations in an ombrotrophic peatland, Glob. Change Biol., 27, 1820–1835, https://doi.org/10.1111/gcb.15543, 2021.
Zeh, L., Igel, M. T., Schellekens, J., Limpens, J., Bragazza, L., and Kalbitz, K.: Vascular plants affect properties and decomposition of moss-dominated peat, particularly at elevated temperatures, Biogeosciences, 17, 4797–4813, https://doi.org/10.5194/bg-17-4797-2020, 2020.