the Creative Commons Attribution 4.0 License.
the Creative Commons Attribution 4.0 License.
 | 20 Jul 2022
Soil carbon loss in warmed subarctic grasslands is rapid and restricted to topsoil
Niel Verbrigghe
Niki I. W. Leblans
Bjarni D. Sigurdsson
Sara Vicca
Chao Fang
Lucia Fuchslueger
Jennifer L. Soong
James T. Weedon
Christopher Poeplau
Cristina Ariza-Carricondo
Michael Bahn
Bertrand Guenet
Per Gundersen
Gunnhildur E. Gunnarsdóttir
Thomas Kätterer
Zhanfeng Liu
Marja Maljanen
Sara Marañón-Jiménez
Kathiravan Meeran
Edda S. Oddsdóttir
Ivika Ostonen
Josep Peñuelas
Andreas Richter
Jordi Sardans
Páll Sigurðsson
Margaret S. Torn
Peter M. Van Bodegom
Erik Verbruggen
Tom W. N. Walker
Håkan Wallander
Ivan A. Janssens
Global warming may lead to carbon transfers from soils to the atmosphere, yet this positive feedback to the climate system remains highly uncertain, especially in subsoils (Ilyina and Friedlingstein, 2016; Shi et al., 2018). Using natural geothermal soil warming gradients of up to +6.4 ∘C in subarctic grasslands (Sigurdsson et al., 2016), we show that soil organic carbon (SOC) stocks decline strongly and linearly with warming (−2.8 t ha−1 ∘C−1). Comparison of SOC stock changes following medium-term (5 and 10 years) and long-term (>50 years) warming revealed that all SOC stock reduction occurred within the first 5 years of warming, after which continued warming no longer reduced SOC stocks. This rapid equilibration of SOC observed in Andosol suggests a critical role for ecosystem adaptations to warming and could imply short-lived soil carbon–climate feedbacks. Our data further revealed that the soil C loss occurred in all aggregate size fractions and that SOC stock reduction was only visible in topsoil (0–10 cm). SOC stocks in subsoil (10–30 cm), where plant roots were absent, showed apparent conservation after >50 years of warming. The observed depth-dependent warming responses indicate that explicit vertical resolution is a prerequisite for global models to accurately project future SOC stocks for this soil type and should be investigated for soils with other mineralogies.
- Article
(3052 KB) - Full-text XML
- BibTeX
- EndNote


Soils store more carbon (C) than the atmosphere and vegetation biomass combined (Batjes, 2016; Scharlemann et al., 2014). Global warming has been hypothesised to increase soil CO2 emissions that may lead to large reductions in soil organic carbon (SOC) stocks, constituting a positive feedback to the climate system (Davidson and Janssens, 2006; Jenkinson et al., 1991). However, soil warming could also be expected to result in increased and/or unaltered SOC stocks if, for example, there is rapid acclimation of microbial communities or if plant productivity increases strongly. This implies that the strength and even direction of this carbon cycle–climate feedback are highly uncertain (Crowther et al., 2016; Todd-Brown et al., 2018; van Gestel et al., 2018). Accordingly, the World Climate Research Programme has acknowledged it as one of the “Grand Challenges” of climate research (Ilyina and Friedlingstein, 2016).
In situ soil warming studies provide ideal tools to study the response of SOC stocks to warming (Batjes, 2016), yet challenges remain great. First, ecosystem responses to warming may take decades to stabilise (Walker et al., 2020; Melillo et al., 2017), implying that extrapolations of responses from model parametrisation based on short-term experiments may lead to erroneous estimation of the future evolution of SOC stocks. Second, SOC stock changes are rarely studied in subsoils. The high cost and labour requirements of SOC research, combined with the fact that most biological activity and SOC mineralisation occur in topsoils, explain why soil biology and ecology, including SOC cycling, are rarely studied below a depth of 20–30 cm (Yost and Hartemink, 2020). This is a major issue because more SOC is stored below this threshold than above it (Shi et al., 2020), and therefore the carbon cycle–climate feedback does not stop at 20–30 cm depth. Unfortunately, the very few soil warming experiments that also warmed subsoils and quantified SOC stock changes yielded very different warming responses, ranging from declining to increasing subsoil SOC stocks (Soong et al., 2020a; Hanson et al., 2020).
To address both these challenges, we determined SOC stock changes along natural geothermal gradients at the ForHot research site in Iceland, which is extensively described in Sigurdsson et al. (2016). The site encompasses the full warming range projected for northern regions (up to +6.4 ∘C), throughout the topsoil (0–10 cm) and the subsoil (10–30 cm). An elaboration on the choice of these two soil layer depths is provided in the material and methods section in Appendix A. We compared topsoil and subsoil SOC dynamics along replicate warming gradients exposed to medium-term (5 and 10 years) and long-term (>50 years but possibly centuries) warming by sampling permanent study plots twice in a 6-year period (2013 and 2018). This enabled us to characterise the magnitude, shape and temporal dynamics of the temperature response of SOC stocks in these northern, non-permafrost soils. Next to measuring SOC stocks, we gathered data about soil aggregates, carbon inputs to the soil by plants and arbuscular mycorrhizal fungi, and carbon flux from topsoil to subsoil. This allowed us to elaborate on the possible mechanisms behind SOC stock changes along the warming gradient.
The recently warmed grassland we investigated at the ForHot site has been warmed since 2008, when a major earthquake shifted geothermal systems to previously unwarmed soils, causing increased temperature in the soil above by radiative heating (Halldórsson and Sigbjörnsson, 2009; O'Gorman et al., 2014). In contrast, the long-term warmed grassland had been warmed for at least 45 years at the time of the earthquake in 2008 (Sigurdsson et al., 2016). Soils in both study sites are classified as Andosols according to the World Reference Base (WRB, IUSS Working Group, 2015), and they are covered by the same grassland type (Sigurdsson et al., 2016).
We hypothesised that because of the slow reaction of protected SOC pools to temperature change, medium-term warmed soils would still be losing SOC over time, while the long-term warmed soils would have reached a new equilibrium at lower SOC content. We further hypothesised similar subsoil and topsoil SOC stock reduction, given that subsoils were exposed to the same warming intensity and duration as topsoils.
Topsoil (0–10 cm; comprising the A horizon and rooting zone) SOC stocks linearly declined by t SOC ha−1 ∘C−1 soil warming (or 9.1 ± 2.1 % ∘C−1; for both, P<0.001) for mass-corrected SOC stocks (Figs. 1a, 2). These topsoil temperature responses did not differ between the medium-term and the long-term warmed grassland; i.e. the warming–grassland interaction term was not significant (P=0.68). An explicit model description can be found in Appendix A “Material and methods”. The model results clearly suggest that warming induced SOC stock reductions only during the initial 5 years of exposure and that SOC stocks did not change thereafter.
However, several sources of variation such as sampling errors and the large heterogeneity inherent to soils induced quite broad uncertainty intervals that reduced the potential to detect statistically significant changes in SOC stocks or in their temperature response. Hence, to demonstrate that the warming-induced SOC stock reduction had indeed stabilised within 5 years of warming and did not further lose SOC, we calculated what SOC stock decline could have remained undetected given the variability in our samples using a one-sided 95 % confidence interval on the soil warming regression coefficient. This shows that average additional SOC stock reductions smaller than 0.88 t C ha−1 ∘C−1 would not have been detected at P<0.05, implying that in the 5-year period following the initial warming response (i.e. 2013–2018), annual declines of up to 0.18 t C ha−1 ∘C−1 yr−1 would have remained undetected. In the subsequent time span of >50 years, only changes smaller than 0.018 t C ha−1 ∘C−1 yr−1 would have remained undetected, i.e. a rate 30-fold less than the SOC stock reductions observed in the initial 5 years of soil warming.
Also when not corrected for warming-induced density changes, SOC stocks and soil C concentrations declined with warming (Figs. B1, B2 in the Appendix) and did not further decrease after 5 years of soil warming. In contrast to our hypothesis, our data thus revealed that in topsoil, a stepwise increase in temperature caused a fast SOC stock reduction that stabilised within 5 years of warming, despite the sustained higher temperatures. Even grasslands that had been warmed for at least 55 years exhibited no larger SOC stocks than those observed after 5 years of soil warming.
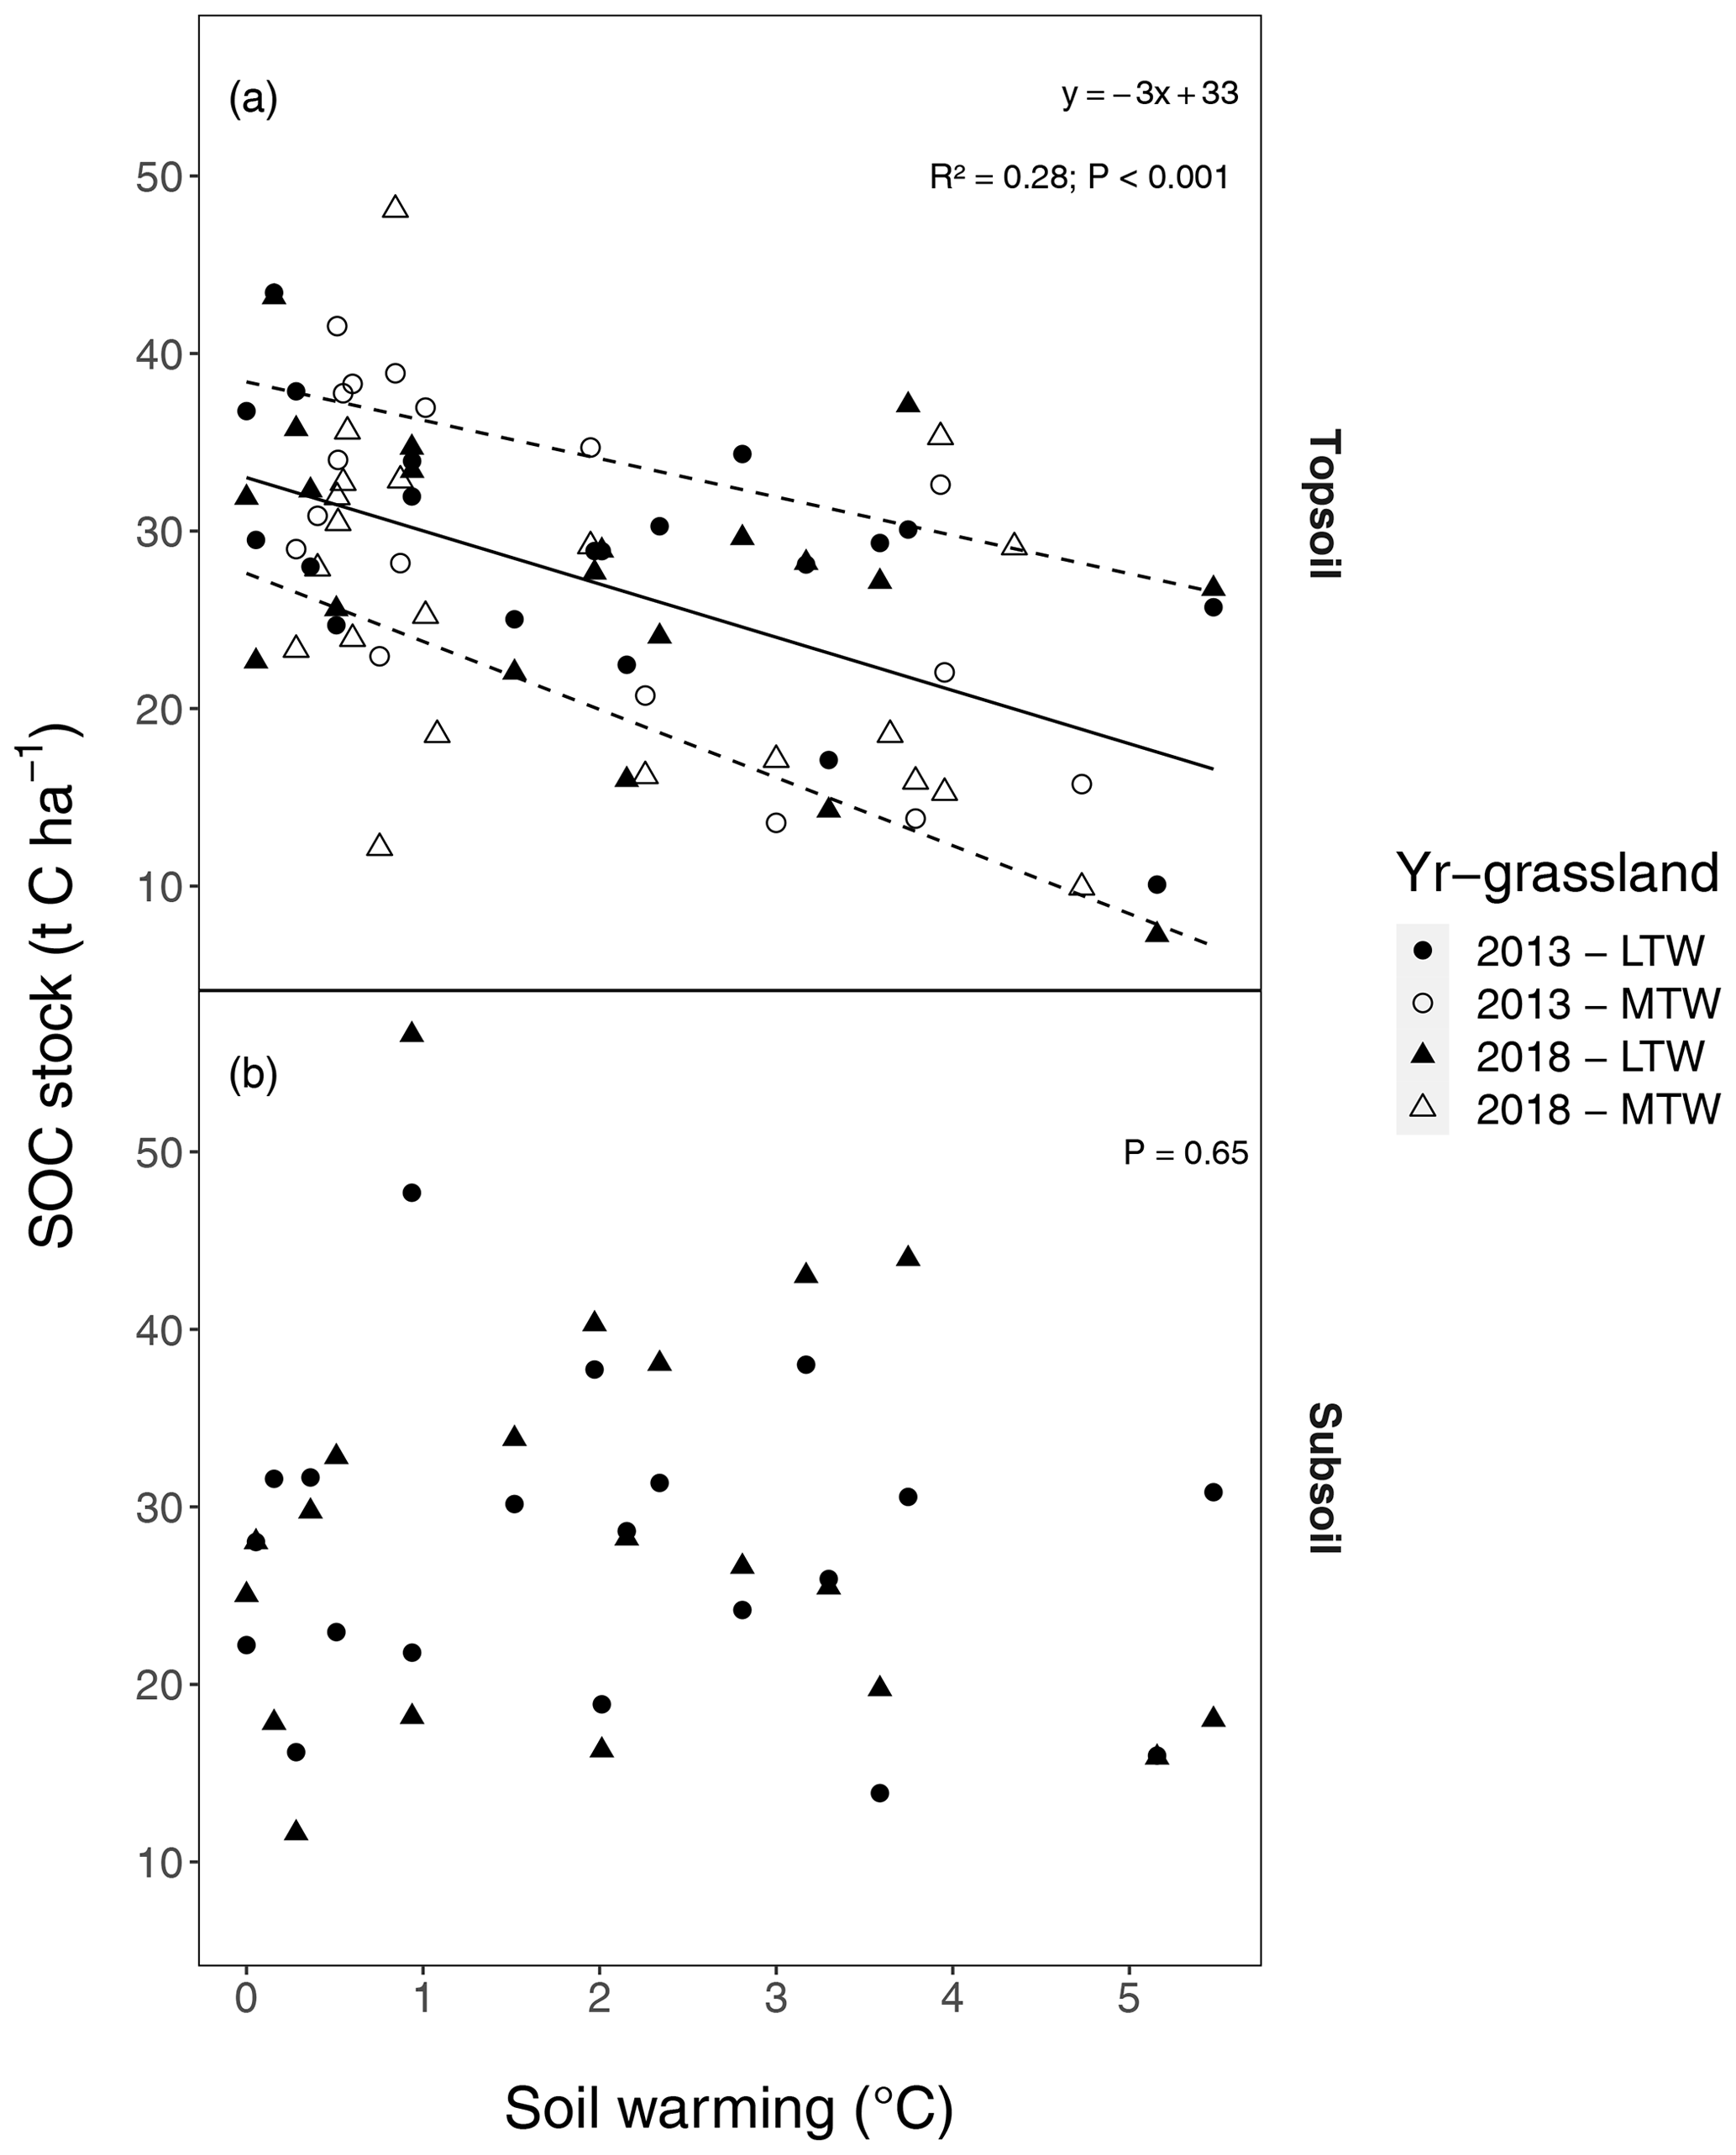
Figure 1Soil organic carbon (SOC) stocks (t C ha−1) along soil warming gradients, (a) in the topsoil (0–10 cm) and (b) in the subsoil (10–30 cm) after a soil mass correction. The regression (solid line; dashed lines represent the 95 % confidence interval; regression details provided in the inset) for medium-term warmed (MTW) and that for long-term warmed (LTW) grassland (in topsoil) for both 2013 and 2018 were combined, since neither a soil temperature–warming duration interaction effect nor a main effect for warming duration or sampling year was found. For topsoil, the marginal R2 from the linear mixed-effects model is shown. The soil mass correction is visualised in Fig. B8, and an explicit model description can be found in Appendix A “Material and methods”. The uncorrected SOC stocks yield qualitatively similar conclusions (Fig. B1), as does the C percentage in topsoil and subsoil (Fig. B2). (n=78 and n=40 for topsoil and subsoil respectively.)
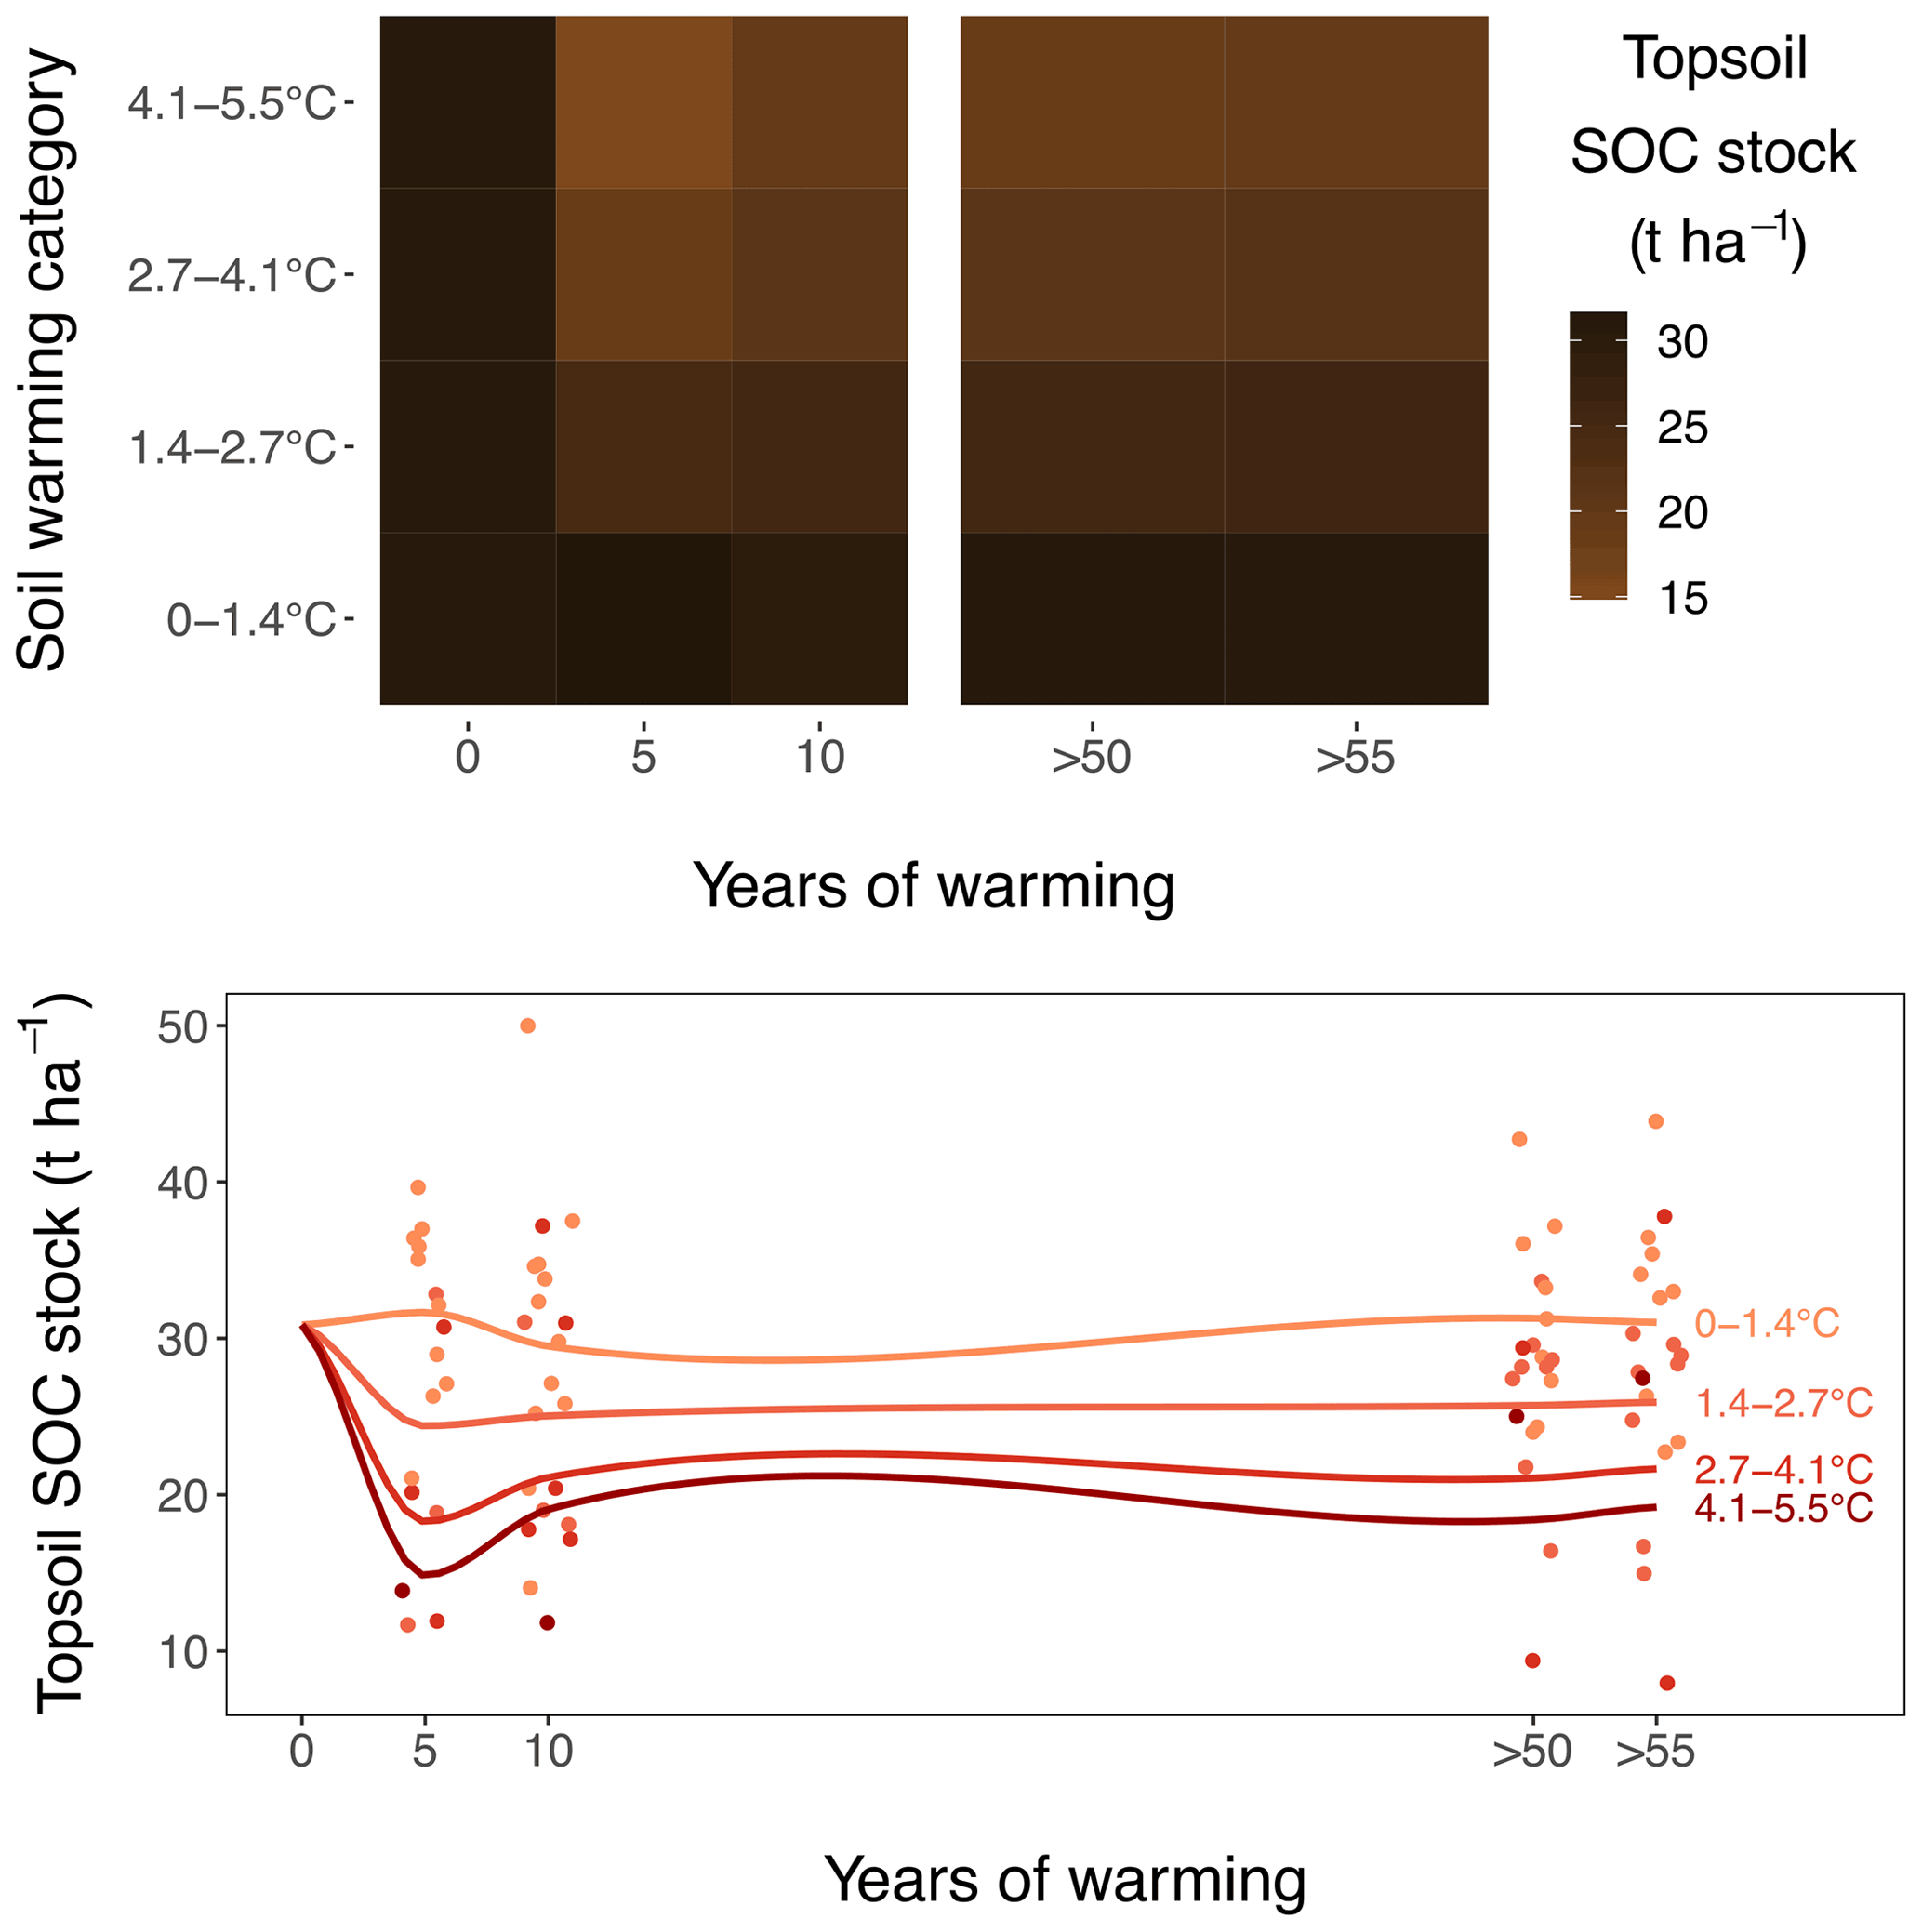
Figure 2Warming effect on topsoil (0–10 cm) SOC stocks, as observed during repeated sampling campaigns. Stocks after 5 and 10 years of warming are sampled in the medium-term warmed grasslands and stocks after >50 and >55 years in the long-term warmed grasslands. The data at the start of warming are interpolated from the ambient plots in grasslands combined. Soils are divided into four warming categories for representation. The colours on the heatmap and the smoother lines are based on a linear regression equation per sampling event.
To gain insight into the warming-induced soil physical changes and their effects on SOC stocks, soils were fractionated into different size classes that were analysed separately (see Appendix A). Aggregate fractionation showed that with increasing warming intensity, the mass of the 2–8 mm fraction declined significantly, in favour of the 250–2000 and 63–250 µm fractions (Fig. 3). No significant change was detected in the mass of the smallest (<63 µm) fraction. Opposed to this contrasting response of relative mass, all soil fractions exhibited similar soil C concentration declines with soil warming (Fig. 3). The relative mass increase in the smaller fractions was compensated for by the soil C concentration decline, resulting in a stable amount of C in the 250–2000 and 63–250 µm fractions. As a result, all of the warming-induced SOC stock decline we observed in the bulk soil was attributable to C losses in the 2–8 mm fraction.

Figure 3Relative mass, soil C concentration and absolute soil C amount of soil aggregate fractions originating from topsoil in the medium-term warmed (MTW) and long-term warmed (LTW) grassland. Darker lines indicate smaller fractions. Fractions significantly affected by soil warming are represented with solid lines; non-significant relations upon soil warming are shown with dashed lines. The full soil warming range is used here to make optimal use of the smaller sample number for aggregate data. (n=17 and n=16 for each fraction in MTW and LTW grassland respectively.)
We suggest that the rapid topsoil SOC stock reduction observed under warming, as well as its attenuation in the medium term, emerged from the interplay between soil microbial biomass and activity. Warming at the same study site accelerated microbial growth and respiration both in the medium-term and in the long-term warmed grassland (Marañón-Jiménez et al., 2018; Walker et al., 2018), which, in the absence of increased plant inputs to soil (Fig. B3), caused the initial SOC stock reduction observed here (Fig. B1a). In turn, the warming-induced SOC stock reduction caused a decline in microbial biomass, creating a negative feedback on microbial activity that we presume prevented further SOC stock reduction (Walker et al., 2018, 2020). Additionally, soil warming might reduce the catalytic power of microbial enzymes and lower SOC decomposition (Alvarez et al., 2018). Alternatively, ephemeral SOC stock reduction under warming may have resulted from physiological adaptations (Allison et al., 2010; Bradford et al., 2019) or compositional shifts (Melillo et al., 2017) in the microbial community. However, previous research in these grasslands showed that soil microbial carbon use efficiency (CUE) remained constant under short- and long-term warming (Walker et al., 2018), and microbial community composition was only affected by more intense (>9 ∘C) long-term warming (Radujković et al., 2018), meaning evidence for such mechanisms is lacking. Aggregate fractionation suggests C % in all size fractions was impacted similarly by warming (Fig. 3). This likely indicates both particulate organic matter, often occluded in large-size aggregates, and mineral-associated organic matter, present in all aggregate sizes, decreased with warming.
We hypothesised that the similar warming intensity across the soil profile (Fig. B4) would in the long term elicit similar declines in subsoil SOC stocks to those in topsoil. In contrast, SOC stocks showed apparent conservation in the subsoil subjected to >50 years of soil warming in the long-term warmed grasslands (P=0.65; Figs. 1b, 2). This lack of SOC stock reduction from the subsoil may be explained by three potentially co-occurring mechanisms. First, limited fresh C inputs from litter and root exudates below the rooting zone (<10 cm deep; Fig. B3) could be a critical factor (Tian et al., 2016), explaining the lack of a positive warming effect on subsoil decomposition because a plausible positive priming effect often elicited by fresh C inputs would have been restricted to the topsoil. Second, a large fraction of SOC in the topsoil is particulate organic matter protected in aggregates, whereas most subsoil SOC is associated with minerals (Fontaine et al., 2007; Rumpel and Kögel-Knabner, 2011). As such, by accelerating mineralisation of plant litter that is deposited only in topsoil (Walker et al., 2018) and thereby reducing aggregate stability and breaking up macroaggregates (Fig. 3) (Poeplau et al., 2020), warming may have had a much greater effect on SOC stock reductions in topsoil than in subsoil, where mineral protection dominates. Third, although unlikely given the absence of increased dissolved organic C (DOC) with warming in subsoil (Fig. B6), it can also not be excluded that SOC stocks in subsoils only appear stable because increased losses are compensated for by increased inputs from above (Osher et al., 2003).
Only very few studies have assessed subsoil SOC stock responses to deep-soil warming, and observed responses differ strongly in their magnitude and even direction. Higher subsoil than topsoil SOC stock reductions were reported in two forests (Lin et al., 2018; Soong et al., 2020a), while unresponsive (this study) subsoil SOC stocks or even increases in subsoil SOC stocks were observed in grasslands (Jia et al., 2019). Further research is needed to unravel the drivers of these contrasting subsoil SOC responses to warming among experiments, which may be related to differences in soil properties, aggregate dynamics or rooting depths.
Earth system model (ESM) inter-comparison studies (Eyring et al., 2016) have revealed large variability in both contemporary global SOC stock estimates and future SOC stock projections, underlining the need for empirical observations to better constrain the response of SOC to temperature change (Nishina et al., 2014). Long-term warming experiments like this study are thus needed to reduce the uncertainty in model projections (Abramoff et al., 2019). Although geothermally active areas offer long-lasting, continuous and large soil temperature gradients and overcome the technical challenges and high costs associated with warming manipulation experiments (Sigurdsson et al., 2016; O'Gorman et al., 2014), their use as a proxy for climate change has some drawbacks of its own, such as limited aboveground warming and a stepwise increase in soil temperature at the initiation of the geothermal gradient (De Boeck et al., 2015). Also the Andosol, covering only ±0.8 % of the Earth's surface (Soil Survey Staff, 1999), means that one should be cautious extrapolating the results to the entire subarctic region. Nonetheless, this site offers a unique opportunity to study the direct versus long-term response of SOC stocks to temperature change, and the results from this study and other deep-soil warming experiments clearly indicate that introducing vertically resolved plant and microbial dynamics into ESMs is a necessity for more accurate projections of the carbon–climate feedback.
In conclusion, warming caused a large but rapidly equilibrating SOC stock reduction in the topsoil that increased linearly with warming intensity, while no SOC stock reduction was observed in the subsoil in our subarctic grasslands exposed to decades of soil warming. Future work should focus on understanding whether these observed temporal dynamics are consistent throughout the northern non-permafrost region. Improved understanding of the variation in subsoil SOC responses to warming is also critical for constraining Earth system models and obtaining reliable climate projections.
This study was conducted at the ForHot research site, located in the Hengill geothermal area, 40 km east of Reykjavík, Iceland (64∘00′01′′ N, 21∘11′09′′ W; 100–225 m a.s.l.; Sigurdsson et al., 2016). The mean annual temperature between 2006 and 2016 was 5.2 ± 0.1 (±SE) ∘C, and mean annual daily minimum and maximum temperatures were 2.2 ± 0.2 (±SE) and 8.6 ± 0.2 (±SE) ∘C. The mean annual precipitation during the same period was 1413 ± 57 (±SE) mm (Icelandic Meteorological Office, Eyrarbakki weather station, which closed in 2017). The main vegetation type is unmanaged grassland, dominated by Agrostis capillaris, Ranunculus acris and Equisetum pratense, and the underlying soil is classified as Brown Andosol (Arnalds, 2015).
In this study, we define the 0–10 cm layer as topsoil and the 10–30 cm layer as subsoil. This subsoil layer strongly differed from the topsoil in many ways. First in these soils, the A horizon that is enriched with SOC is a maximum of 10 cm deep (Arnalds, 2015). Second, 95.7 ± 0.4 (SE) % of the fine root biomass sampled in the top 30 cm layer was found in the upper 10 cm (Fig. B5). Third, bulk density in subsoil is significantly higher than in topsoil (P<0.001) (Fig. B7).
The site comprises two areas that have been subjected to geothermal soil warming for different periods of time (Sigurdsson et al., 2016). One area (hereafter “medium-term warmed grassland”) has been warmed since May 2008, when a large earthquake shifted geothermal systems to previously unwarmed soils. The second area (2.5 km north-east of the first area; hereafter “long-term warmed grassland”) was already mentioned as having been warmed in the early 18th century (Magnússon and Vídalín, 1708) and has thus likely been warmed for centuries. Certainly, the warming was registered in a census during the 1960s, and no change in the location of the hotspots has been recorded during the past 50 years (Kristján Sæmundsson, personal communication, 1963–1965). The soil warming increment at both sites is relatively constant throughout the year, and extreme deviations are rare (Sigurdsson et al., 2016). Soil warming is caused by horizontal heat conduction through the soil, causing fairly homogeneous warming with depth and inducing a fairly natural temperature depth profile (Fig. B4). This homogeneous soil warming is in line with CMIP5 predictions of rapid transfer of the temperature signal from air to shallow and deeper soils (Soong et al., 2020b). The geothermal water is confined within the bedrock, and no signs of soil contamination by geothermal byproducts have been found (Shi et al., 2020). Soil pH (mean 5.5 ± 0.1 (SE)) and soil moisture did not show major changes along the soil warming gradients, with soil moisture very rarely approaching the permanent wilting point and no relation between soil temperature and the frequency of drought events (Leblans et al., 2017). Further, the plant species composition was very similar between the medium-term and the long-term warmed grassland, and no drastic changes in dominant plant species occurred up to +6.4 ∘C warming (Leblans et al., 2017) (which is the Representative Concentration Pathway 8.5 (RCP8.5) projected annual warming level for high northern latitudes for the year 2100) (IPCC, 2013). More detailed information on the site characteristics can be found in Sigurdsson et al. (2016).
We established five replicate transects in each area (the medium-term and the long-term warmed grassland) in 2012, around two and four geothermal heat sources respectively. In the medium-term warmed grassland, all transects were located on south-west-facing slopes, three with the geothermal heat source at the bottom of the slope and two with the geothermal heat source at the top, to eliminate effects of topography and downward transport of groundwater and nutrients from introducing a bias into the SOC stocks. In the long-term warmed grassland, all transects were located on level ground. Within the long-term and medium-term warmed grassland, all measurement plots had similar microtopography and grazing history.
Each transect consists of six 2×2 m permanent measurement plots distributed along the soil temperature gradient, including unwarmed soil (mean annual temperature 5.7 ± 0.1 ∘C), yielding 60 plots in total. Each 2×2 m permanent measurement plot was accompanied by two adjacent 0.5×0.5 m subplots for destructive measurements. Plot-specific soil warming was recorded hourly at 10 cm soil depth using HOBO TidbiT v2 water temperature data loggers (Onset Computer Corporation, USA). More detailed information on the experimental design is provided in Sigurdsson et al. (2016).
In July 2013 and 2018, two 0–10 cm soil cores (corer ø=5.12 cm) were taken within each subplot. In the medium-term warmed grassland, soils were too shallow to sample deeper, but additional 10–30 cm cores were taken in the long-term warmed grassland. Cores were analysed for (1) soil C concentrations, (2) pH (topsoil only), (3) soil bulk density (BD) and (4) SOC stocks.
From the first core we obtained fine roots (<2 mm) and soil particles (>2 mm) (necessary to calculate BD) by washing the cores over two sieves with mesh sizes 2 and 0.5 mm. Roots and >2 mm particles were dried and weighed to gain fine root biomass (g m−2), and the volume of >2 mm particles (g cm−3) was measured by the water displacement method. The second soil core was first dried and weighed (as for aboveground vegetation), and soil was then sieved to obtain soil particles <2 mm and split into three aliquots. One aliquot of 2 g was milled (Retsch MM 301 Mixer Mill, Haan, Germany) and analysed for C concentration (%) by dry combustion (macro elemental analyser, model vario MAX CN, Hanau, Germany). Finally, BD (g cm−3) and SOC stocks (t ha−1) were calculated according to the approach described in Bárcena et al. (2014).
To measure dissolved organic carbon (DOC), Teflon suction cup lysimeters (Prenart Super Quartz, Prenart Equipment ApS, Frederiksberg, Denmark) were placed at about 30–40 cm depth in the medium-term and long-term warmed grassland in October 2014. Samples were taken during summer 2015, 2016 and 2017. The DOC was analysed with a combined total organic carbon analyser (Shimadzu, Kyoto, Japan). Further installation details of the lysimeters, as well as the sampling procedure, are described in Edlinger (2016). The C-input data for arbuscular mycorrhizae originate from Zhang et al. (2020), where the sampling procedure is described. Aboveground biomass was sampled by placing a 20×40 cm frame on the plot, after which all vegetation was clipped. The samples were taken to the lab and sorted by hand into grass and moss fractions. Both fractions were dried for 48 h at 70 ∘C, weighed and milled. The samples were analysed for C concentration (%) by dry combustion (macro elemental analyser, model vario MAX CN, Hanau, Germany). Aggregate fractionation was done in 2018 only. Per plot, a 0–10 cm soil core was taken (corer ø=5.12 cm) and dried at room temperature for some weeks. Stones were removed, and aggregates larger than 8 mm were broken up by dry sieving on an 8 mm soil sieve. The dry-sieved soil was then slaked for 5 min with DI water, after which it was wet-sieved at 2 mm and 250 and 63 µm to separate it into four size fractions. Each fraction was dried at 70 ∘C for 72 h, after which all fractions were ground with a ball mill to homogenise them and analysed for C concentration (%) by dry combustion (macro elemental analyser, model vario MAX CN, Hanau, Germany). Relative mass of the fractions was calculated by dividing the fraction mass by the sum of all fraction masses of the initial sample. The absolute soil C amount of each fraction was calculated by multiplying the fraction soil mass per 100 g of dry soil with the soil C concentration (Fig. 3).
A soil mass correction of the SOC stocks as described in Ellert and Bettany (1995) was necessary to compare stock changes across the soil warming gradient as soil compaction increased with warming in the upper soil layers (increasing BD; Fig. B7), implying that soil depths in unwarmed soil corresponded to shallower soil depths at warmer soils. The calculation method is shown in detail in Fig. B8.
The soil warming dependence of bulk soil SOC stocks (corrected and uncorrected for soil compaction), BD, DOC and soil C concentration was tested with a linear mixed-effects model (Kuznetsova et al., 2017). For SOC stocks and BD, soil warming and warming duration (medium term vs. long term) were included as the main effects for topsoil, while only soil warming was used as a main effect for subsoil. The sampling year and transect were used in a crossed random-effect design to account for sampling differences and interannual variabilities between the two sampling campaigns and for variation between the five transects per grassland. An explicit model description for topsoil can be found below.
SOC_stock ~ soil_warming
+ warming-duration + (1|year)
+ (1|transect)
For DOC, soil warming was used as a main effect and the sampling year as a random factor. For soil C concentration, soil warming was used as a main effect, while the sampling year and transect were used in a crossed random-effect design. In all cases, criteria for normality and homoscedasticity were met. For all tests, the dataset was reduced to cover only the warming levels captured by the projections for high northern latitudes for the year 2100 (0–6.4 ∘C warming) (IPCC, 2013). All tests were performed using R software (R Development Core Team, 2011).
For topsoil, we calculated a corrected thickness of a warmed soil layer, corresponding to the same core mass as the unwarmed soils. Using the ratio of corrected and uncorrected layer thickness, we calculated a corrected SOC stock for the warmed topsoil. For warmed subsoils, we calculated the corrected thickness in the same way as for topsoil but subtracted a surplus thickness of the above topsoil. The corrected subsoil SOC stock was then calculated as the sum of the surplus topsoil SOC stock and the SOC stock in the corrected subsoil layer. The detailed calculation method is shown below.
B1 Corrections 0–10 cm soil layer
First, the corrected soil layer thickness of the 0–10 cm layer (C.Th0−10) was calculated for the warmed soils:
where U.Th0−10 is the uncorrected soil layer thickness of the 0–10 cm layer (10 cm), U.BD0−10 is the uncorrected BD of the 0–10 cm layer (which corresponds to the BD at ambient soil temperature) and C.BD0−10 is the measured BD for the 0–10 cm layer. Then, the corrected SOC stocks of the 0–10 depth layer (C.SOC0−10) were calculated:
where U.SOC0−10 is the uncorrected SOC stock in the 0–10 cm depth layer and C.Th0−10 U.Th0−10 corresponds to the proportional thickness of the corrected layer compared to the uncorrected layer.
B2 Corrections 10–30 cm soil layer (only applicable to the long-term warmed grassland)
First, the thickness of the surplus soil layer from the 0–10 cm layer (S.Th0−10) was calculated:
The second term is a correction factor for the soil compaction of the surplus soil layer. Then, the corrected thickness of the 10–30 cm soil layer, not yet taking the surplus soil sampled from the 0–10 cm layer (S.Th0−10) into account (c.Th10−30), was calculated:
where U.Th10−30 is the uncorrected soil layer thickness of the 10–30 cm layer (20 cm), U.BD10−30 is the uncorrected BD of the 10–30 cm layer (which corresponds to the BD at ambient soil temperature) and C.BD10−30 is the measured BD for the 10–30 cm layer.
Subsequently, we took into account the thickness of the surplus soil sampled from the 0–10 cm layer to calculate the final corrected soil thickness of the 10–30 cm soil layer (C.Th10−30). Hence, C.Th10−30 is the part of the 10–30 cm layer that remains after (i) correcting for soil compaction and (ii) subtracting the thickness of the surplus soil sampled at the 0–10 cm layer:
Subsequently, the corrected SOC stock for the 10–30 cm layer (C.SOC10−30) was calculated:
where U.SOC10−30 is the uncorrected SOC stock in the 10–30 cm depth layer and C.Th10−30 U.Th10−30 corresponds to the proportional thickness of the corrected layer compared to the uncorrected layer.

Figure B1Uncorrected soil organic carbon (SOC) stock in relation to soil warming, (a) in the topsoil (0–10 cm) and (b) in the subsoil (10–30 cm). All soil samples were taken in July 2013 or July 2018. The regression for medium-term warmed (MTW) and long-term warmed (LTW) grassland (in topsoil) for both 2013 and 2018 was combined, since neither a soil temperature–warming duration interaction effect nor a main effect for warming duration was found. Soil warming is expressed relative to ambient soil temperature (both at 10 cm depth). In topsoil, a linear relation was observed, while no significant effect was present in subsoil. The 95 % confidence bounds are shown around the topsoil regression slope. (n=78 and n=40 for topsoil and subsoil respectively.)
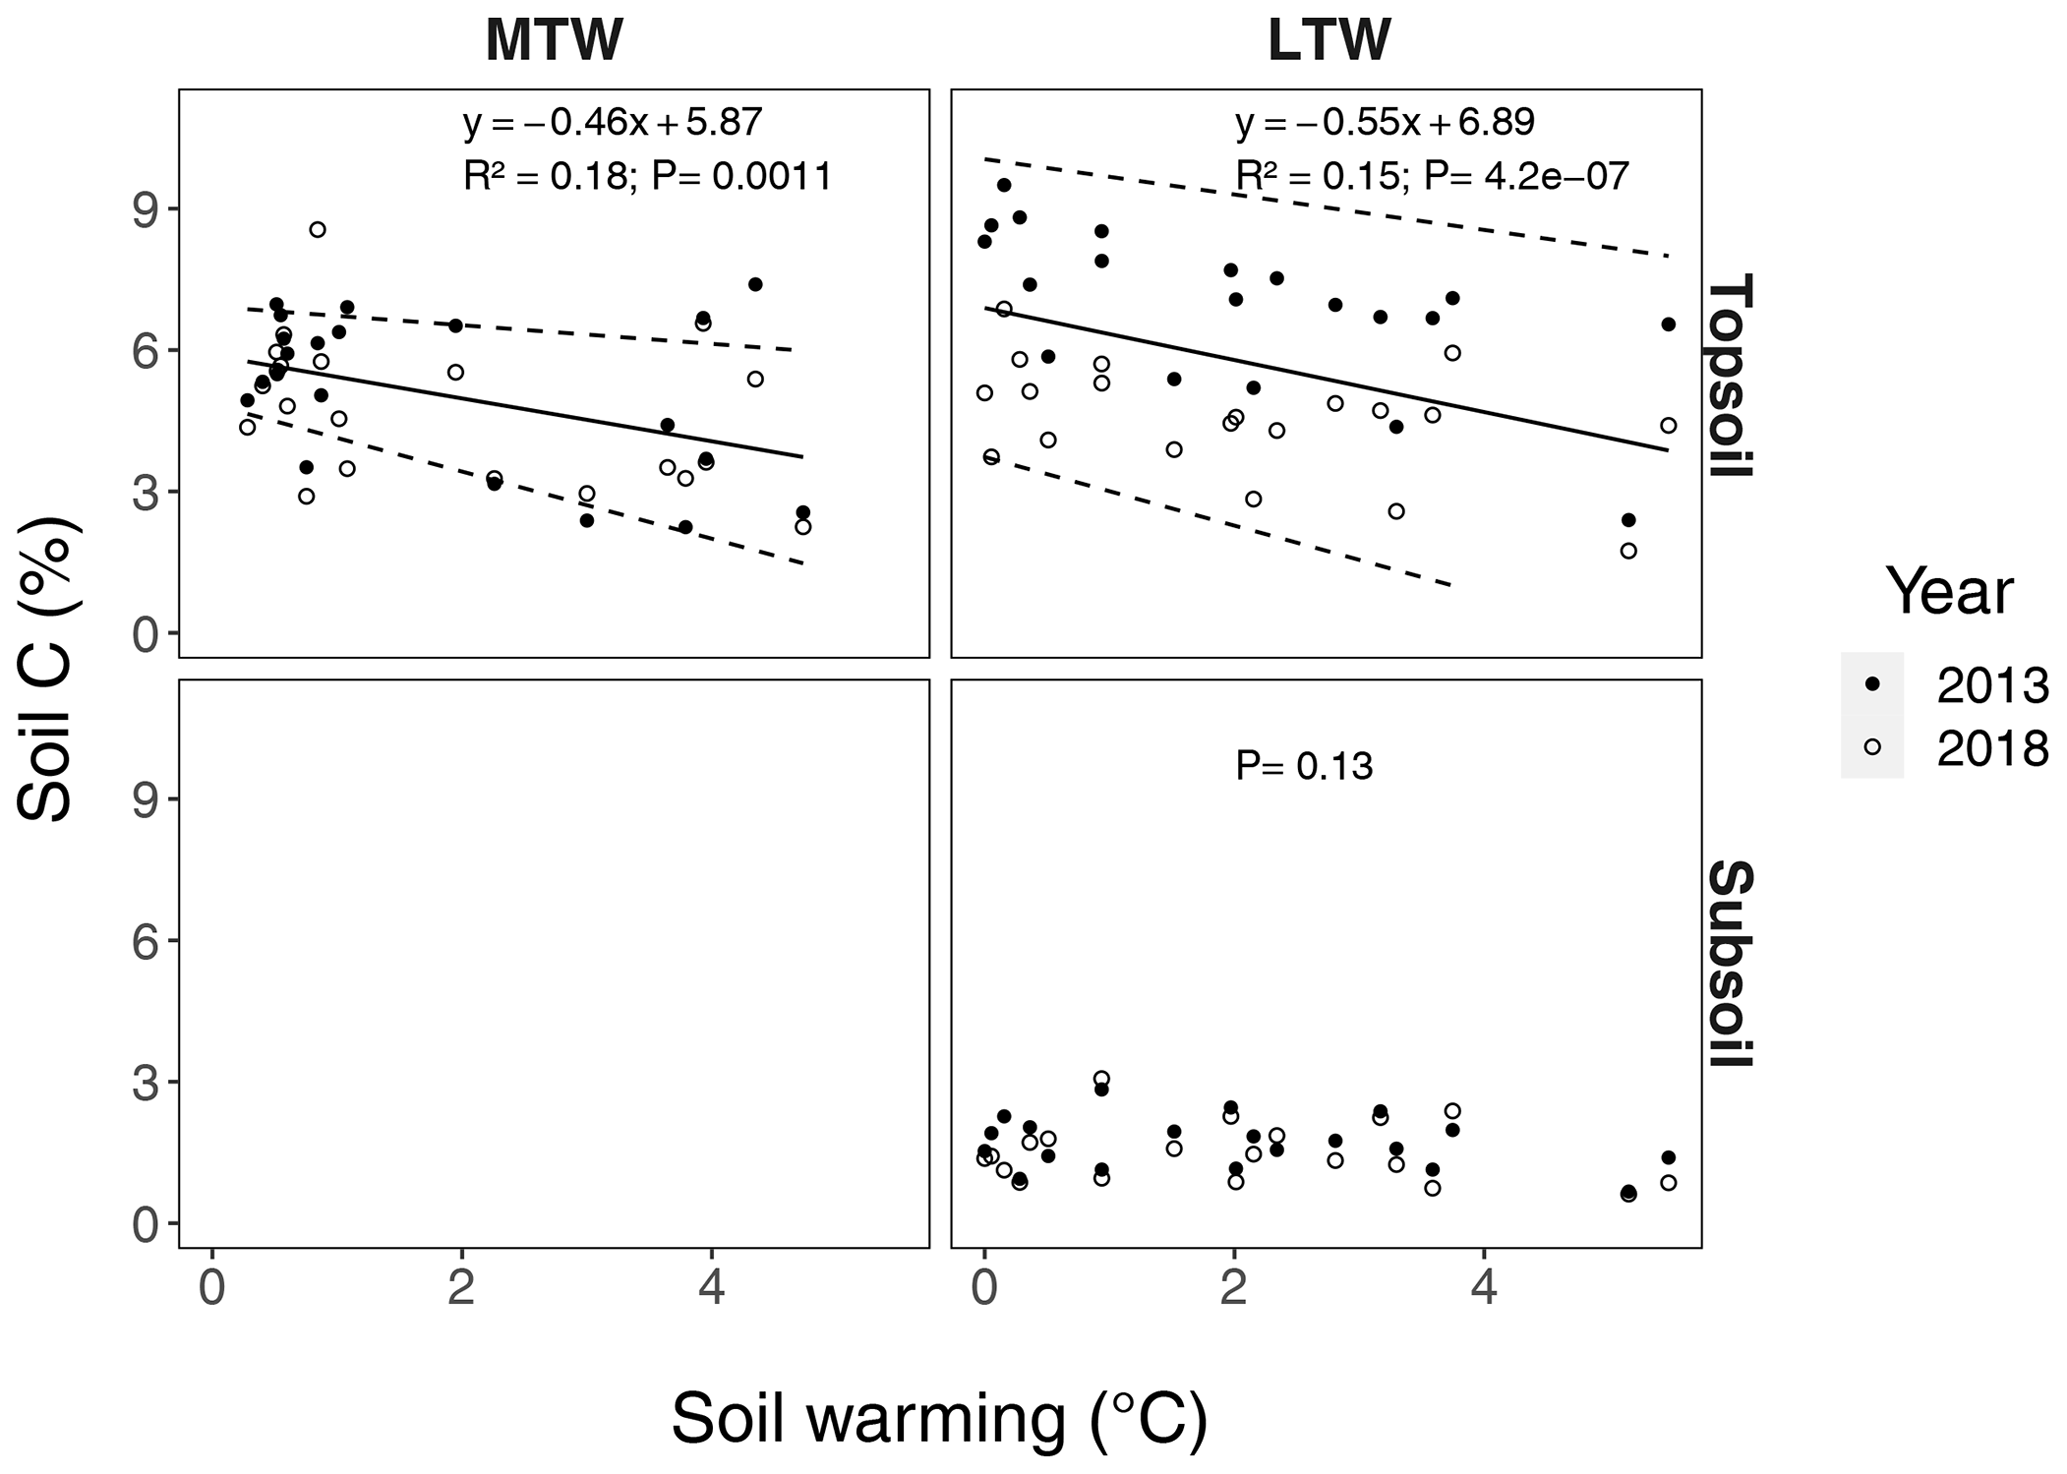
Figure B2Percentage of carbon in topsoil and subsoil, for the long-term warmed (LTW) and medium-term warmed (MTW) grassland. The 95 % confidence bounds are shown around the topsoil linear regression slopes. For topsoil, the marginal R2 from the linear mixed-effects model is shown. (For topsoil, n=42 and n=40 for MTW and LTW grassland respectively; for subsoil, n=40 for LTW grassland.)
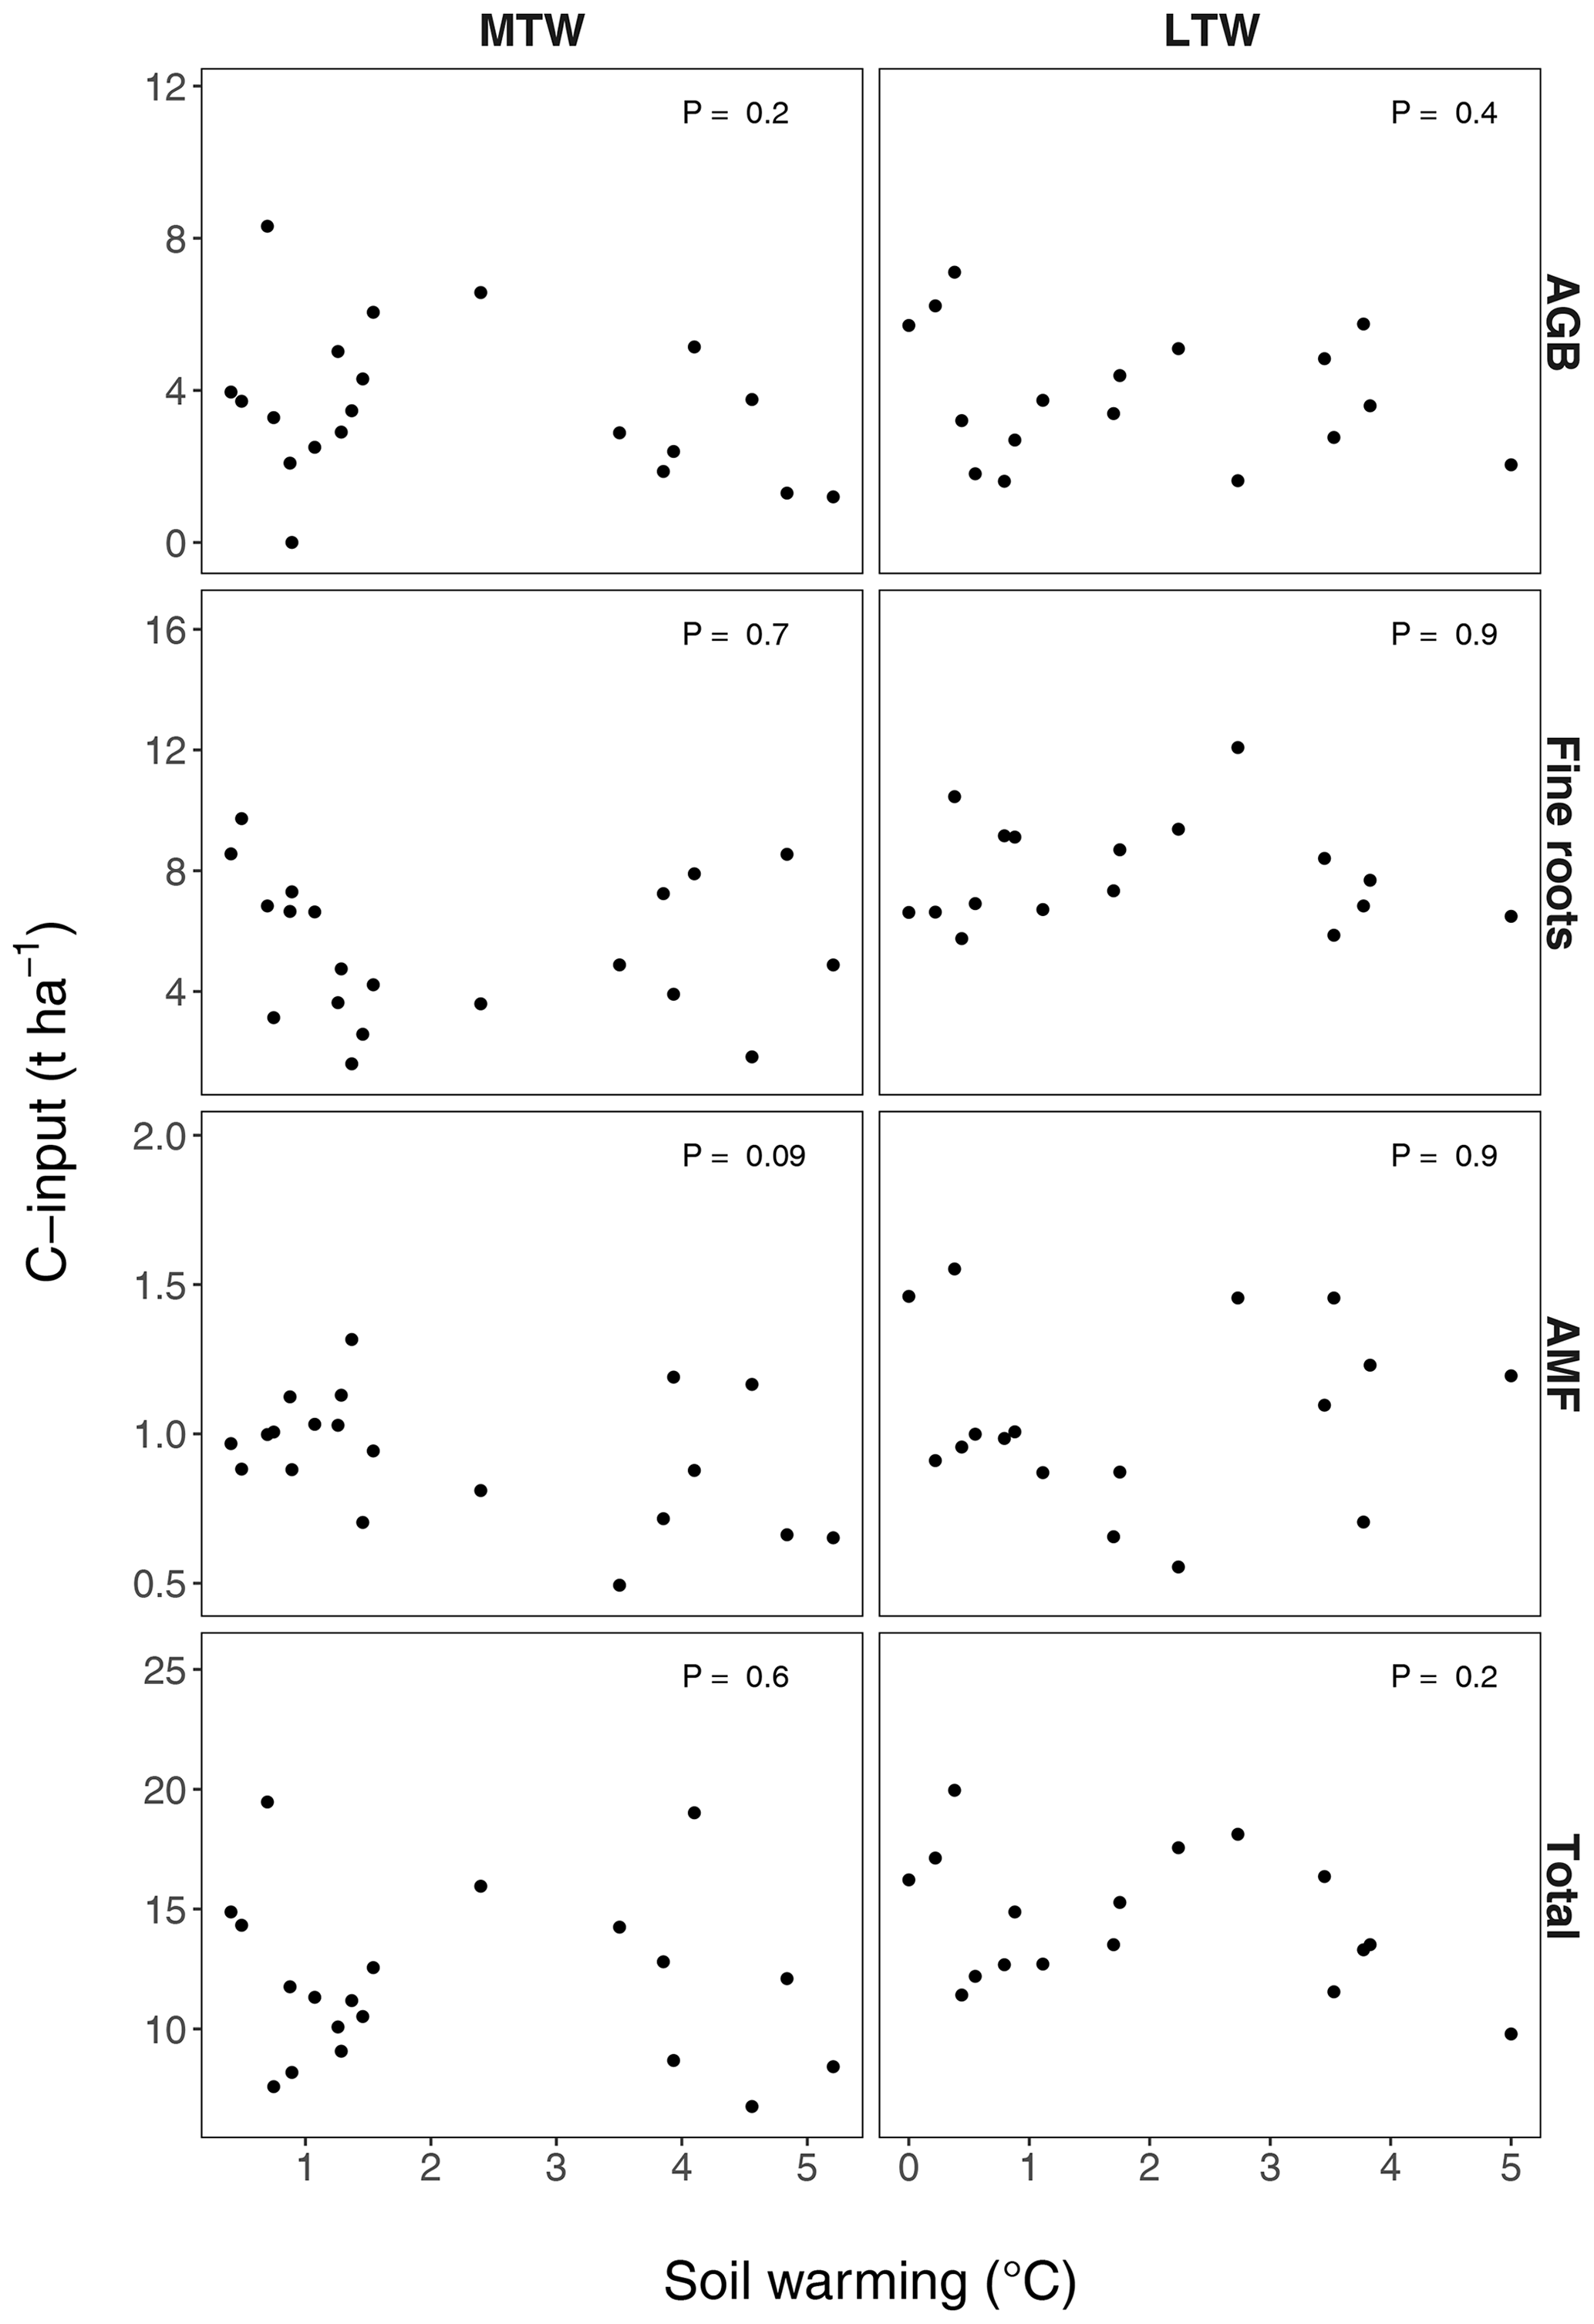
Figure B3Proxies for annual soil C inputs from aboveground biomass (AGB), fine root biomass and arbuscular mycorrhizae (AMF) in the medium-term warmed (MTW) and the long-term warmed (LTW) grasslands. Vascular plant aboveground biomass was used as a proxy for aboveground C inputs, vascular plant fine root biomass for belowground C inputs and C sequestered by AMF (Cnew; data from Zhang et al., 2020) for C inputs by arbuscular mycorrhizae. For the observed soil warming range (0–6.4 ∘C warming), no change in C inputs could be found. P values were obtained by a linear regression analysis. (n=20 and n=17 for MTW and LTW inputs respectively.)
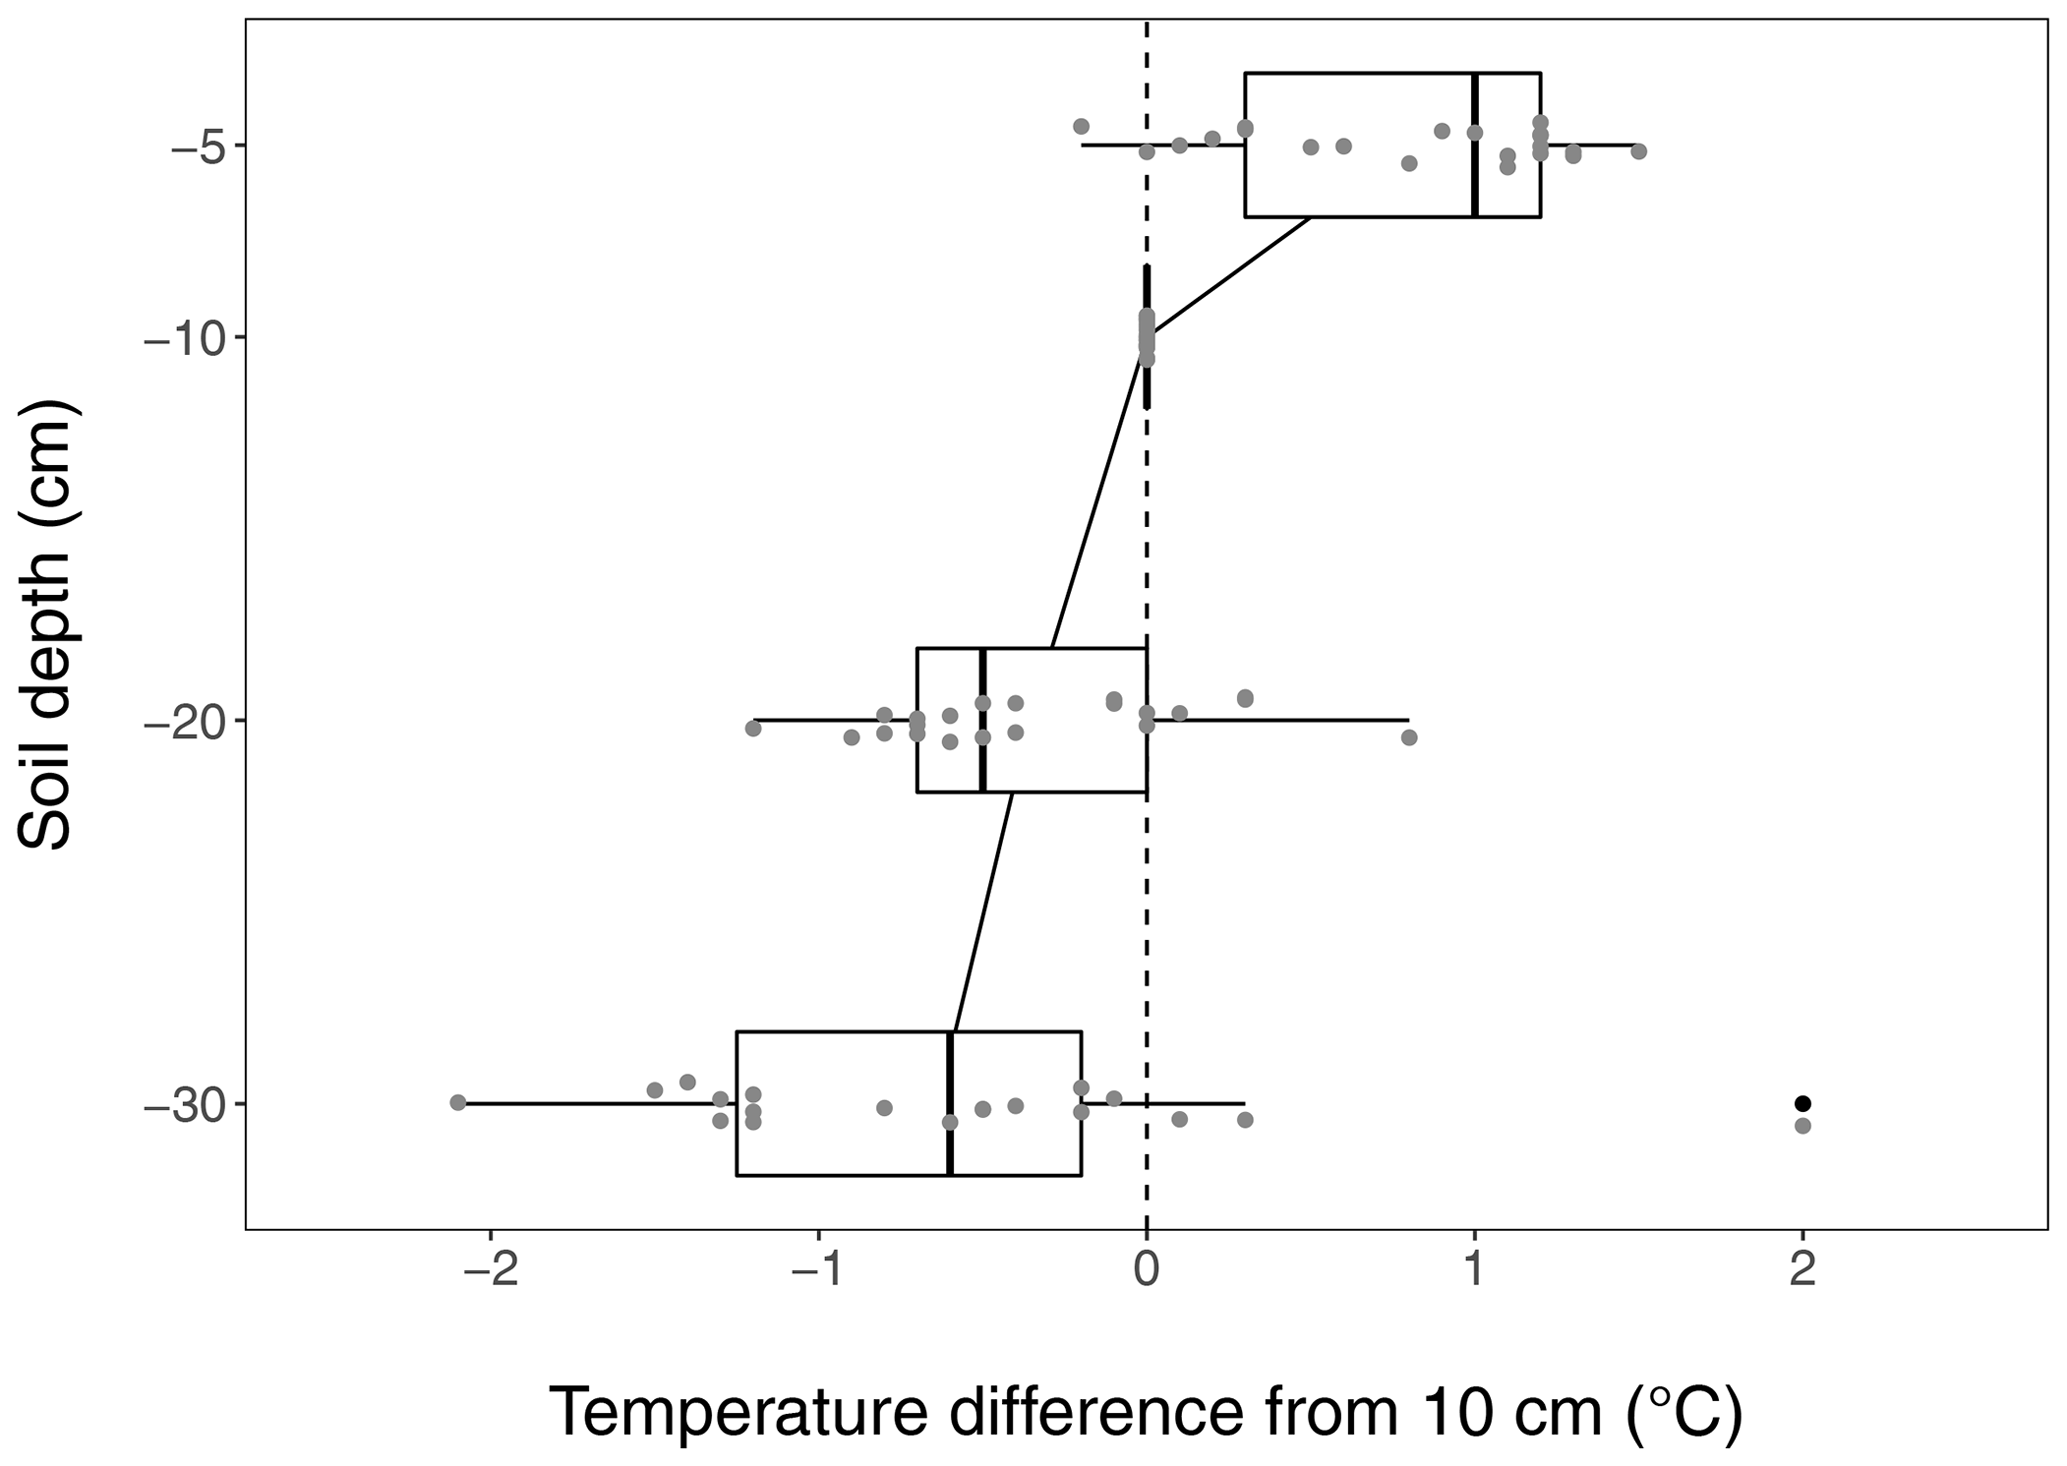
Figure B4Soil warming along the vertical soil profile, based on the reference temperature measured at 10 cm which is used throughout the paper. The median temperature is about 1 ∘C higher at 5 cm depth while being slightly lower at 20 and 30 cm depth. Due to the shallow soil in the medium-term warmed grassland, the warming profile is given for the long-term warmed grassland only.
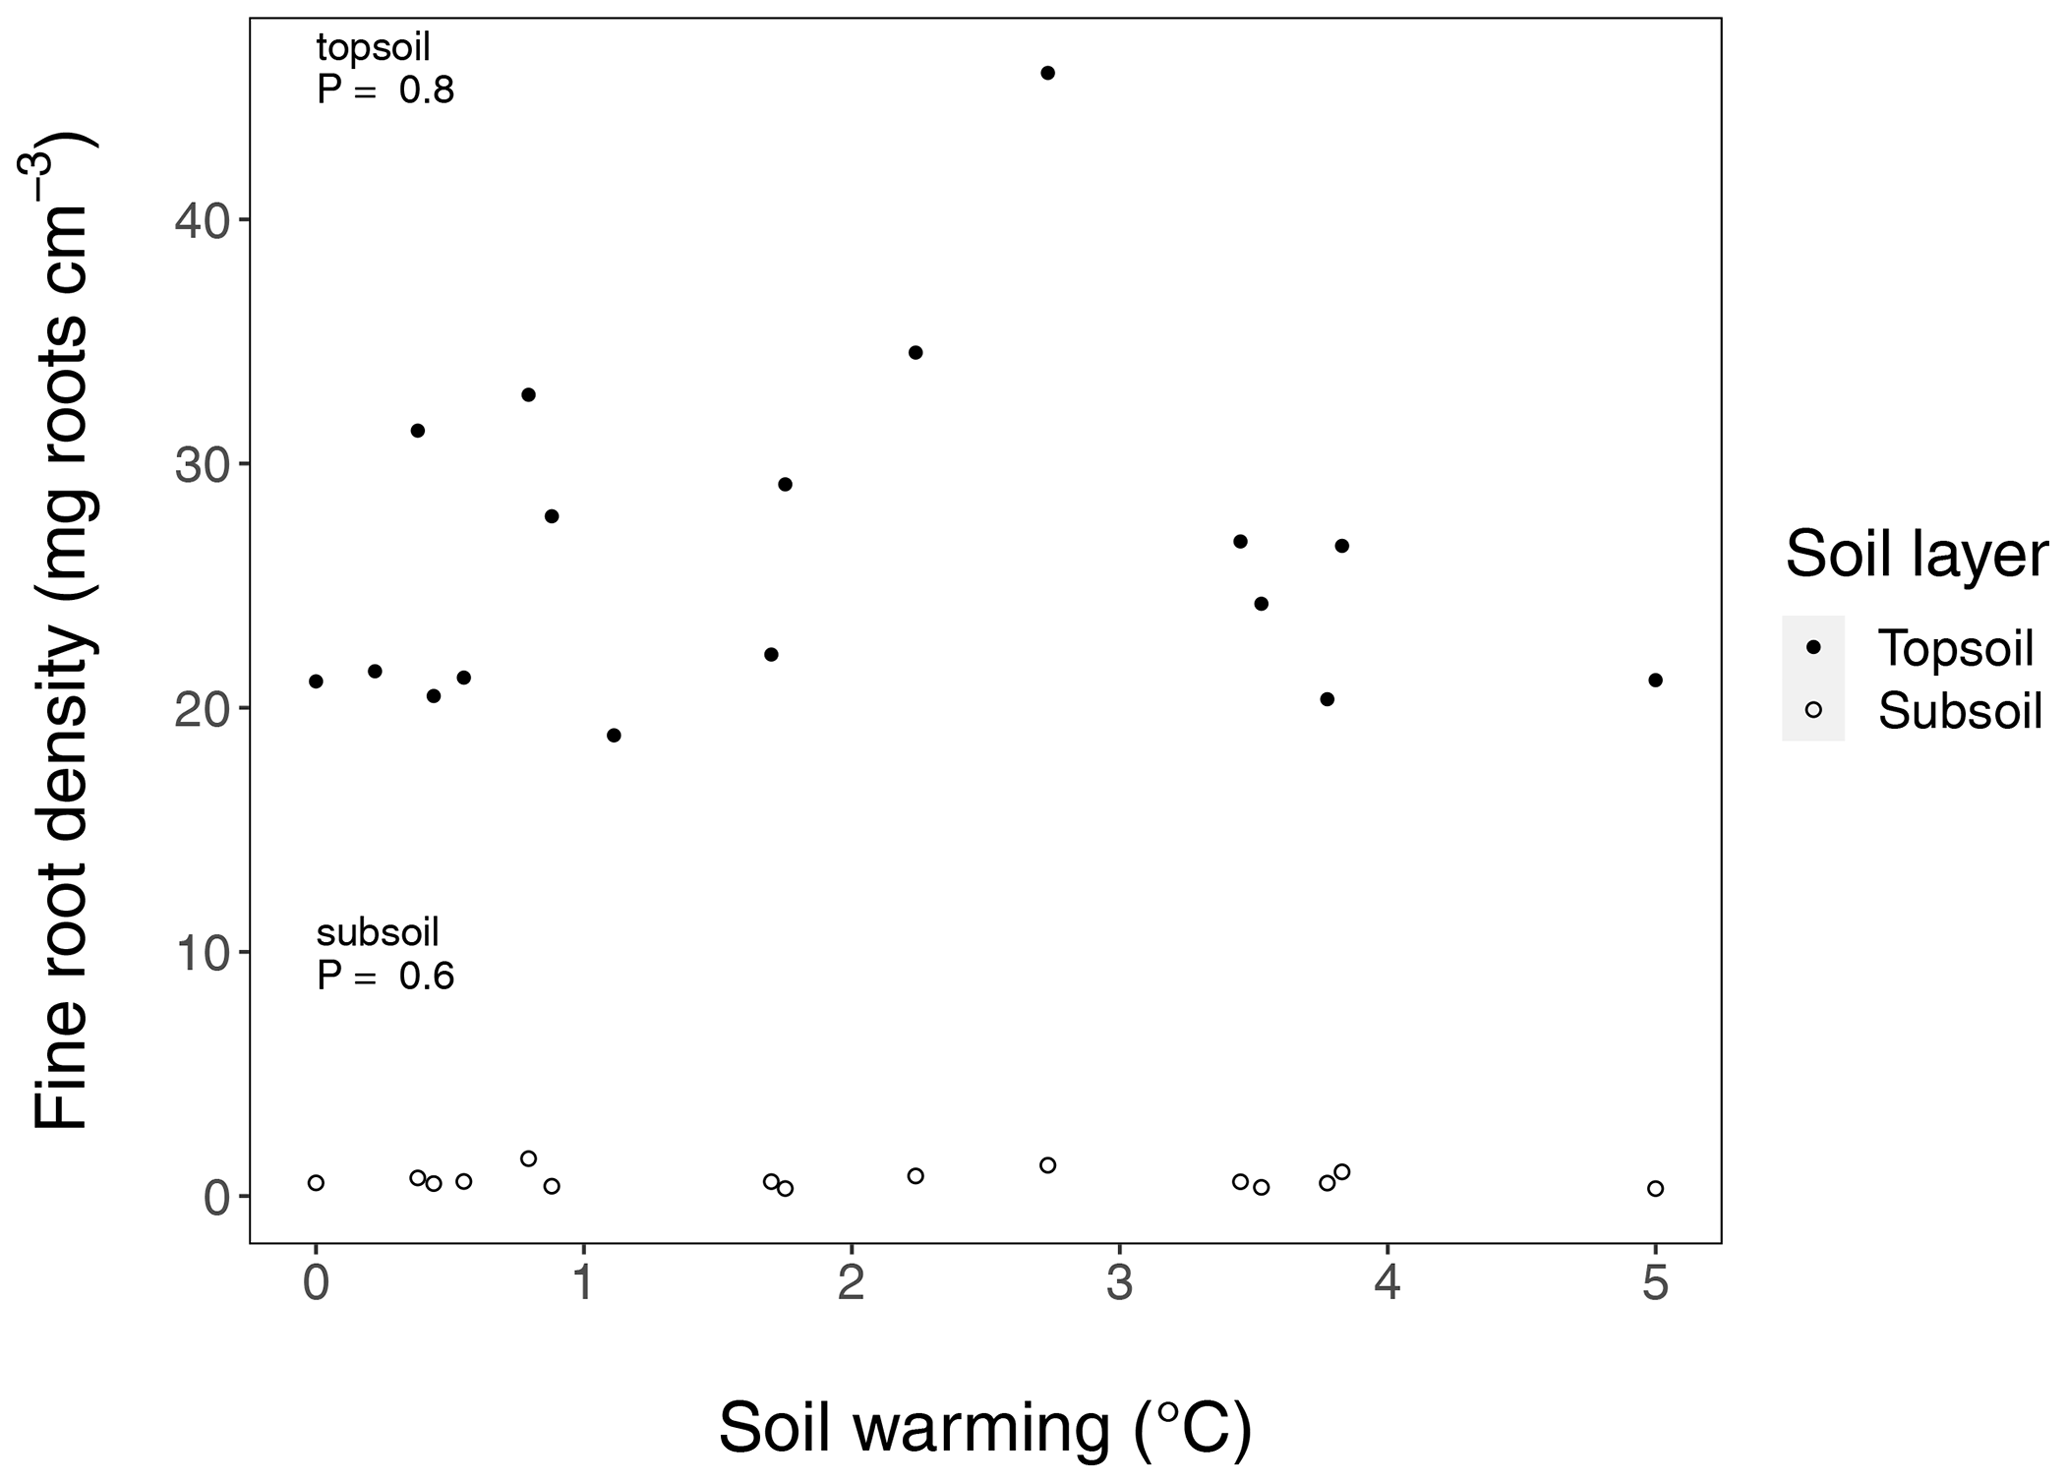
Figure B5Fine root density in long-term warmed (LTW) grassland in topsoil and subsoil sampled in July 2018. For the observed soil warming range (0–6.4 ∘C warming), no change in C inputs could be found. P values were obtained by a linear regression analysis. In the top 30 cm soil layer, 95.7 ± 0.4 (SE) % of the fine root biomass was found in the upper 10 cm, which is why we define the 0–10 cm layer as topsoil and the 10–30 cm layer as subsoil. (n=17 and n=15 for topsoil and subsoil respectively.)
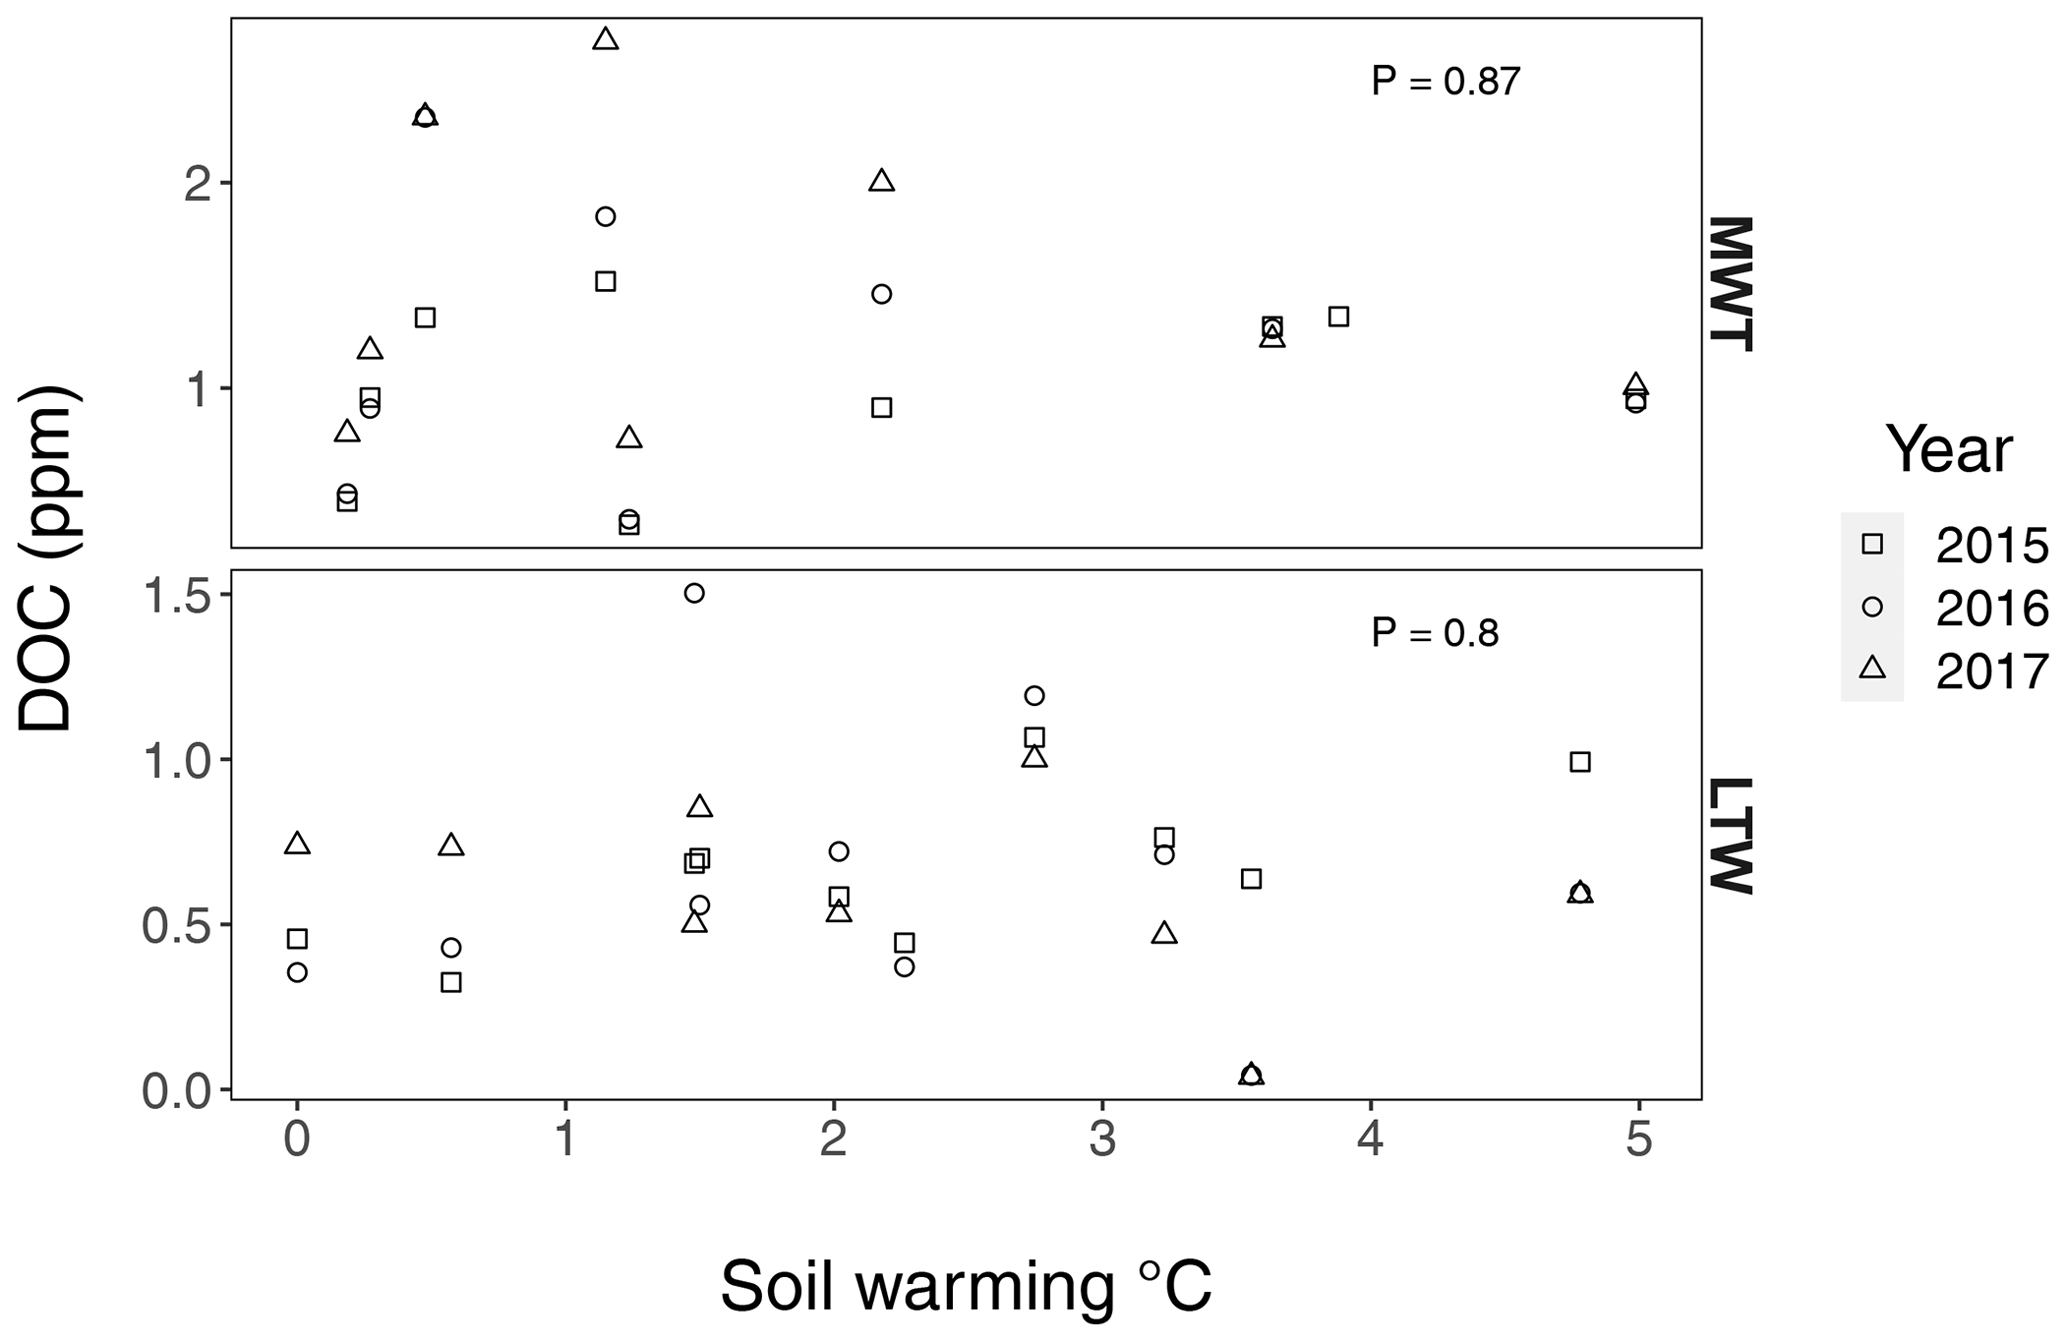
Figure B6Dissolved organic carbon (DOC) in medium-term warmed (MTW) and long-term warmed (LTW) grassland during summer 2015, 2016 and 2017. No DOC change was observed with soil warming in the SWT (P=0.95) or in the LTW (P=0.8), meaning that carbon inputs into deeper soil layers remained constant over the whole soil temperature gradient. Statistical analysis was done with a linear mixed-effects model with soil warming as an explanatory variable and the sampling year as a random factor. Criteria for normality and homoscedasticity were met. Dissolved organic carbon was sampled at an approximate depth of 30 cm with Prenart Super Quartz (Prenart Equipment ApS, Frederiksberg, Denmark) soil water samplers, installed around 1 October 2014. The samples were always inserted from “downslope”, where the soil was deep enough. Analyses of the samples was done at the IGN Biochemistry Lab, University of Copenhagen. (n=25 and n=29 for MTW and LTW grassland respectively.)
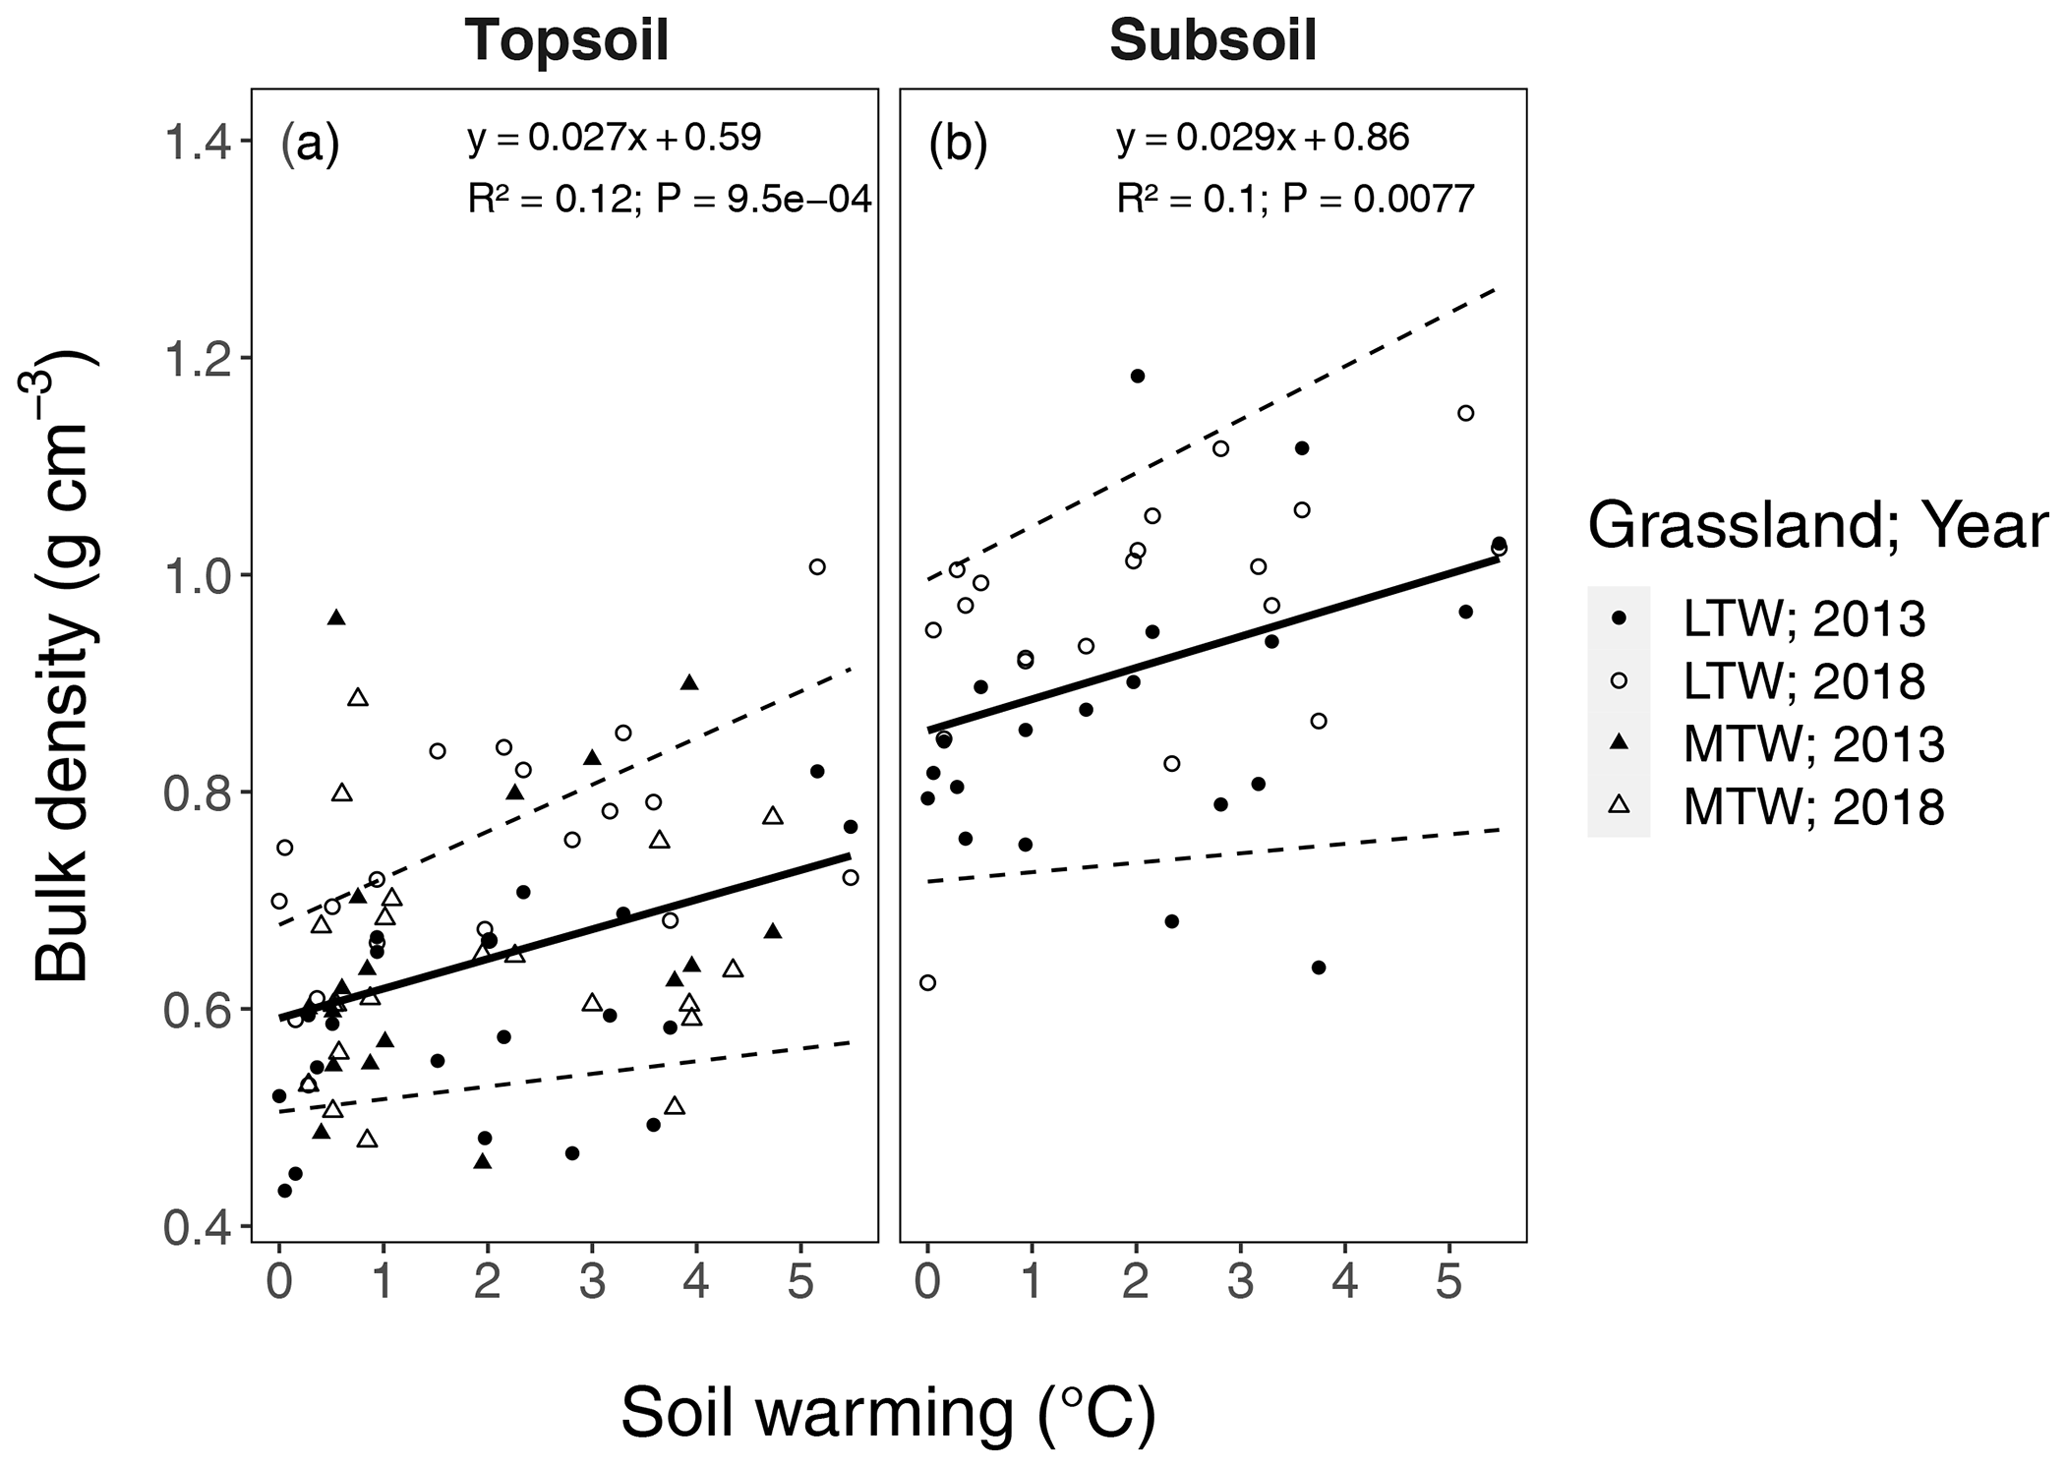
Figure B7Changes in bulk density with soil warming in the long-term warmed (LTW; circles) and the medium-term warmed (MTW; triangles) grassland. Soil warming is expressed relative to ambient soil temperature (at 10 cm depth). Bulk density is separated for the topsoil (0–10 cm) and the subsoil (10–30 cm). The regression for medium-term warmed (MTW) and long-term warmed (LTW) grassland (in topsoil) for both 2013 and 2018 was combined, since neither a soil temperature–warming duration interaction effect nor a main effect for warming duration or sampling year was found. The 95 % confidence bounds are shown around the regression slopes. The marginal R2 from the linear mixed-effects model is shown. (n=78 and n=40 for topsoil and subsoil respectively.)
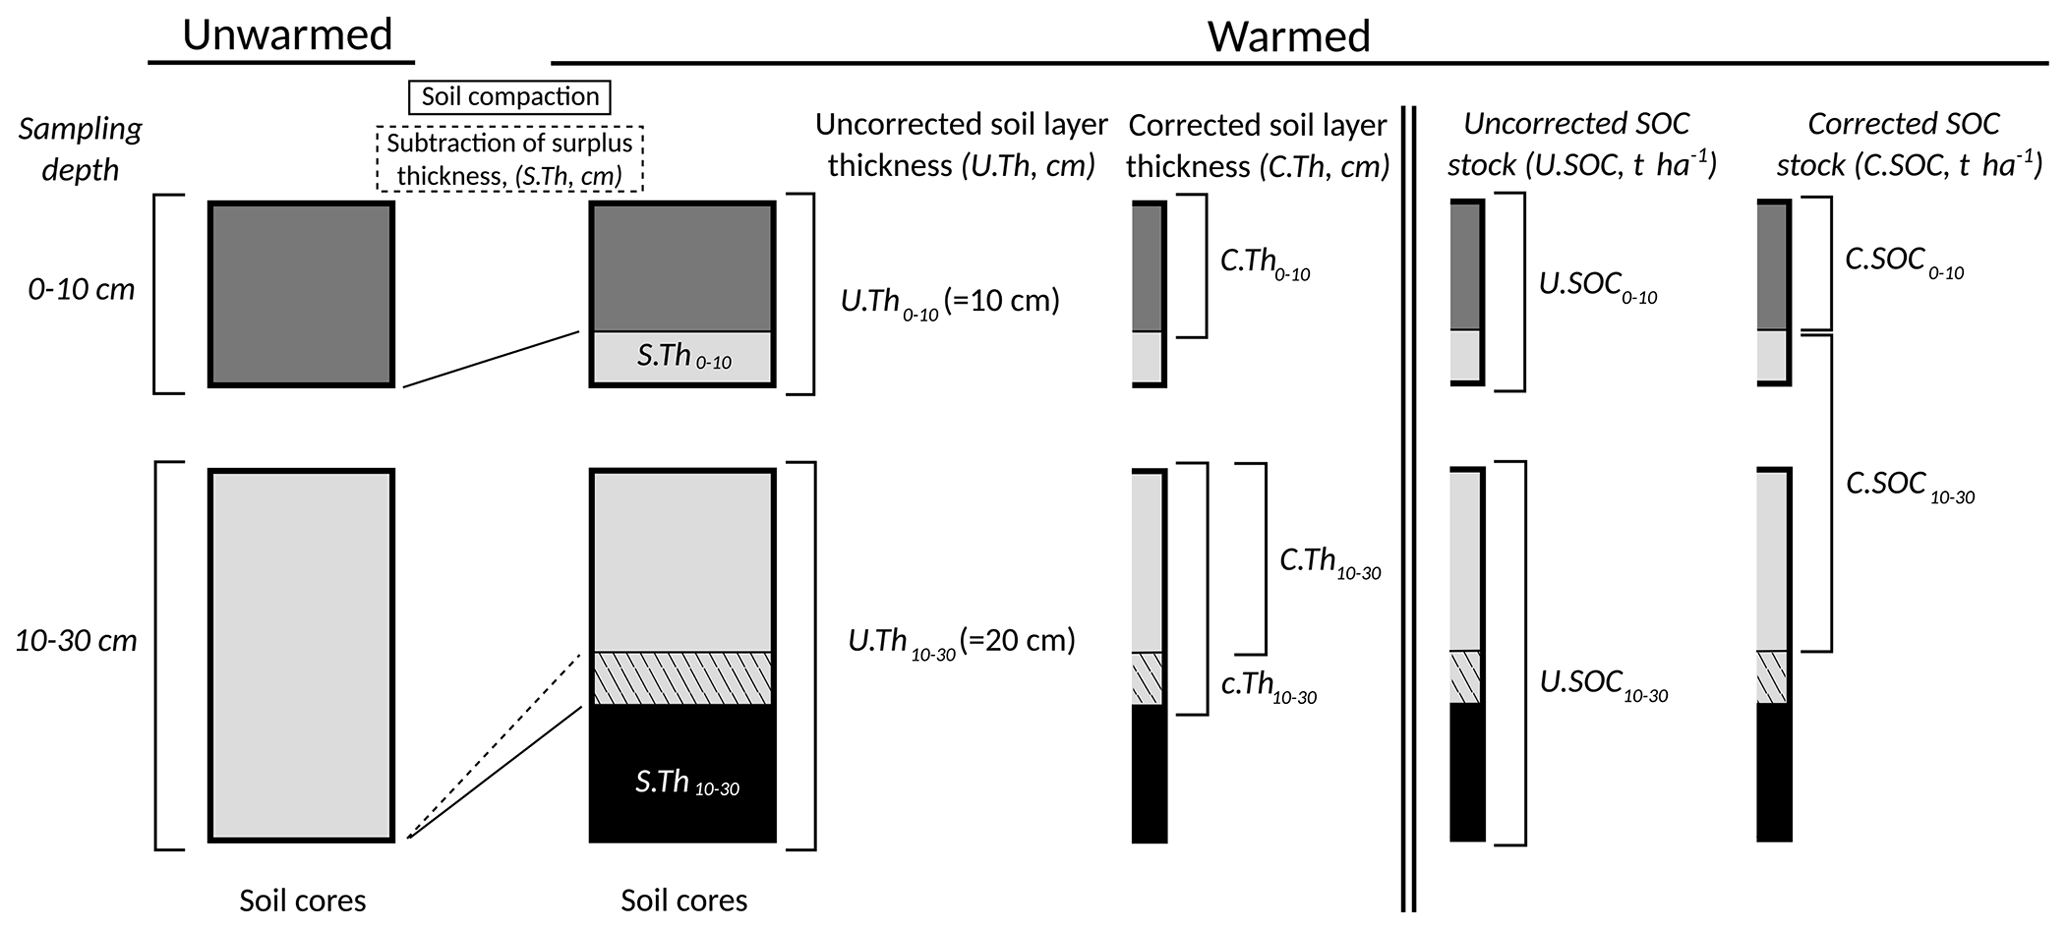
Figure B8Soil mass correction. Due to significant soil compaction (increasing bulk density (BD)) with increasing soil temperature in the upper soil layers (Fig. B7), a certain soil depth in unwarmed soil corresponds to ever shallower soil depths at warmer soil temperatures. Therefore, the SOC stocks were corrected for soil compaction; i.e. the corrected SOC stocks were calculated on the same mass of soil.
All data used in this paper have been made available on Zenodo, https://doi.org/10.5281/zenodo.4745479 (Verbrigghe et al., 2021).
BDS, NIWL, SV, JLS, LF, JTW, HW, PMVB, NV and IAJ designed the study. PG, HW, CF, NIWL, BDS, IAJ, SV, KVDV, EV, ZFL, SMJ, NV and MM provided the data. All authors contributed substantially to the analysis and the writing of the manuscript.
At least one of the (co-)authors is a member of the editorial board of Biogeosciences. The peer-review process was guided by an independent editor, and the authors also have no other competing interests to declare.
Publisher’s note: Copernicus Publications remains neutral with regard to jurisdictional claims in published maps and institutional affiliations.
This research was supported by a joint Fonds Wetenschappelijk Onderzoek Flanders (FWO) and Fonds zur Förderung der wissenschaftlichen Forschung (FWF) grant with nos. FWO-G0F2217N and FWF-I-3237, awarded to Ivan A. Janssens and Michael Bahn. This work contributes to the FSC-Sink, CAR-ES and the ClimMani COST Action (ES1308). Reykir, the Icelandic state gardening school of the Agricultural University of Iceland, Keldnaholt, and the Icelandic Forest Research, Mógilsá, provided logistical support for the present study. Further, we thank the Lorentz Center in Leiden. We thank Iris Janssens, Jochen Janssens, Inge Van De Putte, Maxime Sepelie, Jana Vynckier, Alexander Meire, Lieven Michielsen, Freja Dreesen, Sebastien Leys, Elín Gudmundsdóttir, Annemie Vinck, Paul Leblans, Kwinten Leblans, Sigvatur, Már Gudmundsson, Elías Óskarsson and Simon Arnar Pálsson for their help in the field. We thank Brita Berglund, Baldur Vigfusson, Nadine Calluy, Tom Van Der Spiet, Anne Cools, Marijke Van den Bruel, Els Oosterbos, Saad El-Rawi, Miguel Portillo Estrada and Wannes Kiebooms for their assistance with the lab analyses.
This research has been supported by the Fonds Wetenschappelijk Onderzoek (grant no. FWO-G0F2217N) and the Austrian Science Fund (grant no. FWF-I-3237), the European Research Council Synergy (IMBALANCE-P (grant no. 610028)), and the Research Council of the University of Antwerp (FORHOT TOP-BOF project).
This paper was edited by Sébastien Fontaine and Steven Bouillon, and reviewed by Gaël Alvarez, Emma Sayer, and one anonymous referee.
Abramoff, R. Z., Torn, M. S., Georgiou, K., Tang, J., and Riley, W. J.: Soil Organic Matter Temperature Sensitivity Cannot Be Directly Inferred from Spatial Gradients, Global Biogeochem. Cy., 33, 761–776, 2019. a
Allison, S. D., Wallenstein, M. D., and Bradford, M. A.: Soil-Carbon Response to Warming Dependent on Microbial Physiology, Nat. Geosci., 3, 336–340, https://doi.org/10.1038/ngeo846, 2010. a
Alvarez, G., Shahzad, T., Andanson, L., Bahn, M., Wallenstein, M. D., and Fontaine, S.: Catalytic Power of Enzymes Decreases with Temperature: New Insights for Understanding Soil C Cycling and Microbial Ecology under Warming, Glob. Change Biol., 24, 4238–4250, https://doi.org/10.1111/gcb.14281, 2018. a
Arnalds, O.: The Soils of Iceland, World Soils Book Series, Springer Netherlands, Dordrecht, https://doi.org/10.1007/978-94-017-9621-7, 2015. a, b
Bárcena, T. G., Gundersen, P., and Vesterdal, L.: Afforestation Effects on SOC in Former Cropland: Oak and Spruce Chronosequences Resampled after 13 Years, Glob. Change Biol., 20, 2938–2952, 2014. a
Batjes, N.: Harmonized Soil Property Values for Broad-Scale Modelling (WISE30sec) with Estimates of Global Soil Carbon Stocks, Geoderma, 269, 61–68, https://doi.org/10.1016/j.geoderma.2016.01.034, 2016. a, b
Bradford, M. A., McCulley, R. L., Crowther, T. W., Oldfield, E. E., Wood, S. A., and Fierer, N.: Cross-Biome Patterns in Soil Microbial Respiration Predictable from Evolutionary Theory on Thermal Adaptation, Nat. Ecol. Evol., 3, 223, https://doi.org/10.1038/s41559-018-0771-4, 2019. a
Crowther, T. W., Todd-Brown, K. E. O., Rowe, C. W., Wieder, W. R., Carey, J. C., Machmuller, M. B., Snoek, B. L., Fang, S., Zhou, G., Allison, S. D., Blair, J. M., Bridgham, S. D., Burton, A. J., Carrillo, Y., Reich, P. B., Clark, J. S., Classen, A. T., Dijkstra, F. A., Elberling, B., Emmett, B. A., Estiarte, M., Frey, S. D., Guo, J., Harte, J., Jiang, L., Johnson, B. R., Kröel-Dulay, G., Larsen, K. S., Laudon, H., Lavallee, J. M., Luo, Y., Lupascu, M., Ma, L. N., Marhan, S., Michelsen, A., Mohan, J., Niu, S., Pendall, E., Peñuelas, J., Pfeifer-Meister, L., Poll, C., Reinsch, S., Reynolds, L. L., Schmidt, I. K., Sistla, S., Sokol, N. W., Templer, P. H., Treseder, K. K., Welker, J. M., and Bradford, M. A.: Quantifying Global Soil Carbon Losses in Response to Warming, Nature, 540, 104–108, https://doi.org/10.1038/nature20150, 2016. a
Davidson, E. A. and Janssens, I. A.: Temperature Sensitivity of Soil Carbon Decomposition and Feedbacks to Climate Change, Nature, 440, 165–173, https://doi.org/10.1038/nature04514, 2006. a
De Boeck, H. J., Vicca, S., Roy, J., Nijs, I., Milcu, A., Kreyling, J., Jentsch, A., Chabbi, A., Campioli, M., Callaghan, T., Beierkuhnlein, C., and Beier, C.: Global Change Experiments: Challenges and Opportunities, BioScience, 65, 922–931, https://doi.org/10.1093/biosci/biv099, 2015. a
Edlinger, A.: Changes of belowground processes of the carbon and nitrogen cycle in response to soil warming. Will global warming increase the turnover of soil C and N above plant demands and lead to increased leaching losses, Master's thesis, M. Sc. thesis, Copenhagen University, Denmark & University of Natural Resources and Applied Sciences (BOKU), http://forhot.is/wp-content/uploads/2018/01/Edlinger-Anna-Theresa.-2016.-Changes-of-belowground-processes-of-the-carbon-and-nitrogen.xps (last access: 4 July 2022), 2016. a
Ellert, B. H. and Bettany, J. R.: Calculation of Organic Matter and Nutrients Stored in Soils under Contrasting Management Regimes, Can. J. Soil Sci., 75, 529–538, 1995. a
Eyring, V., Bony, S., Meehl, G. A., Senior, C. A., Stevens, B., Stouffer, R. J., and Taylor, K. E.: Overview of the Coupled Model Intercomparison Project Phase 6 (CMIP6) experimental design and organization, Geosci. Model Dev., 9, 1937–1958, https://doi.org/10.5194/gmd-9-1937-2016, 2016. a
Fontaine, S., Barot, S., Barré, P., Bdioui, N., Mary, B., and Rumpel, C.: Stability of organic carbon in deep soil layers controlled by fresh carbon supply, Nature, 450, 277–280, 2007. a
Halldórsson, B. and Sigbjörnsson, R.: The Mw 6.3 Ölfus Earthquake at 15:45 UTC on 29 May 2008 in South Iceland: ICEARRAY Strong-Motion Recordings, Soil Dynam. Earth. Eng., 29, 1073–1083, https://doi.org/10.1016/j.soildyn.2008.12.006, 2009. a
Hanson, P. J., Griffiths, N. A., Iversen, C. M., Norby, R. J., Sebestyen, S. D., Phillips, J R., Chanton, J. P., Kolka, R. K., Malhotra, A., Oleheiser, K. C., Warren, J. M., Shi, X, Yang, X., Mao, J., Ricciuto, D. M.: Rapid net carbon loss from a whole-ecosystem warmed Peatland, AGU Advances, 1, e2020AV000163, https://doi.org/10.1029/2020AV000163, 2020. a
Ilyina, T. and Friedlingstein, P.: WCRP Grand Challenge-Carbon Feedbacks in the Climate System, Tech. Rep., WCRP, https://www.wcrp-climate.org/images/grand_challenges/carbon/BGCGC_whitepaper.pdf (last access: 4 July 2022), 2016. a, b
IPCC: Climate Change 2013: The Physical Science Basis. Contribution of Working Group I to the Fifth Assessment Report of the Intergovernmental Panel on Climate Change, Cambridge University Press, Cambridge, United Kingdom and New York, NY, USA, ISBN 978-1-107-05799-9, 2013. a, b
Jenkinson, D. S., Adams, D. E., and Wild, A.: Model Estimates of CO2 Emissions from Soil in Response to Global Warming, Nature, 351, 304–306, 1991. a
Jia, J., Cao, Z., Liu, C., Zhang, Z., Lin, L., Wang, Y., Haghipour, N., Wacker, L., Bao, H., Dittmar, T., Simpson, M. J., Yang, H., Crowther, T. W., Eglinton, T. I., He, J.-S., and Feng, X.: Climate Warming Alters Subsoil but Not Topsoil Carbon Dynamics in Alpine Grassland, Glob. Change Biol., 25, 4383–4393, https://doi.org/10.1111/gcb.14823, 2019. a
Kuznetsova, A., Brockhoff, P. B., and Christensen, R. H.: lmerTest Package: Tests in Linear Mixed Effects Models, J. Stat. Softw., 82, 1–26, 2017. a
Leblans, N. I. W., Sigurdsson, B. D., Vicca, S., Fu, Y., Penuelas, J., and Janssens, I. A.: Phenological Responses of Icelandic Subarctic Grasslands to Short-Term and Long-Term Natural Soil Warming, Glob. Change Biol., 23, 4932–4945, https://doi.org/10.1111/gcb.13749, 2017. a, b
Lin, W., Li, Y., Yang, Z., Giardina, C. P., Xie, J., Chen, S., Lin, C., Kuzyakov, Y., and Yang, Y.: Warming Exerts Greater Impacts on Subsoil than Topsoil CO2 Efflux in a Subtropical Forest, Agr. Forest Meteorol., 263, 137–146, https://doi.org/10.1016/j.agrformet.2018.08.014, 2018. a
Magnússon, Á. and Vídalín, P.: Jarðabók, Annaðbindi [The farm register of Iceland], 1708. a
Marañón-Jiménez, S., Soong, J. L., Leblans, N. I. W., Sigurdsson, B. D., Peñuelas, J., Richter, A., Asensio, D., Fransen, E., and Janssens, I. A.: Geothermally Warmed Soils Reveal Persistent Increases in the Respiratory Costs of Soil Microbes Contributing to Substantial C Losses, Biogeochemistry, 138, 245–260, https://doi.org/10.1007/s10533-018-0443-0, 2018. a
Melillo, J. M., Frey, S. D., DeAngelis, K. M., Werner, W. J., Bernard, M. J., Bowles, F. P., Pold, G., Knorr, M. A., and Grandy, A. S.: Long-Term Pattern and Magnitude of Soil Carbon Feedback to the Climate System in a Warming World, Science, 358, 101–105, https://doi.org/10.1126/science.aan2874, 2017. a, b
Nishina, K., Ito, A., Beerling, D. J., Cadule, P., Ciais, P., Clark, D. B., Falloon, P., Friend, A. D., Kahana, R., Kato, E., Keribin, R., Lucht, W., Lomas, M., Rademacher, T. T., Pavlick, R., Schaphoff, S., Vuichard, N., Warszawaski, L., and Yokohata, T.: Quantifying uncertainties in soil carbon responses to changes in global mean temperature and precipitation, Earth Syst. Dynam., 5, 197–209, https://doi.org/10.5194/esd-5-197-2014, 2014. a
O'Gorman, E. J., Benstead, J. P., Cross, W. F., Friberg, N., Hood, J. M., Johnson, P. W., Sigurdsson, B. D., and Woodward, G.: Climate Change and Geothermal Ecosystems: Natural Laboratories, Sentinel Systems, and Future Refugia, Glob. Change Biol., 20, 3291–3299, https://doi.org/10.1111/gcb.12602, 2014. a, b
Osher, L. J., Matson, P. A., and Amundson, R.: Effect of Land Use Change on Soil Carbon in Hawaii, Biogeochemistry, 65, 20, https://doi.org/10.1023/A:1026048612540, 2003. a
Poeplau, C., Sigurðsson, P., and Sigurdsson, B. D.: Depletion of soil carbon and aggregation after strong warming of a subarctic Andosol under forest and grassland cover, SOIL, 6, 115–129, https://doi.org/10.5194/soil-6-115-2020, 2020. a
R Development Core Team, R.: R: A Language and Environment for Statistical Computing, R foundation for statistical computing Vienna, Austria, 2011. a
Radujković, D., Verbruggen, E., Sigurdsson, B. D., Leblans, N. I., Janssens, I. A., Vicca, S., and Weedon, J. T.: Prolonged Exposure Does Not Increase Soil Microbial Community Compositional Response to Warming along Geothermal Gradients, FEMS Microb. Ecol., 94, fix174, https://doi.org/10.1093/femsec/fix174, 2018. a
Rumpel, C. and Kögel-Knabner, I.: Deep soil organic matter – a key but poorly understood component of terrestrial C cycle, Plant Soil, 338, 143–158, 2011. a
Scharlemann, J. P., Tanner, E. V., Hiederer, R., and Kapos, V.: Global Soil Carbon: Understanding and Managing the Largest Terrestrial Carbon Pool, Carbon Manage., 5, 81–91, https://doi.org/10.4155/cmt.13.77, 2014. a
Shi, Z., Crowell, S., Luo, Y., and Moore, B.: Model Structures Amplify Uncertainty in Predicted Soil Carbon Responses to Climate Change, Nat. Commun., 9, 1–11, 2018. a
Shi, Z., Allison, S. D., He, Y., Levine, P. A., Hoyt, A. M., Beem-Miller, J., Zhu, Q., Wieder, W. R., Trumbore, S., and Randerson, J. T.: The Age Distribution of Global Soil Carbon Inferred from Radiocarbon Measurements, Nat. Geosci., 4, 1–5, 2020. a, b
Sigurdsson, B. D., Leblans, N., Dauwe, S., Guðmundsdóttir, E., Gundersen, P., Gunnarsdóttir, G. E., Holmstrup, M., Ilieva-Makulec, K., Kätterer, T., Marteinsdóttir, B., Maljanen, M., Oddsdóttir, E. S., Ostonen, I., Peñuelas, J., Poeplau, C., Richter, A., Sigurðsson, P., van Bodegom, P., Wallander, H., Weedon J., and Janssens, I: Geothermal Ecosystems as Natural Climate Change Experiments: The ForHot Research Site in Iceland as a Case Study, Icel. Agr. Sci., 29, 53–71, https://doi.org/10.16886/IAS.2016.05, 2016. a, b, c, d, e, f, g, h, i, j
Soil Survey Staff: Soil Taxonomy: A Basic System of Soil Classification for Making and Interpreting Soil Surveys, Natural Resources Conservation Service, U.S. Department of Agriculture, 2 Edn., ISBN 9780160608292, 1999. a
Soong, J. L., Castanha, C., Hicks Pries, C. E., Ofiti, Porras, R. C., and Riley: Five Years of Whole-Soil Warming Led to Loss of Subsoil Carbon Stocks and Increased CO2 Efflux, Sci. Adv., 0, https://doi.org/10.1126/sciadv.abd1343, 2020a. a, b
Soong, J. L., Phillips, C. L., Ledna, C., Koven, C. D., and Torn, M. S.: CMIP5 models predict rapid and deep soil warming over the 21st century, J. Geophys. Res.-Biogeo., 125, https://doi.org/10.1029/2019JG005266, e2019JG005266, 2020b. a
Tian, Q., Yang, X., Wang, X., Liao, C., Li, Q., Wang, M., Wu, Y., and Liu, F.: Microbial Community Mediated Response of Organic Carbon Mineralization to Labile Carbon and Nitrogen Addition in Topsoil and Subsoil, Biogeochemistry, 128, 125–139, https://doi.org/10.1007/s10533-016-0198-4, 2016. a
Todd-Brown, K., Zheng, B., and Crowther, T. W.: Field-warmed soil carbon changes imply high 21st-century modeling uncertainty, Biogeosciences, 15, 3659–3671, https://doi.org/10.5194/bg-15-3659-2018, 2018. a
van Gestel, N., Shi, Z., van Groenigen, K. J., Osenberg, C. W., Andresen, L. C., Dukes, J. S., Hovenden, M. J., Luo, Y., Michelsen, A., Pendall, E., Reich, P. B., Schuur, E. A. G., and Hungate, B. A.: Predicting Soil Carbon Loss with Warming, Nature, 554, 4–5, https://doi.org/10.1038/nature25745, 2018. a
Verbrigghe, N., Leblans, N. I. W., Sigurdsson, B. D., et al.: Soil carbon loss in warmed subarctic grasslands is rapid and restricted to topsoil, Zenodo [data set], https://doi.org/10.5281/zenodo.4745479, 2021. a
Walker, T. W. N., Kaiser, C., Strasser, F., Herbold, C. W., Leblans, N. I. W., Woebken, D., Janssens, I. A., Sigurdsson, B. D., and Richter, A.: Microbial Temperature Sensitivity and Biomass Change Explain Soil Carbon Loss with Warming, Nat. Clim. Change, 8, 885–889, https://doi.org/10.1038/s41558-018-0259-x, 2018. a, b, c, d
Walker, T. W. N., Janssens, I. A., Weedon, J. T., Sigurdsson, B. D., Richter, A., Peñuelas, J., Leblans, N. I. W., Bahn, M., Bartrons, M., De Jonge, C., Fuchslueger, L., Gargallo-Garriga, A., Gunnarsdóttir, G. E., Marañón-Jiménez, S., Oddsdóttir, E. S., Ostonen, I., Poeplau, C., Prommer, J., Radujković, D., Sardans, J., Sigurðsson, P., Soong, J. L., Vicca, S., Wallander, H., Ilieva-Makulec, K., and Verbruggen, E.: A Systemic Overreaction to Years versus Decades of Warming in a Subarctic Grassland Ecosystem, Nat. Ecol. Evol., 4, 101–108, https://doi.org/10.1038/s41559-019-1055-3, 2020. a, b
WRB, IUSS Working Group: World Reference Base for Soil Resources 2014, Update 2015: International Soil Classification System for Naming Soils and Creating Legends for Soil Maps, ISBN 978-92-5-108369-7, 2015. a
Yost, J. L. and Hartemink, A. E.: How deep is the soil studied–an analysis of four soil science journals, Plant Soil, 452, 5–18, 2020. a
Zhang, J., Ekblad, A., Sigurdsson, B. D., and Wallander, H.: The Influence of Soil Warming on Organic Carbon Sequestration of Arbuscular Mycorrhizal Fungi in a Sub-Arctic Grassland, Soil Biol. Biochem., 147, 107826, https://doi.org/10.1016/j.soilbio.2020.107826, 2020. a, b
- Abstract
- Introduction
- Large, linear and fast topsoil SOC stock reduction
- Apparent stable subsoil SOC stocks
- Implications for carbon–climate feedbacks
- Appendix A: Material and methods
- Appendix B: Supplementary
- Data availability
- Author contributions
- Competing interests
- Disclaimer
- Acknowledgements
- Financial support
- Review statement
- References