the Creative Commons Attribution 4.0 License.
the Creative Commons Attribution 4.0 License.
 | 01 Aug 2022
Ocean alkalinity enhancement – avoiding runaway CaCO3 precipitation during quick and hydrated lime dissolution
Charly A. Moras
Lennart T. Bach
Tyler Cyronak
Renaud Joannes-Boyau
Kai G. Schulz
Ocean alkalinity enhancement (OAE) is a method that can remove carbon dioxide (CO2) from the atmosphere and counteract ocean acidification through the dissolution of alkaline minerals. Currently, critical knowledge gaps exist regarding the dissolution of different minerals suitable for OAE in natural seawater. Of particular importance is to understand how much alkaline mineral can be dissolved before secondary precipitation of calcium carbonate (CaCO3) occurs, since secondary CaCO3 precipitation reduces the atmospheric CO2 uptake potential of OAE. Using two types of mineral proposed for OAE, quick lime (CaO) and hydrated lime (Ca(OH)2), we show that both (<63 µm of diameter) dissolved in seawater within a few hours. No CaCO3 precipitation occurred at a saturation state (ΩA) of ∼5, but CaCO3 precipitation in the form of aragonite occurred above an ΩA value of 7. This limit is lower than expected for typical pseudo-homogeneous precipitation, i.e. in the presence of colloids and organic matter. Secondary precipitation at low ΩA (∼ 7) was the result of heterogeneous precipitation onto mineral surfaces, most likely onto the added CaO and Ca(OH)2 particles. Most importantly, runaway CaCO3 precipitation was observed, a condition where significantly more total alkalinity (TA) was removed than initially added. Such runaway precipitation could reduce the OAE CO2 uptake efficiency from ∼ 0.8 mol of CO2 per mole of added TA down to 0.1 mol of CO2 per mole of TA. Runaway precipitation appears to be avoidable by dilution below the critical ΩA threshold of 5, ideally within hours of the mineral additions to minimise initial CaCO3 precipitation. Finally, OAE simulations suggest that for the same ΩA threshold, the amount of TA that can be added to seawater would be more than 3 times higher at 5 ∘C than at 30 ∘C. The maximum TA addition could also be increased by equilibrating the seawater to atmospheric CO2 levels (i.e. to a pCO2 of ∼ 416 µatm) during addition. This would allow for more TA to be added in seawater without inducing CaCO3 precipitation, using OAE at its CO2 removal potential.
- Article
(4563 KB) - Full-text XML
- BibTeX
- EndNote


Modern climate change is considered one of the greatest threats to humankind (Hoegh-Guldberg et al., 2019; IPCC, 2021; The Royal Society and Royal Academy of Engineering, 2018). Global mean temperature has increased by 1.0 ∘C since pre-industrial times and could reach +1.2–1.9 ∘C in the next 20 years and +2.1–5.7 ∘C by the end of this century (IPCC, 2021). Furthermore, about 26 % of all anthropogenic carbon dioxide (CO2) emissions were taken up by the ocean through air–sea gas exchange between 1750 and 2020 (Friedlingstein et al., 2022). This has led to a decrease in the average open-ocean pH by 0.1 units in a process termed ocean acidification – OA (Bates et al., 2012; Canadell et al., 2007; Carter et al., 2019; Cyronak et al., 2014; Doney et al., 2009; Hoegh-Guldberg et al., 2007).
The aim of the 2015 Paris Agreement is to minimise the negative impacts of global warming and OA by limiting global warming to less than +2.0 ∘C, ideally below +1.5 ∘C, by the end of this century (Goodwin et al., 2018). However, the current and pledged reductions will likely not be enough, and additional CO2 mitigation strategies are needed, such as ocean alkalinity enhancement – OAE (Gattuso et al., 2015; GESAMP, 2019; Lenton and Vaughan, 2009; The Royal Society and Royal Academy of Engineering, 2018). OAE could be an efficient approach for CO2 removal (current emissions of 40 Gt yr−1), with models suggesting a potential of 165 to 790 Gt (1 Gt = 1015 g) of atmospheric CO2 removed by the year 2100 on a global scale if OAE were implemented today (Burt et al., 2021; Feng et al., 2017; IPCC, 2021; Keller et al., 2014; Köhler et al., 2013; Lenton et al., 2018). However, empirical data on OAE efficacies are limited, and safe thresholds for mineral dissolution are particularly lacking (National Academies of Sciences and Medicine, 2022).
OAE typically relies on the dissolution of alkaline minerals in seawater, releasing alkalinity similarly to natural rock-weathering processes (Kheshgi, 1995). Suitable candidates are magnesium-rich minerals such as brucite, periclase or forsterite and calcium-rich minerals such as quick and hydrated lime (Renforth and Henderson, 2017). Quick lime and hydrated lime are of particular interest due to their high solubility in seawater and rapid dissolution. Quick lime, i.e. calcium oxide (CaO), is obtained by the calcination of limestone, composed primarily of calcium carbonate (CaCO3), which is present in large quantities within the earth's crust. Once heated to temperatures of ∼ 1200 ∘C, each molecule of CaCO3 breaks down into one molecule of CaO and one molecule of CO2 (Ilyina et al., 2013; Kheshgi, 1995). Hence, for maximum OAE potential, carbon capture during calcination and subsequent storage would be necessary (Bach et al., 2019; Ilyina et al., 2013; Kheshgi, 1995; Renforth et al., 2013; Renforth and Kruger, 2013). CaO can be hydrated into calcium hydroxide (Ca(OH)2), also known as hydrated lime. The addition of either CaO or Ca(OH)2 to seawater leads to the dissociation of Ca(OH)2 into one calcium Ca2+ and two hydroxyl ions OH− (Feng et al., 2017; Harvey, 2008). Ignoring the non-linearities of the seawater carbonate system (i.e. changes in total alkalinity, TA, and dissolved inorganic carbon, DIC, are not 1:1), the chemical reaction of CO2 and Ca(OH)2 dissolution and the subsequent uptake of atmospheric CO2 can be written as
The dissolution of CaO and Ca(OH)2 and the subsequent addition of TA increase the pH of seawater, which changes the carbonate chemistry speciation (Zeebe and Wolf-Gladrow, 2001). DIC can be approximated as the sum of HCO and CO (ignoring the small contribution by CO2). Similarly, TA can be approximated as the sum of HCO and 2 CO (ignoring the smaller contributions by boric and silicic acids and other minor components). Combining both DIC and TA equations reveals that CO concentrations can be expressed as [CO] = TA − DIC. Hence, increasing TA at a constant DIC, e.g. by dissolving CaO or Ca(OH)2, increases [CO], shifting the carbonate chemistry speciation towards a higher pH (Fig. A1) (Dickson et al., 2007; Wolf-Gladrow et al., 2007; Zeebe and Wolf-Gladrow, 2001). The subsequent shift in DIC speciation leads to a decrease in dissolved CO2 concentrations, reducing the partial pressure of CO2 (pCO2) in seawater and increasing its atmospheric CO2 uptake potential.
Depending on the amount of TA added and the initial seawater pCO2, the TA-enriched seawater would either take up CO2 from the atmosphere or reduce outgassing of CO2. Factoring in the non-linearities of the carbonate system, about 1.6 mol of atmospheric CO2 could be taken up per mole of dissolved CaO or Ca(OH)2 (Köhler et al., 2010). Furthermore, dissolving CaO and Ca(OH)2 can also counteract ocean acidification. During the dissolution of alkaline minerals, both pH and the CaCO3 saturation state of seawater (Ω) increase through increasing Ca2+ and CO concentrations. This makes OAE a dual solution for removing atmospheric CO2 and mitigating OA (Feng et al., 2017; GESAMP, 2019; Harvey, 2008). However, there are important knowledge gaps in our understanding surrounding basic mineral dissolution in seawater (Feng et al., 2016; González and Ilyina, 2016; Mongin et al., 2021; Renforth and Henderson, 2017).
One knowledge gap is the critical Ω threshold beyond which CaCO3 starts to precipitate inorganically. Such secondary precipitation constitutes the opposite of alkaline mineral dissolution and would decrease pH and Ω while simultaneously increasing the CO2 concentration in seawater. This would decrease the ocean uptake's capacity for atmospheric CO2, causing the opposite of the intended effect. Additionally, if all added alkalinity were precipitated, only 1 mol of atmospheric CO2 per mole of Ca2+ would be removed, instead of ∼ 1.6 mol in the absence of CaCO3 precipitation. If even more CaCO3 precipitated, the efficiency of OAE would be further reduced. Under typical seawater conditions, CaCO3 precipitation does not occur due to the absence of mineral-phase precipitation nuclei and the presence of precipitation inhibitors such as dissolved organic compounds, magnesium (Mg) or phosphate (Chave and Suess, 1970; De Choudens-Sanchez and Gonzalez, 2009; Pytkowicz, 1965; Rushdi et al., 1992; Simkiss, 1964). There are three types of CaCO3 precipitation, (1) homogeneous (in the absence of any precipitation nuclei), (2) heterogeneous (in the presence of mineral phases) and (3) pseudo-homogeneous (in the presence of colloids and organic materials) (Marion et al., 2009; Morse and He, 1993). For pseudo-homogeneous precipitation, the critical threshold at which calcite precipitates spontaneously is at a calcite saturation state (ΩC) of ∼ 18.8 (at a salinity of 35 and at a temperature of 21 ∘C) (Marion et al., 2009). Assuming typical open-ocean carbonate chemistry (e.g. TA ∼ 2350 µmol kg−1 and DIC ∼ 2100 µmol kg−1), this threshold would be reached through an increase in TA of ∼ 810 µmol kg−1. This corresponds to a critical threshold for Ω with respect to aragonite, i.e. ΩA, of ∼ 12.3. The two other types of precipitation (i.e. homogeneous and heterogeneous) are more poorly constrained (Marion et al., 2009). Importantly, at current dissolved Mg and Ca concentrations in seawater, the CaCO3 polymorph that is favoured during inorganic precipitation is aragonite rather than calcite (Morse et al., 1997; Pan et al., 2021). Therefore, aragonite saturation state ΩA may be a more important determinant of critical runaway precipitation thresholds. No matter what mineral phase is precipitating, a better understanding of CaCO3 precipitation under conditions relevant to OAE is needed.
To gain a better understanding of the consequences of CaO and Ca(OH)2 dissolution for OAE, we conducted several dissolution experiments with CaO and Ca(OH)2 to determine (1) how much alkaline material can be dissolved without inducing CaCO3 precipitation, (2) what causes secondary CaCO3 precipitation and (3) how secondary precipitation can be avoided.
2.1 Experimental setup
Two different calcium minerals were used, CaO powder from Ajax Finechem (CAS no. 1305-78-8) and industrial Ca(OH)2 powder (hydrated lime 20 kg, Dingo). The elemental compositions of these powders were analysed using an Agilent 7700 inductively coupled plasma mass spectrometer (ICP-MS), coupled to a laser ablation unit (NWR213, Electro Scientific Industries, Inc). Samples were embedded in resin and instrument readings calibrated against standard reference materials, batch nos. 610 and 612, from the National Institute of Standards and Technology.
All dissolution experiments were conducted in natural seawater. The seawater was collected between September 2020 and June 2021, about 200 to 300 m from the shore, avoiding suspended sand or silt, at Broken Head, New South Wales, Australia (28∘ S, 153∘ E). Seawater was stored for up to 14 d at 4 ∘C in the dark to slow bacterial metabolic activity and allow for all suspended particles to settle on the bottom before being sterile-filtered using a peristaltic pump, connected to a 0.2 µm Whatman Polycap 75 AS filter. For salinity measurements, about 200 mL of seawater was placed in a gas-tight polycarbonate container and allowed to equilibrate to room temperature overnight. The sample's conductivity and temperature were then measured with a Metrohm cell (6.017.080), connected to a 914 pH/Conductometer. The conductivity was recorded in millisiemens per centimetre (mS cm−1) and the temperature in degrees Celsius (∘C). Salinity was calculated according to Lewis and Perkin (1981) on the 1978 practical salinity scale. The salinity in each experiment is reported in Table A1.
2.2 OAE experiments
For each experiment, seawater was accurately weighed (in grams to 2 decimal places) into high-quality 2 L borosilicate 3.3 Schott DURAN beakers, and the temperature was controlled via a Tank chiller line TK-1000 set at 21 ∘C, feeding a re-circulation water jacket (Fig. A2). A magnetic stir bar was placed in the beaker, and the natural seawater was constantly stirred at ∼ 200 rpm. To minimise gas exchange, a floating lid with various sampling ports was placed on top. Finally, after 1 h of equilibration, calculated quantities of weighed-in calcium alkaline compounds were added. Upon addition, samples for DIC and TA were taken at increasing time intervals to fully capture the dissolution kinetics and check for potential secondary precipitation. Furthermore, the pH was monitored at a frequency of 1 Hz for the first hour before alkalinity addition and over 4 h after addition to determine when alkalinity was fully released. Once the pH plateaued (corresponding to maximum TA release), the content of the beaker was carefully transferred to a clean Schott bottle to ensure that evaporation would not alter the DIC or TA concentrations. Bottles were kept in the dark for the duration of each experiment, i.e. up to 48 d, with the same constant stirring of ∼ 200 rpm at 21 ∘C. Each bottle was exposed to UV light for at least 30 min after each sampling to inhibit bacterial growth.
2.2.1 CaO and Ca(OH)2 dissolution
Following the beaker setup as described in Sect. 2.2, TA was added by sieving CaO and Ca(OH)2 through a 63 µm mesh to avoid the formation of larger CaO or Ca(OH)2 aggregates. The mesh was placed in a clean 50 mL upside-down Falcon tube cap to minimise the loss of material smaller than 63 µm, and the overall weight was recorded in milligrams. Then, the mesh was placed above the Schott bottle, and the mineral was added by gently tapping the side of the sieve. Finally, the sieve was placed in the same upside-down Falcon tube cap and weighed once again, thereby making sure that the desired amount had been added to the beaker. The weighing steps were carefully performed to avoid material loss between the bottle and the balance and were achieved in less than 5 min. Two alkalinity additions, +250 and +500 µmol kg−1 with each calcium mineral powder, were performed (Table 1).
Table 1Summary of experimental conditions. Please note that for comparability, more TA was added in the liquid than the sieved approaches to match the theoretical increases in calcium carbonate saturation state (see “Materials and methods” section for details).
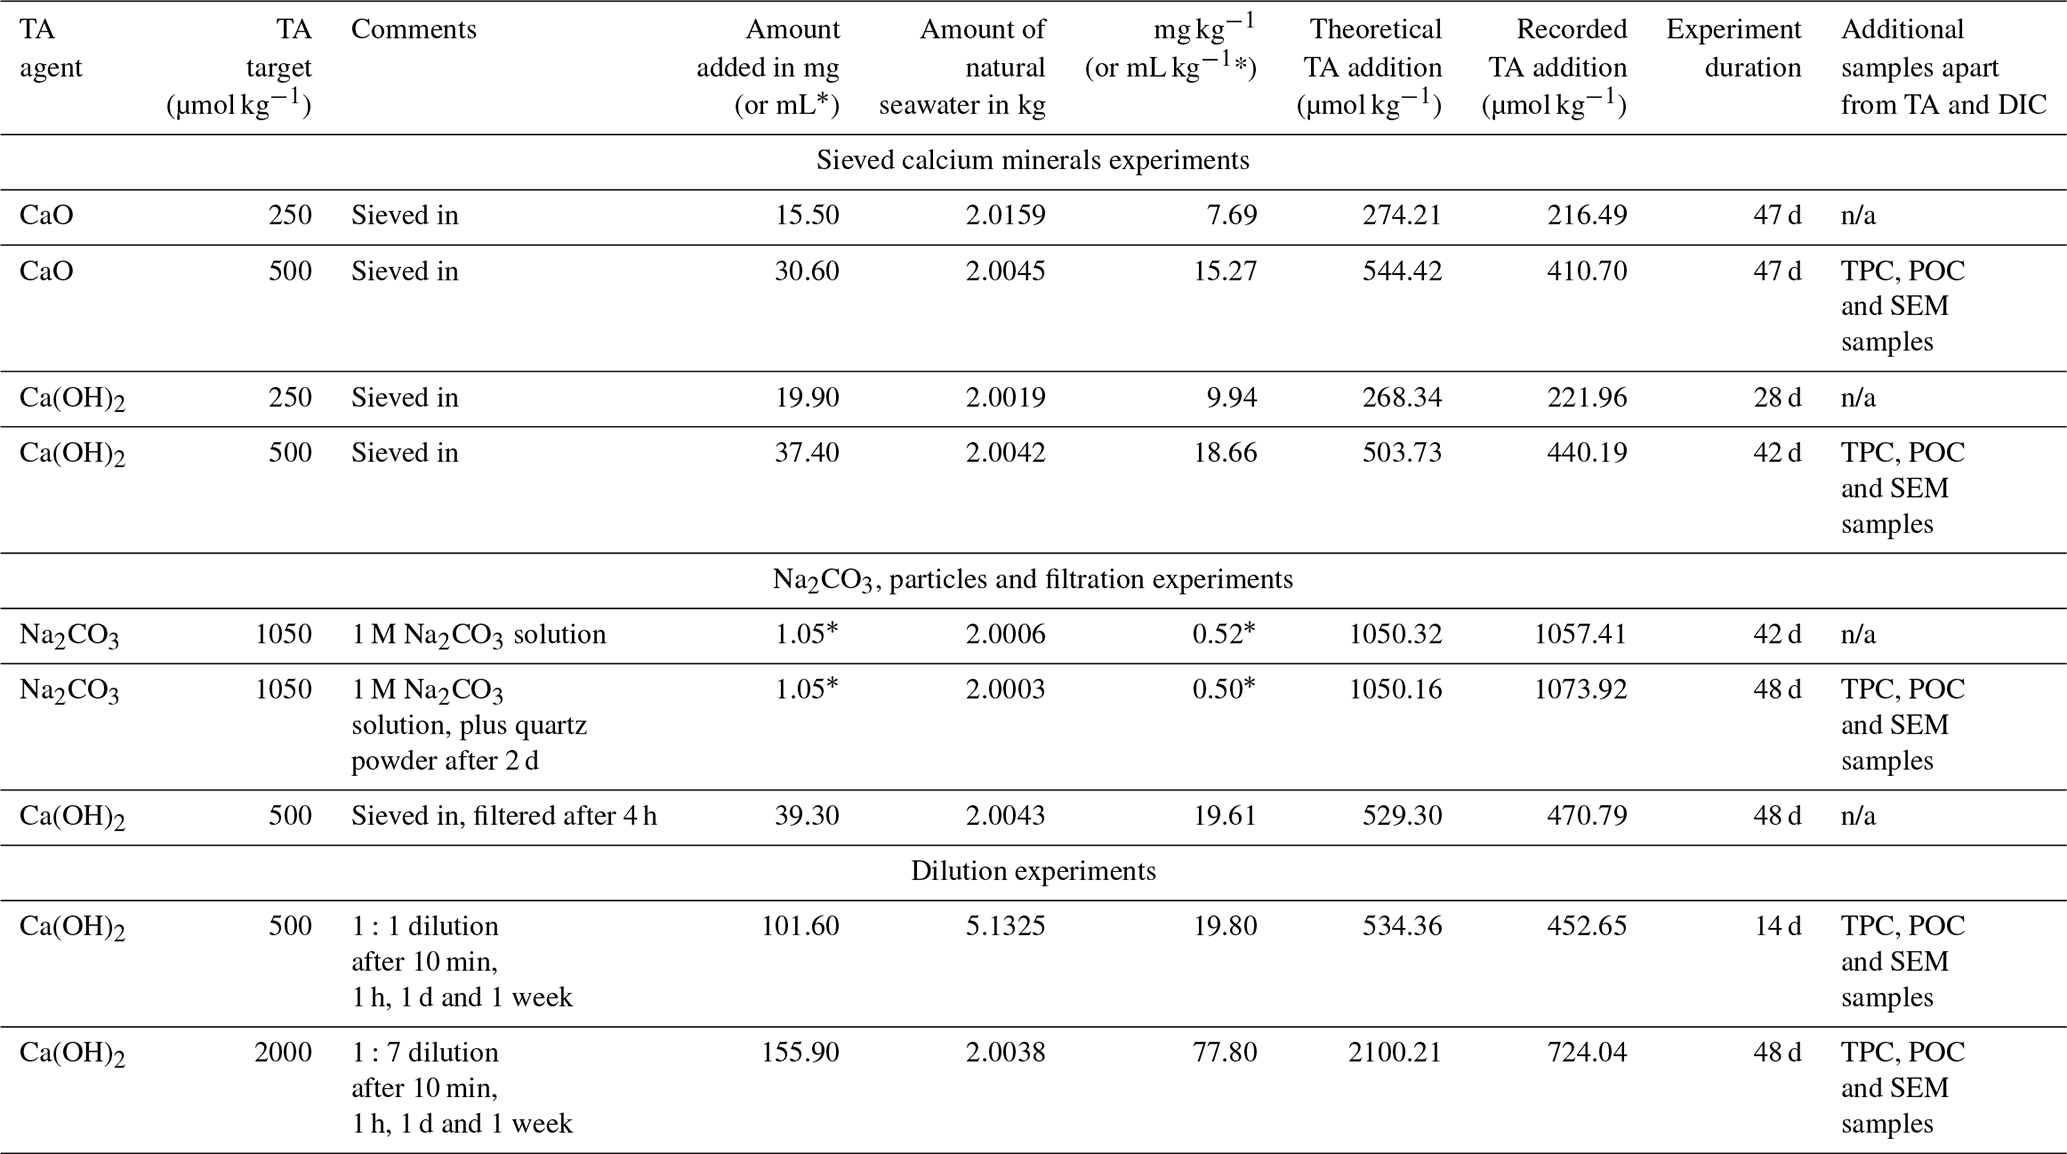
n/a: not applicable.
2.2.2 Na2CO3 alkalinity, particles additions and filtration
Three further experiments assessed the role of mineral phases during secondary CaCO3 precipitation observed in the previous experiments. The first experiment used a 1 M solution of sodium carbonate (Na2CO3, CAS number 497-19-8), freshly prepared on the day to limit CO2 ingassing. Ultrapure Na2CO3 was accurately weighed (in mg with 2 decimal places) into a clean 100 mL Schott bottle and made up to 100 g with Milli-Q (18.2 MΩ). The solution was then sonicated for 15 min, with gentle mixing every 5 min. The amount of Na2CO3 to be added to seawater was calculated so that a similar maximum ΩA would be reached, i.e. ∼ 7.7, as in the previous experiments with the highest addition of CaO and Ca(OH)2. This required about twice the alkalinity increase as before (Table 1) because Na2CO3 additions concomitantly increase DIC when dissociating in two sodium ions and one CO ion, making the ΩA increase smaller. All carbonate chemistry calculations were performed in CO2SYS (see below).
In another experiment similar to the Na2CO3 addition, quartz powder was added after 2 d. Quartz powder was chosen as it does not dissolve on the timescales relevant for this study (Montserrat et al., 2017). The addition of quartz powder was similar to the sieved CaO and Ca(OH)2 additions, i.e. through a 63 µm mesh. The mass of quartz particles added (in mg with 2 decimal places) was determined to provide the same mineral surface area as for the Ca(OH)2 experiments with a TA increase of 500 µmol kg−1. It was calculated using densities and masses of Ca(OH)2 and quartz, assuming spherical particles with a diameter of 63 µm.
The third experiment followed the same experimental setup as described in Sect. 2.2.1. Here, Ca(OH)2 was added to first increase TA by ∼ 500 µmol kg−1 (Table 1). After 4 h of reaction, the entire content of the 2 L Schott beaker was filtered through a Nylon Captiva EconoFilter (25 mm) with a pore size of 0.45 µm into a clean 1 L Schott bottle using a peristaltic pump. The bottle was filled from bottom to top, with overflow to minimise gas exchange.
2.2.3 Dilution experiments
In a last set of experiments, alkalinity-enriched seawater was diluted with natural seawater to test if secondary precipitation could be avoided or stopped. Ca(OH)2 powder was added to reach final alkalinity enrichments of 500 and 2000 µmol kg−1, and dilutions were carried out at several time intervals.
For the experiment with a targeted TA increase of 500 µmol kg−1, a larger quantity of TA-enriched seawater was required to perform all dilutions and sampling in comparison to the previous experiments. Therefore, two 5 L Schott bottles were filled with 5 kg of natural seawater and placed on a magnetic stirring platform. Calculated weighed-in masses of Ca(OH)2 were added to the first bottle, as described in Sect. 2.2.1, using the 63 µm sieve, while the natural seawater in the second bottle was kept for subsequent dilutions. Both bottles were kept on the same bench under the same conditions, stirring at a rate of ∼ 200 rpm, for the duration of the experiment.
Following the Ca(OH)2 addition, 1:1 dilutions (500 g TA-enriched seawater : 500 g natural seawater) were performed in clean 1 L Schott bottles that were kept in the dark and placed on a magnetic platform at a stirring rate of ∼ 200 rpm. After each sampling time, the bottles were exposed to UV light for at least 30 min. The second dilution experiment was set up like the first one, the only difference being that the targeted TA increase was 2000 µmol kg−1. The dilution ratio was 1:7 to reduce the targeted TA increase again to 250 µmol kg−1. All dilutions were performed 10 min, 1 h, 1 d and 1 week after Ca(OH)2 addition, leading to two TA-enriched and eight diluted treatments.
2.3 Carbonate chemistry measurements
Samples for TA and DIC measurements were filtered through a Nylon Captiva EconoFilter (0.45 µm) using a peristaltic pump into 100 mL borosilicate 3.3 Schott DURAN glass stopper bottles. The bottles were gently filled from the bottom to top, using a 14-gauge needle as described in Schulz et al. (2017), with at least half of their volume allowed to overflow, corresponding to ∼ 150 mL of seawater sampled per time point. After filling, 50 µL of saturated mercuric chloride solution was added to each sample before being stored without headspace in the dark at 4 ∘C.
TA was analysed in duplicate via potentiometric titrations by a Metrohm 848 Titrino plus coupled to an 869 Compact Sample Changer using 0.05 M HCl, with the ionic strength adjusted to 0.72 mol kg−1 using NaCl, corresponding to a salinity of 35. Titrations and calculations followed the open-cell titration protocols by Dickson et al. (2007). DIC was measured in triplicate using an Automated Infra-Red Inorganic Carbon Analyzer (AIRICA, Marianda) coupled to a LI-COR LI-7000 infra-red detector as described in Gafar and Schulz (2018). Measured values of TA and DIC were corrected using an internal standard prepared as described in Dickson (2010), calibrated against certified reference materials, batch nos. 175 and 190.
The overall instrument uncertainty for TA and DIC was calculated as follows. For each measurement, a standard deviation was calculated, from duplicates of TA and triplicates of DIC. The samples and reference material standard deviations were averaged, and an error propagation on these values were used to estimate average measurement uncertainty, i.e. ± 1.0 µmol kg−1 and DIC at ± 0.8 µmol kg−1, for TA and DIC, respectively.
2.4 Particulate inorganic carbon and scanning electron microscopy (SEM)
In cases where TA and DIC decreases were observed, indicative of CaCO3 precipitation, samples were taken at the end of the experiments for total particulate carbon (TPC), particulate organic carbon (POC) and scanning electron microscopy (SEM) analyses. TPC and POC samples were collected in duplicates on pre-combusted (450 ∘C) GF/F filters and stored frozen until analysis. Before analysis, POC filters were fumed with HCl for 2 h before drying overnight at 60 ∘C while TPC filters were dried untreated (Gafar and Schulz, 2018). The filters were wrapped in tin capsules and pressed into small 5 mm diameter balls. TPC and POC were quantified on a Thermo Fisher Flash Elemental Analyzer, coupled to a Delta V Plus isotope ratio mass spectrometer. Particulate inorganic carbon (PIC), or CaCO3, was calculated based on the difference between TPC and POC. The results are reported in µmol kg−1 of seawater with an uncertainty estimate by an error propagation of the square root of the sum of the squared standard deviations for TPC and POC.
For SEM analysis, 10 to 15 mL of the sample water was collected on polycarbonate Whatman Cyclopore filters with a 0.2 µm pore size and rinsed with 50 mL of Milli-Q. The filters were dried at 60 ∘C overnight and kept in a desiccator until analysis on a tabletop Hitachi TM4000 Plus scanning electron microscope. The microscope was coupled to an energy-dispersive X-ray (EDX) analyser, allowing us to identify the CaCO3 polymorph and elemental composition of precipitates. Finally, CaO and Ca(OH)2 powders were analysed for their carbon content. This analysis aimed to identify the presence and estimate the amount of particulate carbon, most likely CaCO3, in the respective mineral powders.
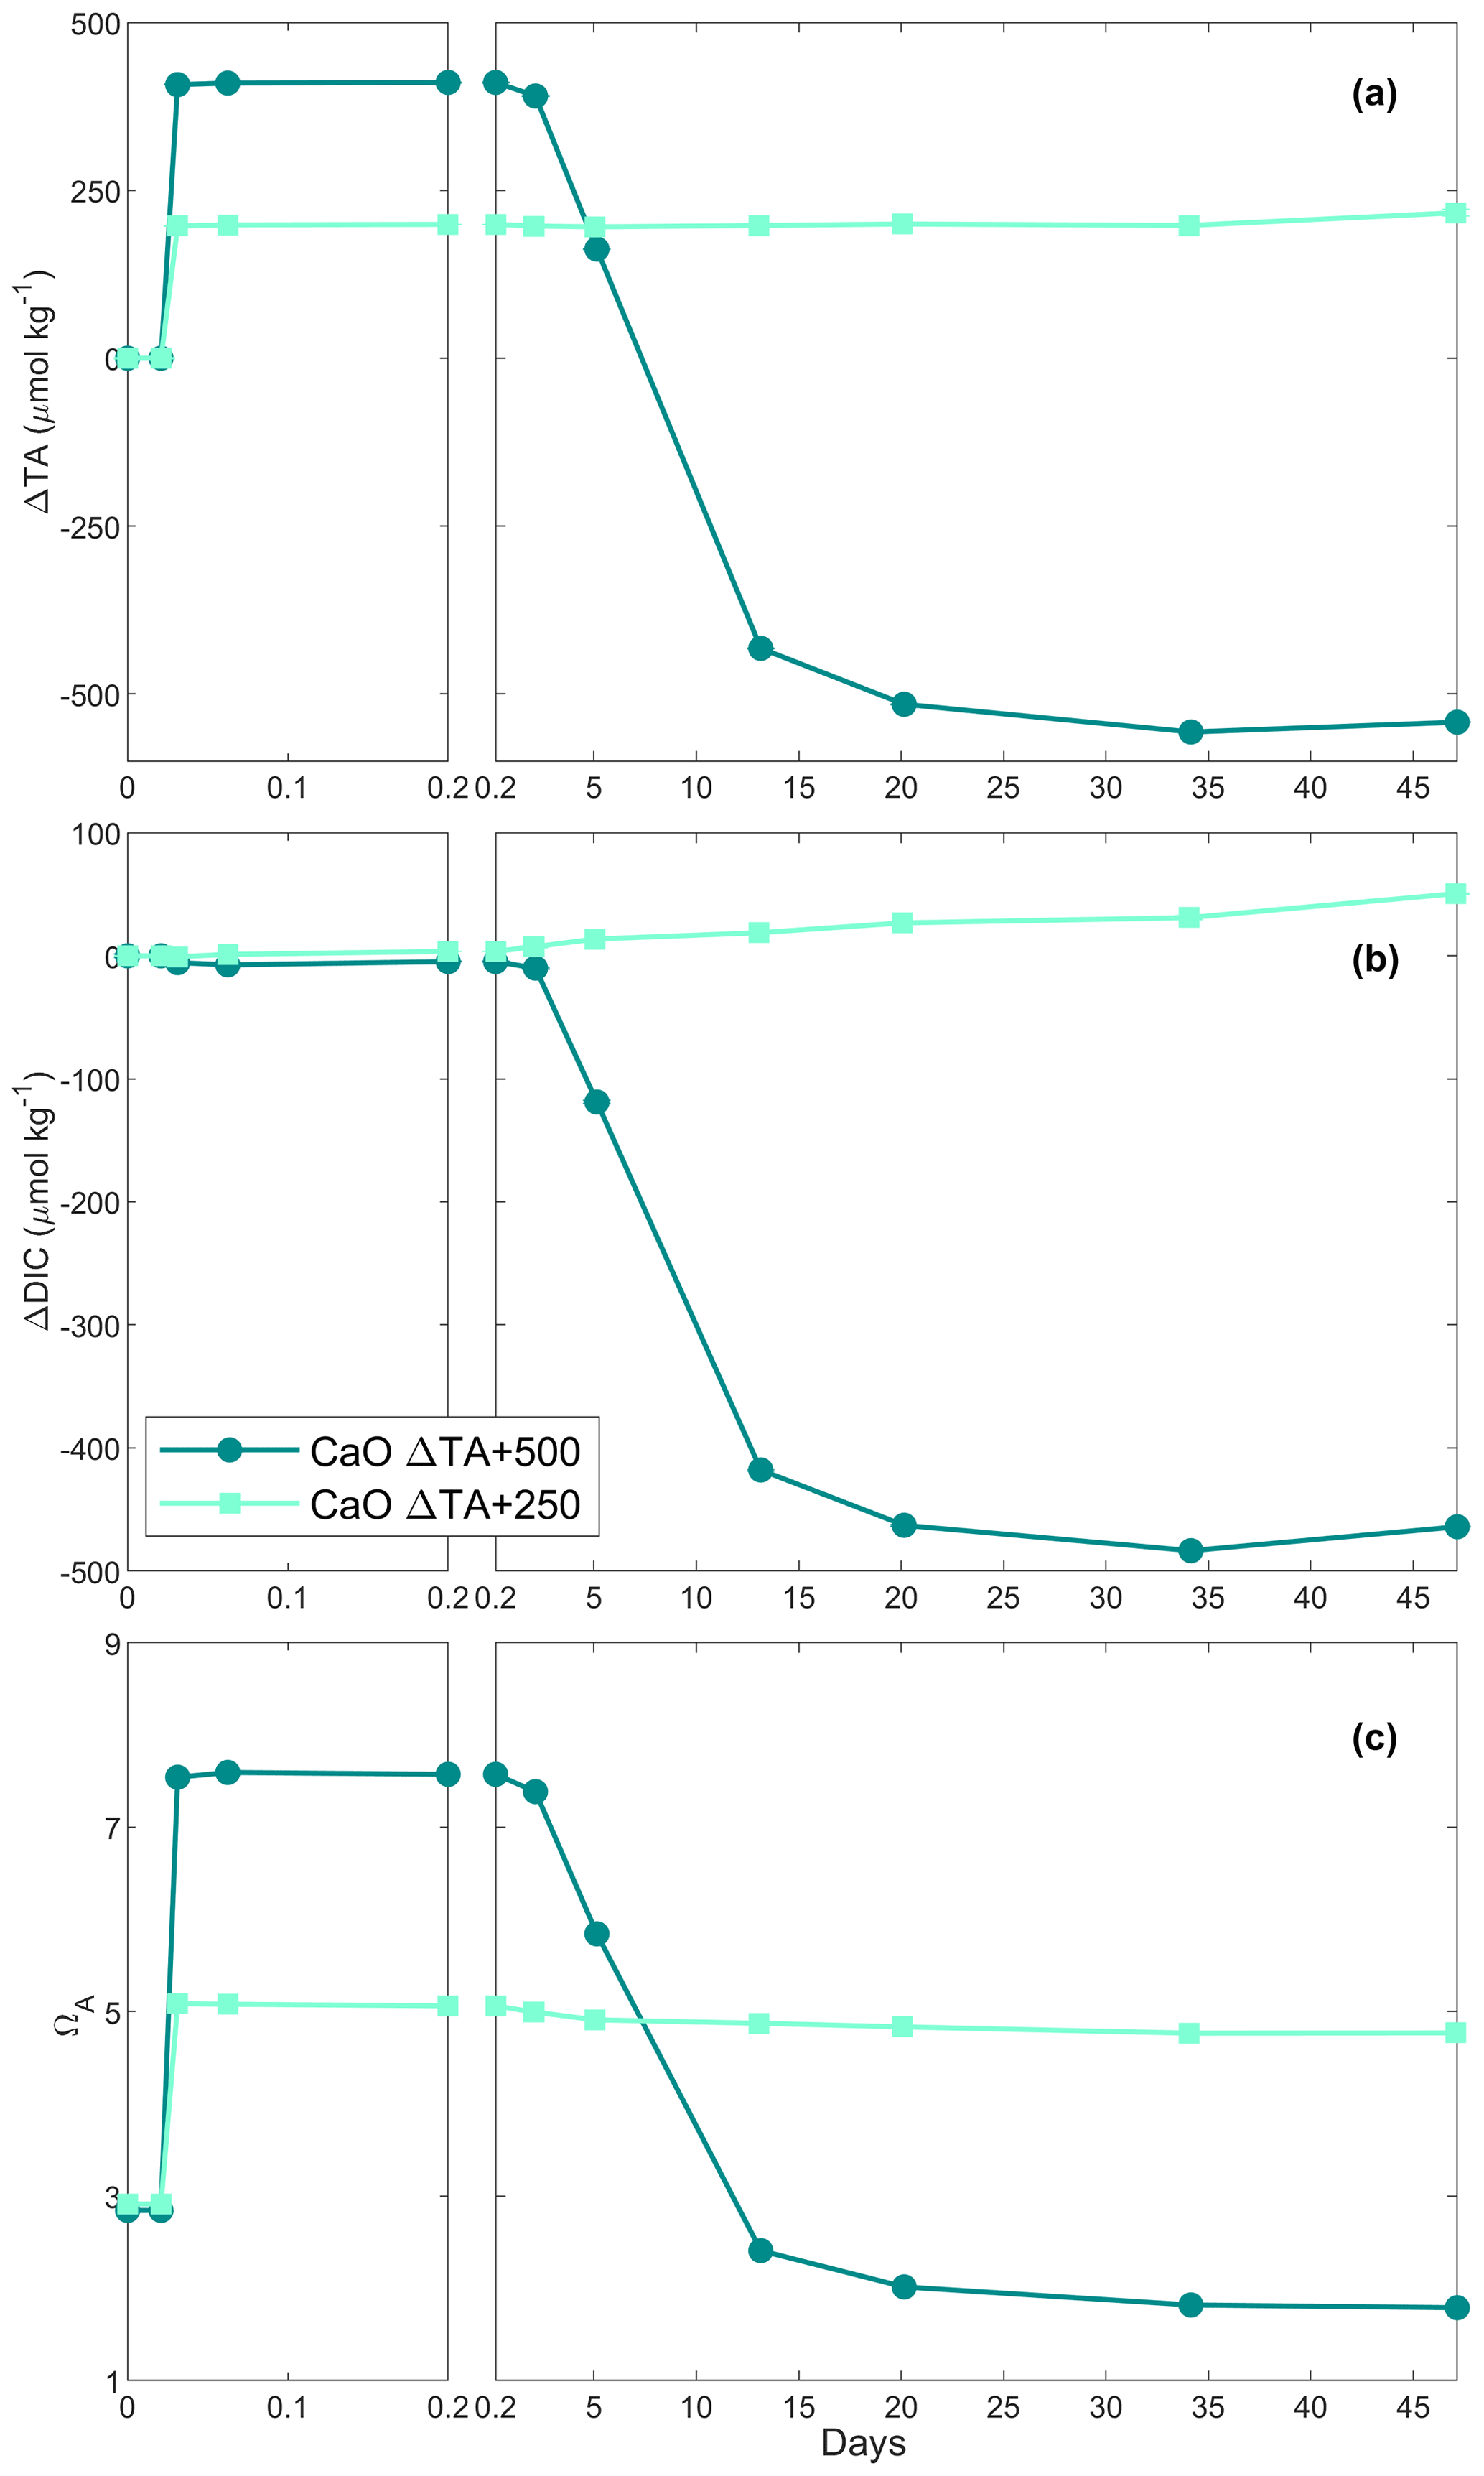
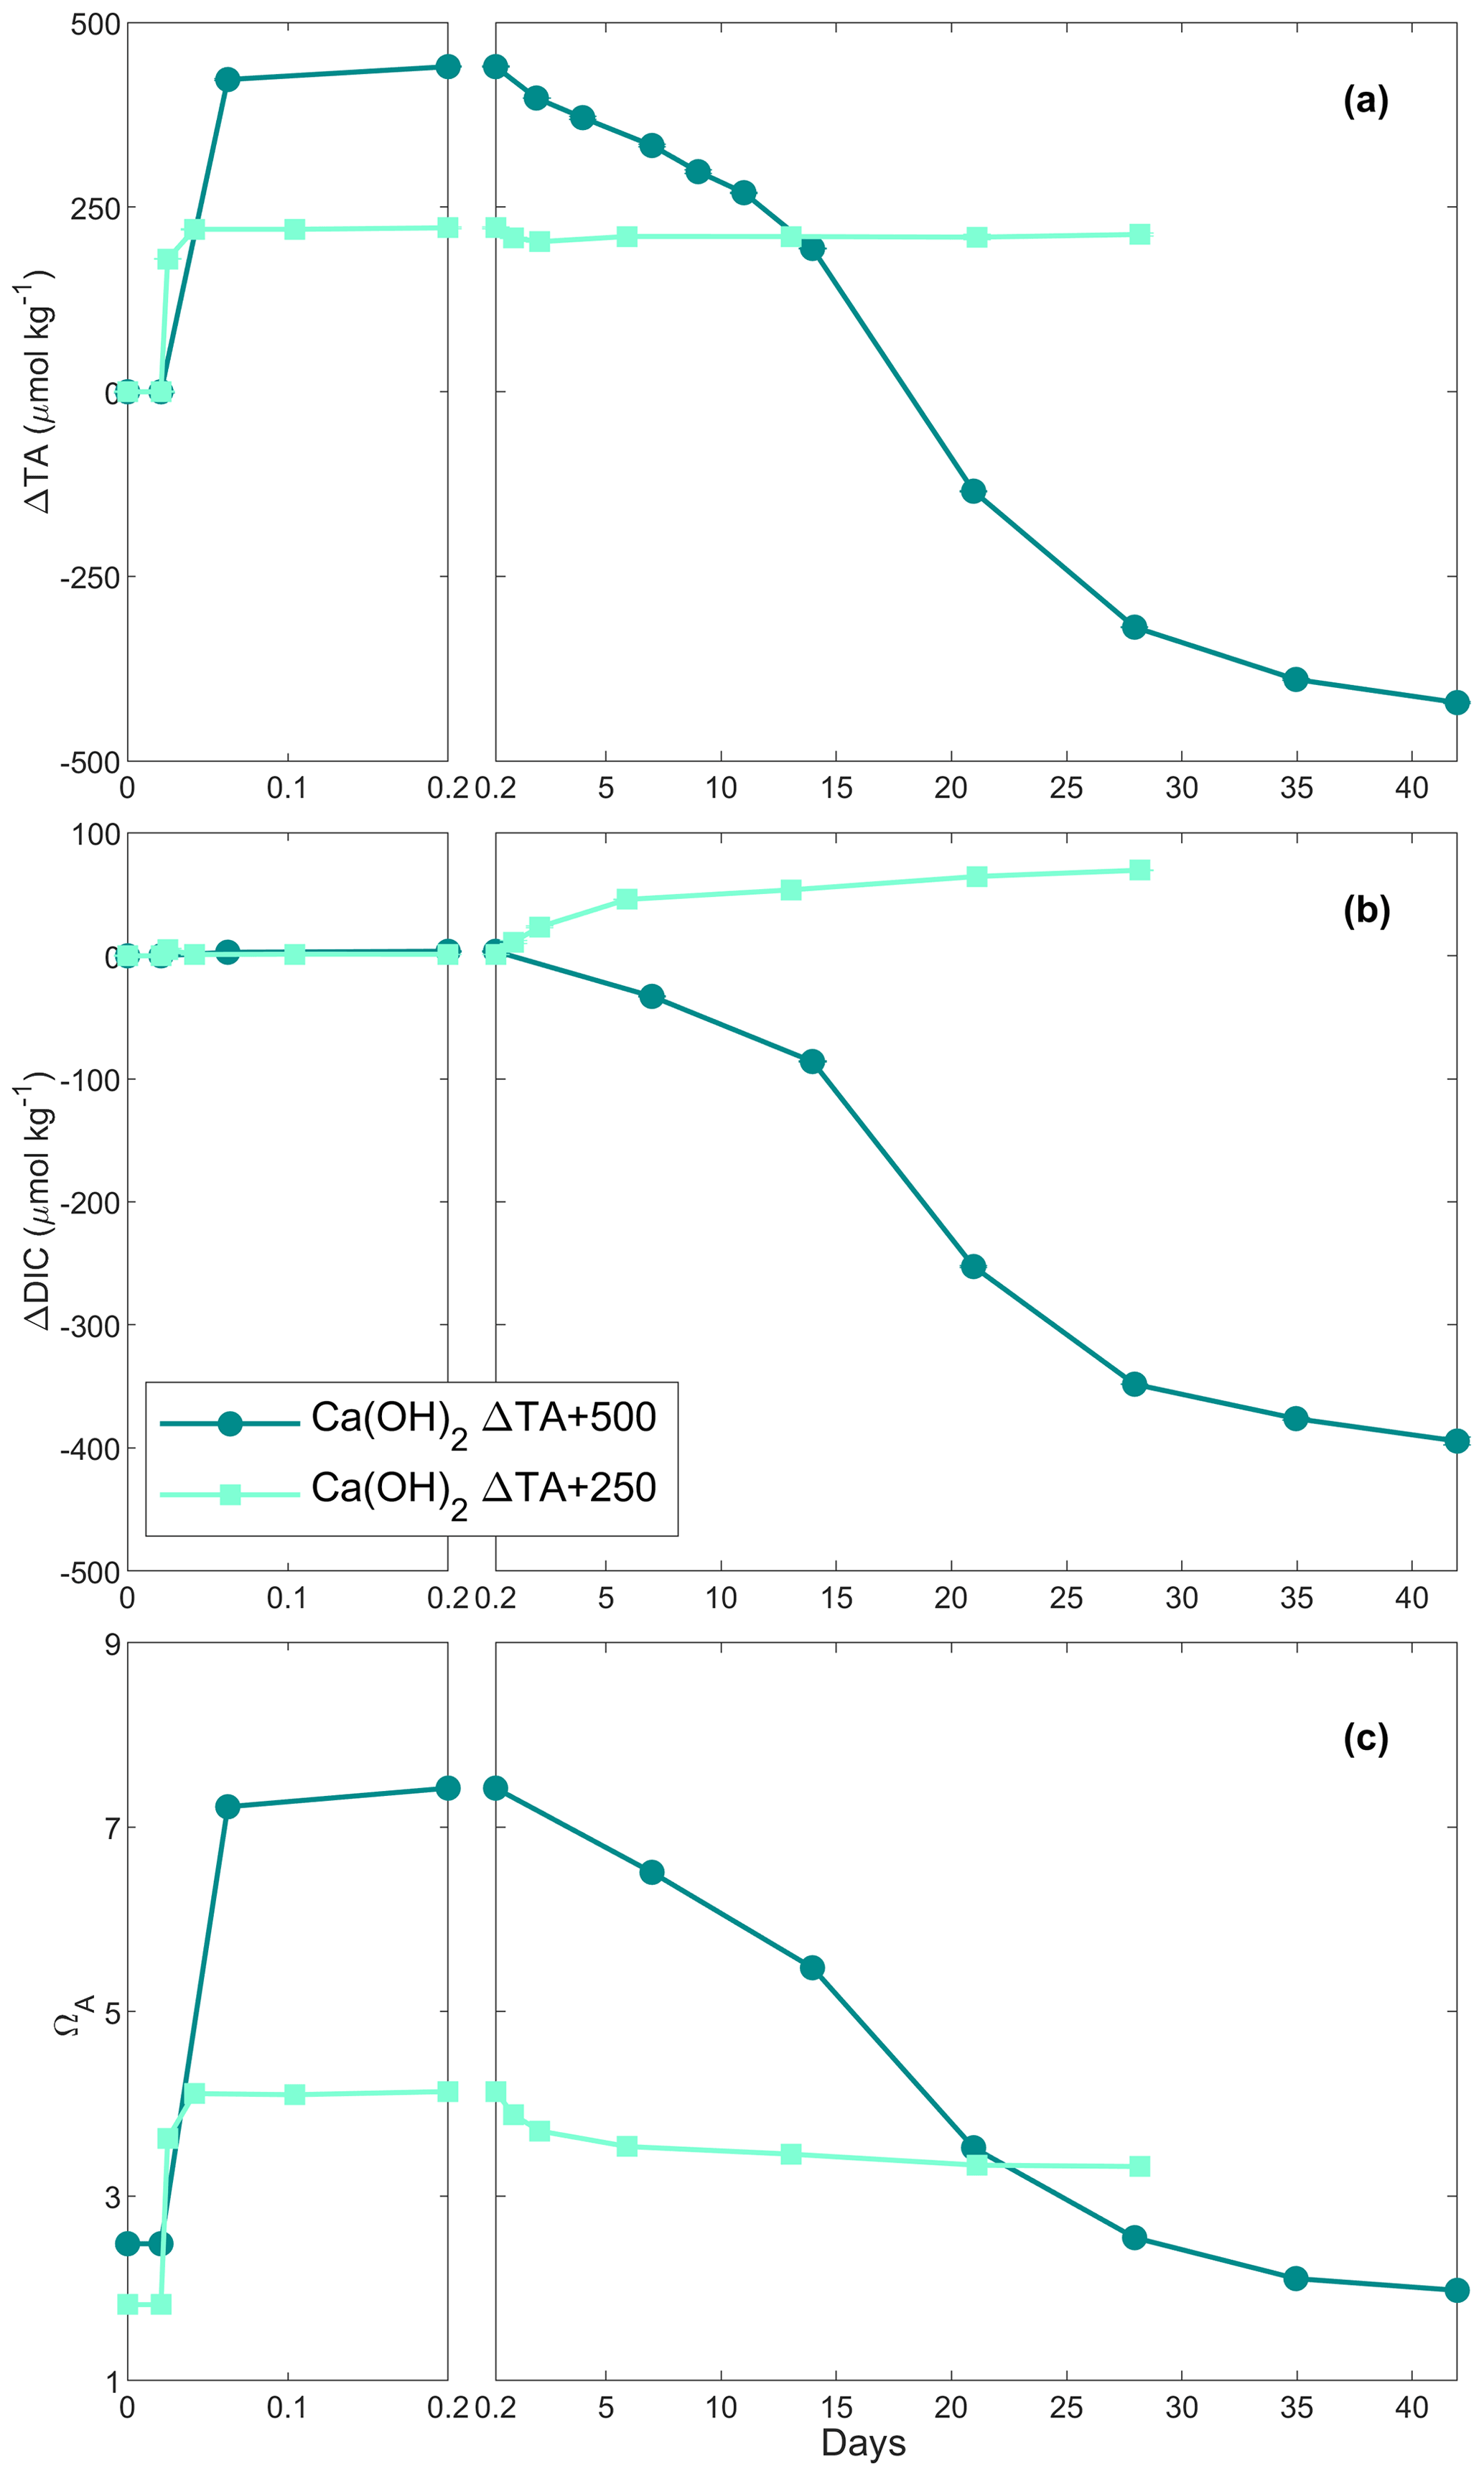
Figure 2Changes in TA (a), DIC (b) and ΩA (c) of the samples over time following two Ca(OH)2 additions.
2.5 Carbonate chemistry calculations
Measured DIC, TA, temperature and salinity were used to calculate the remaining carbonate chemistry parameters with the CO2SYS script for MATLAB® (MathWorks) (Sharp et al., 2021). The borate-to-salinity relationship and boric acid dissociation constant from Uppstrom (1974) and the carbonic acid dissociation constants of Lueker et al. (2000) were used. With two measured carbonate chemistry parameters, i.e. DIC and TA, the others can be derived. An important difference in our experiments was that the dissolution of CaO and Ca(OH)2 changed the calcium concentration, and hence the salinity-based Ω calculated by CO2SYS is underestimated. Ω is defined by the solubility product of CaCO3 as
where [Ca2+] and [CO] denote seawater concentrations of Ca2+ and CO and Ksp is the solubility product for calcite or aragonite at the appropriate salinity and temperature. To calculate saturation states, the correct calcium concentration [Ca2+]Corr was estimated from measured salinity (Riley and Tongudai, 1967) and half the alkalinity concentration change, ΔTA, generated during CaO or Ca(OH)2 dissolution or loss due to CaCO3 precipitation:
where 0.01028 is the molar Ca2+ concentration at a salinity of 35. Ksp was calculated from in situ temperature and salinity according to Mucci (1983). The correct ΩC and ΩA were then calculated according to Eq. (2). Please note that we have opted to report ΩA rather than ΩC since aragonite is more likely to be precipitated in natural modern seawater (Morse et al., 1997).
2.6 OAE simulations
CO2SYS and the results from the various dissolution experiments were used to simulate three OAE scenarios (Table 3). Three alkalinity additions were simulated, +250, +500 and +1000 µmol kg−1. The starting parameters were TA = 2350 µmol kg−1, DIC = 2100 µmol kg−1, salinity = 35 and temperature = 19 ∘C, using the same acid–base equilibrium constants as described in Sect. 2.5. In the first scenario, for all three additions, no CaCO3 precipitation was assumed. We then estimated the amount of CO2 taken up by the seawater after atmospheric re-equilibration, i.e. until a pCO2 of ∼ 416 ppm. For the +500 and +1000 µmol kg−1 TA increases, two additional simulations were performed. First, we assumed that as much CaCO3 precipitated as TA was added; e.g. after increasing the TA by 500 µmol kg−1, we assumed a loss of 500 µmol kg−1 of TA and 250 µmol kg−1 of DIC. We then simulated atmospheric re-equilibration until a pCO2 of ∼ 416 ppm and recorded the changes in the carbonate chemistry parameters. Second, we assumed that CaCO3 precipitated down to an ΩA of ∼ 2 as observed in our experiments. After calculating full carbonate chemistry speciation in these various scenarios, the amount of CO2 taken up after atmospheric re-equilibration was determined using the same approach as described above.
3.1 Chemical composition of CaO and Ca(OH)2
The bulk chemical compositions of the CaO and Ca(OH)2 powders were analysed. These consisted primarily of calcium, with minor contributions of magnesium and silicon (see Table A2 for a more comprehensive list). Furthermore, CaO and Ca(OH)2 contained about 9.4 ± 0.1 and 18.0 ± 0.2 mg g−1 of particulate carbon, respectively, i.e. ∼ 0.9 % and ∼ 1.8 % by weight.
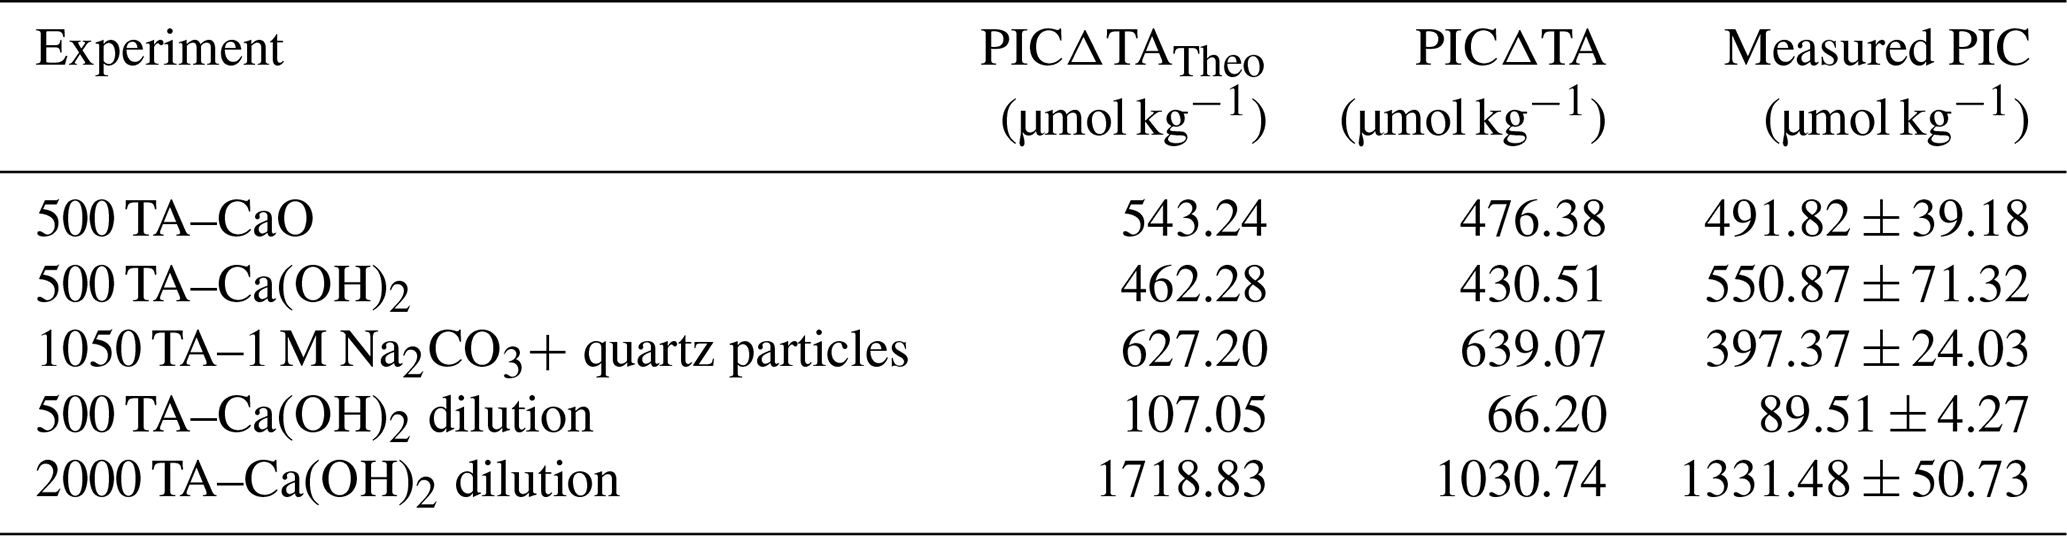
Table 2Comparison between the estimated particulate inorganic carbon (PIC) based on half the TA change between the theoretical maximum TA increase upon full dissolution of the alkaline material added and the measured TA at the end of the experiment (Table 1), the estimated PIC based on half the TA changes between the measured maximum TA increase and the measured TA at the end of the experiment, and the measured PIC from the particulate carbon analysis.
3.2 CaO dissolution in filtered natural seawater
In the first CaO experiment with a targeted 250 µmol kg−1 TA addition, TA increased by ∼ 200 µmol kg−1 within the first 4 h (Fig. 1a). Following this increase, TA was stable over time. In contrast, DIC increased slowly, at about 1 µmol kg−1 d−1, reaching about +50 µmol kg−1 on day 47 of the experiment (Fig. 1b). ΩA reflected the trend observed for ΔTA, increasing from ∼ 2.9 to ∼ 5.1 within the first 4 h before slowly decreasing to 5.0 on day 47 (Fig. 1c).

Figure 3Changes in TA (a), DIC (b) and ΩA (c) over time following additions of Na2CO3, Na2CO3 plus quartz particles and Ca(OH)2 followed by a filtration step (see “Material and methods” for details).
In the second CaO experiment with a targeted 500 µmol kg−1 TA addition, TA increased by ∼ 410 µmol kg−1 within the first 4 h before slowly decreasing on day 3 (Fig. 1a). This was followed by a rapid decrease over the following week, eventually reaching a steady state on day 20 at a final ΔTA of about −540 µmol kg−1. This corresponds to a total loss of TA of ∼ 950 µmol kg−1, between the maximum measured TA and the final recorded TA. A small decrease in DIC of ∼ 10 µmol kg−1 was observed over the first 2 d before a more significant reduction in the following week. Finally, ΔDIC levelled off at about −465 µmol kg−1 (Fig. 1b). ΩA rapidly increased during the first 4 h of the experiment from 2.8 up to 7.6 (Fig. 1c). Following this quick increase, ΩA decreased by 0.3 units by day 3. Afterwards, ΩA dropped quickly to 2.4 on day 13, and reached ∼ 1.8 on day 47, corresponding to a reduction of 1.0 compared to the starting seawater value.
3.3 Ca(OH)2 dissolution in filtered natural seawater
In the first Ca(OH)2 experiment with a targeted TA addition of 250 µmol kg−1, TA increased by ∼ 220 µmol kg−1 after 4 h of reaction, before stabilising at a ΔTA of ∼ 210 µmol kg−1 for the rest of the experiment (Fig. 2a). The DIC concentration increased quickly over the first 6 d after the TA addition before slowing down, reaching about +70 µmol kg−1 by the end of the experiment (Fig. 2b). Finally, ΩA reached ∼ 4.1 after 4 h, slightly decreasing over time, reaching 3.3 on day 28 (Fig. 2c).
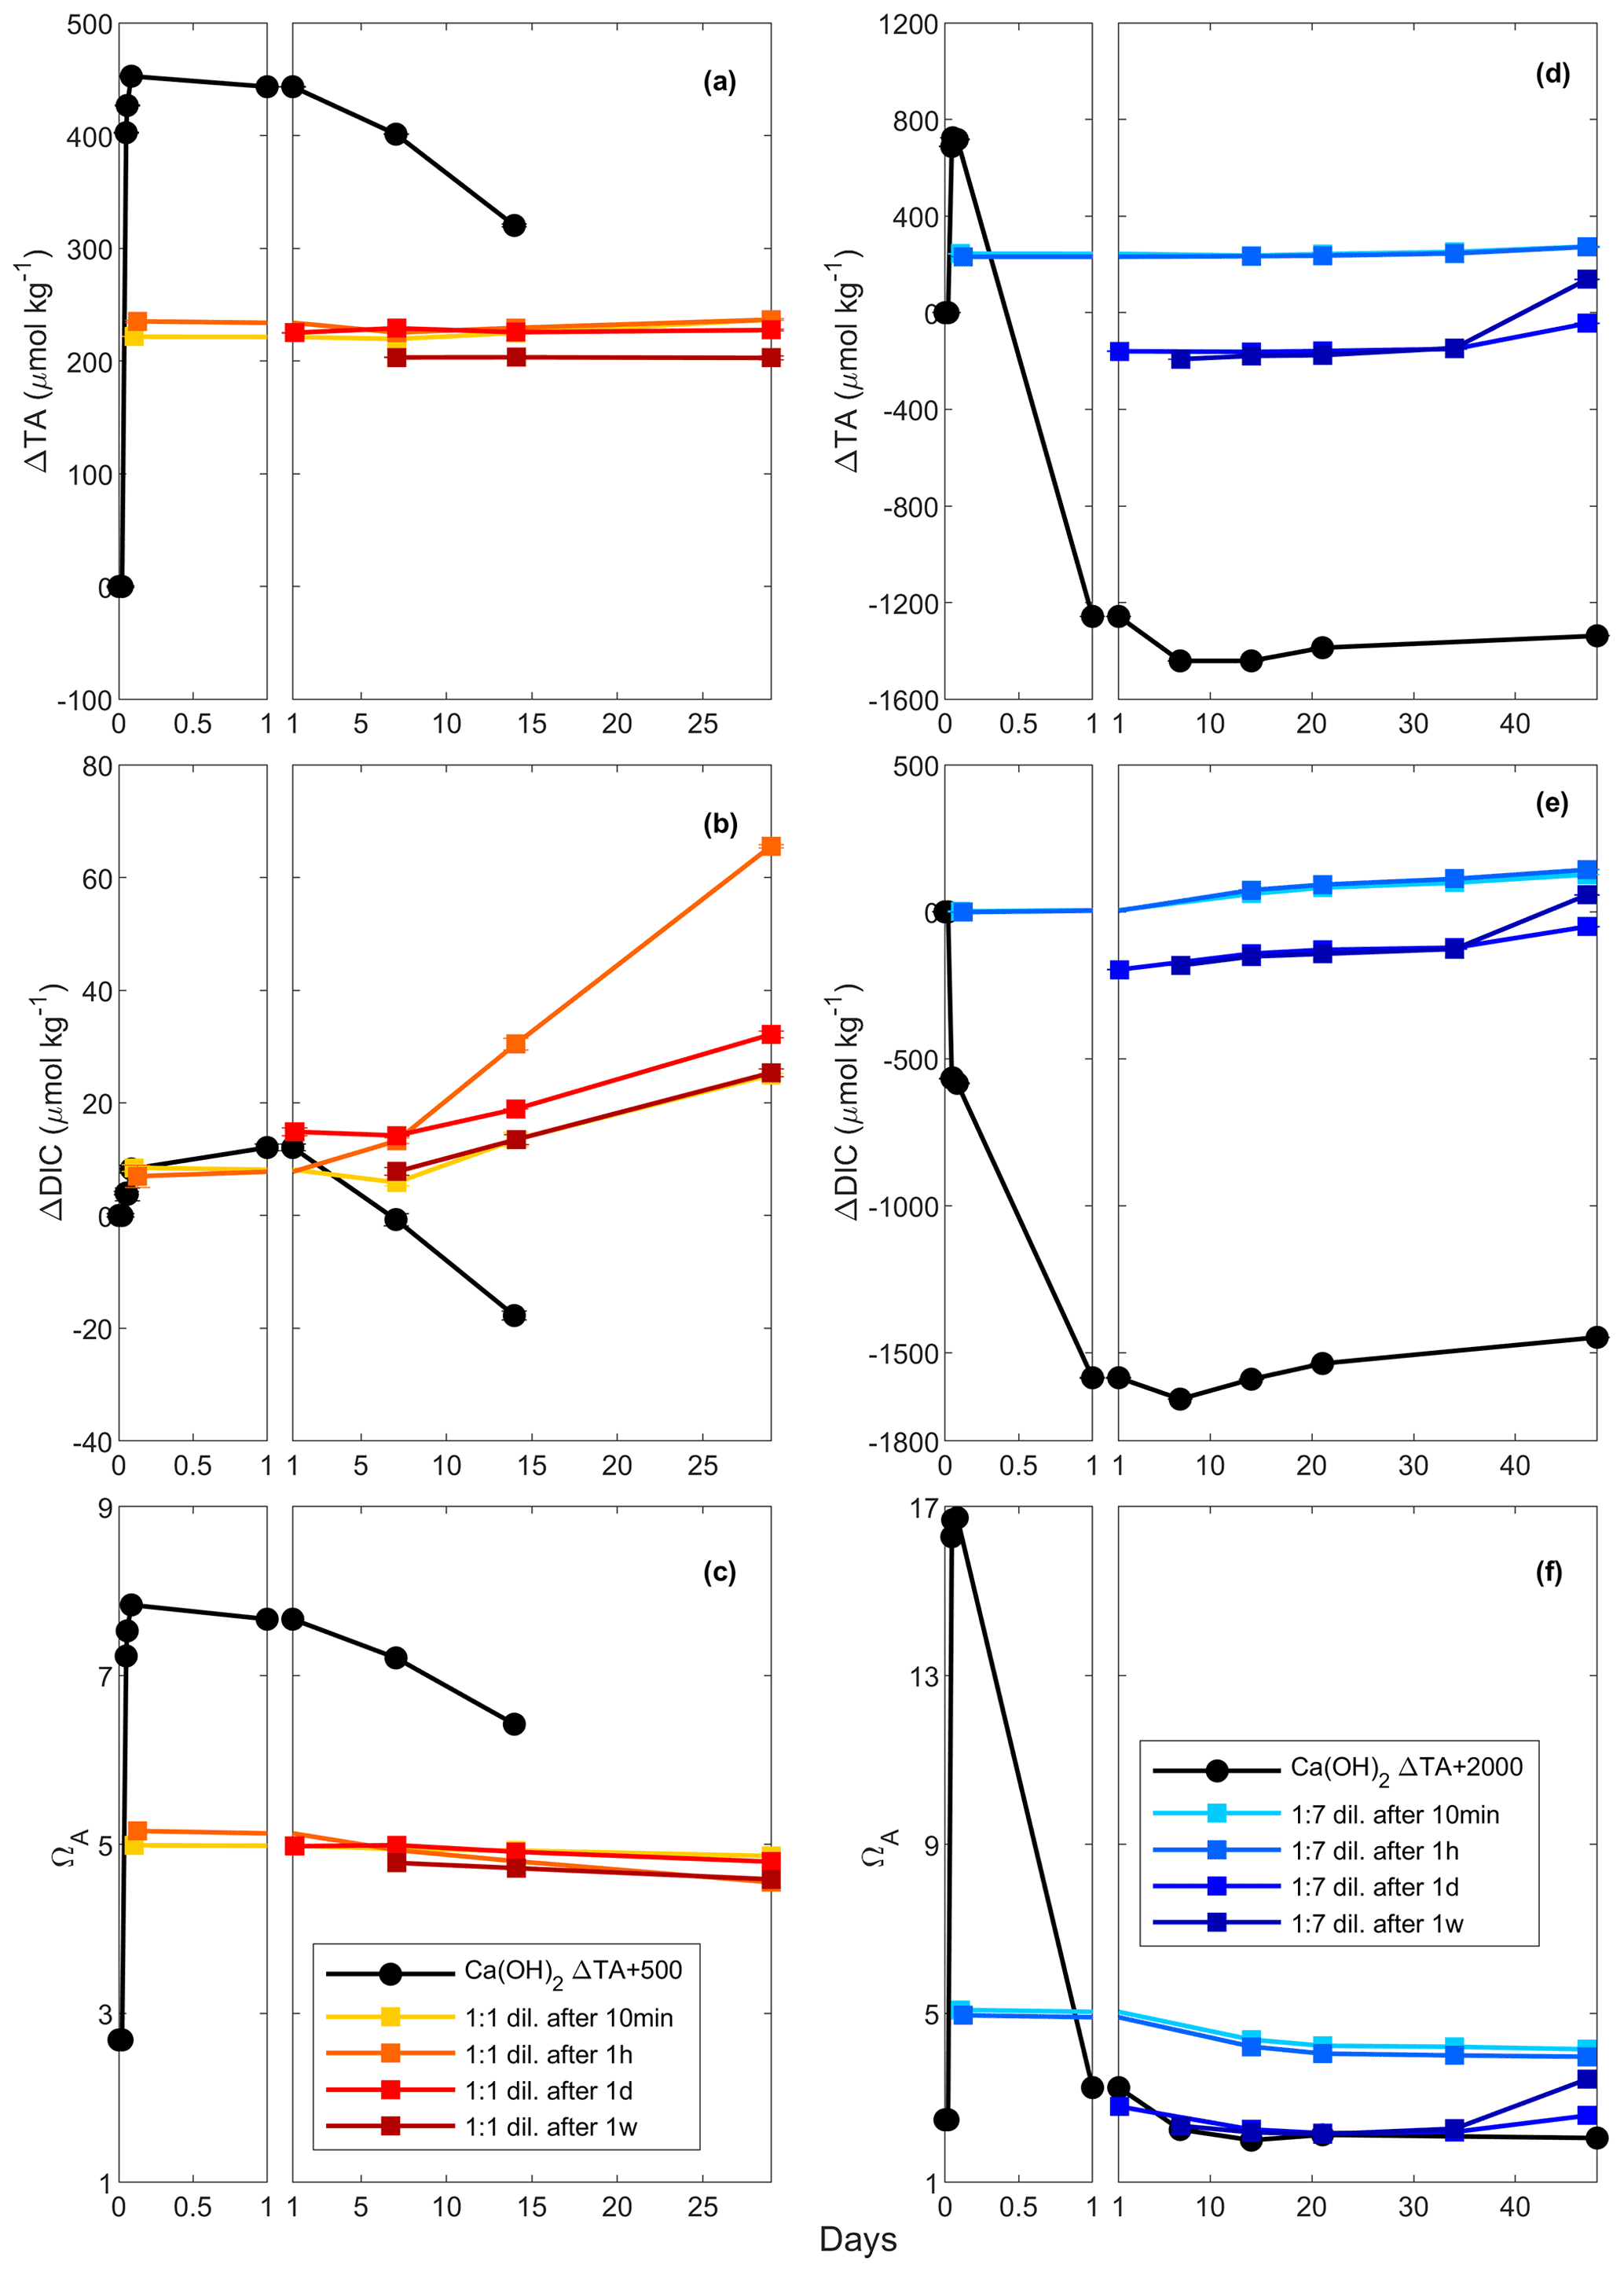
Figure 4Changes in TA (a and d), DIC (b and e) and ΩA (c and f) following a TA addition of 500 and 2000 µmol kg−1, respectively, by Ca(OH)2 (black line), as well as following a 1:1 dilution for the 500 µmol kg−1 TA addition (red and yellow lines) and a 1:7 dilution for the 2000 µmol kg−1 TA addition (blue lines). The dilutions were performed after 10 min, 1 h, 1 d and 1 week, and earlier dilutions are represented by lighter colours.
In the second Ca(OH)2 experiment with a targeted TA addition of 500 µmol kg−1, TA increased by ∼ 440 µmol kg−1 within the first 4 h (Fig. 2a). This was followed by a steady decrease of ∼ 18 µmol kg−1 d−1 over the next 2 weeks, after which the decrease accelerated to ∼ 28 µmol kg−1 d−1 until day 35. Then, it levelled off at a ΔTA of about −420 µmol kg−1 towards the end of the experiment. Overall, ∼ 860 µmol kg−1 of TA was lost compared to the highest TA recorded. The overall DIC concentration decreased in a similar fashion to TA, reaching a ΔDIC of about −395 µmol kg−1 compared to the initial DIC concentration (Fig. 2b). ΩA increased from 2.5 to 7.4 in the first 4 h before decreasing, similarly to TA and DIC, reaching ∼ 2.0 on day 42 (Fig. 2c).
3.4 Na2CO3, particle addition and filtration
Three experiments assessed the influence of particles on CaCO3 precipitation. In the first one, ∼ 1050 µmol kg−1 of TA was added using a 1 M Na2CO3 solution, designed to obtain a similar maximum ΩA to the previous experiments when TA decreased (Table 1). Upon addition, TA increased by ∼ 1060 µmol kg−1 and DIC by ∼ 530 µmol kg−1 within minutes. For the remainder of the experiment, ΔTA was fairly constant between 1060 and 1040 µmol kg−1 (Fig. 3a). In contrast, DIC slightly increased over 42 d from a ΔDIC of ∼ 530 µmol kg−1 on day 1 to ∼ 560 µmol kg−1 on day 42 (Fig. 3b). ΩA increased from ∼ 2.3 to ∼ 8.5 within minutes of the Na2CO3 addition and slightly decreased to ∼ 8.1 after 42 d of the experiment (Fig. 3c).
In the second experiment, the addition of 1 M Na2CO3 solution (Table 1) increased TA by 1070 µmol kg−1, while DIC increased by ∼ 540 µmol kg−1 within minutes and remained stable (Fig. 3a, b). After 2 d, quartz particles were added. Whereas ΔTA and ΔDIC remained invariant after 1 d, ΔTA decreased to ∼ 220 µmol kg−1 and ΔDIC dropped to ∼ 120 µmol kg−1 between day 5 and 12 (Fig. 3a, b). Over the next month, ΔTA and ΔDIC continued to decrease, although at a slowing rate, reaching about −200 and −110 µmol kg−1, respectively, on day 42. ΩA followed a similar trend, with an increase from ∼ 2.8 up to ∼ 9.2 within the first 1.5 h and a significant decline to ∼ 3.9 between day 5 and day 12, before stabilising at around ∼ 2.0 at the end of the experiment on day 48.
In the last experiment, Ca(OH)2 was added, aiming for a TA increase of 500 µmol kg−1 (Table 1), a level at which a significant TA decrease had been observed previously (Fig. 2a). In contrast to the previous experiment, after reaching ∼ 470 µmol kg−1 at the 4 h mark, the content of the bottle was filtered and ΔTA remained relatively constant between 465 and 470 µmol kg−1 over the following 48 d of the experiment (Fig. 3a). Meanwhile, ΔDIC increased from ∼ 5 to 55 µmol kg−1 after filtration (Fig. 3b). ΩA increased from ∼ 2.8 to ∼ 8.2 within the first 1.5 h after Ca(OH)2 addition and then slightly decreased to ∼ 7.5 over the 48 d of the experiment (Fig. 3c).
3.5 Dilution experiments
3.5.1 The 500 µmol kg−1 addition
In these experiments with a targeted TA increase of 500 µmol kg−1 by Ca(OH)2 addition, ΔTA increased to ∼ 450 µmol kg−1 after 2 h (Fig. 4). These changes in TA were followed by a decline to ∼ 320 µmol kg−1 after 14 d, although the latter was a slightly slower decrease than previously (Figs. 2, 4a). After a first increase in ΔDIC by ∼ 10 µmol kg−1 on day 1, ΔDIC steadily decreased to about −20 µmol kg−1 after 2 weeks (Fig. 4b). Finally, ΩA increased from ∼ 2.7 to ∼ 7.8 after 2 h, before steadily decreasing to ∼ 6.4 on day 14 (Fig. 4c).
In the diluted treatments, ΔTA remained relatively stable over time, until the end of the experiments on day 29, regardless of dilution time (Fig. 4a). Upon dilution, ΔTA was reduced, values of which were similar for the 10 min, 1 h and 1 d dilutions. Overall, in the 1-week dilution, ΔTA was slightly lower, i.e. ∼ 205 µmol kg−1 instead of ∼ 230 µmol kg−1 on average. In all dilutions, ΔDIC increased over time, ranging between ∼ 20 and ∼ 60 µmol kg−1, independently of dilution timing. Finally, ΩA showed similar trends to ΔTA, reaching between ∼ 4.8 and ∼ 5.2 and slightly decreasing over time until the end of the experiment.
3.5.2 The 2000 µmol kg−1 addition
This set of experiments aimed for a TA increase of 2000 µmol kg−1 by Ca(OH)2 addition. However, TA only increased to approximately one-third of the targeted value, i.e. ∼ 725 µmol kg−1 within the first 2 h (Fig. 4d). Following this increase, TA rapidly decreased during the first day, reaching a ΔTA of about −1260 and then −1440 µmol kg−1 in the following week (Fig. 4d). Over the second week of the experiment, TA appeared to stabilise before increasing until day 21. In contrast, ΔDIC decreased by ∼ 580 µmol kg−1 within the first 2 h, before rapidly dropping to about −1590 µmol kg−1 on day 1 and −1660 µmol kg−1 after 7 d (Fig. 4e). Over the remaining 41 d, ΔDIC increased by ∼ 210 µmol kg−1, remaining ∼ 1450 µmol kg−1 below the starting DIC concentration. ΩA increased to ∼ 16.7 after 2 h, followed by a rapid drop to ∼ 3.2 on day 1 and ∼ 2.0 on day 14 and slightly increasing over the following 34 d, varying between 2.0 and 2.1 (Fig. 4f).
With respect to ΔTA, ΔDIC and ΩA, the 10 min and 1 h dilutions showed similar responses, as did the 1 d and 1-week dilutions. Upon dilution, ΔTA reached values of ∼ 240 µmol kg−1 after the 10 min and 1 h dilutions and about −160 to −190 µmol kg−1 after the 1 d and 1-week dilutions. With the exception of one data point in the 1-week dilution data, ΔTA remained relatively constant throughout all dilution experiments (Fig. 4d). DIC changes were similar to the TA changes, slowly increasing over time between 0.6 and 2.5 µmol kg−1 d−1, with very similar values reached for the 10 min and 1 h dilutions, as opposed to the 1 d and 1-week dilutions (Fig. 4e). Finally, ΩA dropped from ∼ 5.0–5.1 to ∼ 4.0–4.1 over time in the 10 min and 1 h dilutions, while it decreased from ∼ 2.3–2.8 to ∼ 2.1–2.2 until day 21 in the 1 d and 1-week dilutions before increasing to ∼ 2.6–3.4 towards the end of the experiments (Fig. 4f).
3.6 Particulate inorganic carbon
With the exception of the ∼ 1050 µmol kg−1 TA addition by Na2CO3 and quartz particles, measured PIC in experiments was always higher than estimates from measured ΔTA (Table 2). Furthermore, PIC estimated from the theoretical maximum TA increase upon full mineral dissolution, ΔTATheo, was always higher than estimated PIC from ΔTA, by about 7 % to 14 % in the ∼ 500 µmol kg−1 TA additions with Ca(OH)2 and CaO, respectively, and up to 67 % in the experiment with ∼ 2000 µmol kg−1 TA additions.
This study presents the first results investigating the dissolution of CaO and Ca(OH)2 in natural seawater in the context of OAE. In experiments with at least 500 µmol kg−1 TA increase, secondary precipitation was detected through observed TA and DIC decreases, as well as PIC increases. More specifically, at TA additions leading to an ΩA higher than 7 (in the +500 and +1000 µmol kg−1 TA treatments), “runaway CaCO3 precipitation” was observed, meaning that not only was the added TA completely removed but significant portions of residual seawater TA were as well, until a new steady state was reached. This vastly reduces the desired CO2 removal potential by OAE and should therefore be avoided. In a subsequent set of experiments, we simulated ocean mixing to estimate the timescales required to avoid and/or stop secondary CaCO3 precipitation for applications that initially have TA additions above the critical threshold.
4.1 Identifying CaCO3 precipitation, the problem of unmeasured precipitation, CO2 gas exchange
CaCO3 precipitation can occur via three pathways, i.e. heterogeneous, homogeneous and pseudo-homogeneous nucleation and precipitation (Chen et al., 2005; Marion et al., 2009; Wolf et al., 2008). Heterogeneous precipitation relies on the presence of existing solid mineral surfaces. This differs from homogeneous precipitation, characterised by the formation of CaCO3 crystals from Ca2+ and CO ions in the absence of any nucleation surfaces (Chen et al., 2005; Wolf et al., 2008). Finally, the last type of precipitation, termed pseudo-homogeneous, is similar to homogeneous nucleation, but it occurs on nuclei other than solid minerals such as colloids, organic particles or glassware in a laboratory setting (Marion et al., 2009). Concerning the Ω thresholds above which CaCO3 precipitation is expected, the lowest threshold would be for heterogeneous and the highest for homogeneous, with pseudo-homogeneous nucleation in between. This is because nucleation sites effectively lower the activation energy required for CaCO3 precipitation (Morse et al., 2007).
When 1 mol of CaCO3 is precipitated, the TA of the solution decreases by 2 mol due to the removal of 1 mol of CO ions, accounting for 2 mol of TA (Zeebe and Wolf-Gladrow, 2001). Simultaneously, the loss of 1 mol of CO ions decreases the DIC concentration by 1 mol. Hence, any loss of TA and DIC following a 2:1 ratio can be linked to CaCO3 precipitation (Zeebe and Wolf-Gladrow, 2001). Additionally, when CaCO3 precipitation was suspected in our experiments, SEM and particulate inorganic carbon samples were taken to confirm the presence of CaCO3 and to identify which polymorphs were predominant. In the +250 µmol kg−1 TA additions by CaO and Ca(OH)2, both appeared to fully dissolve without inducing CaCO3 precipitation as TA and ΩA quickly increased within minutes, similarly to what has been described in the literature (Chave and Suess, 1970; Rushdi et al., 1992), until reaching their respective maxima after about a day and remaining stable over weeks (Figs. 1a and c, 2a and c). A slight increase in DIC was observed over time as expected since atmospheric CO2 was absorbed from the bottle headspace, created when 150 to 200 mL of solution was withdrawn at each sampling point. The measured TA increase was slightly below the theoretically expected increase, which is assumed to be due to a combination of impurities present (in the case of CaO, a significant fraction could be hydrated) and any loss of the finely ground material during the process of weighing and sieving. On average, ∼ 23 % of alkalinity added was not detected in the experiments with CaO and about 14 % for the experiments using Ca(OH)2 (Table 1, Figs. 1 and 2).
In contrast, in the +500 µmol kg−1 TA additions by CaO and Ca(OH)2, TA started decreasing after about 1 d following the observed initial increase. If this TA loss was through CaCO3 precipitation, DIC should be reduced by half this amount. The measured TA and DIC losses were very close to this 2:1 ratio for both the CaO and the Ca(OH)2 experiments with a TA addition of 500 µmol kg−1 (950:465 and 860:395 for CaO and Ca(OH)2, respectively). This suggests that TA precipitated in the form of CaCO3. The slight offset can be explained by ingassing of CO2 from the headspace which lowers the TA : DIC ratio, becoming visible only when precipitation ceases towards the end (Fig. 1b). Another caveat is that the maximum increase in TA from full dissolution of CaO or Ca(OH)2 cannot be measured in the presence of concurrent CaCO3 precipitation. This is mostly evident in the +2000 µmol kg−1 TA addition (Fig. 4), where DIC decreases due to CaCO3 precipitation yet TA increases due to higher Ca(OH)2 dissolution rates. This also explains why estimated PIC calculated from measured TA changes is generally smaller than measured PIC concentrations (Table 2). In the experiment with 1 M Na2CO3 and quartz particles, the measured TA-based PIC estimates were larger than the measured PIC. This difference is difficult to explain and could be possibly linked to the observed white layer on the bottle walls, indicative of CaCO3 precipitation. In any case, while being a laboratory artefact, this has no practical consequences as in a natural setting the TA would eventually precipitate in the water column. In summary, trying to estimate CaCO3 precipitation from measured changes in TA, without knowing how much TA was actually generated by full mineral dissolution or actual PIC measurements, might underestimate total precipitation.
4.2 The presence of mineral phases triggers runaway CaCO3 precipitation
An important finding in our experiments was that whenever CaCO3 precipitation was observed, it continued even if the solution dropped below an ΩA of ∼ 4–5, levels at which no precipitation was observed in the +250 µmol kg−1 TA addition experiments. Furthermore, in all these experiments, precipitation decreased and seemingly ceased at an ΩA of ∼ 1.8–2.0. Therefore, it appears that when CaCO3 is initially precipitated, CaCO3 continues to precipitate in a runaway fashion, even if ΩA drops below levels where precipitation would not be initiated in natural seawater. This is to be expected as CaCO3 precipitates onto CaCO3 mineral surfaces at any saturation state above 1, and the initial precipitation at high-saturation states provides new nucleation sites (Morse et al., 2003, 2007; Zhong and Mucci, 1989). The precipitation rate is directly proportional to Ω, decreasing exponentially until reaching zero at an Ω value of 1 (Fig. A4). However, the question of why precipitation occurred at a much lower Ω than anticipated, i.e. Ω∼ 7.5 vs. ∼ 12.3, remains (Marion et al., 2009).
It is known that the presence of particles in suspension can initiate and accelerate CaCO3 precipitation (Millero et al., 2001; Morse et al., 2003; Wurgaft et al., 2021). It is unlikely that the presence of CaCO3 impurities in CaO (less than 1 % carbon) and Ca(OH)2 (less than 2 % carbon) from imperfect calcination would have caused precipitation as the presence of CaCO3 mineral phases should have caused precipitation at any saturation state above 1, i.e. also in the +250 µmol kg−1 TA addition experiments. Furthermore, modelling precipitation using experimentally determined ΩA and surface-area-dependent aragonite precipitation rates onto CaCO3 mineral phases (Zhong and Mucci, 1989) suggests that once precipitation becomes analytically detectable, it should proceed very rapidly before levelling off (Fig. A5). Furthermore, while we expected CaCO3 precipitation to stop at ΩA ∼ 1, we observed it to stop at ΩA ∼ 2. The presence of dissolved organic carbon and soluble reactive phosphate could have slowed down if not stopped CaCO3 precipitation at an ΩA higher than 1 (Chave and Suess, 1970; Pan et al., 2021). We also observed that the bulk of precipitation occurred over a period of at least a week, after which an equilibration was reached with apparent differences between the different dissolving minerals (i.e. CaO, Ca(OH)2 and quartz, although it is acknowledged that the experiments were not replicated).
Table 3Simulations of the changes in TA, DIC, ΩA, pCO2 and pHT (total scale) after TA increases of 250, 500 and 1000 µmol kg−1, assuming complete mineral dissolution without precipitation, a complete dissolution followed by as much CaCO3 precipitated as the amount of TA added and a complete dissolution followed by CaCO3 precipitation until reaching an ΩA of 2.0, before CO2 re-equilibration to initial pCO2. For each scenario, the number of moles of CO2 absorbed per mole of TA added has been calculated for comparison. The 500 µmol kg−1 TA addition simulation is shown in Fig. A3 in the Appendix.
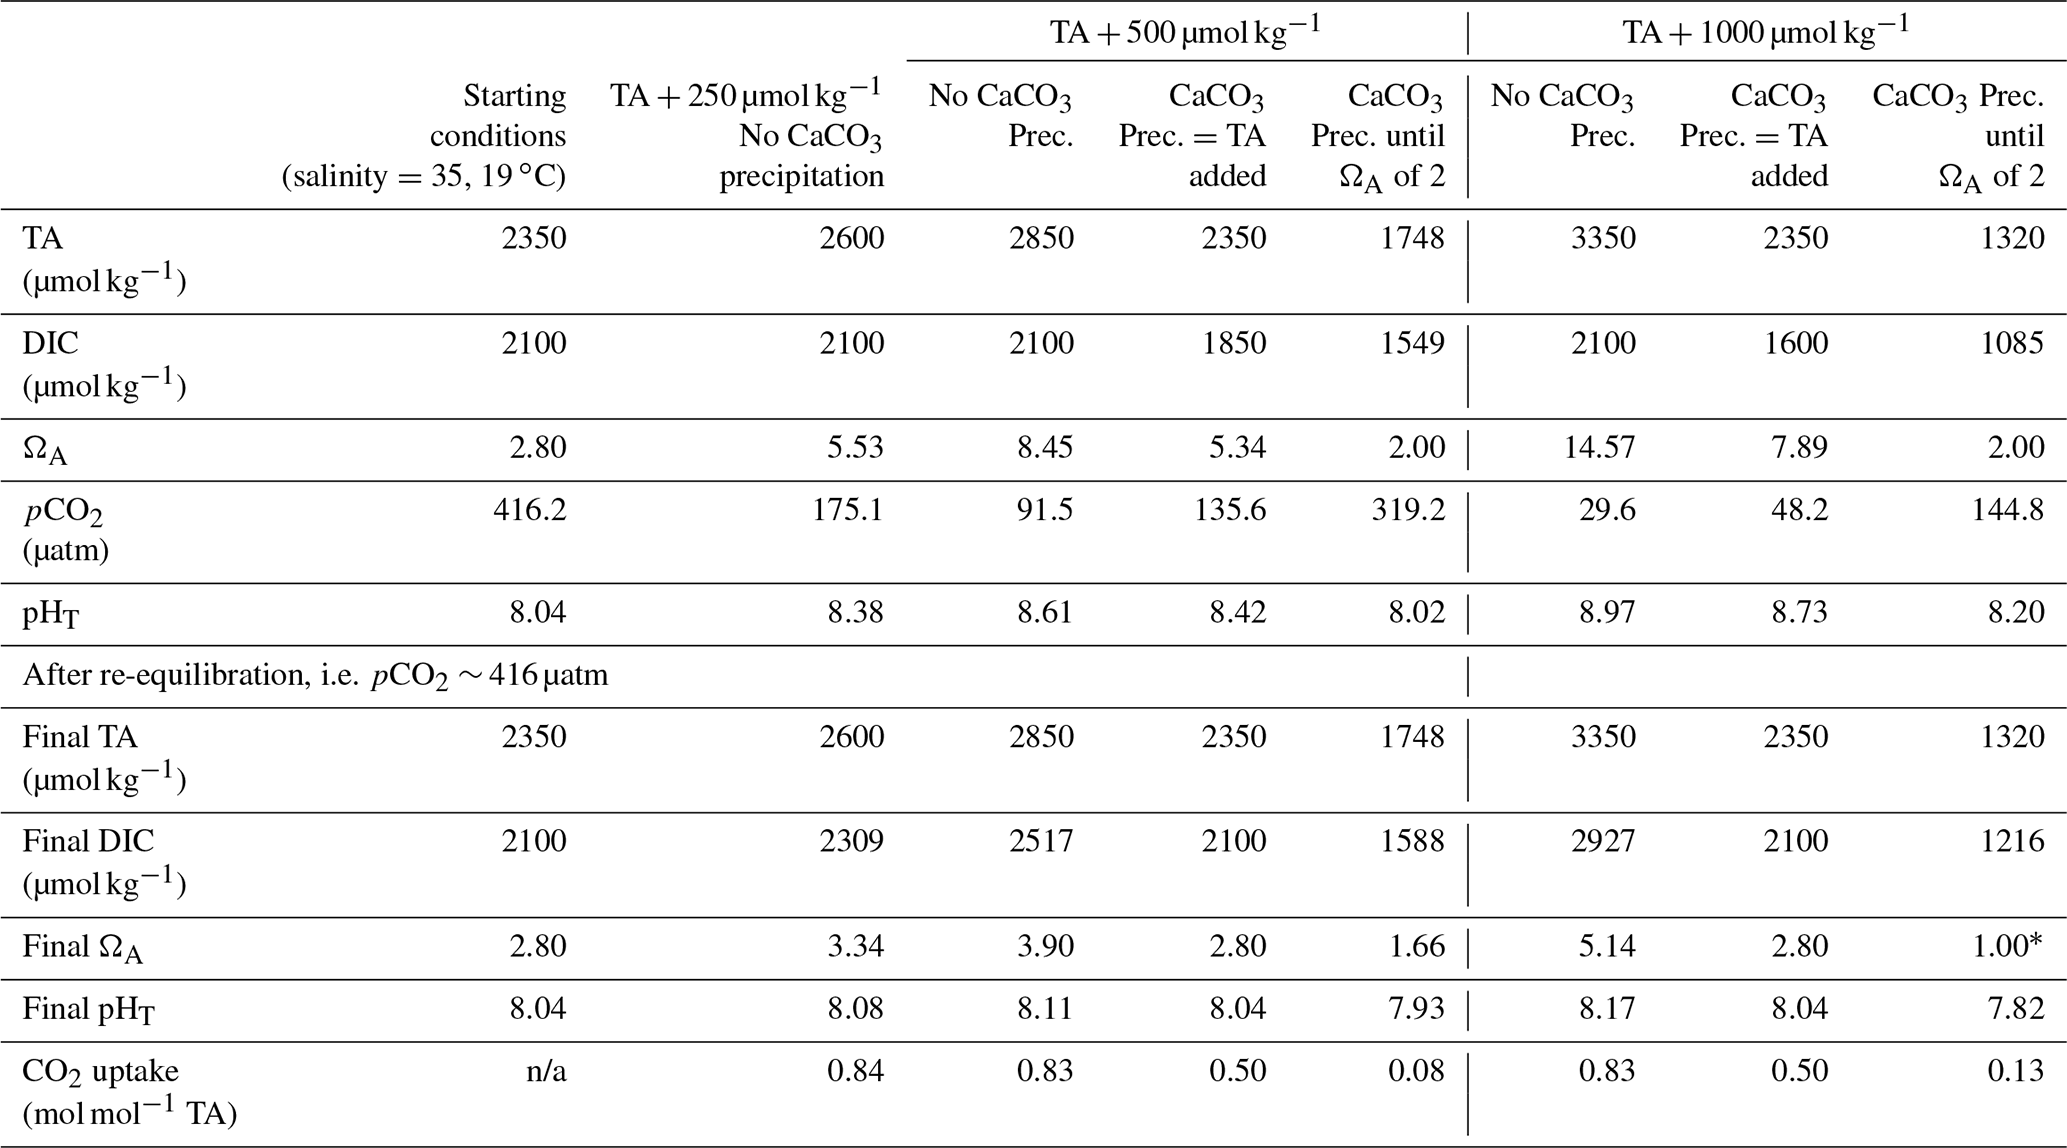
* Note the value for ΩA is rounded to 1.00 but calculated at 0.997. n/a: not applicable.
Another explanation for CaCO3 precipitation is heterogeneous precipitation on not-yet-dissolved CaO and Ca(OH)2 particles (or other impurities), leading to CaCO3 crystal formation and initiating runaway precipitation. The ΩA threshold for this process would depend on lattice compatibility of the mineral phases (Tang et al., 2020). For instance, CaCO3 precipitation has been observed at any saturation state above 1 when introducing CaCO3 seed particles. In contrast, Lioliou et al. (2007) did not report CaCO3 precipitation onto quartz particles at an ΩA lower than 3.5, and in order to trigger CaCO3 precipitation onto quartz particles, ΩA would need to be further increased. Here, we observed CaCO3 precipitation on quartz particles at an ΩA of ∼ 9.2 (Fig. 3). The reason for initially slower but then more rapid precipitation could be a combination of exponentially increasing CaCO3 surface area while increasing lattice compatibility (Lioliou et al., 2007; Pan et al., 2021). The filtration of TA-enriched seawater supports this idea since not-yet-dissolved mineral phases that could facilitate early nucleation were removed, preventing runaway CaCO3 precipitation (Fig. 3).
Needle-shaped aragonite precipitation onto quartz particles (Fig. 5c and d) was observed by SEM imaging. EDX analyses identified the larger mineral to be rich in silicon, a key characteristic of quartz, and the needle-shaped particles were composed of carbon, oxygen and calcium, indicative of CaCO3 (Chang et al., 2017; Ni and Ratner, 2008; Pan et al., 2021). In contrast, direct aragonite precipitation onto not-yet-dissolved CaO and Ca(OH)2 in the +500 µmol kg−1 TA addition is difficult to prove as EDX analyses revealed the presence of Ca and O in both the mineral feedstocks and aragonite (Fig. 5a and b). Finally, in some situations (Fig. 5b), round crystals were also observed, suggesting the presence of vaterite (Chang et al., 2017). Nevertheless, aragonite crystals represented the majority of CaCO3 observed by SEM.
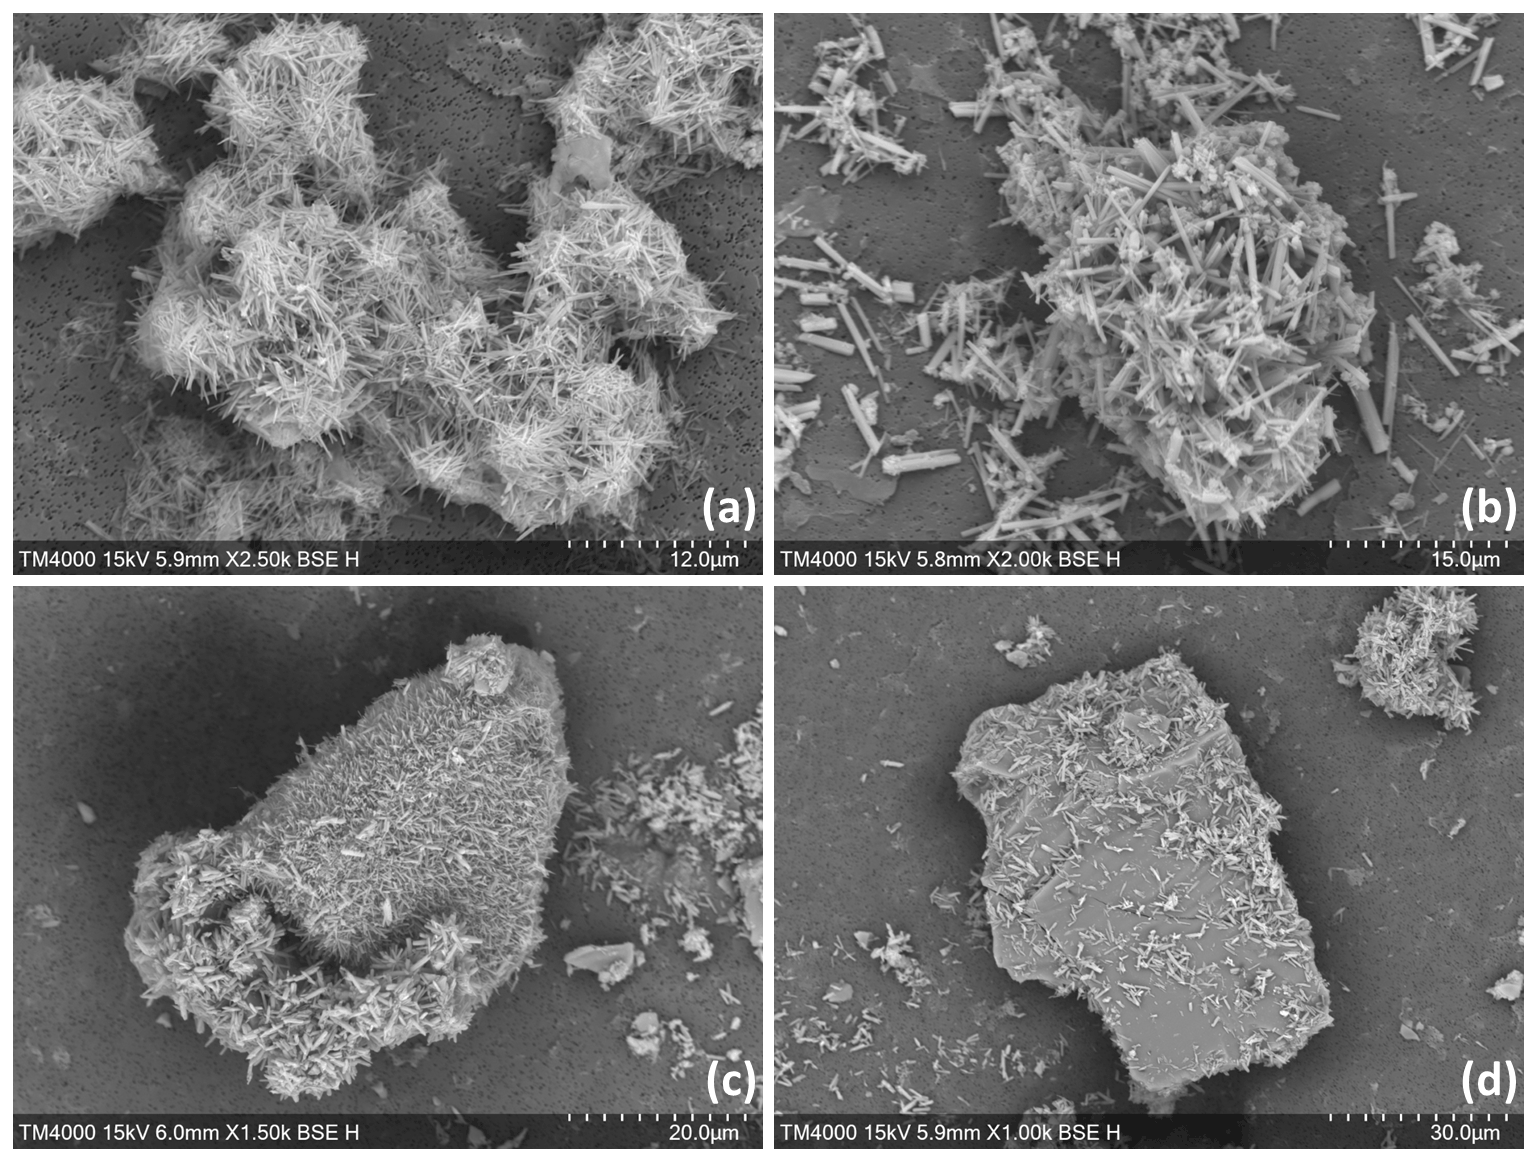
Figure 5SEM images from experiments with an increase in TA of ∼ 500 µmol kg−1 by CaO (a) and Ca(OH)2 (b) and with a TA increase of ∼ 1050 µmol kg−1 by 1 M Na2CO3, followed by quartz particles addition (c and d).
4.3 Impacts of CaCO3 precipitation on OAE potential
From an OAE perspective, CaCO3 precipitation is an important chemical reaction that needs to be avoided. During CaCO3 precipitation, dissolved [CO] and Ω decrease and [CO2] increases, which reduces the ocean's uptake capacity for atmospheric CO2, hence impacting the OAE potential. Considering typical open-ocean TA and DIC concentrations of 2350 and 2100 µmol kg−1, respectively, at a salinity of 35 and a temperature of 19 ∘C, this water mass would have a pCO2 close to atmospheric equilibrium of 416 µatm, a pHT value (total scale) of 8.04 and an ΩA of 2.80. Without CaCO3 precipitation, an addition of 500 µmol kg−1 TA would lower pCO2 to ∼ 92 µatm while increasing pHT and ΩA to about 8.61 and 8.45, respectively. If fully re-equilibrated with the atmosphere, DIC would increase by about 420 µmol kg−1, leading to a pHT and ΩA 0.07 and 1.10 higher, respectively, than prior to the addition (Table 3). The resulting OAE efficiency would be 0.83 mol of atmospheric CO2 absorbed per mole of TA added, very similar to estimates by Köhler et al. (2010). Considering that CaCO3 is the source material for CaO and Ca(OH)2 and that 2 mol of TA is produced per mole of CaO or Ca(OH)2 mineral dissolution, ∼ 0.7 t of CO2 could be captured per tonne of source material, assuming CO2 capture during the calcination process. At a global scale, using all available ship capacity and assuming a slow discharge of 1.7 to 4.0 Gt of Ca(OH)2 per year (Caserini et al., 2021), between 1.2 and 2.8 Gt of CO2 per year could be absorbed by the ocean. Including direct coastal TA discharge at a constant addition of Ca(OH)2 of 10 Gt yr−1 (Feng et al., 2016), we could expect to absorb an additional 7 Gt of CO2 per year. To put these model-derived numbers into perspective, the global cement industry currently produces about 4.1 Gt of cement per year (Statista, 2021). Depending on whether hydraulic (4CaO ⋅ Al2O3⋅ Fe2O3) or non-hydraulic (Ca(OH)2) cement is being produced and assuming a molar Ca2+-to-CO2 sequestration potential of 1.6, up to 3.9 Gt of atmospheric CO2 could be captured per year. This is within the range required over the next 30 years to keep global warming below the 2 ∘C target, as in the Representative Concentration Pathway (RCP) 2.6 scenario (Huppmann et al., 2018).
The above numbers can only be achieved if CaO or Ca(OH)2 dissolution is complete without CaCO3 precipitation. Hypothetically, when as much CaCO3 precipitates as TA is added, i.e. 100 µmol kg−1 of CaCO3 precipitates after a TA increase of 100 µmol kg−1, only 1 instead of 1.6 mol of DIC can be absorbed per 2 mol of TA, after equilibration with atmospheric pCO2 (Table 3). This represents a decrease by nearly 40 % in OAE potential. Similarly, runaway CaCO3 precipitation until an ΩA of 2.0, as observed here, decreases the OAE potential further by almost 90 %. Consequently, only ∼ 0.1 mol of DIC would be absorbed per mole of TA added (Table 3). Furthermore, secondary CaCO3 precipitation higher than TA addition will lead to pHT and Ω levels lower than the initial ones. For instance, runaway precipitation for a TA addition of 500 µmol kg−1 will see pHT drop by about 0.1 from 8.04 to 7.93 and ΩA from 2.80 to 1.66, significantly enhancing ongoing ocean acidification (Table 3). Runaway CaCO3 precipitation for a TA addition of 1000 µmol kg−1 (assumed to cease at an ΩA of 2 as observed here) would see a further drop in ΩA, i.e. to below 1, upon CO2 re-equilibration with the atmosphere (Table 3). Under such conditions, aragonite would start to dissolve, impacting various marine organisms, especially carbonate-secreting organisms, e.g. sessile corals, benthic molluscs and planktonic pteropods (Riebesell et al., 2011; Zeebe and Wolf-Gladrow, 2001). In summary, runaway CaCO3 precipitation in OAE must be avoided as it will not only reduce CO2 uptake efficiency significantly but also enhance ocean acidification. Keeping track of OAE efficiency from changes in TA concentrations can be challenging as CaCO3 precipitation can be underestimated as described earlier, requiring new and clever monitoring strategies.
4.4 Avoiding CaCO3 precipitation by dilution and other TA addition strategies
An important aspect when it comes to avoiding CaCO3 precipitation is the dilution that would occur in the wake of ships releasing TA in the ocean or by natural mixing of TA-enriched water with surrounding seawater (Caserini et al., 2021; Feng et al., 2017; Mongin et al., 2021). In our experiments, a 1:1 dilution appeared to seemingly inhibit CaCO3 precipitation in seawater, even if performed only after 1 week for the +500 µmol kg−1 TA addition. At a first glance, this comes as a surprise since precipitation nuclei would only be diluted by half, reducing surface area and precipitation rates by a factor of 2. However, as ΩA is simultaneously reduced, precipitation rates are further reduced by a factor of 10 (see Fig. A4). Hence, the overall precipitation rate would see a reduction by a factor of 20. This should slow down precipitation initiated upon the alkalinity addition if on CaCO3 particles but not completely inhibit it (Zhong and Mucci, 1989). A possible explanation could be that dilution lowers ΩA below the critical threshold, overcoming the lattice mismatch, as most of the aragonite precipitation appears to be on the original seed mineral itself rather than on the newly formed aragonite (compare Fig. 5c and d).
Overall, CaCO3 precipitation can be avoided if the TA + 500 µmol kg−1 enriched seawater is diluted 1:1, reaching an ΩA of ∼ 5.0. The more quickly dilution takes place, the less CaCO3 would precipitate prior to dilution. Similar results were found for a TA addition of +2000 µmol kg−1, i.e. the ability to stop precipitation at an ΩA of ∼ 5.0, after a 1:7 dilution. However, only the 10 min and 1 h dilutions seem to be suitable in an OAE context as rapid aragonite precipitation at a higher initial ΩA of about 16.7 would significantly reduce the CO2 uptake efficiency. Furthermore, the difficulty in monitoring precipitation from simple TA measurements (as described above) would also mean that quantification of CO2 removal is not straightforward. Therefore, in order to assign carbon credits, TA additions have to be done in a way that rule out or at least minimise secondary CaCO3 precipitation. This is true for any type of TA addition and is not specific to additions of quick and hydrated lime.
Adding TA from land, as modelled by Feng et al. (2017), shows that as more TA is added, higher coastal ΩA would be reached. By staying well below the ΩA threshold identified here, i.e. limiting coastal ΩA to only 3.2, up to ∼ 550 Gt of carbon in the form of CO2 could be removed from the atmosphere between 2020 and 2100, corresponding to a reduction by about 260 ppm (Feng et al., 2017). The critical ΩA threshold beyond which secondary CaCO3 precipitation occurs could be higher for other alkaline minerals of interest for OAE, theoretically allowing for higher TA additions. However, it has to be kept in mind that in waters with high sediment load, often found in coastal settings, CaCO3 could precipitate onto mineral particles other than those added to increase TA. This has been observed in river plumes (Wurgaft et al., 2021), on resuspended sediments of the Bahama Banks (Bustos-Serrano et al., 2009), and in the Red Sea following flash flood deposition of resuspended sediments and particles (Wurgaft et al., 2016). Even with minerals allowing for higher TA additions, an ΩA threshold of 5 might be safer to adopt. Atmospheric CO2 removal could be increased if TA were also added to the open ocean, e.g. on ships of opportunity. Here, additions could be much higher as ship movement and rapid mixing within a ship's wake would significantly dilute added TA as opposed to coastal point sources (Caserini et al., 2021; Köhler et al., 2013).
Finally, another option to increase atmospheric CO2 uptake would be to keep the seawater equilibrated with air or CO2-enriched flue gases, during mineral dissolution. Firstly, an ΩA of 3.3 would be reached as opposed to 5 in the +250 µmol kg−1 TA scenario (Table 3), when equilibration occurs during instead of after the dissolution process. Secondly, when reaching an ΩA of 5 with CO2 equilibration, nearly 1000 instead of 250 µmol kg−1 of TA could be added, allowing for almost 4 times the amount of atmospheric CO2 to be removed (this number is highly sensitive to temperature and ranges between ∼ 3 and ∼ 6 between 30 and 5 ∘C). Unfortunately, this requires an extra step, which appears to be far more time-consuming and costly than a simple mineral addition. It should also be kept in mind that for the same ΩA threshold, the amount of TA that can be added will increase at lower temperatures because of higher CO2 solubility and, hence, naturally lower ΩA in colder waters. Based on our ΩA threshold of 5, at a salinity of 35 and at 5 ∘C, about 3 times as much TA can be dissolved than at 30 ∘C.
OAE is a negative-emission technology with large potential for atmospheric CO2 removal (Caserini et al., 2021; Feng et al., 2016; Köhler et al., 2010). In order to maximise CO2 uptake efficiency, secondary CaCO3 precipitation has to be avoided. Here we show that an increase in TA by 500 µmol kg−1 led to aragonite precipitation, reducing the CO2 uptake potential from about 0.8 mol mol−1 of TA added to nearly 0.1 mol. Precipitation most likely occurred on the CaO and Ca(OH)2 mineral surfaces prior to their full dissolution. In contrast, an addition of 250 µmol kg−1 of TA did not result in CaCO3 precipitation, suggesting that an ΩA of about 5 is a safe limit. This is probably the case for other minerals with even lower lattice compatibility for CaCO3 since CaCO3 could precipitate onto naturally present mineral phases in coastal settings, such as resuspended sediments. Safely increasing the amount of TA that could be added to the ocean could be achieved by (1) allowing for major mixing and dilution of enriched seawater by coastal tides or in the wake of ships, (2) equilibrating the seawater to atmospheric CO2 levels prior to the addition during mineral dissolution, and/or (3) targeting low- rather than high-temperature regions.
Table A1Seawater salinity in each experiment and phosphate concentrations in one of the batches.
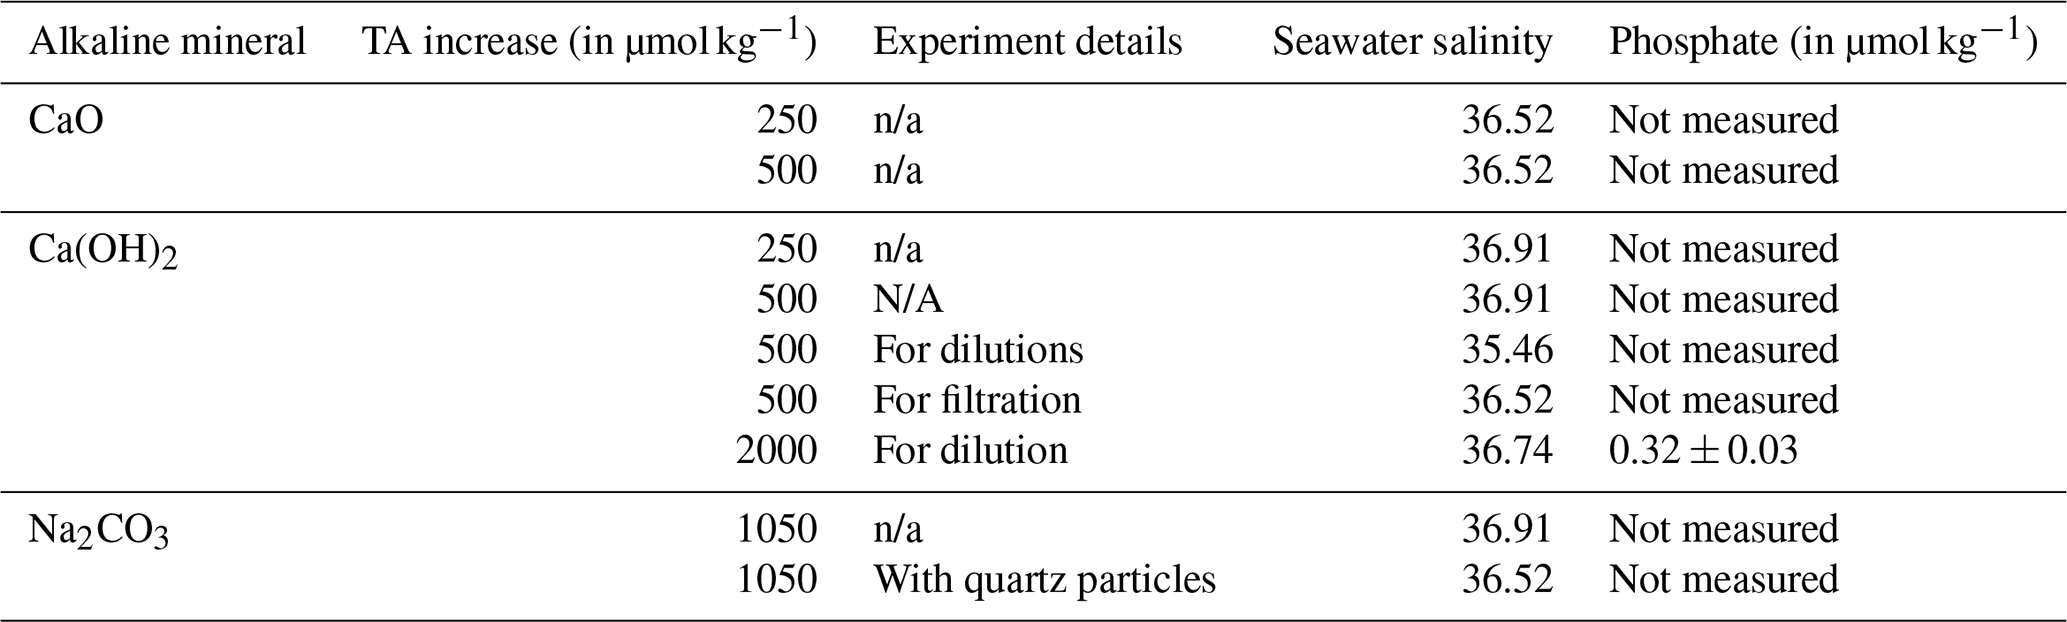
n/a: not applicable.
Table A2Main chemical composition of the CaO and Ca(OH)2 feedstocks used for the TA increase experiments determined by ICP-MS analysis (expressed in mg g−1, with the corresponding standard deviation, SD).
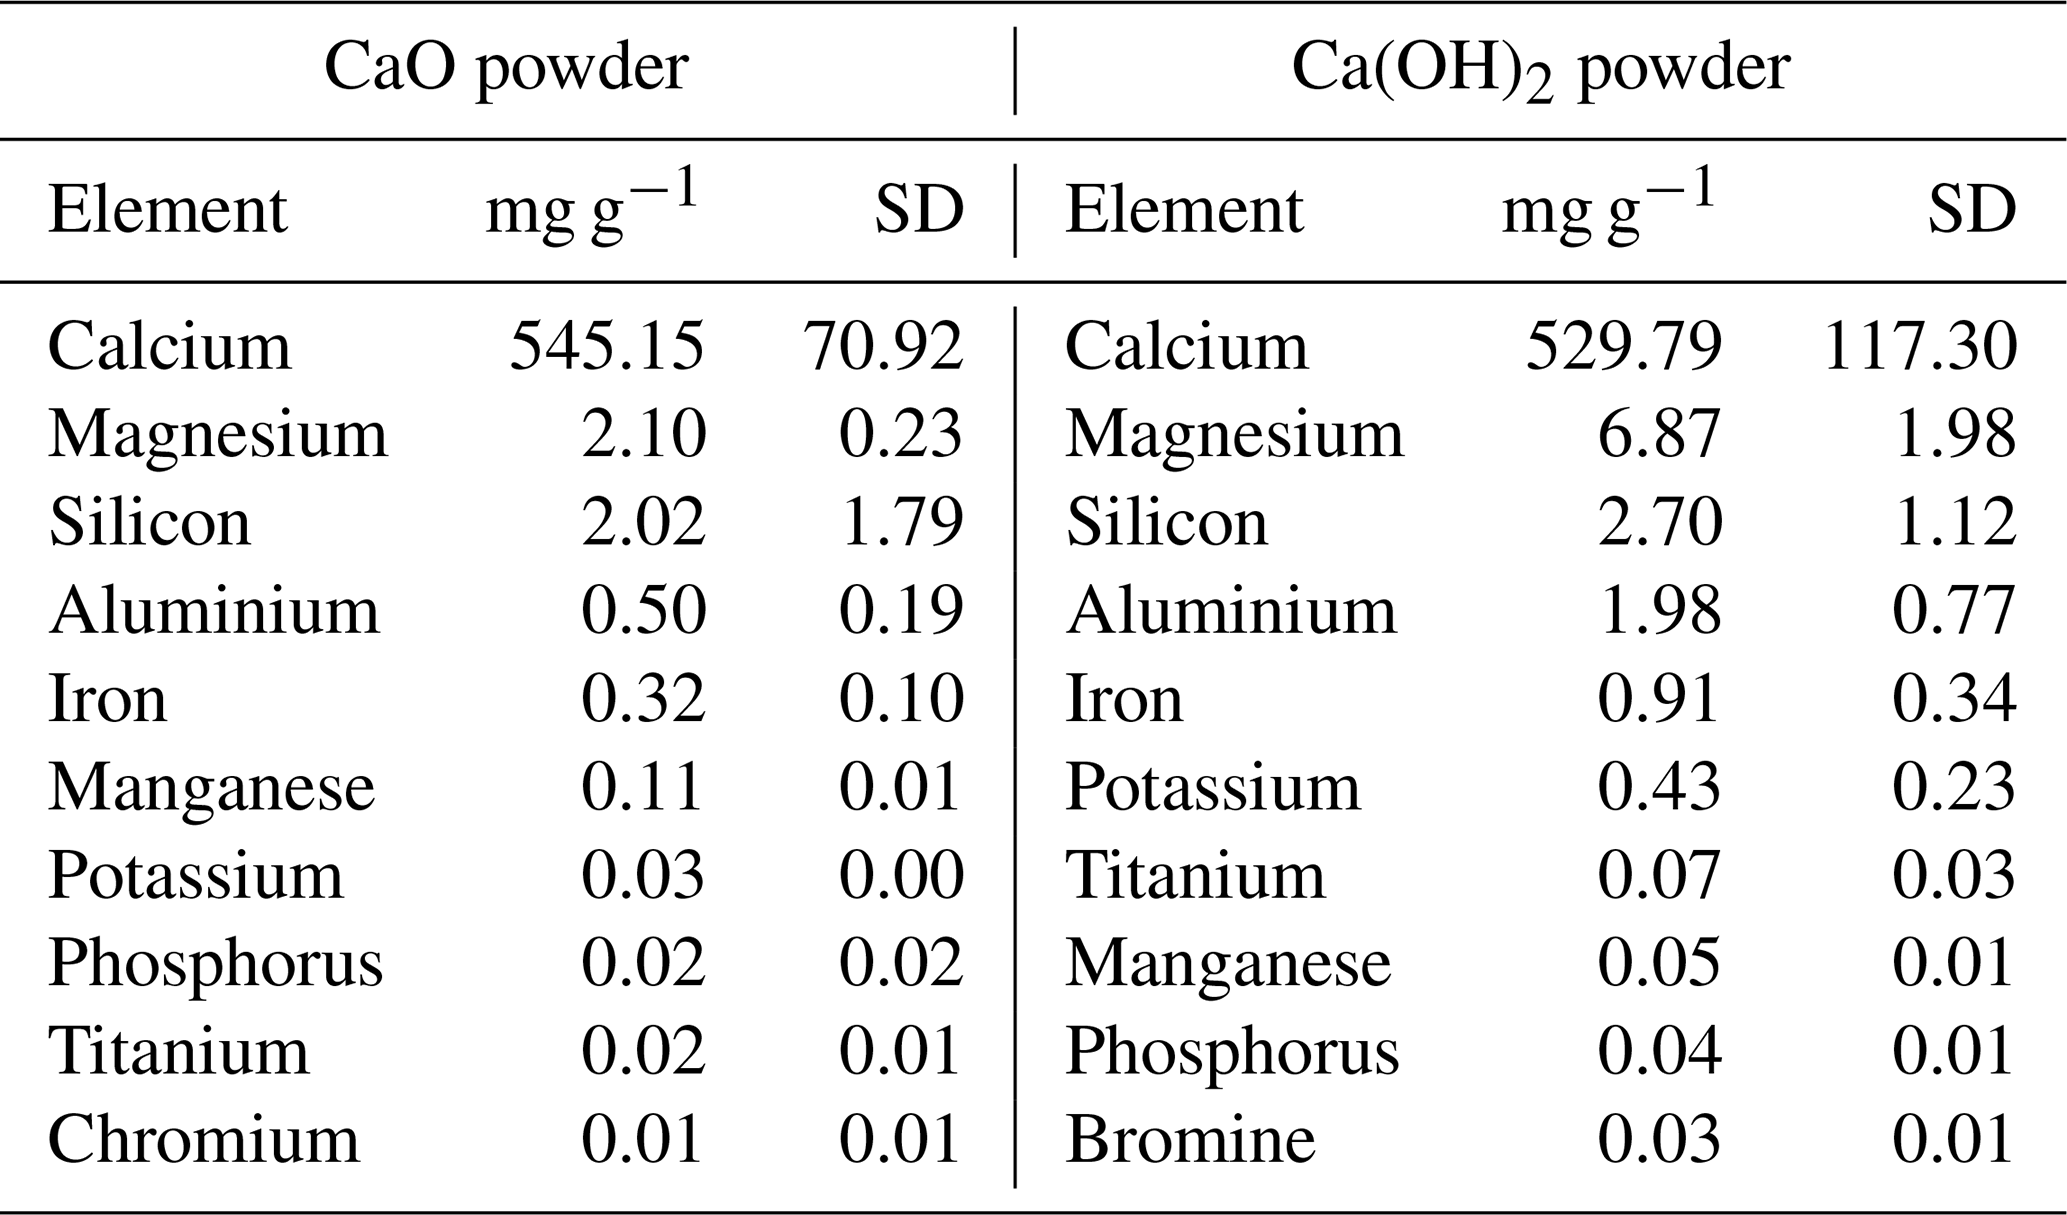

Figure A1Relative contribution of dissolved CO2, HCO and CO to total dissolved inorganic carbon in seawater as a function of pHT (total scale), also known as a Bjerrum plot (based on the carbonic acid equilibrium constant from Mehrbach et al., 1973, and refitted by Dickson and Millero, 1987), at 25 ∘C and a salinity of 35, with the current surface ocean pH average represented by the dashed vertical line (pHT ∼ 8.1).
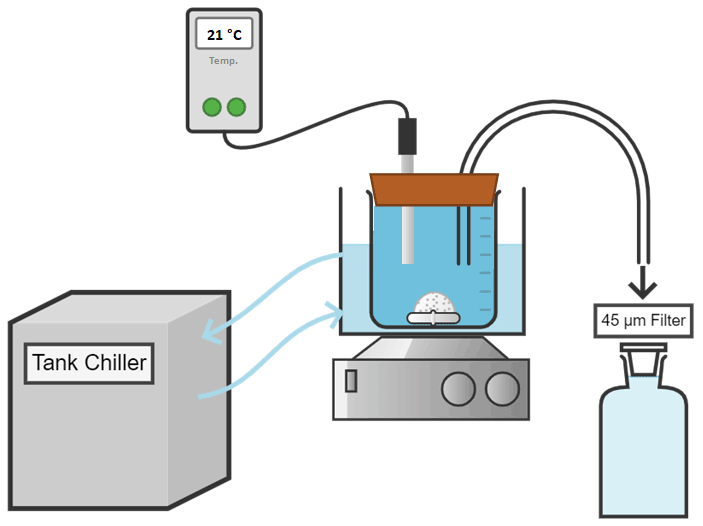
Figure A2Conceptual diagram of the experimental setup used for the dissolution of alkaline minerals.
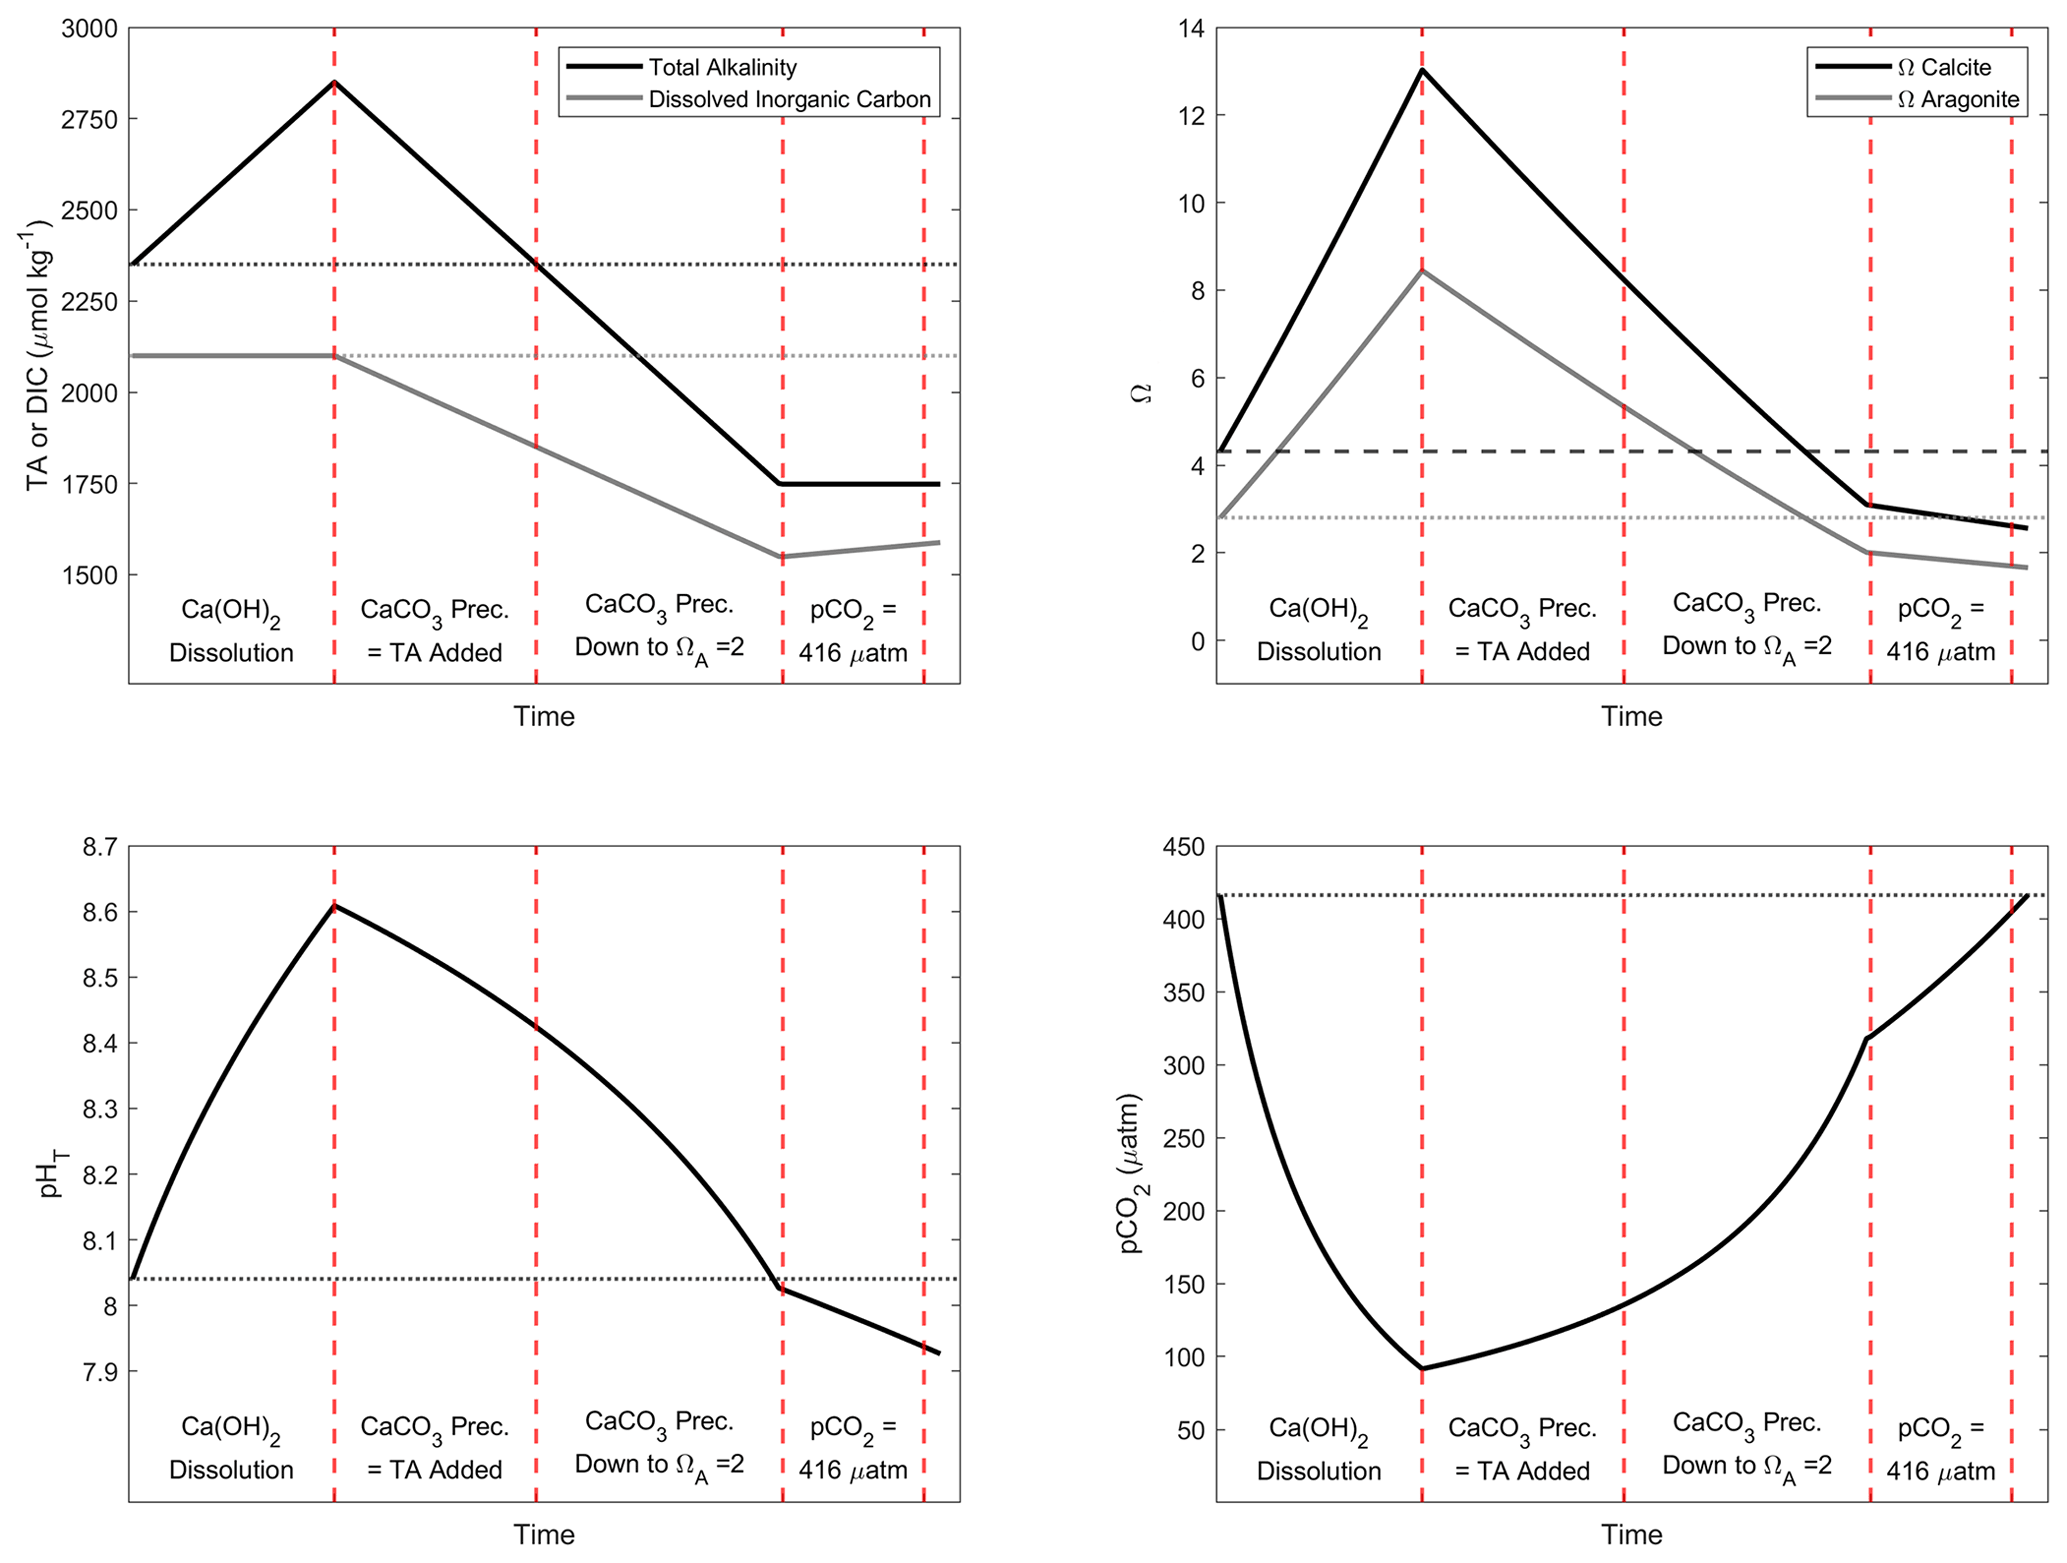
Figure A3Simulation of the changes in TA, DIC, ΩC, ΩA, pCO2 and pHT after addition of 500 µmol kg−1 of alkalinity. Four important steps are presented: first, assuming the complete Ca(OH)2 dissolution without CaCO3 precipitation; second, assuming as much CaCO3 precipitation as the amount of TA added; third, assuming CaCO3 precipitation happening until reaching an ΩA of 2; and fourth, CO2 uptake until equilibrium is reached between atmosphere and seawater at a pCO2 of ∼ 416 µ atm.
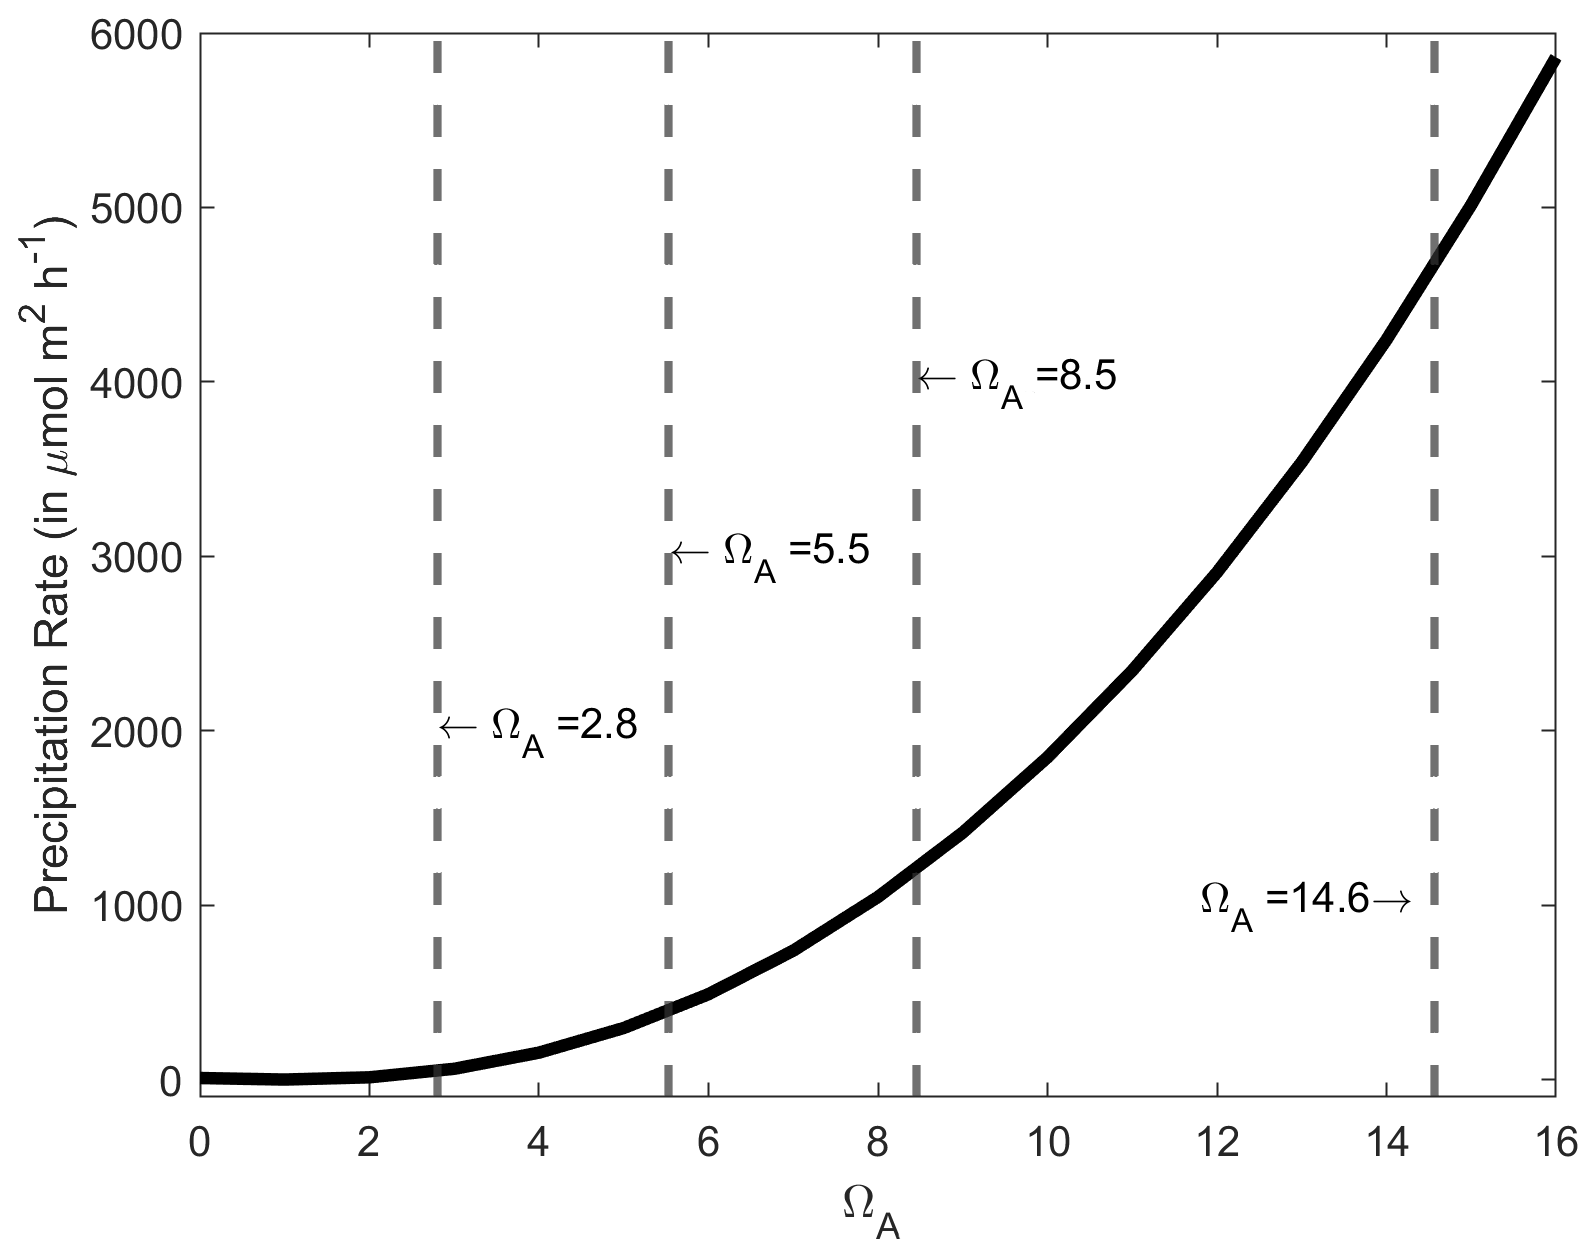
Figure A4CaCO3 precipitation rate onto aragonite seed crystals in µmol m−2 h−1 as a function of ΩA, based on the measurements of Zhong and Mucci (1989) at 25 ∘C and for a salinity of 35. The ΩA values for the starting conditions and following a +250, +500 and +1000 µmol kg−1 TA increase are presented by the dashed grey lines, i.e. 2.8, 5.5, 8.5 and 14.6, respectively.
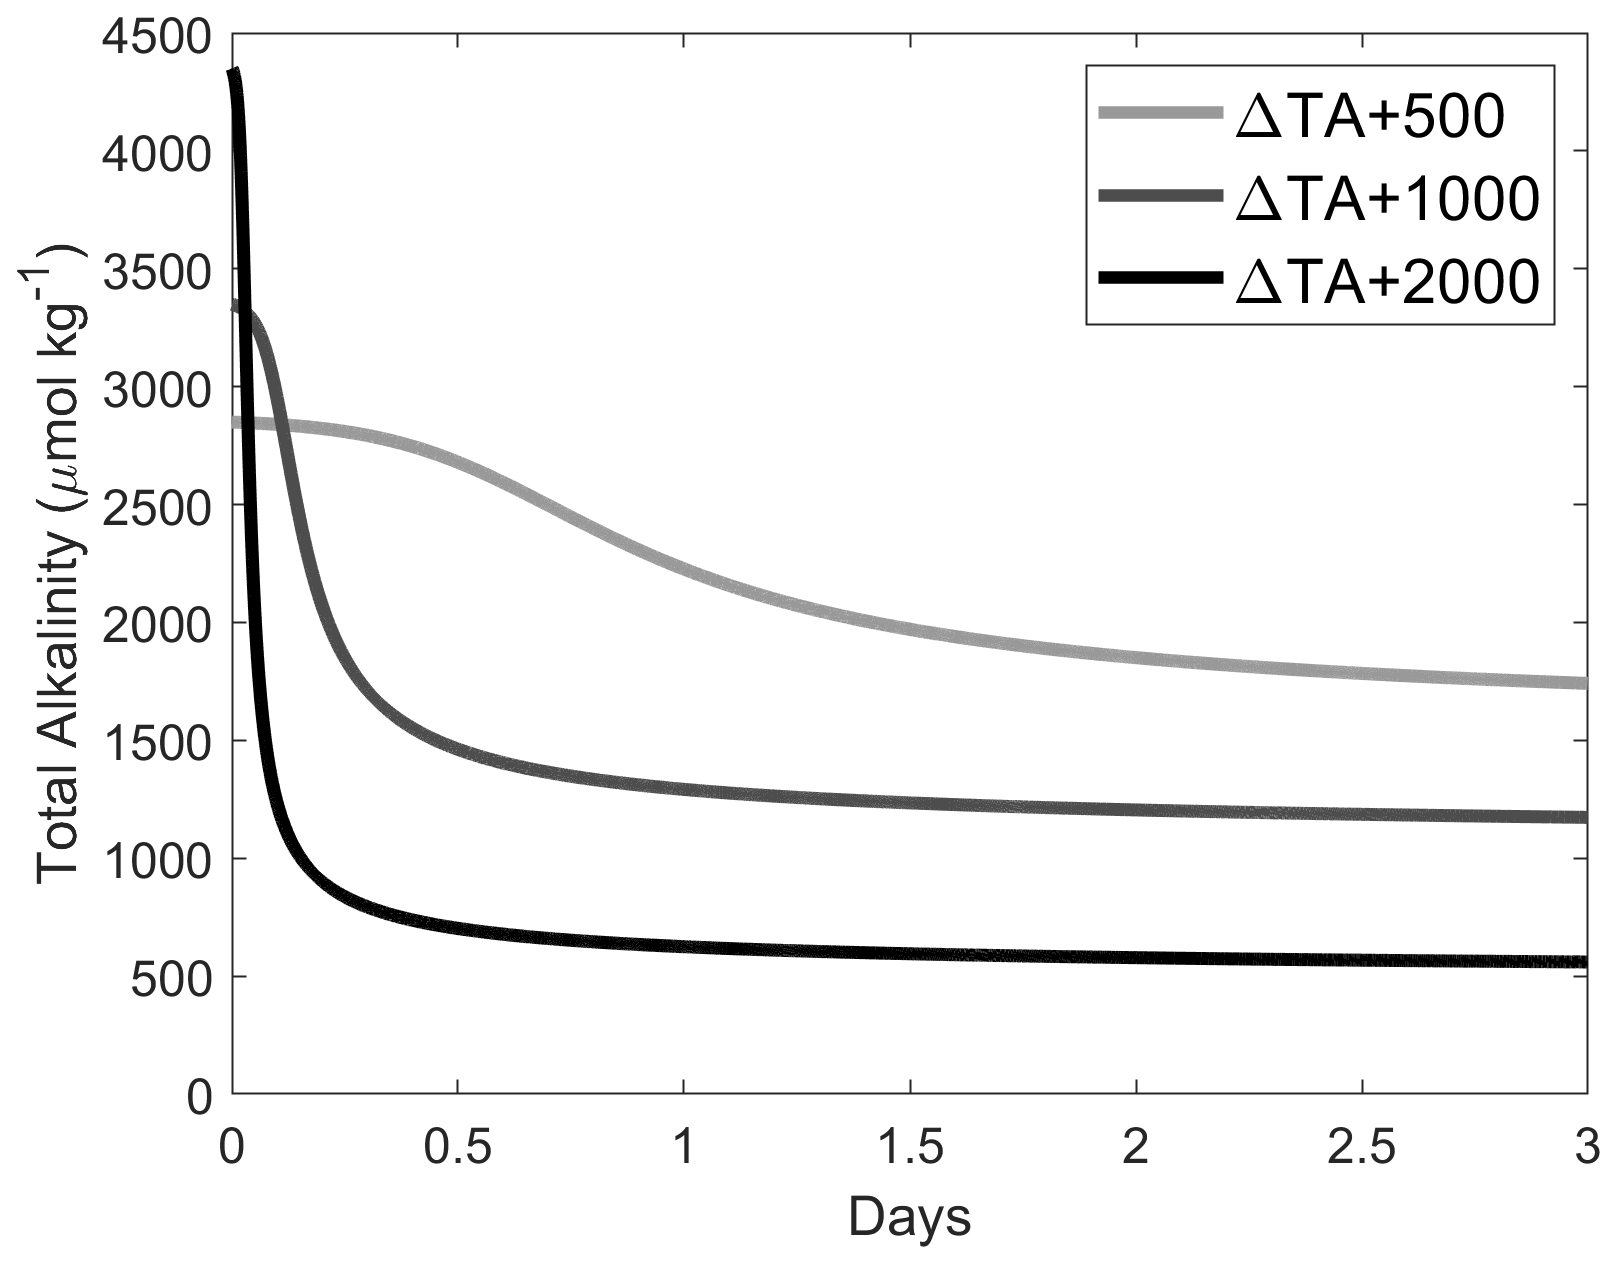
Figure A5Simulations of TA loss due to aragonite precipitation after a TA addition of 500, 1000 and 2000 µmol kg−1, based on ΩA and surface-area-dependent precipitation rates shown in Fig. A4, assuming the initial presence of 2 % of CaCO3 in our samples, i.e. ∼ 0.37, ∼ 0.74 and ∼ 1.48 mg kg−1 for ΔTA + 500, ΔTA + 1000 and ΔTA + 2000 µmol kg−1, respectively. CaCO3 mass was converted to a surface area as described in Zhong and Mucci (1989). The starting conditions were TA = 2300 µmol kg−1, DIC = 2100 µmol kg−1, salinity = 35 and temperature = 21 ∘C.
All data regarding the changes in TA and DIC were collected by Charly A. Moras and were publicly published on the 15 July 2022 by the Australian Ocean Data Network (AODN) under the name “Quick and hydrated lime dissolution for Ocean Alkalinity Enhancement” and can be found at https://doi.org/10.26198/8znv-e436 (Moras, 2022).
CM and KS designed the initial experiments. LB, TC and RJB contributed to designing the follow-up experiments after observing unexpected CaCO3 precipitation. CM and RJB conducted the ICP-MS analyses of the various materials and, with the help of KS and TC, the identification and analyses of CaCO3 using the SEM. CM and KS mainly wrote the paper, with inputs from all co-authors and specific inputs from LB for carbonate chemistry and TC for CaCO3.
At least one of the (co-)authors is a member of the editorial board of Biogeosciences. The peer-review process was guided by an independent editor, and the authors also have no other competing interests to declare.
Publisher’s note: Copernicus Publications remains neutral with regard to jurisdictional claims in published maps and institutional affiliations.
We would like to thank Marian Bailey for her help with ICP-MS sample preparation, as well as Nick Ward for his help with preliminary X-ray diffraction analyses of the calcium powders. We are also thankful to Matheus Carvalho de Carvalho for the particulate carbon analyses and Nadia Toppler for her help arranging the use of the SEM.
This research is part of the PhD project of Charly A. Moras that is funded by a Cat. 5 – SCU Grad School scholarship from the Southern Cross University, Lismore, Australia. The ICP-MS analyses were made possible by Australian Research Council grants to Renaud Joannes-Boyau and Kai G. Schulz (grant no. LE200100022) and to Renaud Joannes-Boyau (grant no. LE120100201).
This paper was edited by Jean-Pierre Gattuso and reviewed by Daniel Burt and one anonymous referee.
Bach, L. T., Gill, S., Rickaby, R., Gore, S., and Renforth, P.: CO2 removal with enhanced weathering and ocean alkalinity enhancement: Potential risks and co-benefits for marine pelagic ecosystems, Front. Clim., 1, 7, https://doi.org/10.3389/fclim.2019.00007, 2019.
Bates, N. R., Best, M. H. P., Neely, K., Garley, R., Dickson, A. G., and Johnson, R. J.: Detecting anthropogenic carbon dioxide uptake and ocean acidification in the North Atlantic Ocean, Biogeosciences, 9, 2509–2522, https://doi.org/10.5194/bg-9-2509-2012, 2012.
Burt, D. J., Fröb, F., and Ilyina, T.: The sensitivity of the marine carbonate system to regional ocean alkalinity enhancement, Front. Clim., 3, 624075, https://doi.org/10.3389/fclim.2021.624075, 2021.
Bustos-Serrano, H., Morse, J. W., and Millero, F. J.: The formation of whitings on the Little Bahama Bank, Mar. Chem., 113, 1–8, 2009.
Canadell, J. G., Le Quéré, C., Raupach, M. R., Field, C. B., Buitenhuis, E. T., Ciais, P., Conway, T. J., Gillett, N. P., Houghton, R., and Marland, G.: Contributions to accelerating atmospheric CO2 growth from economic activity, carbon intensity, and efficiency of natural sinks, P. Natl. Acad. Sci. USA, 104, 18866–18870, 2007.
Carter, B. R., Feely, R. A., Wanninkhof, R., Kouketsu, S., Sonnerup, R. E., Pardo, P. C., Sabine, C. L., Johnson, G. C., Sloyan, B. M., and Murata, A.: Pacific anthropogenic carbon between 1991 and 2017, Global Biogeochem. Cy., 33, 597–617, 2019.
Caserini, S., Pagano, D., Campo, F., Abbà, A., De Marco, S., Righi, D., Renforth, P., and Grosso, M.: Potential of Maritime Transport for Ocean Liming and Atmospheric CO2 Removal, Frontiers in Climate, 3, 575900, https://doi.org/10.3389/fclim.2021.575900, 2021.
Chang, R., Kim, S., Lee, S., Choi, S., Kim, M., and Park, Y.: Calcium carbonate precipitation for CO2 storage and utilization: a review of the carbonate crystallization and polymorphism, Frontiers in Energy Research, 5, 17, https://doi.org/10.3389/fenrg.2017.00017, 2017.
Chave, K. E. and Suess, E.: Calcium Carbonate Saturation in Seawater: Effects of Dissolved Organic Matter 1, Limnol. Oceanogr., 15, 633–637, 1970.
Chen, T., Neville, A., and Yuan, M.: Calcium carbonate scale formation – assessing the initial stages of precipitation and deposition, J. Petrol. Sci. Eng., 46, 185–194, 2005.
Cyronak, T., Schulz, K. G., Santos, I. R., and Eyre, B. D.: Enhanced acidification of global coral reefs driven by regional biogeochemical feedbacks, Geophys. Res. Lett., 41, 5538–5546, 2014.
De Choudens-Sanchez, V. and Gonzalez, L. A.: Calcite and aragonite precipitation under controlled instantaneous supersaturation: elucidating the role of CaCO3 saturation state and ratio on calcium carbonate polymorphism, J. Sediment. Res., 79, 363–376, 2009.
Dickson, A. G.: Standards for ocean measurements, Oceanography, 23, 34–47, 2010.
Dickson, A. G. and Millero, F. J.: A comparison of the equilibrium constants for the dissociation of carbonic acid in seawater media, Deep-Sea Res., 34, 1733–1743, 1987.
Dickson, A. G., Sabine, C. L., and Christian, J. R.: Guide to best practices for ocean CO2 measurements, PICES Special Publication 3, IOCCP Report 8, Sidney, British Columbia, North Pacific Marine Science Organization, 191 pp., https://doi.org/10.25607/OBP-1342, 2007.
Doney, S. C., Fabry, V. J., Feely, R. A., and Kleypas, J. A.: Ocean acidification: the other CO2 problem, Annual Rev. Mar. Sci., 1, 169–192, 2009.
Feng, E. Y., Keller, D. P., Koeve, W., and Oschlies, A.: Could artificial ocean alkalinization protect tropical coral ecosystems from ocean acidification?, Environ. Res. Lett., 11, 074008, https://doi.org/10.1088/1748-9326/11/7/074008, 2016.
Feng, E. Y., Koeve, W., Keller, D. P., and Oschlies, A.: Model-Based Assessment of the CO2 Sequestration Potential of Coastal Ocean Alkalinization, Earth's Future, 5, 1252–1266, 2017.
Friedlingstein, P., Jones, M. W., O'Sullivan, M., Andrew, R. M., Bakker, D. C. E., Hauck, J., Le Quéré, C., Peters, G. P., Peters, W., Pongratz, J., Sitch, S., Canadell, J. G., Ciais, P., Jackson, R. B., Alin, S. R., Anthoni, P., Bates, N. R., Becker, M., Bellouin, N., Bopp, L., Chau, T. T. T., Chevallier, F., Chini, L. P., Cronin, M., Currie, K. I., Decharme, B., Djeutchouang, L. M., Dou, X., Evans, W., Feely, R. A., Feng, L., Gasser, T., Gilfillan, D., Gkritzalis, T., Grassi, G., Gregor, L., Gruber, N., Gürses, Ö., Harris, I., Houghton, R. A., Hurtt, G. C., Iida, Y., Ilyina, T., Luijkx, I. T., Jain, A., Jones, S. D., Kato, E., Kennedy, D., Klein Goldewijk, K., Knauer, J., Korsbakken, J. I., Körtzinger, A., Landschützer, P., Lauvset, S. K., Lefèvre, N., Lienert, S., Liu, J., Marland, G., McGuire, P. C., Melton, J. R., Munro, D. R., Nabel, J. E. M. S., Nakaoka, S.-I., Niwa, Y., Ono, T., Pierrot, D., Poulter, B., Rehder, G., Resplandy, L., Robertson, E., Rödenbeck, C., Rosan, T. M., Schwinger, J., Schwingshackl, C., Séférian, R., Sutton, A. J., Sweeney, C., Tanhua, T., Tans, P. P., Tian, H., Tilbrook, B., Tubiello, F., van der Werf, G. R., Vuichard, N., Wada, C., Wanninkhof, R., Watson, A. J., Willis, D., Wiltshire, A. J., Yuan, W., Yue, C., Yue, X., Zaehle, S., and Zeng, J.: Global Carbon Budget 2021, Earth Syst. Sci. Data, 14, 1917–2005, https://doi.org/10.5194/essd-14-1917-2022, 2022.
Gafar, N. A. and Schulz, K. G.: A three-dimensional niche comparison of Emiliania huxleyi and Gephyrocapsa oceanica: reconciling observations with projections, Biogeosciences, 15, 3541–3560, https://doi.org/10.5194/bg-15-3541-2018, 2018.
Gattuso, J.-P., Magnan, A., Billé, R., Cheung, W. W., Howes, E. L., Joos, F., Allemand, D., Bopp, L., Cooley, S. R., and Eakin, C. M.: Contrasting futures for ocean and society from different anthropogenic CO2 emissions scenarios, Science, 349, aac4722, https://doi.org/10.1126/science.aac4722, 2015.
GESAMP: High level review of a wide range of proposed marine geoengineering techniques, edited by: Boyd, P. W. and Vivian, C. M. G., IMO/FAO/UNESCO-IOC/UNIDO/WMO/IAEA/UN/UN Environment/UNDP/ISA Joint Group of Experts on the Scientific Aspects of Marine Environmental Protection, GESAMP, Rep. Stud. GESAMP No. 98, 144, 1020–4873, 2019.
González, M. F. and Ilyina, T.: Impacts of artificial ocean alkalinization on the carbon cycle and climate in Earth system simulations, Geophys. Res. Lett., 43, 6493–6502, 2016.
Goodwin, P., Brown, S., Haigh, I. D., Nicholls, R. J., and Matter, J. M.: Adjusting mitigation pathways to stabilize climate at 1.5 ∘C and 2.0 ∘C rise in global temperatures to year 2300, Earth's Future, 6, 601–615, 2018.
Harvey, L.: Mitigating the atmospheric CO2 increase and ocean acidification by adding limestone powder to upwelling regions, J. Geophys. Res.-Oceans, 113, C04028, https://doi.org/10.1029/2007JC004373, 2008.
Hoegh-Guldberg, O., Mumby, P. J., Hooten, A. J., Steneck, R. S., Greenfield, P., Gomez, E., Harvell, C. D., Sale, P. F., Edwards, A. J., and Caldeira, K.: Coral reefs under rapid climate change and ocean acidification, Science, 318, 1737–1742, 2007.
Hoegh-Guldberg, O., Jacob, D., Taylor, M., Bolaños, T. G., Bindi, M., Brown, S., Camilloni, I., Diedhiou, A., Djalante, R., and Ebi, K.: The human imperative of stabilizing global climate change at 1.5 ∘C, Science, 365, eaaw6974, https://doi.org/10.1126/science.aaw6974, 2019.
Huppmann, D., Kriegler, E., Krey, V., Riahi, K., Rogelj, J., Rose, S. K., Weyant, J., Bauer, N., Bertram, C., and Bosetti, V.: IAMC 1.5 ∘C Scenario Explorer and Data hosted by IIASA, International Institute for Applied Systems Analysis & Integrated Assessment Modeling Consortium, https://doi.org/10.22022/SR15/08-2018.15429, 2018.
Ilyina, T., Wolf-Gladrow, D., Munhoven, G., and Heinze, C.: Assessing the potential of calcium-based artificial ocean alkalinization to mitigate rising atmospheric CO2 and ocean acidification, Geophys. Res. Lett., 40, 5909–5914, 2013.
IPCC: Summary for Policymakers, in: Climate Change 2021: The Physical Science Basis. Contribution of Working Group I to the Sixth Assessment Report of the Intergovernmental Panel on Climate Change, edited by: Masson-Delmotte, V., Zhai, P., Pirani, A., Connors, S. L., Péan, C., Berger, S., Caud, N., Chen, L., Goldfarb, M. I., Gomis, M., Huang, K., Leitzell, E., Lonnoy, J. B. R., Matthews, Y., Maycock, T. K., Waterfield, T., Yelekçi, O., Yu, R., and Zhou, B., Cambridge University Press, Cambridge University Press, Cambridge, United Kingdom and New York, NY, USA, 3−-32, https://www.ipcc.ch/report/ar6/wg1/downloads/report/IPCC_AR6_WGI_SPM.pdf, https://doi.org/10.1017/9781009157896.001, 2021.
Keller, D. P., Feng, E. Y., and Oschlies, A.: Potential climate engineering effectiveness and side effects during a high carbon dioxide-emission scenario, Nat. Commun., 5, 1–11, 2014.
Kheshgi, H. S.: Sequestering atmospheric carbon dioxide by increasing ocean alkalinity, Energy, 20, 915–922, 1995.
Köhler, P., Hartmann, J., and Wolf-Gladrow, D. A.: Geoengineering potential of artificially enhanced silicate weathering of olivine, P. Natl. Acad. Sci. USA, 107, 20228–20233, 2010.
Köhler, P., Abrams, J. F., Völker, C., Hauck, J., and Wolf-Gladrow, D. A.: Geoengineering impact of open ocean dissolution of olivine on atmospheric CO2, surface ocean pH and marine biology, Environ. Res. Lett., 8, 014009, https://doi.org/10.1088/1748-9326/8/1/014009, 2013.
Lenton, T. M. and Vaughan, N. E.: The radiative forcing potential of different climate geoengineering options, Atmos. Chem. Phys., 9, 5539–5561, https://doi.org/10.5194/acp-9-5539-2009, 2009.
Lenton, A., Matear, R. J., Keller, D. P., Scott, V., and Vaughan, N. E.: Assessing carbon dioxide removal through global and regional ocean alkalinization under high and low emission pathways, Earth Syst. Dynam., 9, 339–357, https://doi.org/10.5194/esd-9-339-2018, 2018.
Lewis, E. and Perkin, R.: The practical salinity scale 1978: conversion of existing data, Deep-Sea Res., 28, 307–328, 1981.
Lioliou, M. G., Paraskeva, C. A., Koutsoukos, P. G., and Payatakes, A. C.: Heterogeneous nucleation and growth of calcium carbonate on calcite and quartz, J. Colloid Interf. Sci., 308, 421–428, 2007.
Lueker, T. J., Dickson, A. G., and Keeling, C. D.: Ocean pCO2 calculated from dissolved inorganic carbon, alkalinity, and equations for K1 and K2: validation based on laboratory measurements of CO2 in gas and seawater at equilibrium, Mar. Chem., 70, 105–119, 2000.
Marion, G. M., Millero, F. J., and Feistel, R.: Precipitation of solid phase calcium carbonates and their effect on application of seawater models, Ocean Sci., 5, 285–291, https://doi.org/10.5194/os-5-285-2009, 2009.
Mehrbach, C., Culberson, C., Hawley, J., and Pytkowicx, R.: Measurement of the apparent dissociation constants of carbonic acid in seawater at atmospheric pressure 1, Limnol. Oceanogr., 18, 897–907, 1973.
Millero, F., Huang, F., Zhu, X., Liu, X., and Zhang, J.-Z.: Adsorption and desorption of phosphate on calcite and aragonite in seawater, Aquat. Geochem., 7, 33–56, 2001.
Mongin, M., Baird, M. E., Lenton, A., Neill, C., and Akl, J.: Reversing ocean acidification along the Great Barrier Reef using alkalinity injection, Environ. Res. Lett., 16, 064068, https://doi.org/10.1088/1748-9326/ac002d, 2021.
Montserrat, F., Renforth, P., Hartmann, J., Leermakers, M., Knops, P., and Meysman, F. J.: Olivine dissolution in seawater: implications for CO2 sequestration through enhanced weathering in coastal environments, Environ. Sci. Technol., 51, 3960–3972, 2017.
Moras, C. A.: Quick and hydrated lime dissolution for Ocean Alkalinity Enhancement, Australian Ocean Data Network [data set], https://doi.org/10.26198/8znv-e436, 2022.
Morse, J. W. and He, S.: Influences of T, S and pCO2 on the pseudo-homogeneous precipitation of CaCO3 from seawater: implications for whiting formation, Mar. Chem., 41, 291–297, 1993.
Morse, J. W., Wang, Q., and Tsio, M. Y.: Influences of temperature and Mg: Ca ratio on CaCO3 precipitates from seawater, Geology, 25, 85–87, 1997.
Morse, J. W., Gledhill, D. K., and Millero, F. J.: CaCO3 precipitation kinetics in waters from the great Bahama bank: Implications for the relationship between bank hydrochemistry and whitings, Geochim. Cosmochim. Ac., 67, 2819–2826, 2003.
Morse, J. W., Arvidson, R. S., and Lüttge, A.: Calcium carbonate formation and dissolution, Chem. Rev., 107, 342–381, 2007.
Mucci, A.: The solubility of calcite and aragonite in seawater at various salinities, temperatures, and one atmosphere total pressure, Am. J. Sci., 283, 780–799, 1983.
National Academies of Sciences, Engineering, and Medicine: A Research Strategy for Ocean-based Carbon Dioxide Removal and Sequestration, The National Academies Press, Washington, DC, 322 pp., https://doi.org/10.17226/26278, 2022.
Ni, M. and Ratner, B. D.: Differentiating calcium carbonate polymorphs by surface analysis techniques – an XPS and TOF-SIMS study, Surf. Interface Anal., 40, 1356–1361, 2008.
Pan, Y., Li, Y., Ma, Q., He, H., Wang, S., Sun, Z., Cai, W.-J., Dong, B., Di, Y., and Fu, W.: The role of Mg2+ in inhibiting CaCO3 precipitation from seawater, Mar. Chem., 237, 104036, https://doi.org/10.1016/j.marchem.2021.104036, 2021.
Pytkowicz, R. M.: Rates of inorganic calcium carbonate nucleation, The Journal of Geology, 73, 196–199, 1965.
Renforth, P. and Henderson, G.: Assessing ocean alkalinity for carbon sequestration, Rev. Geophys., 55, 636–674, 2017.
Renforth, P. and Kruger, T.: Coupling mineral carbonation and ocean liming, Energ. Fuel., 27, 4199–4207, 2013.
Renforth, P., Jenkins, B., and Kruger, T.: Engineering challenges of ocean liming, Energy, 60, 442–452, 2013.
Riebesell, U., Fabry, V. J., Hansson, L., and Gattuso, J.-P.: Guide to best practices for ocean acidification research and data reporting, Office for Official Publications of the European Communities, Luxembourg, 258 pp., https://doi.org/10.2777/66906, 2011.
Riley, J. and Tongudai, M.: The major cation/chlorinity ratios in sea water, Chem. Geol., 2, 263–269, 1967.
Rushdi, A., Pytkowicz, R., Suess, E., and Chen, C.: The effects of magnesium-to-calcium ratios in artificial seawater, at different ionic products, upon the induction time, and the mineralogy of calcium carbonate: a laboratory study, Geol. Rundsch., 81, 571–578, 1992.
Schulz, K. G., Bach, L. T., Bellerby, R. G., Bermúdez, R., Büdenbender, J., Boxhammer, T., Czerny, J., Engel, A., Ludwig, A., and Meyerhöfer, M.: Phytoplankton blooms at increasing levels of atmospheric carbon dioxide: experimental evidence for negative effects on prymnesiophytes and positive on small picoeukaryotes, Frontiers in Marine Science, 4, https://doi.org/10.3389/fmars.2017.00064, 2017.
Sharp, J. D., Pierrot, D., Humphreys, M. P., Epitalon, J.-M., Orr, J. C., Lewis, E. R., and Wallace, D. W. R.: CO2SYSv3 for MATLAB (Version v3.2.0), Zenodo, https://doi.org/10.5281/zenodo.3950562, 2021.
Simkiss, K.: The inhibitory effects of some metabolites on the precipitation of calcium carbonate from artificial and natural sea water, ICES J. Mar. Sci., 29, 6–18, 1964.
Statista: Global cement industry – Statistics & Facts, https://www.statista.com/topics/8700/cement-industry-worldwide/ (last access: 28 March 2022), 2021.
Tang, H., Wu, X., Xian, H., Zhu, J., Wei, J., Liu, H., and He, H.: Heterogeneous Nucleation and Growth of CaCO3 on Calcite (104) and Aragonite (110) Surfaces: Implications for the Formation of Abiogenic Carbonate Cements in the Ocean, Minerals, 10, 294, https://doi.org/10.3390/min10040294, 2020.
The Royal Society and Royal Academy of Engineering: Greenhouse Gas Removal, https://royalsociety.org/-/media/policy/projects/greenhouse-gas-removal/royal-society-greenhouse-gas-removal-report-2018.pdf (last access: 7 May 2022), 2018.
Uppstrom, L.: The boron/chlorinity ratio of deep-sea water from the Pacific Ocean, Deep-Sea Res., 21, 161–162, 1974.
Wolf-Gladrow, D. A., Zeebe, R. E., Klaas, C., Körtzinger, A., and Dickson, A. G.: Total alkalinity: The explicit conservative expression and its application to biogeochemical processes, Mar. Chem., 106, 287–300, 2007.
Wolf, S. E., Leiterer, J., Kappl, M., Emmerling, F., and Tremel, W.: Early homogenous amorphous precursor stages of calcium carbonate and subsequent crystal growth in levitated droplets, J. Am. Chem. Soc., 130, 12342–12347, 2008.
Wurgaft, E., Steiner, Z., Luz, B., and Lazar, B.: Evidence for inorganic precipitation of CaCO3 on suspended solids in the open water of the Red Sea, Mar. Chem., 186, 145–155, 2016.
Wurgaft, E., Wang, Z., Churchill, J., Dellapenna, T., Song, S., Du, J., Ringham, M., Rivlin, T., and Lazar, B.: Particle triggered reactions as an important mechanism of alkalinity and inorganic carbon removal in river plumes, Geophys. Res. Lett., 48, e2021GL093178, https://doi.org/10.1029/2021GL093178, 2021.
Zeebe, R. E. and Wolf-Gladrow, D.: CO2 in seawater: equilibrium, kinetics, isotopes, 65, Gulf Professional Publishing, 360 pp, ISBN 9780444509468, 2001.
Zhong, S. and Mucci, A.: Calcite and aragonite precipitation from seawater solutions of various salinities: Precipitation rates and overgrowth compositions, Chem. Geol., 78, 283–299, 1989.