the Creative Commons Attribution 4.0 License.
the Creative Commons Attribution 4.0 License.
 | 12 Oct 2022
Modeling nitrous oxide emissions from agricultural soil incubation experiments using CoupModel
Wenxin Zhang
Per-Erik Jansson
Søren O. Petersen
Efforts to develop effective climate mitigation strategies for agriculture require methods to estimate nitrous oxide (N2O) emissions from soil. Process-based biogeochemical models have been often used for field- and large-scale estimates, while the sensitivity and uncertainty of model applications to incubation experiments are less investigated. In this study, a process-oriented model (CoupModel) was used to simulate N2O and CO2 fluxes and soil mineral nitrogen (N) contents in a short-term (43 d) factorial incubation experiment (16 treatments). A global sensitivity analysis (GSA) approach, “Morris screening”, was applied to quantify parameter sensitivity. The GSA suggested that a higher number of sensitive parameters was associated with N2O flux estimates and that inter-treatment variations in parameter sensitivities were distinguished by soil moisture levels or NO content and residue types. Important parameters regarding N2O flux estimates were linked to the decomposability of soil organic matter (e.g., organic C pool sizes) and the denitrification process (e.g., Michaelis constant and denitrifier respiratory rates). After calibration, the model better captured temporal variations and magnitude of gas fluxes and mineral N in unamended soils than in residue-amended soils. Low-magnitude daily and cumulative N2O fluxes were well simulated with mean errors (MEs) close to zero, but the model tended to underestimate N2O fluxes, as observed daily values increased by over 0.1 g N m−2 d−1, in which the major mismatch was due to limited success of the model to describe the high emissions during the first few days after crop residue addition. A larger uncertainty was also seen in the magnitude of pulse emissions by the posterior simulations. We also evaluated ancillary variables regarding N cycling, which indicated that more frequent measurements and additional types of observed data such as soil oxygen content and the microbial sources of emitted N2O are required to further evaluate model performance and biases. The major challenges for calibration were associated with high sensitivities of denitrification parameters to initial soil abiotic conditions and the instantaneous residue amendment. Model structure uncertainties and improved modeling practices in the context of incubation experiments were discussed.
- Article
(2873 KB) - Full-text XML
-
Supplement
(2125 KB) - BibTeX
- EndNote


The potent greenhouse gas nitrous oxide (N2O) has been estimated to be responsible for about 7 % of the overall global radiative forcing by long-lived greenhouse gases (World Meteorological Organization, 2021). N2O emissions from the agricultural sector account for 60 %–70 % of the total anthropogenic emissions of this gas (Davidson and Kanter, 2014; Syakila and Kroeze, 2011). However, it is persistently difficult to reduce the uncertainties of N2O emission estimates, and one reason is associated with the high spatiotemporal variability in N2O (Kravchenko et al., 2017). To provide a scientific basis for developing achievable climate mitigation strategies, an improved understanding of N2O production in agricultural soils and quantification of N2O emissions are urgently needed.
N2O emissions from agricultural soils are driven by a suite of microbiological processes, among which nitrification and denitrification predominate as sources of N2O (Butterbach-Bahl et al., 2013). The factors directly regulating nitrification and denitrification activity are the availability of mineral nitrogen (N), oxygen, and degradable carbon (C) sources used by denitrifying organisms (Wijler and Delwiche, 1954). Indirect controls include soil temperature, moisture, pH, and soil texture. During nitrification, when ammonia (NH3, at equilibrium with ammonium NH) is oxidized to nitrate (NO), a small proportion of N may be lost as N2O (Firestone and Davidson, 1989). Nitrification mainly occurs in well-aerated soils with moderate water content (Goreau et al., 1980; Li et al., 1992; Parton et al., 1996). In contrast, denitrification is a microbial process that occurs under anaerobic conditions in which NO is reduced to gaseous N. Soil C substrates are electron donors for denitrification, but they are also a sink for oxygen that can lead to anaerobic microsites (Parkin, 1987) where NO is used as an electron acceptor for microbial respiration. Nitrifying and denitrifying bacteria are most active in producing N2O in environments with abundant N relative to assimilatory demands by other microorganisms or plants (Firestone and Davidson, 1989), as is often the case following soil amendment of fertilizers, manure, or crop residues.
Farming practices influence the interactions between microbial, physical, and chemical processes in the soil, and the uncertainties associated with predicting N2O emissions from agricultural soils amended with plant residues such as cover crops or green manure can be particularly high. The incorporation of crop residues can reduce NH3 losses and enhance degradation compared to leaving residues at the soil surface, but at the same time the N input, elevated water holding capacity, and high local oxygen demand of residues may stimulate the development of anaerobic microsites and bacterial denitrification activity (Kravchenko et al., 2018; Kuzyakov and Blagodatskaya, 2015). Also, mechanical disturbances caused by tillage may influence soil properties (e.g., porosity, aggregate size distribution, solute and gas diffusivities) and microbial enzyme activities associated with N2O emissions (Grandy and Robertson, 2006).
The quantification of N2O emissions from agroecosystems based on field experiments often meets challenges associated with logistics, data gaps, and long-term resource support (e.g., man power, equipment, and research budget). Process-oriented biogeochemical models, e.g., DNDC (Li et al., 1992), DayCent (Parton et al., 1996), APSIM (Keating et al., 2003), and CoupModel (Jansson and Moon, 2001), can be a complementary approach to quantify N2O emission, partly addressing the above-mentioned challenges. When applying process-based models, available in situ measurements can be used to infer model parameters and allow simulation of soil N transformations and N2O emissions on temporal and spatial scales beyond the monitoring sites, but accurately simulating the magnitude of and temporal variability in N2O fluxes under contrasting field conditions remains a challenge. While models provide reasonable estimates of annual N2O emissions, they become less successful at finer time resolution (e.g., diurnal time steps), and this represents a barrier to evaluating the effects of agricultural land use and management on greenhouse gas emissions (Brilli et al., 2017). Such model errors are often attributed to physical and biogeochemical processes being inadequately represented, suggesting there is a need to improve process descriptions beyond parameter optimization (Abdalla et al., 2010; Brilli et al., 2017; Gaillard et al., 2018; Uzoma et al., 2015).
Process-based models attempt to reproduce the most relevant physical and biogeochemical processes through understanding grounded in the best available knowledge. CoupModel, used in the current investigation, has a high level of detail on the interaction between biotic and abiotic processes and has adopted submodules of nitrification, denitrification, and gas transport from the model DNDC (Li et al., 2000; Norman et al., 2008). The description of N2O emissions, including the links between soil environmental factors and biological reactions, is based on a series of hypotheses and results generated from both field measurements and laboratory incubations studies (Li et al., 2000), and the algorithms and parameterization of microbial growth and decay dynamics were specifically supported by the latter. Hence, controlled laboratory experiments, in which the impact of ill-defined pedo-climatic conditions on model predictability can be minimized, may be useful to optimize the model prediction of N2O emissions following residue amendment.
The application of process-based models has often been challenged by the paucity of prior information and measurements compared to the model's demands, and this is also the case when applying a model to incubation experiments. One widely used model calibration method to bridge the gap between model requirements and available data, as well as to quantify parameter uncertainties, is generalized likelihood uncertainty estimation (GLUE) (Beven and Binley, 1992). During model calibration, uncertainty analysis can assess how robust the model reasonably describes the measurements and identify possible reasons to explain the model errors (U.S. Environmental Protection Agency, 2009). This may be facilitated by applying a global sensitivity analysis (GSA), which can rank the sensitivities of parameters so that the model calibration can focus on the relatively more sensitive parameters (Vezzaro et al., 2012), and thereby the model's uncertainties can be more efficiently constrained. While model processes and performance have been extensively documented, in many studies N2O emissions alone were used to train and test the subroutines of nitrification and denitrification (Chen et al., 2008). Evaluation under controlled conditions and with ancillary measurements is noticeably lacking, which makes it difficult to assess the submodules related to C and N processes like, for example, decomposition, nitrification, and denitrification. Thus, a first step in understanding model performance may be an evaluation using new datasets that contain different variables linked to N cycling based on targeted laboratory experiments. To our knowledge, no previous study has attempted a systematic sensitivity and uncertainty analysis in the prediction of N2O emissions based on soil incubation experiments. The present study focused on the role of reactive C and N for N2O emissions and used simulations of targeted experiments to identify key drivers. Simulating N2O dynamics in a short-term laboratory study may be considered as zooming in on a single field operation, in this case the incorporation of crop residues by standard tillage operations.
For this work, we used CoupModel to simulate incubation experiments. CoupModel has a flexible setting of soil layer thickness down to a scale of millimeters and is proper for studying soil physical processes at the scale of incubation experiments. Besides, CoupModel has integrated modules that implement parameter calibration and uncertainty analysis (Jansson, 2012). The calibration datasets used in the model were obtained from a 43 d laboratory incubation using a factorial-based design with various crop residue practices and abiotic factors (Taghizadeh-Toosi et al., 2021). Specifically, our objectives were (i) to conduct a global sensitivity analysis for parameters in a CoupModel setup that represents soil N and C processes for incubation treatments; (ii) to calibrate the model and assess model uncertainty in the estimates of N2O and CO2 emissions, soil ammonium, and nitrate under different residue applications; and (iii) to discuss any limitations in the model optimization with short-term incubation experiments and suggest directions for future model development. We hypothesized that the model is able to simulate the daily and cumulative N2O emissions under contrasting environments in incubated soil cores. Furthermore, we hypothesized that only a few parameters in a complex model could be constrained to an unambiguous solution with limited laboratory measurements. Our findings can thus help diagnose potential causes of model–measurement discrepancies concerning C and N processes and specify conditions for which model and data collection need to be improved.
2.1 Laboratory incubation experiment
In spring 2018, soil used for the experiment was collected from the 0–20 cm tilled layer at the Lönnstorp Field Station, Sweden. Red beets had been grown in the previous year with no cover crop during winter. The soil is sandy loam (61.8 % sand, 22.4 % silt, and 15.8 % clay) with a pH of 6.18, C content of 15 g kg−1, and N content of 1.49 g kg−1. After sampling, the soil was partially dried, stored at −20 ∘C, and thawed the day before being sieved to < 6 mm for use in the experiment.
Treatments were prepared under four different soil conditions including two moisture levels (i.e., 40 % or 60 % WFPS – water-filled pore space) and two nitrate content levels (i.e., no nitrate addition or addition of KNO3 to 100 mg NO–N kg−1 dry weight soil). Soil cores were prepared by stepwise-packing 1 cm layers of soil to a density of 1.25 g cm−3 in cylinders with a height of 8 cm, at each step adding deionized water or a KNO3 solution. Following moisture and nitrate adjustments, the soil was pre-incubated for 1 week at 15 ∘C. The experiment involved two different crop residues: red clover (RC) and winter wheat (WW). RC residues had a ratio of 17.9 and a moisture level corresponding to 80 % of the fresh weight. The WW residues had a ratio of 90.9, and the moisture content corresponded to 20 % of the fresh weight. WW residues had a higher proportion of lignin and ash (11.7 %) than RC residues (5.1 %). On Day 0 of the experiment, RC or WW residues were either mixed in an amount of 0.04 g DM cm−2 (DM signifies dry matter) into the soil from 0–4 cm depth and then repacked, or residues were placed as a layer at 4 cm depth; only results from the mixed treatments were used in the present study. Incubations with RC and WW took place sequentially, and therefore each residue treatment had its own set of unamended controls. Thus, in total 16 incubation treatments (i.e., 40 % vs. 60 % WFPS; ambient nitrate vs. nitrate addition; RC vs. WW; and soil amended with residues vs. unamended controls) were used for this modeling study.
All cylinders were covered at both ends with perforated plastic caps and incubated at 15 ∘C for up to 43 d. Gas sampling for N2O and CO2 flux measurements took place 10 times, i.e., on day 1, 3, 6, 9, 13, 16, 22, 29, 36, and 43. Gas concentrations were determined by gas chromatography. Additionally, nitric oxide (NO) fluxes were quantified in four selected treatments set up separately. Soil mineral N pools in all treatments were measured at four destructive samplings after 1, 6, 22, and 43 d of incubation. Further details about the experimental treatments, preparations, and analytical methods are given by Taghizadeh-Toosi et al. (2021).
2.2 Model description and simulation setup
2.2.1 CoupModel
This study used CoupModel v6.1, which can be downloaded from http://coupmodel.com, last access: 1 November 2021. A detailed description of CoupModel can be found in Jansson and Karlberg (2010). The main structure of the model is a one-dimensional vertical soil profile with user-defined layer thickness and subdivisions. The current setup of CoupModel includes a number of components, of which the following processes are linked to N2O emissions (Fig. 1): (i) soil organic matter (SOM) decomposition and mineralization, (ii) nitrification and nitrifier growth, (iii) denitrification and denitrifier growth, and (iv) gas diffusion between soil layers and internal exchange of N trace gases between aerobic and anaerobic microsites. In the nitrification subroutine, CoupModel accounts for response functions of soil temperature, soil moisture, mineral N concentration, and pH. For denitrification, each step in the chain of denitrification is explicitly simulated, and denitrifier activity is directly influenced by soil temperature, pH, nitrogen oxides, and anaerobic fraction. The anaerobic soil volume fraction is calculated using the “anaerobic balloon” concept, as implemented in the DNDC model (Li et al., 2000; Norman et al., 2008).
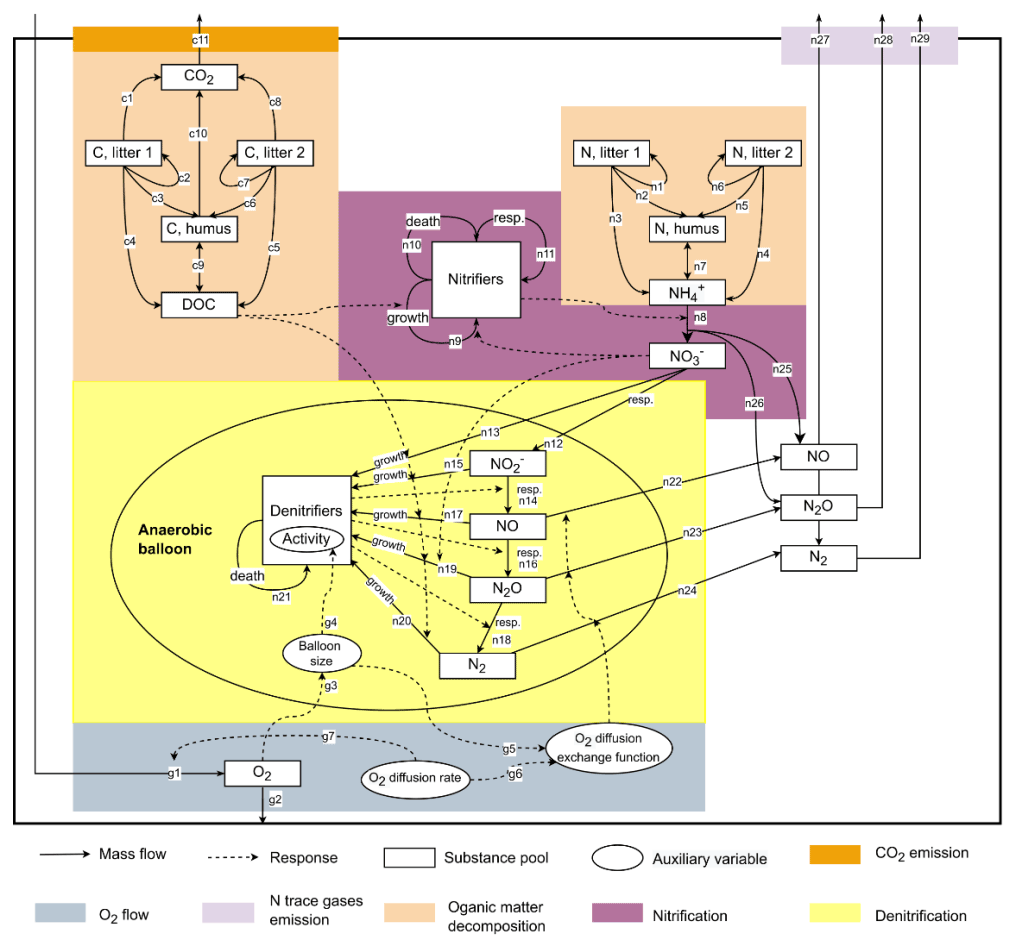
Figure 1A conceptual diagram of major C and N processes in the current setup of CoupModel. The details of parameters and equations in each C or N process can be found in Table S2.
2.2.2 Simulation settings
The modeled soil profile consisted of a single soil layer with a depth of 4 cm for the control treatments and 4.2 cm for the treatments with residues, allowing a 2 mm increment as observed in the experiment. We only simulated the upper half of the 8 cm soil core to have proper gas boundary conditions since the model only allows external gas exchange at the upper side of the soil profile, whereas in the experiments both ends of the cylinder were exposed to air. For the water process, it was assumed that there was no evaporation from the surface and no vertical water flow across the lower boundary, and a constant temperature was set for the upper and lower boundaries, in accordance with incubation conditions. The model was initialized based on the measured soil water content, soil porosity, temperature, pH, total organic C and N, NO–N, and NH–N of the incubated soil cores. The dynamics of SOM were simulated with first-order kinetics using three pools (litter1, litter2, and humus). Considering there were no explicit pools designed for crop residue addition, we assigned the rapidly decomposable SOM and easily metabolized residue components (e.g., sugars and proteins) to litter1, the moderately decomposable SOM and structural residue materials (e.g., lignin and other fibers) to litter2, and the resistant SOM to humus. When initializing the organic matter pools, we took the soil pool sizes from published papers and assumed that they were already close to a steady state at the start of incubations (see the description in the following paragraphs), and hence the changes observed during incubation were assumed to be mainly caused by the decomposition of the residues introduced. For simulating gas transport, we selected the steady-state mode in which the oxygen content within the soil profile was derived from the balance between soil oxygen consumption and surface air diffusive supply, and the transient storage term of gases in the soil air was not considered here.
Calibration datasets. Measurements used for model calibration were N2O flux, CO2 flux, NO–N content, and NH–N content. As the gas fluxes and mineral N content in the upper part with soil–residue mixtures and the lower part with bulk soil were not analyzed separately, it was assumed that soil C and N turnover in the lower, unamended part was identical to that of control treatments in order to create datasets for the residue-amended part for modeling. Specifically, the amounts of mineral N and gas fluxes recorded on individual sampling days in the controls were divided by 2 and subtracted from the values recorded in residue-amended soil.
Initial values. (1) For mineral N, since the mineral N content in the unamended control soil changed little during incubation and the mineral N content in crop residues was negligible, the initial NH–N and NO–N values for the control and residue-amended treatments were taken as the measurement in control soil on day 1. (2) For soil moisture, for the control treatments, the initial volumetric water content was calculated from the water-filled pore space (WFPS) levels of 40 % or 60 % and the total porosity of 0.53. For the residue treatments, the initial volumetric water content was calculated from the moisture content of soil and crop residues (Taghizadeh-Toosi et al., 2021). (3) For organic matter pools, the partitioning of soil organic C between litter1, litter2, and humus was defined by the ratio (Gijsman et al., 2002). For crop residues, the fraction of easily metabolized organic C was calculated from the lignin N ratio: 0.85–0.013 (lignin N) (Gijsman et al., 2002), and hence the organic C allocation between litter1 and litter2 had a ratio of 0.82:0.18 for RC and 0.55:0.45 for WW. The allocation of organic N to different pools followed the pattern of C and the ratios (Table S5).
A summary of calibration datasets can be found in Table S1 of the Supplement, in which cumulative gas emissions were estimated by linear interpolation between sampling dates and integration of the area under emission curves, while average mineral N contents were calculated by dividing the integrated values by the sampling period. The results for nitrate in soil cores with residues were not included due to high uncertainty in the calculations that was probably caused by solute transport between the unamended and amended soil layers, as observed in a related incubation experiment using some of the same soil and residue treatments conducted by Lashermes et al. (2022).
2.3 Model sensitivity and uncertainty analysis
2.3.1 Global sensitivity analysis
Given uncertain prior information, the study used Morris screening (Morris, 1991) for a global sensitivity analysis to identify parameters to which estimates of N2O fluxes were sensitive. We included seven input parameters related to the characteristics of soil and crop residues (i.e., soil porosity, crop residue porosity, soil pH, and organic C pool sizes), and the parameter ranges were defined around the mean values of measurements or estimations (Table S4). For parameters supported by measurements, i.e., soil porosity and pH, the ranges were within 25 % of the mean values to represent realistic microscale variations in the laboratory setup. The residue porosity was estimated with a bulk density of 0.18 g cm−3 and a dry density of 1.3 g cm−3 (Lam et al., 2008; Zhang et al., 2012), as well as with a wider uncertainty range of 40 % due to compressibility. Bulk soil porosity and crop residue porosity were used to calculate the soil–residue-mixture bulk density used in the model input, and this calculation is included in the Supplement. The ranges of organic pool fractions were derived from literature values for cultivated soil, in which the humus pool size (SOCh) had an uncertainty range of ca. 40 %, and the labile carbon pool size (SOCl1) varied within 2 orders of magnitude considering the marginal fraction. The range of crop residue organic pool sizes was taken from the constraints of the different estimated fractions of the two crop residues.
Besides the seven input parameters, we considered 45 process parameters involved in the relevant model processes. Part of the parameter ranges (e.g., tQ10a, dpHhrate, cnm) adopted in the study were based on the most relevant applications of CoupModel, experimental studies, and other process models as shown in Table S4. Ranges for the remaining model-specific parameters, including those involved in nitrification and denitrification, could not be derived from the existing literature, and in the absence of better prior information, we adopted the default ranges set by the model.
The Morris screening method is commonly used for sensitivity analysis based on an efficient sampling strategy for performing a randomized calculation of one-factor-at-a-time (OAT) sensitivity analysis. This method can be viewed as a compromise between a simple OAT approach and the more complex GSA methods (e.g., variance-based approaches), as it provides a good approximation of the global sensitivity measure of the parameters at an affordable computational cost. Furthermore, it was considered excessive and unnecessary in the present study to adopt a more detailed analysis given the limited available measurements.
The elementary effect (EE) was estimated by comparing the variation of the model's output yj with the variation of a given parameter θi, according to Eq. (1). The number of iterations n was set to 50, and the optimal perturbation factor Δ was set to by dividing the input space into four levels (Morris, 1991). To allow comparison across outputs, the EE was then standardized using the standard deviation of the model factor and the standard deviation of the output (SEE, Eq. 2). The significance of the impact of parameters was tested by comparing the mean of the SEE of those parameters to twice the standard error (sem, Eq. 3) (Sin et al., 2009). If the input factor lies outside this range, it is said to have a significant effect on the output. The codes used in the analysis were adapted from Sin et al. (2009).
The GSA was performed to a measure of model performance, root mean square error (RMSE), for three variables: N2O flux, CO2 flux, and soil NH, which had relatively complete measurement datasets. By applying the sensitivity analysis to the likelihood measure, the main factors that drive the model runs with a good fit to data could be identified (Ratto et al., 2001). The results from sensitivity analyses were further used to identify process parameters for inclusion in the uncertainty analysis due to their contribution to output variability.
2.3.2 Uncertainty analysis
Model calibration was conducted separately for each of the 16 treatments to give more flexibility in model parameterization. The calibration was carried out with reference to five measurement variables, namely N2O flux, CO2 flux, NH content, NO content, and NO flux (only four treatments), using the GLUE method. The GLUE method does not seek the single best fit to the measured data but utilizes an ensemble of model simulations that represent equally good results using informal likelihood measures (also called acceptance criteria) to account for parameter equifinalities. In this study, we first described the entire ensemble of model runs as prior runs, and after applying selection criteria the selected ensemble of model runs was analyzed as posterior runs or behavioral runs. Based on the calculated sensitivity indices from Morris screening, a total of 26 process parameters were selected for calibration, in which the parameters with marginal SEEs were omitted and only one denitrifier growth parameter was kept in each step of the denitrification chain (see Table S4). These parameters were uniformly or log-uniformly distributed within the predefined ranges, from which 20 000 parameter sets were then randomly sampled for model runs. Out of these runs, whether a parameter set was accepted or not was based on the defined criteria, which in this study consisted of the coefficient of determination, R2, and mean error, ME. The latter is defined as ME = E (Oi−Si), where Si and Oi are the simulated and observed data at each measurement time step.
The ME acceptance threshold of each variable was set to be around the average of daily measurements, taking into account the different magnitudes of each variable (see Table S3). The ME values of prior runs for some measurement variables often showed a skewed distribution deviating from 0, meaning that the model may have systematically over- or underestimated these variables. While setting the same threshold on both sides rejected most of the prior model runs, the ME criterion on one side might be looser than the other. For N2O emissions with marked peak fluxes, a combination of R2 and ME was used for the selection of posterior parameters to simulate the dynamics and magnitudes. An ensemble of ca. 50 posterior runs was selected with an acceptance rate of 0.25 % based on prior simulations. The uncertainties of model predictions were quantified within the limits and posterior probability distributions of parameters.
Finally, to investigate whether the treatment effects of soil moisture and nitrate levels could be represented by a common parameterization, we also calibrated process parameters against measurements combined with data from every four treatments with the same residue application including “40 % WFPS, −NO”, “40 % WFPS, +NO”, “60 % WFPS, −NO”, and “60 % WFPS, +NO”. The prior parameter ensembles used the same 20 000 parameter sets as the single-treatment calibration. Accordingly, the measurement datasets from the four treatments in each group were pooled, and thus a larger dataset for model evaluation was obtained. The procedure of selecting behavioral runs followed the aforementioned approach based on ME and R2. A diagram that describes the analysis workflow for this study is presented in Fig. 2.
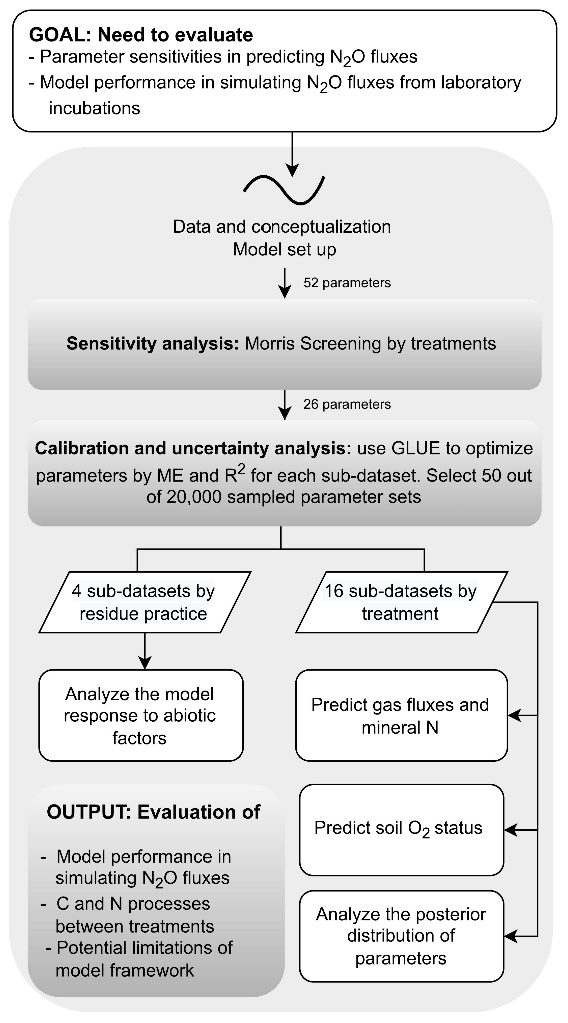
Figure 2A schematic diagram of the workflow of the study to analyze parameter sensitivity and uncertainty of the CoupModel based on 16 treatments from an incubation experiment (see text for details).
3.1 Sensitivity analysis
The results of Morris screening were evaluated by comparing the absolute SEEs concerning N2O flux, CO2 flux, and soil NH for individual treatments. Figure 3a–c list the parameters ranking in the top five SEEs across the 16 treatments. In general, a higher number of sensitive parameters were found for N2O flux (18) than CO2 flux (8) and NH (9). Also, more inter-treatment variations in the SEEs of parameters were found for N2O flux. For CO2 flux and NH, inter-treatment variations were found in the parameters relevant to soil moisture levels (e.g., pθLow and θwilt), NO content (dgrowthNO3), or residue types (e.g., fe,l2, fe,l1, and cnm). For N2O, the parameters exhibiting relatively high SEE values for most treatments belonged to categories of SOM decomposition and denitrification (Table S2), including deffNO, SOCh, dgrowthNO3, cnm, and dhrateNxOy. The model input, SOCh, characterizing the partitioning of SOM pools in the simulation, was found crucial in 13 out of 16 treatments. deffNO represented the respiration of denitrifying bacteria based on NO and showed relatively large elementary effects for almost all treatments by directly regulating the reduction step from NO to N2O. The parameter dgrowthNO3 described the loss of NO from the anaerobic nitrogen pool due to microbial growth. dhrateNxOy represented the N concentration for half the rate in the denitrification process and was also known as the Michaelis constant of the enzyme (see n13, n15, n17, n19, and n20 in Fig. 1).
Parameters that had the greatest impact on CO2 emissions were concentrated in the following: SOCh, SOM decomposition rates (kl2, kl1), and the corresponding efficiencies (fe,l2, fe,l1). In addition, pθLow and θwilt, which controlled the lower limit of the soil moisture response function for the decomposition of organic matter (see Eq. 5.86 in Table S2), exhibited distinct influences for the treatments at the lower moisture level.
The main processes influencing the NH content of the soil were identified as SOM decomposition and denitrification, and influential parameters included cnm, SOCh, kl2, and fe,l2. The ratio of microbes, cnm, has an influence on the mineral N content by changing the magnitude and direction of soil mineralization and/or immobilization of nitrogen (see n1–n7 and n11 in Fig. 1). Soil porosity (nsoil) had significant effects on some treatments, especially under higher moisture conditions. Besides, as a key intermediate of mineral nitrogen turnover, the content of NH was also influenced by denitrification-related parameters (e.g., dgrowthNO3).
The average SEEs across all treatments are shown in Fig. 3d–f. For the N2O flux, all parameters were located inside the wedge indicating that none of these parameters showed a significant effect across all treatments despite their significance in individual treatments. In contrast, we found that the other two variables, CO2 flux and NH content, were significantly affected by 15 and 28 parameters, respectively. Moreover, all parameters showed nonlinear effects on the outputs as revealed by their non-zero standard deviations, which suggested that simulated C and N processes did not solely depend on individual parameters but also on their interactions.
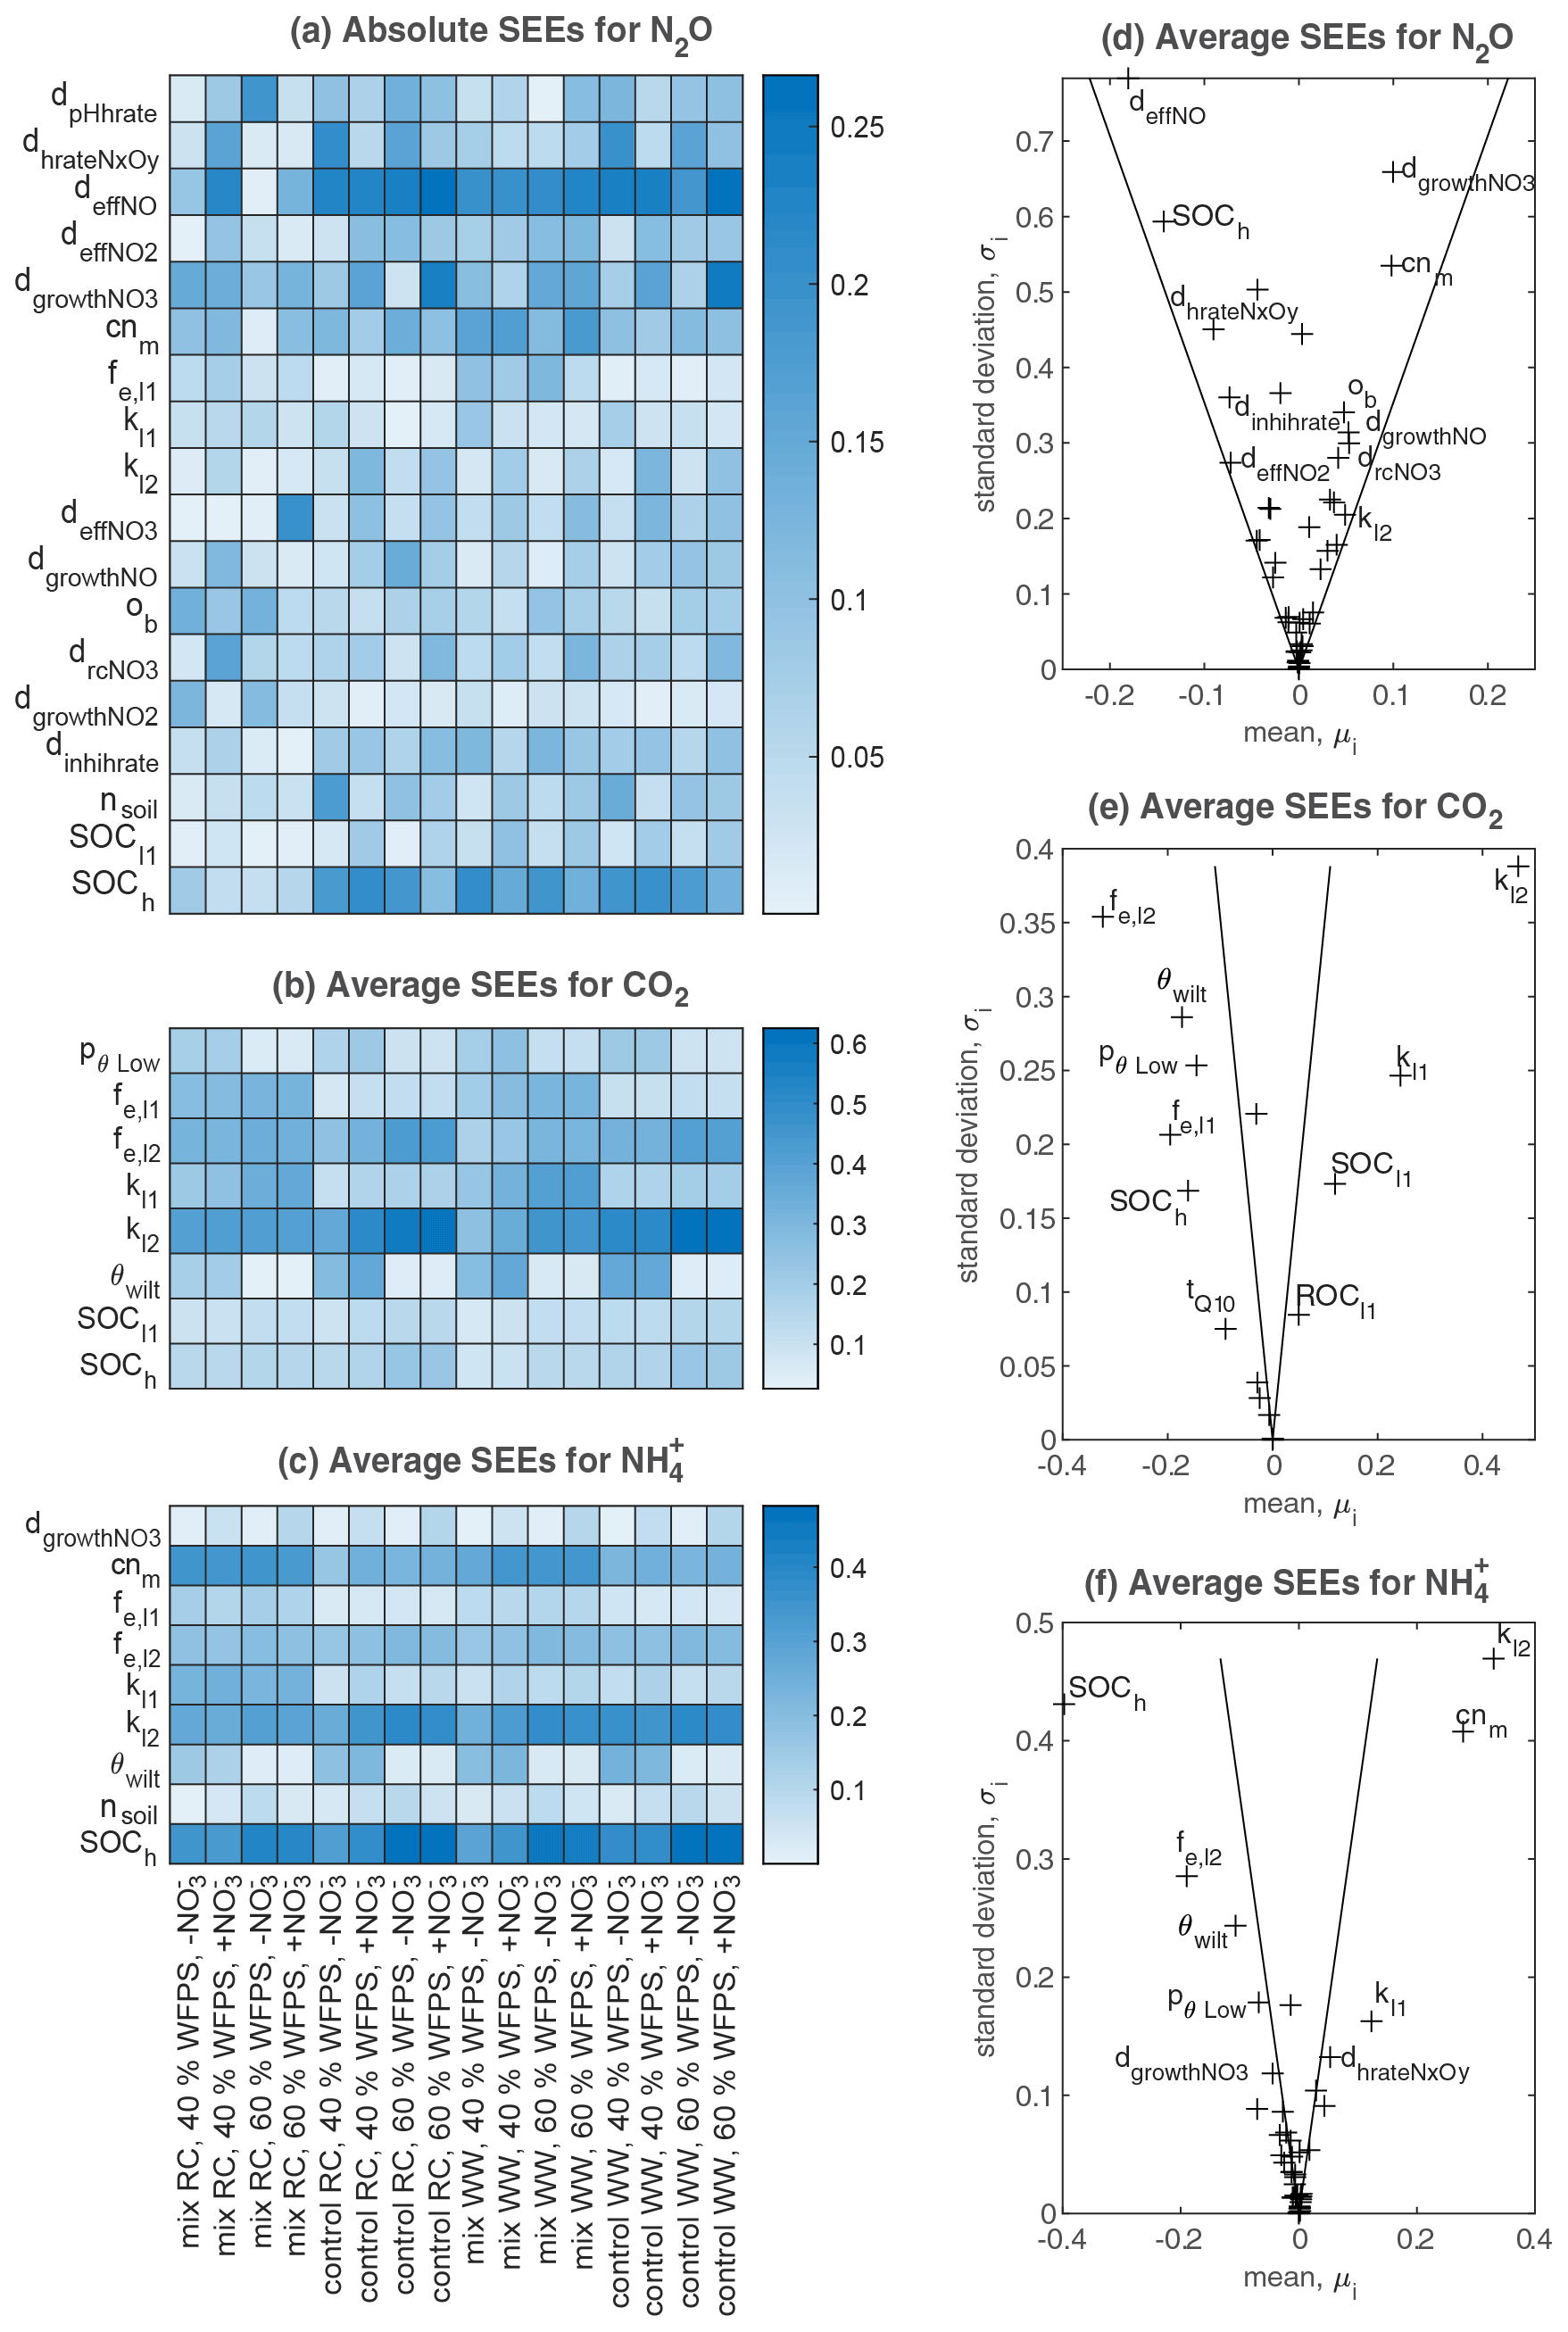
Figure 3Sensitivity analyses for N2O flux, CO2 flux, and soil NH content in all treatments. (a–c) Heat maps that include all parameters ranked in the top five places for each treatment based on absolute values of standardized elementary effects (SEEs) – the higher the absolute value, the more important the parameter is, as shown by the shade of color. (d–f) Estimated mean and standard deviation of SEEs averaged across the 16 treatments, where the two lines drawn in each subplot correspond to twice the standard error (sem): (see Sect. 2.3.1): if a factor is located inside the wedge, its impact on the output is considered insignificant, and vice versa.
3.2 Uncertainty analysis
3.2.1 Temporal dynamics of N2O flux, CO2 flux, and mineral N
The prior simulations generally showed that mean errors for gas emissions and soil mineral N largely deviated from zero, and these biases were reduced in the posterior simulations for most model outputs (Fig. 4a–d). For N2O fluxes, most treatments amended with WW and corresponding controls did not show significant deviations from the observed fluxes. In contrast, in treatments amended with RC and corresponding controls, though the absolute MEs had been reduced, there were still significant deviations generally in the direction of underestimating the observed fluxes. For CO2 emissions, 13 out of 16 treatments showed reduced mean errors in the behavioral models, and half of the treatments showed insignificant deviations from the observed fluxes. For soil NH content, there was a severe overestimation for most prior models, but this was alleviated by posterior models, and seven treatments showed insignificant deviations from zero after model calibration. For soil NO content in control treatments, the ME ranges of posterior runs were around zero, while negative or positive biases existed, especially the former.
In the experimental treatments with RC amendment, N2O emission rates were consistently low at 40 % WFPS but were markedly higher and peaked on day 3 at 60 % WFPS (Fig. 5a). The highest measured daily N2O flux was 1.4 g N m−2 d−1 in the RC treatment with NO addition at 60 % WFPS. Similar patterns were observed for CO2 emission rates, with emission peaks at an early stage of incubation (day 1 or day 3), and then followed by a decline. In treatments amended with WW, N2O evolution rates were generally low compared to those with RC amendment. Higher rates were observed at 60 % WFPS and in NO-amended soil, but treatment effects were generally minor. For CO2 evolution, higher rates were detected by day 1, but there was also a secondary peak after 1–2 weeks for the WW treatments (Fig. 5b). The control treatments of the WW residue incubations showed less CO2 and N2O release compared to the control treatments of the preceding RC incubations. For soil mineral N, there was a consistent increase in NH–N content by day 1 after residue application compared to the controls, and both NH–N and NO–N showed smaller variations than gas fluxes (Figs. 5c–d and S6c–d). The simulated evolution of associated variables is depicted in Fig. 5a–d for treatments at 60 % WFPS and in Fig. S6a–d for treatments at 40 % WFPS, respectively, and the results are summarized below.
N2O. The posterior simulations (Figs. 5a and S6a) were able to represent the scenarios with low daily N2O emissions (10−5–10−2 g N m−2 d−1), while simulations failed to capture the large emission peaks (e.g., 1.4 g N m−2 d−1 and 0.13 g N m−2 d−1 for the two RC treatments with NO amendment), or the emission dynamics were reasonably simulated (e.g., R2>0.4; see Table S3), but the peak values were lower than observed. The N2O fluxes obtained from the model tended to increase over time and generally agreed with the observed fluxes in the second part of the experiment. Compared with residue-amended soils, the model better described the magnitude and stable trend of N2O fluxes in control soils.
CO2. Overall, the posterior simulations mimicked the measured dynamics and magnitude of CO2 emissions well (Figs. 5b and S6b). There were overestimations or underestimations by the model, most pronounced in the early stage of incubation. By day 14, a second peak of respiration was observed for the WW treatments but not captured by the posterior simulations.
NH. For RC residue treatments, an increase in NH was observed within the first day, followed by net N mineralization from the early- to mid-stage of the incubation period and then a decline. In contrast, in the posterior simulations for three of four treatments, the simulated NH corresponded to an enhanced net N mineralization throughout the incubation (Figs. 5c and S6c). Such a continuous increase in soil NH also existed in the prior simulations, which would not be radically altered in the posterior simulations by setting a stricter selection criterion for R2. For WW residue and control treatments the measured NH content was at the detection limit, and the magnitude of the simulated NH content was either in line with the measurements or a bit higher.
NO. The simulated daily NO content captured well the magnitude of the measurements and showed small variations throughout the incubation period for all control treatments (Figs. 5d and S6d). While in most of the control treatments except for the ones with high moisture and NO amendment, the observed NO levels remained stable or slightly increased during incubation. For the treatments amended with crop residues, the simulated NO content showed a noticeable decrease throughout the period, consistent with NO being utilized as a substrate of denitrification in the simulation. Though there was no explicit measurement of NO within the residue-amended layer in the present experiment, the average NO within the entire soil core in RC treatments showed net consumption followed by a rebound (Taghizadeh-Toosi et al., 2021), consistent with observations for the RC-amended layer in a comparable incubation experiment by Lashermes et al. (2022). Given that, the simulated NO content in residue treatments exhibiting a continuous decline was probably lower than the actual values.
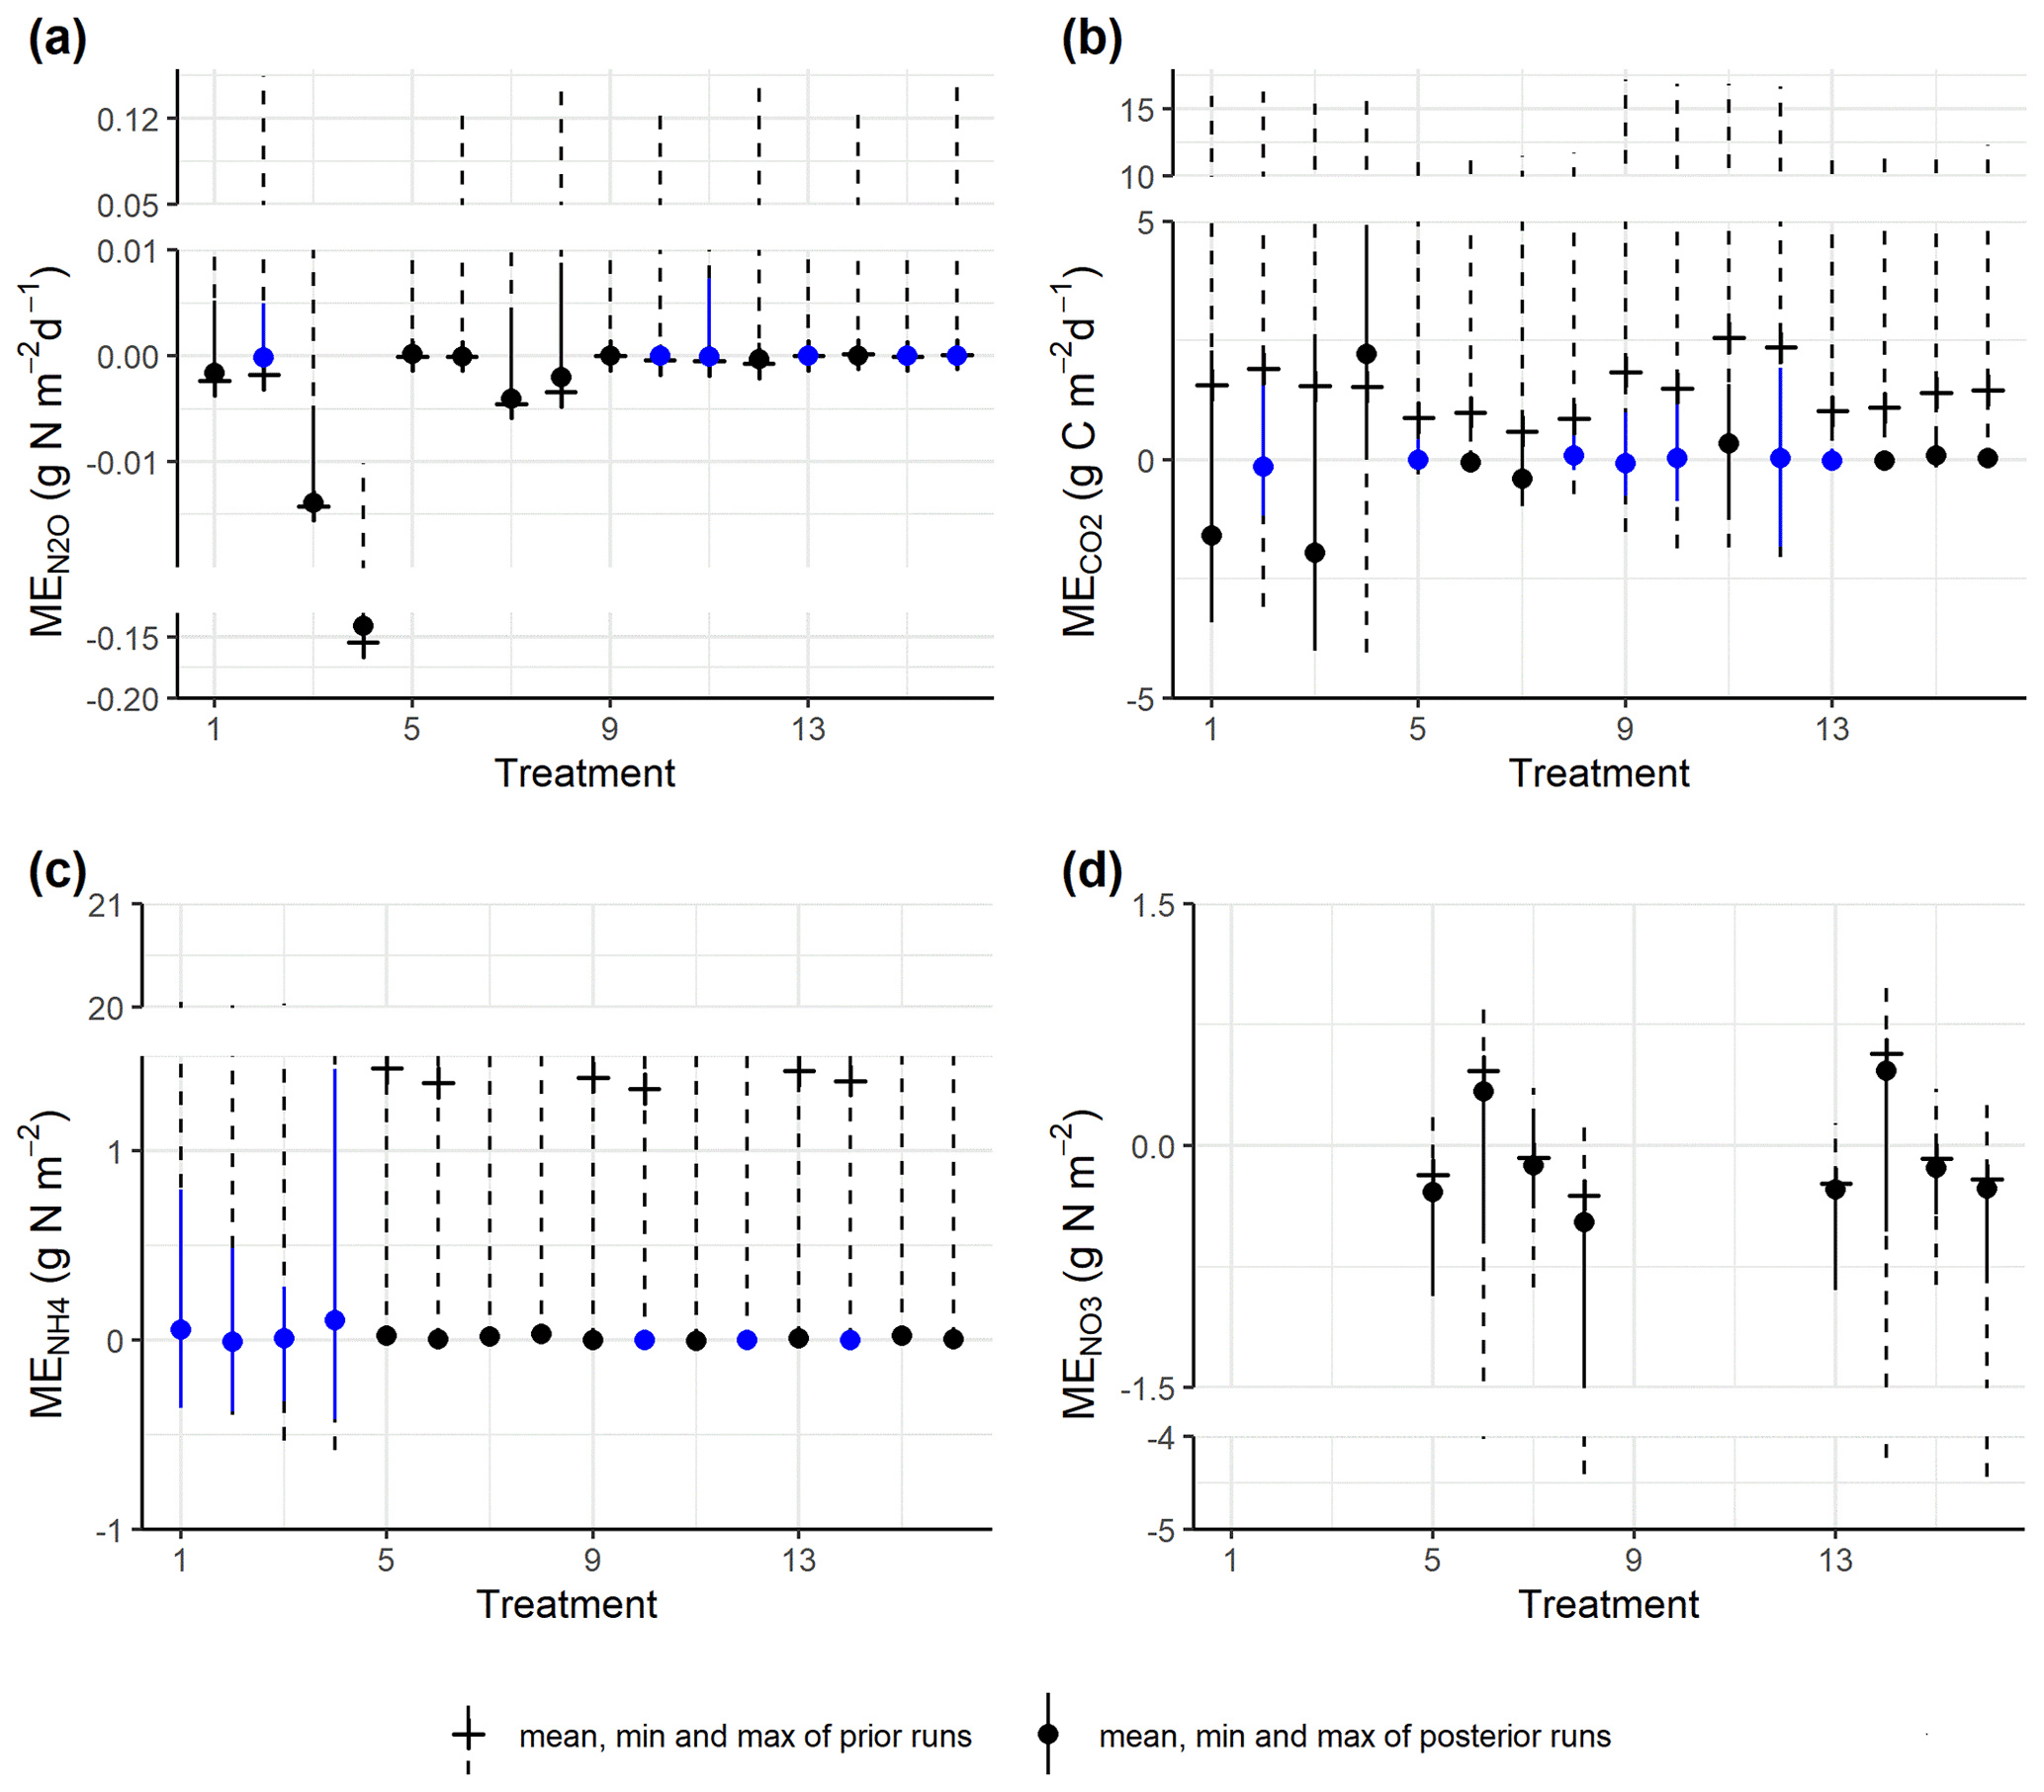
Figure 4Comparison of the ME ranges between prior simulations and posterior (accepted) simulations for (a) daily N2O fluxes, (b) CO2 fluxes, (c) soil NH content, and (d) soil NO content. The blue color shows ME values not significantly different from zero by one-sample t tests (significance level α = 0.05). Treatment indices 1–4 represent treatments for mix RC, 5–8 for control RC, 9–12 for mix WW, and 13–16 for control WW, where treatment conditions are, in order, “40 % WFPS, −NO”, “40 % WFPS, +NO”, “60 % WFPS, −NO”, and “60 % WFPS, +NO”. There are no measured data for nitrate in residue treatments.
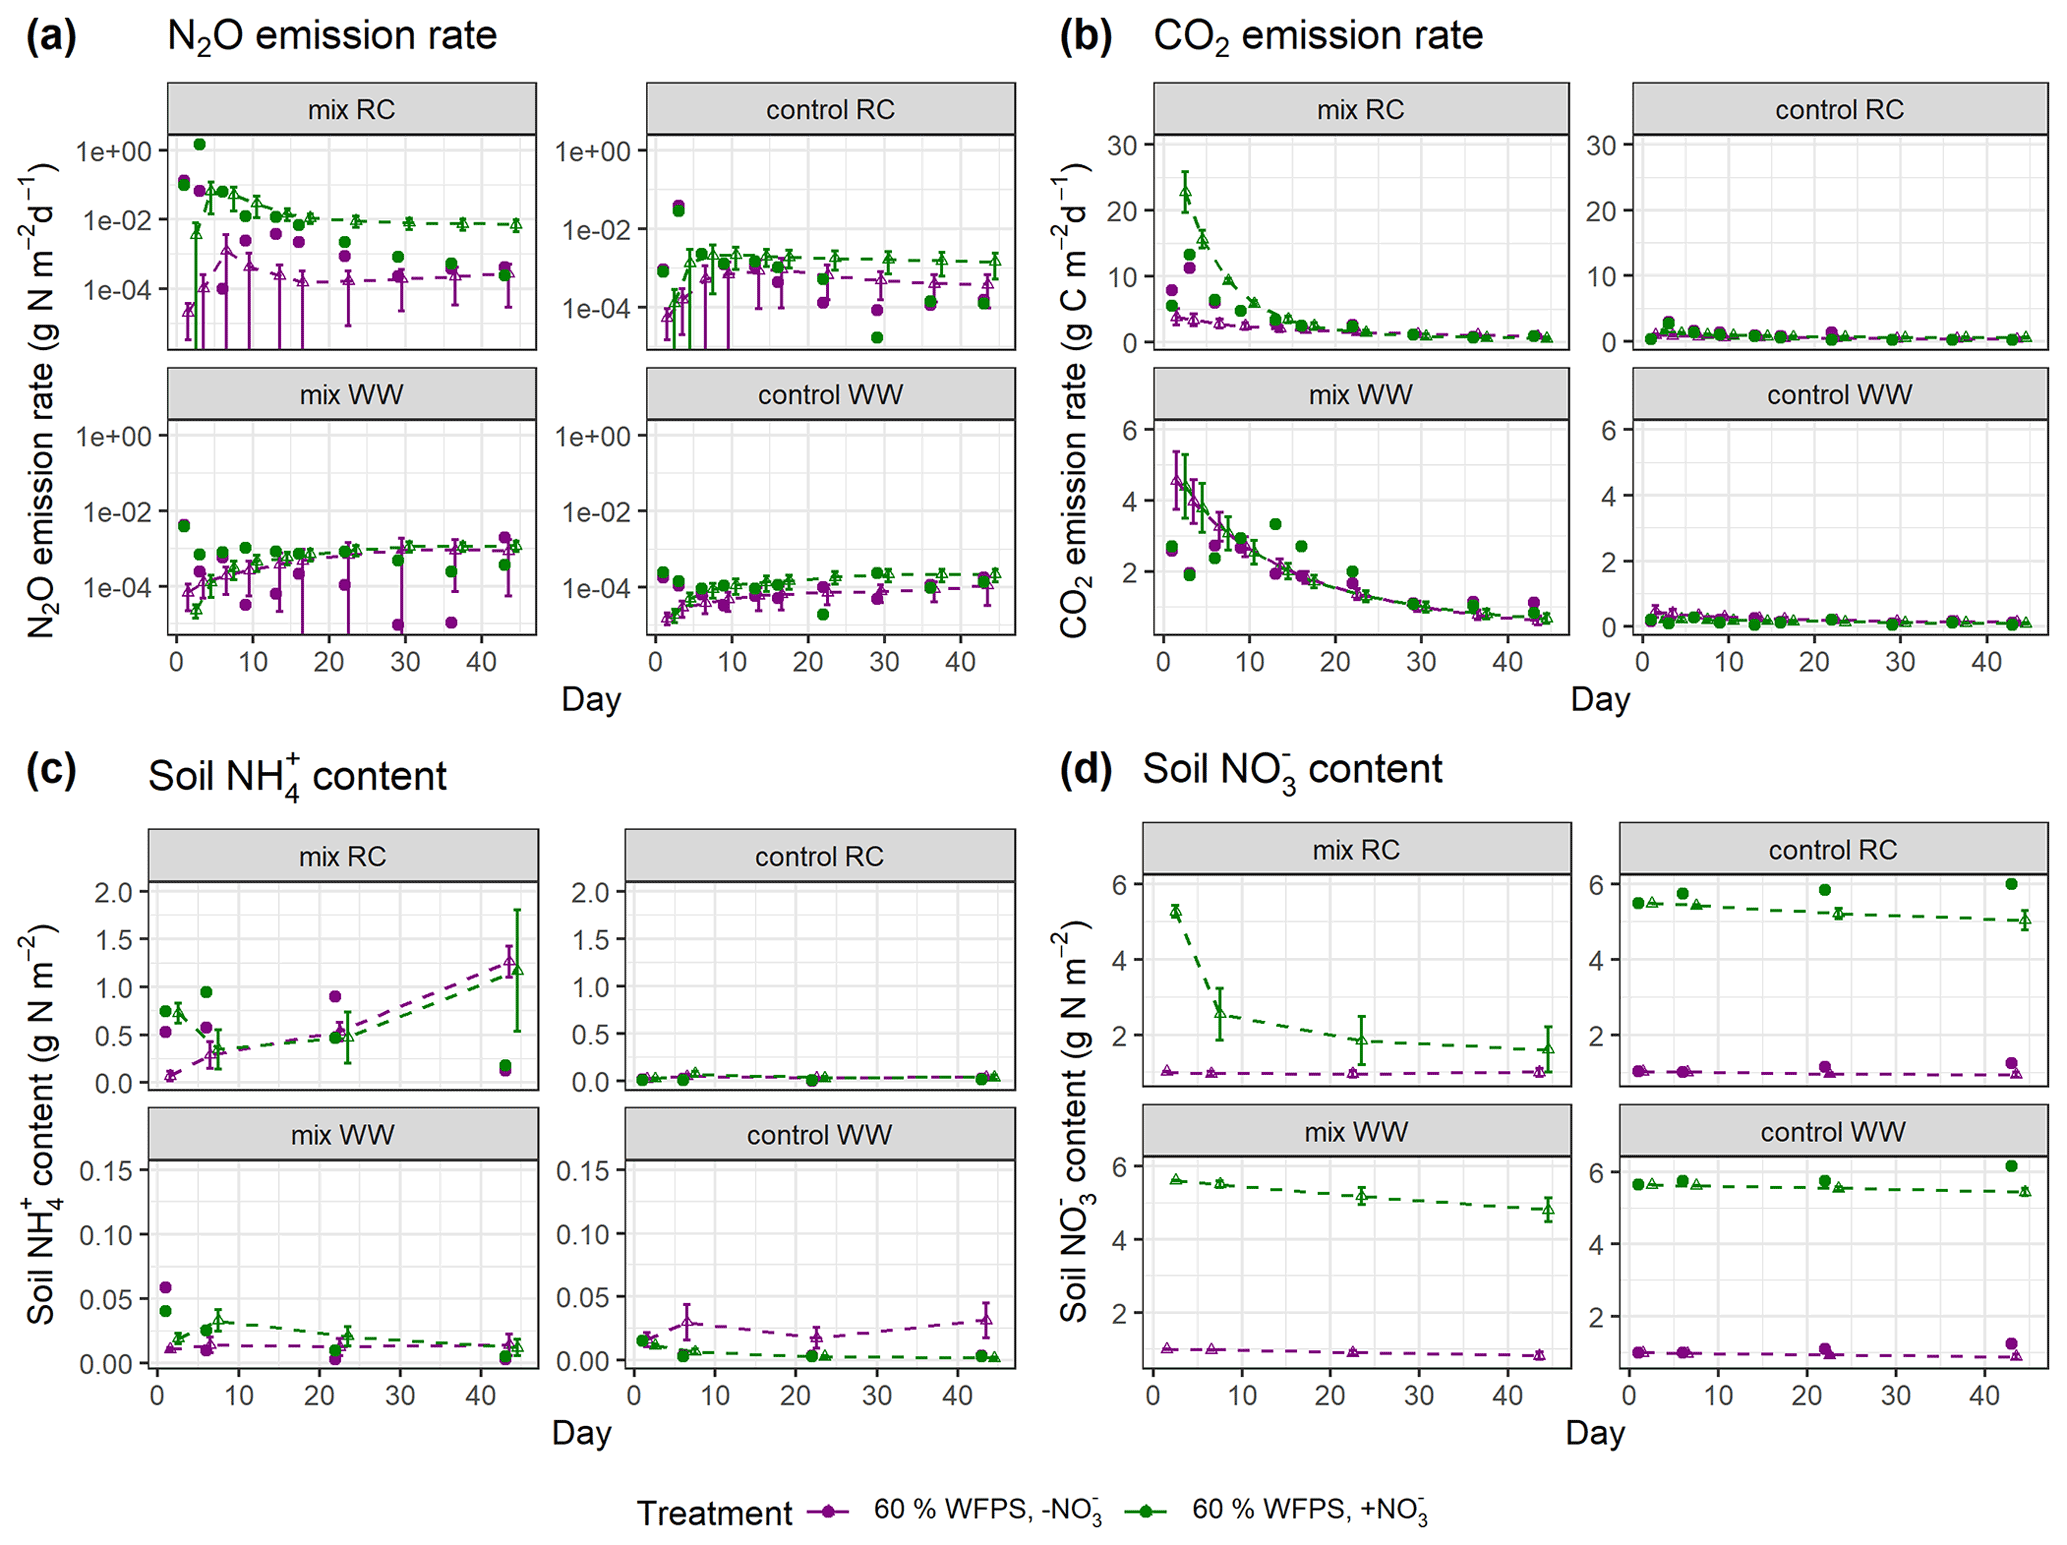
Figure 5Simulated and measured daily (a) N2O fluxes, (b) CO2 fluxes, (c) soil NH content, and (d) soil NO content during the 43 d incubation at 60 % WFPS. Scatter points represent measured data, and triangles with dashed lines represent simulated data (error bar: 95 % confidence interval). Daily measurements presented were re-calculated from the data provided by Taghizadeh-Toosi et al. (2021).
3.2.2 Cumulative gas fluxes and average mineral N content
Model predictions of cumulative N2O fluxes and CO2 fluxes for the 16 treatments were significant and strongly correlated with the observed fluxes (Fig. 6 and Table 1). For N2O, there was a consistent underestimation of high cumulative N2O fluxes (slope β1: 0.17; ME: −0.23). The estimated slope of the linear regression for cumulative CO2 flux approached 1, indicating there was no consistent bias. For the average NH and NO content, the estimated slopes were also close to unity, and the deviations between prediction and measurement, signified by the relative RMSEs (rRMSEs), were 46 % and 11 %, respectively. For the average NH content in the low-range, simulated values were found to overestimate the measured data (Fig. 6c).
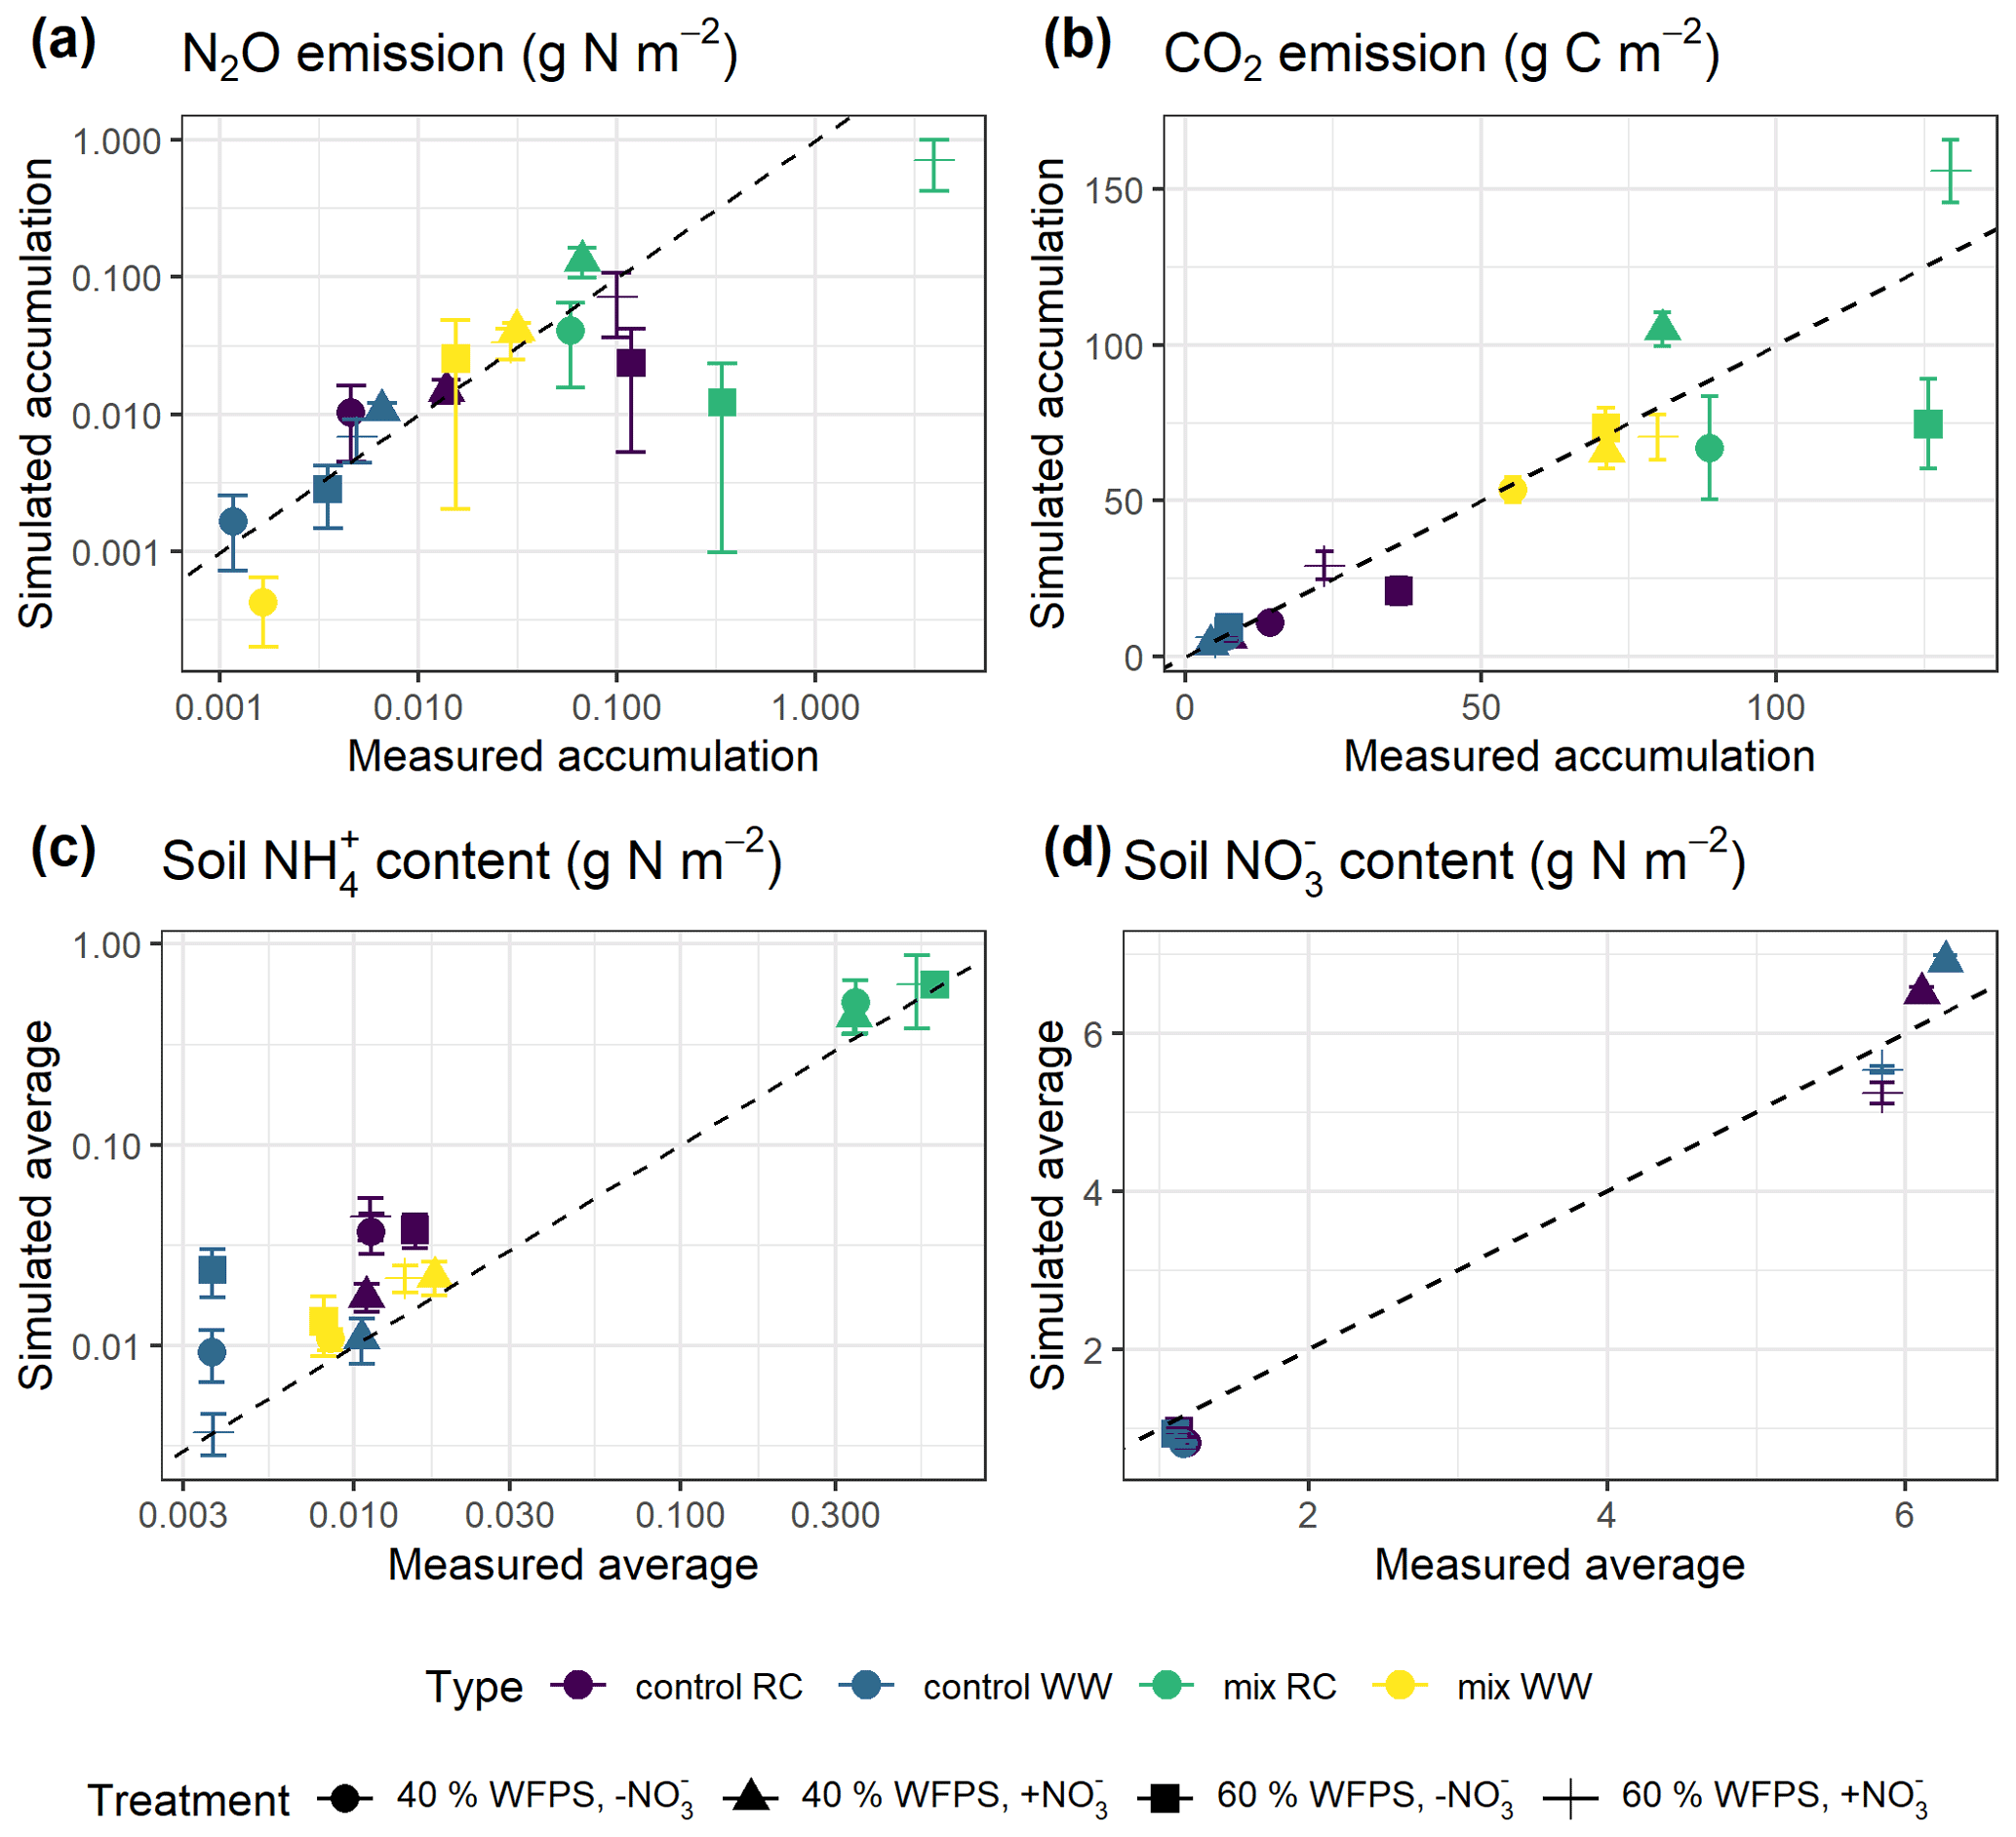
Figure 6Simulated and measured (a) cumulative N2O fluxes, (b) cumulative CO2 fluxes, (c) average NH content, and (d) average soil NO content during the 43 d incubation (error bar: 95 % confidence interval). Colors indicate different types of residue amendment, and markers indicate different abiotic soil environments. Reference lines with a slope of 1.0 are shown on the graphs.
Table 1Model evaluation of cumulative gas fluxes and average mineral N content from the single-treatment calibration procedure and the multi-treatment calibration procedure. The mean values of posterior models were compared with the observed data for 16 treatments. Units are valid for the statistics of ME and RMSE.
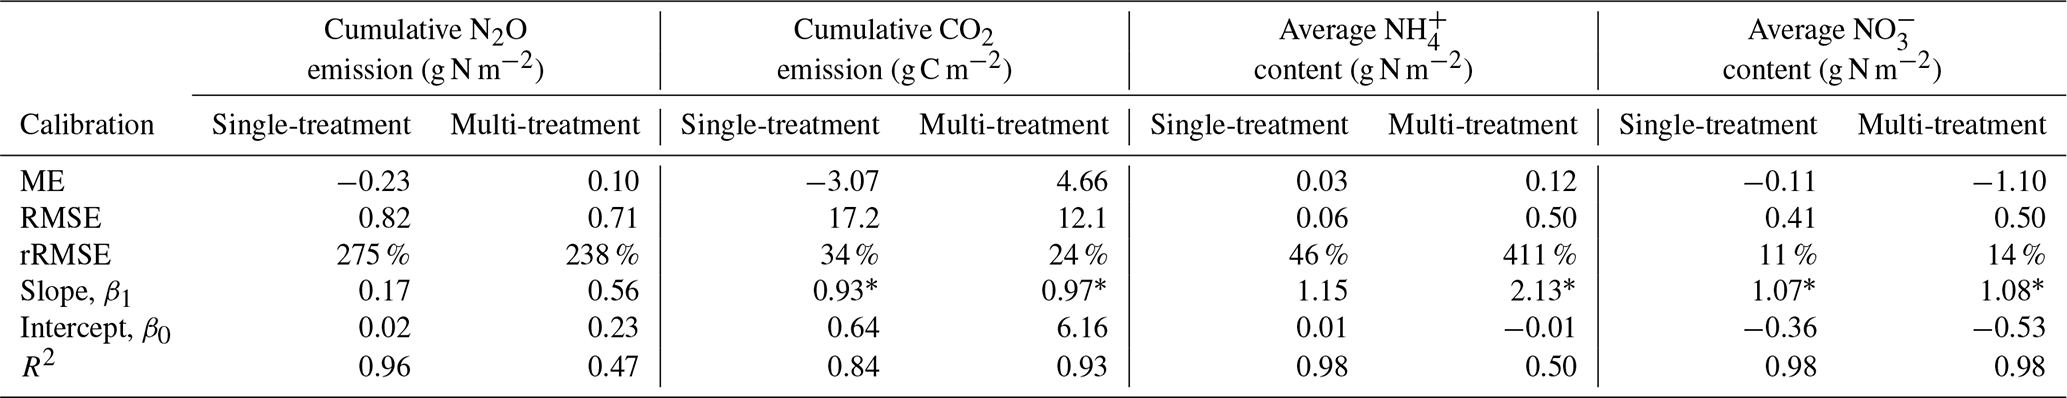
* Values are not significantly different from 1 by one-sample t tests (significance level α=0.05).
A regression of simulated cumulative N2O flux residuals against observed data confirmed that underestimations were strongly (R2: 0.92) associated with the magnitude of observed N2O fluxes (Fig. S1a). The negative slope of the regression indicated an underestimate of 0.83 g N2O–N for every 1 g of observed N2O–N per square meter. A regression of simulated cumulative N2O flux residual against the residuals of other variables revealed that underestimations were not strongly associated with the residuals of simulated NH and NO (Fig. S1c–d). However, we observed that clustering of residuals for mineral N existed, in which underestimations of cumulative N2O flux tended to occur when soil NH was overestimated and when soil NO was underestimated. Specifically, residuals for cumulative N2O flux and soil NO were simultaneously underestimated in 53 % of the posterior runs as revealed by scatter points falling in the third quadrant, and underestimations of N2O flux were accompanied by overestimations of soil NH in 41 % of the posterior runs by looking at scattering points in the fourth quadrant.
3.2.3 Calibration by multiple treatments
Increasing the number of calibration treatments resulted in lower uncertainty but, at the same time, reduced the performance of posterior models for some treatments (Fig. 7). Cumulative N2O fluxes were better simulated for the treatments with higher observed fluxes in each group, especially treatments at 60 % WFPS, but were overestimated for others with low observed fluxes. The regression between the mean simulated and measured N2O flux only accounted for 47 % of the variations in the data, much lower than the level of 96 % in the single-treatment calibration procedure (Table 1). Simulated CO2 and NO were generally close to the observed data. In the same group, simulated CO2 fluxes showed no difference between the two levels of soil NO but not for the levels of moisture. Simulated soil NH showed a good agreement with the measured data in the low range of NH content but had large model deviations for the four RC residue treatments (a log-scale is used in Figs. 6c and 7c), in which the R2 was 0.50 in contrast to 0.98 in the single-treatment calibration procedure (Table 1). The statistics rRMSE and RMSE are more sensitive to outliers compared to mean error (ME), and regarding NH, their high values for NH (rRMSE of 411 % and RMSE of 0.50 in Table 1) would be reduced to 78 % and 0.01, respectively, after removing the four RC treatments.

Figure 7Simulated and measured (a) cumulative N2O fluxes, (b) cumulative CO2 fluxes, (c) average NH content, and (d) average soil NO content during the 43 d incubation (error bar: 95 % confidence interval). Simulated results were obtained from multi-treatment calibration. Colors indicate different types of residue amendment, and markers indicate different abiotic soil environments. Reference lines with a slope of 1.0 are shown on the graphs.
3.2.4 Simulated oxygen status and N2O sources
Simulated oxygen content in the soil cores was close to that of the ambient air, with the modeled volumetric oxygen content in air-filled pores ranging from 19.5 % to 20 % throughout the incubation period independent of treatment (Table S7). Still, according to the model, denitrification-derived N2O accounted for 76 % to 100 % of the cumulative emissions on average (Table S7).
In simulations, the 0–4 cm soil layer was treated as one uniform compartment, and this could have influenced model predictions. To investigate whether increasing the vertical resolution would change the predicted oxygen availability, the soil profile was divided into five uniform layers. The results showed that underestimations of high N2O fluxes still existed after this change in the stratified representation of the model (Table S6). The simulated soil oxygen profiles were still predominantly aerobic for all treatments, as in the single-layer model, but did show stratification by depth as depicted in Fig. 8. The oxygen level was the lowest at the beginning of incubation and then showed an increase over the period studied, mirroring the trends in CO2 flux. Despite the overall aerobic conditions in the soil, the large proportion of denitrification-derived N2O emissions was accompanied by the rapid growth of denitrifier biomass (data not shown).
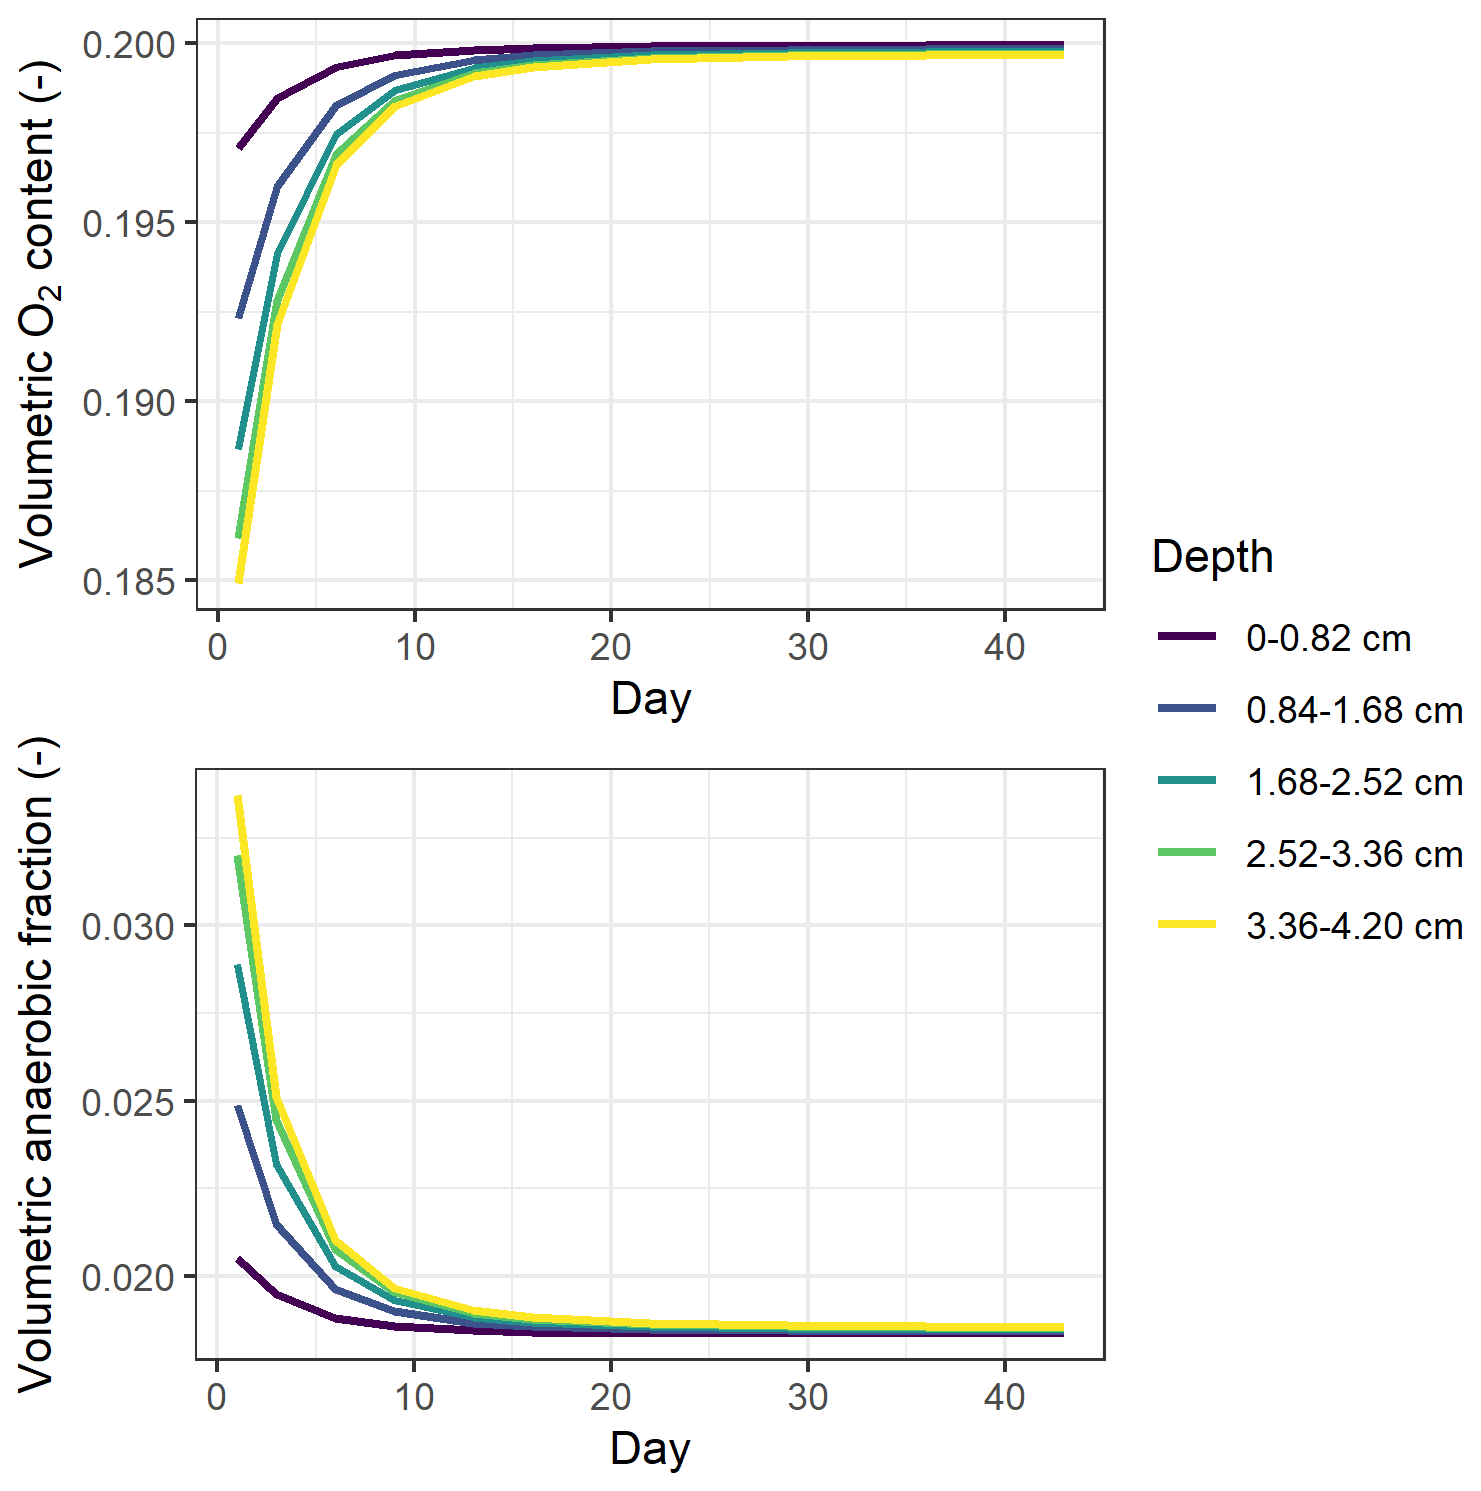
Figure 8Simulated O2 content and volumetric anaerobic fraction by the multi-layer model for the treatment with the greatest soil respiration rate (i.e., RC treatment with NO addition at 60 % WFPS). The mean daily values from posterior runs were used here.
3.2.5 Calibrated parameters
Although the number of parameters used for calibration had been reduced by Morris screening, more than half of the 26 calibrated parameters still exhibited random distributions within the predefined ranges (Fig. S4). High inter-correlations between posterior parameters may explain why some parameters could not be constrained to an unambiguous solution. But five parameters were showing marked variability between treatments in their posterior distributions as depicted in Fig. 9, where the prior ranges of these parameters are indicated in the ordinate.
In most treatments, the parameter dhrateNxOy, representing the half-saturation constant of N concentration in the denitrification process and also known as the Michaelis constant of the enzyme, was well constrained at the lower range of the parameter boundary within 50 mg N L−1 in contrast to the mean of 250 mg N L−1 in the prior range (Fig. 9). A low dhrateNxOy relative to the physical concentration of NO resulted in a pronounced response of denitrifying bacteria activity to substrate availability (see Eq. 6.44 in Table S2). In some treatments which had no NO addition, i.e., treatment 3, 7, 9, and 13, the parameter showed more diffuse distribution and higher medians compared to other treatments (Fig. 9). An enzyme with high dhrateNxOy relative to the concentration of substrate is not normally saturated with substrate, and thus the rate of formation of product is substrate-limited.
In more than half of the treatments, the posterior distribution of cnm, the microbial ratio (cnm) involved in calculations of mineralization and immobilization, was concentrated at around 10 on average. However, for some NO-amended treatments which usually had higher N2O emission rates, i.e., treatments 4, 6, 10, 12, and 14, the distribution of the calibrated microbial ratio was not well constrained but similar to the prior distribution with medians up to 20.
The parameter representing the rate coefficient for the decay of the litter carbon pool, kl1, generally showed higher values in WW treatments than controls, and its range for the high nitrate RC treatment at 60 % WFPS (treatment 4) was markedly higher than other treatments, indicating the faster decomposition of labile organic matter. Besides, the efficiency of NO-based denitrifier respiration, deffNO, showed a low-range distribution for treatment 4. Low deffNO values induced a high respiration rate of denitrifiers carrying out NO reduction (see Eq. 6.47 in Table S2). This treatment also exhibited a low-range distribution of the efficiency of SOM decomposition, fe,l1, associated with a high fraction of CO2 production.
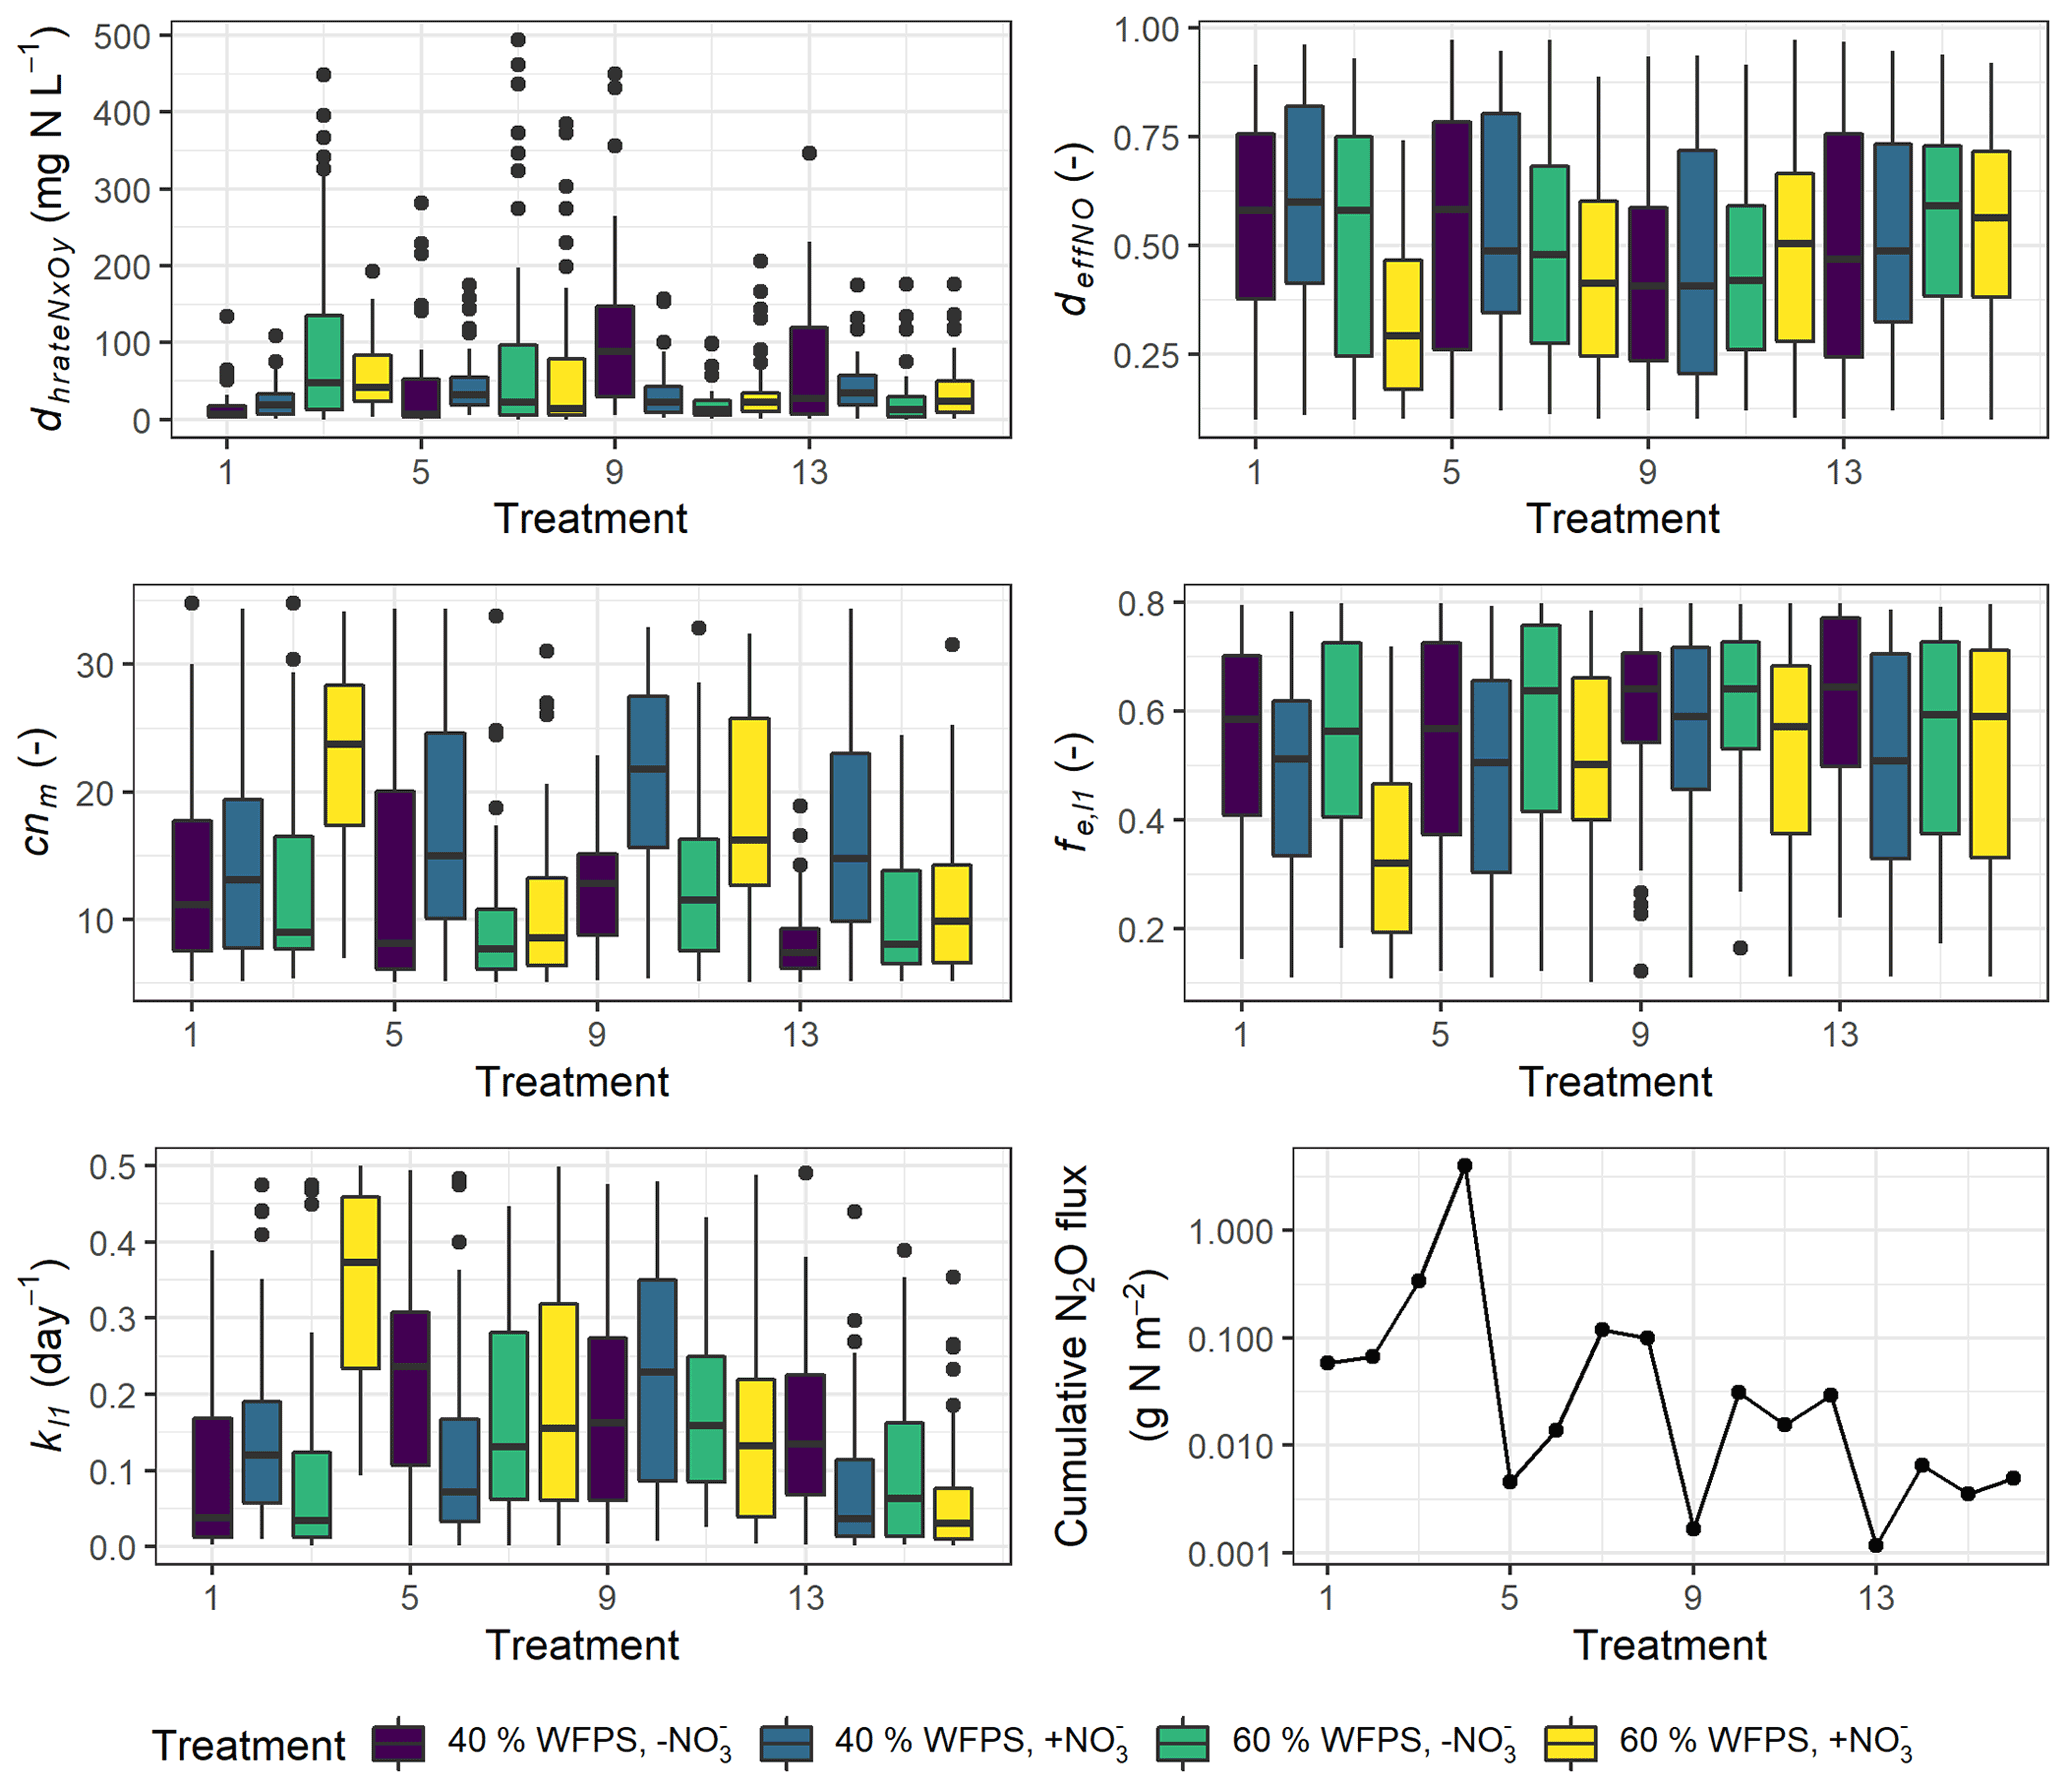
Figure 9Variability in five calibrated parameters among the 16 treatments. The boxplots show the 25 % and 75 % percentiles as the tops and bottoms of the boxes, and the medians as the bold lines. Treatment indices 1–4 represent treatments for mix RC, 5–8 for control RC, 9–12 for mix WW, and 13–16 for control WW, where treatment conditions are, in order, “40 % WFPS, −NO”, “40 % WFPS, +NO”, “60 % WFPS, −NO”, and “60 % WFPS, +NO”.
4.1 Simulation of decomposition and denitrification processes
The sensitivity analyses, investigating the impact of parameter uncertainties on model predictions, showed the importance of the parameter interactions and associations between different processes in the model (Fig. 3a–f). Compared with CO2 emissions and soil NH content, N2O emissions were controlled by a larger range of parameters related to decomposition and denitrification processes and had generally lower SEEs. According to Fig. 3a, reliable information about the size of humus and litter pools and their decomposition rates will be critical in reducing the uncertainty of simulated N2O emissions, and this could be particularly true where part of the soil organic matter is fresh input from residues. The results confirm the findings of previous experimental and modeling studies showing the importance of substrate heterogeneity for simulations of decomposition and denitrification processes (Brilli et al., 2017; Eusterhues et al., 2003; Sierra et al., 2011). However, other studies (Dungait et al., 2012; Schmidt et al., 2011) also indicate that the chemical structure of organic molecules alone may not determine their stability in soil, and environmental and biological controls (e.g., accessibility of the SOM to decomposers, abiotic reactions, and desorption) predominate, especially in the longer term.
In our model simulations, C and N in crop residues were allocated to two labile pools, but the allocation ratio did not greatly influence N2O emissions, soil respiration, or mineral N. This could be related to the fact that the overall ratio of crop residues was kept constant as the sizes of organic matter pools changed in the sensitivity analysis. The influence of crop residues on N2O emissions may be better reflected in other residue properties, e.g., the ratio and solubility of individual substrates (Aulakh et al., 1991; Surey et al., 2020). Furthermore, it should be noted that the addition of labile carbon from crop residues does not affect the decomposition of native soil organic matter in the model (i.e., no priming effect), as the decomposition of organic matter in labile and recalcitrant pools is calculated separately in CoupModel, as in other process-based models. The omission of a priming effect, the importance of which has been shown in field and laboratory studies (Kuzyakov, 2010), may cause models to underestimate the effects of crop residue composition on soil C and N turnover, particularly in connection with the initial burst of gas emissions.
In the present study, denitrifier growth parameters (e.g., deffNO, dgrowthNO3) showed considerable influence on the release of N2O in most treatments (Fig. 3a). Our results suggested that the influences of microbial activities on N2O emissions varied between different denitrification steps, and the denitrifier respiration for NO reduction showed a relatively larger and broader impact across treatments than other steps. The analysis of the two statistical measures σ and μ suggested that, rather than a single factor driving the model to become more “behavioral” in predicting N2O emissions, the collective effects of multiple parameters were more important because one single parameter could exhibit various SEEs as other parameters changed, represented by high variability (σ) compared to the mean (μ) in Fig. 3d. For calibration of complex models, several combinations of different parameter values might give the same goodness-of-fit between model outputs and measured variables, which is defined as equifinality (Beven and Freer, 2001). The model sensitivity to such parameters is probably attenuated in the case of high-level equifinalities. Besides, the importance of the parameter interaction structure associated with equifinality could hinder the constraint of parameters and hence the reduction of uncertainty in N2O simulations when limited measurement data are available. For instance, the fraction of C mineralized to CO2, characterized by , and the decay rate of litter1 (kl1) have a product interaction regarding the production of CO2 (see Eqs. 6.3 and 6.4 in Table S2). Also, the denitrifier growth rates (e.g., dgrowthNO3) and the half-saturation constant of nitrogen substrates (dhrateNxOy) influence the loss of N from anaerobic N pools by invoking microbial growth via a quotient interaction (see Eq. 6.41 and Eq. 6.44 in Table S2).
The parameters which have the greatest impact on soil respiration and NH content were associated with SOM composition (SOCh) and decomposability (kl1, kl2, fe,l1, fe,l2), suggesting that model uncertainty for soil respiration and soil NH could be greatly reduced if experimental data for either SOM composition or decay rates were available. For simulation of soil NH, information about the microbial ratio (cnm) and denitrifier growth parameters (e.g., dgrowthNO3) is also important because the availability of soil mineral N is closely associated with decomposition dynamics and its consumption by immobilization, nitrification, and denitrification (Lashermes et al., 2022). The influence of the soil wilting point on CO2 emissions and soil NH content was larger under dry conditions, while soil porosity had a greater effect on these two variables under wet conditions. Soil porosity and wilting point are key set points of the soil moisture response function controlling the upper and lower bounds of the function, which implies that the measurement of soil hydraulic properties could reduce model uncertainty under contrasting soil moisture levels.
4.2 Model performance and possible explanations for deviations
Overall, the performance of posterior models varied between estimated variables and treatments. The timing and magnitude of peak N2O emissions were more difficult to predict than those of CO2 emissions. The GLUE calibration greatly reduced model uncertainty associated with N2O gas emissions, with an average reduction of 83 % in the posterior ME range for all treatments (Fig. 4a), whereas the model still had difficulties capturing high emissions observed in the incubation (Fig. 5a). This was probably in part due to model biases in describing abiotic and biotic properties but also due to uncertainties in the measurement dataset as discussed below (see Sect. 4.4). The model performance was generally consistent with previous attempts to simulate N2O emissions from agricultural soils where models have been able to reproduce the cumulative emissions but had the same difficulties in describing the actual dynamics (e.g., Fuchs et al., 2020; He et al., 2016). The evaluation of model bias with respect to the slope β1 in the linear regression of model results vs. observations (Table 1) showed that the model had a better performance in its simulation of CO2 fluxes and soil mineral contents than N2O fluxes. The major mismatch between the model and measurements was associated with the underestimation of N2O flux during the first 3 d of the experiment. Nevertheless, our model showed initial success by better capturing the timing of N2O for mix RC, particularly for “60 % WFPS, +NO” (R2>0.4, Fig. 5a) than other treatments. According to Gaillard et al. (2018), who evaluated the simulated N2O flux from three process-oriented models (DNDC, DayCent, and EPIC), an underestimation of 0.01–0.93 kg N2O–N ha−1 for every 1 kg of observed N2O–N ha−1 across these models was reported. When Fang et al. (2015) applied four different algorithms to an irrigated corn field, they found that all algorithms underestimated the four highest cumulative N2O fluxes among eight N fertilizer treatments and explained this with an underestimation of soil water content. In the present study, parameter-induced biases may have been an important source of simulation uncertainty as shown in Fig. 5, as some microbial coefficients were loosely constrained, with more denitrification-related parameters than other process parameters (Fig. 3). So far very few studies have reported parameterization and calibration of C and N cycling for incubation experiments. Our identified parameter sensitivities and constrained parameters could provide a reference for future modeling of similar systems. More discussion of parameter calibration is presented in Sect. 4.4.
The unamended soil treatments (controls) were well described by the model, indicating that the repacked and pre-incubated soil was a suitable representation of normal soil conditions. For amended soils, a rapid increase in soil NH was observed by day 1, while the modeled NH tended to have a delayed increase for most residue treatments (Fig. 5c). According to Lashermes et al. (2022), the red clover residues contained water-soluble N (WSN) corresponding to ca. 1 g N m−2, which can account for the observed increase. Cutting and mixing residues into the soil probably accelerated the release and mineralization of N from the WSN pool compared to a real field situation (Angers and Recous, 1997), challenging the model that was calibrated to describe decomposition in natural environments (see Sect. 4.4 for more discussion). It also stresses the importance of realistic experimental setups for model parameterization under controlled laboratory conditions. The accumulating trend of NH simulated for the RC residue treatments was in contrast to the transient NH peaks observed (Fig. 5c), which indicates that the modeled NH release from residue decomposition was greater than the NH consumption by microbial immobilization and nitrification that was simulated. By setting stricter selection criteria of ME and R2 regarding NH, such a trend could be avoided, but this was accompanied by decreased N2O emission rates owing to reduced net N mineralization (data not shown). In our study, the relationships between N2O flux residuals and the residuals for mineral N were weak and not significant, indicating that the N2O underestimation at high flux ranges may also be due to other factors.
Inaccurate estimation of proximal factors such as soil water content and temperature by the pedo-climatic subroutines has been put forward as a main cause of errors in simulating C and N emissions in many process-based models (Brilli et al., 2017), but in the present study, the soil water content and temperature were constant during incubation. Instead, a heterogeneous distribution of water within residue-amended soil cores could be a problem for the description of soil water content in the model because water retention capacity in the soil might be altered by the practice of adding crop residues. Lashermes et al. (2022) found that adding crop residues to soil increased the average WFPS of this layer from 60 % to 63 %. Also, Kravchenko et al. (2017) found that specific gravimetric moisture of plant residues in soil could vary in the range of 60 % to 220 % and that residues were characterized by high moisture even at low soil water contents. Hence, the main effect of crop residues on the abiotic soil environment is probably not the marginal change in the average soil moisture content but more likely the co-occurrence of elevated water content and labile C and N within the soil core. Residue fragments with high water retention capacity could represent microenvironments markedly different from those of the bulk soil and promote N2O emissions (Kravchenko et al., 2017).
Model results indicated that the simulated O2 content of soil air at 0–4 cm depth changed only slightly during incubation and was close to the saturation partial pressure in the atmosphere owing to faster diffusion supply compared to soil respiration rates (Fig. 8). However, most O2 consumption likely occurred in the microenvironment around residue particles. This is supported by observations of O2 concentration profiles in soil using O2 microsensors (Markfoged et al., 2011) and planar optodes (Kravchenko et al., 2017), which showed the aerated O2 partial pressure in the soil matrix away from organic hotspots and steep gradients in O2 between bulk soil and hotspots of manure and residues, respectively. Model simulations found that denitrification was the major process that produced N2O in the experiment, accounting for 76 % to 100 % of the total estimated N2O emissions. Parkin (1987) found that a thin water film, even as little as 20 µm, could be enough to deplete air and support denitrification at the surface of decaying litter, and it is thus possible that the observed high N2O fluxes were produced via denitrification despite a high average oxygen status within the soil. However, existing process-based models do not describe the heterogeneity in physical and biochemical processes caused by organic amendments, which may limit the ability of these models to reflect the microscale anaerobiosis and SOC availability, as well as to predict peak N2O emissions such as those observed in RC treatments (Fig. 5a). Some studies have explored methods to incorporate spatial variability into denitrification models, although conceptual frameworks considering effects of heterogeneity on greenhouse gas emissions have only in recent years emerged and gained attention (Sihi et al., 2020). Using a stochastic modeling approach, Parkin (1987) found that the patchy dispersion pattern of high denitrification microsites was a major factor influencing the overall rates of denitrification. Based on a parsimonious numerical model, Sihi et al. (2020) used probability distribution functions to represent soil microsite production and consumption of three greenhouse gases, which explained occasional observations of simultaneous N2O uptake (reduction) and CH4 uptake (oxidation) that were not typically captured by other models. We suggest that model development should improve the representation of microscale processes in soil, for instance by parameterizing the distribution and extent of heterogeneity in, for example, organic amendments and clay content and by establishing the degree of anaerobiosis associated with organic hotspots and bulk soil separately.
The simultaneous underestimation of N2O and NO in model runs (Figs. 5d and S1) may have been due to an incomplete description of nitrate supply in the residue-amended 0–4 cm soil layer. In a separate incubation experiment using the same soil and experimental design and several of the same treatments, Lashermes et al. (2022) found that adding RC residue to the 0–4 cm soil layer induced a decrease in the NO content of the unamended 4–8 cm depth layer, indicating that NO removal in the upper, amended layer during denitrification caused a diffusive mass transfer between the two layers. In the current model framework, solute transport is only possible by convection (driven by water flow) and does not include diffusion driven by concentration gradients. Under field conditions, this spatial-scale infiltration is the main mechanism for solute transport between compartments, but for a period after organic amendments, diffusive NO supply from the bulk soil can be the most important source of electron acceptor for denitrification, as observed in earlier incubation studies (Nielsen et al., 1996; Petersen et al., 1996). The current solute transport process may thus not be sufficient to properly simulate N2O production on small scales, especially under low flow rates or for short travel distances where diffusive flux becomes increasingly important (Flury and Gimmi, 2018).
The differences in the posterior parameter distributions provided information about the simulation of C and N processes between treatments. For example, the microbial biomass ratio (cnm) was constrained within 10 in most treatments, consistent with observations that, on average, the ratio of the soil microbial biomass varies between 6 and 10 (Xu et al., 2013) and does not easily change with litter quality (Spohn, 2015). Fungal cells typically have a ratio ranging from 10 to 15, while bacteria range from 3.5 to 7 (Paul, 2007). In some treatments associated with extra NO input and high N2O emissions, however, the microbial ratios in accepted runs exhibited relatively high values closer to the soil–residue-mixture ratio. According to Eqs. (6.7) and (6.8) in Table S2, a relatively high cnm coincides with simulations of low humification (i.e., less labile C and N converted to recalcitrant matter), as well as intense N mineralization (i.e., more organic N in litter pools converted to NH). At the same time, the relatively low values of estimated Michaelis constant dhrateNxOy suggested a high microbial affinity for soluble nitrogen oxides. These trends all promote N availability for denitrification, and we propose with reference to Lashermes et al. (2022) that ratios above 10 were related to an inaccurate assumption that there was no diffusive supply of NO from the 4–8 cm soil layer. Including solute diffusion in the model may be able to change the posterior distributions of both parameters by better mimicking the mineral N supply.
Compared to control soils, C and N dynamics in residue-amended soil, especially at the high moisture level (Fig. 5a), were difficult to simulate. In the experiment, rapid organic matter turnover in the residue-soil mixture was possibly caused by a high concentration of decomposer microorganisms associated with residue fragments. As discussed above, the rapid decay of organic matter (kl1, kl2) and high CO2 formation rate (fe,l1, fe,l2) in the calibrated parameters in these amended treatments reflected the need to mobilize N for nitrification and denitrification processes to simulate observed N2O emissions from amended soils.
We also noted that the model deviations for N2O flux were not caused by the spatial resolution of the vertical soil profile, which has been a problem in some studies (e.g., Xing et al., 2011), as model performance concerning N2O prediction was not improved in the multi-layer model (Table S6) where the one-layer soil profile had been sub-divided into five layers for simulations. This was not surprising since structural uncertainty was not addressed in this way; for example, increasing the number of layers would not reflect the microscale processes associated with crop residue fragments and soil aggregates, nor would it address the missing description of solute diffusion between interfaces.
4.3 Treatment effects
We only investigated how the model responded to the specific change for two soil moisture and NO levels, but the results we obtained after calibrating the model against multiple treatments indicated that it is difficult to predict N2O emissions under varying soil environmental conditions using a common model parameterization (Fig. 7). In the multiple treatment calibration, similar cumulative N2O fluxes were simulated for treatments with the same NO level regardless of the soil moisture level, which was different from observations. For instance, in the experiment with RC treatments, higher N2O fluxes were associated with the higher WFPS level (60 %) rather than with the higher NO level but with a strong interaction between the two factors (Taghizadeh-Toosi et al., 2021). However, single-treatment calibration showed more success to simulate the effects of different soil moisture levels on N2O fluxes. In a recent study, Grosz et al. (2021) also found it difficult to describe treatments in incubation studies with three N2O models (DNDC, CoupModel, and DeNi) that responded to controlling factors in the same direction as measurements with frequencies from only 19 % to 67 %. In CoupModel, soil moisture effects have indirect effects on denitrification through decomposition, nitrification, and gas diffusion processes in which the soil moisture response function and its association with anaerobic conditions were accounted for. Hence, soil moisture may have had fewer or delayed effects on the N2O emissions in model applications than in soil incubations with non-uniform distribution of moisture and C and N sources. The model deviations in our study, obtained by calibration of multiple treatments, suggested that potential limitations in model assumptions or the description of mechanisms were more important for unsatisfactory model responses than parameterization. It should be noted, however, that only two moisture levels were included in the experimental setup, and in the absence of a more detailed moisture gradient, we were unable to draw more concrete conclusions about the model's performance in simulating soil moisture effects.
On the other hand, with the same type of residue amendment, treatments with higher cumulative N2O fluxes – either high soil moisture level or high N input – were better simulated by the model (Fig. 7a). This can be understood from the characteristics of the calibration dataset and selection criteria. The high flux samples represented only a minor fraction of the total samples (i.e., 40 sampling points) in each group but were higher than the rest of them by orders of magnitude (Fig. 5a). The application of the ME criterion mainly constrained model deviations for the high fluxes in each dataset and less so for minor fluxes. It may be argued that this limitation could be improved by applying more stringent additional criteria such as R2. However, this would reduce the acceptance rate or even refuse all posterior runs. Interestingly, Vezzaro et al. (2012) obtained similar results in a GLUE context by using the Nash–Sutcliffe-based likelihood and stormwater measurements with large internal variability, and they concluded that the choice of selection criteria should be based not only on their mathematical features but also by looking at the characteristics of the available data.
4.4 Improving modeling practice and experimental design
Some reasons for deviations between model simulations and experimental results were already discussed, but possibly other microbial and physiochemical processes are also not well described by current modeling practices. For example, enzymatic processes accounting for N2O production and reduction could change progressively during incubation, which is not reflected in fixed parameter values, as in this study. Khalil et al. (2005), coupling model and soil batch experiments, demonstrated the importance of an increase in the ability of denitrifiers to reduce N2O for correct simulation of N2O dynamics and variations in N2O (N2O + N2) ratios, especially when anaerobic conditions lasted more than 1 d. Microbial biomass and enzyme production can also vary under field conditions. Davidson et al. (2012) found that allowing model parameters to vary seasonally was more effective for modeling field data than calibrating parameters fixed at constant values to the entire annual dataset.
In view of these reports, we tried to test the sensitivity of simulated N2O emissions to dynamic parameters using the default setup as a benchmark. Two parameters, deffNO and deffN2O, were selected to simulate an increase with time in the ability of denitrifiers to produce and reduce N2O, respectively, by assigning different values before and after day 3. The results (Fig. S7) show that the time course of N2O emissions could be manipulated, with an intensification of the N2O reduction activity over time changing the timing of an emission peak. It indicates that the use of fixed model parameters for short-term incubation experiments could lead to systematic errors if biotic properties such as the activity of enzymes or the affinity for a substrate of soil microbes vary significantly.
The rapid N mineralization in RC treatments during the early stage of incubation (Fig. 5c) may have been associated with disturbances in the experimental setup (see Sect. 4.2), which is beyond the description of the model framework. We conducted a simple sensitivity test with initial NH content on treatment 4 using default parameters and one calibrated parameter combination from the posterior ensemble. We found that by setting the initial NH content to different values between the observations on day 0 (value taken from the corresponding control) and day 1 to account for the rapid mineralization of WSN, simulated N2O in the early stage could be enhanced (Fig. S8), and the impact was linked to parameter values. When using process-based models to simulate such systems, the measurements taken shortly after experiment initialization can be more suitable model inputs compared to the values from the starting point, and thus frequent measurements in the early stage of experiments are required.
We also found that our capacity to evaluate model performance was limited by the data available for model estimation and calibration. Firstly, some model parameters were not assessed in the incubation experiment (e.g., soil and residue labile C content and microbial biomass), and their values were either estimated or determined by calibration. Proximal chemical analysis related to these properties of soil samples could help reduce model uncertainties. Secondly, the quality and temporal resolution of the measurements of controlling factors such as NO and NH were limited. We used mean values of recalculated measurements to compare with model simulations, in which any measurement error was included in parameter ranges. Having explicit measurements in each layer (i.e., soil–residue mixture and bulk soil layer) of incubated soil cores and having higher measurement frequencies of mineral N and gas emissions within the first 24 h of the experiment are promising tools to improve the reliability of experimental data for modeling. Thirdly, in soil N2O modeling, measuring more ancillary variables regarding N cycling (e.g., N2, NO) and using state-of-the-art techniques (e.g., 15N gas flux methods) could help test the validity of model principles (Grosz et al., 2021). Although collecting all data types discussed here is not always possible or practical, we consider that reporting ancillary model outputs regarding N cycle processes even in the absence of observations, particularly the denitrification products, soil oxygen content, and anaerobic fraction, will aid model evaluation efforts, which was not done very often in previous studies. Accordingly, closer collaboration between modelers and experimentalists is essential to increase mutual understanding, enforce better modeling practices, and find new knowledge by merging data and modeling.
The current setup of CoupModel, when applied to results from an incubation study, indicated that parameters associated with the decomposition of SOM and denitrifier growth were important in regulating soil respiration and mineral N dynamics. A high level of parameter interaction and equifinality issues that exist in simulating N2O emissions has brought us challenges in quantifying parameter sensitivities and improve parameter constraints.
The parameters showing posterior distributions that differed from the prior distributions revealed specific modeled microbial processes between treatments and may be used as references behind observations. For example, in the treatments with NO addition, the relatively low values of dhrateNxOy in the posterior distribution suggested a high microbial affinity for soluble nitrogen oxides, accelerating microbial denitrification. More intense SOM decomposition was simulated in residue treatments compared to the “control” simulations.
The uncertainty analysis demonstrated that a model bias towards underestimating high-range daily and cumulative N2O fluxes was likely associated with a simplified description of microbial processes in mineral N dynamics. While the simulated soil respiration response to soil moisture was generally in line with the direction of measurement, the modeled N2O emissions were not as sensitive to the WFPS as the measured data, but further assessment of this requires experimental data with more moisture levels. We discussed potential model structure uncertainties based on current model outcomes (i.e., the prediction bias, oxygen profiles, N2O sources, and moisture effects) and the emerging knowledge in recent experimental studies. Several suggestions for model improvement were described, including the use of new parameters and equations to represent microscale heterogeneity, as well as a re-examination of the effects of soil moisture on denitrification processes with the assistance of more experimental data. Under the current modeling framework, allowing for dynamic microbial parameters in calibration and careful consideration of initial mineral N conditions may assist in better model representation of microbial and physiochemical processes in the context of incubation experiments, as well as N application in field conditions.
Generally, we conclude that modeling N2O emissions in controlled experiments is useful to identify the need for prior knowledge in both basic (e.g., decomposability of SOM) and elaborate (e.g., denitrifier growth) aspects of the process-based model for reducing the uncertainty of N2O flux estimates. Moreover, we identified potential model deviations from observations and discussed future steps that may be required to assess their sources. We believe there is a need to revisit basic model assumptions and improve the experimental design that enables more effective modeling practices, model evaluation, and comparison.
The codes and descriptions of the models are available from the authors on request.
The laboratory experiment and the modeled gas flux data are available from the authors on request.
The supplement related to this article is available online at: https://doi.org/10.5194/bg-19-4811-2022-supplement.
JZ and SOP conceived the study. JZ designed the modeling experiments and carried them out, with contributions from WZ and SOP. PEJ made a version of CoupModel available for the study and provided advice for model application. JZ prepared the manuscript and figures with contributions from all co-authors.
The contact author has declared that none of the authors has any competing interests.
Publisher’s note: Copernicus Publications remains neutral with regard to jurisdictional claims in published maps and institutional affiliations.
This study was financially supported by Danmarks Frie Forskningsfond (grant no. 0136-00118B). Arezoo Taghizadeh-Toosi is acknowledged for having provided the experimental data. We further thank Iris Vogeler Cronin for providing insights on the model results. Wenxin Zhang acknowledged the grant from the Swedish Research Council VR 2020-05338.
This research has been supported by the Danmarks Frie Forskningsfond (grant no. 0136-00118B).
This paper was edited by Lutz Merbold and reviewed by two anonymous referees.
Abdalla, M., Jones, M., Yeluripati, J., Smith, P., Burke, J., and Williams, M.: Testing DayCent and DNDC model simulations of N2O fluxes and assessing the impacts of climate change on the gas flux and biomass production from a humid pasture, Atmos. Environ., 44, 2961–2970, https://doi.org/10.1016/j.atmosenv.2010.05.018, 2010.
Angers, D. A. and Recous, S.: Decomposition of wheat straw and rye residues as affected by particle size, Plant Soil, 189, 197–203, https://doi.org/10.1023/A:1004207219678, 1997.
Aulakh, M. S., Walters, D. T., Doran, J. W., Francis, D. D., and Mosier, A. R.: Crop residue type and placement effects on denitrification and mineralization, Soil Sci. Soc. Am. J., 55, 1020–1025, https://doi.org/10.2136/SSSAJ1991.03615995005500040022X, 1991.
Beven, K. and Binley, A.: The future of distributed models: model calibration and uncertainty prediction, Hydrol. Process., 6, 279–298, https://doi.org/10.1002/HYP.3360060305, 1992.
Beven, K. and Freer, J.: Equifinality, data assimilation, and uncertainty estimation in mechanistic modelling of complex environmental systems using the GLUE methodology, J. Hydrol., 249, 11–29, https://doi.org/10.1016/S0022-1694(01)00421-8, 2001.
Brilli, L., Bechini, L., Bindi, M., Carozzi, M., Cavalli, D., Conant, R., Dorich, C. D., Doro, L., Ehrhardt, F., Farina, R., Ferrise, R., Fitton, N., Francaviglia, R., Grace, P., Iocola, I., Klumpp, K., Léonard, J., Martin, R., Massad, R. S., Recous, S., Seddaiu, G., Sharp, J., Smith, P., Smith, W. N., Soussana, J.-F., and Bellocchi, G.: Review and analysis of strengths and weaknesses of agro-ecosystem models for simulating C and N fluxes, Sci. Total Environ., 598, 445–470, https://doi.org/10.1016/j.scitotenv.2017.03.208, 2017.
Butterbach-Bahl, K., Baggs, E. M., Dannenmann, M., Kiese, R., and Zechmeister-Boltenstern, S.: Nitrous oxide emissions from soils: how well do we understand the processes and their controls?, Philos. T. R. Soc. B, 368, 20130122, https://doi.org/10.1098/rstb.2013.0122, 2013.
Chen, D., Li, Y., Grace, P., and Mosier, A. R.: N2O emissions from agricultural lands: a synthesis of simulation approaches, Plant Soil, 309, 169–189, https://doi.org/10.1007/s11104-008-9634-0, 2008.
Davidson, E. A. and Kanter, D.: Inventories and scenarios of nitrous oxide emissions, Environ. Res. Lett., 9, 105012, https://doi.org/10.1088/1748-9326/9/10/105012, 2014.
Davidson, E. A., Samanta, S., Caramori, S. S., and Savage, K.: The Dual Arrhenius and Michaelis – Menten kinetics model for decomposition of soil organic matter at hourly to seasonal time scales, Glob. Change Biol., 18, 371–384, https://doi.org/10.1111/j.1365-2486.2011.02546.x, 2012.
Dungait, J. A. J., Hopkins, D. W., Gregory, A. S., and Whitmore, A. P.: Soil organic matter turnover is governed by accessibility not recalcitrance, Glob. Change Biol., 18, 1781–1796, https://doi.org/10.1111/j.1365-2486.2012.02665.x, 2012.
Eusterhues, K., Rumpel, C., Kleber, M., and Kögel-Knabner, I.: Stabilisation of soil organic matter by interactions with minerals as revealed by mineral dissolution and oxidative degradation, Org. Geochem., 34, 1591–1600, https://doi.org/10.1016/j.orggeochem.2003.08.007, 2003.
Fang, Q. X., Ma, L., Halvorson, A. D., Malone, R. W., Ahuja, L. R., Del Grosso, S. J., and Hatfield, J. L.: Evaluating four nitrous oxide emission algorithms in response to N rate on an irrigated corn field, Environ. Model. Softw., 72, 56–70, https://doi.org/10.1016/j.envsoft.2015.06.005, 2015.
Firestone, M. K. and Davidson, E. A.: Microbiological basis of NO and N2O production and consumption in soil, Life Sci. R., 47, 7–21, 1989.
Flury, M. and Gimmi, T. F.: 6.2 Solute Diffusion, in: Methods of Soil Analysis: Part 4 Physical Methods, edited by: Dane, J. H. and Topp, C. G., 1323–1351, Soil Science Society of America, Inc., Madison, US, 1323–1351, https://doi.org/10.2136/sssabookser5.4.c55, 2018.
Fuchs, K., Merbold, L., Buchmann, N., Bretscher, D., Brilli, L., Fitton, N., Topp, C. F. E., Klumpp, K., Lieffering, M., Martin, R., Newton, P. C. D., Rees, R. M., Rolinski, S., Smith, P., and Snow, V.: Multimodel evaluation of nitrous oxide emissions from an intensively managed grassland, J. Geophys. Res.-Biogeo, 125, 1–21, https://doi.org/10.1029/2019JG005261, 2020.
Gaillard, R. K., Jones, C. D., Ingraham, P., Collier, S., Izaurralde, R. C., Jokela, W., Osterholz, W., Salas, W., Vadas, P., and Ruark, M. D.: Underestimation of N2O emissions in a comparison of the DayCent, DNDC, and EPIC models, Ecol. Appl., 28, 694–708, https://doi.org/10.1002/eap.1674, 2018.
Gijsman, A. J., Hoogenboom, G., Parton, W. J., and Kerridge, P. C.: Modifying DSSAT crop models for low-input agricultural systems using a soil organic matter–residue module from CENTURY, Agron. J., 94, 462–474, https://doi.org/10.2134/agronj2002.4620, 2002.
Goreau, T. J., Kaplan, W. A., Wofsy, S. C., McElroy, M. B., Valois, F. W., and Watson, S. W.: Production of NO and N2O by nitrifying bacteria at reduced concentrations of oxygen, Appl. Environ. Microbiol., 40, 526–532, https://doi.org/10.1128/aem.40.3.526-532.1980, 1980.
Grandy, A. S. and Robertson, G. P.: Initial cultivation of a temperate-region soil immediately accelerates aggregate turnover and CO2 and N2O fluxes, Glob. Chang. Biol., 12, 1507–1520, https://doi.org/10.1111/j.1365-2486.2006.01166.x, 2006.
Grosz, B., Well, R., Dechow, R., Köster, J. R., Khalil, M. I., Merl, S., Rode, A., Ziehmer, B., Matson, A., and He, H.: Evaluation of denitrification and decomposition from three biogeochemical models using laboratory measurements of N2, N2O and CO2, Biogeosciences, 18, 5681–5697, https://doi.org/10.5194/bg-18-5681-2021, 2021.
He, H., Jansson, P. E., Svensson, M., Meyer, A., Klemedtsson, L., and Kasimir, Å.: Factors controlling Nitrous Oxide emission from a spruce forest ecosystem on drained organic soil, derived using the CoupModel, Ecol. Modell., 321, 46–63, https://doi.org/10.1016/j.ecolmodel.2015.10.030, 2016.
Jansson, P.-E.: CoupModel: model use, calibration, and validation, Trans. ASABE, 55, 1335–1344, https://doi.org/10.13031/2013.42245, 2012.
Jansson, P.-E. and Karlberg, L.: Coupled heat and mass transfer model for soil-plant-atmosphere systems, https://www.coupmodel.com/documentation (last access: 10 February 2022), 2010.
Jansson, P.-E. and Moon, D. S.: A coupled model of water, heat and mass transfer using object orientation to improve flexibility and functionality, Environ. Model. Softw., 16, 37–46, https://doi.org/10.1016/S1364-8152(00)00062-1, 2001.
Keating, B., Carberry, P., Hammer, G., Probert, M., Robertson, M., Holzworth, D., Huth, N., Hargreaves, J. N., Meinke, H., Hochman, Z., McLean, G., Verburg, K., Snow, V., Dimes, J., Silburn, M., Wang, E., Brown, S., Bristow, K., Asseng, S., Chapman, S., McCown, R., Freebairn, D., and Smith, C.: An overview of APSIM, a model designed for farming systems simulation, Eur. J. Agron., 18, 267–288, https://doi.org/10.1016/S1161-0301(02)00108-9, 2003.
Khalil, K., Renault, P., Guerin, N., and Mary, B.: Modelling denitrification including the dynamics of denitrifiers and their progressive ability to reduce nitrous oxide: comparison with batch experiments, Eur. J. Soil Sci., 56, 491–504, https://doi.org/10.1111/j.1365-2389.2004.00681.x, 2005.
Kravchenko, A. N., Toosi, E. R., Guber, A. K., Ostrom, N. E., Yu, J., Azeem, K., Rivers, M. L., and Robertson, G. P.: Hotspots of soil N2O emission enhanced through water absorption by plant residue, Nat. Geosci., 10, 496–500, https://doi.org/10.1038/ngeo2963, 2017.
Kravchenko, A. N., Fry, J. E., and Guber, A. K.: Water absorption capacity of soil-incorporated plant leaves can affect N2O emissions and soil inorganic N concentrations, Soil Biol. Biochem., 121, 113–119, https://doi.org/10.1016/J.SOILBIO.2018.03.013, 2018.
Kuzyakov, Y.: Priming effects: interactions between living and dead organic matter, Soil Biol. Biochem., 42, 1363–1371, https://doi.org/10.1016/j.soilbio.2010.04.003, 2010.
Kuzyakov, Y. and Blagodatskaya, E.: Microbial hotspots and hot moments in soil: concept & review, Soil Biol. Biochem., 83, 184–199, https://doi.org/10.1016/j.soilbio.2015.01.025, 2015.
Lam, P. S., Sokhansanj, S., Bi, X., Lim, C. J., Naimi, L. J., Hoque, M., Mani, S., Womac, A. R., Narayan, S., and Ye, X. P.: Bulk density of wet and dry wheat straw and switchgrass particles, Appl. Eng. Agr., 24, 351–358, https://doi.org/10.13031/2013.24490, 2008.
Lashermes, G., Recous, S., Alavoine, G., Janz, B., Butterbach-Bahl, K., Ernfors, M., and Laville, P.: N2O emissions from decomposing crop residues are strongly linked to their initial soluble fraction and early C mineralization, Sci. Total Environ., 806, 150883, https://doi.org/10.1016/j.scitotenv.2021.150883, 2022.
Li, C., Frolking, S., and Frolking, T. A.: A model of nitrous oxide evolution from soil driven by rainfall events: 1. model structure and sensitivity, J. Geophys. Res.-Atmos., 97, 9759–9776, https://doi.org/10.1029/92JD00509, 1992.
Li, C., Aber, J., Stange, F., Butterbach-Bahl, K., and Papen, H.: A process-oriented model of N2O and NO emissions from forest soils: 1. model development, J. Geophys. Res.-Atmos., 105, 4369–4384, https://doi.org/10.1029/1999JD900949, 2000.
Markfoged, R., Nielsen, L. P., Nyord, T., Ottosen, L. D. M., and Revsbech, N. P.: Transient N2O accumulation and emission caused by O2 depletion in soil after liquid manure injection, Eur. J. Soil Sci., 62, 541–550, https://doi.org/10.1111/j.1365-2389.2010.01345.x, 2011.
Morris, M. D.: Factorial sampling plans for preliminary computational experiments, Technometrics, 33, 161–174, https://doi.org/10.1080/00401706.1991.10484804, 1991.
Nielsen, T. H., Nielsen, L. P., and Revsbech, N. P.: Nitrification and coupled nitrification-denitrification associated with a soil-manure interface, Soil Sci. Soc. Am. J., 60, 1829–1840, https://doi.org/10.2136/sssaj1996.03615995006000060031x, 1996.
Norman, J., Jansson, P.-E., Farahbakhshazad, N., Butterbach-Bahl, K., Li, C., and Klemedtsson, L.: Simulation of NO and N2O emissions from a spruce forest during a freeze/thaw event using an N-flux submodel from the PnET-N-DNDC model integrated to CoupModel, Ecol. Modell., 216, 18–30, https://doi.org/10.1016/j.ecolmodel.2008.04.012, 2008.
Parkin, T. B.: Soil microsites as a source of denitrification variability, Soil Sci. Soc. Am. J., 51, 1194–1199, https://doi.org/10.2136/sssaj1987.03615995005100050019x, 1987.
Parton, W. J., Mosier, A. R., Ojima, D. S., Valentine, D. W., Schimel, D. S., Weier, K., and Kulmala, A. E.: Generalized model for N2 and N2O production from nitrification and denitrification, Global Biogeochem. Cy., 10, 401–412, https://doi.org/10.1029/96GB01455, 1996.
Paul, E. A. (Ed.): Soil microbiology, ecology and biochemistry, 3rd Edn., Elsevier, Amsterdam, Netherlands, https://doi.org/10.1016/C2009-0-02816-5, 2007.
Petersen, S. O., Nielsen, T. H., Frostegård, Å., and Olesen, T.: O2 uptake, C metabolism and denitrification associated with manure hot-spots, Soil Biol. Biochem., 28, 341–349, https://doi.org/10.1016/0038-0717(95)00150-6, 1996.
Ratto, M., Tarantola, S., and Saltelli, A.: Sensitivity analysis in model calibration: GSA-GLUE approach, Comput. Phys. Commun., 136, 212–224, https://doi.org/10.1016/S0010-4655(01)00159-X, 2001.
Schmidt, M. W. I., Torn, M. S., Abiven, S., Dittmar, T., Guggenberger, G., Janssens, I. A., Kleber, M., Kögel-Knabner, I., Lehmann, J., Manning, D. A. C., Nannipieri, P., Rasse, D. P., Weiner, S., and Trumbore, S. E.: Persistence of soil organic matter as an ecosystem property, Nature, 478, 49–56, https://doi.org/10.1038/nature10386, 2011.
Sierra, C. A., Harmon, M. E., and Perakis, S. S.: Decomposition of heterogeneous organic matter and its long-term stabilization in soils, Ecol. Monogr., 81, 619–634, https://doi.org/10.1890/11-0811.1, 2011.
Sihi, D., Davidson, E. A., Savage, K. E., and Liang, D.: Simultaneous numerical representation of soil microsite production and consumption of carbon dioxide, methane, and nitrous oxide using probability distribution functions, Glob. Change Biol., 26, 200–218, https://doi.org/10.1111/gcb.14855, 2020.
Sin, G., Gernaey, K. V., and Lantz, A. E.: Good modeling practice for PAT applications: propagation of input uncertainty and sensitivity analysis, Biotechnol. Prog., 25, 1043–1053, https://doi.org/10.1021/bp.166, 2009.
Spohn, M.: Microbial respiration per unit microbial biomass depends on litter layer carbon-to-nitrogen ratio, Biogeosciences, 12, 817–823, https://doi.org/10.5194/bg-12-817-2015, 2015.
Surey, R., Schimpf, C. M., Sauheitl, L., Mueller, C. W., Rummel, P. S., Dittert, K., Kaiser, K., Böttcher, J., and Mikutta, R.: Potential denitrification stimulated by water-soluble organic carbon from plant residues during initial decomposition, Soil Biol. Biochem., 147, 107841, https://doi.org/10.1016/j.soilbio.2020.107841, 2020.
Syakila, A. and Kroeze, C.: The global nitrous oxide budget revisited, Greenh. Gas Meas. Manag., 1, 17–26, https://doi.org/10.3763/ghgmm.2010.0007, 2011.
Taghizadeh-Toosi, A., Janz, B., Labouriau, R., Olesen, J. E., Butterbach-Bahl, K., and Petersen, S. O.: Nitrous oxide emissions from red clover and winter wheat residues depend on interacting effects of distribution, soil N availability and moisture level, Plant Soil, 466, 121–138, https://doi.org/10.1007/s11104-021-05030-8, 2021.
U.S. Environmental Protection Agency: Guidance on the development, evaluation, and application of environmental models (report no. EPA/100/K-09/003), https://www.epa.gov/sites/default/files/2015-04/documents/cred_guidance_0309.pdf (last access: 9 February 2022), 2009.
Uzoma, K. C., Smith, W., Grant, B., Desjardins, R. L., Gao, X., Hanis, K., Tenuta, M., Goglio, P., and Li, C.: Assessing the effects of agricultural management on nitrous oxide emissions using flux measurements and the DNDC model, Agr. Ecosyst. Environ., 206, 71–83, https://doi.org/10.1016/j.agee.2015.03.014, 2015.
Vezzaro, L. and Mikkelsen, P. S.: Application of global sensitivity analysis and uncertainty quantification in dynamic modelling of micropollutants in stormwater runoff, Environ. Model. Softw., 27/28, 40–51, https://doi.org/10.1016/j.envsoft.2011.09.012, 2012.
Vezzaro, L., Eriksson, E., Ledin, A., and Mikkelsen, P. S.: Quantification of uncertainty in modelled partitioning and removal of heavy metals (Cu, Zn) in a stormwater retention pond and a biofilter, Water Res., 46, 6891–6903, https://doi.org/10.1016/j.watres.2011.08.047, 2012.
Wijler, J. and Delwiche, C. C.: Investigations on the denitrifying process in soil, Plant Soil, 5, 155–169, https://doi.org/10.1007/BF01343848, 1954.
World Meteorological Organization: WMO Greenhouse gas bulletin: the state of greenhouse gases in the atmosphere based on global observations through 2020, https://library.wmo.int/index.php?lvl=notice_display&id=21975#.YgFFTrrMJaQ (last access: 7 February 2022), 2021.
Xing, H., Wang, E., Smith, C. J., Rolston, D., and Yu, Q.: Modelling nitrous oxide and carbon dioxide emission from soil in an incubation experiment, Geoderma, 167/168, 328–339, https://doi.org/10.1016/j.geoderma.2011.07.003, 2011.
Xu, X., Thornton, P. E., and Post, W. M.: A global analysis of soil microbial biomass carbon, nitrogen and phosphorus in terrestrial ecosystems, Glob. Ecol. Biogeogr., 22, 737–749, https://doi.org/10.1111/geb.12029, 2013.
Zhang, Y., Ghaly, A. E., and Li, B.: Physical properties of wheat straw varieties cultivated under different climatic and soil conditions in three continents, Am. J. Eng. Appl. Sci., 5, 98–106, https://doi.org/10.3844/ajeassp.2012.98.106, 2012.