the Creative Commons Attribution 4.0 License.
the Creative Commons Attribution 4.0 License.
 | 12 Jan 2023
Sediment quality assessment in an industrialized Greek coastal marine area (western Saronikos Gulf)
Georgia Filippi
Manos Dassenakis
Vasiliki Paraskevopoulou
Konstantinos Lazogiannis
Eight sediment cores from the coastal marine area of the western Saronikos Gulf have been analysed for grain size and geochemistry. The concentrations of eight metals (Al, Fe, Mn, Cu, Cr, Ni, Pb and Zn) were measured along with total organic carbon (TOC) and carbonate content. The cores are fairly homogeneous in terms of carbonates and the downcore variability of TOC percentage (% TOC) and are characterized by high surficial values that decrease with depth. Metal concentrations from both geological (Al, Mn, Cr, Ni) and anthropogenic origin (Cu, Pb, Zn) are higher in the muddy fraction than in the sand fraction of sediments. The spatial distribution of Al, Fe, Mn, Cu, Pb and Zn in surface sediments presents increasing concentrations from the northeast to the southwest part of the study area and from the shallow to the deeper parts in contrast to Cr and Ni, which are increased in the northern nearshore stations. Based on the vertical distributions, the metal to Al ratios of Cu, Pb and Zn show a constant decrease over depth along most cores, indicating the anthropogenic effects to surface sediments, while is constant. Spearman's correlation analysis performed among the fine-grain metal contents demonstrated a strong positive correlation (r>0.5, p<0.05) between Al, Fe, Mn, Cu, Pb and Zn. The calculated enrichment factors indicate minimal to moderate pollution. The concentrations of Cr at most surface sediments are higher than the “effects range low” (ERL) value (81 mg kg−1) but below the “effects range median” (ERM) value (370 mg kg−1), and the concentrations of Ni are always higher than the ERM value (51.6 mg kg−1). In contrast, the concentrations of Cu, Pb and Zn at most surface sediments are below ERL values. The mean effects range medium quotients (mERMq) of surface sediments, based on the overall metal concentrations, indicated that the surface sediments of most cores are moderately toxic. The levels of Cr, Ni, Mn and Zn at most stations are decreased in 2017, but the concentrations of Pb and Cu are increased in 2017, compared to a previous study of 2007. The concentrations of Cu, Pb and Zn in the surface sediments of the western Saronikos Gulf are lower than levels reported for the inner Saronikos Gulf, Elefsis Bay and other polluted hotspot areas in Greece, owing to a lower degree of urban and industrial development.
- Article
(16010 KB) - Full-text XML
- BibTeX
- EndNote


Sediment cores are one of the most easily accessed natural archives, used to evaluate and reconstruct historical pollution trends in aquatic environments. The cores provide data to characterize sediment physical properties and their geochemistry and composition. Vertical profiles of heavy metals can present the sedimentation rate, changes in diagenetic processes and evolution of human pressures. Metals released into aquatic systems undergo several processes, such as adsorption, photolysis, chemical oxidation and microbial degradation. Sedimentation depends on contaminant physicochemical properties, sediment physical properties, adsorption capabilities and the partitioning constant at the water–sediment interface. Trace metals removed from the water column are adsorbed on particulate matter and eventually deposited on bottom sediments (Bigus et al., 2014).
Sediments are repositories for metals such as chromium, lead, copper, nickel, zinc and manganese that present as discrete compounds or ions held by cation-exchanging clays bound to hydrated oxides of iron and manganese or chelated by insoluble humic substances. Solubilization of metals from sedimentary or suspended matter depends on the presence of complexing agents. Metals that are held by suspended particles and sediments are less available than those in true solution (Manahan, 2011).
The Saronikos Gulf (Greece) is a marine area of the Aegean Sea between the Attic and Argolid peninsulas. The environmental interest in the Saronikos Gulf arises from the fact that it is the marine border of the most urbanized areas of Greece, i.e. the country's capital (Athens), the industrial zones of Attica (Elefsis, Thriasio, Sousaki) and the large port city of Piraeus. As a result, there have been ongoing environmental monitoring and oceanographic studies of the Saronikos Gulf since the 1980s. There are several published works focusing on the eastern part of the Saronikos Gulf due to the presence of extended and intensive anthropogenic activities (Scoullos, 1986; Pavlidou et al., 2004; Scoullos et al., 2007; Kontogiannis, 2010; Paraskevopoulou et al., 2014; Panagiotoulias et al., 2017; Karageorgis et al., 2020a; Prifti et al., 2022). In contrast, fewer studies have focused on northwestern Saronikos Gulf despite the presence of a less extensive industrial zone hosting a major oil refinery and coastal touristic activities in combination with a particular geological (volcanic/hydrothermal) background (Paraskevopoulou, 2009; Kelepertsis et al., 2001).
The main aim of this work is to assess the levels and the distribution of several heavy metals (Al, Fe, Mn, Pb, Zn, Ni, Cr, Cu) in sediment cores of the western Saronikos Gulf, in order to discern between the relative contribution of geological and anthropogenic origins and to identify the major sources of metal pollution. The second aim is to determine the evolution of marine pollution in the area by comparing the results with those of a similar study 10 years ago, conducted at the Laboratory of Environmental Chemistry (Department of Chemistry, National and Kapodistrian University of Athens). The last aim of this work is to assess and highlight the differences between the concentrations of heavy metals in the surface sediments of the western Saronikos Gulf in comparison to sediments in studies conducted in the eastern Saronikos Gulf, Elefsis Bay and other areas of Greece.
The Saronikos Gulf is situated in the central Aegean Sea (northeastern Mediterranean) between 37∘30′ and 38∘00′ N and 24∘01′ and 23∘00′ E between the Attic and Argolid peninsulas. The length of its coastline is 270 km, the surface is 2866 km2 and the mean water depth 100 m. To the north, a shallow (30 m depth) embayment is formed, known as Elefsis bay. The islands of Salamis and Aegina and the plateau between them divide the gulf into two basins: the western basin (western Saronikos Gulf), with maximum depths of 220 m in the north and 440 m in the south, and the eastern basin, which has a smooth bathymetry with depths of 50–70 m to the north (inner Saronikos Gulf) reaching 200 m to the southeast, from where the gulf opens to the Aegean Sea (outer Saronikos Gulf). To the west, the narrow Isthmus of Corinth connects the Gulf of Corinth with the Saronikos Gulf in the Aegean Sea (Kontoyiannis, 2010; Paraskevopoulou, 2014).
The gulf is subjected to a strong seasonal cycle of heating and cooling, with air temperatures between 0 and 40 ∘C, which causes the formation of a seasonal pycnocline from May to November. In winter, the water column is homogenized down to 120 m. However, in the western part, vertical mixing never reached the sea bottom (440 m) in the years after 1992, while dissolved oxygen concentration has approached nearly anoxic conditions (DO <1 mL L−1) (Paraskevopoulou et al., 2014).
A few circulation studies have been conducted in the Saronikos Gulf in order to discern the possible movement of the treated wastewater effluent discharged at 65 m south of Psyttaleia in the eastern basin. The circulation is reported as being strongly dependent on local winds and having a predominant northerly direction throughout the year. However, westerly and southerly winds may also occur in fall, winter and spring. Under the predominant northerly wind regime in summer and autumn during the presence of the seasonal pycnocline there is a distinctly different two-layer circulation above and below 60 m. In the upper layer there is a general eastward anticyclonic (clockwise) flow from the western basin to the eastern basin. Below 60 m the flow is reversed from the northeast through the Salamis–Aegina passage to the southwest towards the deeper part of the western basin following a cyclonic (anticlockwise) path. During winter when the water column is fully mixed down to 90 m, the general flow is anticyclonic from the west to east. Nearshore on the northwestern Sousaki coast, the currents reported are directed from the north to the south. In spring during the pycnocline formation there is no continuous flow structure spanning both the western and eastern basins. In the west, during spring there is a rather strong north to south flow (SoHelME, 2005; Kontoyiannis, 2010).
The Saronikos Gulf, as a whole, is subjected to intense anthropogenic pressure, as it is the marine border of the cities of Athens and Piraeus, an area with 3–4 million inhabitants. Several point and non-point pollution sources are present, mainly on the northeastern coasts. One of the most important point sources is the Athens–Pireaus wastewater treatment plant (WWTP) on the small island of Psyttaleia, among the largest in Europe, with a population equivalent (p.e.) coverage of 5.6 million. Other point sources along the coasts include the port of Piraeus, marinas, touristic facilities, fish farms and the effluent of smaller towns and settlements. Finally, pollution pressure arises from increased marine traffic, since Piraeus is one of the largest and busiest Mediterranean ports, and from the heavy-vehicle traffic and the heating systems in the extended urban areas (Paraskevopoulou et al., 2014).
The coastal marine area of the northern part of western Saronikos Gulf is affected by a few types of industries established there during the 1970s, including a major oil refinery unit at the centre of the Sousaki area, a cable manufacturer, soya mills, sulfur and fertilizer manufacturing for agricultural use, and is also affected by the increased sewage load from nearby coastal villages due to the summer tourist season (Kelepertsis et al., 2001; Paraskevopoulou, 2009). The settlements on the coast of the Western Saronikos Gulf, to the best of our knowledge, are not yet connected to wastewater treatment facilities, and a projected treatment plant in Agioi Theodoroi is under construction. The Sousaki area, which extends parallel to the northern coast of the western Saronikos Gulf for about 8 km, is known for its volcanic activity that took place during Pliocene and Quaternary. Most of the volcanic materials were transported by fluvial processes and deposited in the alluvial plains and coastal regions. The formations observed are peridotites and serpentinites, Neogene deposits, and Quaternary deposits. As a result, elevated values of Cr, Ni, Co, Mn and Fe are found in the soils and sediments of this area and can be explained by the existence of the ultrabasic rocks (Kelepertsis et al., 2001). The deeper southwestern part of the western Saronikos Gulf (Epidavros Basin) could be affected by the transport of organic and inorganic pollutants from the eastern basin due to the periodical northeast to southwest water flow below the pycnocline (Psyllidou-Giouranovits and Pavlidou, 1998; Kontoyannis, 2010).
Eight short sediment cores (12–32 cm) were obtained at a corresponding number of stations with varying depths (50–420 m) in the area of the western Saronikos Gulf with the use of a box corer. The sampling was conducted on 18 October 2017 with the Greek Oceanographic vessel R/V Aegaeo. The western Saronikos Gulf study area and the specific locations of stations are presented in Fig. 1.
Table 1Coordinates, water column depths and core lengths at each sampling station.
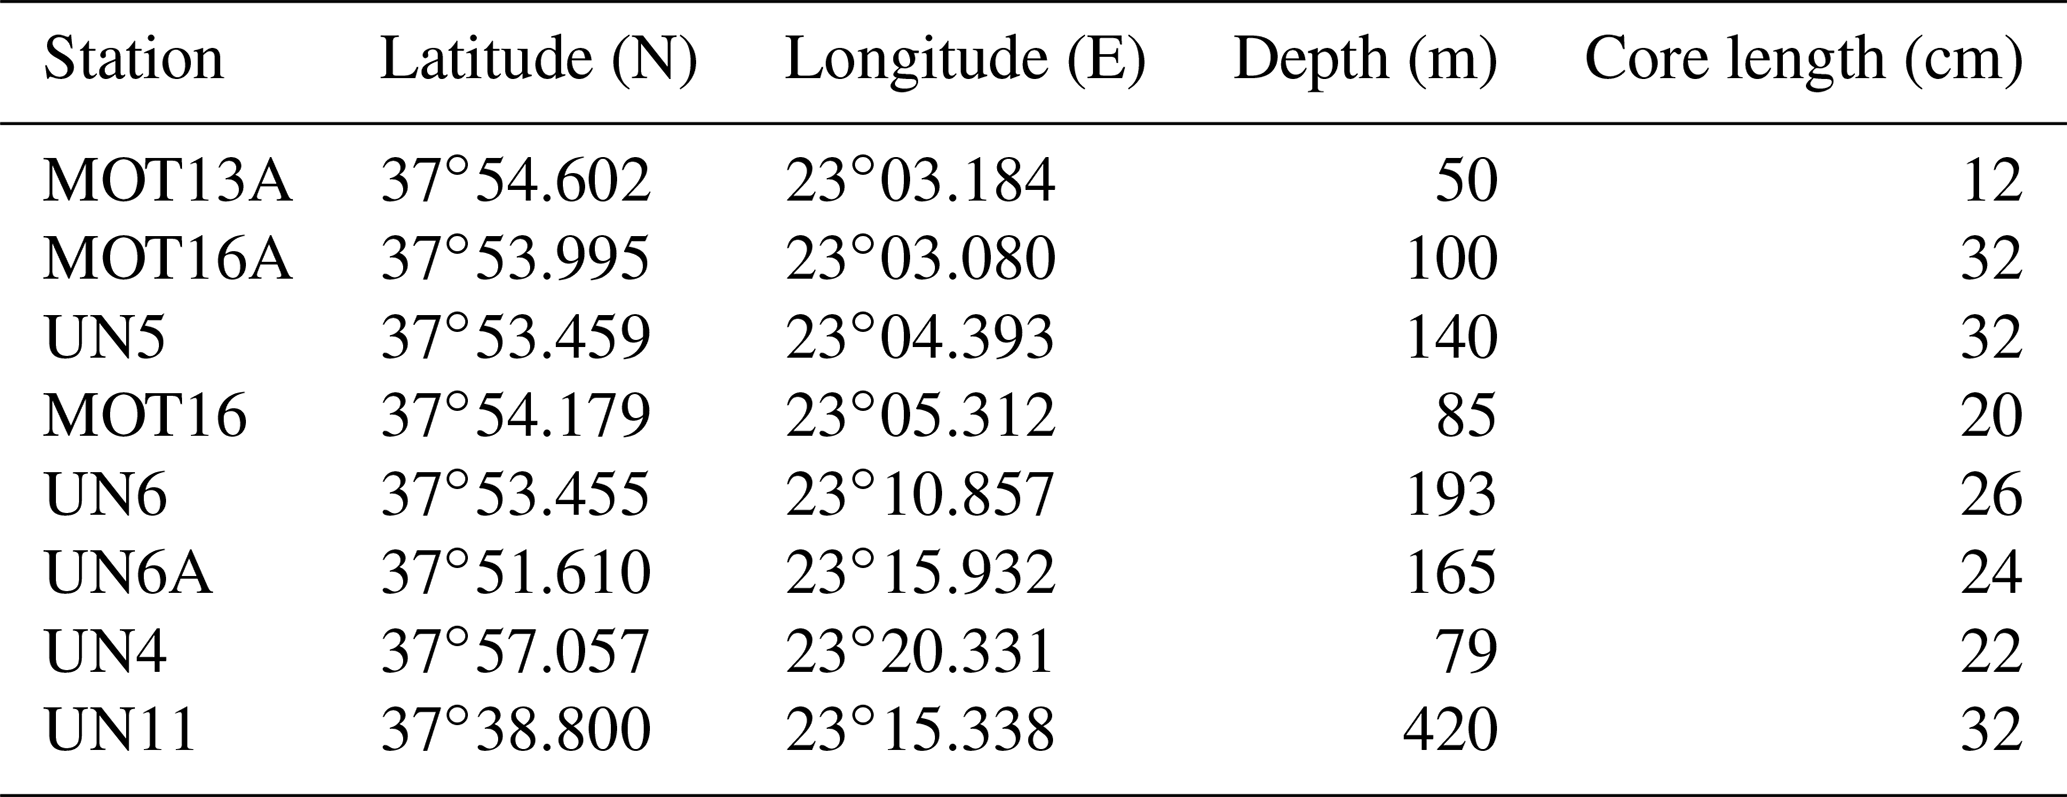
Stations MOT13A, MOT16A, UN5, MOT16, UN6 (near the Sousaki area) and UN4 (Megara Basin), in the northwestern area, are affected by the coastal industrial zone, urbanization and touristic activities. The offshore station UN6A, in the middle of Megara Basin, is probably less disturbed by anthropogenic activities. Finally, station UN11, in Epidavros Basin at the southwestern part of the study area, is influenced by trawling and aquaculture and potential transport of organic and inorganic pollutants from the eastern Saronikos Gulf due to periodical circulation patterns in the water layers below 60 m.

Figure 1Study area of the western Saronikos Gulf and sampling stations. The map was constructed using Arc Map with bathymetry representation data from the European Marine Observation and Data Network-EMODnet (https://portal.emodnet-bathymetry.eu/, last access: 20 September 2022) and land cover data from Corine (2000).
The cores were frozen immediately after sampling and cut in 1 cm layers down to the top 10 cm of each core and 2 cm layers after that. The separated layers were stored frozen until further processing. The initial step of analysis is removal of water content with the use of a Lab Conco freeze dryer. Subsequently, grain size analysis via dry sieving was performed using the 1 mm and 63 µm Retsch stainless steel sieves. The gravel (>1 mm), sand (>63 µm) and muddy (<63 µm) fractions were separated for the calculation of the respective percentages to the total sediment. The gravel fraction was discarded. Total organic carbon, carbonates and the concentrations of heavy metals were determined separately in both sand and muddy sediment, when the fraction percentage was more than 10 % of the total sediment or in the prevailing fraction only (above 90 %). Table 1 presents the coordinates and depth of each sampling station along with the corresponding core length.
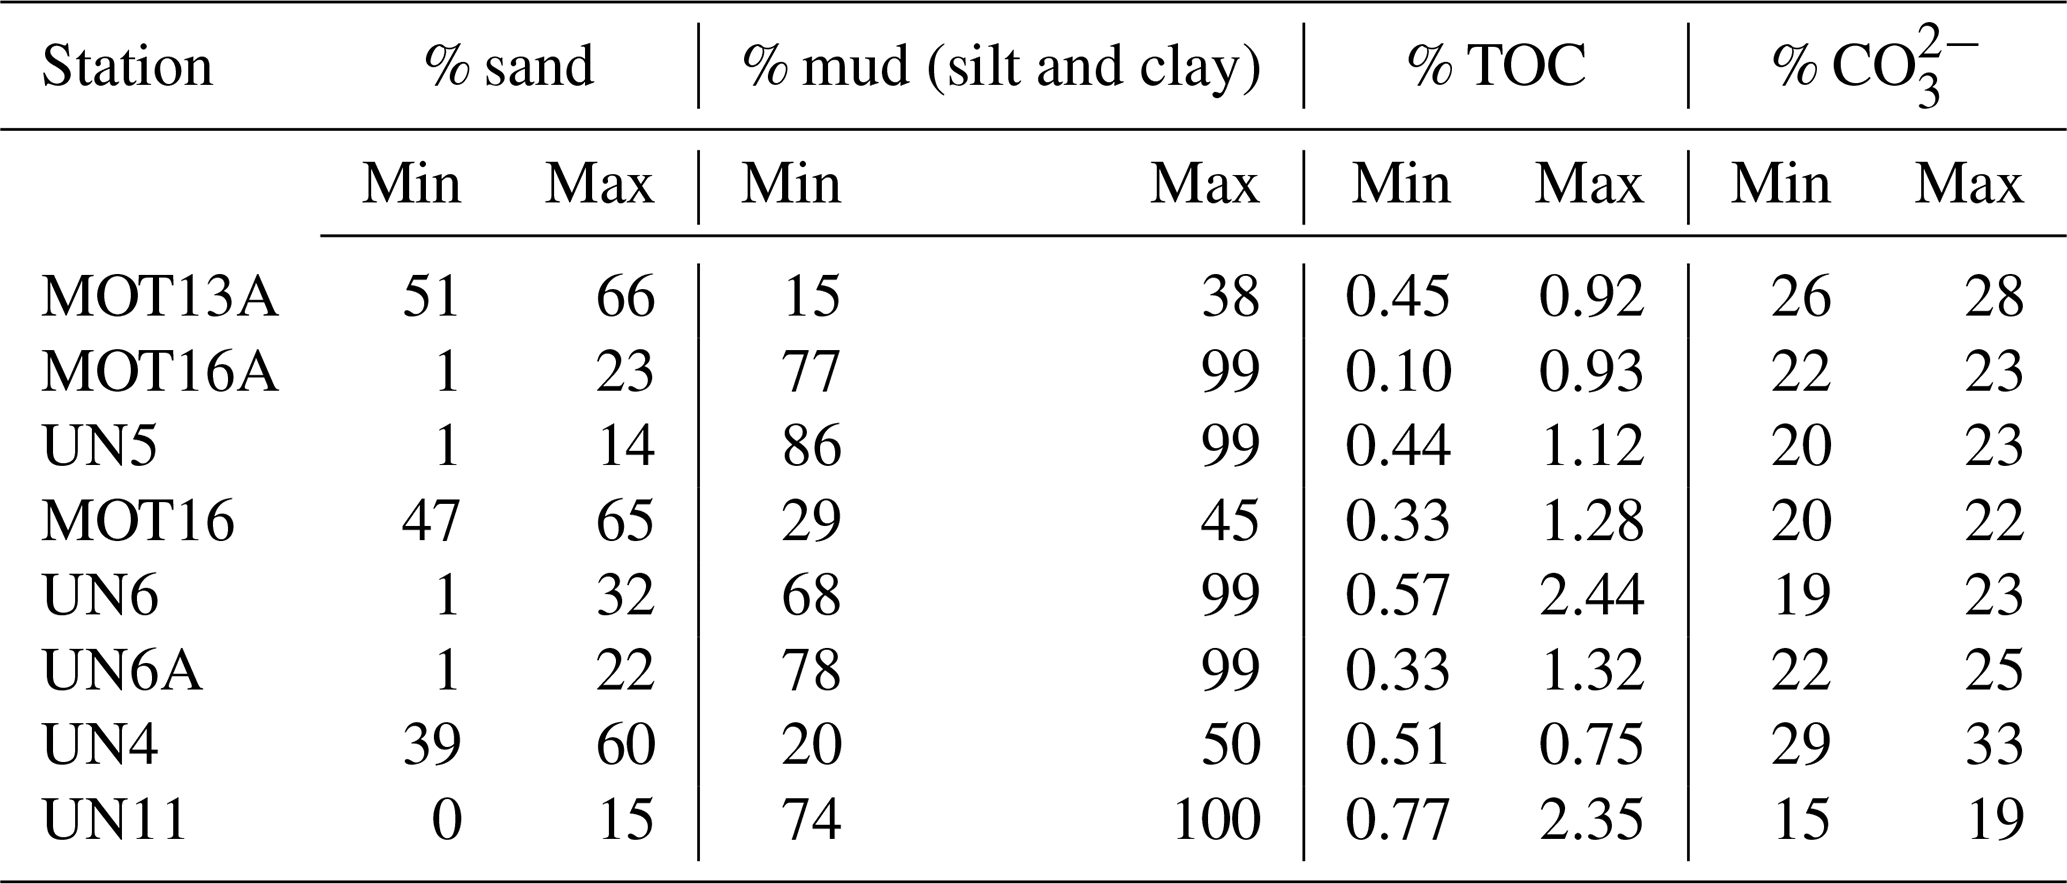
Table 2Summary statistics of grain size percentages, TOC and carbonate content along the collected cores.
The total organic carbon (TOC) content was measured using the standard Walkley (1947) method as modified by Jackson (1958) and Loring and Rantala (1992), which is based on the exothermic reaction (oxidation) of the sediment with potassium dichromate (K2Cr2O7) and concentrated sulfuric acid (H2SO4), followed by back-titration with ferrous ammonium sulfate (FeSO4) and a ferroin indicator.
The carbonate content was determined by calculating the weight difference of the sample before and after the strong effervescence caused by adding 6 M hydrogen chloride (HCl) to the sediment, causing an exothermic reaction followed by HCl gas and CO2 emission (Loring and Rantala, 1992).
The total metal contents were extracted via complete dissolution of sediment samples with an acid mixture of HNO3–HClO4–HF (ISO-14869-1:2000) (Peña-Icart et al., 2011). Following this, the total metal concentrations were determined by flame or graphite furnace atomic absorption spectroscopy (FAAS, Varian SpectrAA-200, and GFAAS, Varian SpectrAA 640Z, respectively) (Skoog et al., 1998). In order to evaluate the precision and accuracy of the method for total metal analysis, a certified reference material (PACS-3, NRC-CNRC) was carried through the analytical procedure along with the sediment samples in every digestion batch, and one or two random layers of each core were also analysed in duplicate. Accuracy was calculated as “% recovery” (percentage ratio of the measured to the certified value). The precision was evaluated using the “% RSD” (relative standard deviation, percent ratio of the standard deviation to the average concentration of the replicates) calculated for each metal by each of the duplicate measurements (repeatability estimation) and the multiple measurements of the reference material (reproducibility estimation). The quality data for the total metal method are presented in the Appendix (Table A1). The precision and recoveries generally fall into the ranges 3 % RSD–10 % RSD and 80 % recovery–120 % recovery, depending on analyte level. Such results of analytical performance are anticipated for multistage analysis of solid samples and are roughly recommended by the US Environmental Protection Agency (US EPA) and the Association of Official Analytical Chemists (AOAC) (US EPA, 1996; AOAC International, 2016). For every core, the % RSD for each metal was calculated as an indication of the downcore variability, and the results are presented in Figs. A1–A15.
Most of the statistical treatment of data and the creation of the vertical distribution graphs was performed by Microsoft Excel 2010. The horizontal distributions of metals were visualized with the software package Ocean Data View (ODV) 2017. The software IBM-SPSS Statistics 2020 was used for statistical comparisons between stations regarding the trace metal concentrations and Spearman correlation analysis to identify significant relationships between different heavy metals, total organic carbon and carbonates. The comparison between stations was done by performing parametric (one-way analysis of variance, ANOVA) and non-parametric (Kruskal–Wallis, Kolmogorov–Smirnov) tests for each metal and each core to the results of the top 5 cm. The comparison between two groups of values, e.g. a variable between two cores or concentrations of variables above or below a certain layer in a single core was either done by two-sided t test or by a non-parametric equivalent test (Mann–Whitney and Kolmogorov–Smirnov). In all comparative tests, statistical results were calculated at the 95 % confidence level (p<0.05).
4.1 Geochemical results
Table 2 summarizes the main findings from the determination of geochemical parameters. The grain size in cores from stations MOT16A, UN5, UN6, UN6A and UN11 is dominated by mud, while the percentage of sand fraction is generally low and below 10 % in most core layers. On the other hand, in cores MOT13A, MOT16 and UN4 the percentages of both sand (39 %–66 %) and mud (15 %–50 %) are significant. The sediments at stations MOT13A and MOT16 are coarser, with average mud percentages 25 % and 38 %, respectively, while at station UN4 the average mud percentage is slightly increased (43 %), especially in the top 10 cm. As a result, the percentages of total organic carbon (TOC) and carbonates, as well as the concentrations of heavy metals, were determined in the mud fraction (<63 µm) of sediments in cores MOT16A, UN5, UN6, UN6A and UN11 and separately in the sand and mud fraction of sediments in cores MOT13A, MOT16 and UN4.
Apart from small variations, the cores are fairly homogeneous in terms of carbonates. The high percentages of CO in cores MOT13A and UN4 are associated with the coarse-grained samples and abundant presence of shell fragments. Figure 2 presents the vertical distribution of TOC percentage (% TOC) in selected cores. Comparing between stations, the lowest TOC values in the top 5 cm are measured in the coarser sediments of MOT13A (average of 0.57 %) and the highest in the deepest station UN11 (average of 1.74 %). There was no statistical difference between TOC in the remaining cores, and the average values for the top 5 cm are as follows: UN4 (0.68 %), MOT16A (0.69 %), MOT16 (0.96 %), UN5 (0.96 %), UN6A (1.09 %) and UN6 (1.26 %).
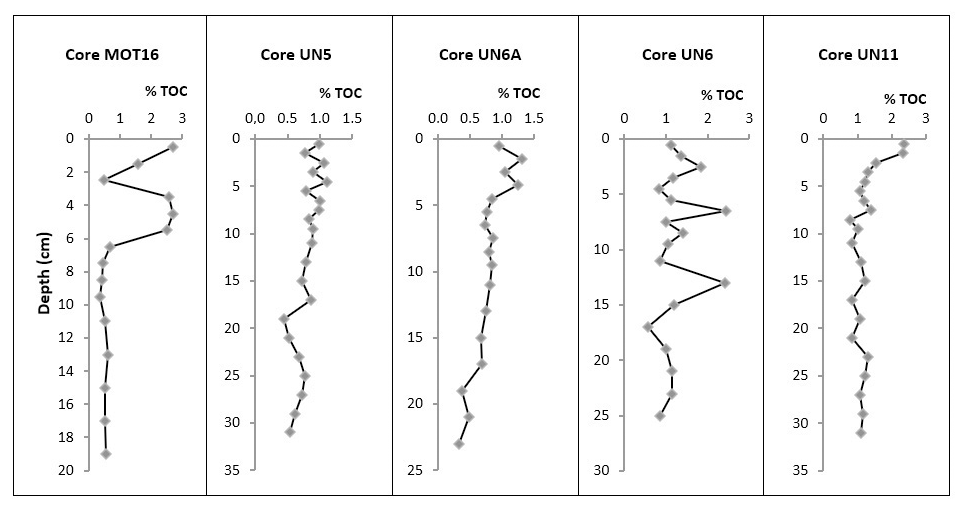
Figure 2Vertical distribution of % TOC at selected cores (MOT16 profile depicts fine-sediment (<63 µm) TOC content).
The vertical TOC distribution in core MOT16 is differentiated than the corresponding in the adjacent station MOT13A. Below 6 cm the levels of TOC are similar in both stations. However, in the top 6 cm of core MOT16 average TOC in the total sediment is approximately 1 %, while below 6 cm the corresponding average is 0.42 %. This is caused by a striking increase in the TOC content of the muddy sediments, with an average of 2.4 % TOC at the top 6 cm being approximately 5-fold higher than the corresponding average in the deeper layers (0.5 %). At the same time, the TOC variability in the sandy fraction of the top 6 cm of MOT16 is minimal, ranging between 0.3 % and 0.4 %. The vertical TOC distributions of the dominantly muddy cores (MOT16A, UN5, UN6, UN6A, UN11) present high surficial content and gradual increase with depth.
Table 3 presents TOC, carbonate and heavy-metal contents in the two fractions (sand and mud) at the shallow coarse-grained cores MOT13A, MOT16 and UN4. It is apparent that the % TOC content of the muddy material is higher than the corresponding content of the sandy fraction as anticipated. The percentage of CaCO3 (% CaCO3) is increased in the sandy material of cores MOT13A and UN4 compared to that of the fine sediment and is approximately equal in the two sediment fractions of core MOT16.
The concentrations of Al, Cr, Cu, Mn, Pb, Ni and Zn are higher in the muddy sediments of MOT13A and UN4 than the corresponding values in sandy sediments. The same applies to Al, Mn, Cu and Zn in MOT16. Unlike other metals, the Fe content is more or less similar in both sediment fractions of cores MOT13A and UN4. The sediments of core MOT16 appear to be different with higher concentrations of Fe, Cr, Ni and Pb in the coarse-grained fraction.
The vertical distributions of the studied metals (in mg kg−1) along the collected cores are presented in Figs. A1–A15. In the case of the coarse-grained cores MOT13A, MOT16 and UN4, the concentrations in the total sediment (calculated by the corresponding values in both fractions) are depicted. Table A2 presents the ratios of eight heavy metals to Al in the surface and deeper sediment layer of the collected cores. The ratios presented for the cores MOT13A, MOT16 and UN4 are calculated by the results in the corresponding fine-grained sediments. The vertical profiles of metal to aluminium ratios (in fine-grained sediments) along the collected cores are also given in Figs. A1–A15.
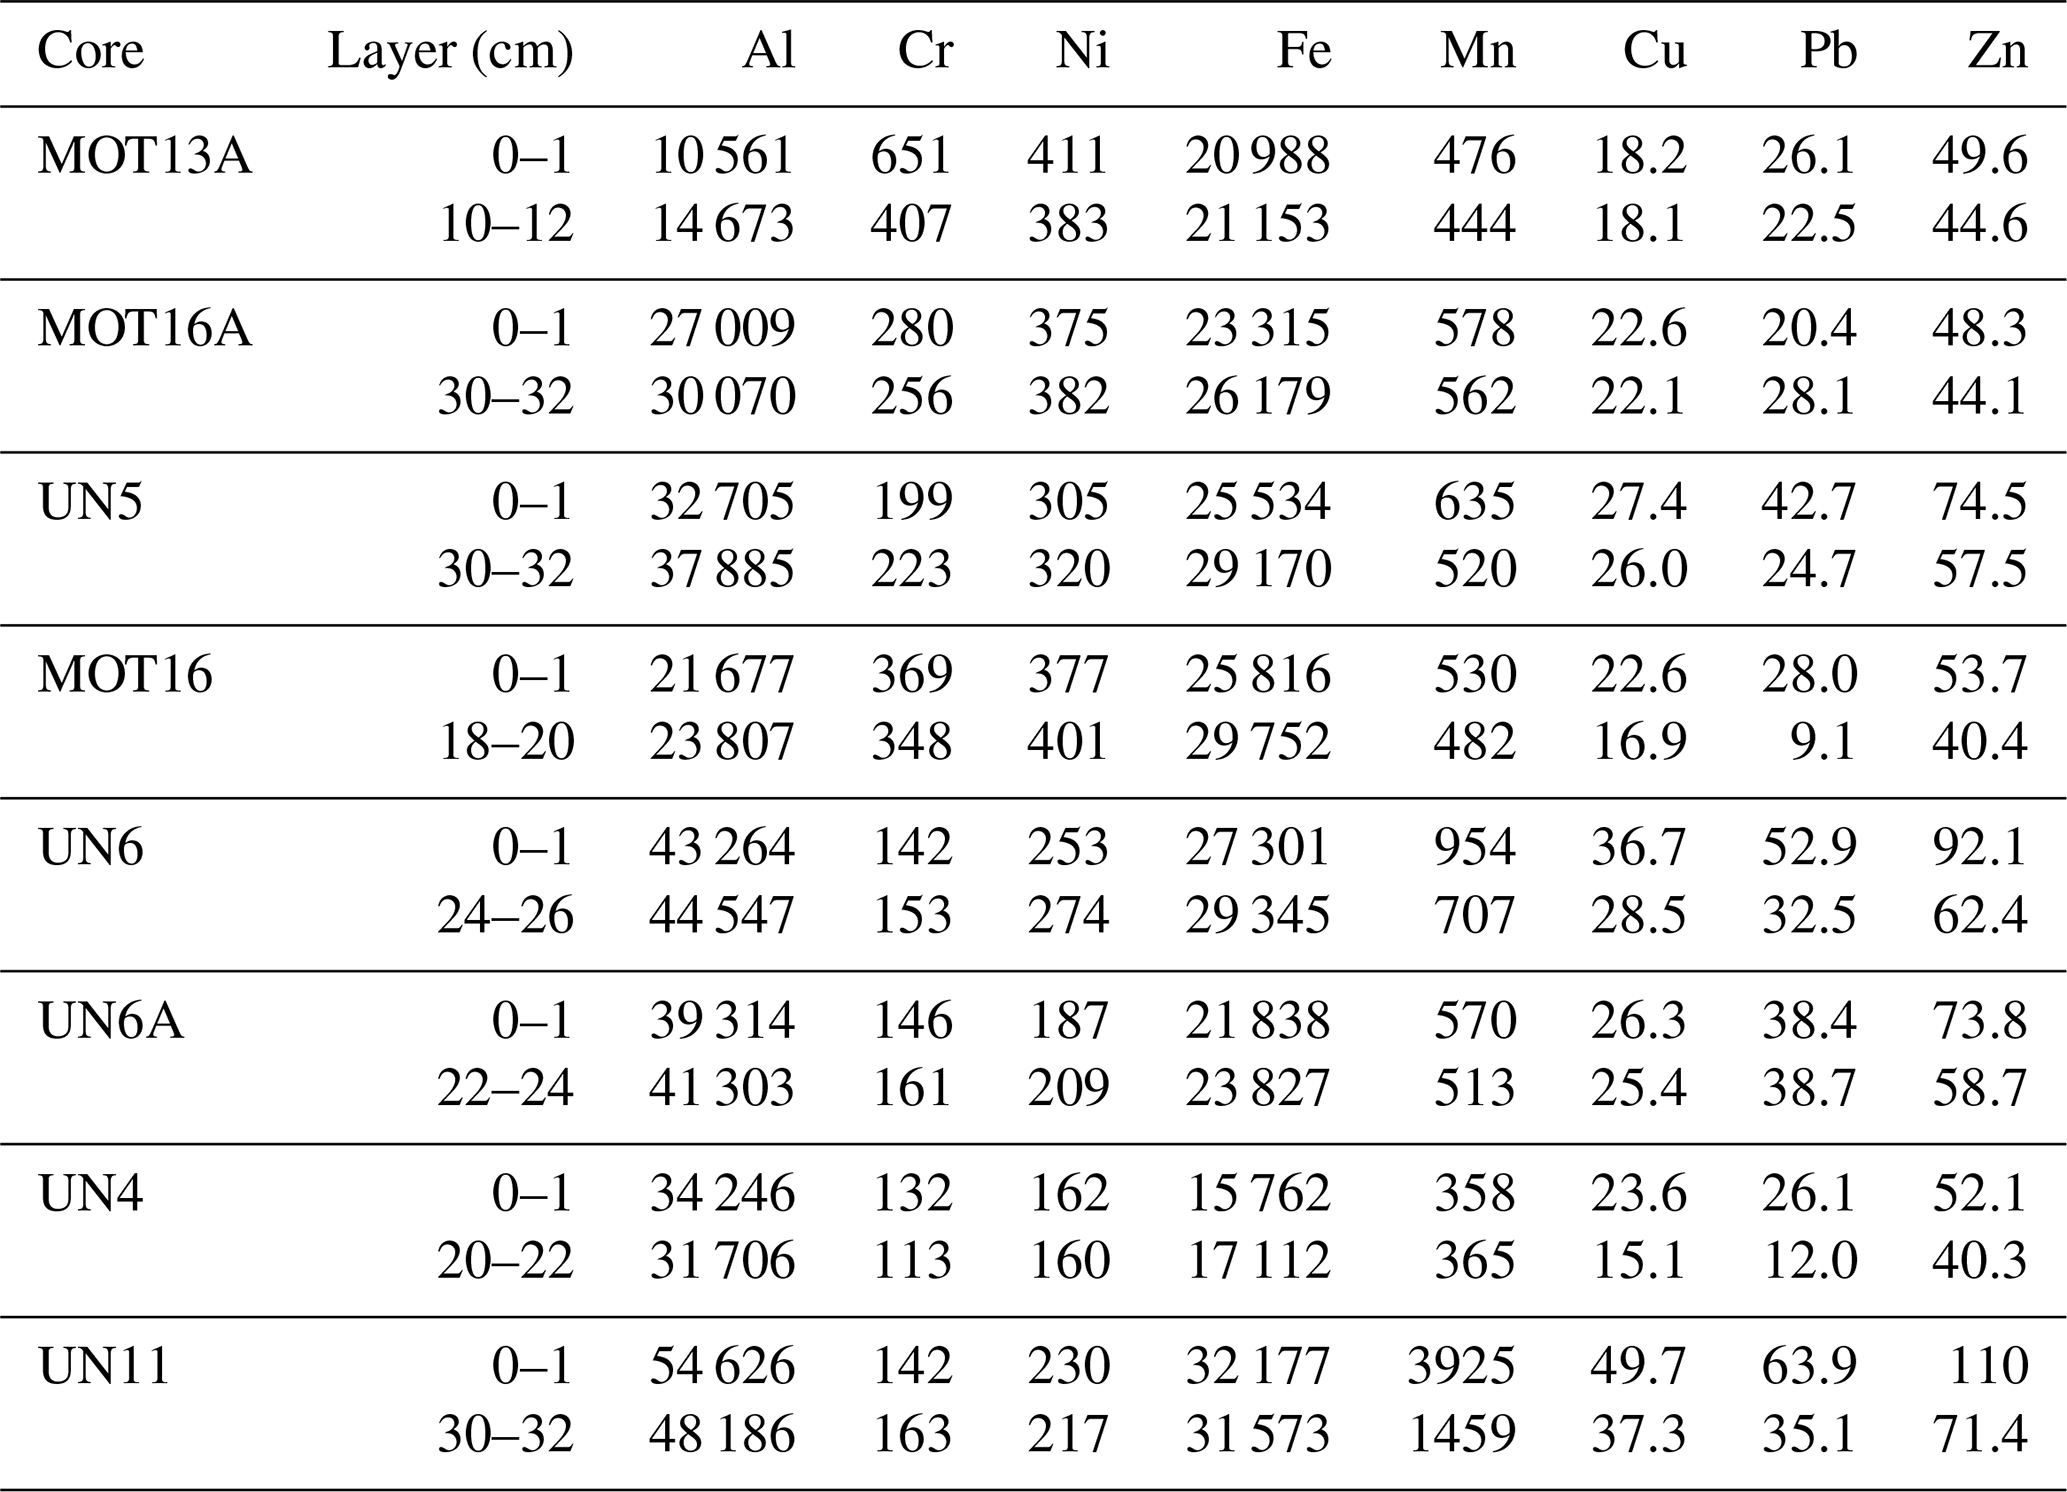
Table 4 summarizes the concentrations of eight heavy metals at the surface and in the deeper sediment layer of the collected cores. For the sake of direct comparison in the cases of cores MOT13A, MOT16 and UN4, the fine-grained concentrations are presented in Table 4. The sediments at the deeper parts of the western Saronikos Gulf (cores UN6, UN6A and UN11) present elevated concentrations of Al, Fe, Pb and Zn. The sediments of UN11 are also particularly enriched in Mn. In contrast, the values of Cr and Ni are elevated in cores MOT13A, MOT16 and MOT16A.
Table 3Concentrations of metals (in mg kg−1) and organic and inorganic carbon content in the two sediment fractions of coarse-grained cores (MOT13A, MOT16, UN4).

Table 4Concentrations (in mg kg−1) of metals at the surface and in the deeper sediment layer of cores. The concentrations at coarse-grained cores MOT13A, MOT16, UN4 refer to the fine-sediment fraction (f<63 µm).
The vertical distributions of Al (Fig. A1) for the total sediment (both fractions) present minimal variation. The downcore variability of Al is lower than 10 % in the finer sediments (MOT16A, UN5, UN6, UN6A and UN11) and between 10 % and 15 % in the coarser sediments (MOT13A, MOT16 and UN4). In the surface layer (0–1 cm) of cores MOT13A and UN5 there is a sharp decrease in Al content. Furthermore, the average aluminium content (16 709 mg kg−1) at the top 6 cm of core MOT16 is statistically lower (two-sided t test, p<0.05) than the corresponding average content in the layers below (20 477 mg kg−1). In contrast, in the top 12 cm of core UN11 aluminium (average 52 714 mg kg−1) is increased (two-sided t test, p<0.05) compared to the deeper layers (average 48 621 mg kg−1). The other so-called lithogenic metals (Cr, Ni, Fe, Mn) generally present uniform vertical profiles with minimal variability, mostly below 10 % (Figs. A2–A9). However, Cr, Ni, Fe and Mn in the surface sediments of MOT13A present an increasing trend that remains pronounced after normalization to Al in the muddy fraction in the top 0–1 cm, concurrent with the 2-fold decrease in Al content. The vertical profiles of Cr and normalized in UN11 indicate a decrease in Cr in the upper sediment layers. This decrease is confirmed statistically, and the average Cr (148 mg kg−1) and (28.0) values of the top 12 cm are lower than the corresponding values in the deeper layers (155 mg kg−1 and 32.0, respectively). The same decreasing trend in the top 0–1 cm is seen in the normalized profiles of Fe, Ni and Mn in the fine-grained sediment fraction of core UN4. The average concentrations of Fe, Mn and Ni in the top 12 cm of UN11 are statistically higher than the corresponding values in the deeper layers. The most pronounced difference is calculated for Mn, where the average upper-layer content is 2396 mg kg−1, while the content in the deeper layers is 1527 mg kg−1. The same applies to ratio in UN11 but not to the ratios of and , which are seemingly lower in the upper layers like but statistically equal. The downcore variability of Mn in all stations except UN4 is typical of shelf sediments, with high surficial Mn concentrations and ratios that diminish with depth.
Figure 3 presents selected vertical profiles of Mn and Pb along core UN11 and those of Cr, Fe, Cu and Zn at stations UN6A, MOT16A, UN4 and UN6, respectively. Figure 4 presents selected vertical distributions of metal to Al ratios at cores MOT13A, UN5, MOT16A, MOT16 and UN11. The concentrations and ratios presented in Figs. 3 and 4 for the coarse-grained cores (MOT13A, MOT16, UN4) refer to values from the muddy sediment fraction.
The concentrations of Cu, Pb and Zn, as well as the normalized profiles (Figs. A10–A15), show a constant decrease over depth to background levels. That tendency is less pronounced in very few cases, i.e. no statistical difference between upper and deeper sediment layers, but is particularly clear for Cu (MOT13A, MOT16, MOT16A), (MOT13A), Pb (MOT13A, MOT16A), (MOT16A) and Zn (MOT16A). In all remaining cores, the concentrations of Cu, Pb and Zn and the ratios to aluminium in the upper sediment layers (above 10 cm) are statistically higher than the corresponding values in the deeper layers.
4.2 Horizontal distributions
Figure 5 presents the horizontal distributions of heavy metals in the surface sediments (0–1 cm) of the study area. In cases of coarse surface sediments of MOT13A, MOT16 and UN4, the concentrations of total sediment fraction (sand and mud) were used.
The concentrations of Al, Fe, Mn, Cu, Pb and Zn are plotted increased from the northeast to the southwest in the western Saronikos Gulf. On the other hand, the concentrations of Fe, Cr and Ni in the northern part appear higher than those in the southern area.
In order to corroborate the above plots and produce solid statistical comparisons for the metal concentrations between stations the average values and standard deviation from the results of the top 5 cm were calculated and examined using IBM-SPSS Statistics 2020 software. In most cases the five value groups followed the normal distribution; therefore, the parametric one-way ANOVA test was first applied. But since some cases did not follow the normal distribution, non-parametric tests (Kruskal–Wallis for multiple groups and Mann–Whitney or Kolmogorov–Smirnov for two groups) were also applied to corroborate the statistical comparison outcome. The results can be summarized as follows.
- Al
UN11 ≫ UN6 = UN6A > UN5 > MOT16A > UN4 = MOT16 ≫ MOT13A
- Fe
UN11 = MOT16 > UN6 = UN5 > MOT16A > MOT13A = UN6A > UN4
- Mn
UN11 ≫ UN6 > MOT16A = UN6A = UN5 = MOT16 > MOT13A > UN4
- Cr
MOT13A = MOT16 > MOT16A > UN5 > UN6A = UN11 = UN6 > UN4
- Ni
MOT16 > MOT16A > UN5 = MOT13A = UN6 > UN11 > UN6A > UN4
- Cu
UN11 > UN6 = UN5 > UN6A > MOT16A > UN4 = MOT16 > MOT13A
- Pb
UN11 = UN6 > UN5 = UN6A > UN4 = MOT16 > MOT16A = MOT13A
- Zn
UN11 > UN6 > UN5 = UN6A > MOT16 = UN4 = MOT16A = MOT13A.
5.1 Geochemical findings and element interrelations
The spatial grain size distribution falls into an expected pattern, with coarser sediments closer to the coastline (stations MOT13A, MOT16, UN4) and finer sediments in the more remote and deeper stations (MOT16A, UN5, UN6, UN6A, UN11).
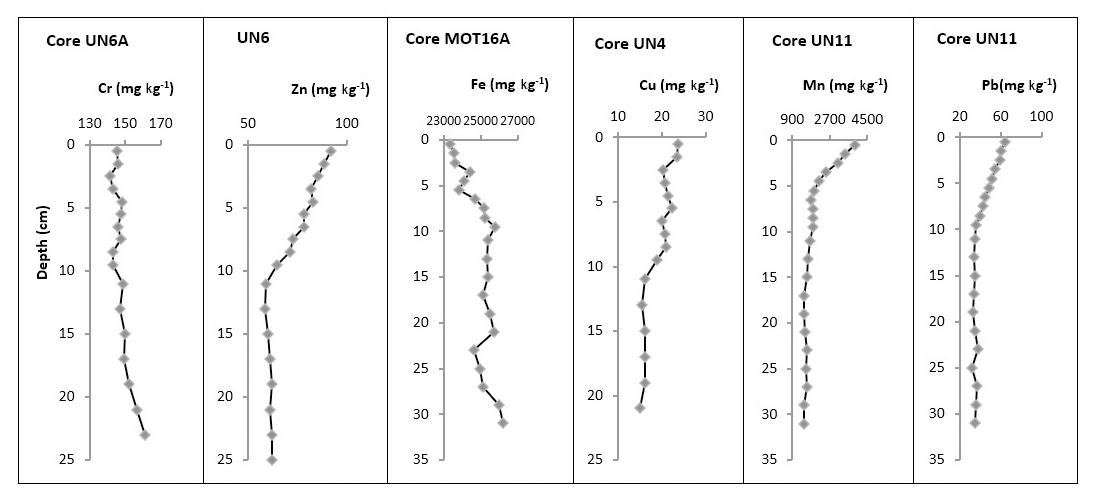
Figure 3Vertical profiles of Cr, Fe, Cu and Zn at the muddy sediments of cores UN6A, MOT16A, UN4 and UN6, respectively, and Mn and Pb along core UN11.
The observed spatial variability of TOC with higher content in the predominantly muddy cores is expected since fine-grained sediments are known to contain elevated levels of organic material compared to coarse-grained sediments (Salomons and Forstner, 1984). The pronounced increase in TOC in the muddy sediments of station MOT16 (top 6 m) could be attributed to the treated wastewater effluents of the refinery, which are discharged in the general vicinity of this station (Paraskevopoulou; 2009). The two deep stations UN6 (200 m at Megara Basin) and UN11 (440 m at Epidavros Basin) present the highest TOC content. It has been stipulated that suspended matter from eastern Saronikos Gulf basin, which is affected by more pronounced polluting activities, is transported below the thermocline to the western basin (Psyllidou-Giouranovits and Pavlidou, 1998; Kontoyannis, 2010). This could explain the gradual increase in TOC content in the more recently deposited upper layers of sediment.
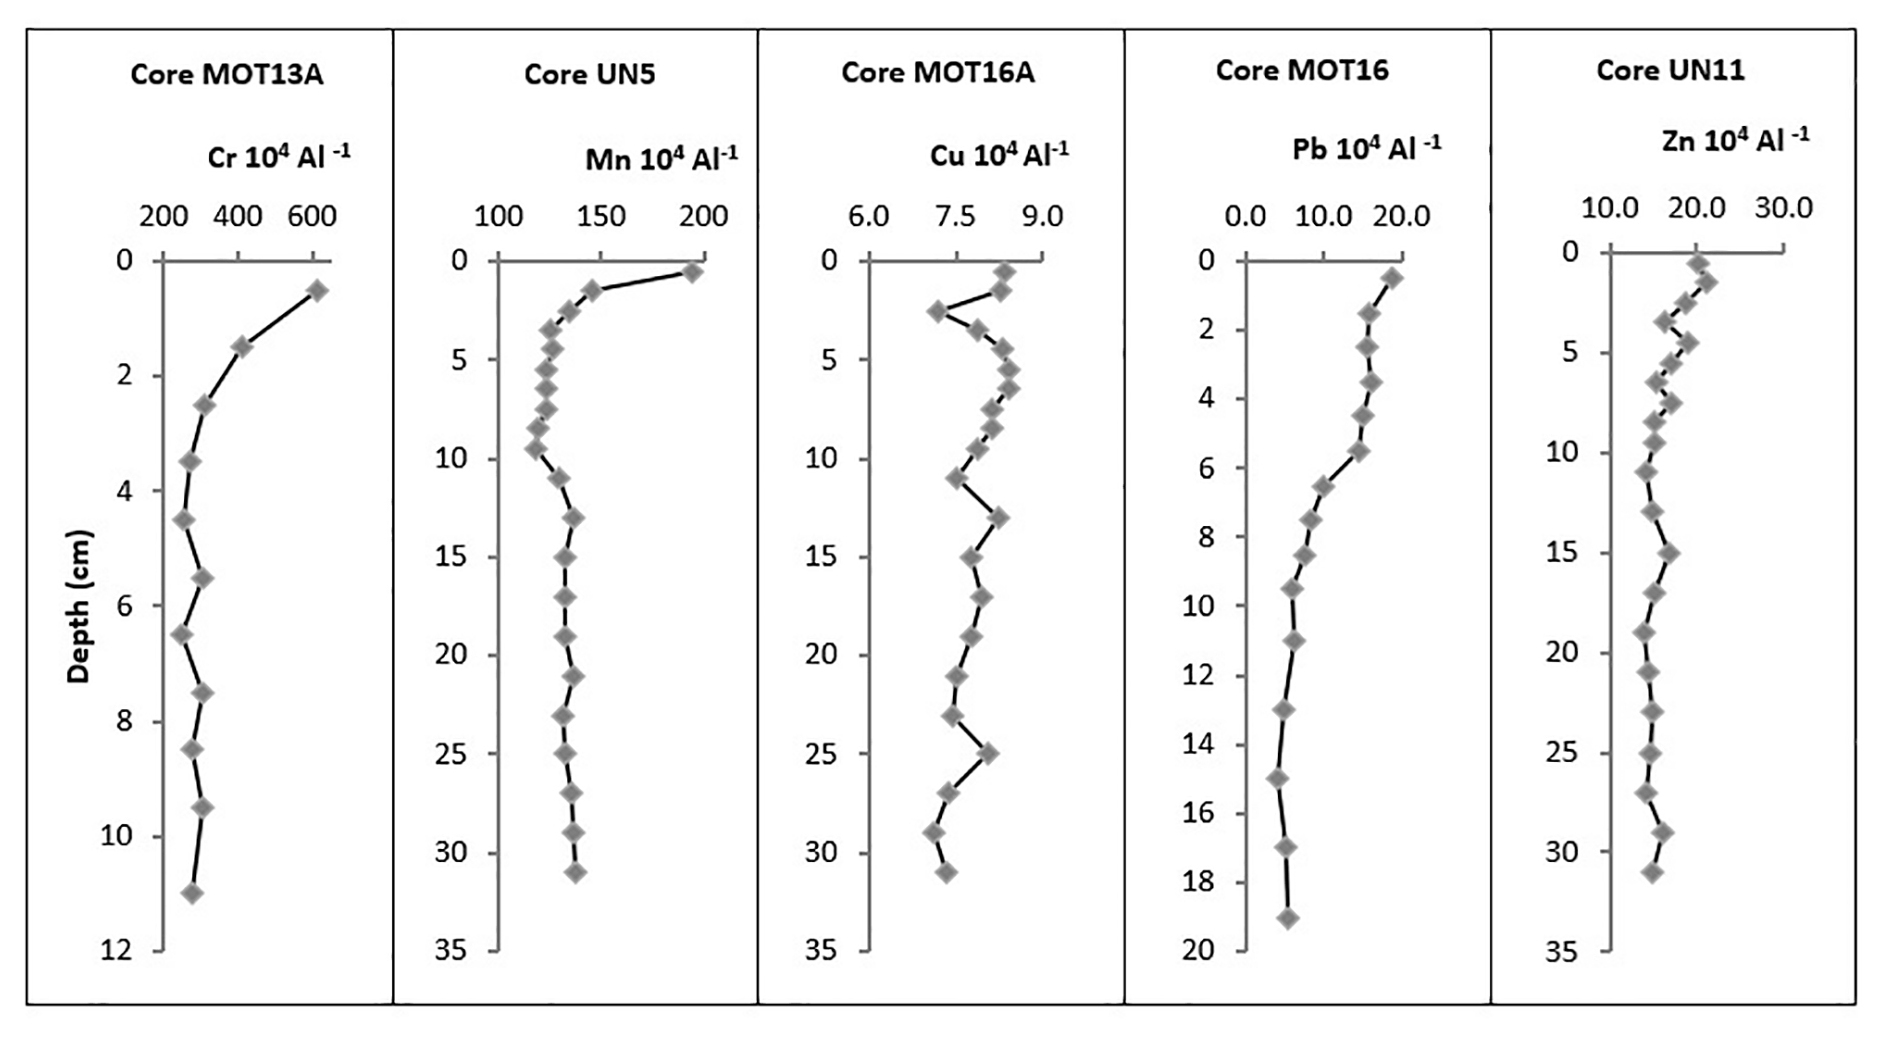
Figure 4Vertical distributions of ratios to Al at cores MOT13A, UN5, MOT16A, MOT16 and UN11 in the northwestern Saronikos Gulf (profiles for MOT13A and MOT16 depict ratios calculated for the muddy fraction).
Fine-grained sediments are known to contain abundant geochemical phases, such as clay minerals, organic material and Fe–Mn oxy-hydroxides with high affinity for trace metals due to increased surface adsorption and ionic attraction. Thus, the elevated levels of Al and the so-called anthropogenic metals (Cu, Pb, Zn) in the muddy sediments of the study area can be attributed to the predominant occurrence of aluminium-rich aluminosilicate and clay minerals in fine-grained sediments and their concurrent efficacy to bind or sorb trace metals (Barjy et al., 2020; Karageorgis et al., 2005; Salomons and Forstner, 1984). In contrast, Cr and Ni, which are also regarded as lithogenic elements along with Al, present a different distribution and are elevated in the coarser near-shore sediments of cores MOT13A, MOT16 and MOT16A. This can be attributed to the existence of ultrabasic rocks in the coastal Sousaki area, where these metals are abundant (Kelepertsis et al., 2001). In the case of Fe and Mn, the lower contents at station UN4 can be attributed to the coarser sediments and the different geological setting with the absence of ultrabasic rocks.
The minimal depth variations observed at the vertical distributions of major (Al) and lithogenic elements (Fe, Cr, Ni) in the study area are anticipated because of their terrigenous origin (Nolting et al., 1999; Karageorgis et al., 2005); however, some of the discrepancies identified in specific cores cannot be readily explained due to a lack of data for other elements such as Ti, Si and Ca.
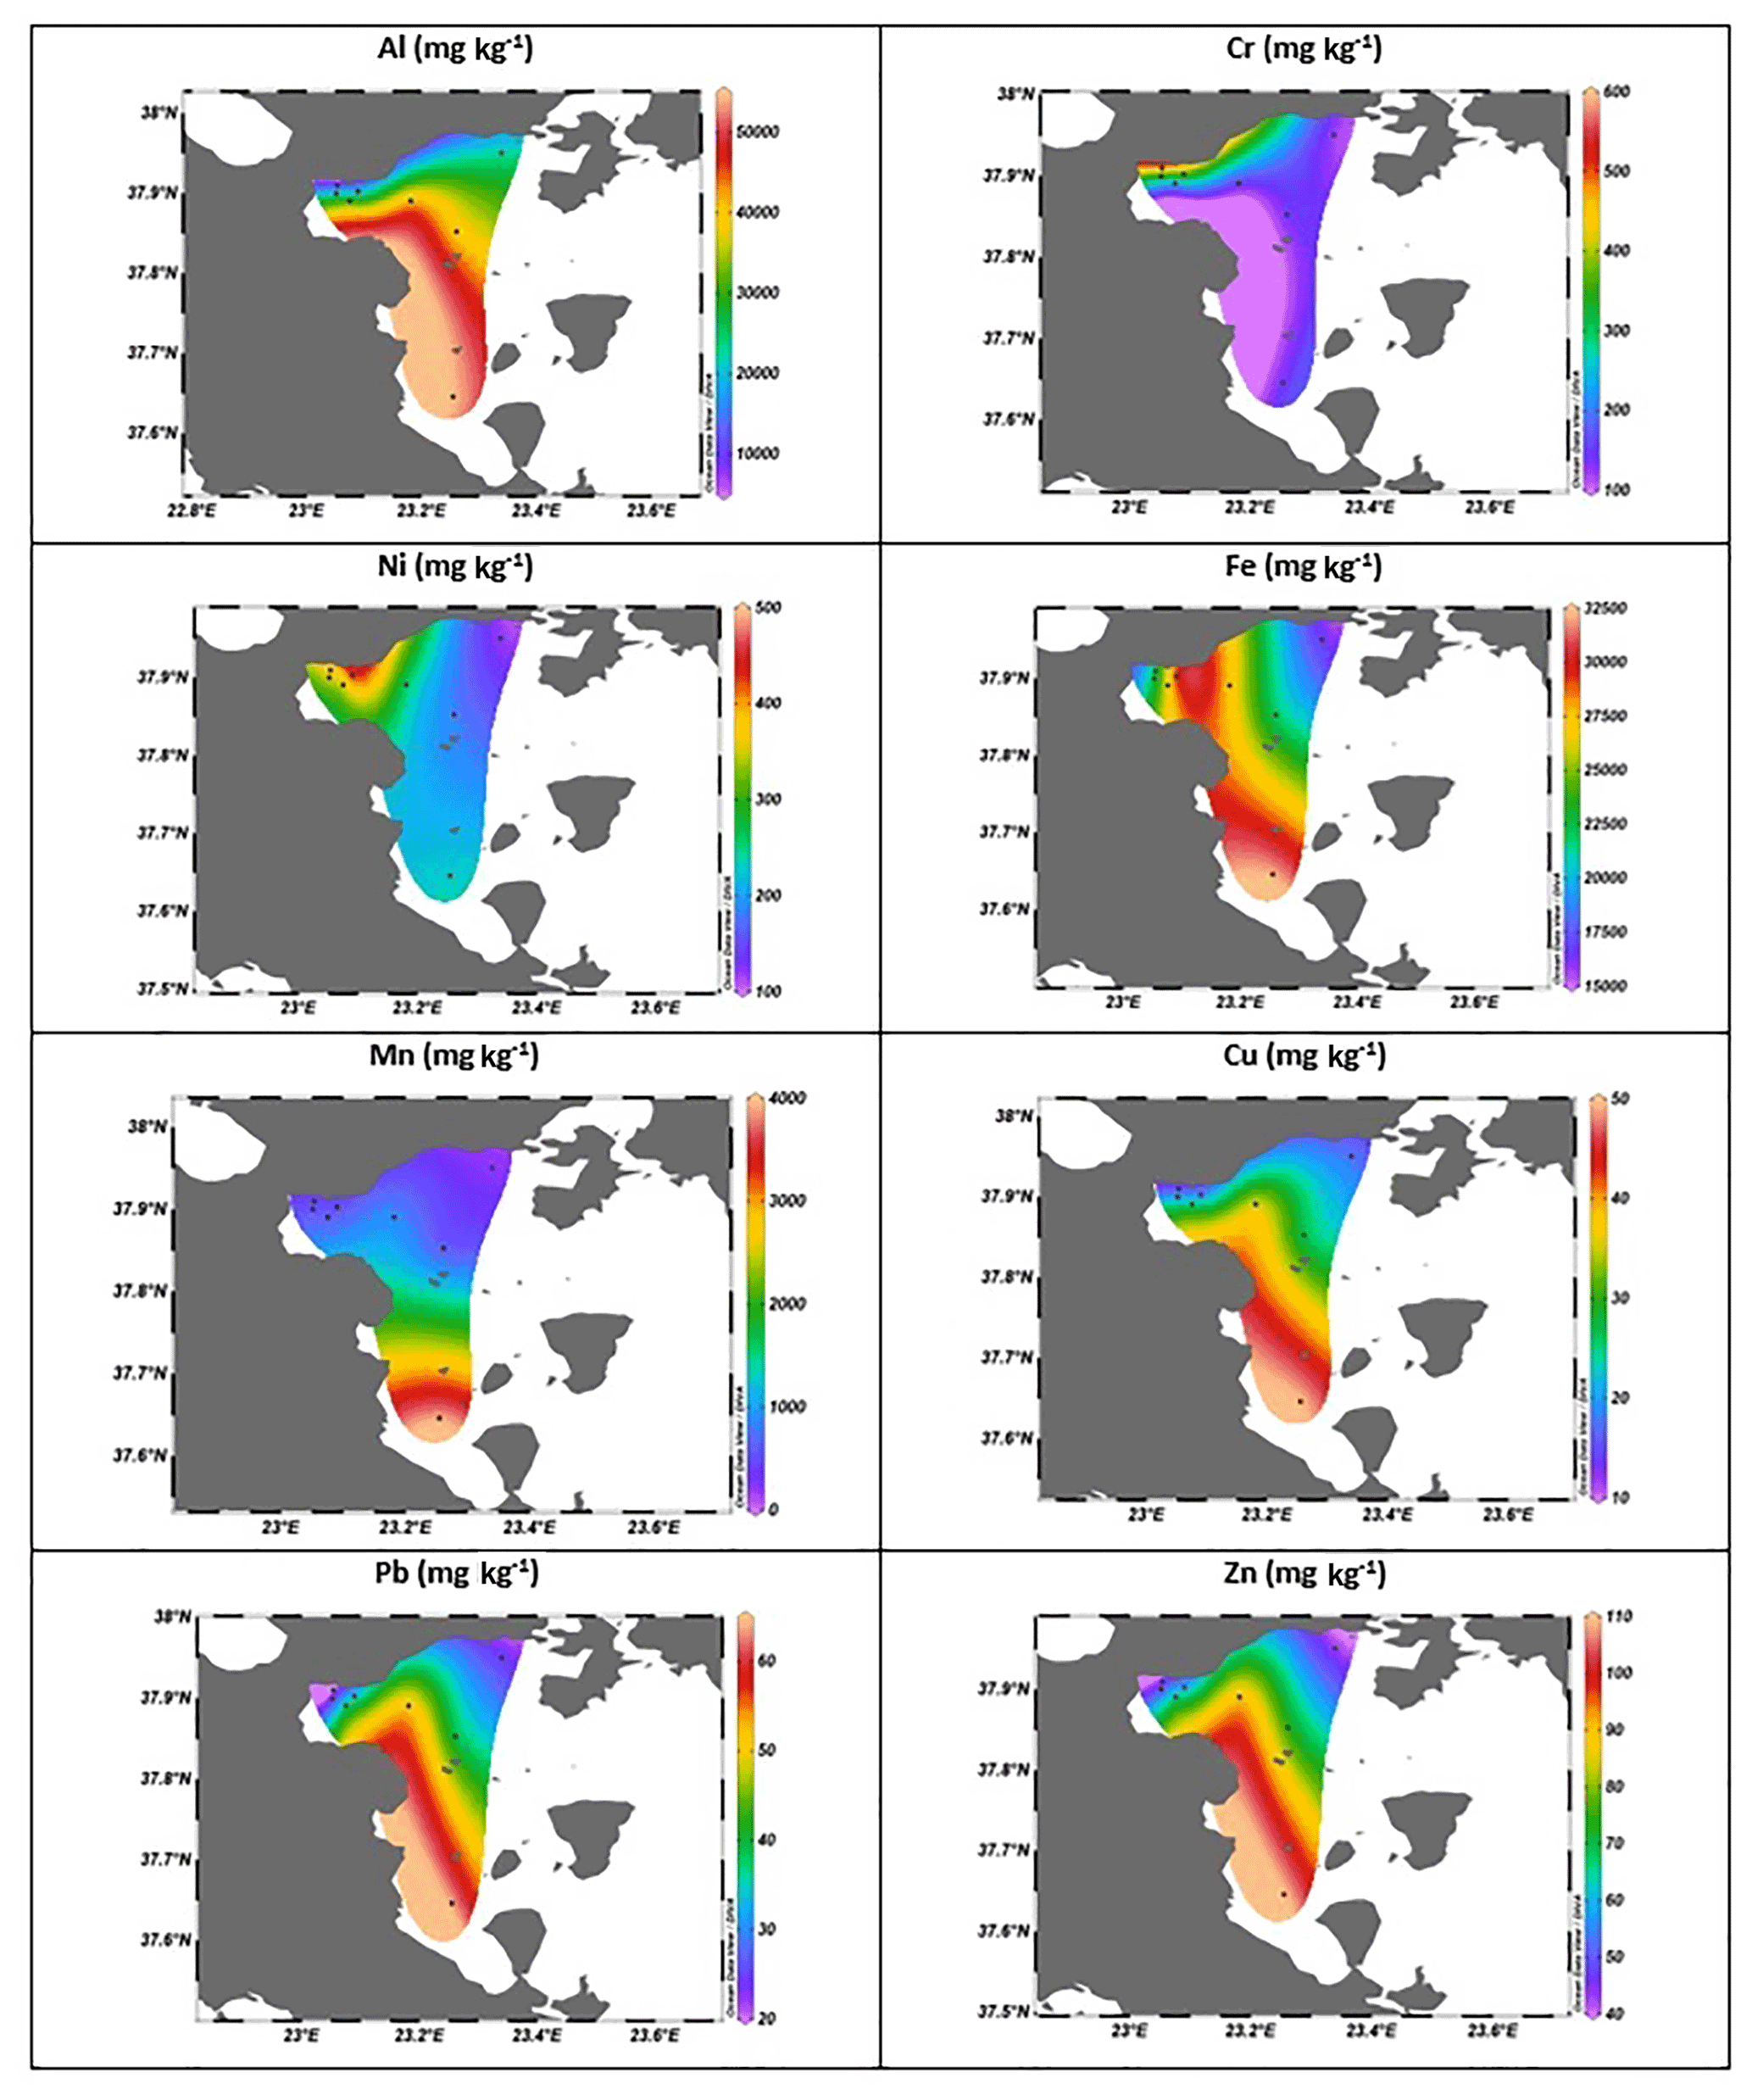
Figure 5The horizontal distributions of heavy metals in the surface sediments of the western Saronikos Gulf. In cases with coarse surface sediments at stations MOT13A, MOT16 and UN4, the concentrations of the total sediment (sand and mud) were used.
The downcore variability of Mn at all stations except UN4 is typical of shelf sediments, with high surficial Mn concentrations that diminish with depth as reducing conditions develop. These variations are largely independent of lithological or carbonate content fluctuations and are attributed solely to the respiration of organic carbon and the redox cycle of Mn (Karageorgis et al., 2005; Sundby, 2006). The Mn enrichment is far more pronounced in the surface sediments of station UN11 and is more subtle in the other muddy cores. At station UN11, the bottom waters have been hypoxic or near anoxic since the mid 1990s (Kontoyiannis, 2010; Paraskevopoulou et al., 2014). A possible explanation is that the slow diffusion of dissolved oxygen from the more oxidizing overlying waters and the upward diffusion of dissolved Mn (II) from the pore water of anoxic surface sediments to the sediment–water interface (Ozturk, 1995) cause the oxidation of dissolved Mn (II) and its precipitation as Mn (IV) oxides (Pohl and Hennings, 1999). The Mn enrichment in the surface layers of UN11 resembles concentrations in sediments from suboxic parts of the Black Sea (Kiratli and Ergin, 1996; Chen et al., 2022).
The normalized profiles of Cu, Pb and Zn exhibit statistically higher metal ratios in the upper layers of the cores, which is a typical indication of the effect of modern pollution sources on recently deposited sediments in contrast to the pre-industrial deposition of the deeper layers (Karageorgis et al., 2005).
The concentrations of Al, Fe, Mn, Cu, Pb and Zn are increased from the northeast to the southwest of the western Saronikos Gulf and generally follow the distribution of muddy sediments. The opposite increase in Cr and Ni to the north of the study area is attributed to the ultrabasic geological substrate of the Sousaki coastal area. The exception of increased Fe concentrations in one of the northern sandy cores (MOT16) can also be attributed to the geology of the coastal region (Kelepertsis et al., 2001).
Spearman's correlation analysis was carried out to determine the relationships between heavy metals and percentages of total organic carbon (TOC) and carbonates in sediments of the collected cores. The concentrations of metals and the percentages of organic and inorganic carbon used for the analysis correspond to the fine fraction in the sediments of stations MOT13A, MOT16 and UN4. Spearman's correlation coefficients are presented in Table A3 and Fig. A16.
Al is highly correlated (r>0.5, p<0.05) with Fe, Mn, Cu, Pb and Zn, which probably indicates an association between these metals in the form of metal–clay complexes of continental origin (Barjy et al., 2020). On the other hand, there is a negative correlation of Al with Cr and Ni.
Cr is highly correlated with Ni, but both of them show a negative correlation with Cu, Pb and Zn, which can be attributed to their different origin (Barjy et al., 2020) and poor correlation with Mn. Cr also shows poor correlation with Fe. The strong correlation between Cr and Ni can be observed at sediments of the northwest part as well.
Fe, Mn, Cu, Pb and Zn show positive correlation with each other. Cu, Pb and Zn are highly correlated with each other (r>0.5, p<0.05), which can be observed in sediments in the northwestern part as well, suggesting that they have a common origin and identical behaviour during transport in the marine environment (Barjy et al., 2020).
The % TOC content presents moderate correlation with Al, Cu, Pb and Zn and negative correlation with Cr, Ni and percentage of carbonates (% carbonates). Moreover, it shows poor correlation with Fe and Mn. Finally, the percentage of carbonate content presents a negative correlation with all metals.
5.2 Enrichment factors
The enrichment factors (EFs) are used to distinguish between metals originating from anthropogenic activities and from natural processes, assessing the degree of anthropogenic effect. Equation (1) was used for the calculations of EFs, where Cx is the concentration of the analysed metal and CEN is the concentration of the normalizing element. Al was used as the reference element.
In Table 5, the categories of contamination according to the enrichment factor are presented (Diamantopoulou et al., 2019; Sutherland, 2000). In general, EFs use concentrations normalized to Al to account for the heterogeneity of the samples due to differences in texture and organic content (Gredilla et al., 2015).
Table 5The categories of pollution according to the enrichment factor.
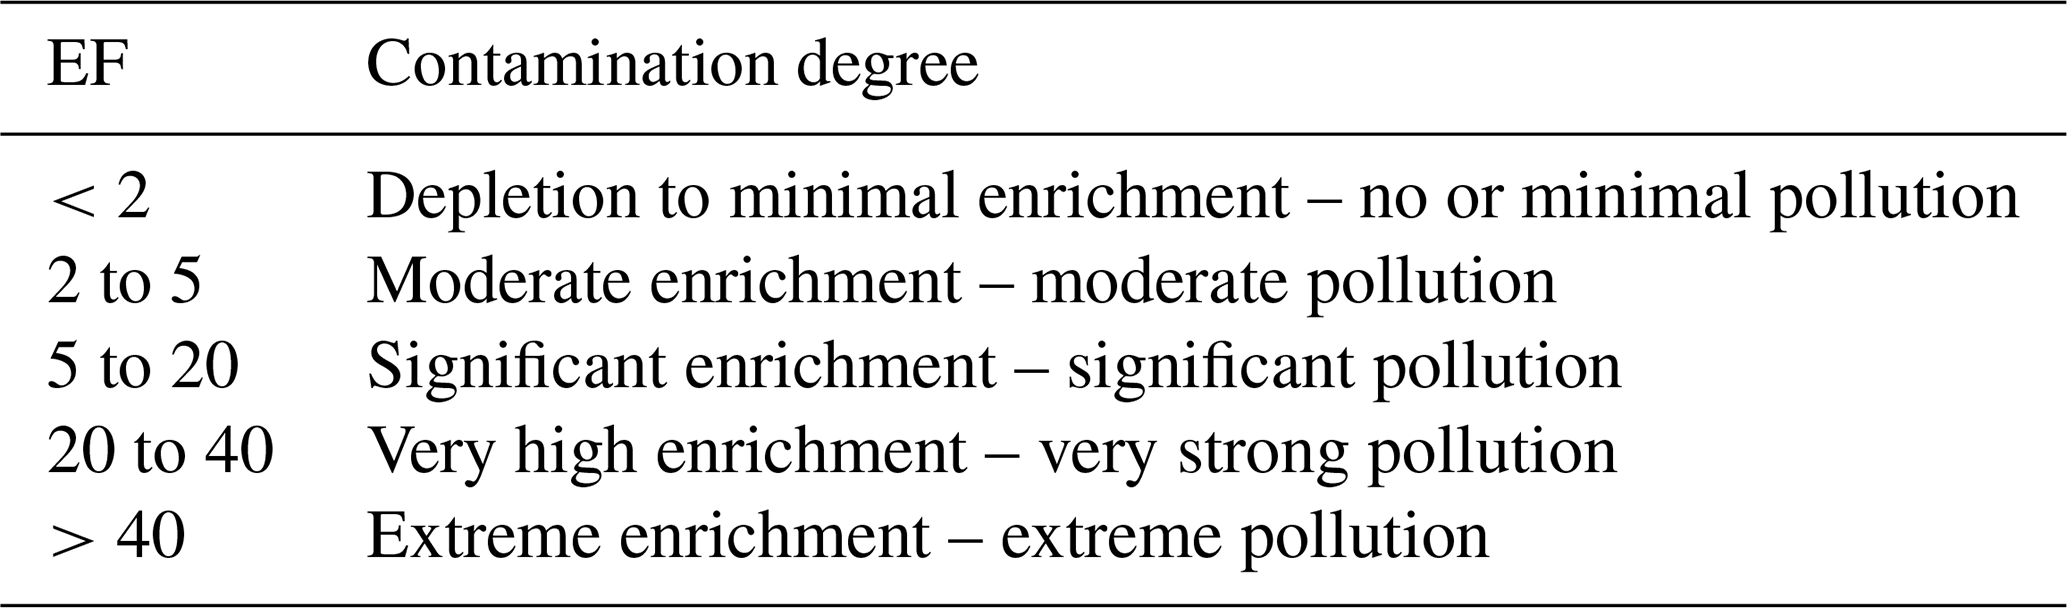
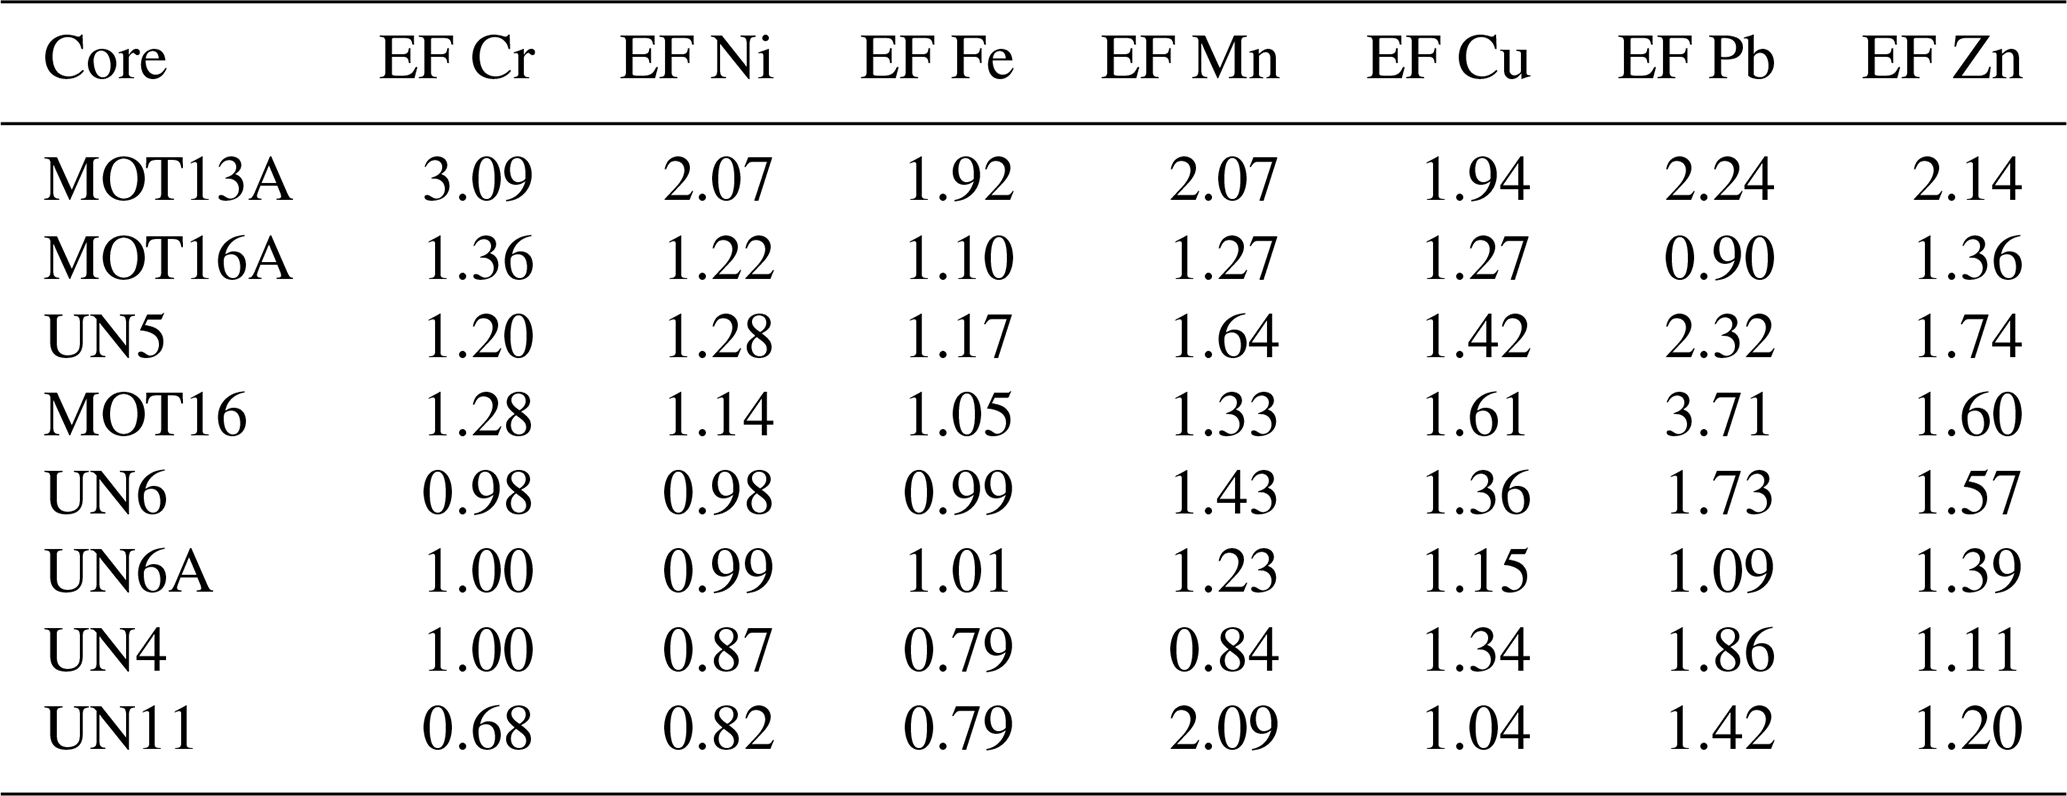
Table 6 presents the enrichment factors of the surface sediments (0–1 cm) that were calculated based on the measured concentrations of heavy metals. The EFs were calculated at the fine fraction (f<63 µm) of sediments of cores MOT13A, MOT16 and UN4. Most metals present minimal to moderate enrichment in almost all the cores analysed. Moderate enrichment is found for Cr, Ni, Mn, and Pb in core MOT13A; Mn in UN11; and Pb in UN5 and MOT16.
Table 6Enrichment factors of the surface sediments (0–1 cm) of the study area. At stations MOT13, MOT16 and UN4, the EFs were calculated at the fine surface sediment fraction (f<63 µm).
5.3 Sediment quality guidelines
Sediment quality guidelines (SQG) of “effects range low” (ERL) and “effects range median” (ERM) are used to assess the level of toxicity of metals in the surface sediments. Metal concentrations below the ERL value indicate that effects on biota are rarely observed. Concentrations above the ERL but below the ERM occasionally affect the biota, and concentrations above the ERM frequently affect the biota. The ERL and ERM guideline values for trace metals (mg kg−1 dry weight) and percent incidence of biological effects in concentrations ranges defined by the two values are presented in Table 7 (Long et al., 1995).
Table 7ERL and ERM guideline values for trace metals (mg kg−1 dry weight) and percent incidence of biological effects in concentration ranges defined by the two values.
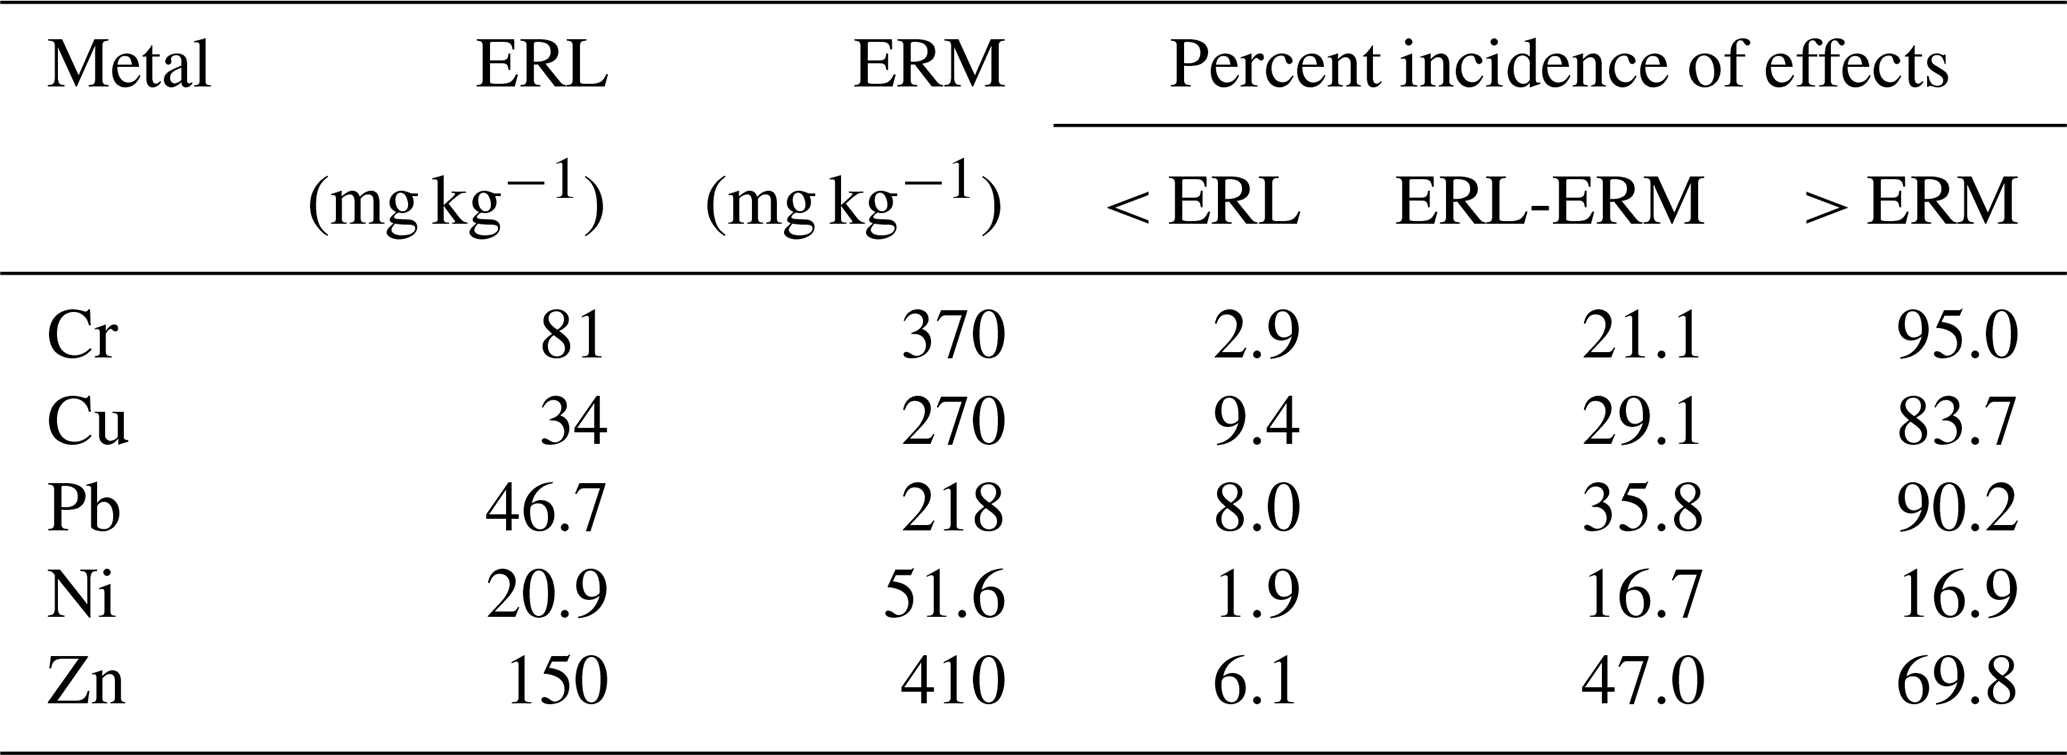
In this study, the concentrations of heavy metals in the surface sediments were compared with the ERL and ERM criteria. For cores MOT13A, MOT16 and UN4, the concentrations in the total sediment (<1 mm) were used. The concentrations of Cr in the surface sediments of cores UN4, UN5, MOT16A, UN6, UN6A and UN11 are higher than the ERL value (81 mg kg−1) but below the ERM value (370 mg kg−1), and the values of surface sediments at MOT13A and MOT16 are higher than the ERM value. The concentrations of Ni in the surface sediments of the collected cores are higher than the ERM value (51.6 mg kg−1), and as a result they frequently affect the biota (Long et al., 1995; Hahladakis et al., 2012).
The concentrations of Cu and Pb in surface sediments of stations MOT13A, MOT16A, UN4, UN5, MOT16 and UN6A are below the ERL values (34 mg kg−1 for Cu and 46.7 mg kg−1 for Pb), which indicates that effects on biota are rarely observed. On the other hand, the concentrations at surface sediments of cores UN6 and UN11 are higher than the ERL values but below the ERM values (270 mg kg−1 for Cu and 218 mg kg−1 for Pb), which means that they can occasionally affect biota . The concentrations of Zn are below the ERL (150 mg kg−1) value and the ERM value (410 mg kg−1), which indicates that effects on biota are rarely observed (Long et al., 1995; Hahladakis et al., 2012).
5.4 Mean effects range medium quotients
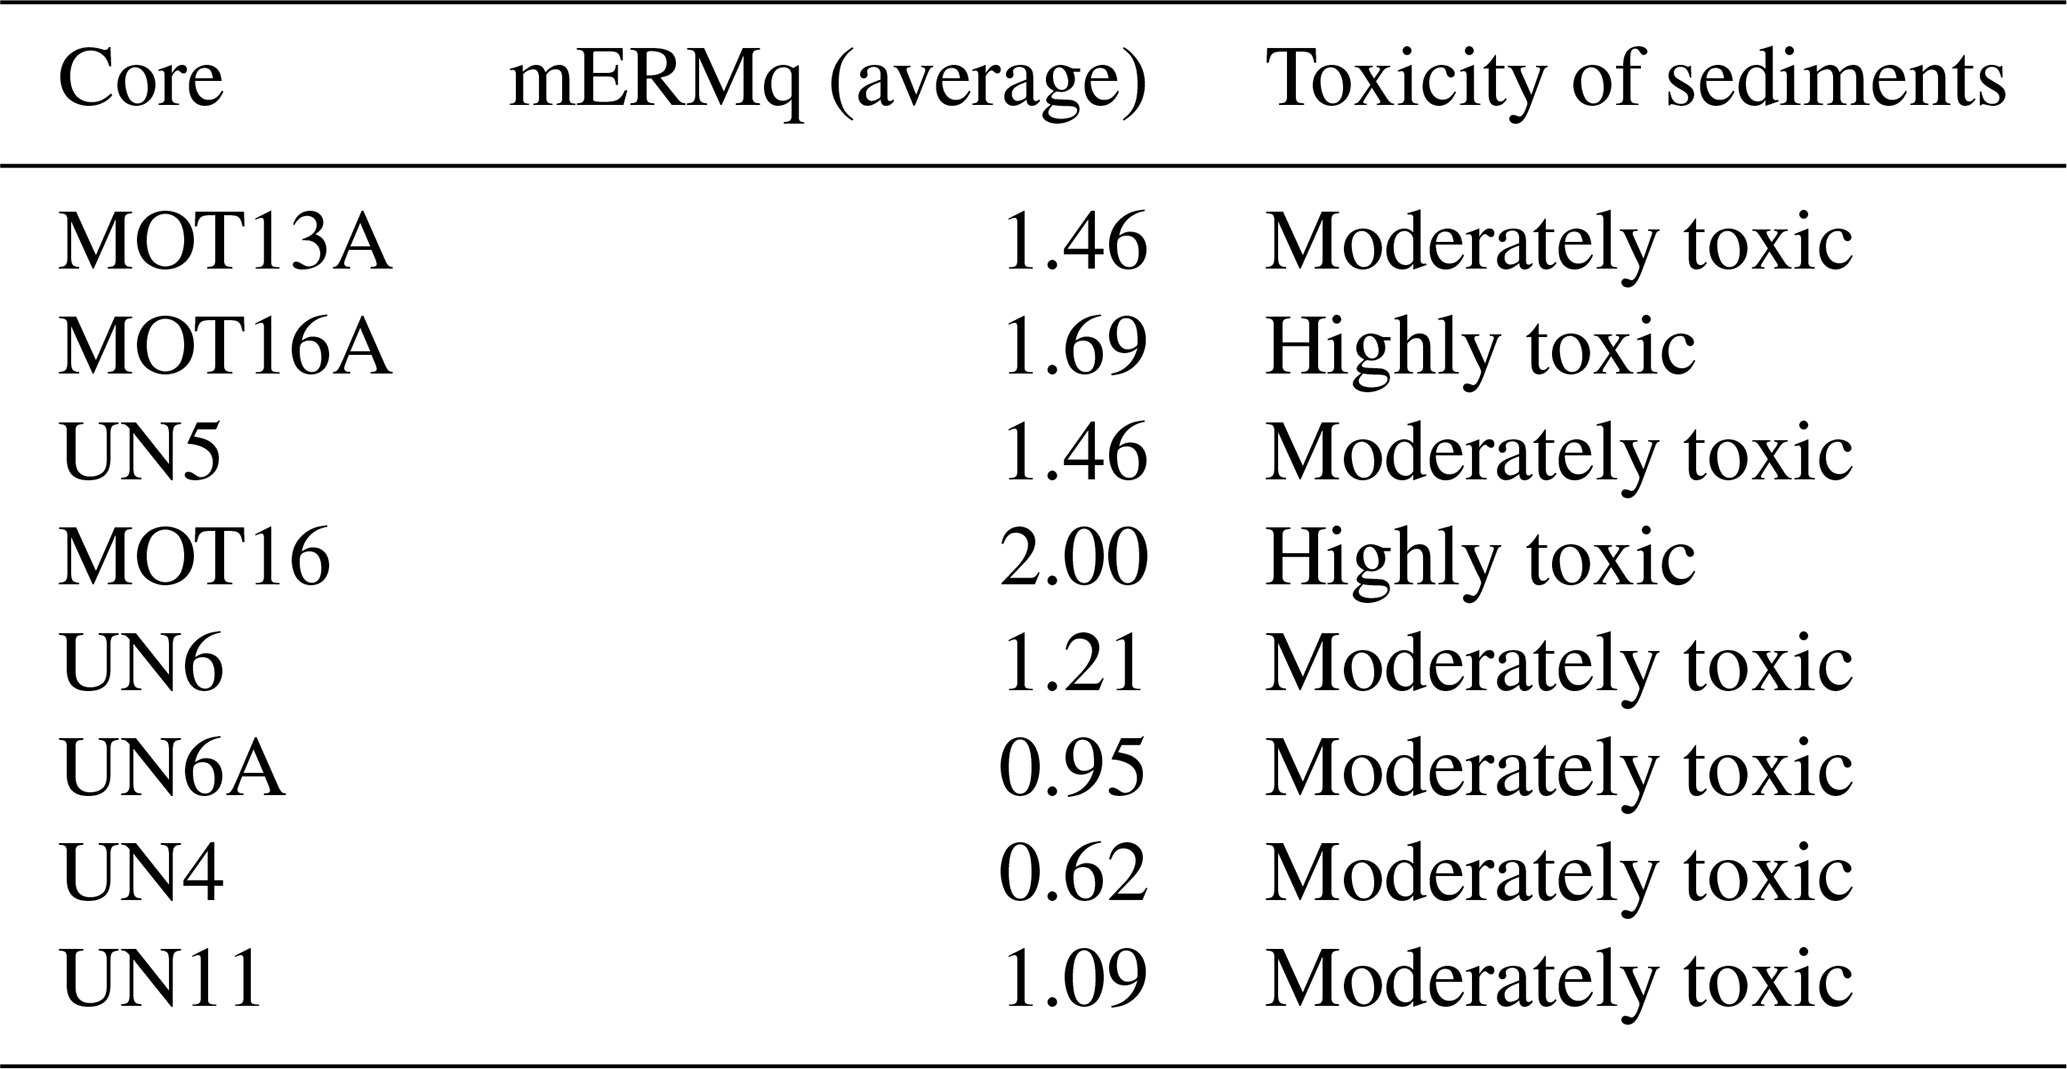
The “mean effects range medium quotient” (mERMq) is an index that is used to evaluate the possible biological effects of the coupled toxicity of all heavy metals in the surface sediments (Gredilla et al., 2015). Briefly, mERMq was calculated by dividing the average concentration of each metal at the top 9 cm by its respective ERM, to obtain the corresponding sediment quality guideline quotient (ERMq). Following this, the mERMq for each core was obtained as the average of previously calculated ERMqs. ERMqs indicate the pollutant concentration above which effects are expected to be frequent and have been only defined for very toxic elements (Gredilla et al., 2015).
In this study, Cr, Ni, Cu, Pb and Zn were considered in our calculations, and the results are depicted in Table 8. In the MOT13A, MOT16 and UN4 cores, the concentrations of the total sediment (<1 mm) were used for the calculation of mERMq. Values of mERMq in the ranges of 0.0–0.1, 0.1–0.5, 0.5–1.5 and <1.5 correspond to the following probabilities of toxicity: 9 % (non-toxic), 21 % (slightly toxic), 49 % (moderately toxic) and 76 % (highly toxic), respectively (Gredilla et al., 2015). The mERMq values obtained for the sediments varied from 0.62 to 2.00, which means that the sediments are moderately or highly toxic.
The concentrations of Cr, Ni, Cu, Pb and Zn in sediments of cores MOT13A, UN5, UN6, UN6A, UN4 and UN11 are moderately toxic, and in the sediments of MOT16A and MOT16 they are highly toxic. The concentrations of Cu, Pb and Zn in sediments of cores MOT13A, MOT16A, MOT16 and UN4 are non-toxic, with mERMq ranging from 0.08 to 0.10, and those in sediments of UN5, UN6, UN6A and UN11 are slightly toxic, with a mERMq range of 0.16–0.21.
5.5 Evolution of marine pollution
The total concentrations of eight heavy metals in the surface sediments were compared with those of a similar study 10 years ago (Paraskevopoulou, 2009). In cores MOT13A, MOT16 and UN4, the concentrations of the total sediment fraction (<1 mm) were used and the results are depicted in Fig. 6. The levels of Cr, Ni and Mn in most sediments are decreased in 2017 compared to the study from 2007. On the other hand, the levels of Pb and Cu are increased in 2017 compared to the study from 2007. Moreover, the levels of Zn at most sediments are decreased in 2017 compared to the study from 2007.
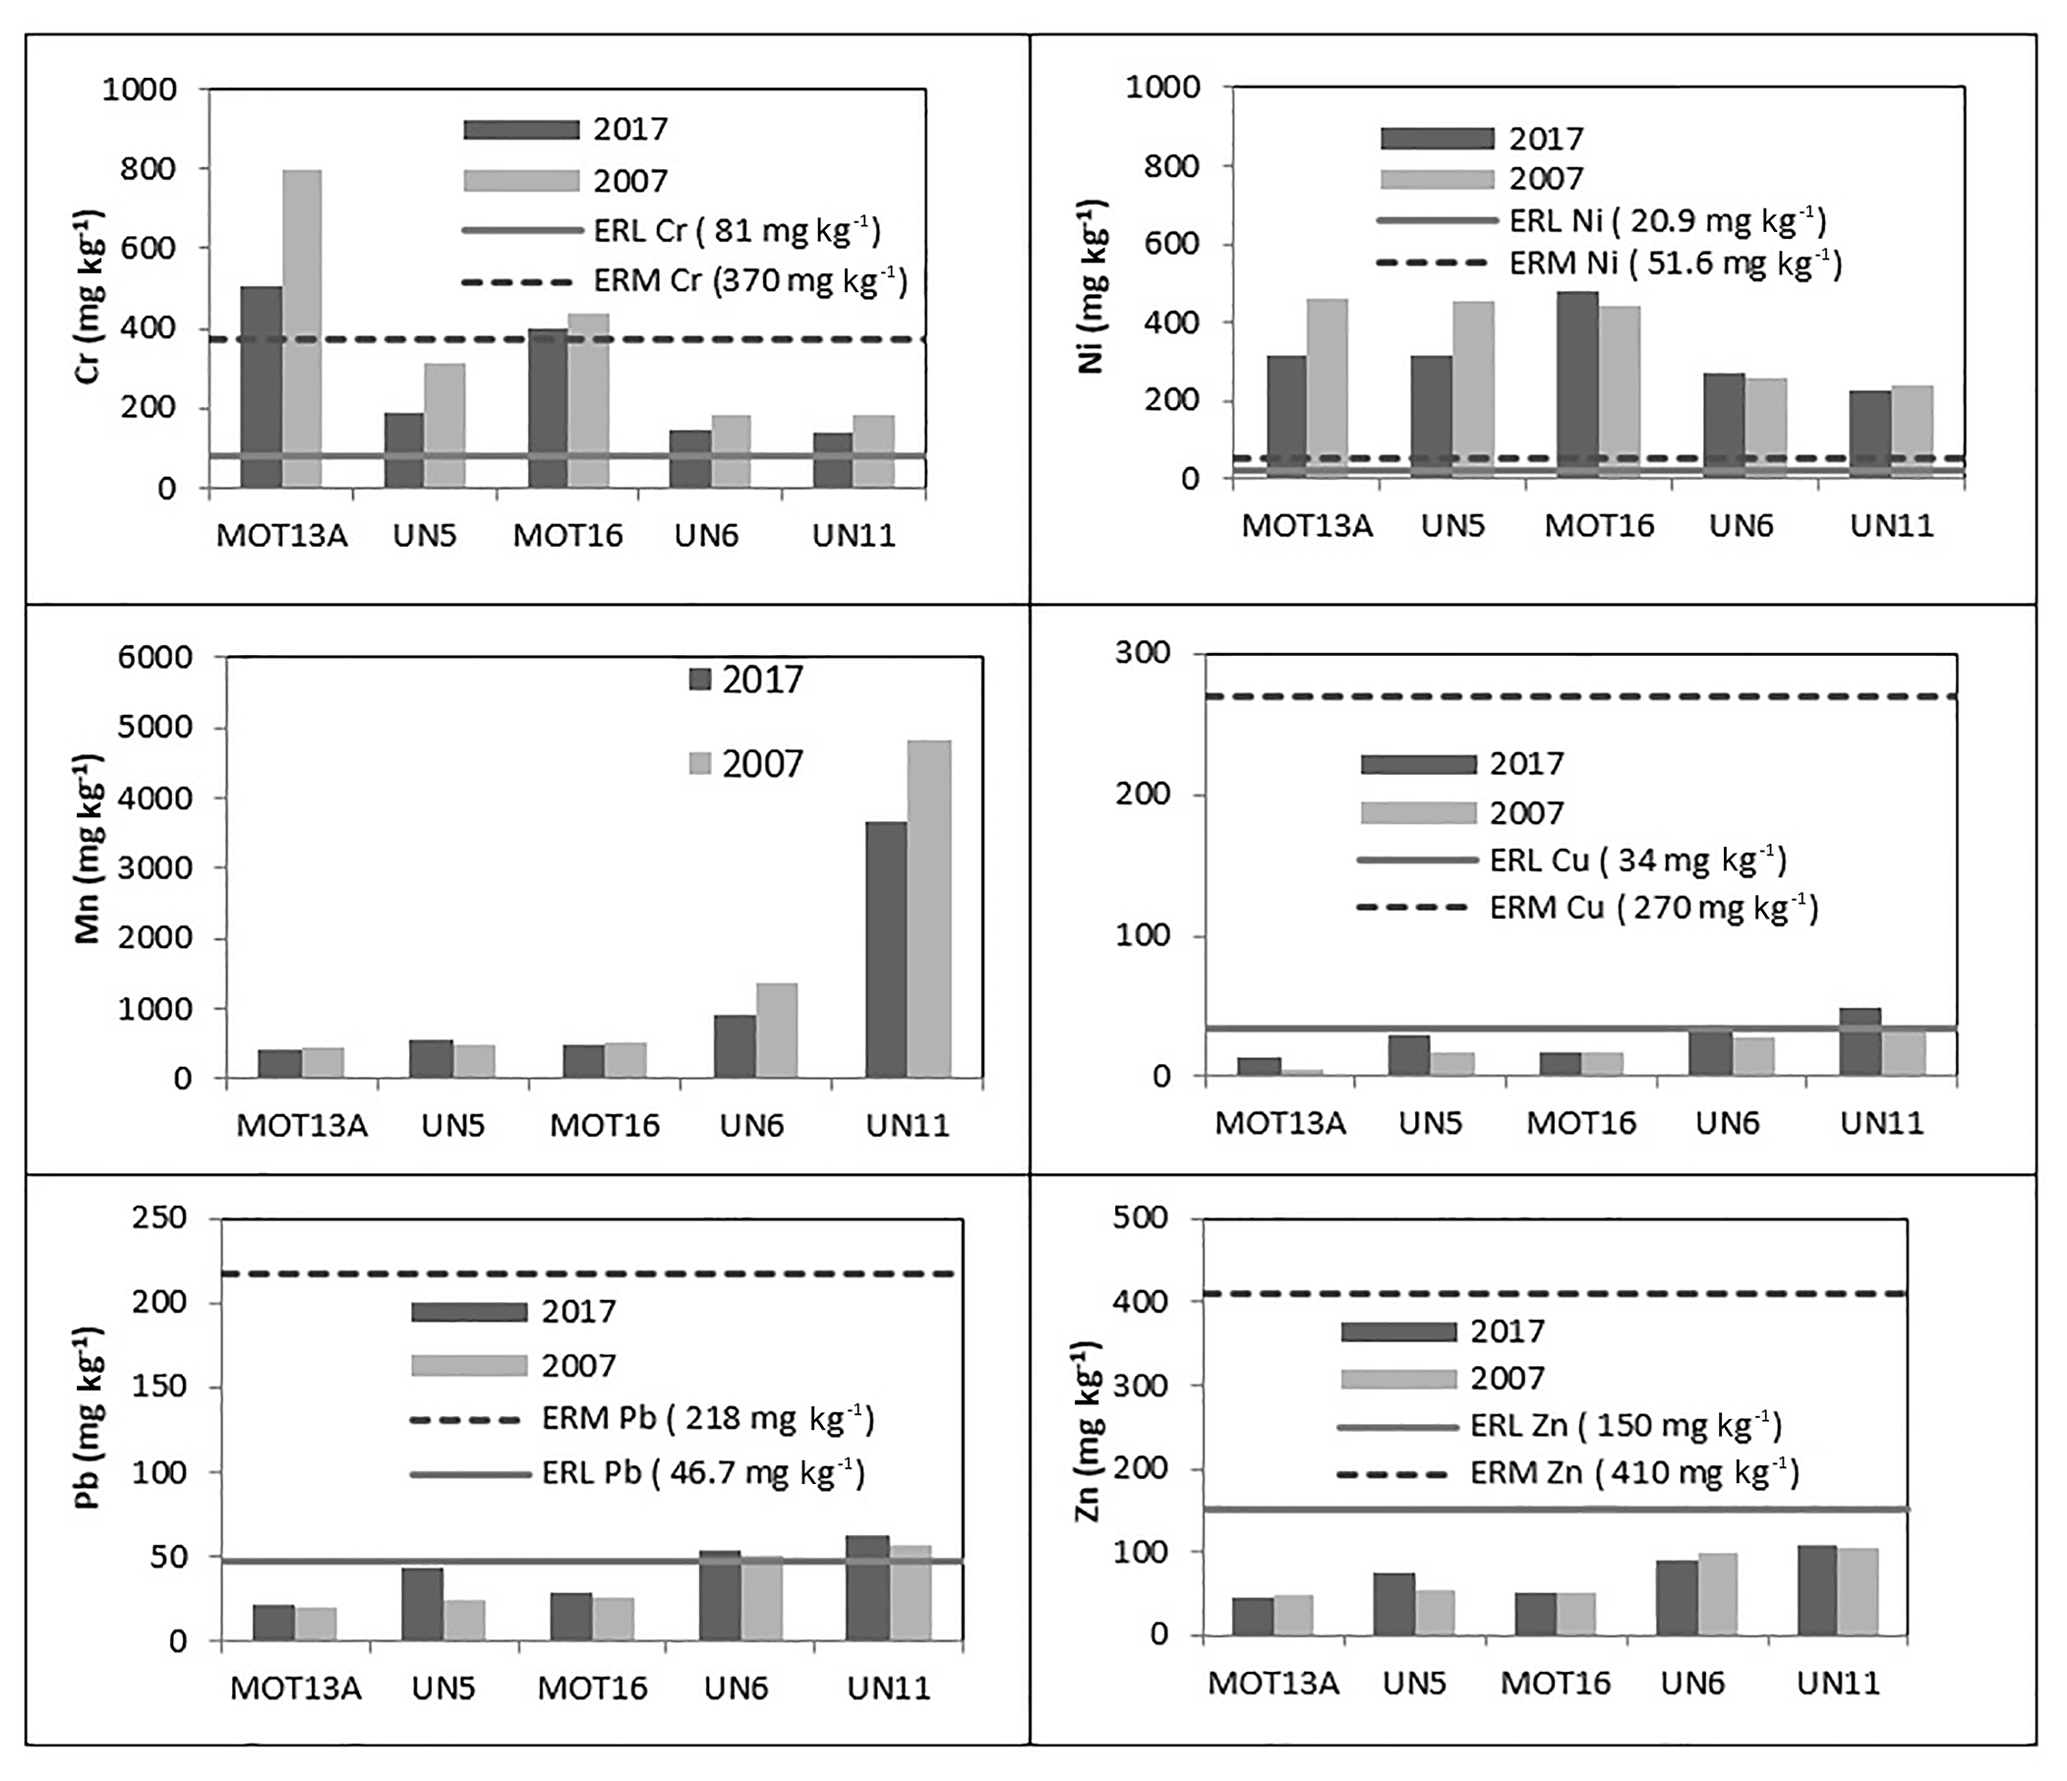
Figure 6Levels of heavy metals in surface sediments of 2017 and 2007 plotted with sediment quality guidelines. For the coarse sediments of stations MOT13A, MOT16 and UN4, the concentrations of total sediment <1 mm) were used.
5.6 Comparison of metal concentrations in the western Saronikos Gulf with other areas of the Saronikos Gulf
The concentrations of heavy metals in the surface sediments of the western Saronikos Gulf from the present study are compared with data from the other sub-areas of the Saronikos Gulf. The specific data reviewed are (a) from surface sediments collected in Elefsis Bay (EB), the inner Saronikos Gulf (ISG) and the outer Saronikos Gulf (OSG) during the same sampling of October 2017 and analysed in the Laboratory of Environmental Chemistry using the same methodologies (Xarlis, 2018; Vrettou, 2019) and (b) data from surface sediments in EB, the ISG and the OSG from various samplings conducted by the Hellenic Centre for Marine Research and analysed by X-ray fluorescence (Karageorgis et al., 2020a, b). A summary of the results of this comparative review are provided in Table 9. The location of selected stations from the other sub-areas of the Saronikos Gulf are roughly given in Fig. A17. Furthermore, metal concentrations in sediments from various areas of Greece analysed by X-ray fluorescence (Kanellopoulos et al., 2022) were also reviewed.
Table 8The mERMq values calculated for the surface sediments (0–9 cm) of the collected cores of the western Saronikos Gulf by dividing the average concentration (mg kg−1) of each metal (Cr, Ni, Cu, Pb, Zn) by its respective ERM (mg kg−1). In cases of cores MOT13A, MOT16 and UN4, the concentrations of total sediment (<1 mm) were used.
It is observed that high Al concentrations are recorded in the western and outer Saronikos Gulf, related to the settling of finer aluminosilicates in deeper waters. Moreover, high values of Al contents at Elefsis Bay (S1 and neighbouring stations, Fig. A17) are attributed to the terrigenous inputs from ephemeral streams discharging into the bay (Karageorgis et al., 2020a).
Cr and Ni contents show maxima in the northwestern stations (MOT13A, MOT16, MOT16A) offshore from Sousaki, due to the geological contribution from ophiolite complexes (Kelepertsis et al., 2001). Ni and Cr concentrations throughout the northwestern area of the Saronikos Gulf are higher than the mean background contents (117 mg kg−1 for Ni and 142 mg kg−1 for Cr) estimated from sediments sampled in various areas of Greece and similar to concentrations reported for Aliveri Bay and the Asopos River basin, which are also related to the occurrence of ultrabasic rocks (Kanellopoulos et al., 2022).
The concentrations of Mn and Fe are similar throughout the sub-areas of the Saronikos Gulf, with the exception of Epidavros Basin, where the maximum values are recorded due to the settling of finer aluminosilicates in deeper waters and possibly the implications of bottom water hypoxia and anoxia already discussed in previous sections (Kontoyannis, 2010; Karageorgis et al., 2020a).
Table 9Comparison of heavy metal concentrations (in mg kg−1) between areas of the Saronikos Gulf.
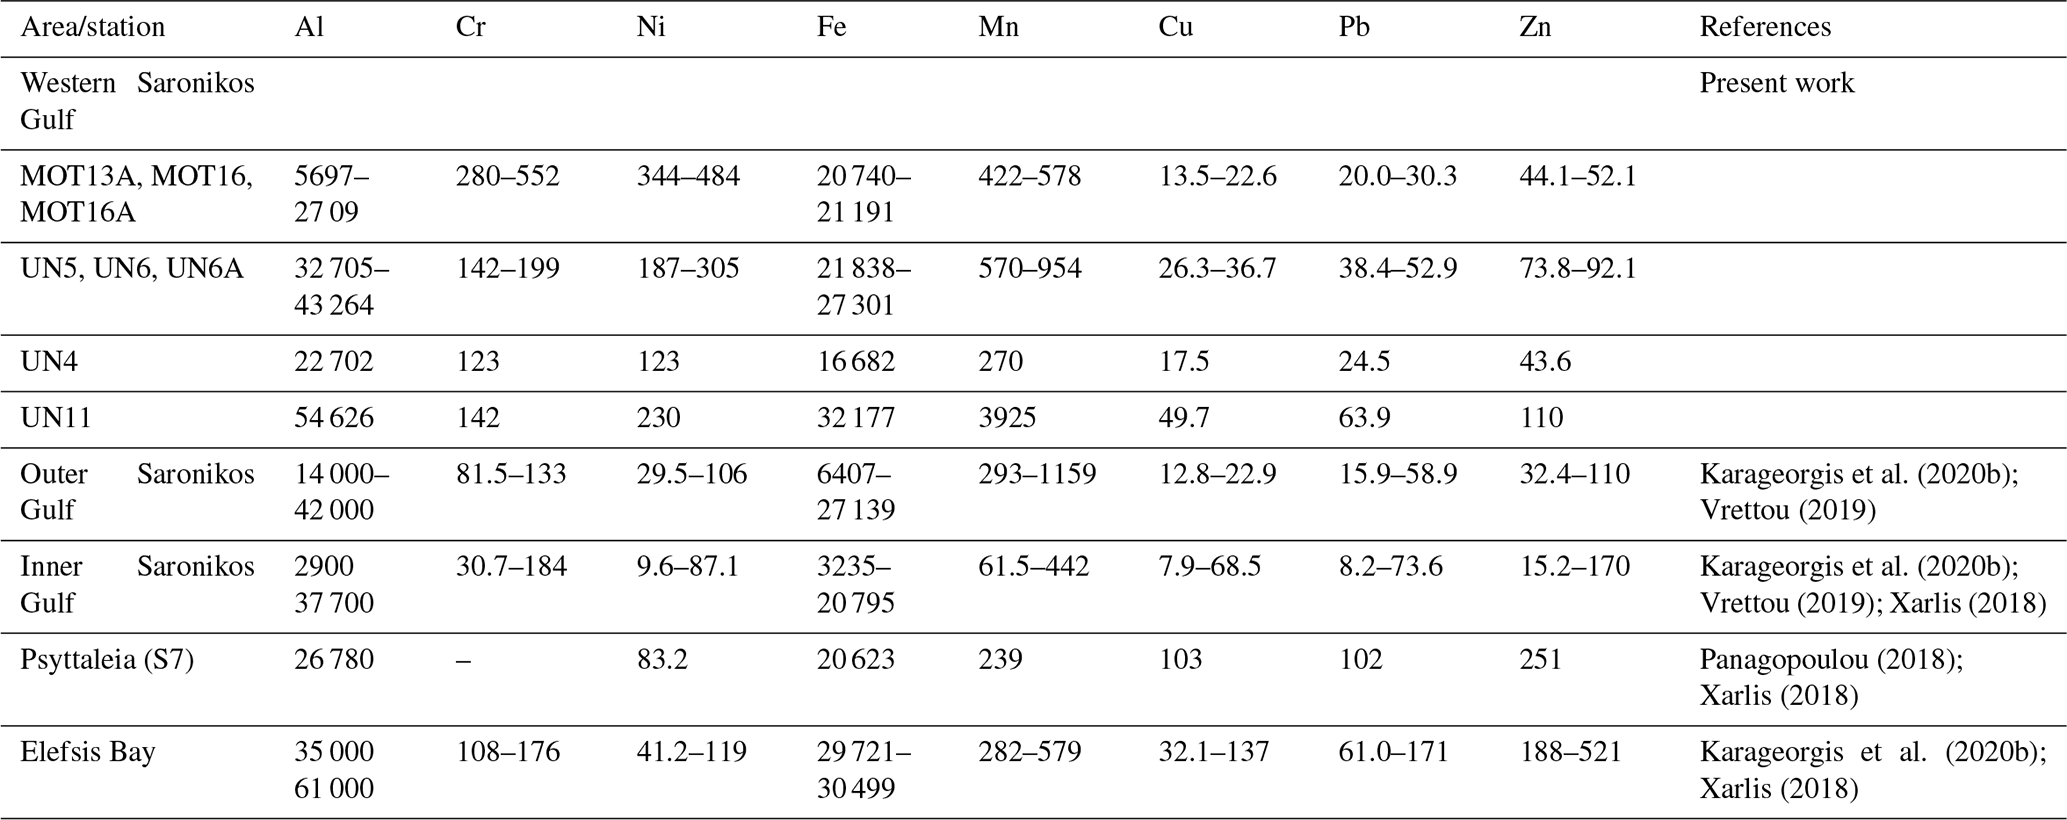
The so-called anthropogenic metals Cu, Pb and Zn show maxima at Elefsis Bay, while their concentrations in the other parts of the Saronikos Gulf are reported to be lower. The levels at Epidavros Basin (UN11) are the highest among the stations of the western Saronikos Gulf, which can be attributed to the transport of pollutants from the eastern basin (Psyllidou-Giouranovits and Pavlidou, 1998; Dassenakis et al., 2003). However, the western Saronikos Gulf levels of Cu, Pb and Zn remain lower than polluted stations of the inner Saronikos Gulf, such as OS2 (near the port of Pireaus) and S7 (Psyttaleia, outfall of the Athens Waste Water Treatment Plant) (see Fig. A17). Furthermore, Cu, Pb and Zn concentrations at the Megara and Epidavros basins are similar to those in surface sediments of Malliakos and Pagassitikos gulfs (Kanellopoulos et al., 2022) and the concentrations found at most stations of the inner and outer Saronikos Gulf (Karageorgis et al., 2020; Panagopoulou, 2018; Vrettou, 2019; Xarlis, 2018) but higher than less-affected island areas such as Chios Port, Milos and Andros (Kanellopoulos et al., 2022). In general, the western Saronikos Gulf sediments, affected by a relatively small industrial zone, are much less contaminated by Zn compared to the concentrations well above 150 mg kg−1 found in specific locations in Elefsis Bay, the inner Saronikos Gulf, Thessaloniki Bay, Ierissos and Lavrio (Karageorgis et al., 2020, Kanellopoulos et al., 2022), which feature extensive pollution sources such as the Elefsis industrial zone, Piraeus Port, the Athens Waste Water Treatment Plant outfall, the major rivers of northern Greece, and current or historical mining operations.
The heavy metal pollution of the western Saronikos Gulf has not yet been sufficiently studied, despite the scientific interest of this area, in contrast to the numerous studies of the eastern coast. The distribution of metals in the sediment samples of the western Saronikos Gulf indicates that the area is enriched in metals of both geological and anthropogenic origin. The concentrations of all metals (Al, Mn, Cr, Ni, Cu, Pb, Zn) in muddy sediments are higher than those measured in sandy sediments. The cores are fairly homogeneous in terms of carbonates, and the downcore variability of % TOC is characterized by high surficial values that decrease with depth.
The Cr and Ni concentrations in the northwestern part of the study area are higher than those measured in the southwestern area, and their values are very stable with depth of most sediment cores, which can be attributed to the geological background of the adjacent coast. Al, Fe and Mn are increased from the northeast to the southwest of the study area. The concentrations of Al and Fe increase with depth in most cores, while the values of Mn decrease with depth. Generally, concentrations of Fe and Mn in surface sediments are affected by oxic and hypoxic conditions and the settling of finer aluminosilicates.
The vertical distributions of Cu, Pb and Zn present a constant decrease over depth along most cores, which can be attributed to their anthropogenic origin. Moreover, their levels in most sediments are higher than those measured 10 years ago. Finally, the Cu, Pb and Zn concentrations in the western Saronikos Gulf surface sediments are comparable with those in the outer Saronikos Gulf and lower than those from the inner Saronikos Gulf, Elefsis Bay and other pollution hot spots in Greece, which can be attributed to the smaller industrial zone and sparse urbanized settlements of the western Saronikos Gulf coast.
The concentrations of metals that are measured higher than the ERL values and the indication for moderately or highly toxic sediments by the calculation of mERMq signify that more research is required in order to investigate probable effects on the marine ecosystem. Continuous monitoring and updating of the results of the present study, complemented with detailed geochemical analysis for major element and mineral identification, core dating, metal speciation, and the study of bioaccumulation, should be conducted to assess the impacts of heavy metal pollution on the marine environment of the western Saronikos Gulf.
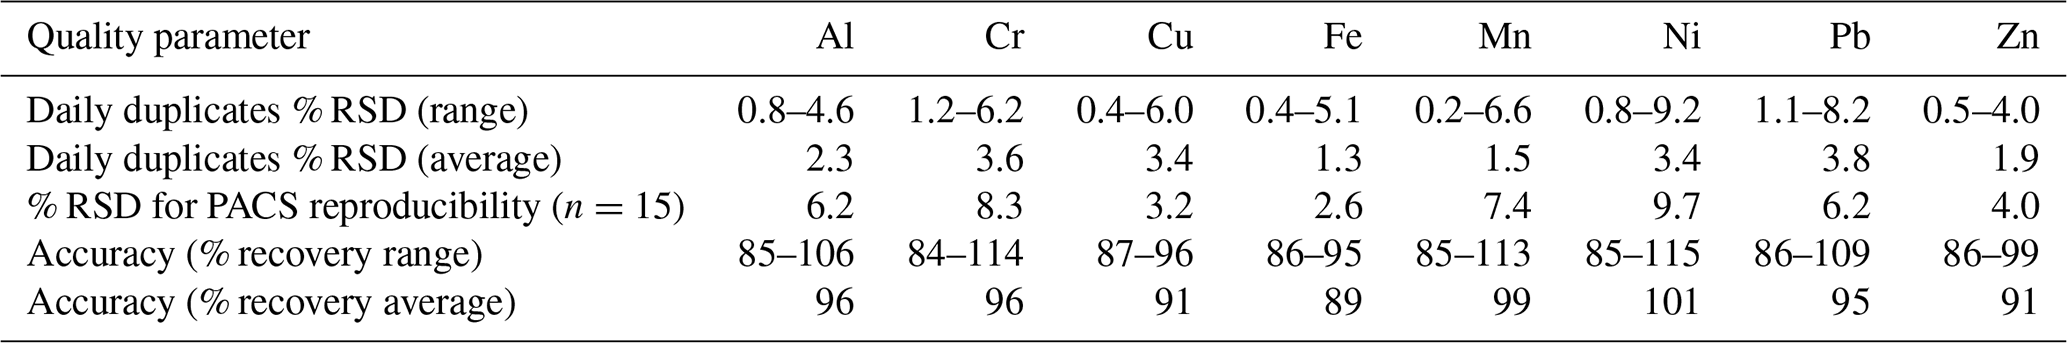
Table A2The ratios of eight heavy metals to Al in surface and deeper-layer sediments of the collected cores. In cases of the coarse-grained sediment cores MOT13A, MOT16 and UN4, the ratios in the fine-sediment fraction (f<63µm) are calculated.

Table A3Spearman's correlation coefficient matrix for Al (mg kg−1), Cr (mg kg−1), Ni (mg kg−1), Fe (mg kg−1), Mn (mg kg−1), Cu (mg kg−1), Pb (mg kg−1), Zn (mg kg−1), TOC (% total organic carbon) and carbonates (% CaCO3) (N=140 sediment samples).
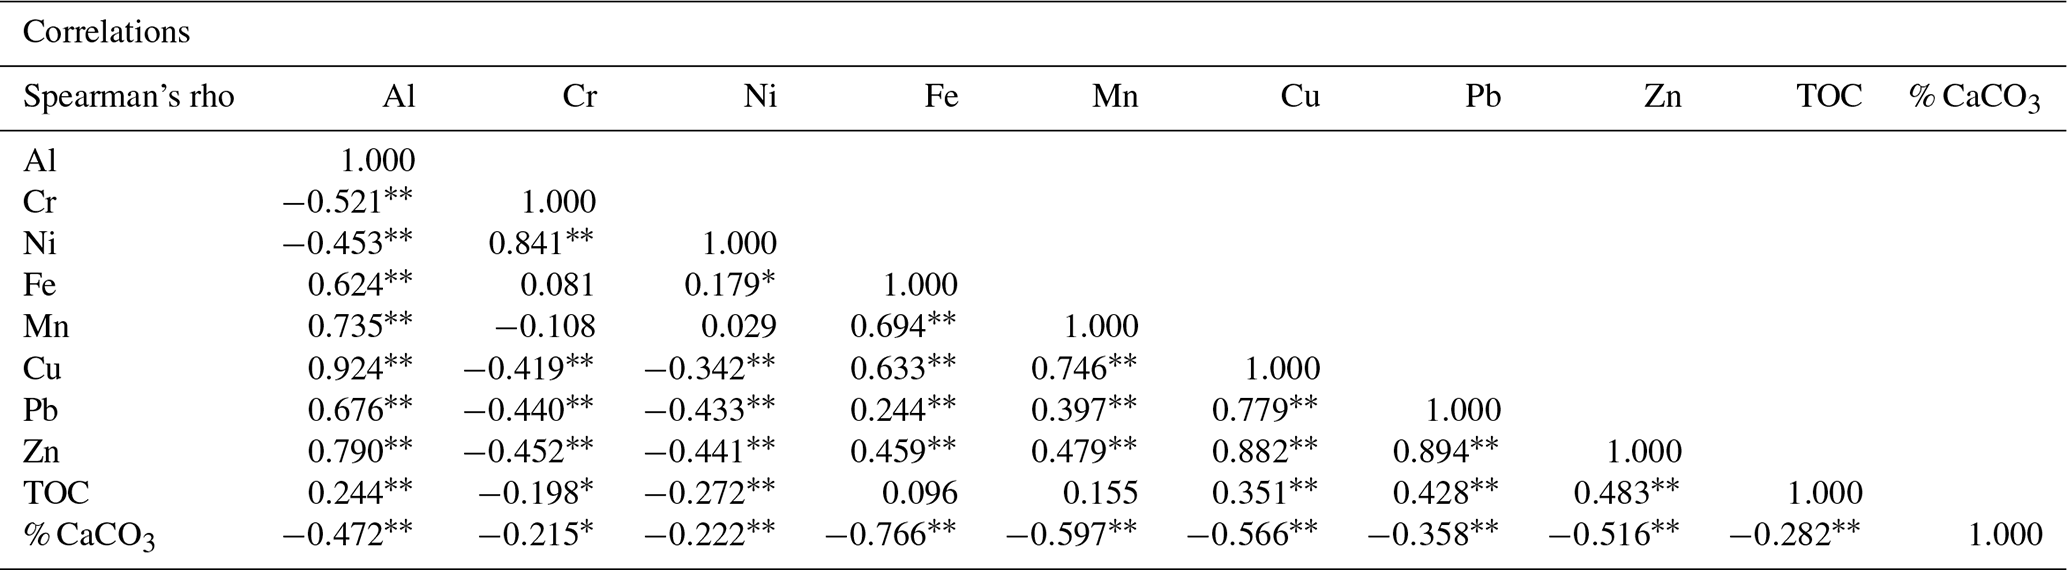
∗ Correlation is significant at the 0.05 level (two-tailed). Correlation is significant at the 0.01 level (two-tailed).
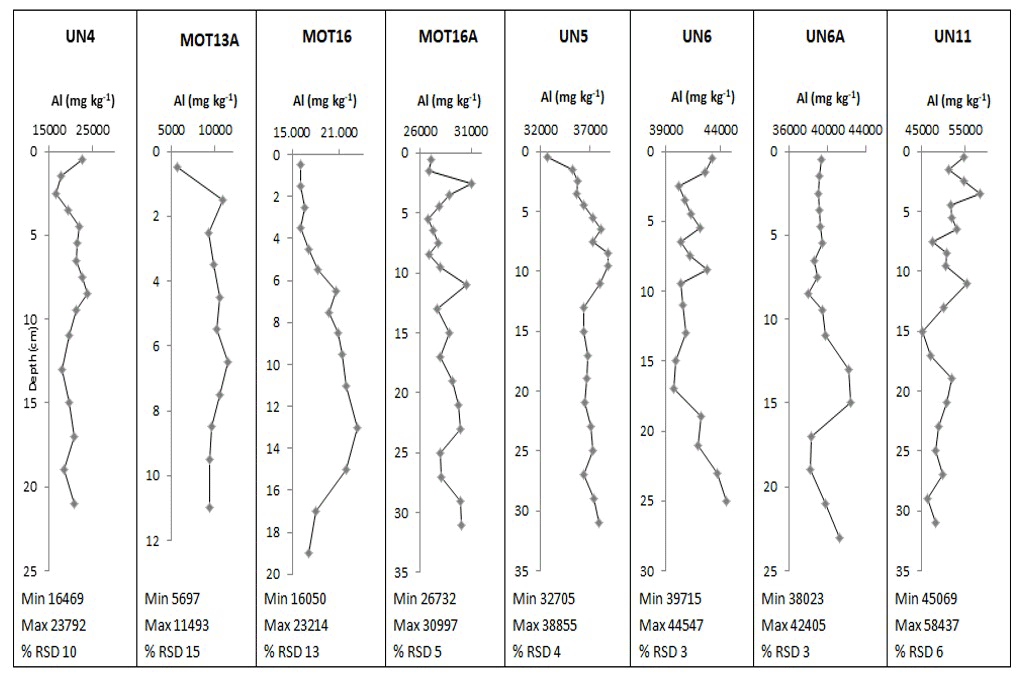
Figure A1Vertical distributions of Al (in mg kg−1) in sediment cores. The concentrations in the coarse cores MOT13A, MOT16 and UN4 refer to the total sediment fraction (<1 mm).
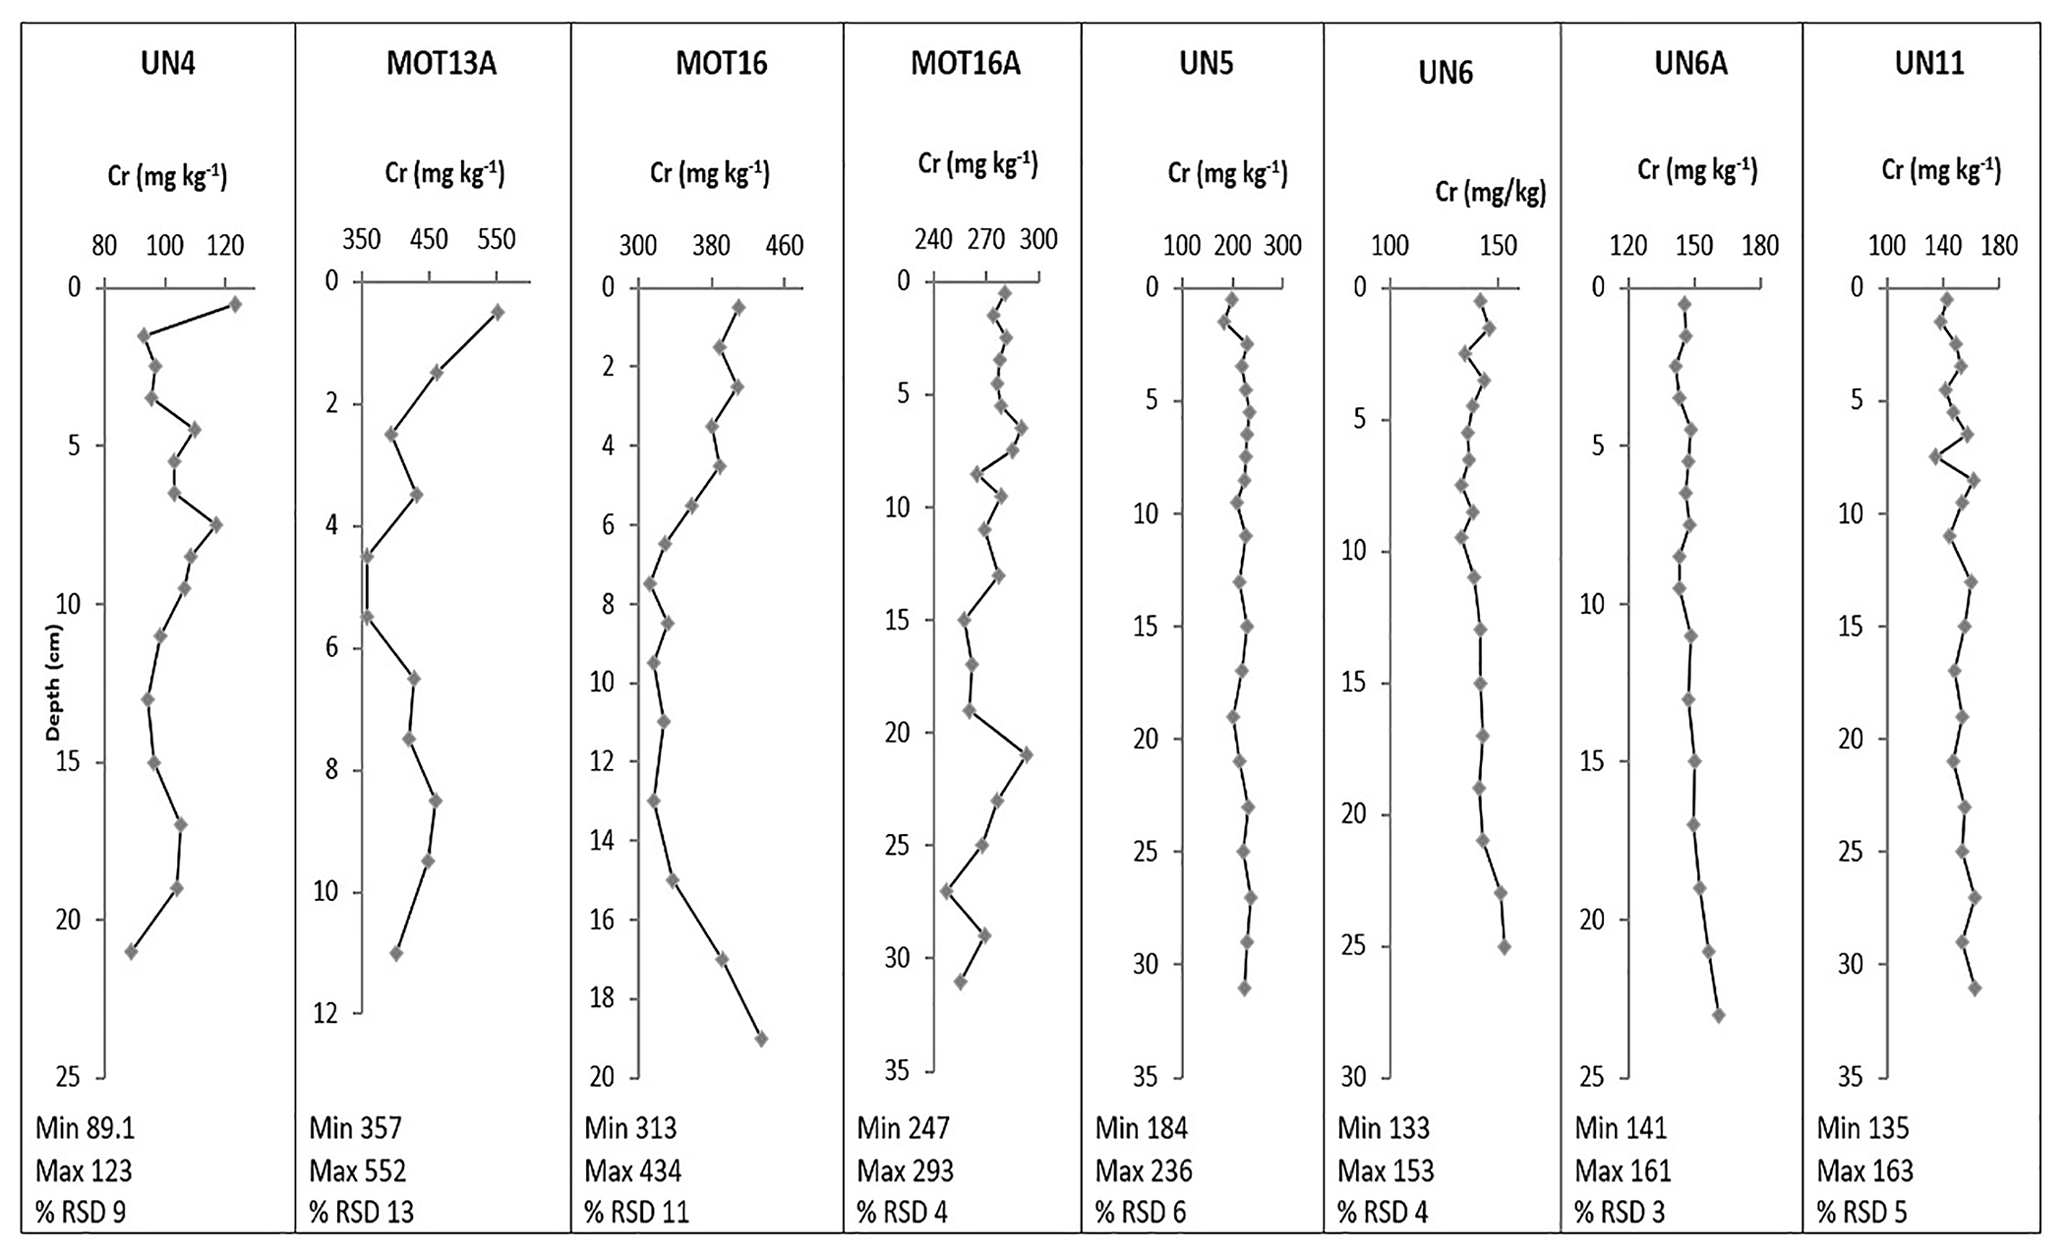
Figure A2Vertical distributions of Cr (in mg kg−1) in sediment cores. The concentrations in the coarse cores MOT13A, MOT16 and UN4 refer to the total sediment fraction (<1 mm).
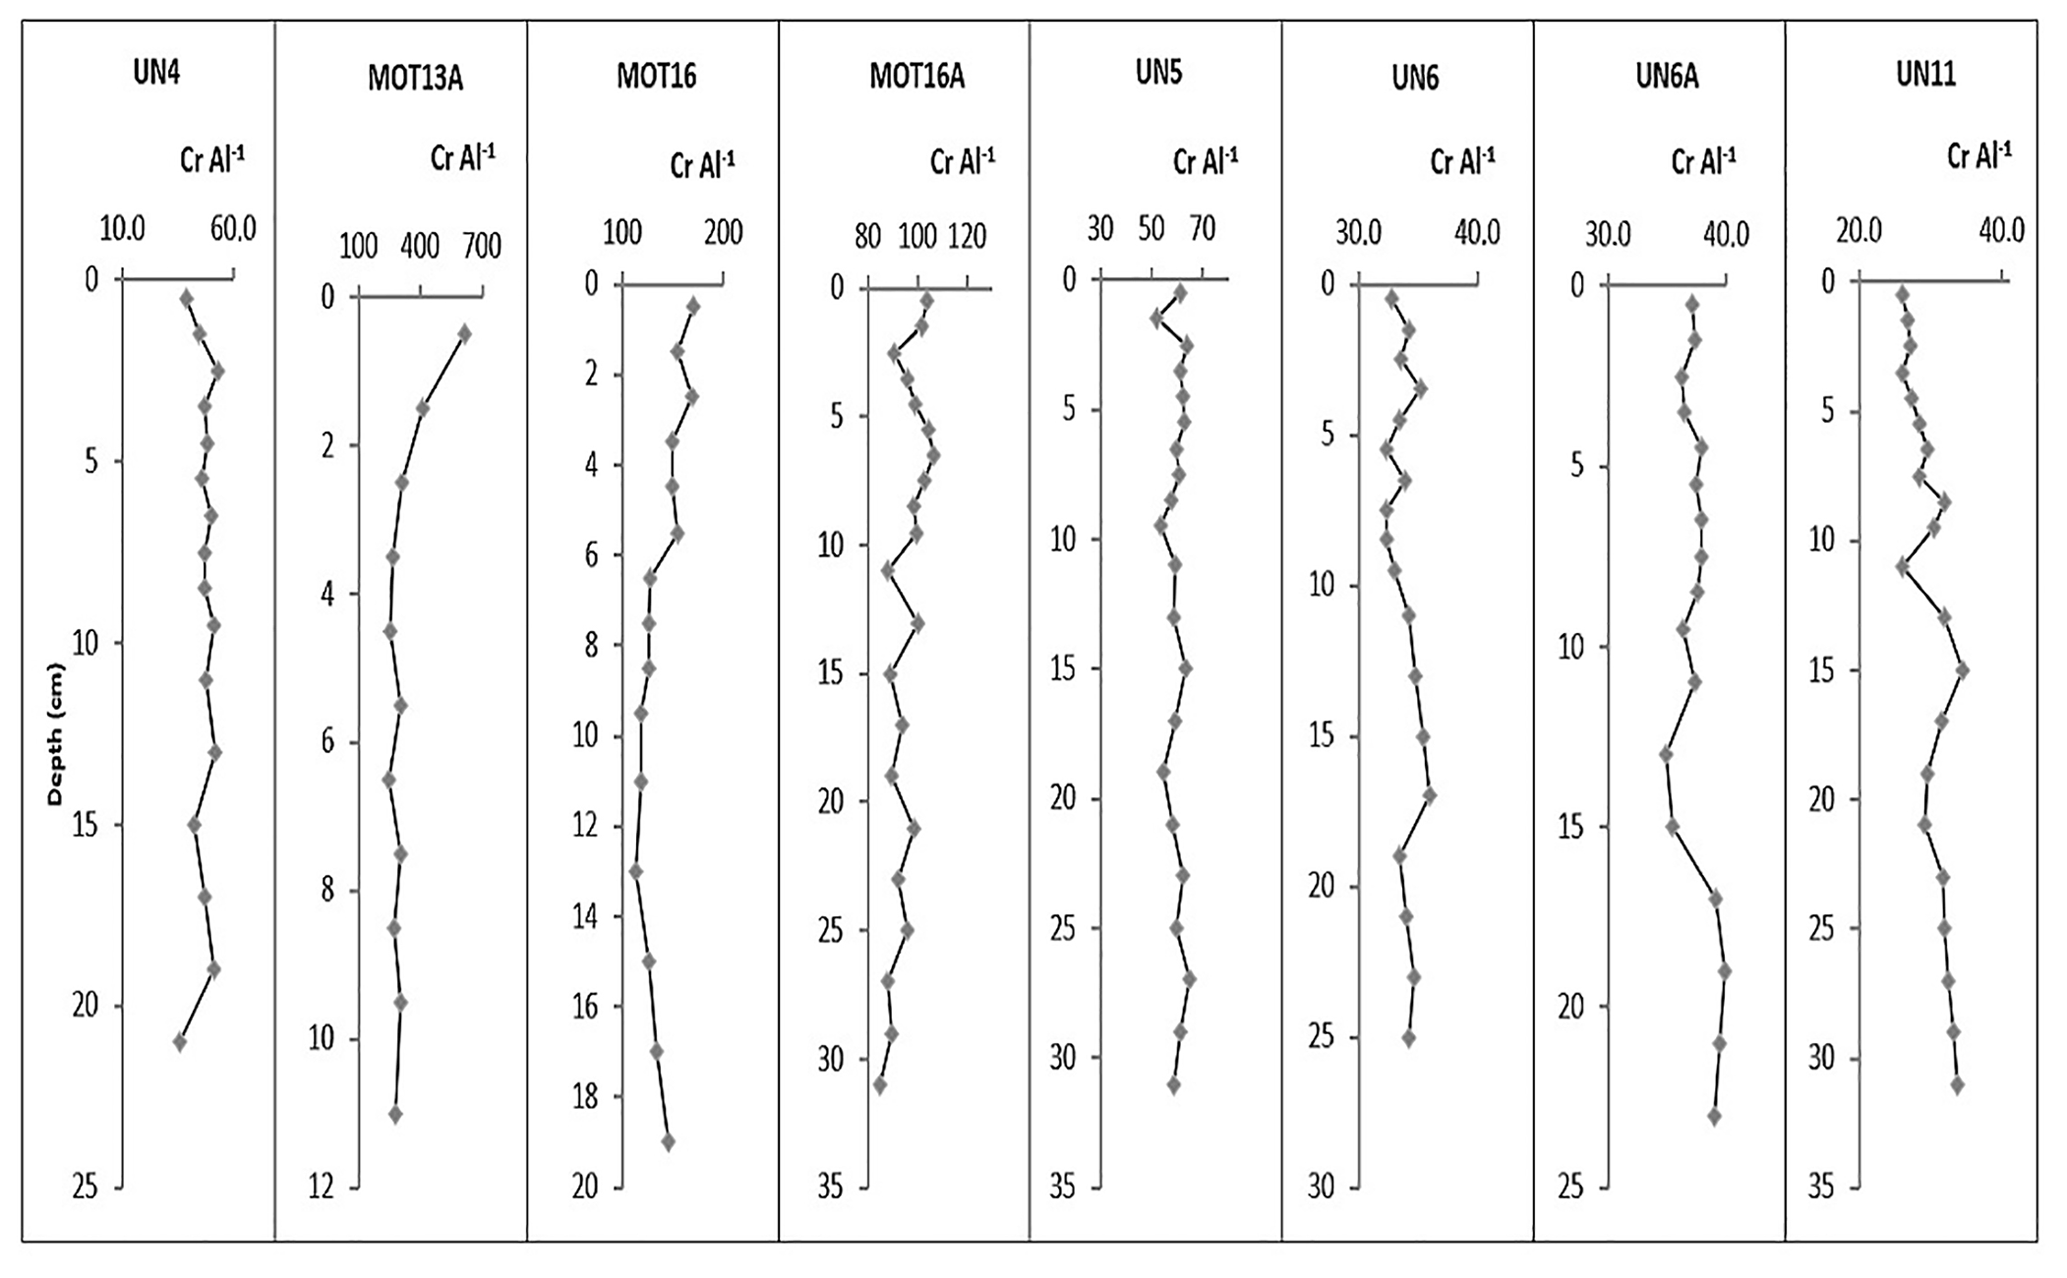
Figure A3Vertical distributions of Cr Al in sediment cores. The ratios in the coarse cores MOT13A, MOT16 and UN4 are calculated at the fine-sediment fraction (<63 µm).

Figure A4Vertical distributions of Ni in (in mg kg−1) in sediment cores. The concentrations in the coarse cores MOT13A, MOT16 and UN4 refer to the total sediment fraction (<1 mm).
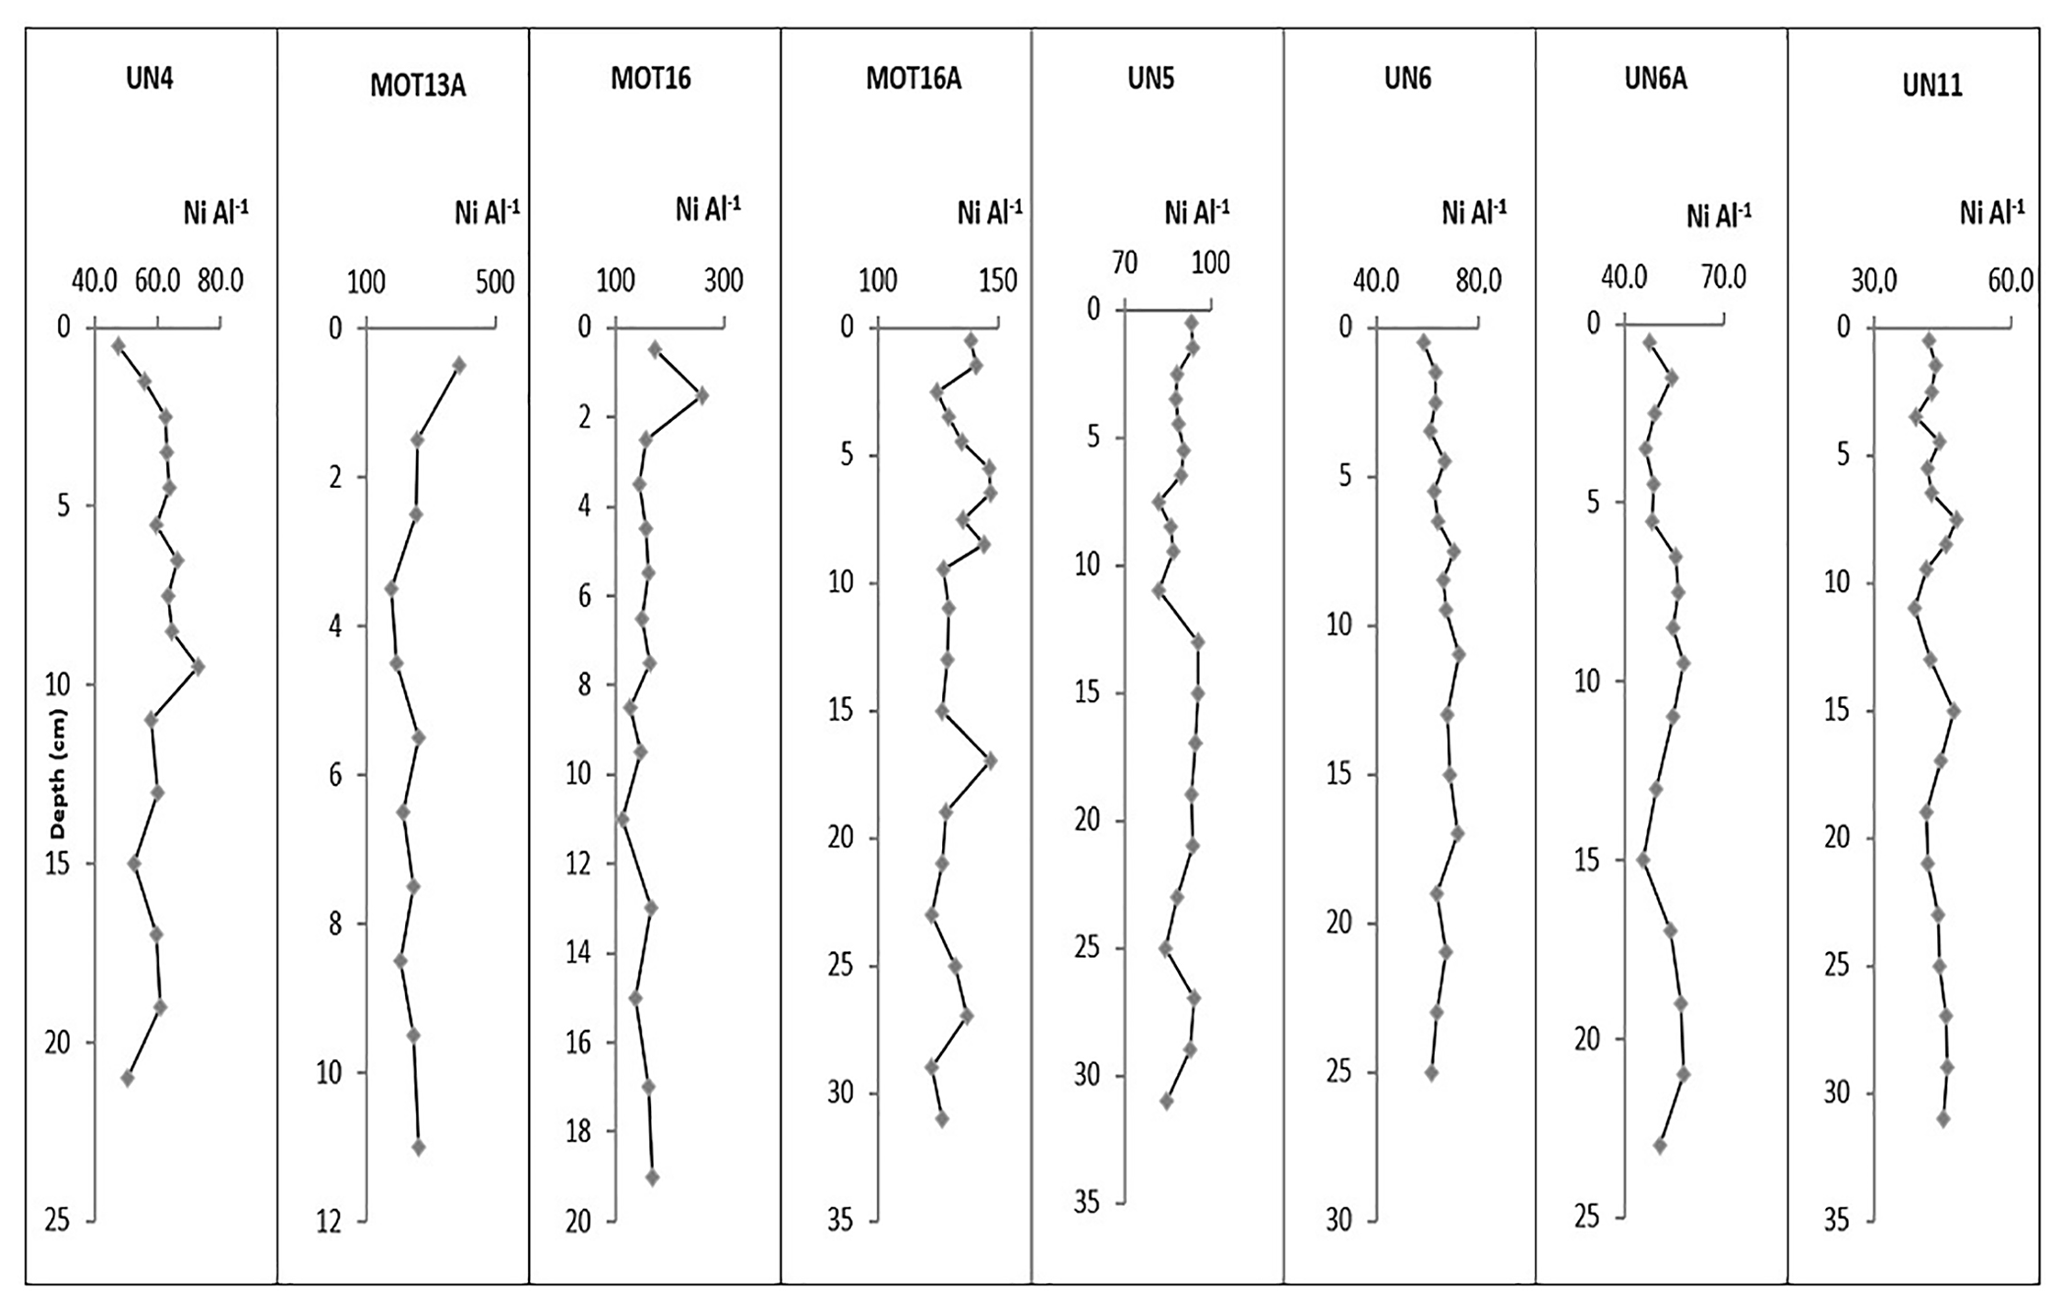
Figure A5Vertical distributions of Ni Al in sediment cores. The ratios in the coarse cores MOT13A, MOT16 and UN4 are calculated at the fine-sediment fraction (<63 µm).
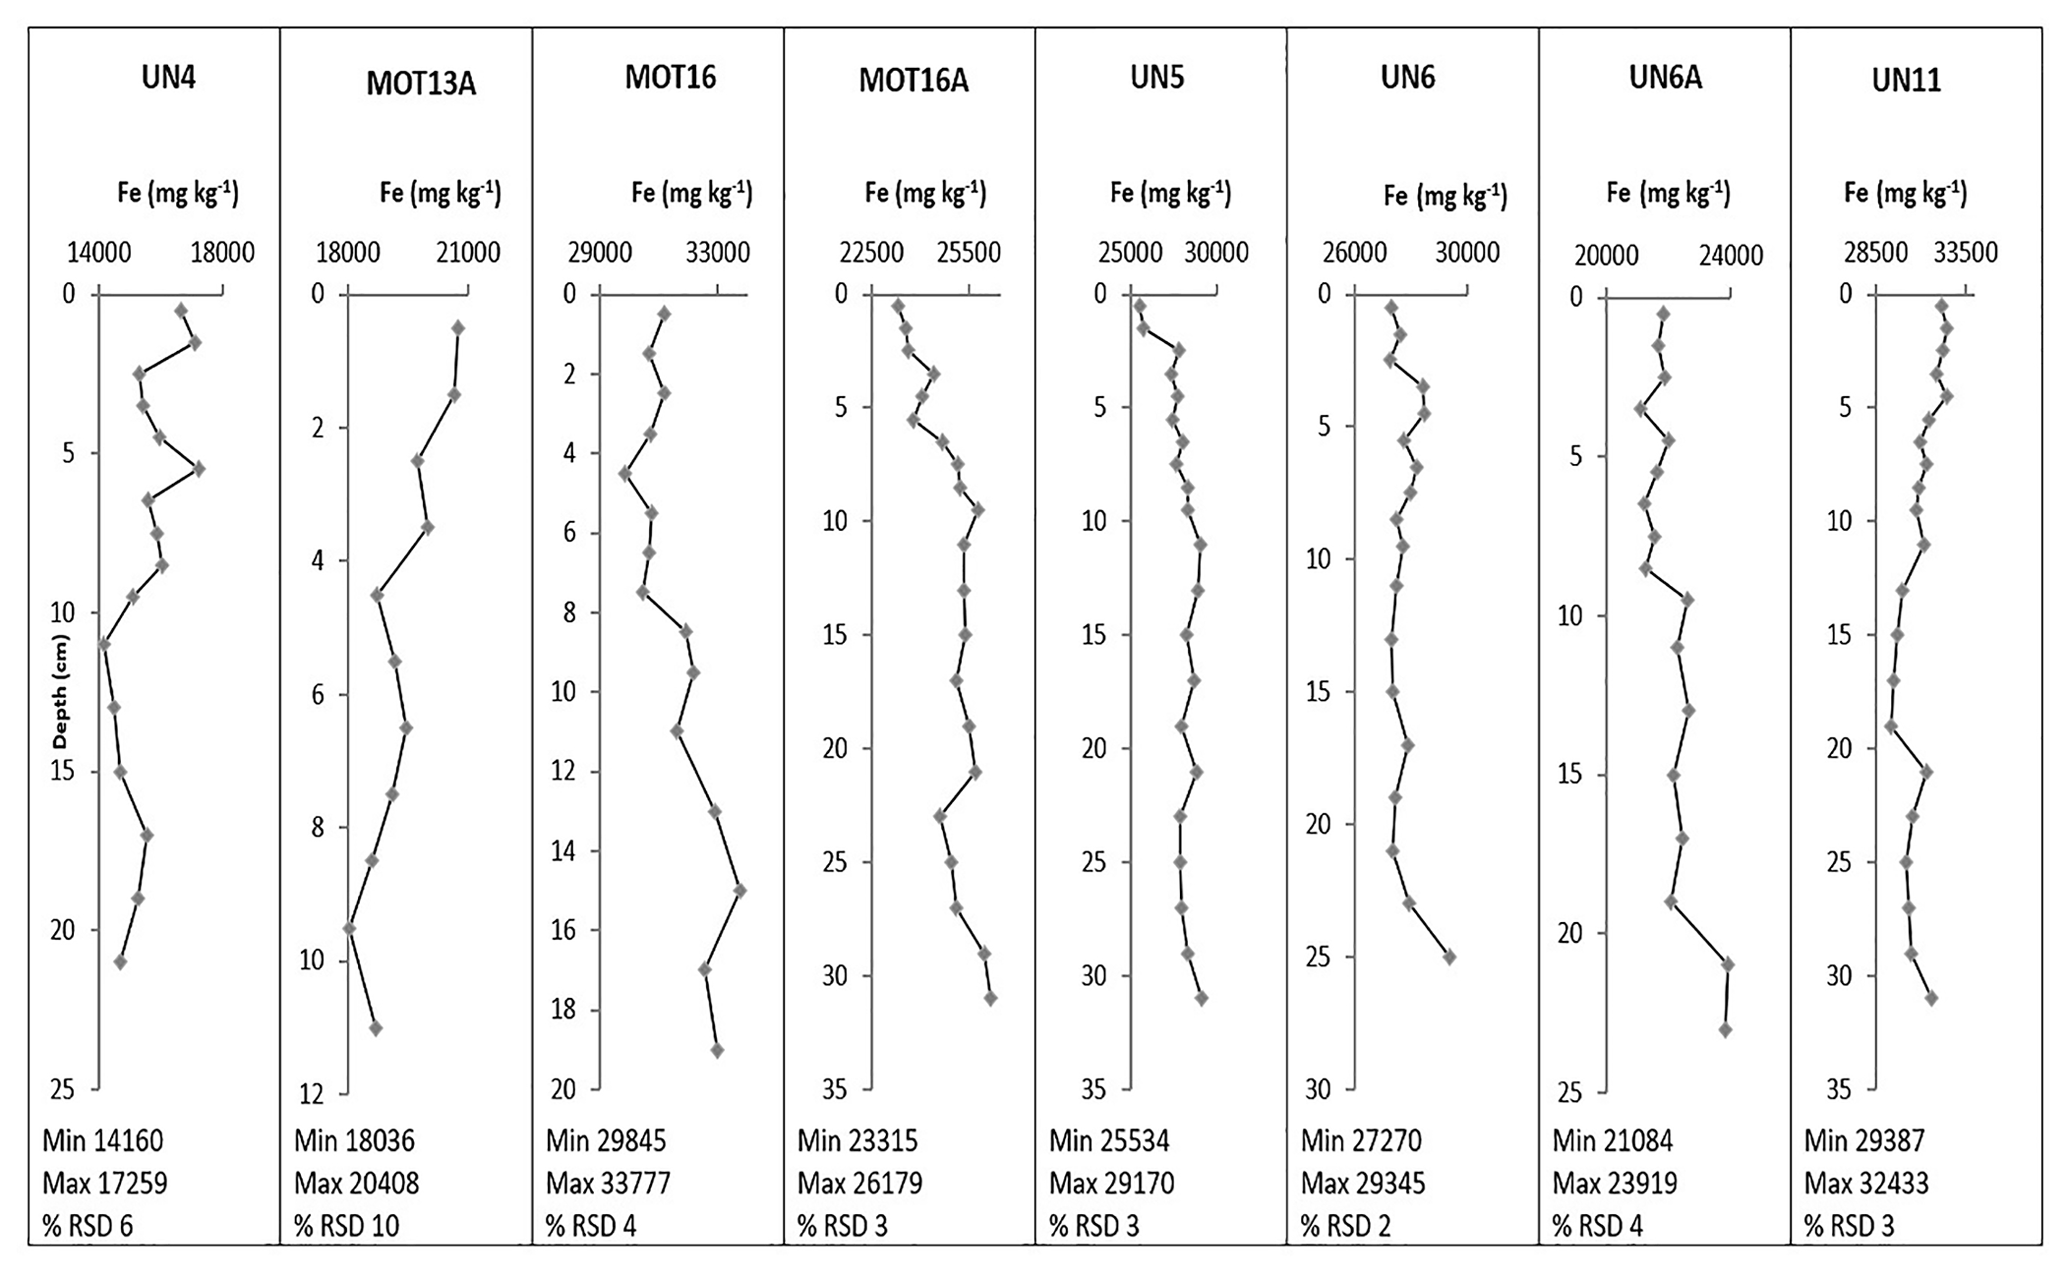
Figure A6Vertical distributions of Fe (in mg kg−1) in sediment cores. The concentrations in the coarse cores MOT13A, MOT16 and UN4 refer to the total sediment fraction (f<1 mm).
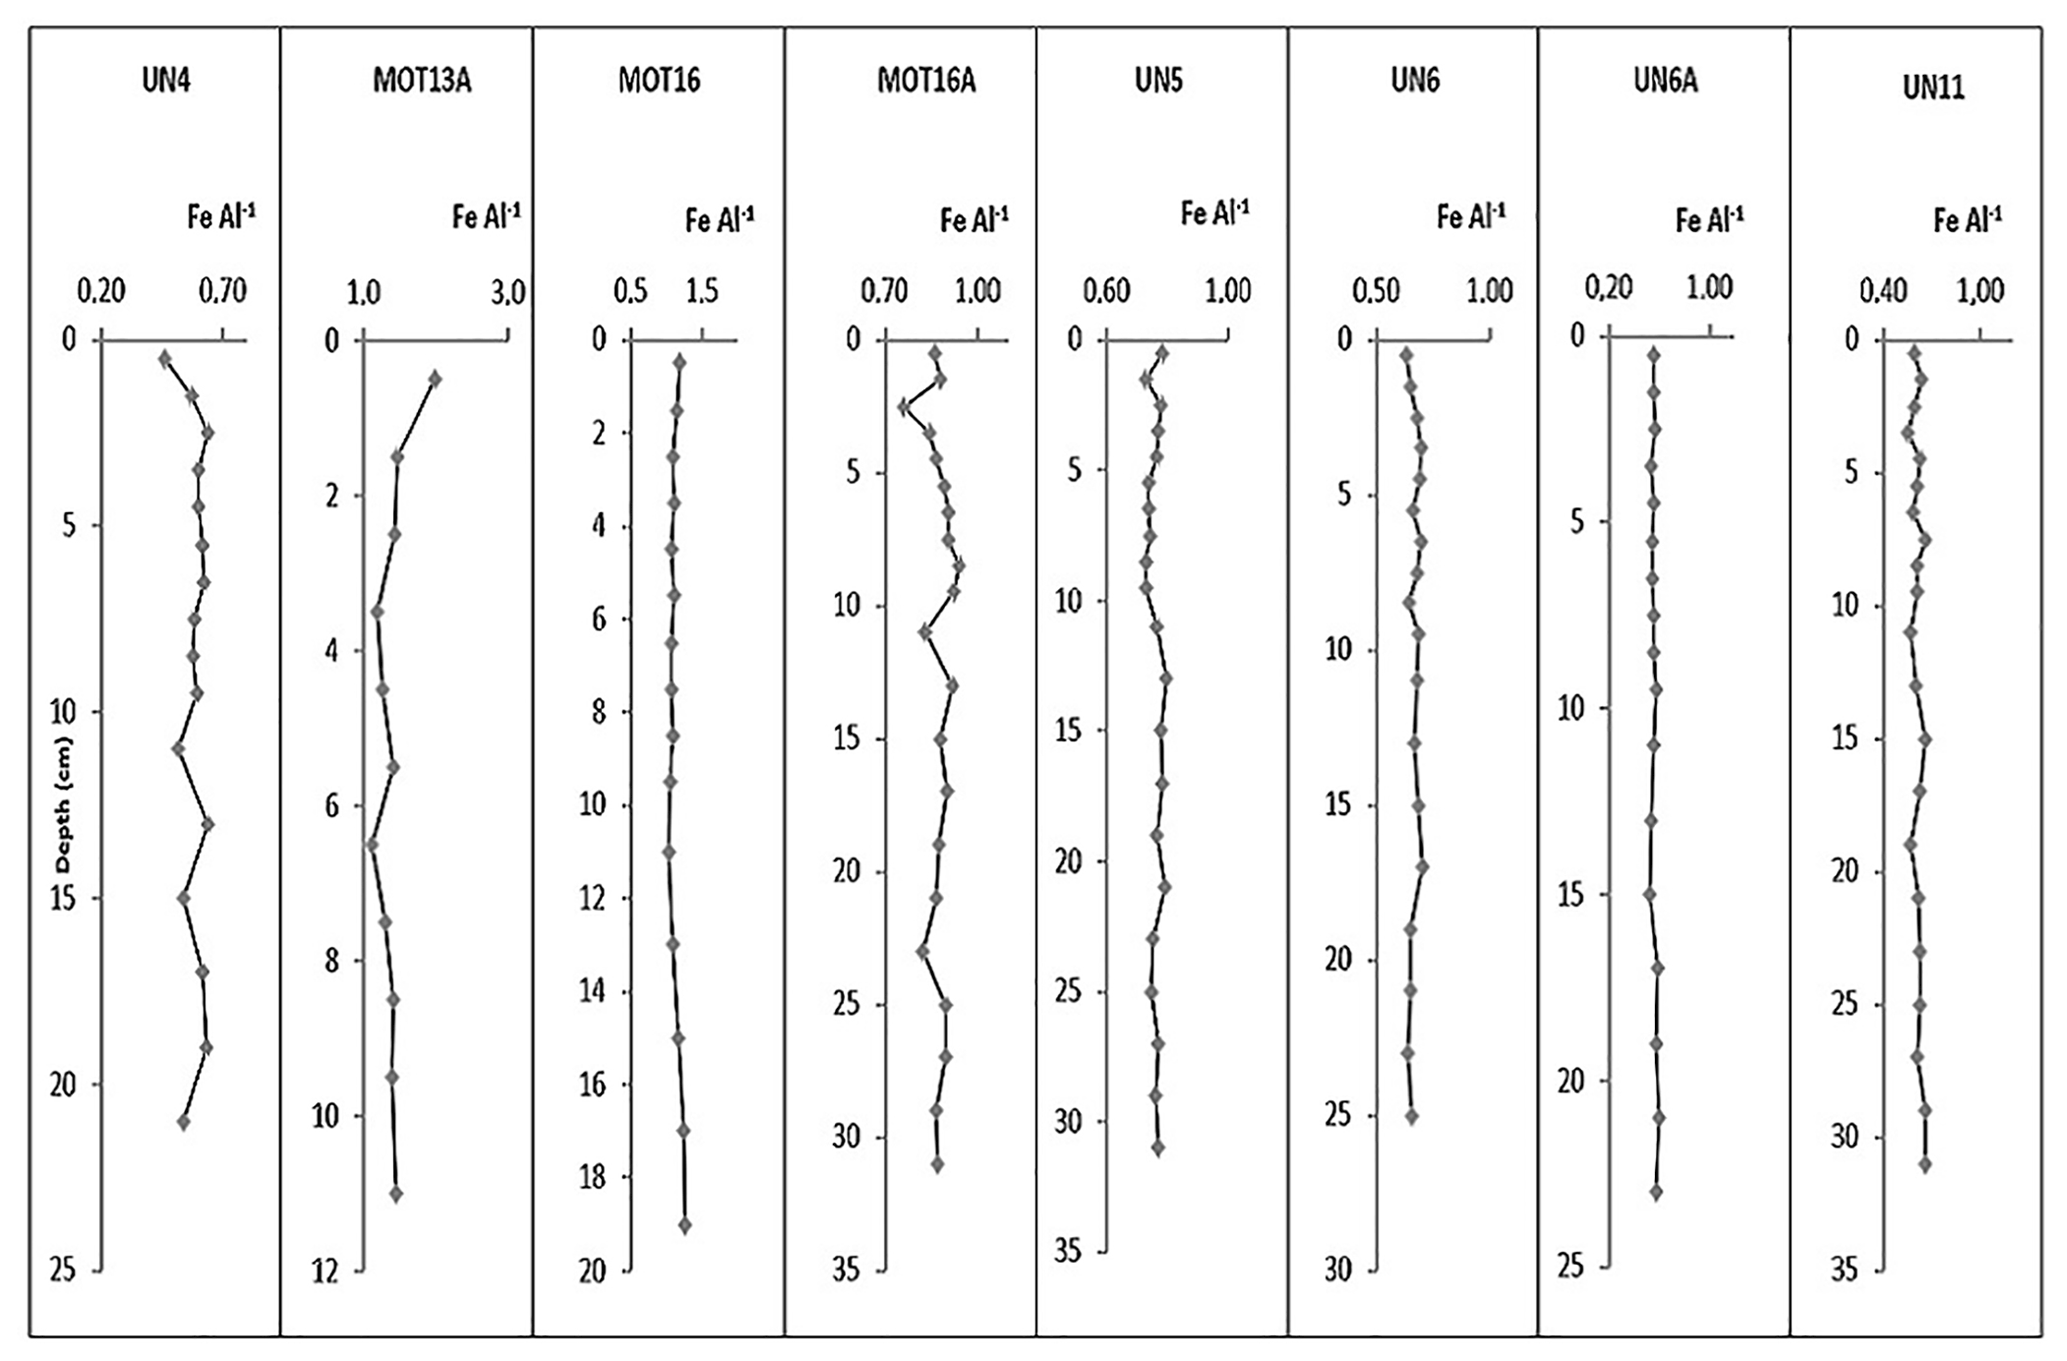
Figure A7Vertical distributions of Fe Al−1 in sediment cores. The ratios in the coarse cores MOT13A, MOT16 and UN4 are calculated at the fine-sediment fraction (<63 µm).

Figure A8Vertical distributions of Mn (in mg kg−1) in sediment cores. The concentrations in the coarse cores MOT13A, MOT16 and UN4 refer to the total sediment fraction (<1 mm).
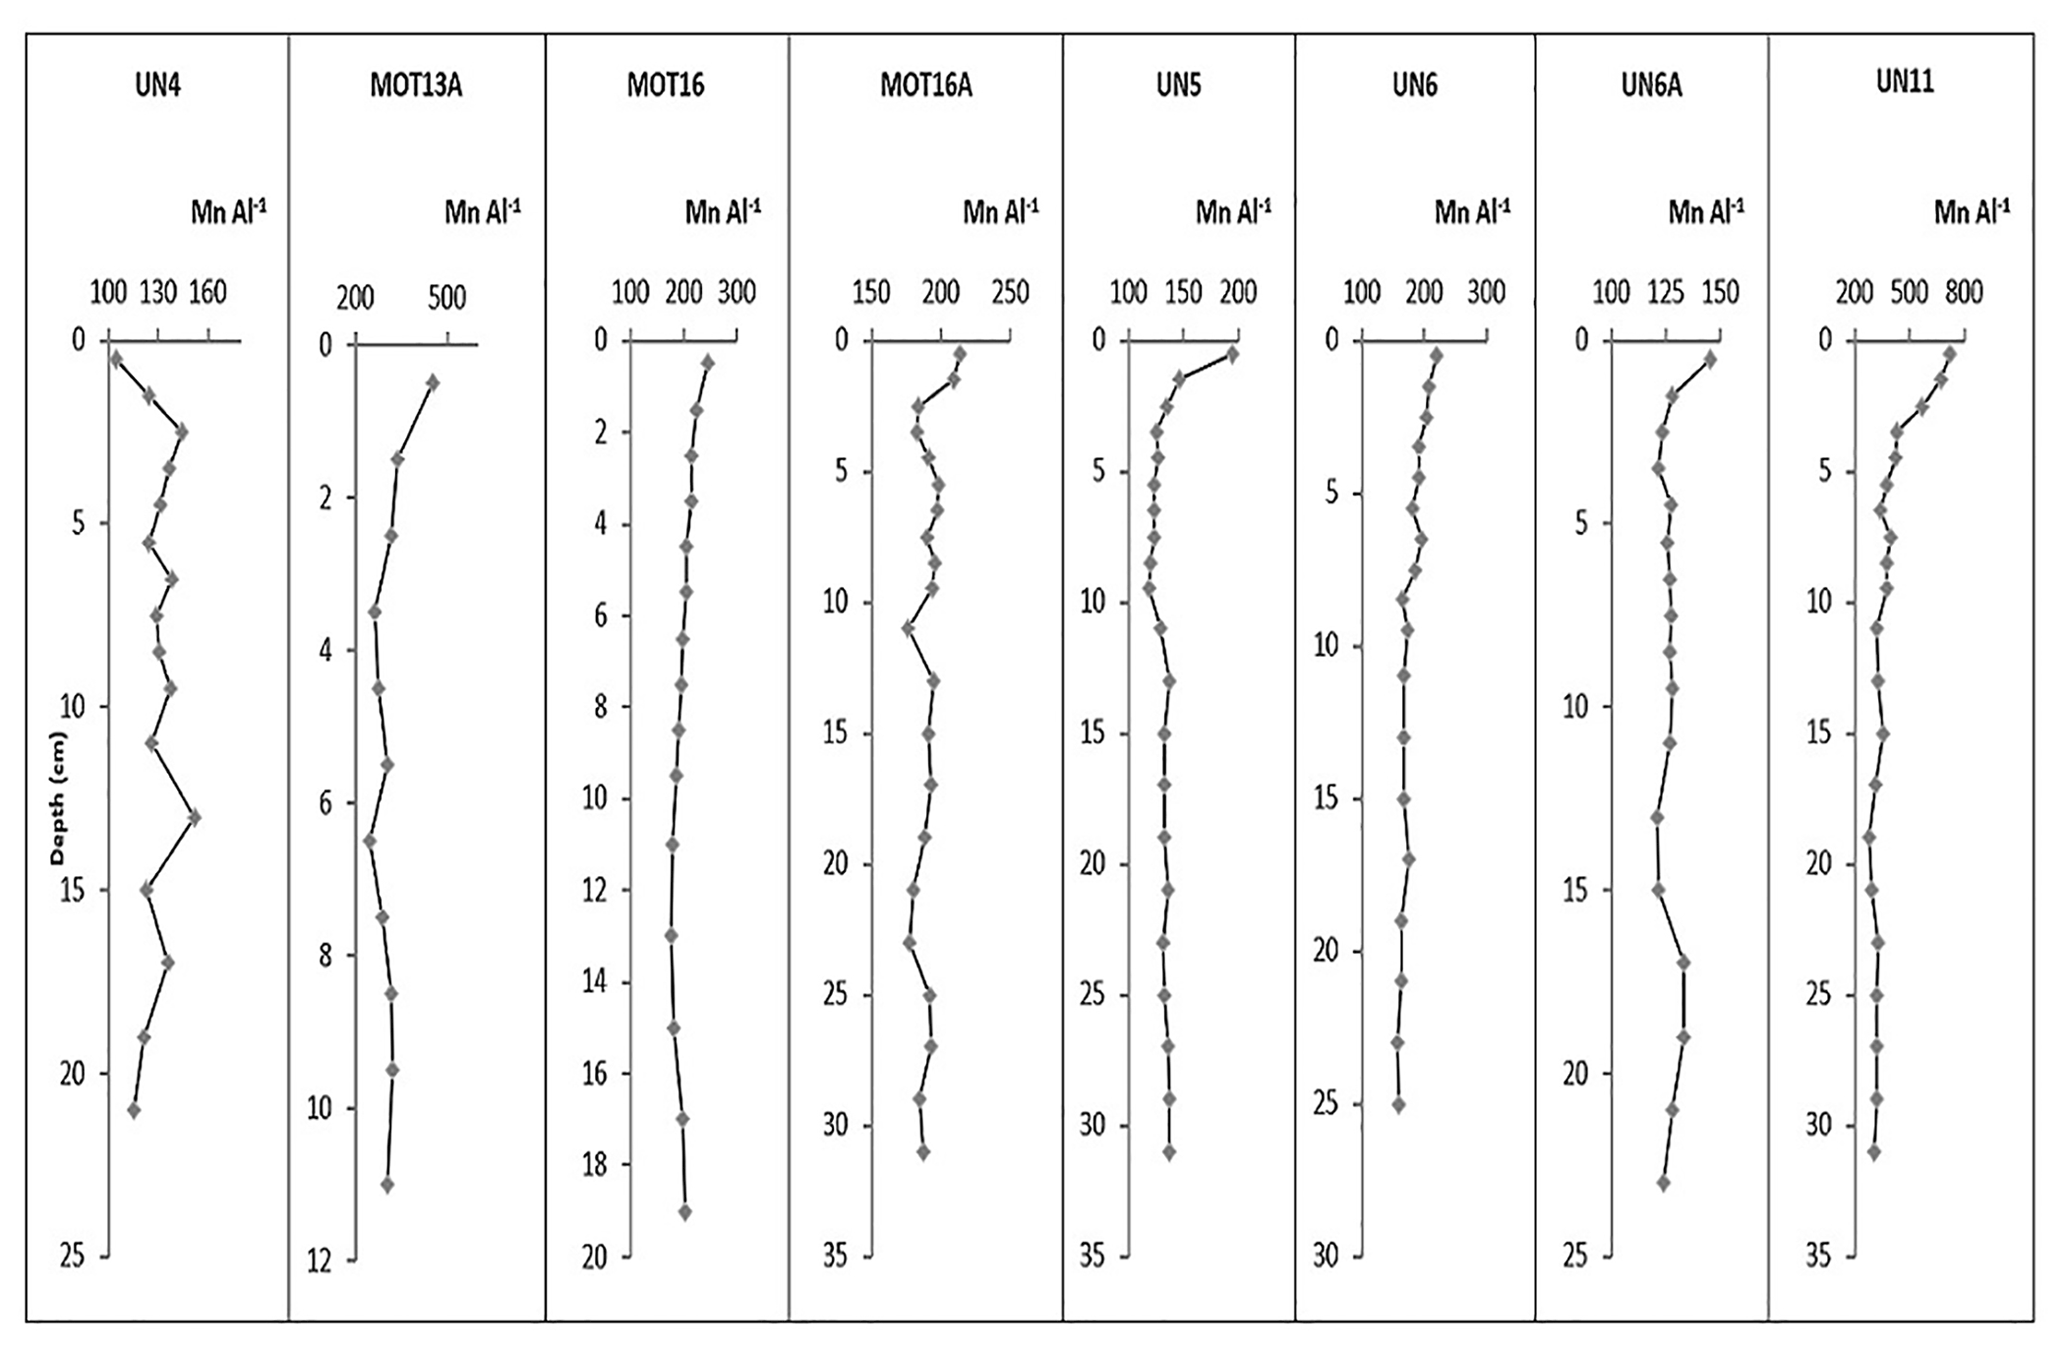
Figure A9Vertical distributions of Mn Al in sediment cores. The ratios in the coarse cores MOT13A, MOT16 and UN4 are calculated at the fine-sediment fraction (<63 µm).
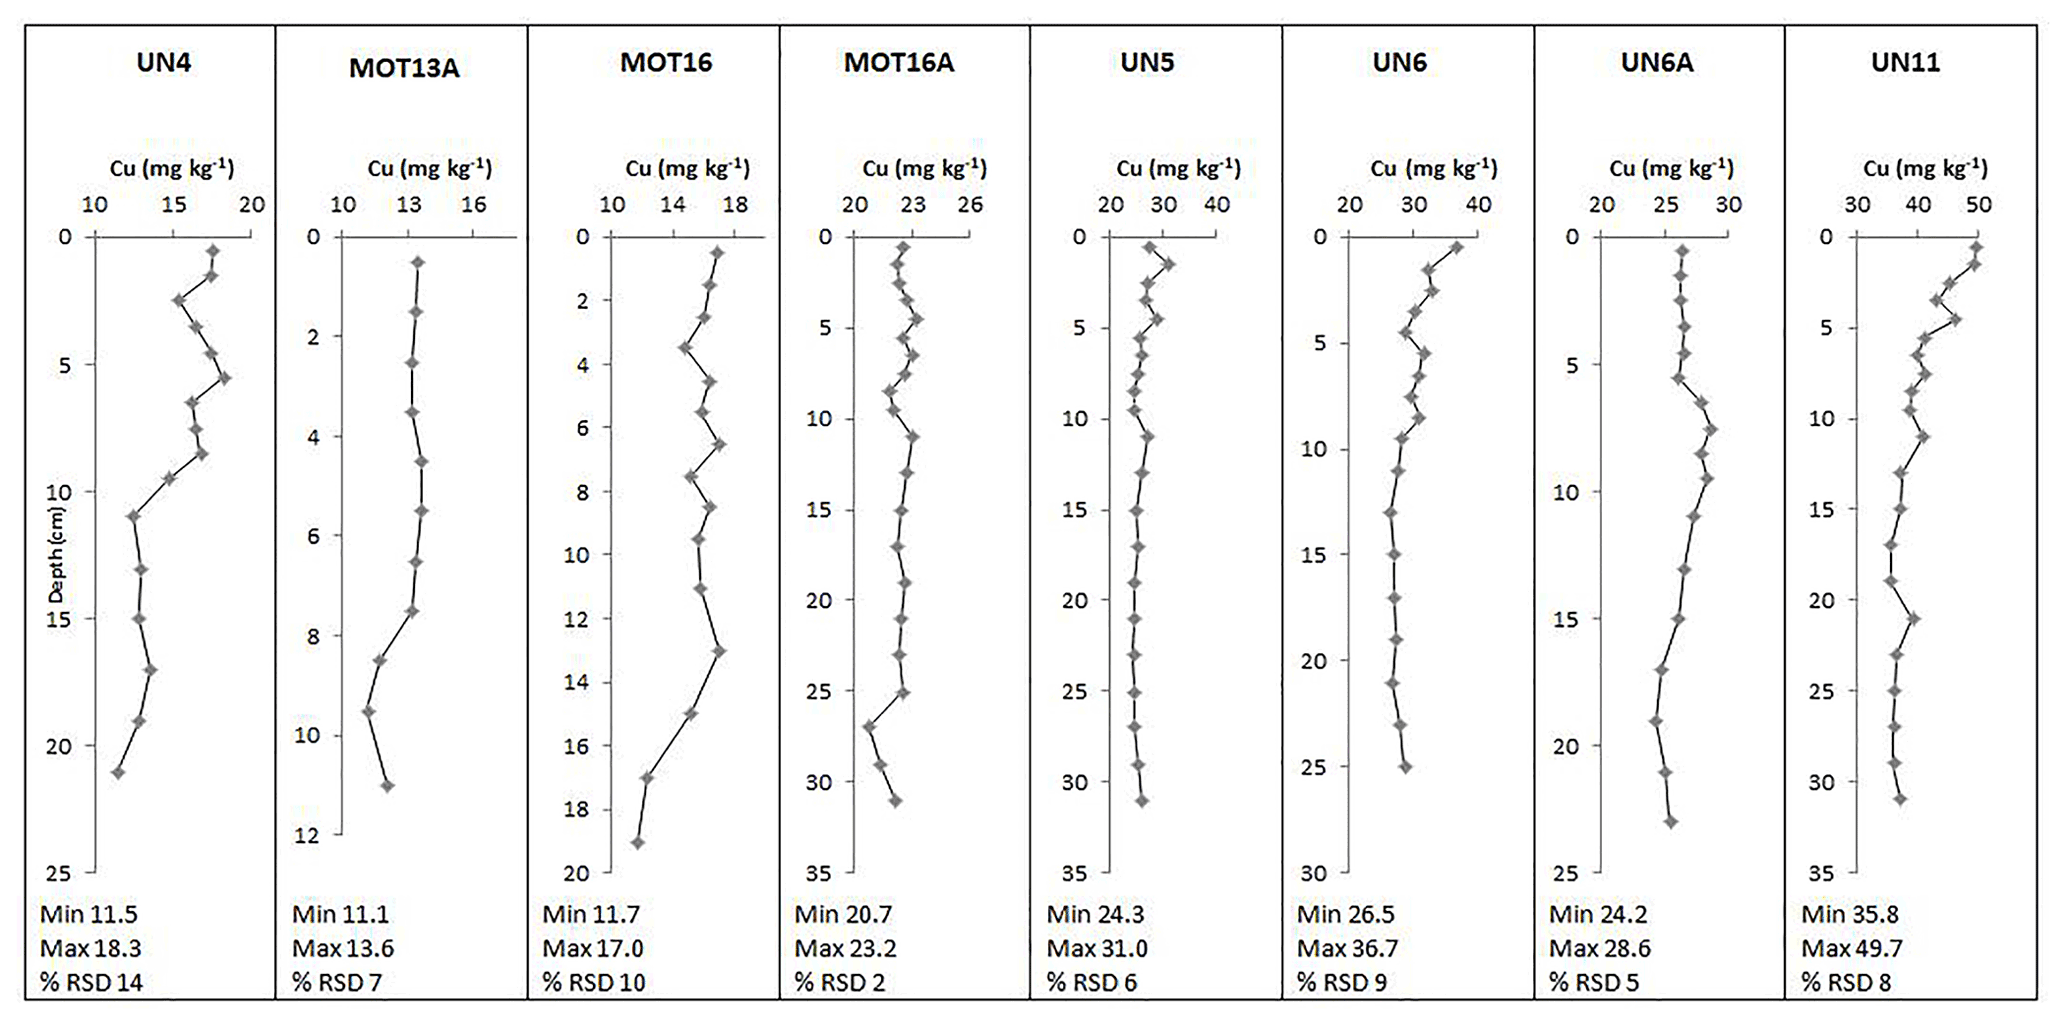
Figure A10Vertical distributions of Cu (in mg kg−1) in sediment cores. The concentrations in the coarse cores MOT13A, MOT16 and UN4 refer to the total sediment fraction (<1 mm).
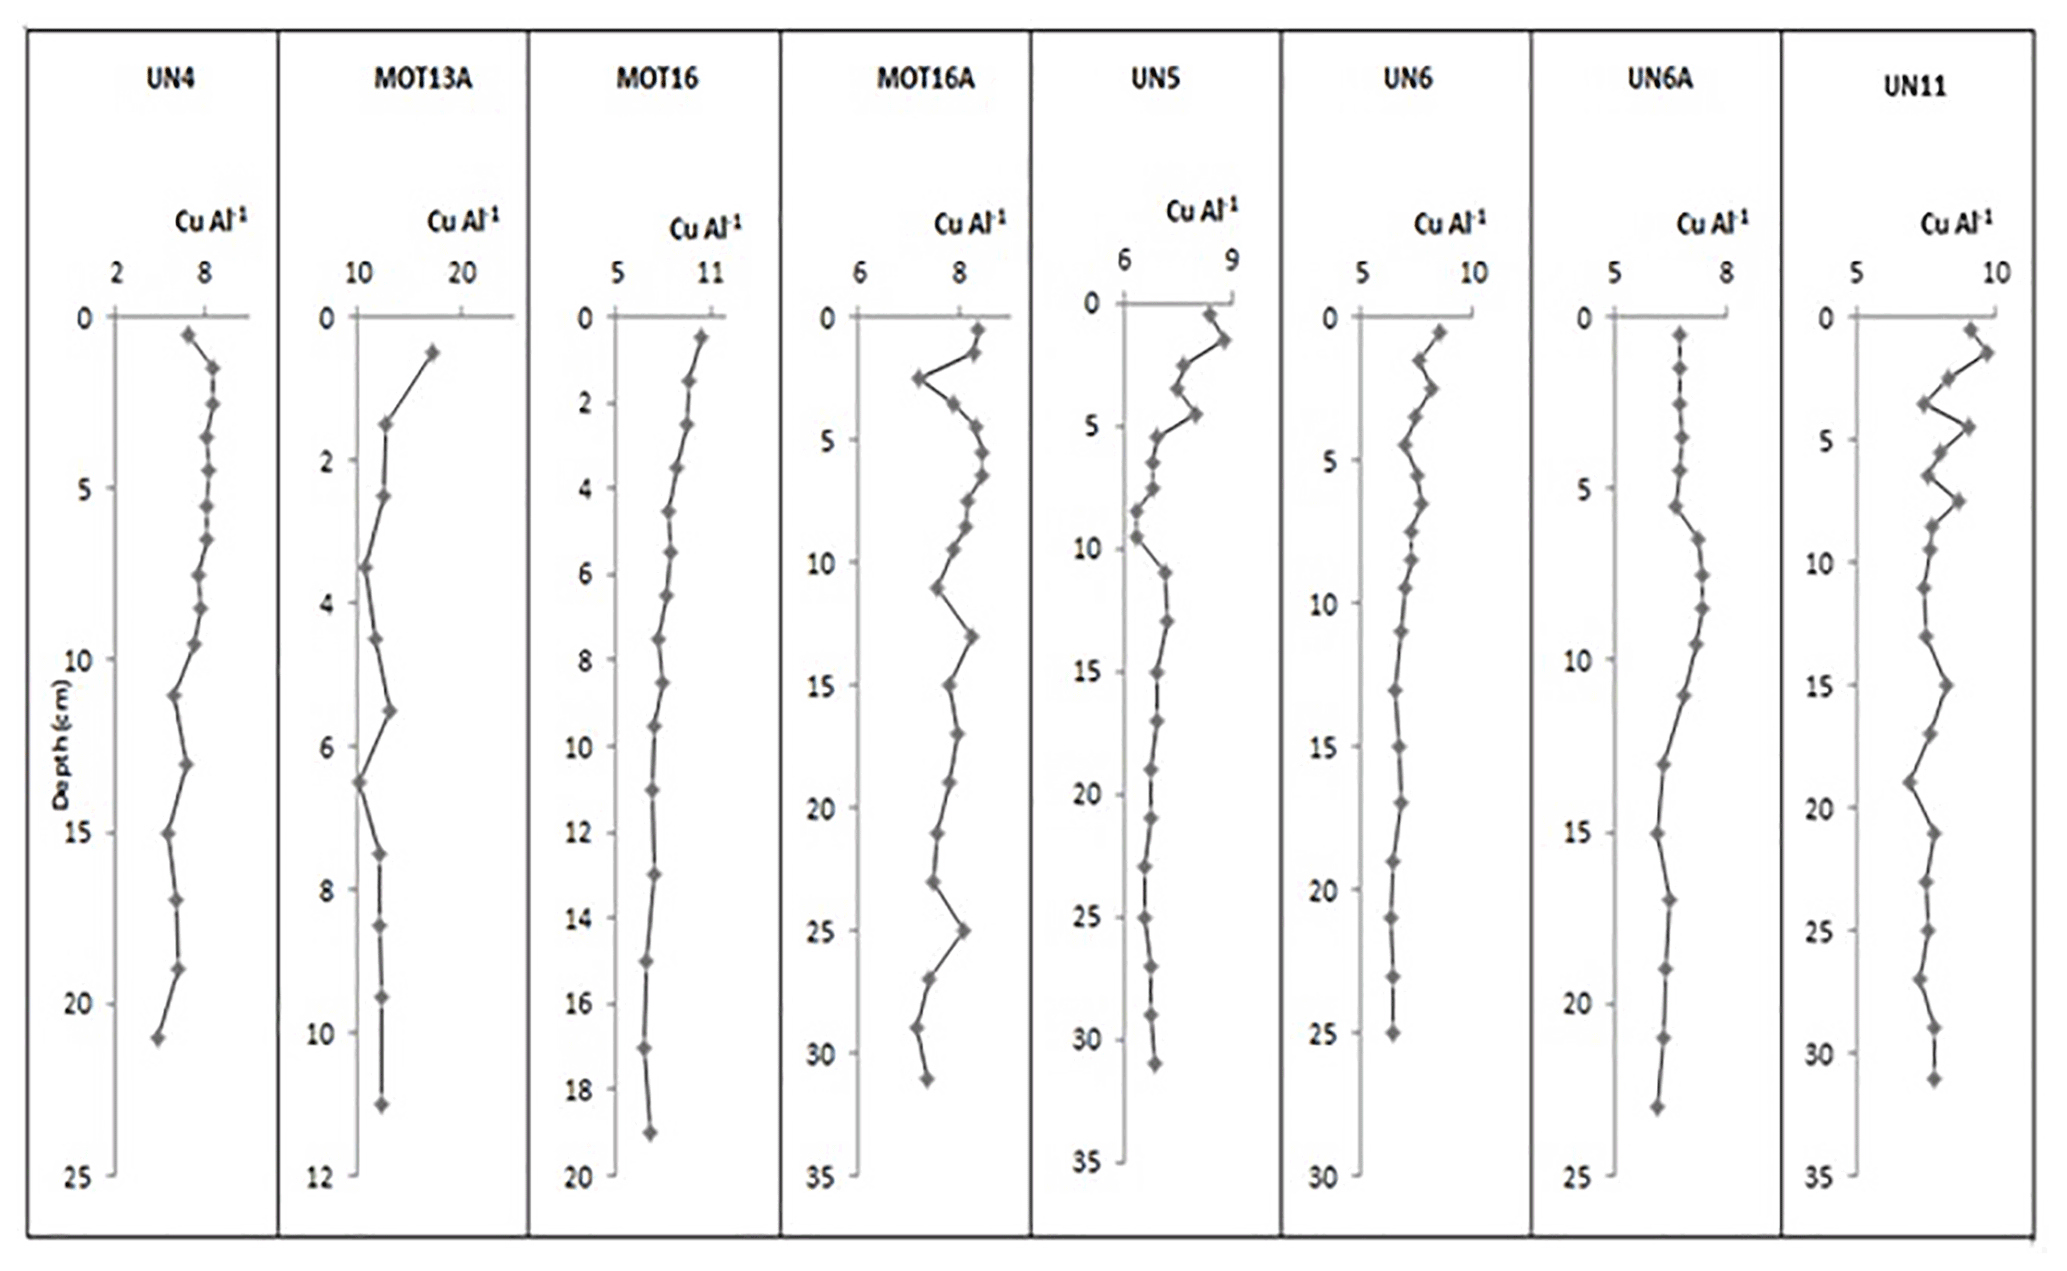
Figure A11Vertical distributions of Cu Al in sediment cores. The ratios in the coarse cores MOT13A, MOT16 and UN4 are calculated at the fine-sediment fraction (<63 µm).

Figure A12Vertical distributions of Pb (in mg kg−1) in sediment cores. The concentrations in the coarse cores MOT13A, MOT16 and UN4 refer to the total sediment fraction (<1 mm).
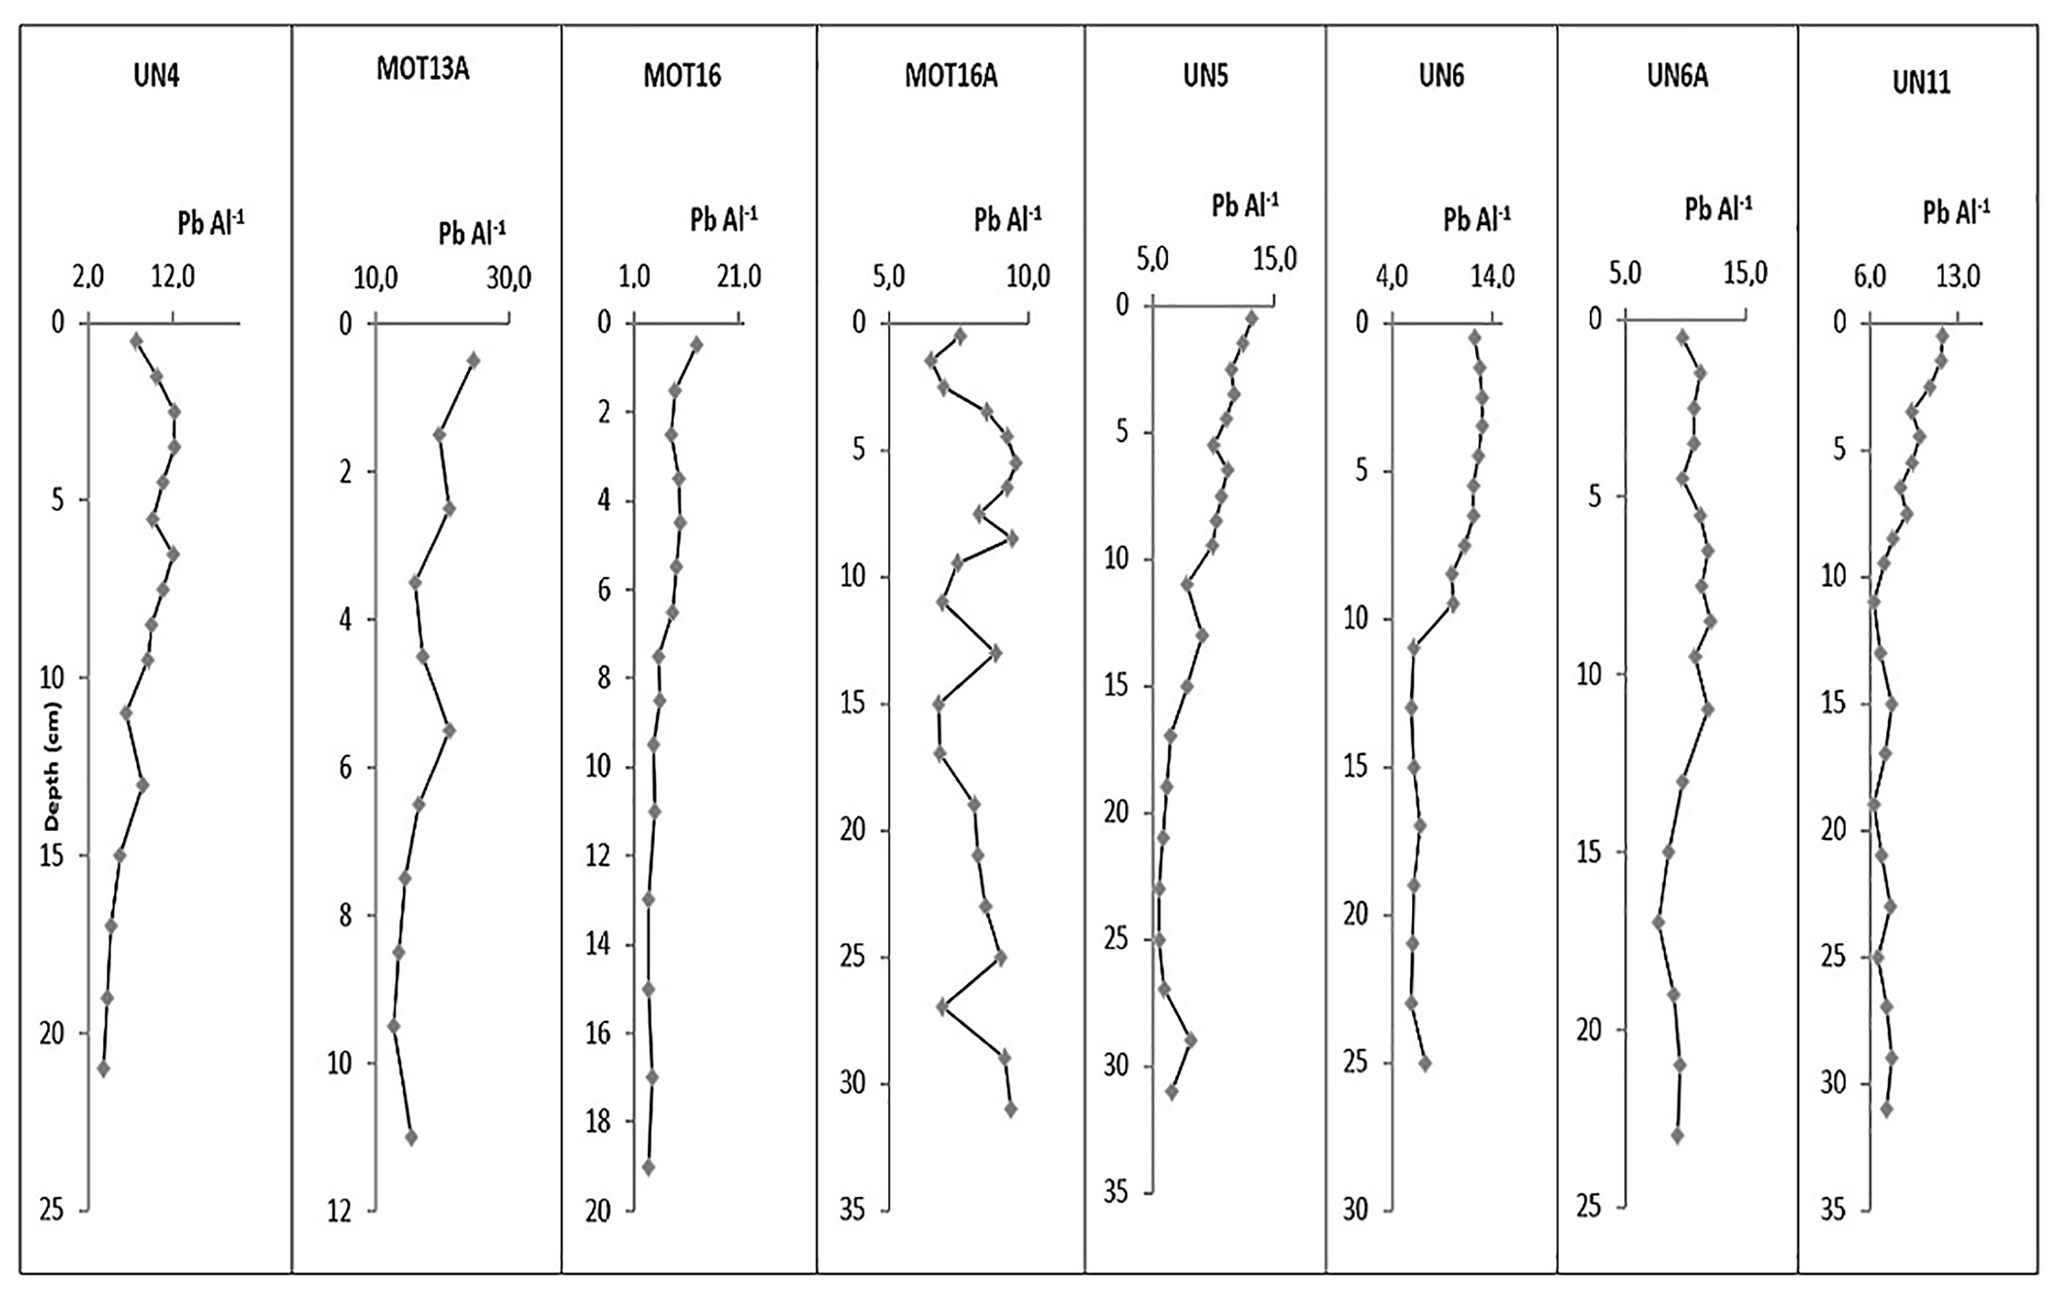
Figure A13Vertical distributions of Pb Al in sediment cores. The ratios in the coarse cores MOT13A, MOT16 and UN4 are calculated at the fine-sediment fraction (<63 µm).
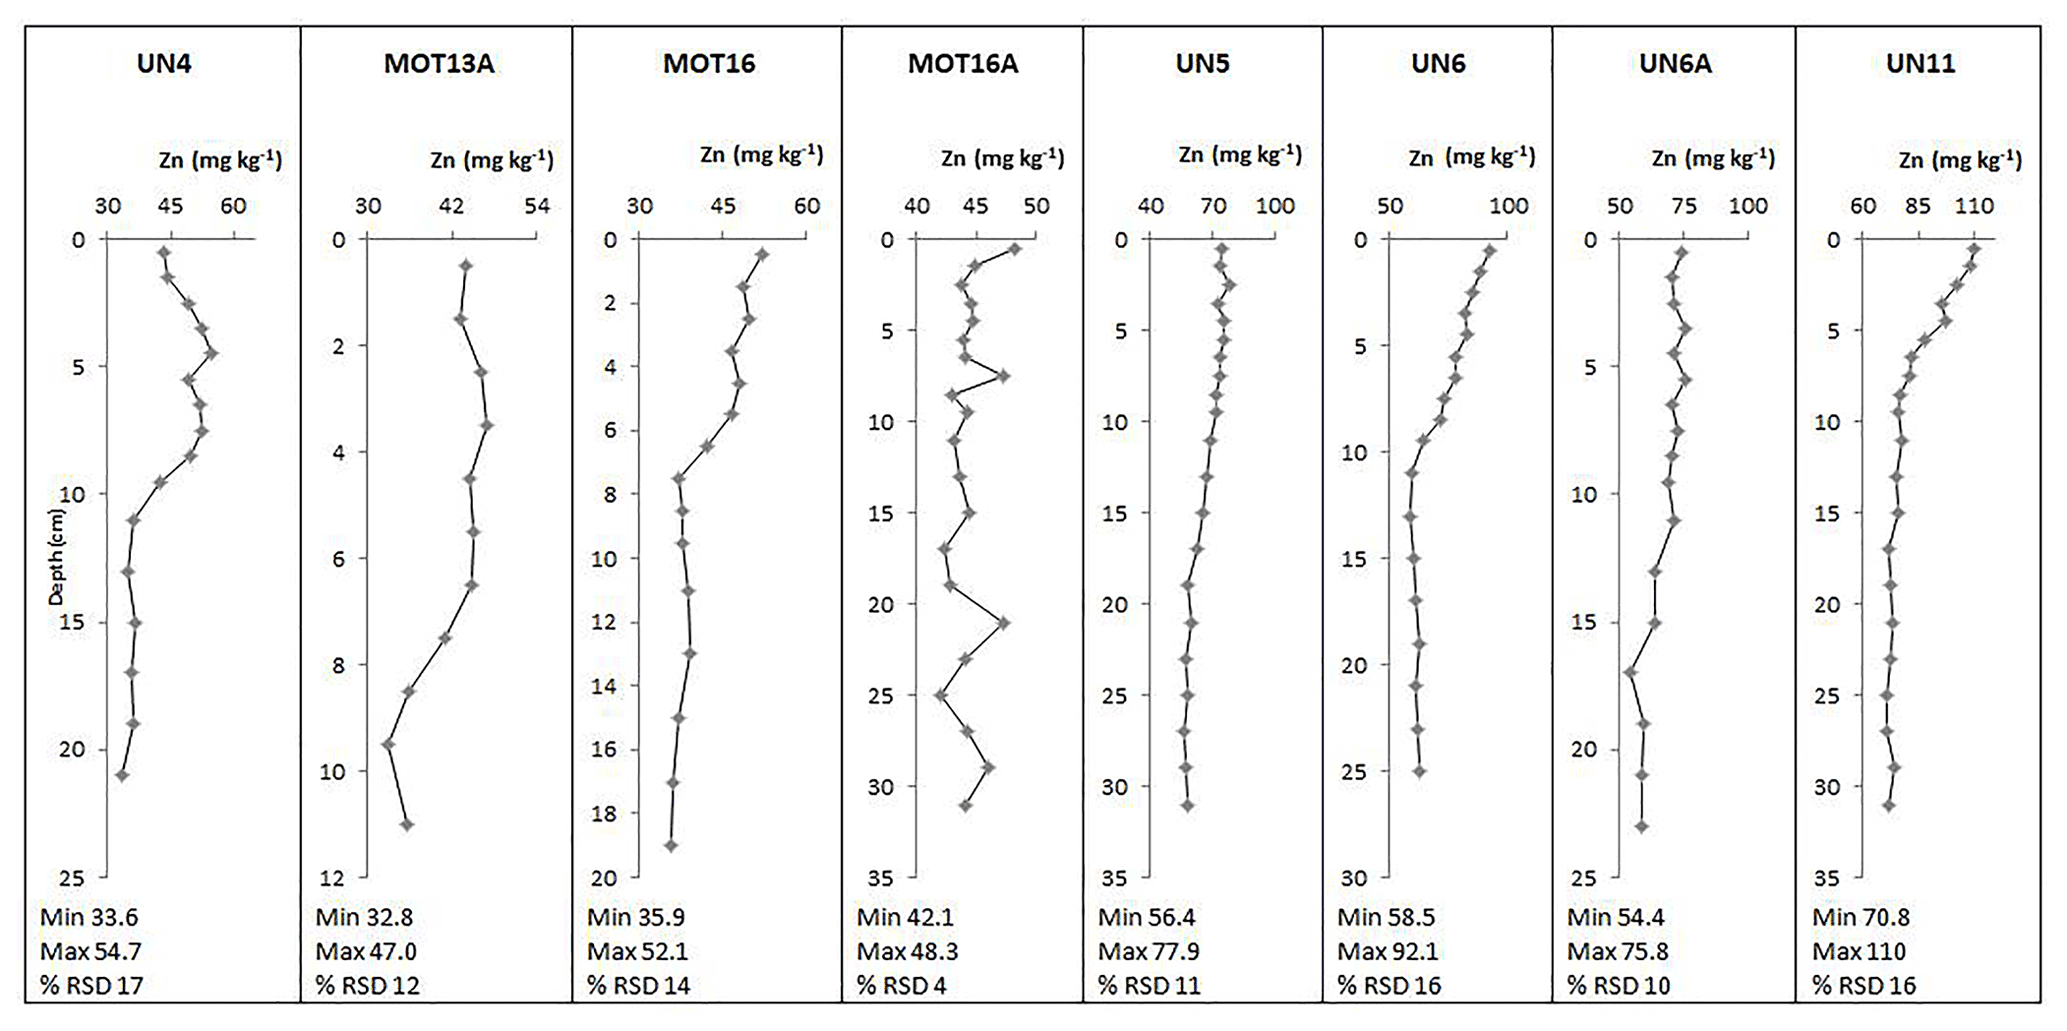
Figure A14Vertical distributions of Zn (in mg kg−1) in sediment cores. The concentrations in the coarse cores MOT13A, MOT16 and UN4 refer to the total sediment fraction (<1 mm).

Figure A15Vertical distributions of Zn Al in sediment cores. The ratios in thew coarse cores MOT13A, MOT16 and UN4 are calculated at the fine-sediment fraction (<63 µm).
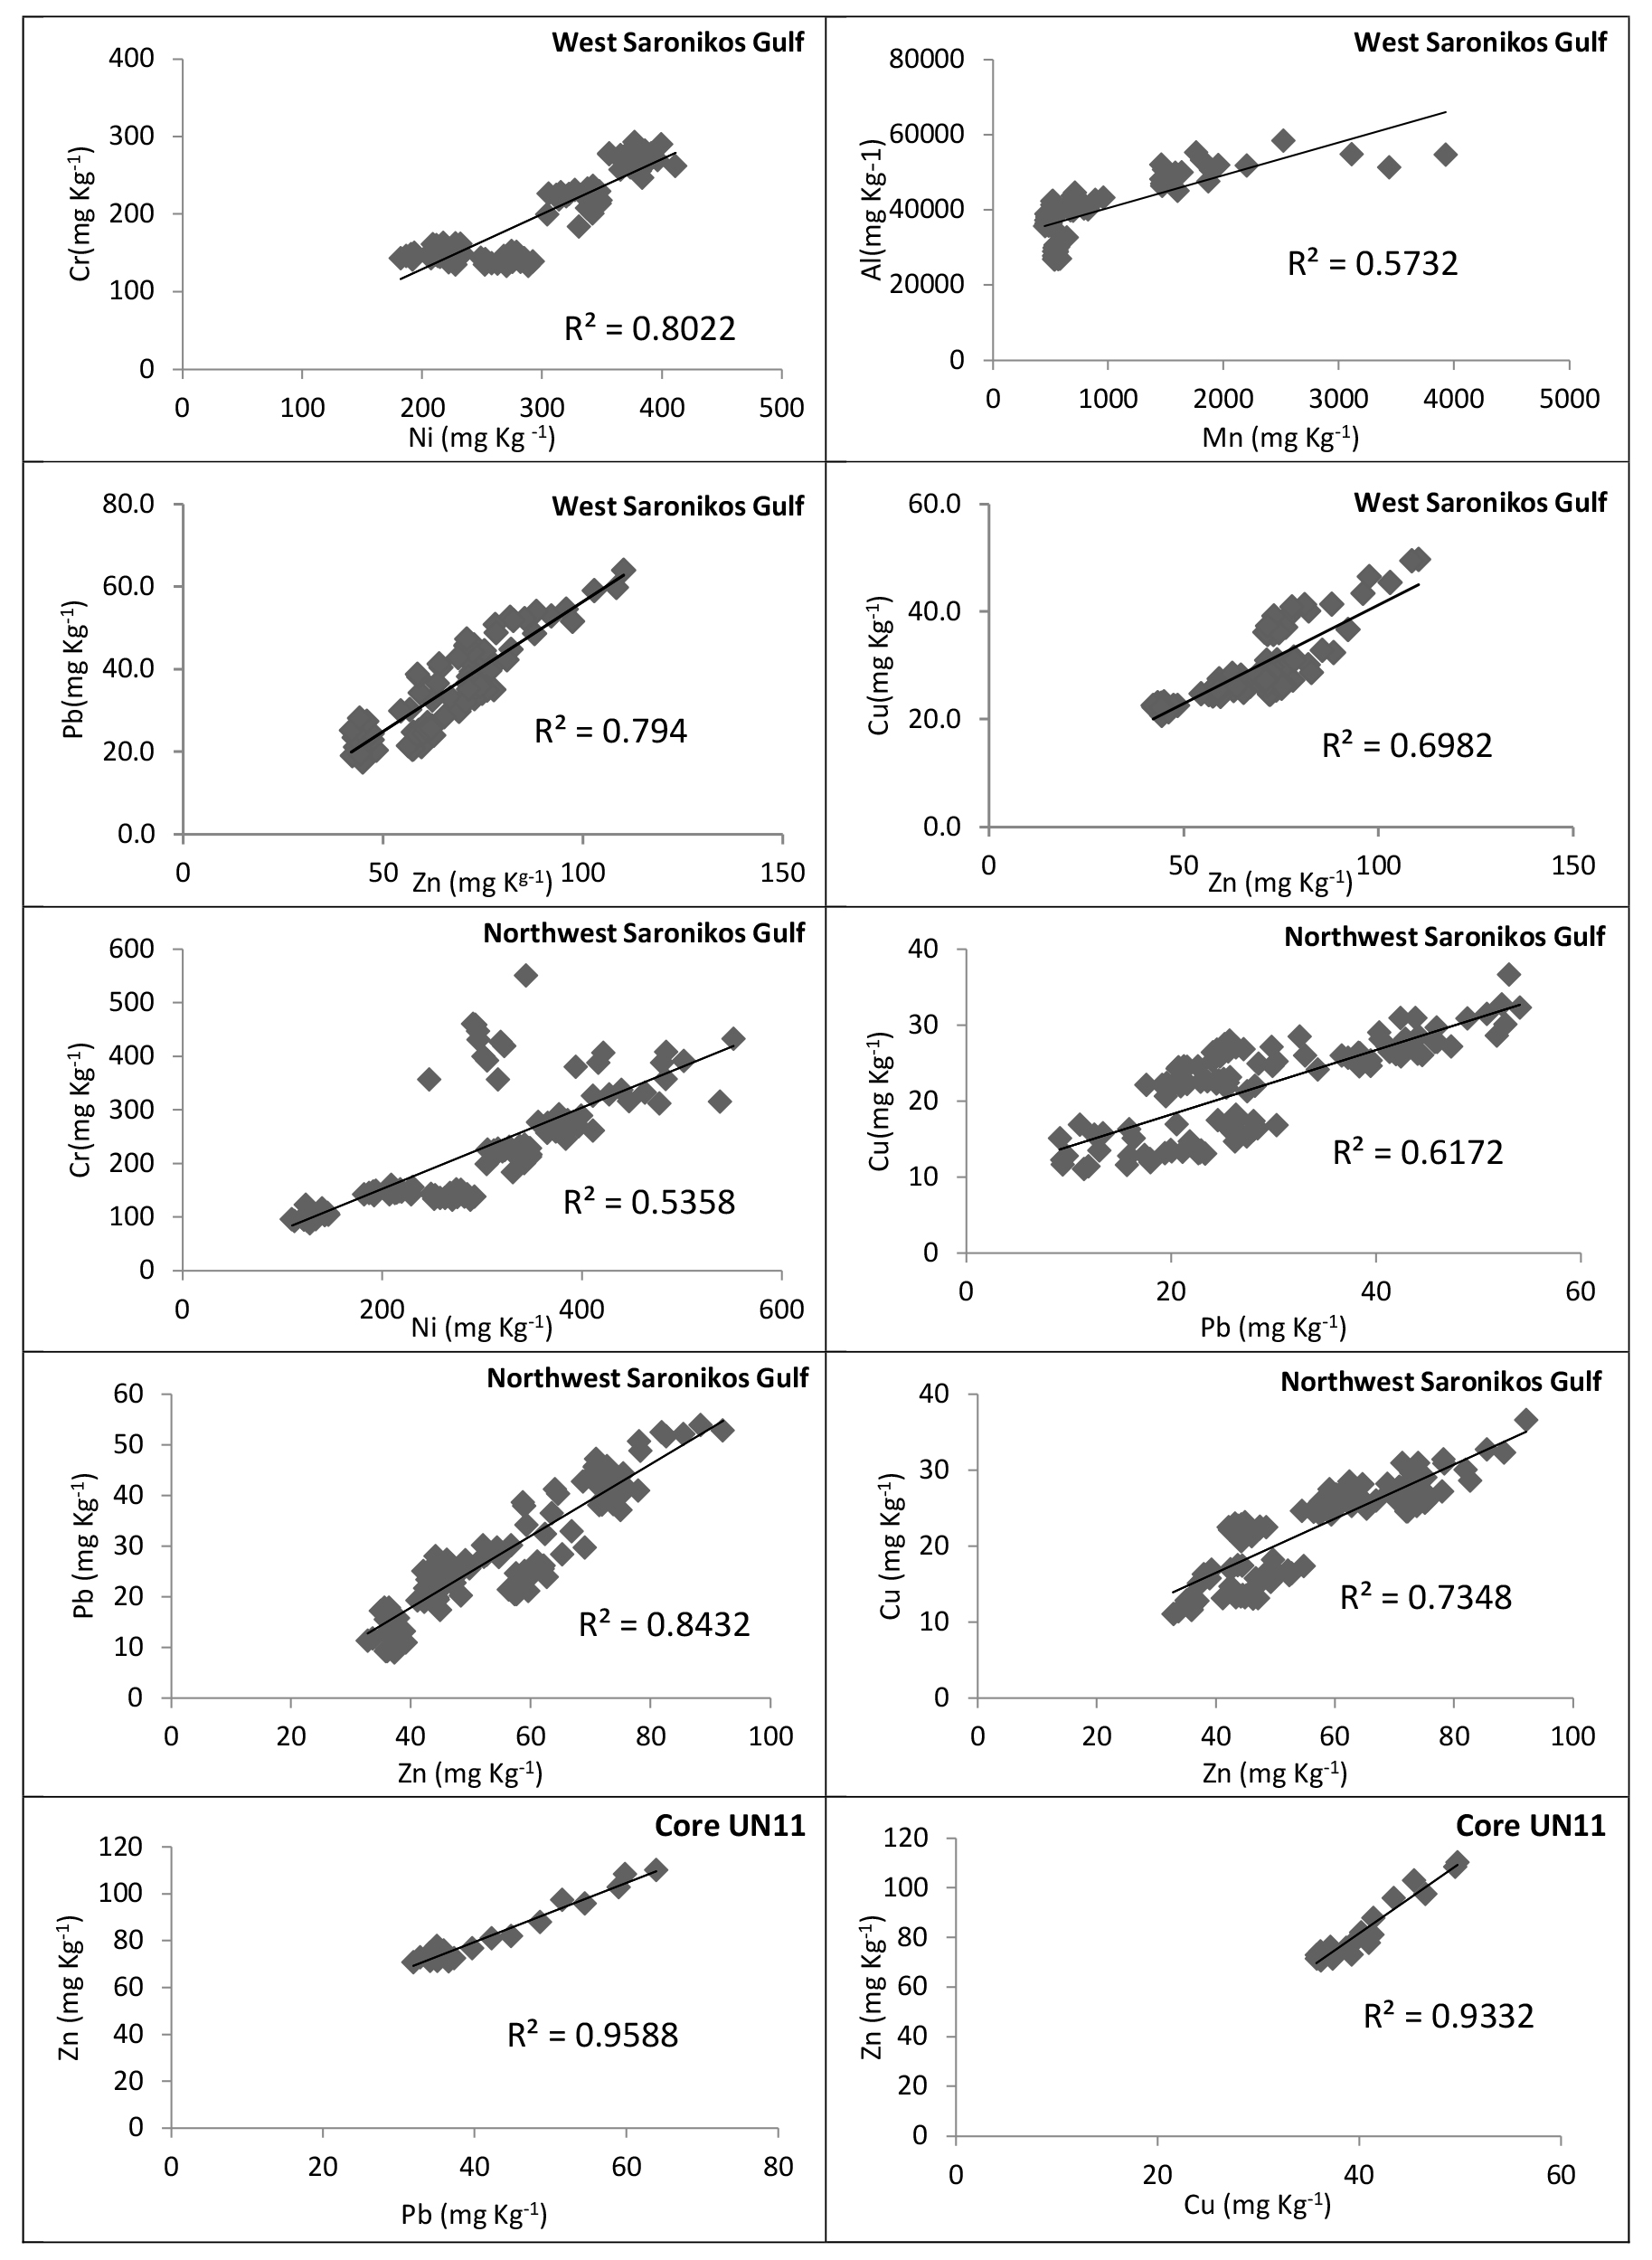

Figure A17Map of the Saronikos Gulf with the stations in Elefsis Bay (red circles), the inner Saronikos Gulf (yellow circles) and outer Saronikos Gulf (green circles) from which metal concentrations in sediments were reviewed for the comparative discussion with the present study results in the western Saronikos Gulf (black circles)=
The data in this study are available upon reasonable request from the corresponding author.
GF and VP conducted the chemical analyses in the Laboratory of Environmental Chemistry of the National and Kapodistrian University of Athens. GF wrote the paper, with contributions and reviews from all co-authors. KL constructed the map of the study area and contributed to the compilation and improvement of the figures. MD was the supervisor of the laboratory work and the creation of this article.
The contact author has declared that none of the authors has any competing interests.
Publisher's note: Copernicus Publications remains neutral with regard to jurisdictional claims in published maps and institutional affiliations.
This article is part of the special issue “Towards an understanding and assessment of human impact on coastal marine environments”. It is not associated with a conference.
We are grateful to the Hellenic Center for Marine Research (HCMR) and our colleagues Serafeim Poulos, Aikaterini Karditsa, and Fotini Botsou for their assistance during the sampling. The research was co-funded by the European Union (European Social Fund) and Greece (Hellenic General Secretariat for Research and Technology) in the framework of the project ARISTEIA I, 640 “Integrated Study of Trace Metals Biogeochemistry in the Coastal Marine Environment (Grant number 640)”, within the “Lifelong Learning Programme”. This project gave us the opportunity to research the heavy metal pollution of western Saronikos Gulf. This paper summarizes part of the results of this study.
This research has been supported by the European Union (European Social Fund) and Greece (Hellenic General Secretariat for Research and Technology, grant no. 640).
This paper was edited by Gert Van Hoey and reviewed by two anonymous referees.
AOAC International: Appendix F: Guidelines for Standard Method Performance Requirements, AOAC Official Methods of Analysis, 2016.
Barjy, M., Maanan, M., Maanan, M., Salhi, F., Tnoumi, A., and Zourarah, B.: Contamination and environmental risk assessment of heavy metals in marine sediments from Tahaddart estuary (NW of Morocco), Hum. Ecol. Risk Assess., 26, 71–86, https://doi.org/10.1080/10807039.2018.1495056, 2020.
Bigus, P., Tobiszewski, M., and Namiesnik, J.: Historical records of organic pollutants in sediment cores, Mar. Poll. Bull., 78, 26–42, https://doi.org/10.1016/j.marpolbul.2013.11.008, 2014.
Chen, X., Li, S., Newby, S. M., Lyons, T. W., Wu, F., and Owens, J. D.: Iron and manganese shuttle has no effect on sedimentary thallium and vanadium isotope signatures in Black Sea sediments, Geochim. Cosmochim. Ac., 317, 218233, https://doi.org/10.1016/j.gca.2021.11.010, 2022.
Dassenakis, M., Scoullos, M., Rapti, K., Pavlidou, A., Tsorova, D., Paraskevopoulou, V., Rozi, E., Stamateli, A., and Siganos, M.: The distribution of copper in Saronicos Gulf after the operation of the wastewater treatment plant of Psitalia, Global Nest J., 5, 135–145, https://doi.org/10.30955/gnj.000282, 2003.
Diamantopoulou, A., Kalavrouziotis, I. K., and Varnavas, S. P.: Geochemical investigations regarding the variability of metal pollution in the Amvrakikos Bay, Global Nest J., 21, 7–13, https://doi.org/10.30955/gnj.002733, 2019.
Gredilla, A., Stoichev., T., Fdez-Ortiz de Vallejuelo, S., Rodriguez-Iruretagoiena, A., Morais, P., Arana, G., and Madariaga, J. M.: Spatial distribution of some trace and major elements in sediments of the Cávado estuary (Esposende, Portugal), Mar. Poll. Bull., 99, 305–311, https://doi.org/10.1016/j.marpolbul.2015.07.040, 2015.
Hahladakis, J., Smaragnaki, E., Vasilaki, G., and Gidaragos, E.: Use of Sediment Quality Guidelines and pollution indicators for the assessment of heavy metal and PAH contamination in Greek surficial sea and lake sediments, Env. Mon. Assess., 185, 2843–2853, https://doi.org/10.1007/s10661-012-2754-2, 2012.
Jackson, M. L.: Soil Chemical Analysis, Soil Sci. Soc. Am. J., 22, 272–272, https://doi.org/10.2136/sssaj1958.03615995002200030025x, 1958.
Kanellopoulos, T., Kapetanaki, N., Karaouzas, I., Botsou, F., Mentzafou, A., Kaberi, H., Kapsimalis, V., and Karageorgis, A.: Trace element contamination status of surface marine sediments of Greece: an assessment based on two decades (2001–2021) of data, [data set], Environ. Sci. Pollut. R., 29, 45171–45189, https://doi.org/10.1007/s11356-022-20224-y, 2022.
Karageorgis, A. P., Kaberi, H., Price, N. B., Muir, G. K. P., Pates, J. M., and Lykousis, V.: Chemical composition of short sediment cores from Thermaikos Gulf (Eastern Mediterranean): Sediment accumulation rates, trawling and winnowing effects, Cont. Shelf Res., 25, 2456–2475, https://doi.org/10.1016/j.csr.2005.08.006, 2005.
Karageorgis, A. P., Botsou, F., Kaberi, H., and Iliakis, H.: Geochemistry of major and trace elements in surface sediments of the Saronikos Gulf (Greece): Assessment of contamination between 1999 and 2018, [data set], Sci. Total Environ., 717, 137046, https://doi.org/10.1016/j.scitotenv.2020.137046, 2020a.
Karageorgis, A. P., Botsou, F., Kaberi, H., and Iliakis, H.: Dataset on the major and trace elements contents and contamination in the sediments of Saronikos Gulf and Elefsis Bay, Greece, Data in brief, Sci. Total Environ., 29, 2352–3409, https://doi.org/10.1016/j.dib.2020.105330, 2020b.
Kelepertsis, A., Alexakis, D., and Kita, I.: Environmental Geochemistry of soils and waters of Susaki Area, Korinthos, Greece, Environ. Geochem. Hlth, 23, 117–135, https://doi.org/10.1023/A:1010904508981, 2001.
Kiratli, N. and Ergin, M.: Partitioning of heavy metals in surface Black Sea sediments, Appl. Geochem., 11, 775–788, https://doi.org/10.1016/S0883-2927(96)00037-6, 1996.
Kontoyiannis, H.: Observations on the circulation of the Saronikos Gulf: A Mediterranean embayment sea border of Athens, J. Geophys. Res., 115, 1–23, https://doi.org/10.1029/2008JC005026, 2010.
Long, E. R., MacDonald, D. D., Smith, S. L., and Calder, F. D.: Incidence of Adverse Biological Effects Within Ranges of Chemical Concentrations in Marine and Estuarine Sediments, Environ. Manage., 19, 81–97, https://doi.org/10.1007/BF02472006, 1995.
Loring, H. D. and Rantala, R.: Manual for the Geochemical Analyses of Marine Sediments and Suspended Particulate Matter, Earth-Sci. Rev., 32, 235–283, https://doi.org/10.1016/0012-8252(92)90001-A, 1992.
Manahan, E.: Water Chemistry, Green Science and Technology of Nature's Most Renewable Resource, 1st edition, CRC Press, Taylor & Francis Group, U.S., 416 pp., 2011.
Nolting, R. F., Ramkema, A., and Everaarts, J. M.: The geochemistry of Cu, Cd, Zn, Ni and Pb in sediment cores from the continental slope of the Banc d'Arguin (Mauritania), Cont. Shelf Res., 19, 665–691, https://doi.org/10.1016/S0278-4343(98)00109-5, 1999.
Ozturk, M.: Trends of trace metal (Mn, Fe, Co, Ni, Cu, Zn, Cd and Pb) distributions at the oxic-anoxic interface and in sulfidic water of the Drammensfjord, Mar. Chem., 48, 329–342, https://doi.org/10.1016/0304-4203(95)92785-Q, 1995.
Panagiotoulias, I., Botsou, F., Kaberi, H., Karageorgis, A. P., and Scoullos, M.: Can we document if regulation and Best Available Techniques (BAT) have any positive impact on the marine environment? A case based on a steel mill in Greece, Environ. Monit. Assess., 189, 598, https://doi.org/10.1007/s10661-017-6324-5, 2017.
Panagopoulou, G.: Heavy metals (Hg, Pb, Cd) at water samples and sediments of Saronikos Gulf, MSc thesis (in Greek), University of Athens in Greece, Greece, [data set], https://pergamos.lib.uoa.gr/uoa/dl/object/2814414 (last access: 15 December 2022), 2018.
Paraskevopoulou, V.: Distribution and chemical behaviour of heavy metals in sea area affected by industrial pollution (NW Saronikos), PhD Thesis in Chemical Oceanography (in Greek), University of Athens in Greece, Greece, [data set], https://doi.org/10.12681/eadd/24012, 2009.
Paraskevopoulou, V., Zeri, C., Kaberi, H., Chalkiadaki, O., Krasakopoulou, E., Dassenakis, M., and Scoullos, M.: Trace metal variability, background levels and pollution status assessment in line with the water framework and Marine Strategy Framework EU Directives in the waters of a heavily impacted Mediterranean Gulf, Mar. Poll. Bull., 87, 323–337, https://doi.org/10.1016/j.marpolbul.2014.07.054, 2014.
Pavlidou, A., Kontoyiannis, H., and Psyllidou-Giouranovits, R.: Trophic conditions and stoichiometric nutrient balance in the Inner Saronicos Gulf (Central Aegean Sea) affected by the Psitalia seawage outfall, Fresenius Environ. Bull., 13, 1509–1514, 2004.
Peña-Icart, M., Villanueva, M., Alonso Hernández, C., Rodríguez Hernández, J., Behar, M., and Pomares Alfonso, M.: Accepted Manuscript, Comparative Study of Digestion Methods EPA 3050B (HNO3-H2O2-HCl) and ISO 11466.3 (aqua regia) for Cu, Ni and Pb Contamination Assessment in Marine Sediments, Mar. Environ. Res., 72, 60–66, 2011.
Pohl, C. and Hennings, U.: The effect of redox processes on the partitioning of Cd, Pb, Cu, and Mn between dissolved and particulate phases in the Baltic Sea, Mar. Chem., 65, 41–53, https://doi.org/10.1016/S0304-4203(99)00009-2, 1999.
Prifti, E., Kaberi, H., Paraskevopoulou, V., Michalopoulos, P., Zeri, C., Iliakis, S., Dassenakis, M., and Scoullos, M.: Vertical distribution and chemical fractionation of heavy metals in dated sediment cores from the Saronikos Gulf, Greece, J. Mar. Sci. Eng., 10, 376, https://doi.org/10.3390/jmse10030376, 2022.
Psyllidou-Giouranovits, R. and Pavlidou, A.: Chemical characteristics, edited by: Catsiki, V. A., Pollution research and Monitoring program in Saronikos gulf, Technical Report, https://atlantis-dspace.hcmr.gr/handle/123456789/2802?show=full (last access: 23 November 2022), 1998 (in Greek).
Salomons, W. and Förstner, U.: Metals in the Hydrocycle, 1, Springer Berlin, Heidelberg, Berlin, 352 pp., https://doi.org/10.1007/978-3-642-69325-0, 1984.
Scoullos, M.: Lead in coastal sediments: The case of Elefsis gulf, Sci. Total Environ., 49, 199–219, https://doi.org/10.1016/0048-9697(86)90240-8, 1986.
Scoullos, M., Sakellari, A., Giannopoulou, K., Paraskevopoulou, V., and Dassenakis, M.: Dissolved and particulate trace metal levels in the Saronikos Gulf, Greece, in 2004. The impact of the primary Wastewater Treatment Plant of Psittalia, Desalination, 210, 98–109, https://doi.org/10.1016/j.desal.2006.05.036, 2007.
Skoog, D., Holler, F. J., and Nieman, T. A.: Principles of Instrumental Analysis, Fifth Edition, Saunders golden sunburst series, Saunders College Pub., Philadelphia , Orlando, Fla., Harcourt Brace College Publishers, ISBN 978-1-305-57721-3, 1998.
SoHelME, Papathanassiou, E., and Zenetos, A. (Eds.): State of the Hellenic Marine Environment, HCMR Publ., 360 pp, https://epublishing.ekt.gr/sites/ektpublishing/files/ebooks/Sohelme.pdf (last access: 2 September 2022), 2005.
Sundby, B.: Transient state diagenesis in continental margin muds, Mar. Chem., 102, 2–12, https://doi.org/10.1016/j.marchem.2005.09.016, 2006.
Sutherland, R. A.: Bed sediment-associated trace metals in an urban stream, Oahu, Hawaii, Env. Geol., 39, 611–627, https://doi.org/10.1007/s002540050473, 2000.
US EPA: Method 3050B Acid Digestion of sediments, sludges and soils, Revision 2, https://www.epa.gov/sites/default/files/2015-06/documents/epa-3050b.pdf (last access: 15 February 2022), 1996.
Vrettou, E.: Heavy metals in sediment cores of Saronikos Gulf, MSc thesis (in Greek), University of Athens in Greece, Greece, [data set], https://pergamos.lib.uoa.gr/uoa/dl/object/2865272 (last access: 17 December 2022), 2019.
Walkley, A.: A Critical Examination of a Rapid Method for Determining Organic Carbon in Soils: Effect of Variations in Digestion Conditions and of Inorganic Soil Constituents, Soil Sci., 63, 251–264, https://doi.org/10.1097/00010694-194704000-00001, 1947.
Xarlis, P.: Heavy metals (Cu, Ni, Zn) at water samples and sediments of Saronikos Gulf, MSc thesis (in Greek), University of Athens in Greece, Greece, [data set], https://pergamos.lib.uoa.gr/uoa/dl/object/2814423 (last access: 15 December 2022), 2018.