the Creative Commons Attribution 4.0 License.
the Creative Commons Attribution 4.0 License.
 | 04 May 2023
High metabolism and periodic hypoxia associated with drifting macrophyte detritus in the shallow subtidal Baltic Sea
Karl M. Attard
Anna Lyssenko
Iván F. Rodil
Macrophytes form highly productive habitats that export a substantial proportion of their primary production as particulate organic matter. As the detritus drifts with currents and accumulates in seafloor depressions, it constitutes organic enrichment and can deteriorate O2 conditions on the seafloor. In this study, we investigate the O2 dynamics and macrobenthic biodiversity associated with a shallow ∼ 2300 m2 macrophyte detritus field in the northern Baltic Sea. The detritus, primarily Fucus vesiculosus fragments, had a biomass of ∼ 1700 g dry weight m−2, approximately 1.5 times larger than nearby intact F. vesiculosus canopies. A vertical array of O2 sensors placed within the detritus documented that hypoxia ([O2] < 63 µmol L−1) occurred for 23 % of the time and terminated at the onset of wave-driven hydrodynamic mixing. Measurements in five other habitats nearby, spanning bare sediments, seagrass, and macroalgae, indicate that hypoxic conditions were unique to detritus canopies. Fast-response O2 sensors placed above the detritus documented pulses of hypoxic waters originating from within the canopy. These pulses triggered a rapid short-term (∼ 5 min) deterioration of O2 conditions within the water column. Eddy covariance measurements of O2 fluxes indicated high metabolic rates, with daily photosynthetic production offsetting up to 81 % of the respiratory demands of the detritus canopy, prolonging its persistence within the coastal zone. The detritus site had a low abundance of crustaceans, bivalves, and polychaetes when compared to other habitats nearby, likely because their low O2 tolerance thresholds were often exceeded.
- Article
(5499 KB) - Full-text XML
-
Supplement
(408 KB) - BibTeX
- EndNote


Oxygen availability determines ecosystem health and the biogeochemical function of coastal waters (Diaz and Rosenberg, 2008; Middelburg and Levin, 2009; Breitburg et al., 2018). When in gaseous equilibrium with air, seawater typically contains an O2 concentration ([O2]) between 200–400 µmol L−1, depending on the water temperature and the salinity (Garcia and Gordon, 1992). However, both abiotic and biotic processes cause significant departures from equilibrium. The main source of O2 to coastal waters is the atmosphere, where the diffusion of O2 is governed by the air-to-sea gas exchange rate (Berg and Pace, 2017; Long and Nicholson, 2018). In shallow waters and light-exposed seafloor sediments, O2 is produced by primary producers as a by-product of photosynthesis, and it is consumed by consortia of microbes and fauna directly, through aerobic respiration, and indirectly, through the oxidation of reduced substances (Glud, 2008). If O2 consumption exceeds supply for a sufficiently long period, O2 conditions deteriorate and become hypoxic ([O2] < 63 µmol L−1). Hypoxia is becoming more common and more intense and is affecting larger areas of coastal waters, increasingly placing ecosystems and the services they provide at risk (Breitburg et al., 2018). There are several well-known variants of coastal hypoxia (Diaz and Rosenberg, 2008; Carstensen and Conley, 2019). Seasonal hypoxia, the most common form, typically occurs in summer when warm waters, strong stratification, and high organic enrichment combine to deplete O2 until autumn (Robertson et al., 2016). Periodic hypoxia, in contrast, occurs more often due to local weather dynamics and tidal cycles, but individual events are shorter (Diaz and Rosenberg, 1995), whereas diel cycles with large day-to-night [O2] excursions trigger hypoxia for a few hours daily (Davanzo and Kremer, 1994; Tyler et al., 2009). All events are expected to affect biodiversity and biogeochemical cycling to varying degrees. Seasonal and periodic hypoxia are associated with large-scale mortality of organisms and a switch between retention and removal of bioavailable nutrients such as nitrate, ammonium, phosphate, and toxic hydrogen sulfide (Middelburg and Levin, 2009; Carstensen and Conley, 2019). Short-term hypoxia can similarly exceed lethal and non-lethal thresholds for many taxa (Vaquer-Sunyer and Duarte, 2008), although, due to their sporadic nature, their occurrence and impacts are less understood.
Given the importance of O2 in coastal waters, [O2] is one of the most frequently measured environmental parameters. Near-seabed [O2] is typically measured using long-term stable O2 sensors (e.g. optodes; Bittig et al., 2018) that are moored ∼ 0.3–1.0 m above the seafloor or by performing vertical profiles of water column [O2] down to ∼ 1.0 m above the seafloor using multiparameter sondes. National monitoring programmes such as those maintained by the Swedish Meteorological and Hydrological Institute and the Finnish Environment Institute provide a wealth of essential open-access data, enabling important analyses detailing the prevalence and intensity of coastal hypoxia (Virtanen et al., 2019; Conley et al., 2011; Carstensen and Conley, 2019). Notwithstanding the progress being made in coastal monitoring, it was demonstrated more than 40 years ago that the largest [O2] gradients may occur just a few centimetres above the seafloor due to the high reactivity of marine sediments and a strong benthic O2 demand (Jorgensen, 1980). To date, records of hypoxia in the shallow subtidal zone are still somewhat scarce. In a compilation of monitoring data for the northern Baltic Sea (Gulf of Finland and Archipelago Sea), Virtanen et al. (2019) found that just 11 out of 461 (or 2.4 %) of the monitoring stations that registered hypoxia occurred in waters with < 5 m depth. While this may reflect a true signal that hypoxia is more widespread in deeper coastal waters, it is also likely that hypoxic conditions go undetected if measurements are performed away from the seafloor, as is common practice (Conley et al., 2011; Virtanen et al., 2019).
Around two-thirds of the ocean's photosynthetic biomass is bound in macrophytes growing in shallow waters along the world's coastline (Smith, 1981). Through seasonal decay, epiphyte growth, grazing, and physical forcing (e.g. waves, currents, and ice scouring), macrophytes export a large proportion of their primary production (∼ 40 %) to their surroundings as detritus (Attard et al., 2019a; Krumhansl and Scheibling, 2012; Duarte and Cebrián, 1996). Macrophyte detritus drifts with the currents and accumulates on the shoreline and in low-energy marine environments (e.g. shallow seafloor depressions and in deeper waters), where it constitutes habitat structure and organic enrichment to the receiving habitat (Norkko and Bonsdorff, 1996b). Given high-enough abundance, detritus suppresses the diffusion of O2 from the water column to the sediment surface, and it exacerbates O2 depletion on the seabed as it decays. Large accumulations of unattached ephemeral macroalgae such as the brown algae Ectocarpus siliculosus and Pylaiella littoralis are common in eutrophic coastal waters such as the Baltic Sea, forming thin mats above the seafloor that are typically a few centimetres thick (Norkko and Bonsdorff, 1996a). While coastal hypoxia is most commonly associated with eutrophic waters such as the Baltic Sea (Carstensen and Conley, 2019; Conley et al., 2011), hypoxic (and even sulfidic) conditions have been reported in remote and more pristine environments such as the high Arctic due to large accumulations of detritus produced from perennial brown seaweeds (Glud et al., 2004). However, the O2 dynamics within accumulations of drifting detritus and the potential implications for the associated fauna remain poorly understood. Understanding the ecological and biogeochemical implications of drifting macrophyte detritus is particularly important given the ambitions to vastly increase macroalgal farming (Broch et al., 2019), which would result in increased deposition of macrophyte detritus on the coastal seafloor (Broch et al., 2022).
In this study, we investigate the O2 dynamics and macrobenthic biodiversity associated with a shallow ∼ 2300 m2 macrophyte detritus field composed of Fucus vesiculosus fragments in the northern Baltic Sea. To assess O2 production versus consumption rates of the detritus canopy, we deployed an eddy covariance system on multiple occasions to extract benthic O2 fluxes non-invasively. Using a vertical array of O2 sensors and an acoustic velocimeter, we monitored O2 distribution within the canopy and the hydrodynamics above the canopy to assess the occurrence and intensity of hypoxic events and their links to local hydrodynamics. We performed biodiversity surveys to identify the prevailing taxa, and we compared hypoxic thresholds of these taxa to [O2] measured in situ to identify potential stress. Measurements were also performed in five other habitats nearby, spanning bare sediments, seagrass, and macroalgae for comparison.
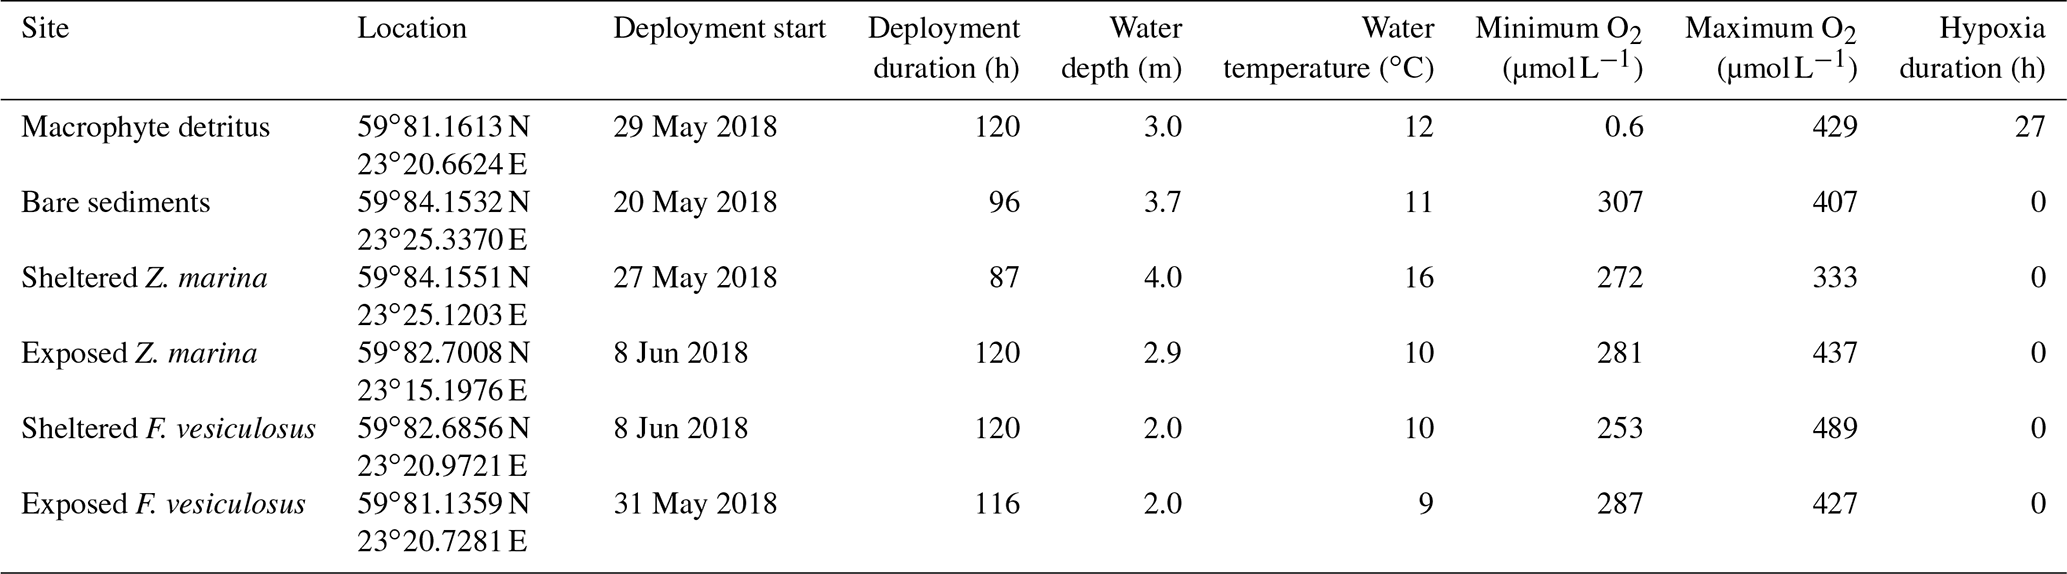
Table 1Environmental conditions and low-oxygen events at the six study sites.
2.1 Study location
The study was performed in the microtidal Baltic Sea nearby the Tvärminne Zoological Station in SW Finland. Although the focus of our study was to investigate drifting macrophyte detritus, we selected an additional five study sites within the shallow subtidal zone (2–4 m depth) for comparison; these study sites represented key habitats in the Baltic Sea: one site with bare sediments, two sites with seagrass (predominantly Zostera marina – sheltered and exposed), and two sites with intact macroalgae canopies (predominantly Fucus vesiculosus – sheltered and exposed; Table 1).
2.2 [O2] dynamics in benthic habitats
To investigate the near-bed [O2] dynamics and its environmental controls, we equipped a tripod frame with a suite of sensors consisting of three cross-calibrated dissolved [O2] loggers with inbuilt temperature compensation (HOBO U26-001, Onset), a 6 MHz acoustic velocimeter (Vector, Nortek), a photosynthetic active radiation (PAR) sensor (RBRsolo with Licor PAR Quantum 192SA), and a saltwater conductivity sensor (HOBO U24-002-C). The [O2] loggers have a factory-specified accuracy of ± 6 µmol L−1 from 0 to 250 µmol L−1, ± 16 µmol L−1 from 250–625 µmol L−1, a resolution of 0.6 µmol L−1, and a 90 % response time (T90) < 2 min. The [O2] and conductivity sensors were mounted onto a 75 cm long stainless-steel rail affixed to the tripod leg (Fig. 1). The sensors were secured to the rail at various heights above the seabed using rail mount clamps. For the study sites with canopies, two sensors were set inside the canopy; one sensor was ∼ 5 cm above the seafloor, and one was close to the top of the canopy (15–25 cm). The third sensor was placed in the water above the canopy (∼ 35 cm above the seafloor). The tripod was deployed by divers from a small boat and was carefully positioned on the seafloor using a lift bag. The exact sensor heights were noted by the divers once the instrument was on the seafloor. The instrument was left to record data for 3–5 d at each site. The velocimeter sampled three-dimensional flow velocity continuously at 8 Hz, whereas the [O2], temperature, conductivity, and PAR sensors recorded data every minute.
To investigate [O2] dynamics and its environmental drivers, all sensor time series were aligned in time, and analyses were performed to investigate vertical gradients in O2 distribution, diel [O2] excursions, and boundary-layer hydrodynamics. We assessed the occurrence of hypoxia ([O2] < 63 µmol L−1) by quantifying the magnitude (lowest [O2] value) and the duration (in hours) of hypoxic events. The high-frequency velocity data were used to calculate mean flow velocity magnitude () as the sum of streamwise (u) and traverse (v) components, as .
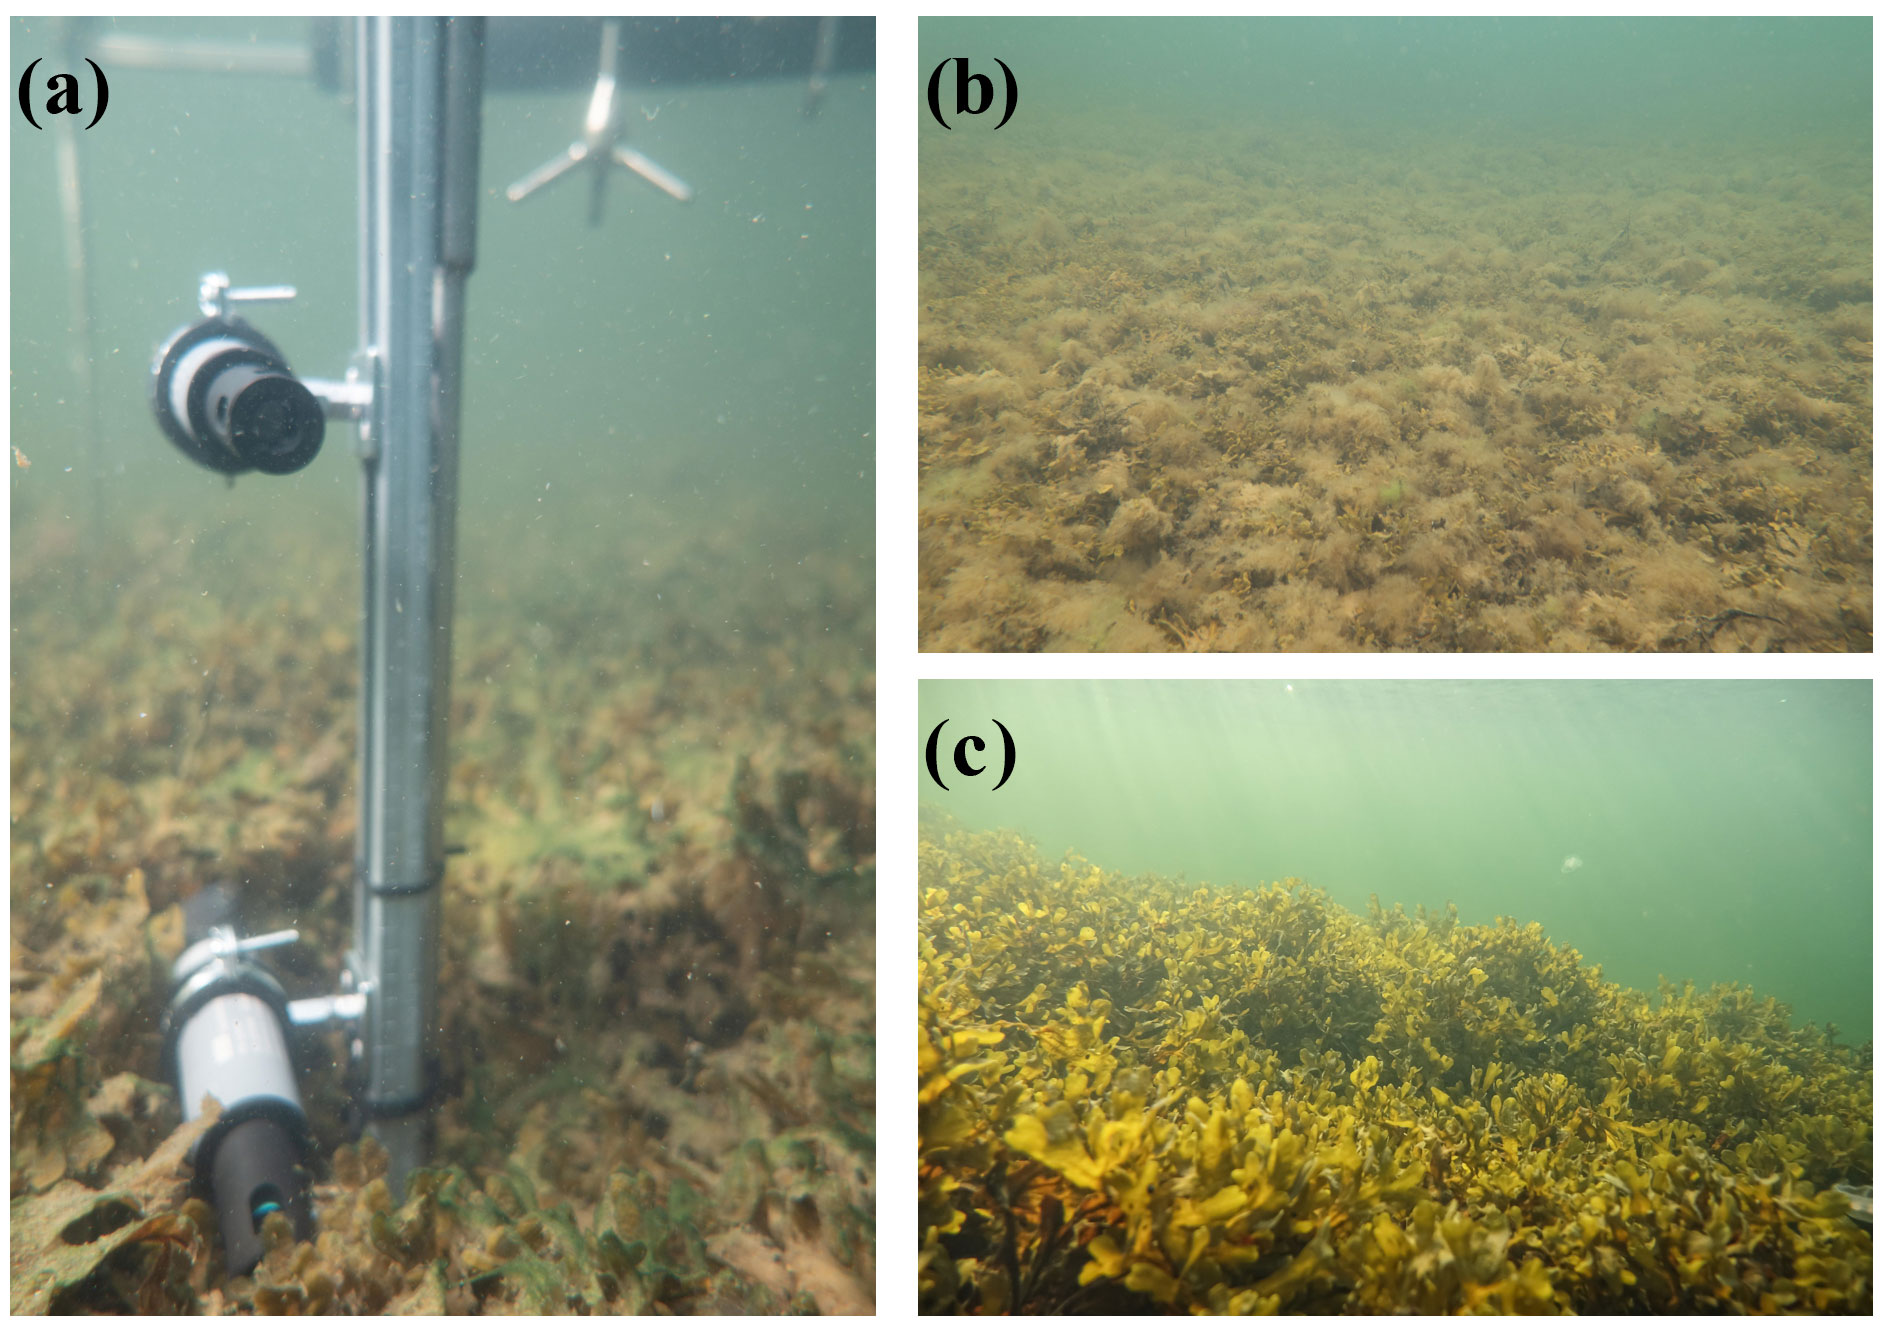
Figure 1The study area showing (a) the instrument deployed within the detritus canopy, (b) a broad-scale view of the detritus accumulation area, and (c) a nearby intact Fucus vesiculosus canopy.
2.3 Benthic O2 fluxes
An aquatic eddy covariance system was deployed at the detritus site to quantify benthic O2 fluxes at the canopy–water interface on three occasions (June 2017, September 2017, and May 2018). Eddy covariance integrates over a relatively large seafloor area (typically ∼ 30 m2; Berg et al., 2007) and extracts fluxes without disturbing the hydrodynamics or the light, which is particularly useful when trying to understand the mechanistic drivers of [O2] dynamics (Berg et al., 2022). The eddy covariance setup was identical to the tripod frame described above, with the addition of a fast-response (T90 < 0.3 s) [O2] microsensor setup for covariance measurements (McGinnis et al., 2011). The hardware and data-processing techniques are described in detail in Attard et al. (2019b). This instrument can capture the entire range of flux-contributing turbulent eddies within the benthic boundary layer, and this information is used to approximate the benthic O2 flux non-invasively (Berg et al., 2003; Berg et al., 2022). The instrument recorded co-located measurements of the vertical velocity (w) and the O2 concentration (C) at 32 Hz, and the data were processed using a multiple-step protocol detailed in Attard et al. (2019b) to extract and quality-check benthic fluxes. In short, the data streams for w and C were decomposed into mean and fluctuating components using Reynolds decomposition, as and (Berg et al., 2003). The turbulent flux (JEC) was then computed in units of as , where the overbar represents a period of 15 min. The turbulent flux was then summed with a storage correction term to calculate the total benthic flux (Jbenthic, ; Rheuban et al., 2014) as follows:
The storage correction term was defined using the three [O2] optodes placed within and above the canopy. For the correction, we defined a matrix with the number of rows n corresponding to the sensor measurement height above the seafloor (1 row per cm; Camillini et al., 2021). To do this, the oxygen time series, consisting of [O2] measurements performed at three heights within the canopy, were converted to a matrix using the software package OriginPro 2022. Since the measurement heights of the three sensors were spaced nonlinearly, the data were first converted to XYZ column format using the w2xyz function. Next, the three rows, representing the [O2] time series measurements at three heights, were expanded to n rows, with n representing the sensor measurement height in centimetres (from 0 to n cm above seabed, 1 row per cm) using the XYZ Gridding function. This generated a matrix of n rows consisting of linearly interpolated [O2]. Interpolation was performed using the Random (Renka Cline) gridding method. Next, a storage correction term was calculated for each 1 cm cell as described by Rheuban et al. (2014), and the total storage correction was subsequently computed for the water volume below the sensor measurement height as the sum of the n rows. The high-frequency [O2] time series from the fast-response microsensors were also analysed to identify any pulses of low-[O2] waters originating from within the canopy and propagating upwards into the water column.
2.4 Benthic metabolic rates
The O2 flux time series was separated into individual 24 h periods (midnight to midnight). The daytime flux (Fluxday, ) was computed as a bulk average of fluxes measured when PAR > 1.0 . The nighttime flux (Fluxnight, ) was calculated as the average of the remaining fluxes, when PAR < 1.0 . These two values and the number of daylight hours (hday) were used to estimate the daily photosynthetic rate, termed the gross primary production (GPP, in ), as and the daily respiration (R, in ) as , assuming a light-independent respiration rate. The latter is a common assumption, but it is known that it underestimates the true metabolic activity (Fenchel and Glud, 2000; Juska and Berg, 2022). The daily balance between GPP and R, termed the net ecosystem metabolism (NEM, in ) was estimated as (Attard et al., 2019b).
The relationship between seafloor PAR and the in situ benthic O2 flux was investigated using light-saturation curves. Hourly O2 fluxes were plotted against the corresponding near-bed incident PAR, and the relationship between the two was investigated using a modified tangential hyperbolic function from Platt et al. (1980), as , where Pm is the maximum rate of hourly gross primary production, α is the initial quasi-linear increase in O2 flux with PAR, I is near-bed irradiance (PAR), and R is the dark respiration rate. The photosaturation parameter, Ik (), was derived as . Non-linear curve fitting was performed in OriginPro 2022 using a Levenberg–Marquardt iteration algorithm until a chi-squared tolerance value of 1 × 10⁻⁹ was reached (Attard and Glud, 2020).
2.5 Biodiversity sampling
At all six sites, we aimed to obtain a quantitative understanding of the abundance, biomass, and species richness of macrophytes and macrofauna (infauna and epifauna). The different habitats required different sampling strategies, since four sites were sedimentary (bare-sediments site, two seagrass sites, and the detritus sites) and two sites were rocky (two macroalgal sites; Rodil et al., 2019).
At the time of our study, the detritus site had a ∼ 20 cm thick detritus mat covering the seabed sediments. The detritus canopy was sampled using large stainless-steel core liners (inner diameter = 19 cm; n = 4) capable of cutting through the mat, and the collected samples were transferred into a fine-mesh bag. In the laboratory, the detritus was rinsed through a 0.5 mm sieve to collect the associated epifauna. Samples of algal detritus were dried at 60 ∘C for 48 h, and the biomass was calculated as dry weight per m2.
Macroinfauna at the four sedimentary habitats was sampled using six sediment cores (inner diameter = 5.0 cm; depth = 15 cm). The samples were sieved through a 0.5 mm sieve, and animals were stored in alcohol for later identification. At the seagrass sites, representative macrophyte samples were collected by divers from an area around the tripod frame at the end of the deployment using four randomly placed quadrats (20 cm × 20 cm). The seagrass within each quadrat was gently uprooted and was transferred into a net-bag. In the laboratory, the samples were rinsed through a 0.5 mm sieve to collect all the associated epifauna. The animals were stored in alcohol for later identification, and the seagrass was frozen in sealed bags for further processing. The seagrass samples were later thawed, and individual shoots were counted to determine the canopy density in m2. The above- and below-ground macrophyte biomass was separated, dried at 60 ∘C for 48 h, and weighed.
At the rocky sites, F. vesiculosus individuals (n = 4) were randomly collected from around the instrument in fine-mesh bags. Randomly placed quadrats (1 m2; n = 4) were used to quantify the number of F. vesiculosus individuals per m2. At the laboratory, the collected F. vesiculosus samples were carefully rinsed through a 0.5 mm sieve to collect the epifauna. The height of the F. vesiculosus canopy was determined from the average length of the sampled individuals. Both F. vesiculosus and epiphytes were separated to the extent possible, dried at 60 ∘C for 48 h, and weighed. To collect any macrofauna on the bare rock beneath the F. vesiculosus canopy, Kautsky-type samplers were placed on the seafloor, and the 20 cm × 20 cm area was gently scraped using a spoon into a fine-mesh sampling bag. In the laboratory, all the macrofauna from the four replicates were sieved through a 0.5 mm sieve and stored in alcohol.
The fauna from all habitats was sorted, identified to species level, counted, and weighed. The wet weight for each species was noted with 0.0001 g accuracy. In cases where the fauna occurred in very high numbers, the sample was placed in a water-filled tray and divided into eight sectors. Four sectors were randomly chosen to calculate abundance and biomass. The length of gastropods and bivalves was measured from anterior to posterior axis using Vernier callipers (accuracy = 0.01 mm) for conversion to ash-free dry mass (AFDM). The AFDM of bivalves and gastropods was calculated using established relationships between length and weight for Baltic Sea fauna (Rumohr et al., 1987).
The abundance () and biomass (AFDM and/or SFDM g m−2) of the invertebrates across sites were calculated. Primer (v.7 and PERMANOVA+) software was used to perform the nonmetric multidimensional scaling (nMDS, with fourth-root-transformed data) to visualize macrofauna assemblages between sites. Analysis of similarities (ANOSIM) based on the Bray–Curtis similarity matrix was also performed in Primer (site as a fixed factor; 4999 random sample permutations) to compare differences in macrofauna abundance and biomass between sites.
3.1 Environmental conditions
Average water depth ranged from 2.0 to 4.0 m at the six study sites, and average water temperature ranged from 9 to 16 ∘C during the study period (Table 1). Hypoxic conditions were only detected at the detritus site. Bottom-water [O2] at the detritus site ranged from 1 to 429 µmol L−1, with hypoxic conditions occurring for 27 h out of the 120 h long deployment (i.e. for 23 % of the time; Table 1). At the five other measurement sites, [O2] were well above hypoxic conditions, with overall concentrations following diel patterns and ranging from 250 to 490 µmol L−1 (Table 1).
3.2 [O2] dynamics in detritus canopies
The [O2] measurements within the detrital canopy document a highly dynamic [O2] environment driven by light availability and flow velocity (Fig. 2). Within the upper layers of the canopy (i.e. ∼ 10 to 25 cm above the seafloor), [O2] and temporal dynamics largely follow diel patterns driven by light availability, with large ∼ 250 µmol L−1 diel excursions in [O2]. There, the [O2] was lowest in the morning (∼ 160 µmol L−1) and highest in the evening (∼ 430 µmol L−1). In all cases, [O2] within the upper canopy region was above hypoxic thresholds. However, under low average flow velocities < 2 cm s−1, [O2] within the lower canopy region (< 10 cm) deviated substantially from the conditions above. No diel variations in [O2] were observed during these periods, and [O2] rapidly became hypoxic for sustained periods (> 24 h long), with [O2] being very low (< 10 µmol L−1) during ∼ 10 h (∼ 8 % of the time; Fig. 2). As hypoxia persisted throughout the night under low flow velocities, low [O2] extended upwards into the canopy. Hypoxic conditions ended at the onset of higher mean flow velocities of ∼ 7 cm s−1, which initiated a rapid (i.e. within 1.5 h) oxygenation of the entire canopy.
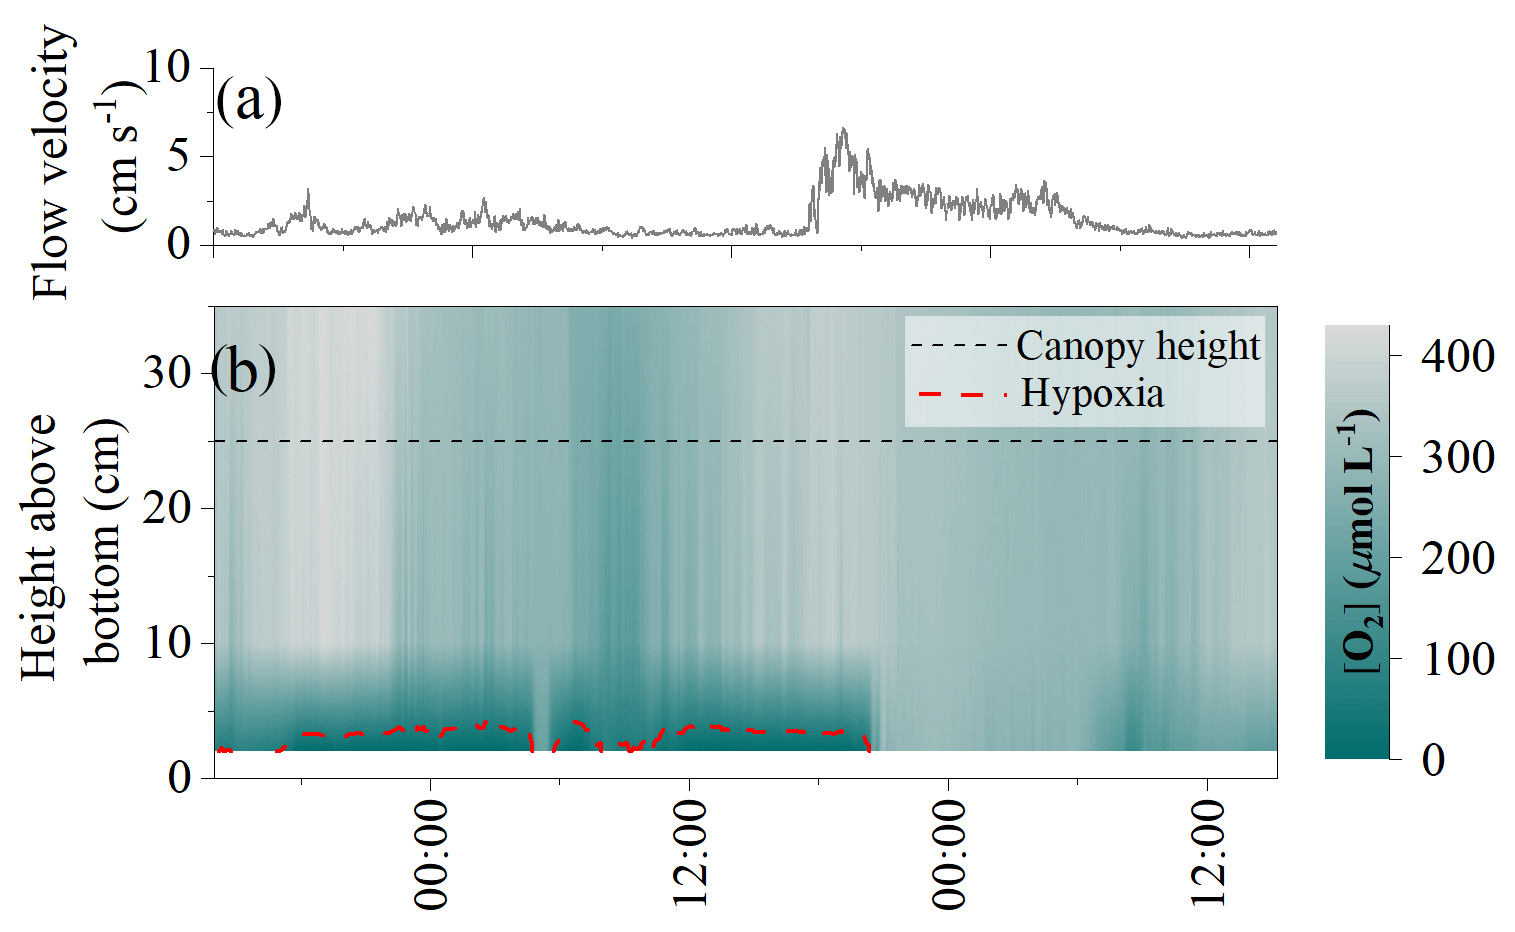
Figure 2(a) Flow velocity measured by the velocimeter 10 cm above the detritus canopy and (b) O2 distribution within the canopy as resolved by three O2 sensors located 3, 10, and 35 cm above the seafloor. Deployment started from 29 May 2018.
3.3 Pulses of hypoxic waters
High-frequency [O2] measurements performed 10 cm above the detritus canopy document transient pulses of hypoxic water originating from within the canopy and propagating upwards into the water column (Fig. 3). Such pulses typically followed quiescent weather and occurred at the onset of increased flow velocities. It took < 1 min to reduce [O2] in the water column from 220 to 65 µmol L−1. Subsequently, a recovery period followed, where [O2] gradually increased back to previous concentrations over a ∼ 5 min period. These rapid variations in water column [O2] were not captured by the slow-response [O2] optode sampling at 1 min intervals.
3.4 Benthic O2 fluxes and detritus metabolic rates
The eddy covariance measurements at the detritus site produced 3 d of continuous flux data in June 2017, 3 d of data in September 2017, and 5 d of data in May 2018. Benthic O2 fluxes documented a dynamic O2 exchange rate driven by light availability and flow velocity. During quiescent periods with low flow velocity < 2 cm s−1, a clear diel signal in the O2 flux was observed, indicating substantial primary production associated with the detritus canopy. Higher flow velocities stimulated O2 uptake rates up to 5-fold, indicating that canopy ventilation through mixing increased O2 uptake.
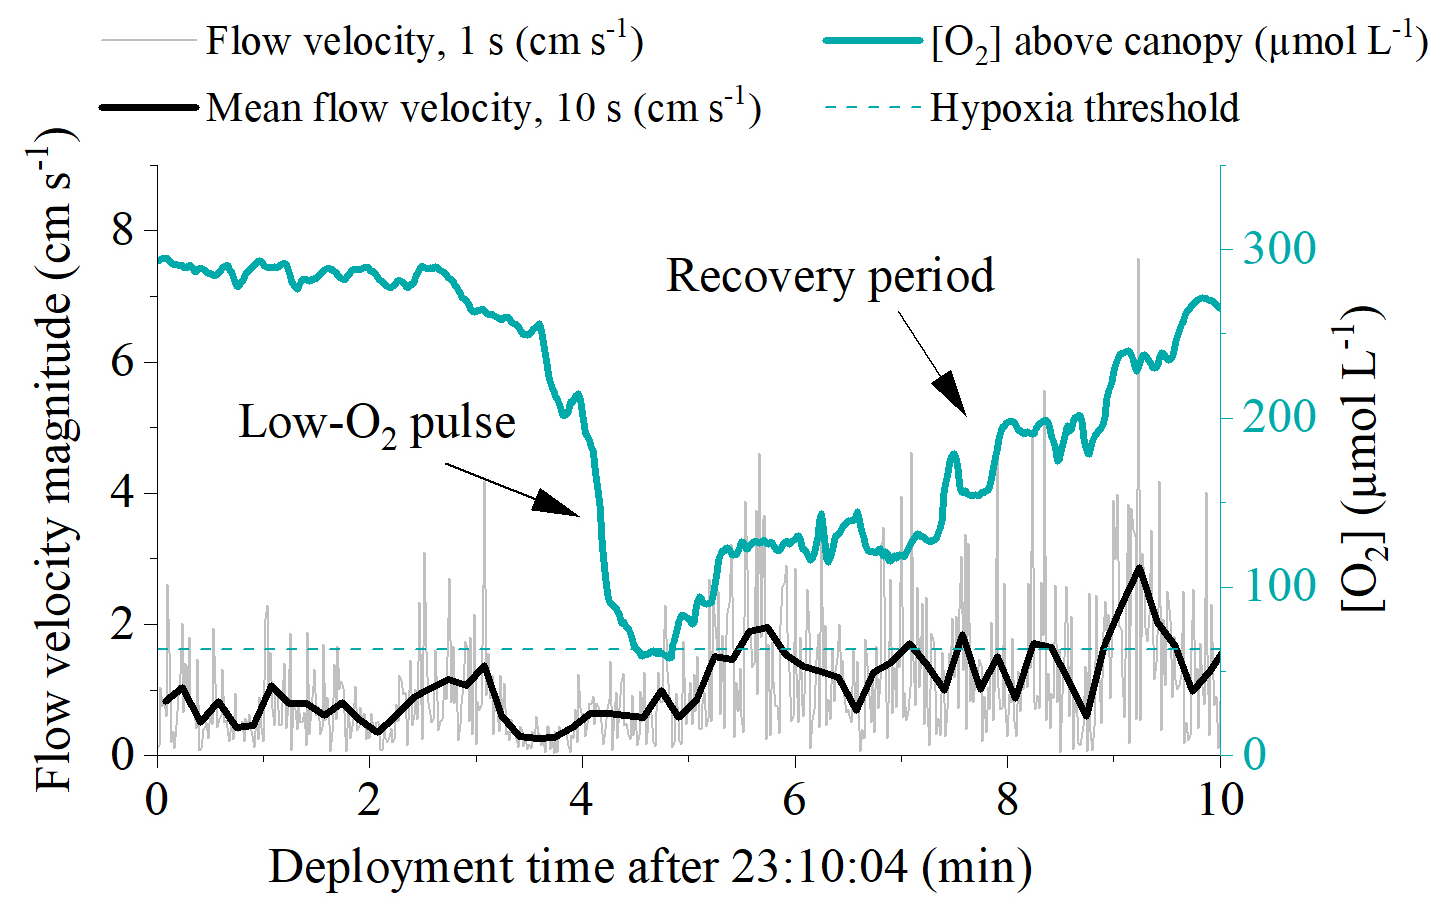
Figure 3High-frequency [O2] measured 10 cm above the detrital canopy documented pulses of hypoxic water originating from within the canopy and propagating upwards into the water column. Data from 20 September 2017.
Hourly O2 fluxes ranged from −22 at night to 13 during the day and showed a distinct diel cycle in response to sunlight availability (Fig. 4). Daily R ranged from 26 to 97 , and daily GPP was between 15 and 74 . Daily R exceeded GPP in all 11 measurement days (net heterotrophic), with NEM ranging from −7 to −32 (Fig. 4, Table S1 in the Supplement). The deployment average ( ± SD) GPP:R for the detritus canopy was 0.77 ± 0.04 in June 2017 (n = 3), 0.55 ± 0.02 in September 2017 (n = 3), and 0.77 ± 0.00 in May 2018 (n = 5), and the global mean GPP:R was 0.71 ± 0.11 (n = 11).
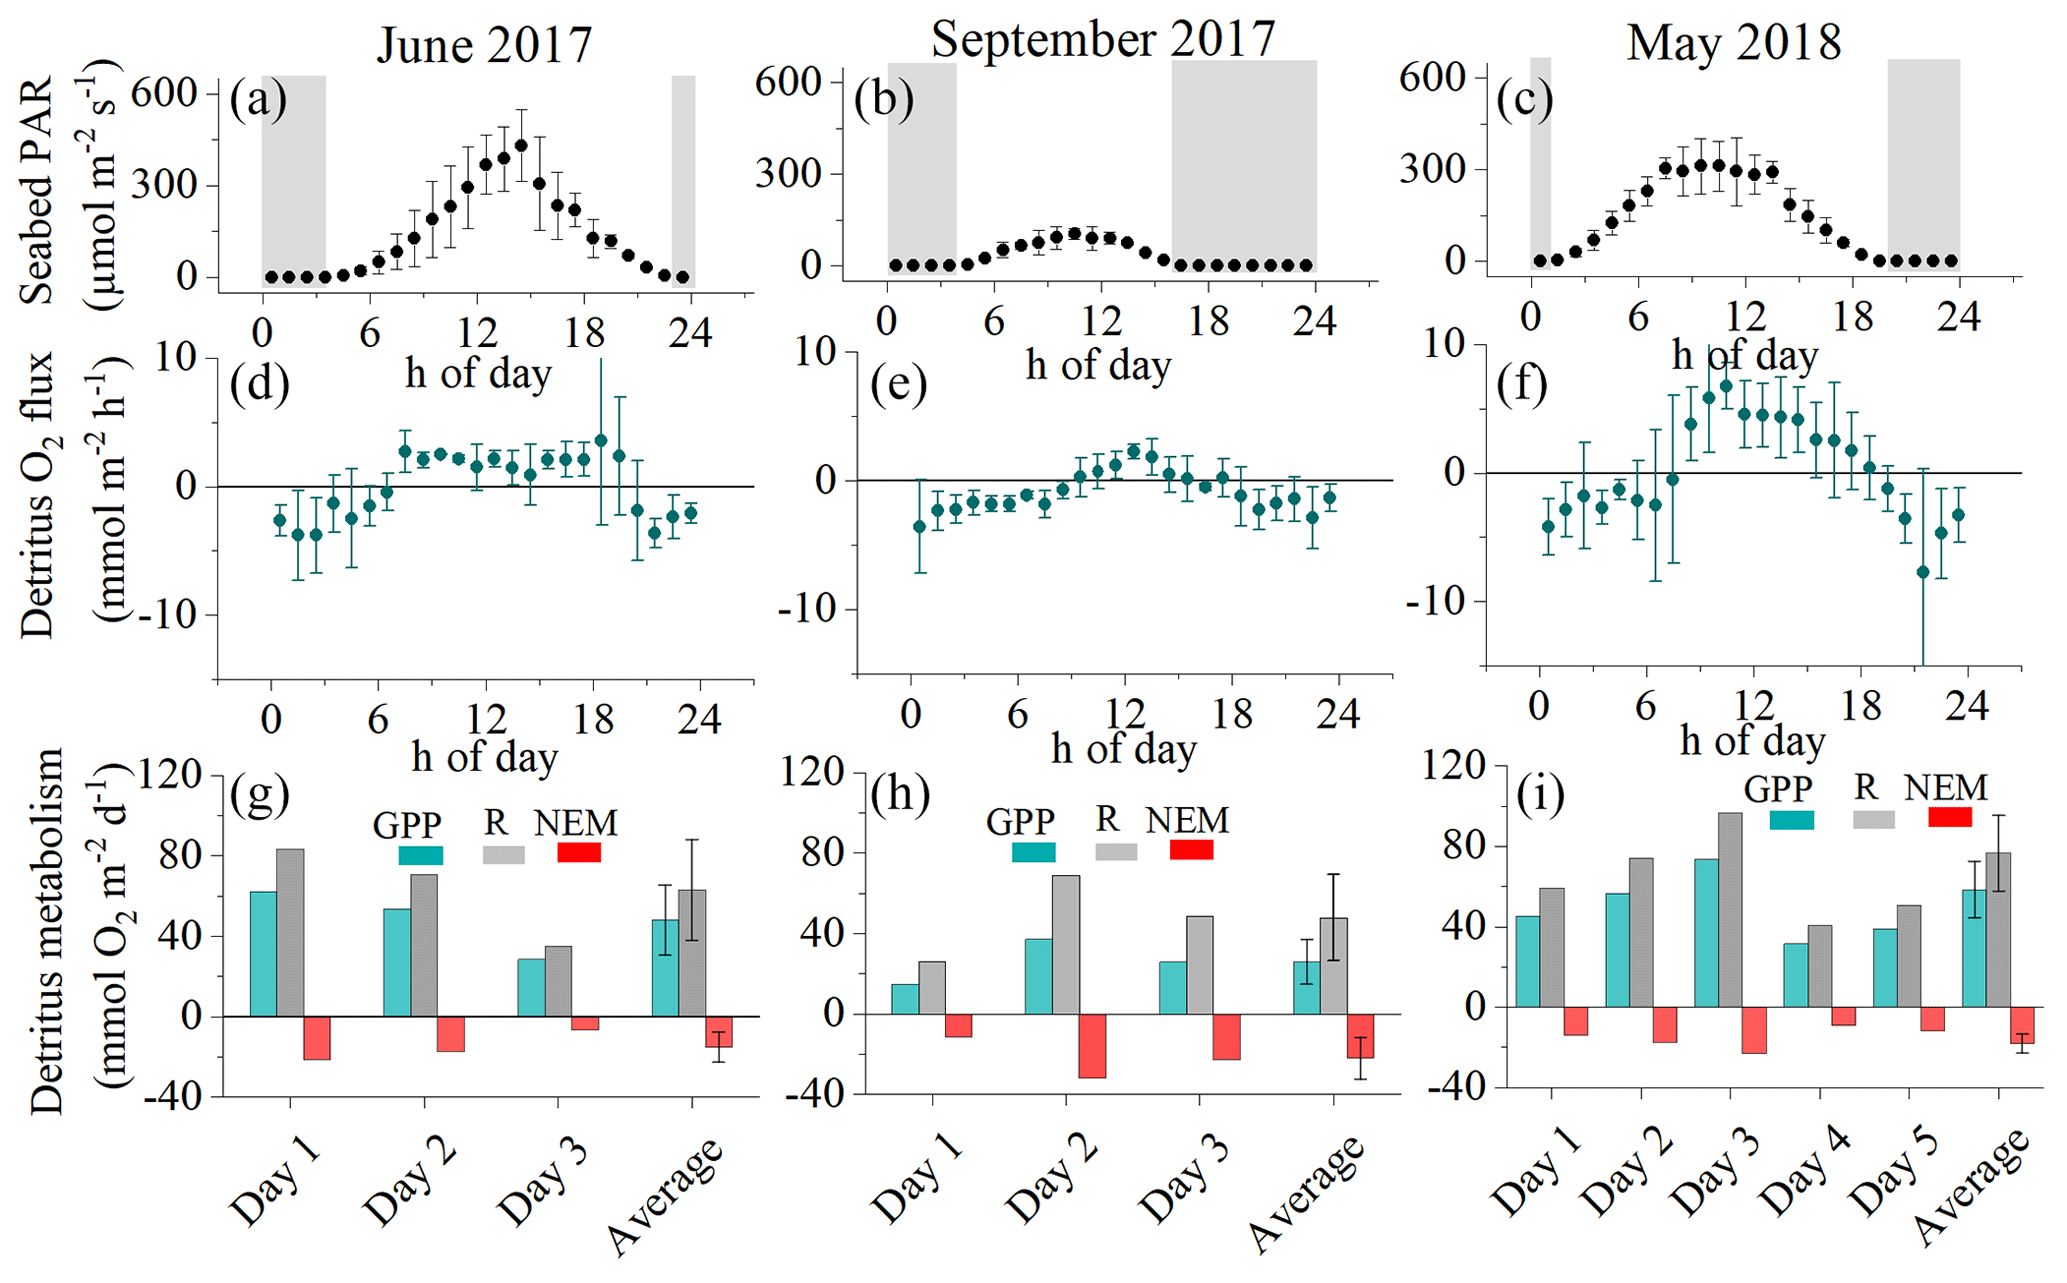
Figure 4Hourly seabed PAR (a–c) with nighttime periods grey shaded, hourly O2 fluxes (d–f), and daily metabolism estimates of gross primary production (GPP), respiration (R), and net ecosystem metabolism (NEM) for the detritus canopy for the three measurement campaigns (g–i). Seabed PAR and O2 fluxes are shown as mean ± 1 s.d. and are binned by the hour of day.
There was a significant positive relationship between daily detritus GPP and R in all measurement campaigns, with the detritus canopy seemingly becoming more heterotrophic (i.e. R > GPP) as the magnitude of the metabolic rates increased (Fig. 5, Table S2 in the Supplement). Significant positive relationships were also observed between daily detritus GPP and daily seabed PAR (Table S2). Canopy light-use efficiency (LUE), estimated as the ratio between daily GPP and daily PAR (Attard and Glud, 2020), was 0.004 O2 photon−1 in June 2017, 0.006 O2 photon−1 in September 2017, and 0.004 O2 photon−1 in May 2018 (Table S1).
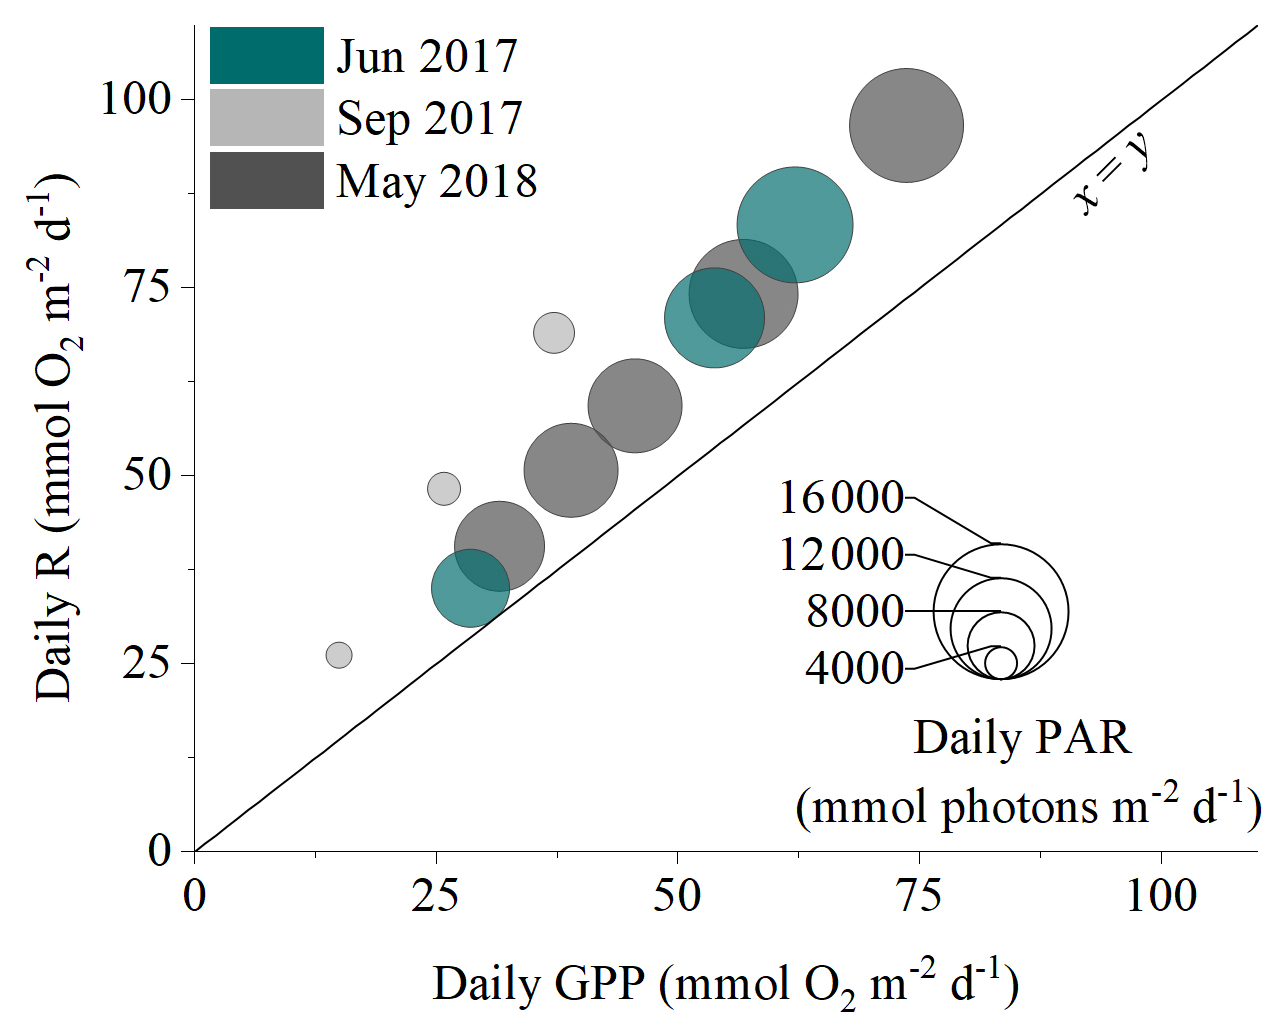
Figure 5The daily balance between detritus gross primary production (GPP) and respiration (R) for the three measurement campaigns. Symbol size corresponds to the daily integrated PAR reaching the seafloor.
There was a significant positive relationship between near-bed incident PAR and the benthic O2 flux (Fig. 5). Light-saturation curves fitted to hourly data from all deployments indicated a maximum gross primary production rate (Pm) of 5.14 ± 0.56 , an α of 0.03 ± 0.01, and an R rate of 1.92 ± 0.26 . Light saturation (Ik) of the detritus canopy occurred at irradiances greater than ∼ 170 .
Table 2Vegetation abundance and biomass (dry weight) at the six study sites. Abundance is shoots per m2 for seagrass and individuals per m2 for F. vesiculosus. Values are mean ± SE.

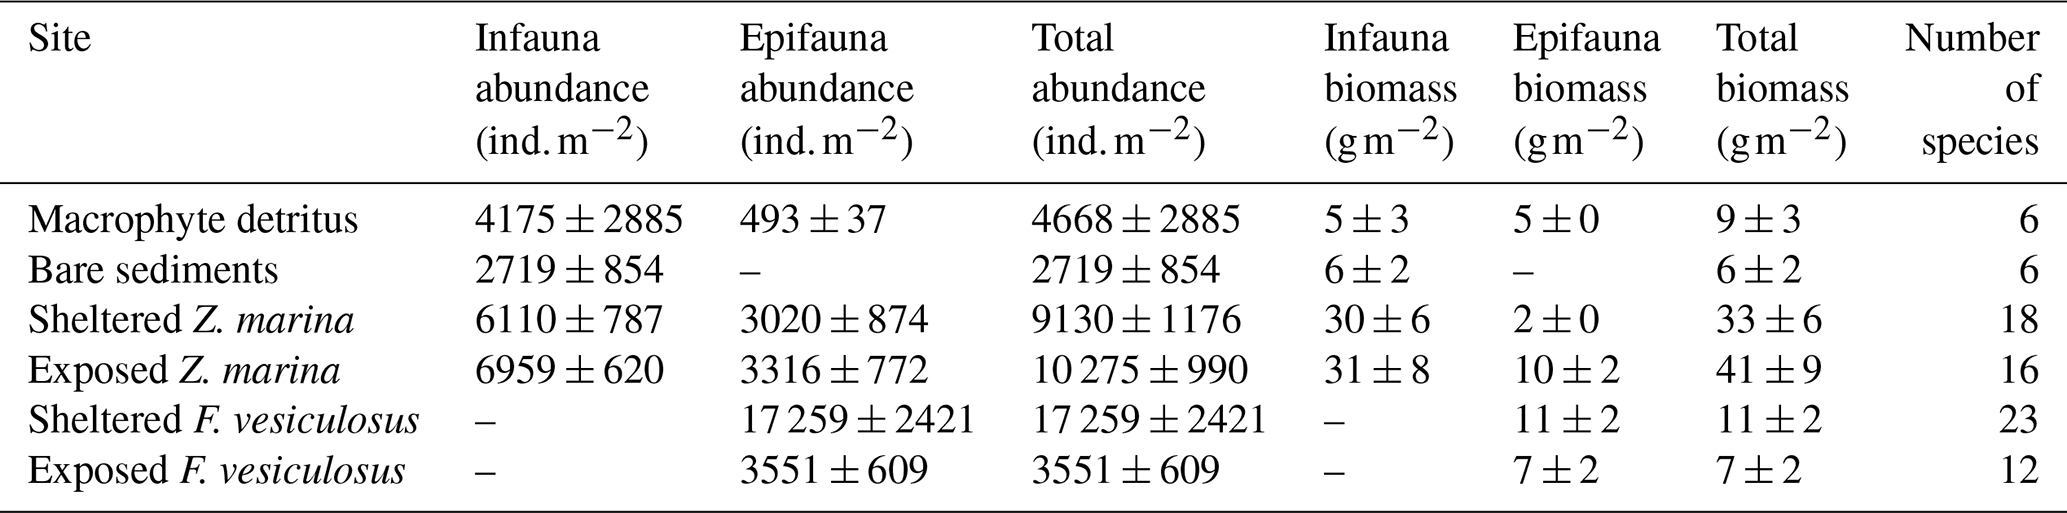
Table 3Macrofauna abundance, biomass (ash-free dry weight), and number of species at the six study sites.
3.5 Macrobenthic diversity and abundance
The detritus site had a biomass of accumulated macrophyte (F. vesiculosus) detritus of 1666 ± 223 g dry weight m−2 (mean ± SE; n = 4), approximately 1.5 times larger than nearby intact F. vesiculosus canopies (Table 2). Detritus accumulation in the five other habitats was around 100 times smaller. The area of the detritus site estimated using Google Earth was 2300 m2, amounting to 3800 kg dry weight of F. vesiculosus fragments. Macrofauna abundance ranged from 2700 ± 900 at the bare-sediments site to 17 300 ± 2400 at the sheltered F. vesiculosus site (mean ± SE, n = 4; Table 3). Macrofauna biomass ranged from 6 ± 2 g m−2 at the bare site to 41 ± 9 g m−2 at the exposed-seagrass site (mean ± SE, n = 4), and the number of species ranged from 6 to 23, with the lowest values measured at the bare-sediments and detritus sites and the highest values measured at the sheltered F. vesiculosus site (Table 3).
At the detritus site, there was a low abundance of epifaunal crustaceans when compared to other habitats with canopies. Key species such as the amphipod Gammarus spp. were notably absent, and isopods such as Idotea spp. were present in low abundance (Table S3 in the Supplement). Similarly, there was a notable absence of bivalves such as the soft-shelled clam, Mya arenaria, and the cockle Cerastoderma glaucum. Polychaetes such as Hediste diversicolor and Marenzelleria spp. were also absent from the detritus site but present in other sedimentary habitats (Table S3). The nMDS ordination of the macrofaunal assemblages indicated a clear separation of points representing the different habitat sites (ANOSIM: R2 = 0.865; p < 0.001). The assemblages from the bare-sand and the detritus sites formed separate site groupings compared to the vegetated sites (Fucus and seagrass, both exposed and sheltered). Within the vegetated sites, the assemblages of the seagrass-sheltered and the Fucus-sheltered sites were the most different (Fig. 7).
4.1 Detritus metabolism
The eddy covariance measurements document a highly active detrital canopy that photosynthesized and also respired. High daily rates of GPP of up to 75 and R of 100 are comparable to some of the most-productive habitats in the area, such as dense seagrass meadows (Zostera marina) and intact canopies of bladder wrack (Fucus vesiculosus; Attard et al., 2019b). However, intact canopies of F. vesiculosus function very differently to detritus canopies from a metabolic standpoint. In June 2017, two eddy covariance instruments were deployed in parallel: one at the detritus site and another at a nearby intact canopy. While the detritus was net heterotrophic (NEM = −15 ; GPP:R = 0.76), the intact F. vesiculosus canopy was strongly net autotrophic (NEM = 167 ; GPP:R = 6.40; Attard et al., 2019b). Daily R at the detritus site was up to ∼ 5 times larger than that at a nearby (within 4 km) site with bare sediments and was up to twice as high as a neighbouring intact canopy of F. vesiculosus (Attard et al., 2019b). Decaying (and respiring) fragments of F. vesiculosus could contribute substantially to the O2 uptake rate; laboratory incubations of F. vesiculosus fragments resolved respiration rates of ∼ 5 , equivalent to ∼ 25 , when upscaled to in situ biomass observed at the detritus site (data not shown).
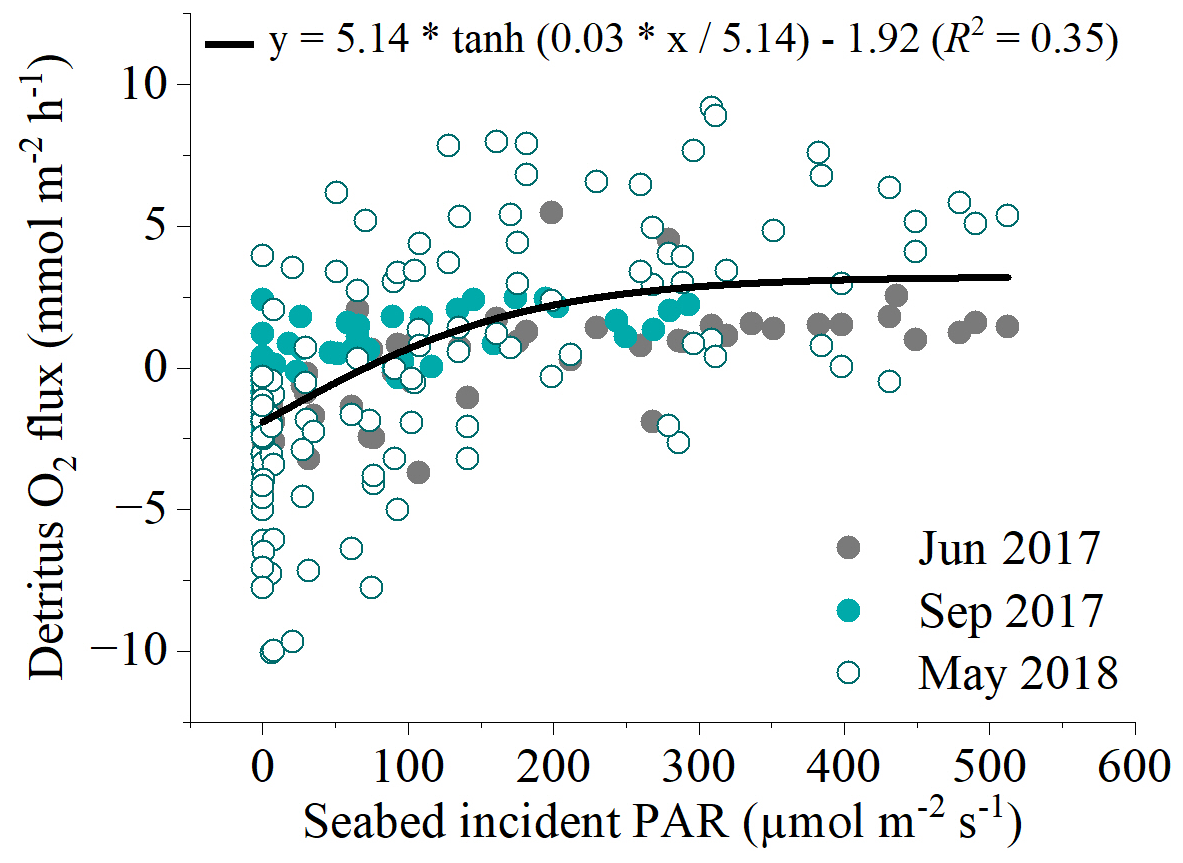
Figure 6Relationship between all hourly in situ benthic O2 fluxes at the detritus site and light availability from the three flux datasets measured. A modified photosynthesis–irradiance curve by Platt et al. (1980) is shown as the line of best fit to the global dataset.
Notwithstanding the key metabolic differences between detritus and other neighbouring sites, the flux measurements (Fig. 4) indicate that shallow detritus accumulation zones are not just regions of organic matter remineralization; rather, they synthesize substantial amounts of organic matter through primary production. The range in daily GPP:R from 0.53 to 0.81 indicates that primary production can offset a substantial proportion of the respiratory demand, which extends the persistence of detritus in the coastal zone. These observations are consistent with the laboratory study by Frontier et al. (2021), who determined that, following detachment, kelp (Laminaria hyperborea and L. ochroleuca) fragments retain physiological and reproductive capabilities for up to several months. Carbon retention within the coastal zone and export to deeper sedimentary-accumulation regions would therefore be larger than would be predicted by decomposition theory alone. Similarly, slow and incomplete degradation of algae detritus under low-[O2] conditions, which could occur, for instance, in the bottom layers of detrital canopies or in the large anoxic basins of the Baltic Sea (Conley et al., 2009), would increase carbon retention, transfer, and sequestration potential (Pedersen et al., 2021).

Figure 7A non-metric multidimensional scaling (nMDS) ordination of the macrofaunal assemblages indicated a clear separation of points representing the different habitat sites. The assemblages from the bare-sand and the detritus sites formed separate site groupings compared to the vegetated sites. Data from May 2018 (see Table 1).
4.2 Periodic benthic hypoxia
Our in situ measurements performed over a few days in late spring document that subtidal detritus accumulation zones uniquely experience dynamic [O2] conditions driven by sunlight availability and flow velocity, with rapid [O2] oscillations and frequent periods of hypoxia (Table 1). Hypoxic conditions were largely restricted to the lower ∼ 5 cm of the canopy and were only revealed by sensors placed directly above the sediment surface (< 5 cm distance). At the onset of wave-driven mixing, hypoxic waters from within the canopy propagated upwards into the water column and were registered by fast-response [O2] sensors located 10 cm above the canopy (∼ 35 cm above the seafloor). This observation suggests that the [O2] conditions inside the entire canopy and even in the water column directly above can reach hypoxic conditions for a few minutes (Fig. 3). Such pulses, however, were not registered by the slow-response [O2] optodes with a factory-specified T90 < 2 min. The minimum [O2] observed by these sensors placed at 10 and 35 cm above the seafloor was 158 and 229 µmol L−1, respectively, and was thus well above hypoxic conditions.
The importance of measuring [O2] close to the seafloor was demonstrated more than 40 years ago by Jorgensen (1980), and since then, other researchers have investigated the distribution of dissolved constituents such as O2 and nutrients in the benthic boundary layer (Holtappels et al., 2011). These studies document that solute gradients are largest near the seafloor. For practical reasons, however, coastal monitoring programmes measure [O2] further away from the seafloor. Models based on monitoring data suggest that hypoxia is prevalent in only small areas of the shallow subtidal zone. For instance, models for the northern Baltic Sea, which cover a total seabed area of 12 435 km2, of which 2211 km2 is in shallow waters of < 5 m depth, indicate that just 16.5 km2 (or 0.75 % of shallow waters) are prone to hypoxia (Virtanen et al., 2019). Given that large quantities of drifting macrophytes are a common phenomenon in the shallow subtidal zone of the northern Baltic Sea (Norkko and Bonsdorff, 1996a), it is likely that coastal hypoxia is currently underestimated because large-scale models are largely based on measurements performed higher above the seafloor (0.5–1.0 m; Virtanen et al., 2019; Conley et al., 2011).
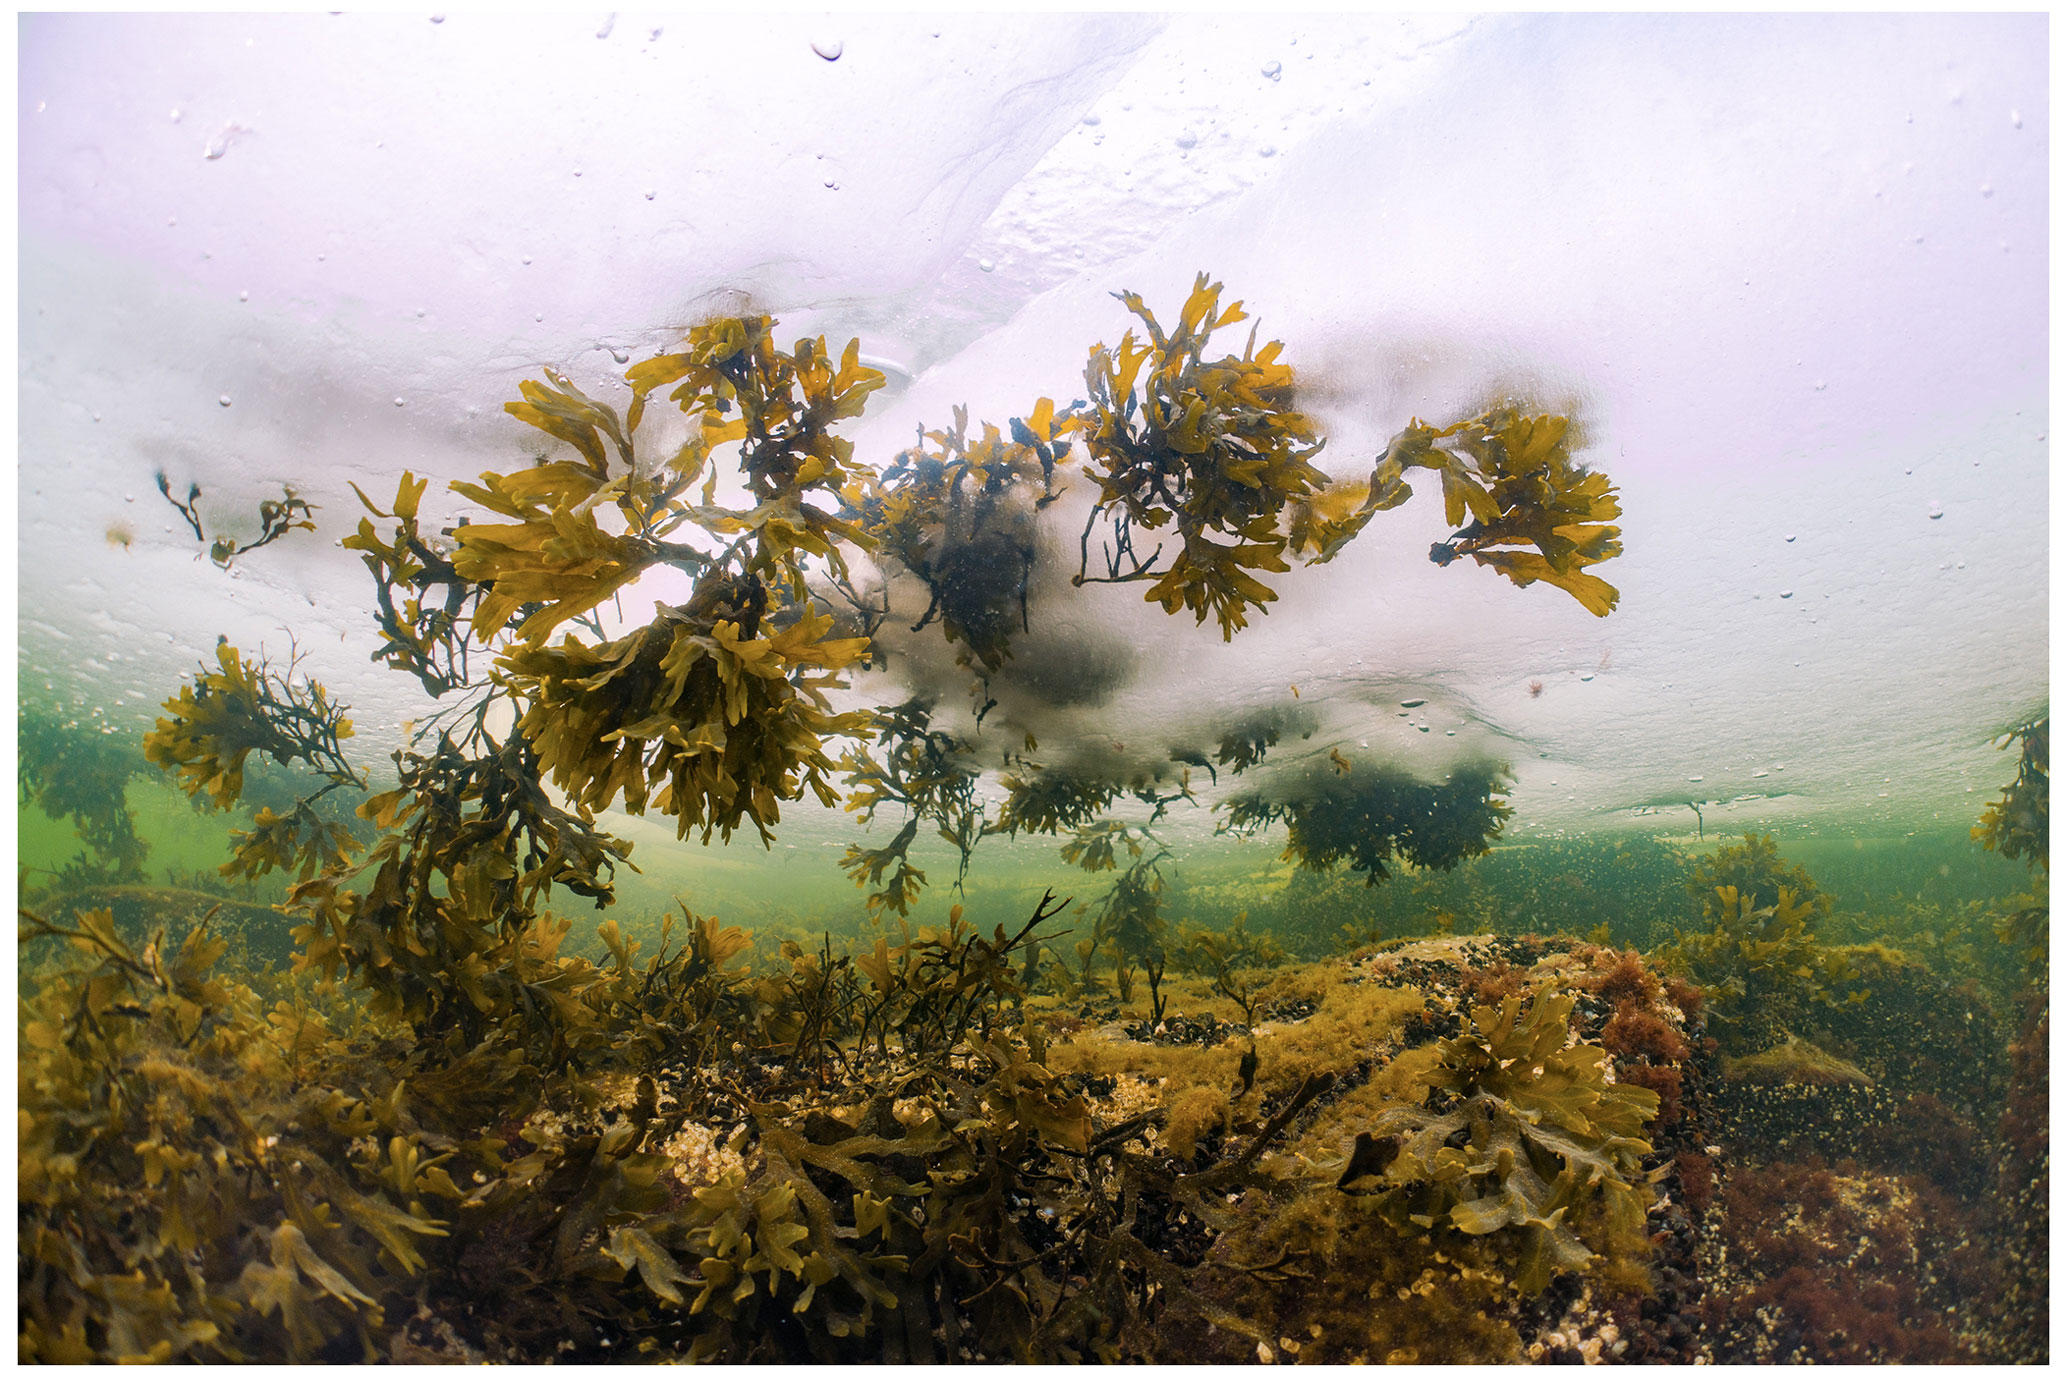
Figure 8Substantial detritus accumulation was observed during a cold spell in March 2021 when F. vesiculosus froze into sea ice and got dislodged once the ice broke up. Photo by Alf Norkko.
4.3 Biodiversity and [O2] dynamics in detritus canopies
Despite being considered a temporary habitat, detritus was found in abundance at our study site on all occasions in May, June, and September. This type of habitat is likely quite widespread in the Baltic. Habitat distribution models for the area indicate a dominance of F. vesiculosus canopies in shallow waters of < 5 m depth (Virtanen et al., 2018), and these canopies are expected to export substantial amounts of organic matter (∼ 0.3 ), which can accumulate in topographical depressions with limited water exchange (Attard et al., 2019a). Topographic depressions occupy ∼ 1350 km2 or ∼ 11 % of the northern Baltic Sea (Virtanen et al., 2019). During a recent seasonal study, we observed the highest abundance of detritus at our study site in summer and autumn, coinciding with high southerly winds that erode intact canopies in shallower waters (Attard et al., 2019a). However, we also observed significant canopy erosion in winter when a substantial biomass of F. vesiculosus froze into sea ice and got dislodged once the ice broke up (Fig. 8). Therefore, some degree of drifting detritus might be common throughout the year. Drifting detritus constitutes a significant habitat structure. Given high-enough biomass, however, detritus canopies can be a challenging habitat for most species. At our study site, hypoxic conditions uniquely occurred at the detritus site for around a quarter of the deployment time (Table 1). We can expect these conditions to be particularly challenging for crustaceans, the most hypoxia-sensitive macroinvertebrate group (Vaquer-Sunyer and Duarte, 2008). Indeed, we only found one crustacean species at this site, namely the isopod Idotea balthica (Table S3), which is mobile and can tolerate hypoxic conditions for a few hours (Vetter and Dayton, 1999). All other invertebrates observed at the detritus site were mollusks (Table S3), the most hypoxia-tolerant marine-invertebrate group (Vaquer-Sunyer and Duarte, 2008). Other tolerant species include the blue mussel Mytilus trossulus x edulis that can survive > 300 h of anoxia (Jorgensen, 1980), although the survival of larvae depends on its developmental stage (Diaz and Rosenberg, 1995). Similarly, the mudsnail Peringia ulvae is highly mobile and can survive > 150 h of anoxia (Jorgensen, 1980; Norkko et al., 2000).
Overall, the dynamic [O2] conditions in detrital canopies seem to be challenging for most species in this region of the Baltic Sea, with lethal and non-lethal thresholds frequently being exceeded on timescales of hours to days. We currently have a poor understanding of the extent of periodic hypoxia in coastal waters because [O2] measurements are performed at some distance away from the seabed. While this is a practical approach that is done to minimize sensor fouling and damage, it does not reveal the full extent of coastal hypoxia. If implemented widely, sensor arrays, as described herein, and sensor elevators (e.g. Holtappels et al., 2011) can fill in this knowledge gap and provide important insights into the ecological status and biogeochemical cycling that is needed for the sustainable management of coastal ecosystems.
All data presented in this paper are available from the Dryad digital repository at https://doi.org/10.5061/dryad.7pvmcvdzj (Attard et al., 2023).
The supplement related to this article is available online at: https://doi.org/10.5194/bg-20-1713-2023-supplement.
All the authors contributed significantly to designing the research, funding the study, collecting the data, analysing the samples and data, and interpreting the results. KMA wrote the paper with input from all the authors.
The contact author has declared that none of the authors has any competing interests.
Publisher's note: Copernicus Publications remains neutral with regard to jurisdictional claims in published maps and institutional affiliations.
Colleagues at the Tvärminne Zoological Station provided valuable assistance with the fieldwork and logistics. Anni Glud at the University of Southern Denmark constructed the oxygen microsensors used in this study. Elina Virtanen at the Finnish Environmental Institute (SYKE) provided spatial data used to estimate the extent of detritus canopies. The Walter and Andrée de Nottbeck Foundation supported this work through a postdoctoral fellowship to KMA and through a Masters fellowship to Anna Lyssenko. Further funding for this project was provided by research grants from the Academy of Finland (project ID 294853), the University of Helsinki and Stockholm University strategic fund for collaborative research (the Baltic Bridge initiative), and Denmark's Independent Research Fund (project ID 7014-00078). This study has utilized research infrastructure facilities provided by FINMARI (Finnish Marine Research Infrastructure network, The Academy of Finland, project ID 283417).
This research has been supported by the Academy of Finland (grant no. 294853), the Danmarks Frie Forskningsfond (grant no. 7014-00078), and the Academy of Finland (grant no. 283417).
This paper was edited by Tyler Cyronak and reviewed by Dirk Koopmans and one anonymous referee.
Attard, K. M. and Glud, R. N.: Technical note: Estimating light-use efficiency of benthic habitats using underwater O2 eddy covariance, Biogeosciences, 17, 4343–4353, https://doi.org/10.5194/bg-17-4343-2020, 2020.
Attard, K. M., Rodil, I. F., Berg, P., Norkko, J., Norkko, A., and Glud, R. N.: Seasonal metabolism and carbon export potential of a key coastal habitat: The perennial canopy-forming macroalga Fucus vesiculosus, Limnol. Oceanogr., 64, 149–164, https://doi.org/10.1002/lno.11026, 2019a.
Attard, K. M., Rodil, I. F., Glud, R. N., Berg, P., Norkko, J., and Norkko, A.: Seasonal ecosystem metabolism across shallow benthic habitats measured by aquatic eddy covariance, Limnology and Oceanography Letters, 4, 79–86, https://doi.org/10.1002/lol2.10107, 2019b.
Attard, K. M., Lyssenko, A., and Rodil, I. F.: High metabolism and periodic hypoxia associated with drifting macrophyte detritus in the shallow subtidal Baltic Sea, Dryad Digital Repository, [data set], https://doi.org/10.5061/dryad.7pvmcvdzj, 2023.
Berg, P. and Pace, M. L.: Continuous measurement of air–water gas exchange by underwater eddy covariance, Biogeosciences, 14, 5595–5606, https://doi.org/10.5194/bg-14-5595-2017, 2017.
Berg, P., Røy, H., Janssen, F., Meyer, V., Jorgensen, B. B., Huettel, M., and de Beer, D.: Oxygen uptake by aquatic sediments measured with a novel non-invasive eddy-correlation technique, Mar. Ecol. Prog. Ser., 261, 75–83, https://doi.org/10.3354/Meps261075, 2003.
Berg, P., Røy, H., and Wiberg, P. L.: Eddy correlation flux measurements: the sediment surface area that contributes to the flux, Limnol. Oceanogr., 52, 1672–1684, https://doi.org/10.4319/lo.2007.52.4.1672, 2007.
Berg, P., Huettel, M., Glud, R. N., Reimers, C. E., and Attard, K. M.: Aquatic Eddy Covariance: The Method and Its Contributions to Defining Oxygen and Carbon Fluxes in Marine Environments, Annu. Rev. Mar. Sci., 14, 431–455, https://doi.org/10.1146/annurev-marine-042121-012329, 2022.
Bittig, H. C., Kortzinger, A., Neill, C., van Ooijen, E., Plant, J. N., Hahn, J., Johnson, K. S., Yang, B., and Emerson, S. R.: Oxygen Optode Sensors: Principle, Characterization, Calibration, and Application in the Ocean, Front. Mar. Sci., 4, 429, https://doi.org/10.3389/fmars.2017.00429, 2018.
Breitburg, D., Levin, L. A., Oschlies, A., Gregoire, M., Chavez, F. P., Conley, D. J., Garcon, V., Gilbert, D., Gutierrez, D., Isensee, K., Jacinto, G. S., Limburg, K. E., Montes, I., Naqvi, S. W. A., Pitcher, G. C., Rabalais, N. N., Roman, M. R., Rose, K. A., Seibel, B. A., Telszewski, M., Yasuhara, M., and Zhang, J.: Declining oxygen in the global ocean and coastal waters, Science, 359, eaam7240, https://doi.org/10.1126/science.aam7240, 2018.
Broch, O. J., Alver, M. O., Bekkby, T., Gundersen, H., Forbord, S., Handa, A., Skjermo, J., and Hancke, K.: The Kelp Cultivation Potential in Coastal and Offshore Regions of Norway, Front. Mar. Sci., 5, 529, https://doi.org/10.3389/fmars.2018.00529, 2019.
Broch, O. J., Hancke, K., and Ellingsen, I. H.: Dispersal and Deposition of Detritus From Kelp Cultivation, Front. Mar. Sci., 9, 840531, https://doi.org/10.3389/fmars.2022.840531, 2022.
Camillini, N., Attard, K. M., Eyre, B. D., and Glud, R. N.: Resolving community metabolism of eelgrass Zostera marina meadows by benthic flume-chambers and eddy covariance in dynamic coastal environments, Mar. Ecol. Prog. Ser., 661, 97–114, 2021.
Carstensen, J. and Conley, D. J.: Baltic Sea Hypoxia Takes Many Shapes and Sizes, Limnology and Oceanography Bulletin, 28, 125–129, https://doi.org/10.1002/lob.10350, 2019.
Conley, D. J., Bjorck, S., Bonsdorff, E., Carstensen, J., Destouni, G., Gustafsson, B. G., Hietanen, S., Kortekaas, M., Kuosa, H., Meier, H. E. M., Muller-Karulis, B., Nordberg, K., Norkko, A., Nurnberg, G., Pitkanen, H., Rabalais, N. N., Rosenberg, R., Savchuk, O. P., Slomp, C. P., Voss, M., Wulff, F., and Zillen, L.: Hypoxia-Related Processes in the Baltic Sea, Environ. Sci. Technol., 43, 3412–3420, https://doi.org/10.1021/es802762a, 2009.
Conley, D. J., Carstensen, J., Aigars, J., Axe, P., Bonsdorff, E., Eremina, T., Haahti, B. M., Humborg, C., Jonsson, P., Kotta, J., Lannegren, C., Larsson, U., Maximov, A., Medina, M. R., Lysiak-Pastuszak, E., Remeikaite-Nikiene, N., Walve, J., Wilhelms, S., and Zillen, L.: Hypoxia Is Increasing in the Coastal Zone of the Baltic Sea, Environ. Sci. Technol., 45, 6777–6783, https://doi.org/10.1021/es201212r, 2011.
Davanzo, C. and Kremer, J. N.: Diel Oxygen Dynamics and Anoxic Events in an Eutrophic Estuary of Waquoit Bay, Massachusetts, Estuaries, 17, 131–139, 1994.
Diaz, R. J. and Rosenberg, R.: Marine benthic hypoxia: A review of its ecological effects and the behavioural responses of benthic macrofauna, Oceanogr. Mar. Biol., 33, 245–303, 1995.
Diaz, R. J. and Rosenberg, R.: Spreading dead zones and consequences for marine ecosystems, Science, 321, 926–929, https://doi.org/10.1126/science.1156401, 2008.
Duarte, C. M. and Cebrián, J.: The fate of marine autotrophic production, Limnol. Oceanogr., 41, 1758–1766, https://doi.org/10.4319/lo.1996.41.8.1758, 1996.
Fenchel, T. and Glud, R. N.: Benthic primary production and O2-CO2 dynamics in a shallow-water sediment: Spatial and temporal heterogeneity, Ophelia, 53, 159–171, 2000.
Frontier, N., de Bettignies, F., Foggo, A., and Davoult, D.: Sustained productivity and respiration of degrading kelp detritus in the shallow benthos: Detached or broken, but not dead, Mar. Environ. Res., 166, 105277, https://doi.org/10.1016/j.marenvres.2021.105277, 2021.
Garcia, H. E. and Gordon, L. I.: Oxygen Solubility in Seawater – Better Fitting Equations, Limnol. Oceanogr., 37, 1307–1312, 1992.
Glud, R. N.: Oxygen dynamics of marine sediments, Mar. Biol. Res., 4, 243–289, 2008.
Glud, R. N., Rysgaard, S., Fenchel, T., and Nielsen, P. H.: A conspicuous H2S-oxidizing microbial mat from a high-latitude Arctic fjord (Young Sound, NE Greenland), Mar. Biol., 145, 51–60, https://doi.org/10.1007/s00227-004-1296-8, 2004.
Holtappels, M., Kuypers, M. M. M., Schluter, M., and Bruchert, V.: Measurement and interpretation of solute concentration gradients in the benthic boundary layer, Limnol. Oceanogr.-Meth., 9, 1–13, 2011.
Jorgensen, B. B.: Seasonal Oxygen Depletion in the Bottom Waters of a Danish Fjord and Its Effect on the Benthic Community, Oikos, 34, 68–76, 1980.
Juska, I. and Berg, P.: Variation in seagrass meadow respiration measured by aquatic eddy covariance, Limnol. Oceanogr. Lett., 7, 410–418, https://doi.org/10.1002/lol2.10276, 2022.
Krumhansl, K. A. and Scheibling, R. E.: Production and fate of kelp detritus, Mar. Ecol. Prog. Ser., 467, 281–302, https://doi.org/10.3354/meps09940, 2012.
Long, M. H. and Nicholson, D. P.: Surface gas exchange determined from an aquatic eddy covariance floating platform, Limnol. Oceanogr.-Meth., 16, 145–159, 2018.
McGinnis, D. F., Cherednichenko, S., Sommer, S., Berg, P., Rovelli, L., Schwarz, R., Glud, R. N., and Linke, P.: Simple, robust eddy correlation amplifier for aquatic dissolved oxygen and hydrogen sulfide flux measurements, Limnol. Oceanogr.-Meth., 9, 340–347, https://doi.org/10.4319/lom.2011.9.340, 2011.
Middelburg, J. J. and Levin, L. A.: Coastal hypoxia and sediment biogeochemistry, Biogeosciences, 6, 1273–1293, https://doi.org/10.5194/bg-6-1273-2009, 2009.
Norkko, A. and Bonsdorff, E.: Population responses of coastal zoobenthos to stress induced by drifting algal mats, Mar. Ecol. Prog. Ser., 140, 141–151, https://doi.org/10.3354/meps140141, 1996a.
Norkko, A. and Bonsdorff, E.: Rapid zoobenthic community responses to accumulations of drifting algae, Mar. Ecol. Prog. Ser., 131, 143–157, https://doi.org/10.3354/meps131143, 1996b.
Norkko, J., Bonsdorff, E., and Norkko, A.: Drifting algal mats as an alternative habitat for benthic invertebrates: Species specific responses to a transient resource, J. Exp. Mar. Biol. Ecol., 248, 79–104, 2000.
Pedersen, M. F., Filbee-Dexter, K., Frisk, N. L., Sarossy, Z., and Wernberg, T.: Carbon sequestration potential increased by incomplete anaerobic decomposition of kelp detritus, Mar. Ecol. Prog. Ser., 660, 53–67, 2021.
Platt, T., Gallegos, C. L., and Harrison, W. G.: Photoinhibition of photosynthesis in natural assemblages of marine phytoplankton, J. Mar. Res., 38, 687–701, 1980.
Rheuban, J. E., Berg, P., and McGlathery, K. J.: Multiple timescale processes drive ecosystem metabolism in eelgrass (Zostera marina) meadows, Mar. Ecol. Prog. Ser., 507, 1–13, https://doi.org/10.3354/meps10843, 2014.
Robertson, E. K., Roberts, K. L., Burdorf, L. D. W., Cook, P., and Thamdrup, B.: Dissimilatory nitrate reduction to ammonium coupled to Fe(II) oxidation in sediments of a periodically hypoxic estuary, Limnol. Oceanogr., 61, 365–381, 2016.
Rodil, I. F., Attard, K. M., Norkko, J., Glud, R. N., and Norkko, A.: Towards a sampling design for characterizing habitat-specific benthic biodiversity related to oxygen flux dynamics using Aquatic Eddy Covariance, PLOS ONE, 14, e0211673, https://doi.org/10.1371/journal.pone.0211673, 2019.
Rumohr, H., Brey, T., and Ankar, S.: A compilation of biometric conversion factors for benthic invertebrates of the Baltic Sea, Baltic Marine Biologists, 9, 1–56, 1987.
Smith, S. V.: Marine macrophytes as a global carbon sink, Science, 211, 838–840, https://doi.org/10.1126/science.211.4484.838, 1981.
Tyler, R. M., Brady, D. C., and Targett, T. E.: Temporal and Spatial Dynamics of Diel-Cycling Hypoxia in Estuarine Tributaries, Estuar. Coast., 32, 123–145, https://doi.org/10.1007/s12237-008-9108-x, 2009.
Vaquer-Sunyer, R. and Duarte, C. M.: Thresholds of hypoxia for marine biodiversity, P. Natl. Acad. Sci. USA, 105, 15452–15457, https://doi.org/10.1073/pnas.0803833105, 2008.
Vetter, E. W. and Dayton, P. K.: Organic enrichment by macrophyte detritus, and abundance patterns of megafaunal populations in submarine canyons, Mar. Ecol. Prog. Ser., 186, 137–148, 1999.
Virtanen, E., Viitasalo, M., Lappalainen, J., and Moilanen, A.: Evaluation, gap analysis, and potential expansion of the Finnish marine protected area network, Frontiers in Marine Science, https://doi.org/10.3389/fmars.2018.00402, 2018.
Virtanen, E. A., Norkko, A., Nyström Sandman, A., and Viitasalo, M.: Identifying areas prone to coastal hypoxia – the role of topography, Biogeosciences, 16, 3183–3195, https://doi.org/10.5194/bg-16-3183-2019, 2019.