the Creative Commons Attribution 4.0 License.
the Creative Commons Attribution 4.0 License.
 | 22 May 2023
Carbon cycle extremes accelerate weakening of the land carbon sink in the late 21st century
Bharat Sharma
Jitendra Kumar
Auroop R. Ganguly
Forrest M. Hoffman
Increasing surface temperature could lead to enhanced evaporation, reduced soil moisture availability, and more frequent droughts and heat waves. The spatiotemporal co-occurrence of such effects further drives extreme anomalies in vegetation productivity and net land carbon storage. However, the impacts of climate change on extremes in net biospheric production (NBP) over longer time periods are unknown. Using the percentile threshold on the probability distribution curve of NBP anomalies, we computed negative and positive extremes in NBP. Here we show that due to climate warming, about 88 % of global regions will experience a larger magnitude of negative NBP extremes than positive NBP extremes toward the end of 2100, which accelerate the weakening of the land carbon sink. Our analysis indicates the frequency of negative extremes associated with declines in biospheric productivity was larger than positive extremes, especially in the tropics. While the overall impact of warming at high latitudes is expected to increase plant productivity and carbon uptake, high-temperature anomalies increasingly induce negative NBP extremes toward the end of the 21st century. Using regression analysis, we found soil moisture anomalies to be the most dominant individual driver of NBP extremes. The compound effect of hotness, dryness, and fire caused extremes at more than 50 % of the total grid cells. The larger proportion of negative NBP extremes raises a concern about whether the Earth is capable of increasing vegetation production with a growing human population and rising demand for plant material for food, fiber, fuel, and building materials. The increasing proportion of negative NBP extremes highlights the consequences not only of reduction in total carbon uptake capacity but also of conversion of land to a carbon source.
Please read the corrigendum first before continuing.
-
Notice on corrigendum
The requested paper has a corresponding corrigendum published. Please read the corrigendum first before downloading the article.
-
Article
(3787 KB)
- Corrigendum
-
Supplement
(13800 KB)
-
The requested paper has a corresponding corrigendum published. Please read the corrigendum first before downloading the article.
- Article
(3787 KB) - Full-text XML
- Corrigendum
-
Supplement
(13800 KB) - BibTeX
- EndNote


This manuscript has been authored by UT-Battelle, LLC under Contract No. DE-AC05-00OR22725 with the U.S. Department of Energy. The United States Government retains and the publisher, by accepting the article for publication, acknowledges that the United States Government retains a non-exclusive, paid-up, irrevocable, world-wide license to publish or reproduce the published form of this manuscript, or allow others to do so, for United States Government purposes. The Department of Energy will provide public access to these results of federally sponsored research in accordance with the DOE Public Access Plan (http://energy.gov/downloads/doe-public-access-plan, last access: 11 May 2023).
Rising anthropogenic carbon dioxide (CO2) emissions are leading to increases in Earth's surface temperature and climate variability as well as intensification of climate extremes. Terrestrial ecosystems have historically taken up a little over one-quarter of these emissions via carbon accumulation in forest biomass and soils (Friedlingstein et al., 2019) and helped constrain increasing atmospheric CO2 concentrations. The increase in the net terrestrial carbon sink is a result of reduced deforestation, enhanced vegetation growth driven by CO2 fertilization, and lengthening of growing seasons in high latitudes. The growing terrestrial carbon sink provides a negative feedback to climate change; however, exacerbating environmental changes and climate extremes, such as droughts, heat waves, and fires, have the potential to reduce regional carbon stocks and moderate carbon uptake (Reichstein et al., 2013; Sharma et al., 2022a). Net biospheric production (NBP), the total downward flux of carbon from the atmosphere to the land, represents the net carbon uptake after accounting for carbon losses from plant respiration, heterotrophic respiration, fire, and harvest (Bonan, 2015) and is a critical measure of land carbon storage. Climate-driven large anomalies in NBP could impact the structure, composition, and function of terrestrial ecosystems (Frank et al., 2015). To improve our understanding of the climate–carbon cycle feedbacks, especially during such large carbon anomalies, we investigated the changing magnitude, frequency, and spatial distribution of NBP extremes over decadal time periods and identify the influential climate anomalies that potentially drive large NBP extremes at regional and global scales.
Terrestrial carbon cycle processes, such as photosynthesis, respiration, and elemental cycling, control the structure, composition, and function of terrestrial ecosystems. In the past few decades, the global terrestrial carbon cycle has taken up 25 %–35 % of the CO2 emissions from anthropogenic activities such as fossil fuel consumption, deforestation, and other land use changes (Piao et al., 2019). With rising atmospheric CO2, the carbon uptake by both the land and the ocean has also increased but with significantly greater variability over land (Friedlingstein et al., 2019). The interannual variability in land carbon uptake is strongly influenced by climate extremes, and it is primarily responsible for the interannual variation in the atmospheric CO2 growth rate (Piao et al., 2019).
Climate extremes are part of Earth's climatic variability, affecting terrestrial vegetation and modifying ecosystem–atmosphere feedbacks (von Buttlar et al., 2018). Recent studies have investigated the influence of rising temperatures on climate extremes and terrestrial ecosystems (von Buttlar et al., 2018; Diffenbaugh et al., 2017; Frank et al., 2015; Zscheischler et al., 2018; Sharma et al., 2022a). Observations and climate models suggest that climate change has increased the severity and occurrence of the hottest month, hottest day, and driest and wettest periods (Diffenbaugh et al., 2017). Heavy precipitation or lack thereof could have a negative feedback on the carbon cycle via soil waterlogging or drought stress, respectively (Reichstein et al., 2013). A few studies have investigated the impact of climate extremes on the carbon cycle and found that hot and dry extremes reduce land carbon uptake, especially in low latitudes and arid/semi-arid regions (Pan et al., 2020; Frank et al., 2015). Attribution studies infer that the compound effect of multiple climate drivers has a larger effect on the carbon cycle and its extremes (Sharma et al., 2022a; Zscheischler et al., 2018; Pan et al., 2020; Frank et al., 2015; Reichstein et al., 2013) than any individual climate driver. Most attribution methods focus on analyzing the response of the carbon cycle to climate, aggregated over annual, sub-annual, and seasonal scales; however, the responses may vary over shorter timescales, including daily to monthly.
The variability in climate–carbon cycle feedbacks is dependent on geographical location, among other factors. Grose et al. (2020) reported that while Australia is expected to experience an overall reduction in precipitation by 2100, the spatial distribution of precipitation varies since a few regions are expected to get more and others will receive less precipitation. Ault (2020) found that despite the overall increase in precipitation and water-use efficiency globally, the available soil moisture may be reduced across many regions due to increased evapotranspiration from higher temperatures, exceeding the supply from precipitation. The regions that see a decrease in supply and increase in demand for water are sensitive even to relatively small increases in temperature. These feedbacks will increase the severity of droughts, and El Niño–Southern Oscillation (ENSO) may further amplify the effect (Ault, 2020). Net primary production (NPP) sensitivity to temperature is negative above 15 ∘C and positive below 10 ∘C (Pan et al., 2020), which means warming will cause a reduction in carbon uptake in the tropics and extratropics and an increase in carbon uptake at higher latitudes. However, with increasing average surface temperatures, the NPP sensitivity could become negative over time in high-latitude regions.
Rising atmospheric CO2 levels and climate change could have implications for biological (Frank et al., 2015) and ecological systems since the severity and occurrence of climate extremes, such as heat waves, droughts, and fires, are likely to strengthen in the future. These systems are more sensitive to climate and carbon extremes than to gradual changes in climate. The increasing frequency and magnitude of climate extremes could reduce carbon uptake in tropical vegetation, reduce crop yields (Ribeiro et al., 2020), and negate the expected increase in carbon uptake (Reichstein et al., 2013). In this study we investigated the extremes in NBP and their climate drivers from Earth system model simulations for the period 1850–2100 across several regions around the globe. The objectives of this research were to (1) quantify the magnitude, frequency, and spatial distribution of NBP extremes; (2) attribute individual and compound climate drivers of NBP extremes at multiple time lags; and (3) investigate the changes in climate–carbon cycle feedbacks at regional scales.
2.1 Data
We used the Community Earth System Model (version 2) (CESM2) simulations at 1∘ × 1∘ spatial and monthly temporal resolution to analyze the carbon cycle extreme events in net biospheric production. The CESM2 is a fully coupled global Earth system model composed of atmosphere, ocean, land, sea ice, and land ice components. The simulations analyzed here were forced with atmospheric greenhouse gas concentrations, aerosols, and land use change for the historical (1850–2014) and Shared Socioeconomic Pathway 8.5 (SSP5-8.5; 2015–2100) scenario, wherein atmospheric CO2 mole fraction rises from about 280 ppm in 1850 to 1150 ppm in 2100 (Danabasoglu et al., 2020). While CO2 forcing causes temperatures to increase, changes in aerosols and land use have a slight cooling effect (Lawrence et al., 2019), resulting in an overall increase of about 8 ∘C in mean air temperature over the global land surface during 1850–2100. All the variables used in this study are from the CESM2 simulation outputs.
2.2 Definition and calculation of extreme events
We wanted to quantify the NBP extremes that are significant globally and compare the distribution of global NBP extremes across various regions. The Intergovernmental Panel on Climate Change (IPCC) (Seneviratne et al., 2012) defines extremes of a variable as the subset of values in the tails of the probability distribution function (PDF) of anomalies. Based on the global PDF of NBP anomalies, we selected a threshold value of q, such that total positive and negative extremes constitute 5 % of all NBP anomalies (Fig. S1 in the Supplement). The negative and positive extremes in NBP were comprised of NBP anomalies smaller than −q and larger than q, respectively. While the total number of NBP extremes was constant (i.e., 5 % of all NBP anomalies) for any time period, the count and intensity among positive and negative extremes vary depending on the nature of the PDF of NBP anomalies.
We computed extremes for every 25-year period from 1850 through 2100 to analyze the changing characteristics of NBP extremes at regional to global scales. For regional analysis, we used the 26 regions defined in the IPCC Special Report on Managing the Risks of Extreme Events and Disasters to Advance Climate Change Adaptation (Seneviratne et al., 2012), hereafter referred to as the SREX regions (Fig. S2). We analyzed the characteristics of NBP extremes during carbon uptake periods, when photosynthesis dominates NBP and land is a net sink of carbon (NBP>0), and carbon release periods, when NBP is dominated by respiration and disturbance processes and land is a net source of carbon (NBP<0) (Marcolla et al., 2020).
The anomalies in NBP were calculated by removing the modulated annual cycle and nonlinear trend from the time series of NBP at every grid cell. We calculated the modulated annual cycle and nonlinear trend of NBP using singular spectrum analysis, which is a non-parametric spectral estimation method that decomposes a time series into independent and interpretable components of predefined periodicities (Golyandina et al., 2001). The conventional way of computing annual cycle or climatology does not capture the intrinsic non-linearity of the climate–carbon feedback (Wu et al., 2008). The modulated annual cycle, composed of signals with return periods of 12 months and its harmonics, is able to capture the varying modulation of the seasonality of NBP under rising atmospheric CO2 concentrations. The nonlinear trend is comprised of return periods of 10 years and longer, such that the anomalies in the ecosystem and climate drivers capture the effects of ENSO, which has a large impact on climate and the carbon cycle (Zscheischler et al., 2014; Ault, 2020). Thus, NBP anomalies consist of intra-annual variability, represented by high-frequency signals (<12 months), and the interannual variability (>12 months and <10 years).
2.3 Attribution to climate drivers
While most studies traditionally attribute carbon cycle impacts to changes in climate at seasonal to annual timescales, many carbon cycle responses to climate variability occur at shorter, daily to monthly, timescales (Frank et al., 2015). Attribution analysis was performed in recent studies of large connected manifolds of spatiotemporal continuous extremes in the carbon cycle (Sharma et al., 2022b; Zscheischler et al., 2014; Flach et al., 2021) by comparing the medians or mean state of climate driver(s) during or preceding a carbon cycle extreme with climate extreme for the same spatiotemporal region or grid cells affected during carbon cycle extremes. This method may not capture the variability at smaller regional to grid cell scales. As described by Sharma et al. (2022a), we compute time-continuous extreme (TCE) events at every grid cell provided they fulfill the following conditions:
- i.
They must consist of isolated extremes that are continuous for at least one season (i.e., 3 months).
- ii.
Any number of isolated or contiguous extremes can be a part of a TCE event if the gap between such extremes is less than one season in length (i.e., up to 2 months).
We assume that extreme events separated by gaps greater than or equal to one season length are separate TCE events. Using linear regression of time-continuous NBP extremes that represent the large intra-annual and interannual variation in NBP with climate anomalies, we quantified the dominance (regression coefficient) and response (sign of the regression coefficient) of climate drivers on large NBP extremes.
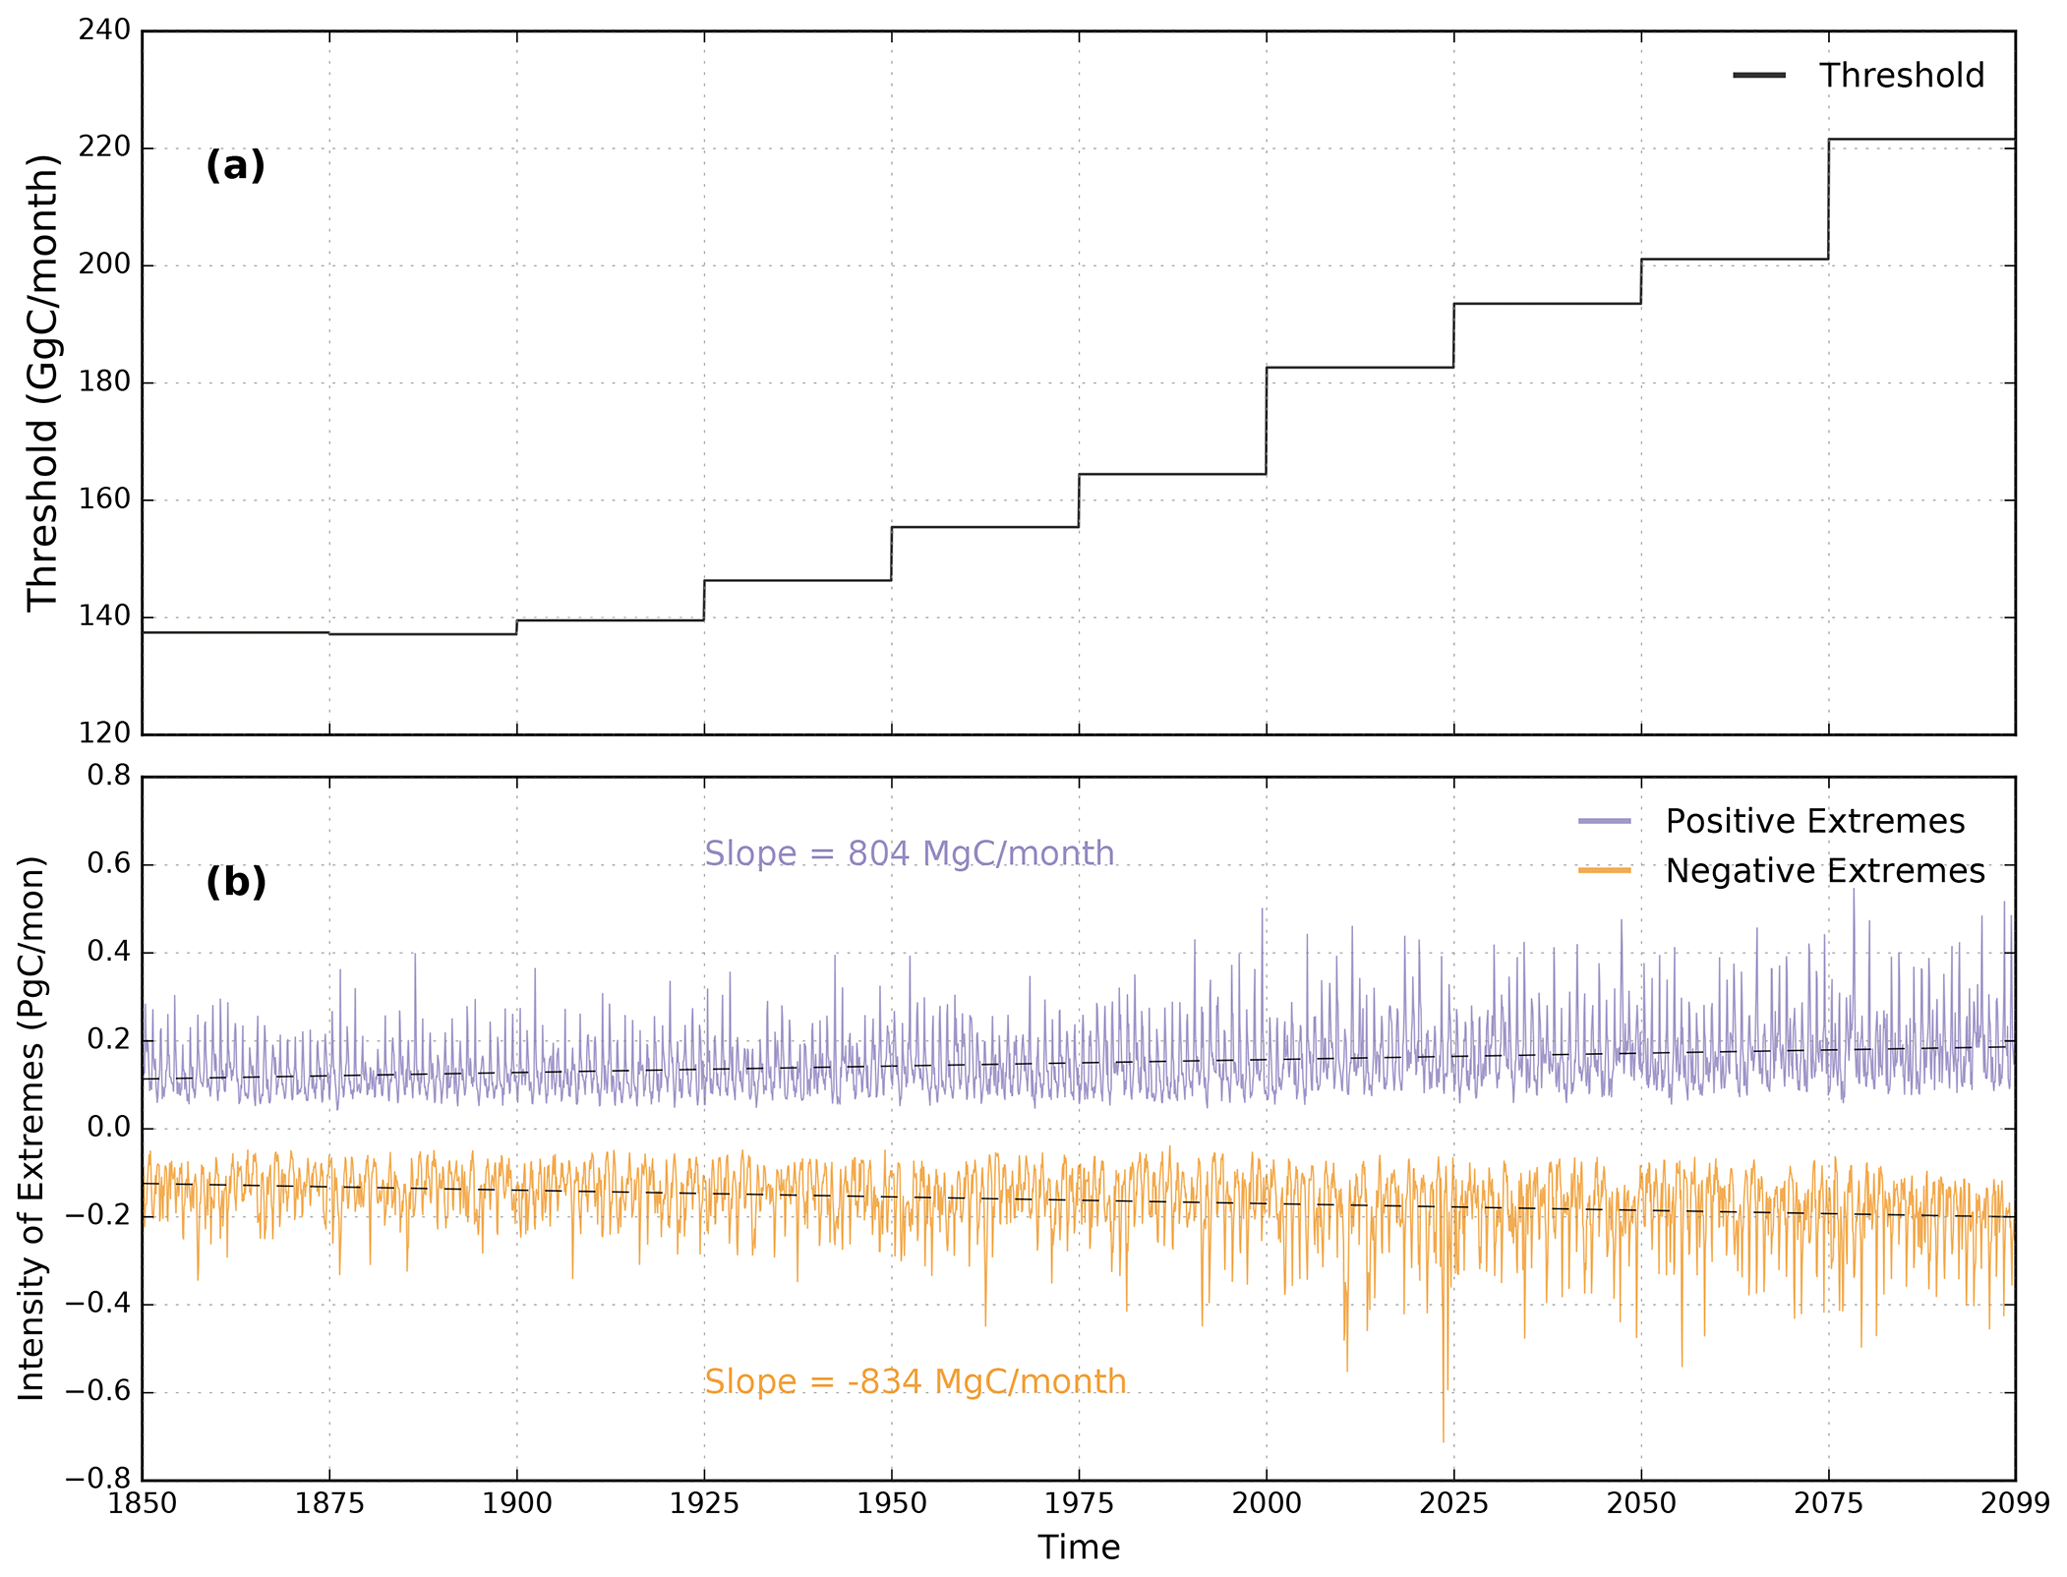
Figure 1(a) The 5th percentile threshold, q, of NBP anomalies. The negative extremes in NBP are those NBP anomalies that are and positive extremes are >q. (b) The intensity of positive and negative extremes in NBP in CESM2 are represented by green and red color, respectively. The rates of increase of positive and negative extremes in NBP are 804 and −834 MgC per month, respectively.
Human activities, such as fossil fuel emissions and land use changes, modify biogeochemical and biogeophysical processes, which alter the climate through climate–carbon feedbacks. Large anomalous changes in climate drivers have a strong impact on carbon uptake and biospheric productivity. Here, we attributed NBP TCEs to climate drivers, namely, precipitation (“Prcp”), soil moisture (“SM”), monthly average daily temperature (“TAS”), and biomass loss from carbon flux into the atmosphere due to fire (“Fire”). As the terrestrial vegetation has ingrained plasticity to buffer and push back effects of climate change (Zhang et al., 2014), the impacts of changes in climate drivers are often associated with lagged responses. Moreover, the strength of the impact of climate on NBP is dependent on location, timing, and land cover type (Frank et al., 2015). Linear regressions of TCEs in NBP and anomalies of every climate driver were identified at all affected land grid cells for lags from 1 to 4 months. We assumed that the higher the Pearson correlation coefficient (ρ) of a climate driver with NBP extremes, the larger its impact is on NBP at that location. The attribution based on ρ is used only for those grid cells for which the significance value p<0.05. The grid cells with at least two negative and positive NBP TCEs each often yielded high correlation coefficients with high significance values (p<0.05); thus, this constraint was applied for attribution to climate drivers.
The instantaneous impact (when lag equals zero months) of driver anomalies (drit) on NBP TCEs (nbpt) is computed using Eq. (1). Attribution based on the lagged response of driver anomalies on NBP TCEs was computed using Eq. (2), where L represents the number of lagged months. For lags greater than 1 month, we computed the correlation of the average of climate driver anomalies, for every time step in the driver anomalies, with nbpt. The resulting ρ captures the average response of antecedent climatic conditions up to L months in advance that drive NBP TCEs.
The direction and strength of the impact of various climate drivers on plant productivity and the carbon sink vary with space and time. Increased temperatures could lead to increased respiration and losses in NBP in the tropics and midlatitudes, but an increase in temperature could conversely lead to higher photosynthetic activity and greater uptake at higher latitudes. A moderate reduction in precipitation may not severely impact vegetation productivity, but if accompanied by a heat wave, it could lead to large losses in NBP. We expect that CESM2 could simulate the impact of variability of climate drivers on ecosystem processes because the Community Land Model version 5 (CLM5 (Lawrence et al., 2018)), the land model component of CESM2, simulates water exchange across the root structure that varies with soil depth and plant functional type. The soil water flux is dependent on hydraulic conductivity and hydraulic potential among various soil layers via Darcy's law. Due to the differences in hydraulic properties of soil layers, their soil water content varies by soil depth. The root–soil conductivity depends on evaporative demand and varies by soil layer and is calculated based on soil potential and soil properties, via the Brooks–Corey theory. The rooting depth parameterizations were improved in CLM5 with a deepened rooting profile for broadleaf evergreen and broadleaf deciduous tropical trees (Lawrence et al., 2019).
Anomalous climate drivers causing NBP extremes may or may not qualify as climate extremes by themselves. A recent study found that the periods of extreme climate and NBP often do not occur at the same time, and the compound effect of non-extreme climate drivers could produce an extreme in NPP (Pan et al., 2020). Occurrence of a NBP extreme is also likely driven by the compound effect of multiple climate drivers; we identified co-occurring anomalous climatic conditions during and antecedent to NBP extremes to improve our understanding of the interactive compound effect of drivers on the carbon cycle. We analyzed the dominant climate drivers across SREX regions for every 25-year period from 1850 to 2100 to understand the changing characteristics of large spatiotemporal extremes and their compound climate drivers across time and space. Since the dominance of climate drivers is usually quantified by a correlation coefficient range of 0.5–0.7 (Dormann et al., 2013), we imposed a limit of correlation coefficients ρ>0.6 and significance values p<0.05 on co-occurring individual climate drivers to qualify as individual or compound drivers of NBP extremes. These constraints yield a smaller number of extremes that are attributable to climate drivers with high confidence.
3.1 Characteristics of NBP extremes
The 5th percentile NBP anomalies computed for every 25-year period from 1850 to 2100 rendered threshold trajectories that increase from 140 to 220 GgC per month (Fig. 1a). This 1.5 times increase in threshold values demonstrates the increasing magnitude of anomalies and interannual variability of NBP across the globe. The corresponding time series of intensity of losses and gains in biome productivity were calculated by integrating the negative (NBP anomalies ) and positive (NBP anomalies >q) extreme anomalies. The rate of increase in the magnitude of negative extremes (−834 MgC per month) was larger than that of the positive extremes (804 MgC per month) (Fig. 1b), which implies that over time the net losses in carbon storage during NBP extremes increases.

Figure 2The figure shows the sum of the magnitude of positive and negative NBP extremes during 25-year periods. The figure shows the total integrated net impact of carbon cycle extremes (PgC) across SREX regions for the following periods: (a) 1850–1974, (b) 1900–1924, (c) 1950–1974, (d) 2000–2024, (e) 2050–2074, and (f) 2075–2099. A net gain in carbon uptake during extremes is represented by a purple color and a “+” sign, and a net decrease is represented by an orange color and a “−” sign. For most regions, the magnitude of negative NBP extremes or losses in carbon uptake were higher than positive NBP extremes or gains in carbon uptake.
The changes in NBP are driven by spatial and temporal variations in climate drivers and anthropogenic forcing. During 1850–1874, 24 out of 26 regions were dominated by carbon release (Fig. S4) and the total NBP was negative (Fig. S3). From 1850 through the 1960s, the land experienced a net C losses in carbon storage flux likely driven by deforestation, fire, and land-use change activities (Friedlingstein et al., 2019) (Fig. S9). After the year 1960, the continued increase in fossil fuel emissions raised the atmospheric CO2 concentration despite declining rates of deforestation. Increasing CO2 fertilization, water-use efficiency, and the lengthening of growing seasons enhanced vegetation growth and NBP with the largest increases in the tropics and northern high latitudes (Fig. S4). After 2070, the total NBP reached its peak and started to decline (Fig. S3) as ecosystem respiration exceeded total photosynthetic activity. Tropical regions have the largest magnitude of NBP; however, the rate of increase of NBP declined after 2050 and the region of the Sahara (SAH) showed an early drop in total NBP after the year 2050. Longer dry spells and intense rains due to changing precipitation patterns in the Mediterranean and subtropical ecosystems are likely to cause higher tree mortality (Frank et al., 2015). Hot temperatures and reduced activity of RuBisCO hindering carboxylation are possible factors that will likely cause a net decrease in NBP in the region of the SAH and make it a net carbon source after 2050. During 2050–2074 and 2075–2099, low-latitude regions exhibit the highest regional NBP; however, many areas in the tropics exhibited a declining growth rate of regional NBP (Fig. S4).
As anomalous changes in climate vary over space and time, extremes in NBP also respond to the interactive effects of climate drivers and exhibit spatial and temporal variation. Figure 2 shows the net total sum of both positive and negative extremes in NBP in SREX regions integrated for all 25-year periods (1850–1874, 1900–1924, 1950–1974, 2000–2024, 2050–2074, and 2075–2099). Most regions exhibited net losses in biospheric productivity during extremes. For example, South Africa (SAF) has always been dominated by negative NBP extremes. The large magnitude of net carbon uptake changes during the period 2000–2024 was likely due to land use and land cover change (LULCC) forcing from decadal to annual during 2000–2015 and then back to decadal from 2015 onward. The increased temporal resolution of LULCC forcing possibly caused higher climate variability due to biogeophysical feedbacks and subsequently led to increased carbon cycle variability and extremes. Since we focused on NBP extremes, which are tails of PDF of anomalies (or interannual variability) of NBP, the magnitude of carbon cycle extremes was large during this period. However, the impact of LULCC forcing was not as significant on mean NBP changes (Fig. S3); 23 out of 26 SREX regions experienced an overall loss in biospheric productivity during extremes near the end of the 21st century (Fig. 2). The distribution of the total magnitude and count of negative TCEs during 2075–2099 across all the SREX regions followed a similar pattern; i.e., more frequent extremes were accompanied by larger carbon losses (Fig. 3a). The largest losses in carbon uptake during TCEs were in tropical regions, e.g., East Asia (EAS), Amazon (AMZ), and SAF, with −3, −3, and −2.25 PgC carbon losses, respectively, during 2075–2099. These regions also witnessed the highest number of negative NBP TCEs at 1270, 1410, and 950, respectively. The magnitude of carbon losses and the number of negative NBP TCEs were highest in tropical regions. The magnitude and number of negative TCEs were very low for the high-latitude regions of Alaska (ALA), Canada and Greenland (CGI), eastern North America (ENA), northern Europe (NEU), central Europe (CEU), and the dry regions of the Mediterranean (MED) and the Sahara (SAH). Although the number of NBP TCEs in northern Asia (NAS) was higher than in southeastern South America (SSA) and Central America (CAM), the magnitude of NBP TCEs in NAS was low due to lower regional NBP. Since the extremes were calculated based on global anomalies, the largest impacts on terrestrial carbon uptake are expected in the regions of AMZ, EAS, and SAF, which have the largest concentrations of live biomass.
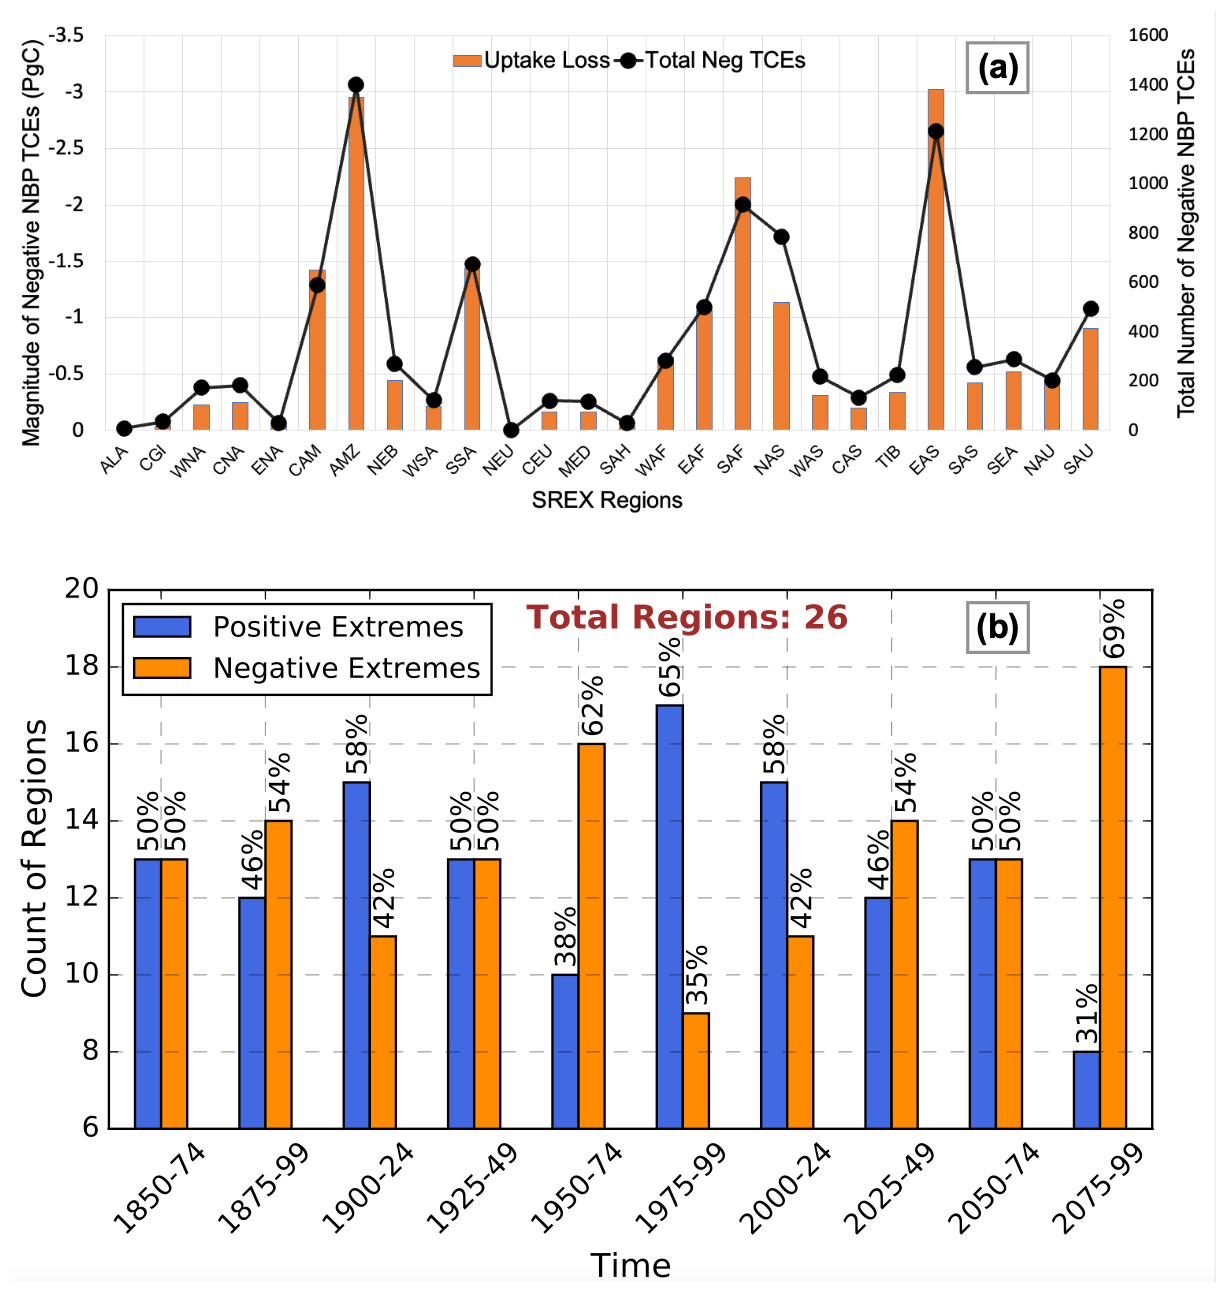
Figure 3(a) Total magnitude of negative carbon cycle extremes or loss is carbon uptake during TCEs across SREX regions plotted as a bar graph (left y axis). The total number of negative TCE events (right y axis) plotted as a line graph. The largest portion of carbon uptake loss is in the tropical SREX regions of the Amazon (AMZ), East Asia (EAS), and South Africa (SAF) for the period 2075–2099. (b) Count (y axis) of the regions dominated by either positive or negative NBP extremes. Relative to a total of 26 SREX regions, the percent count of positive or negative NBP extremes is represented at the top of the bars.
The magnitude and the total number of regions dominated by negative extremes in NBP are expected to gradually increase in the 21st century (Fig. 3b). Most of the increases in the frequency of negative extremes in NBP are expected in ENA, South Asia (SAS), SAF, and CAM (Fig. S5). The increase in the magnitude (23 out of 26 % or 88 % of all regions) and frequency (18 out of 26 % or 70 % of all regions) of negative NBP TCEs in most SREX regions during 2075–2099 is a matter of concern since the total global NBP peaked at around 2070 and subsequently declines in the model (Fig. S3). The negative NBP TCEs dominate in eight out of the nine tropical regions, which store the largest standing carbon biomass and represent the largest portion of carbon uptake loss during negative NBP extremes. A large magnitude of extreme events in the NBP could potentially lead to a state of low and decreasing carbon sink capacity that could further lead to a positive feedback on climate warming. The strengthening of negative extremes relative to positive extremes in NBP represents a net decline of terrestrial carbon sink capacity into the future (Fig. S3). This is contrary to the results of Zscheischler et al. (2014), who found a strengthening of positive (net ecosystem production, NEP) extremes over time using CMIP5 Earth system models (ESMs). However, the ratio of negative to positive carbon cycle extremes in our study lies within the multi-model spread of the relative strength of NEP extremes in CMIP5 ESMs (Zscheischler et al., 2014). The positive feedback of warming and climate driven losses in carbon uptake raises concerns about the implications of reducing terrestrial uptake capacity on food security, global warming, and ecosystem functioning. Moreover, the sensitivity of vegetation responses is higher for climate and carbon extremes than for gradual changes because of larger response strength and shorter response times (Frank et al., 2015).
3.2 Attribution to climate drivers
The increase in climate variability and extremes driven by rising CO2 emissions influences the terrestrial carbon cycle (von Buttlar et al., 2018; Reichstein et al., 2013; Sharma et al., 2022a). The control of climate drivers on NBP extremes is dependent on the regional interannual variability of climatic conditions and vegetation composition. The percent of total number of grid cells that show soil moisture as a dominant driver of NBP TCEs was about 40 % to 50 % from 1850 to 2100 across multiple lags, which means that the near-term and long-term impacts of soil moisture were highest among all other drivers (Fig. S6). The positive response of soil moisture anomalies on NBP TCEs indicates that a decline in soil moisture causes a reduction in NBP and vice versa. Likewise, the dominant climate driver across the 26 SREX regions was also soil moisture, and it exhibited a positive response relationship with NBP TCEs (Fig. 4). However, the proportion of the total number of grid cells dominated by precipitation doubled (10 % to 20 %) when the lag was increased from 1 to 3 months. This implies that antecedent declines in precipitation limit carbon uptake more than a recent decline in precipitation and possibly causes a decline in soil moisture. Moreover, the plants with deep roots are less impacted with short-term reduction in precipitation than prolonged droughts, which are caused by soil moisture limitation. By the end of the 21st century, the model indicates that 70 % of the total number of NBP extremes will be water-driven (i.e., due to soil moisture and precipitation). Our results are consistent with recent studies (Liu et al., 2020; Pan et al., 2020) that concluded that the most important factor limiting vegetation growth is water stress, which is caused mainly by low soil moisture. Lack of soil moisture for extended periods could result in drought events, causing a larger reduction in ecosystem productivity and a smaller reduction in terrestrial respiration.
The second most dominant driver of NBP TCEs was fire, which has a positive response on NBP TCEs (Fig. S6). Fire is an important Earth system process that is dependent on vegetation, climate, and anthropogenic activities. CESM2 incorporated a process-based fire model, which contains three components, namely, fire occurrence, fire spread, and fire impact (Li et al., 2013). The interannual variability of agricultural fires is largely dependent on fuel load and harvesting; deforestation fires included fires due to natural and anthropogenic ignitions, caused by deforestation, land-use change, and dry climate. Peat fires usually occur in the late dry season and are strongly controlled by climate. The current version of the fire model reasonably simulates burned area, fire seasonality, fire interannual variability, and fire emissions (Li et al., 2013). As fires are controlled by soil moisture, temperature, and wind, the attribution of NBP extremes to fires could also include the NBP extremes that are driven by inadequate soil moisture and hot temperatures. Therefore, the total number of fire events could be larger, and recovery after such fire driven extremes could be much longer.
Hot temperatures over long periods tend to reduce ecosystem production and enhanced terrestrial respiration, causing a large reduction in NBP (Pan et al., 2020). Leaf photosynthesis depends on the RuBisCO-limited rate of carboxylation, which is inversely proportional to the Q10 function of temperature in the model (Lawrence et al., 2019). Hubau et al. (2020) found that with increasing temperatures and droughts, tree growth was reduced and could offset earlier productivity gains. Conversely, warm temperatures in the northern high latitudes cause an increase in carbon uptake due to reduced snow cover and optimal temperature for photosynthesis. Increased warming at northern high latitudes could lead to hot temperature-related hazards and alter temperature–carbon interactions, which is discussed in Sect. 3.5.
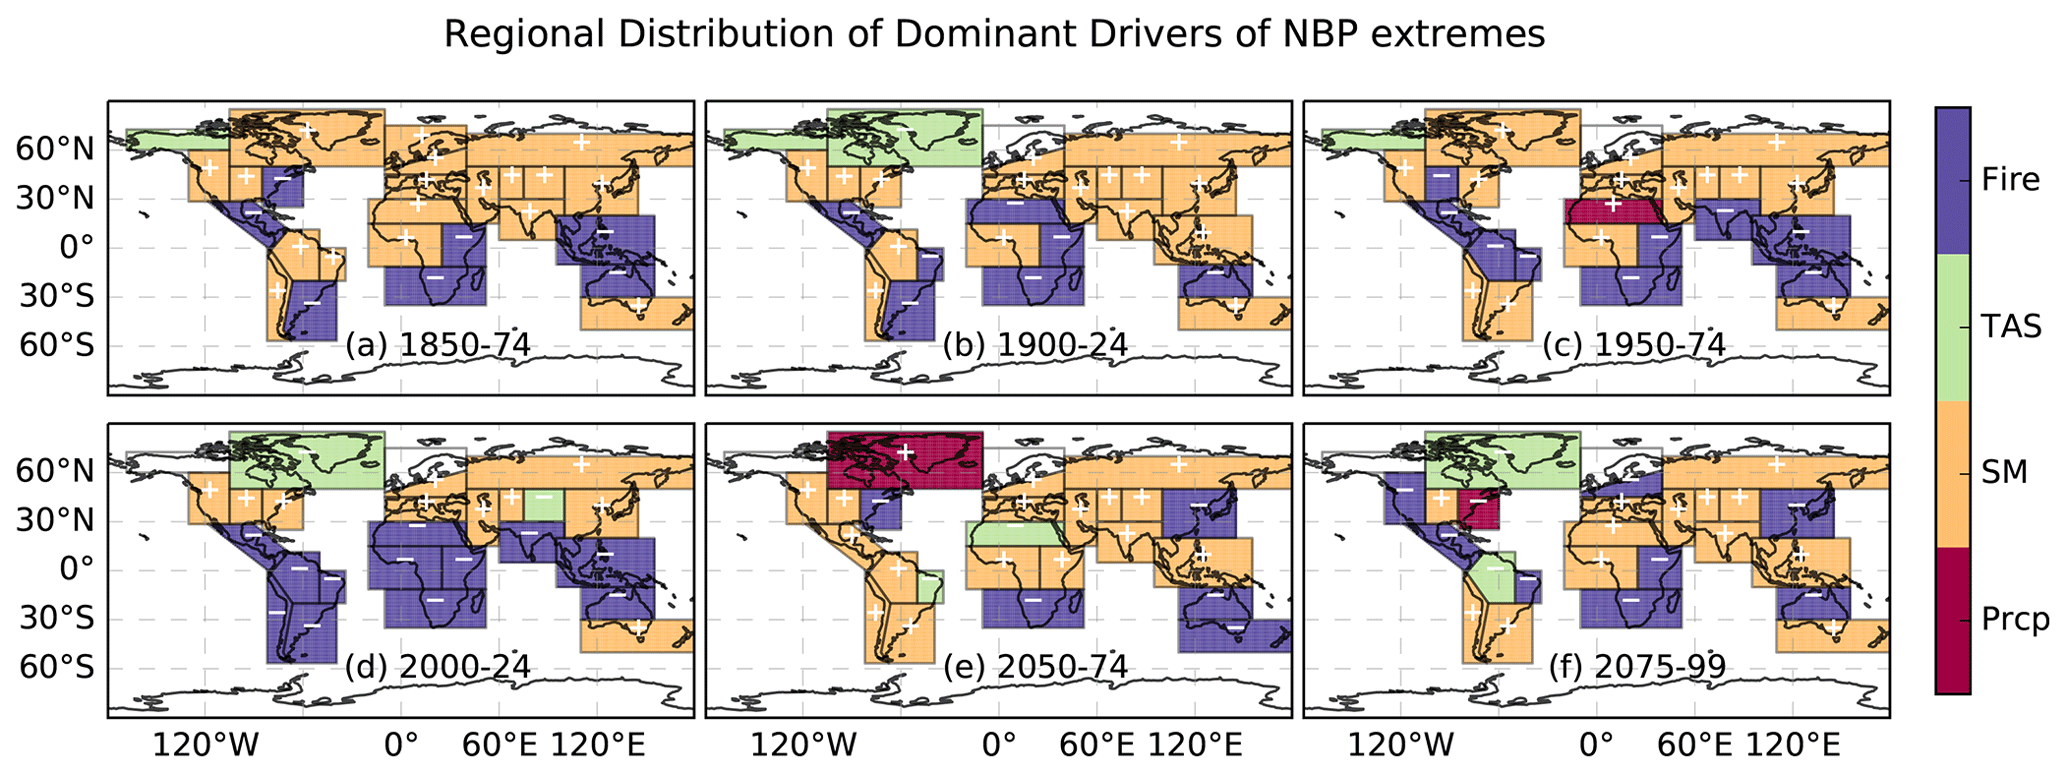
Figure 4Spatial distribution of dominant climate drivers across SREX regions. The color in every SREX region represents the most dominant climate driver causing carbon cycle extremes at a 1-month lag for the following periods: (a) 1850–1874, (b) 1900–1924, (c) 1950–2074, (d) 2000–2024, (e) 2050–2074, and (f) 2075–2099. The positive (“+”) and negative (“−”) signs within a region represent the correlation relationship of NBP extremes with every dominant climate drivers.
Rising CO2 emissions drive high temperature in the tropics and have the potential to hinder photosynthesis and vegetation growth, further discussed in Sect. 3.4. The changes in atmospheric circulation patterns might also influence the precipitation cycle, resulting in longer dry spells and increased fire risks with stomatal closure (Frank et al., 2015; Langenbrunner et al., 2019). The second-largest negative NBP extremes were experienced by arid and semi-arid regions with mostly grasslands (Fig. 3a). Several studies conclude that soil moisture causes an increase in dry days and have a significant negative effect on the carbon cycle driven by increasing droughts in arid, semi-arid, and dry temperate regions (Frank et al., 2015; Zscheischler et al., 2014; Pan et al., 2020). The regions of South Africa, Central America, and northern Australia witness the largest NBP extremes driven by fire. Extremes in the Amazon region were dominated by fire, soil moisture, and temperature in the 21st century.
3.3 Compound effect of climate drivers
The interactive effect of multiple climate drivers could lead to devastating ecological consequences as compound extremes often have a larger impact on the carbon cycle than the aggregate response of individual climate drivers (Zscheischler et al., 2018; Ribeiro et al., 2020; Pan et al., 2020). We used three broad classes of climate drivers, namely, moisture (dry vs. wet), temperature (hot vs. cold), and fire to study their compound effect. At most grid cells, NBP extremes were either positively correlated with anomalous precipitation and/or soil moisture and/or negatively correlated with temperature and/or fire. Figure 5 shows the compound climate drivers, both mutually exclusive and inclusive, that control NBP extremes over time. Mutually inclusive climate drivers represent the simultaneous occurrence of various climatic conditions that drive extreme events in NBP. Mutually exclusive climate drivers are those climatic conditions that do not occur at the same time to cause an extreme event. For example, if an extreme event in NBP is driven by both hot and dry conditions, the mutually exclusive climate driver is only hot–dry, and the mutually inclusive drivers are hot, dry, and hot–dry.
The largest fraction, about 50 %, of total NBP TCEs was attributed to the combined effect of hot–dry and fire events (Fig. 5). This implies that every other large extreme event associated with anomalous loss in biospheric productivity was driven by the interactive effect of water limitation, hot days (heat waves), both of which together could trigger fire and rapid loss of carbon. The second strongest exclusive compound driver was dry and fire, causing about 25 % of extremes. With increasing climate warming, the number of NBP extremes driven by hot and dry climatic conditions have increased, with about 10 % extremes driven exclusively by hot–dry events during 2050–2074.
Although the negative impact of water limitation (dry) on NBP extremes was the highest (driving inclusively about 90 % of all NBP extremes), rising atmospheric CO2 concentration and climate change led to an increasing number, 54 % during 1900–1924 to 62 % during 2050–2074, of NBP extremes driven inclusively by hot climatic conditions (Fig. 5). For the same periods, extremes driven inclusively by hot–dry rose by 8 %.
The effect of rising temperature on vegetation growth and carbon uptake is dependent on the geographical location. Pan et al. (2020) found that net ecosystem production had a negative sensitivity to warming across 81 % of the global vegetated land area during 2007–2018, and only the higher latitudes and Tibetan Plateau (TIB) had a positive sensitivity of NBP to temperature. Similarly, Marcolla et al. (2020) found a positive sensitivity of NBP to air temperature in higher latitudes and negative sensitivity in the tropics. Since the tropics have the largest standing biomass and high-latitude regions have the largest amount of stored carbon, understanding the contrasting impacts of climate change across these regions is important to understanding climate–carbon feedbacks. The next two sections will briefly discuss the changing characteristics of extremes in the tropics and at high latitudes.
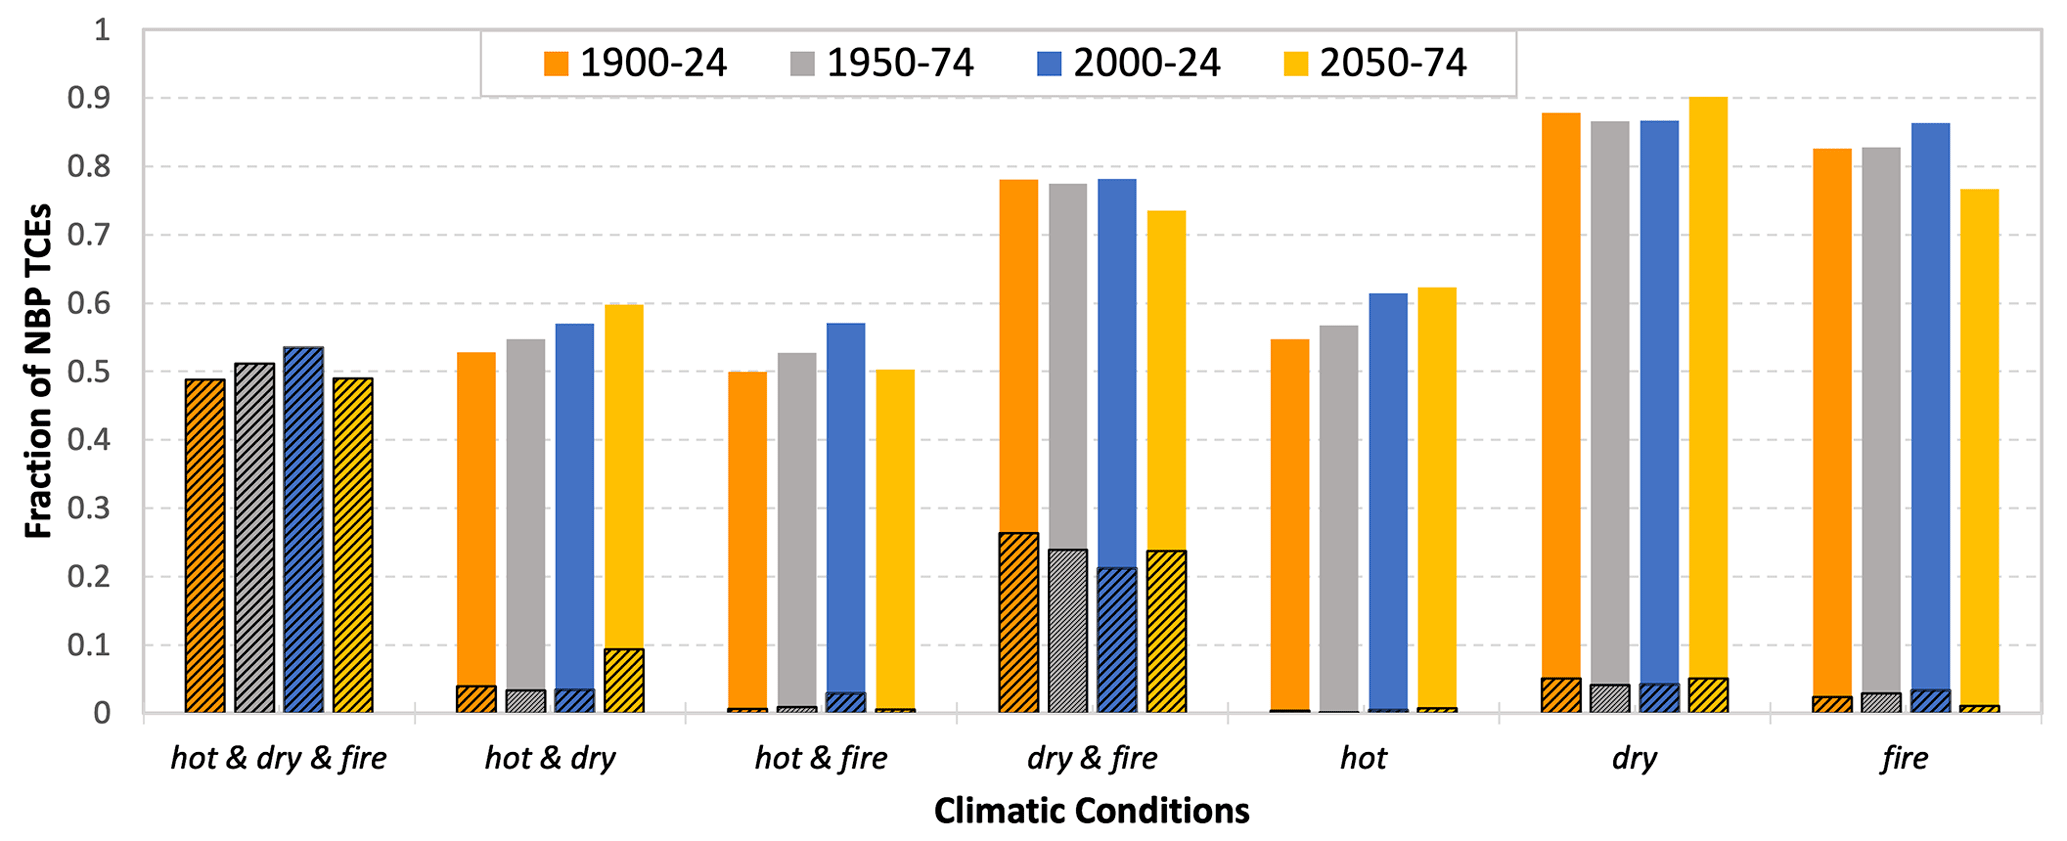
Figure 5Fractional distribution of carbon cycle time-continuous extremes (TCEs) driven by compound climate drivers at a lag of 1 month. The unhatched and hatched bars represent the mutually inclusive and exclusive compound and individual climate drivers, respectively. The exclusive climate drivers are always less than or equal to mutually inclusive drivers. The different colored bar represents following periods: 1900–1924, 1950–1974, 2000–2024, and 2050–2074 (from left to right bar). Most carbon cycle extremes are driven by the interactive effect of climate drivers.
3.4 Increasing temperature sensitivity and weakening terrestrial carbon sink across the tropics
Observation-based studies have reported a decline in the rate of carbon uptake in Amazonian forests, and similar declines in the African tropics are expected in the future (Hubau et al., 2020). Over long timescales, the rising atmospheric CO2 concentration may not necessarily lead to an increase in plant biomass (Walker et al., 2019) as respiration losses outpace carbon uptake. Increasingly frequent and stronger heat waves, droughts, and fires due to climate change are likely to cause the growth rate of NBP to flatten by the late 21st century (Fig. S9). They may lead to an eventual reduction in total stored carbon and a potential reversal for tropical vegetation from a net carbon sink to a carbon source. Toward the end of the 21st century (2075–2099), most of the SREX regions (23 of 26) were dominated by negative NBP extremes (Fig. 3b), especially in the tropical regions (CAM, AMZ, NEB, west Africa (WAF), east Africa (EAF), SAF, SAS, SEA, and north Australia (NAU)) (Fig. 2). During 2075–2099, almost all tropical SREX regions (with the exception of NAU) were dominated by negative NBP extremes.
Rising temperatures and atmospheric CO2 lead to an increasing trend for gross primary production (GPP) and net primary production (NPP) across most of the tropics. However, they are often also accompanied by increases in disturbance (such as droughts and fire), inducing plant mortality and increases in heterotrophic respiration that contribute to significant quantities of negative carbon fluxes from the ecosystem. With the exception of AMZ and SEA that continued to witness an increase in NBP in the model simulation, most of the tropical regions showed a saturation or decline in NBP toward the end of 21st century (Fig. S9). Analysis of temperature trends across tropical regions showed a significant trend toward warmer temperatures during warm (increase in 90th quantile) as well as cool (increase in 10th quantile) months of the year (Fig. S7). Rising daily temperatures hinder net carbon uptake by enhancing stomatal closure, under conditions of water stress, and increasing heterotrophic respiration (Fig. S9). The strength of 10 years of negative temperature sensitivity of NBP (see Sect. S1 in the Supplement) increased over time (Fig. 6a), suggesting an accelerated reduction in NBP growth with rising temperatures. The negative sensitivity values gradually increased from −20 to −33 GgC per month per ∘C for CAM, and −30 to −70 GgC per month per ∘C for AMZ during 1850–2100. South-East Asia (SEA) saw the highest negative NBP sensitivity of −207 GgC per month per ∘C to temperature by the end of the 21st century. The possible reasons for the large difference in the NBP sensitivity for the region of SEA compared to other tropical regions (e.g., AMZ) are the higher rate of decline in GPP sensitivity to temperature and the highest heterotrophic respiration (RH) sensitivity to temperature of about 90 GgC per month per ∘C for the region of SEA. Our findings were consistent with Pan et al. (2020), who analyzed seven terrestrial biosphere models and found that the region of SEA had the largest negative NPP sensitivity and positive RH sensitivity to temperature. Similar patterns were seen in other tropical regions, suggesting an increasing negative temperature sensitivity of terrestrial ecosystem productivity to carbon uptake in a warming world (Fig. 6a).
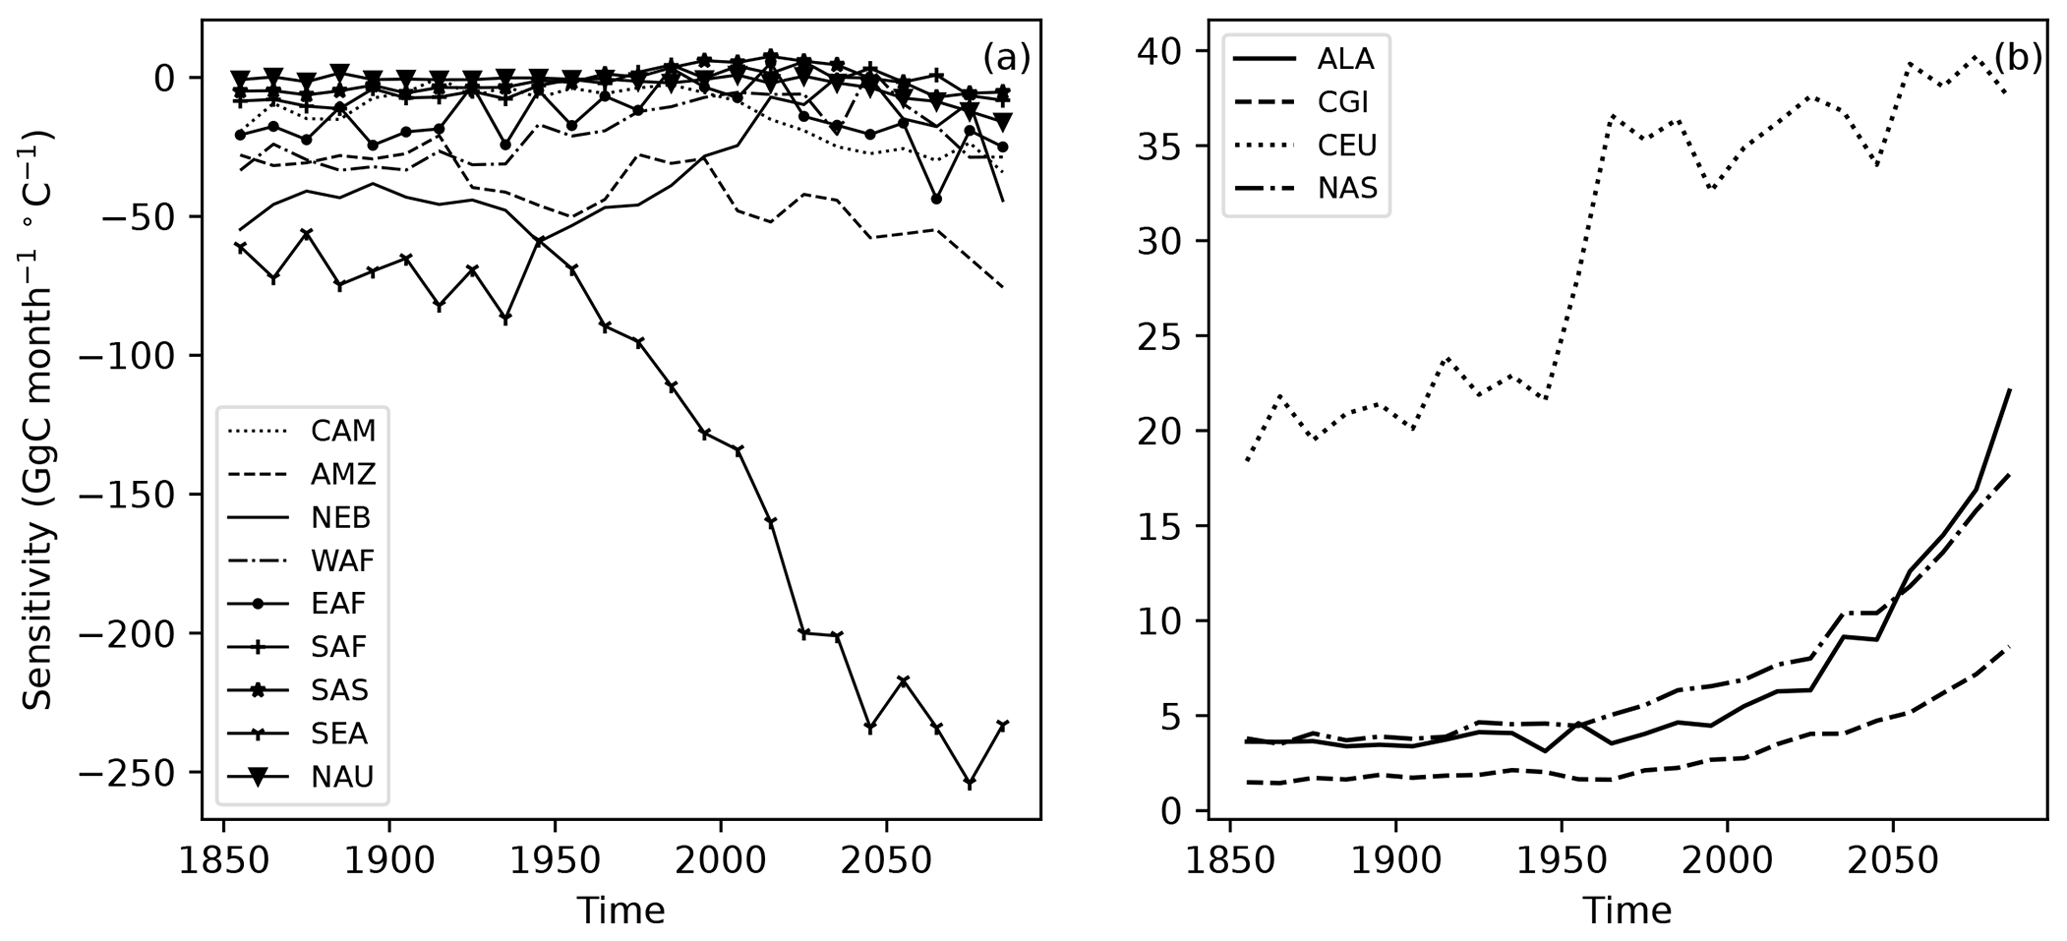
Figure 6Changing temperature sensitivity of detrended anomalies in NBP to detrended anomalies in surface temperature for 10-year time periods at multiple SREX regions. The regions at low latitudes (a) have negative NBP sensitivity to temperature anomalies and high latitudes and (b) have positive sensitivities.
3.5 High-latitude ecosystems can potentially become sources of carbon under warming climate
High-latitude ecosystems store large amounts of carbon below ground, and increasing exposure to warming and disturbance pose the risk of release of stored soil carbon (Marcolla et al., 2020) into the atmosphere. Warmer temperatures at high latitudes create favorable conditions for longer growing seasons, enhanced plant growth, and overall increases in greening. All high-latitude regions (ALA, CGI, CEU, NAS) showed a trend of positive and increasing NBP sensitivity to changes in air temperature (Sect. S1) over 1850–2100 (Fig. 6).
While the overall impact of warming at high latitudes is expected to increase plant productivity and carbon uptake, high-temperature anomalies increasingly induce negative NBP TCEs toward the end of the 21st century.
The negative responses of NBP to warm air temperature anomalies were found to occur most frequently during the summer months of July and August. For example, the 90th quantile temperature increased from 13 ∘C by 8 to 21 ∘C in the NAS region, while similar increases were observed for ALA, CGI, and CEU (Fig. S8d). With warming temperature trends, these periods of carbon losses in response to temperature extremes have an oversized impact on the overall carbon budget of high-latitude ecosystems. Toward the end of the 21st century, CGI and NAS showed strong declines in NBP, becoming a net source of carbon.
The accelerated warming of winter temperatures has large consequences for respiration losses in the Arctic and boreal regions (Natali et al., 2019; Jones et al., 1998; Commane et al., 2017). Natali et al. (2019) found that the total carbon loss from wintertime respiration in the Arctic was 60 % larger than the summer carbon uptake during 2003–2017, driven primarily by higher soil and air temperatures. Contrary to in situ observations, which show significant CO2 emissions at subzero temperatures, the current generation of process-based models shut off the respiration at subzero temperatures, thus underestimating the carbon losses during winter (Natali et al., 2019). The simulation we analyzed showed a 1.7-times-higher increase in winter air temperature (10th quantile) compared to summer air temperature (90th quantile) at high latitudes (Fig. S8). For example, in NAS, the 10th quantile temperature increased from −25 ∘C during 1900–1924 by 14 to −11 ∘C during 2075–2099 (Fig. S8d). This enhanced rate of warming, especially during winter, resulted in rising wintertime total ecosystem (autotrophic and heterotrophic) respiration, turning some regions to net sources of carbon (Fig. S10).
Increases in warm and cold season temperatures induce a potential risk of losing a carbon sink and an accelerated release of stored carbon into the atmosphere. The increase in heterotrophic respiration is likely due to increased thaw of permafrost (Turetsky et al., 2020), a larger litter pool due to accelerated NPP, and higher microbial decomposition during the extended warm season. As a result, the peak of NBP and NEP started to sharply decline toward the end of 21st century. The CGI region is expected to become a carbon source by the year 2100, and the NBP of the CEU region was gradually decreasing after 1975. The NAS region has shown a reduction in total NBP during 2075–2099, breaking the consistently increasing trend since 1850. With accelerated rising winter temperatures (Fig. S8), declining NEP and NBP (Fig. S10), and underestimation of respiration in the current process models, the losses in carbon uptake in the Arctic and at high latitudes in general are expected to be higher in the future.
The increasing frequency of climate change-driven extremes – such as fire, drought, and heat waves – has the potential to cause large losses of carbon from terrestrial biomass and soils. The increasing frequency and magnitude of negative NBP extremes and saturation of NBP toward the end of the 21st century suggests that terrestrial ecosystems may increasingly lose the ability to sequester anthropogenic carbon and ameliorate the impact of climate extremes and change. Under a changing climate, parts of the globe are expected to experience enhanced vegetation growth and positive extremes in NBP; however, they are far outpaced by the frequency and intensity of negative extremes and associated losses in NBP. At the global scale, reductions in deforestation and enhanced CO2 fertilization lead to an increase in NBP. The globally integrated NBP in the CESM2 reached a peak around 2070, followed by a large decline toward the end of the 21st century. These losses in NBP were particularly large in the carbon-rich tropical region, followed by arid and semi-arid regions of the world. During 2075–2099, 23 out of 26 SREX regions were dominated by negative NBP extreme events, especially in tropical regions. The increasing intensity and magnitude of negative extremes in NBP toward the end of the 21st century and beyond could lead to widespread declines in vegetation and loss of terrestrial carbon storage, and it could increasingly turn terrestrial ecosystems into a net source of carbon.
Extremes in the carbon cycle, driven by the extremes in environmental conditions, impact vegetation health and productivity. We analyzed anomalies in three primary environmental drivers (hot, dry and fire) of NBP extremes. Negative anomalies in soil moisture, causing widespread droughts and water stress in vegetation, were identified as the most dominant driver of negative NBP extremes, affecting almost half of the grid cells experiencing NBP extremes. The interactive and compounded impact of simultaneous anomalies in multiple drivers has especially large impacts on vegetation productivity, beyond the individual impacts of the variables. Extreme temperature anomalies compounded with dry conditions impact vegetation productivity, more than the sum of individual temperature and moisture anomalies. They also increase the risk and occurrence of fires. The compound effect of all three climate drivers (hot, dry and fire) causes the largest fraction of NBP TCEs. In the tropics, the growth rate of NBP was decreasing, while the magnitude of negative extremes in NBP and the negative temperature sensitivity of NBP were strengthening over time. Large standing carbon stocks (fuel load) with hot and dry climate (fire weather conditions) increase the fire risk and potential loss of carbon stock during negative NBP extremes.
In the northern high latitudes, accelerated warming leads to permafrost thaw and release of belowground carbon, increasing the likelihood of reversal of the ecosystem to a net source of carbon over time.
This study analyzed climate-driven NBP extremes using one Earth system model, CESM2, from 1850 to 2100. Using only CESM2 simulations helped us to delve deeper into the climate–carbon feedbacks across different periods and spatial resolutions, as well as to identify model artifacts. However, the current study lacks comparison to observations, other shared socioeconomic pathways, and other Earth system models. Future work should use multi-model analysis to evaluate the agreement among different Earth system models about the magnitude, frequency, and spatial distribution of NBP extremes and their attribution to individual and compound climate drivers. Longer-term simulations are needed to analyze the climate–carbon feedback post-2100, when the difference between the rate of CO2 emissions and terrestrial carbon uptake is expected to increase.
Data analysis was performed in Python, and the analysis codes are publicly available on https://doi.org/10.5281/zenodo.7854623 (Sharma, 2023).
The data used here are from the CMIP6 simulations performed by the various modeling groups and available from the CMIP6 archive maintained by Earth System Grid Federation (ESGF) at the CMIP6 archive site (https://doi.org/10.22033/ESGF/CMIP6.7768, Danabasoglu, 2019). Searching for a given model, a given experiment, and a given variable name will yield the link to the dataset that can be downloaded.
The supplement related to this article is available online at: https://doi.org/10.5194/bg-20-1829-2023-supplement.
BS designed the study with inputs from JK, FMH, and ARG. BS developed the statistical analysis methodology and codes, performed the data analysis, and wrote the manuscript with input from all co-authors.
The authors declare that they have no conflict of interest.
Publisher’s note: Copernicus Publications remains neutral with regard to jurisdictional claims in published maps and institutional affiliations.
We acknowledge the World Climate Research Programme, which, through its Working Group on Coupled Modeling, coordinated and promoted CMIP6. We thank the climate modeling groups for producing and making available their model output, the Earth System Grid Federation (ESGF) for archiving the data and providing access, and the multiple funding agencies that support CMIP6 and ESGF. We thank DOE's RGMA program area, the data management program, and NERSC for making this coordinated CMIP6 analysis activity possible. This research used resources of the National Energy Research Scientific Computing Center (NERSC), a U.S. Department of Energy Office of Science User Facility located at Lawrence Berkeley National Laboratory, operated under contract no. DE-AC02-05CH11231 for project m2467.
This research was supported by the Reducing Uncertainties in Biogeochemical Interactions through Synthesis and Computation (RUBISCO) Science Focus Area, which is sponsored by the Regional and Global Model Analysis (RGMA) activity of the Earth & Environmental Systems Modeling (EESM) Program in the Earth and Environmental Systems Sciences Division (EESSD) of the Office of Biological and Environmental Research (BER) in the US Department of Energy Office of Science. The authors from ORNL are supported by the U.S. Department of Energy, Office of Science, Office of Biological and Environmental Research. ORNL is managed by UT-Battelle, LLC, for the DOE under contract DE-AC05-00OR22725.
This paper was edited by Kirsten Thonicke and reviewed by two anonymous referees.
Ault, T. R.: On the essentials of drought in a changing climate, Science, 368, 256–260, https://doi.org/10.1126/science.aaz5492, 2020. a, b, c
Bonan, G.: Ecological Climatology: Concepts and Applications, Cambridge University Press, 3 edn., https://doi.org/10.1017/CBO9781107339200, 2015. a
Commane, R., Lindaas, J., Benmergui, J., Luus, K. A., Chang, R. Y.-W., Daube, B. C., Euskirchen, E. S., Henderson, J. M., Karion, A., Miller, J. B., Miller, S. M., Parazoo, N. C., Randerson, J. T., Sweeney, C., Tans, P., Thoning, K., Veraverbeke, S., Miller, C. E., and Wofsy, S. C.: Carbon dioxide sources from Alaska driven by increasing early winter respiration from Arctic tundra, P. Natl. Acad. Sci. USA, 114, 5361–5366, https://doi.org/10.1073/pnas.1618567114, 2017. a
Danabasoglu, G.: NCAR CESM2 model output prepared for CMIP6 ScenarioMIP ssp585, Version 20200530, Earth System Grid Federation, https://doi.org/10.22033/ESGF/CMIP6.7768, 2019. a
Danabasoglu, G., Lamarque, J.-F., Bacmeister, J., Bailey, D. A., DuVivier, A. K., Edwards, J., Emmons, L. K., Fasullo, J., Garcia, R., Gettelman, A., Hannay, C., Holland, M. M., Large, W. G., Lauritzen, P. H., Lawrence, D. M., Lenaerts, J. T. M., Lindsay, K., Lipscomb, W. H., Mills, M. J., Neale, R., Oleson, K. W., Otto-Bliesner, B., Phillips, A. S., Sacks, W., Tilmes, S., van Kampenhout, L., Vertenstein, M., Bertini, A., Dennis, J., Deser, C., Fischer, C., Fox-Kemper, B., Kay, J. E., Kinnison, D., Kushner, P. J., Larson, V. E., Long, M. C., Mickelson, S., Moore, J. K., Nienhouse, E., Polvani, L., Rasch, P. J., and Strand, W. G.: The Community Earth System Model Version 2 (CESM2), J. Adv. Model. Earth Sys., 12, e2019MS001916, https://doi.org/10.1029/2019MS001916, 2020. a
Diffenbaugh, N. S., Singh, D., Mankin, J. S., Horton, D. E., Swain, D. L., Touma, D., Charland, A., Liu, Y., Haugen, M., Tsiang, M., and Rajaratnam, B.: Quantifying the influence of global warming on unprecedented extreme climate events, P. Natl. Acad. Sci. USA, 114, 4881–4886, https://doi.org/10.1073/pnas.1618082114, 2017. a, b
Dormann, C. F., Elith, J., Bacher, S., Buchmann, C., Carl, G., Carré, G., Marquéz, J. R. G., Gruber, B., Lafourcade, B., Leitão, P. J., Münkemüller, T., McClean, C., Osborne, P. E., Reineking, B., Schröder, B., Skidmore, A. K., Zurell, D., and Lautenbach, S.: Collinearity: a review of methods to deal with it and a simulation study evaluating their performance, Ecography, 36, 27–46, https://doi.org/10.1111/j.1600-0587.2012.07348.x, 2013. a
Flach, M., Brenning, A., Gans, F., Reichstein, M., Sippel, S., and Mahecha, M. D.: Vegetation modulates the impact of climate extremes on gross primary production, Biogeosciences, 18, 39–53, https://doi.org/10.5194/bg-18-39-2021, 2021. a
Frank, D., Reichstein, M., Bahn, M., Thonicke, K., Frank, D., Mahecha, M. D., Smith, P., van der Velde, M., Vicca, S., Babst, F., Beer, C., Buchmann, N., Canadell, J. G., Ciais, P., Cramer, W., Ibrom, A., Miglietta, F., Poulter, B., Rammig, A., Seneviratne, S. I., Walz, A., Wattenbach, M., Zavala, M. A., and Zscheischler, J.: Effects of climate extremes on the terrestrial carbon cycle: concepts, processes and potential future impacts, Global Change Biol., 21, 2861–2880, https://doi.org/10.1111/gcb.12916, 2015. a, b, c, d, e, f, g, h, i, j, k
Friedlingstein, P., Jones, M. W., O'Sullivan, M., Andrew, R. M., Hauck, J., Peters, G. P., Peters, W., Pongratz, J., Sitch, S., Le Quéré, C., Bakker, D. C. E., Canadell, J. G., Ciais, P., Jackson, R. B., Anthoni, P., Barbero, L., Bastos, A., Bastrikov, V., Becker, M., Bopp, L., Buitenhuis, E., Chandra, N., Chevallier, F., Chini, L. P., Currie, K. I., Feely, R. A., Gehlen, M., Gilfillan, D., Gkritzalis, T., Goll, D. S., Gruber, N., Gutekunst, S., Harris, I., Haverd, V., Houghton, R. A., Hurtt, G., Ilyina, T., Jain, A. K., Joetzjer, E., Kaplan, J. O., Kato, E., Klein Goldewijk, K., Korsbakken, J. I., Landschützer, P., Lauvset, S. K., Lefèvre, N., Lenton, A., Lienert, S., Lombardozzi, D., Marland, G., McGuire, P. C., Melton, J. R., Metzl, N., Munro, D. R., Nabel, J. E. M. S., Nakaoka, S.-I., Neill, C., Omar, A. M., Ono, T., Peregon, A., Pierrot, D., Poulter, B., Rehder, G., Resplandy, L., Robertson, E., Rödenbeck, C., Séférian, R., Schwinger, J., Smith, N., Tans, P. P., Tian, H., Tilbrook, B., Tubiello, F. N., van der Werf, G. R., Wiltshire, A. J., and Zaehle, S.: Global Carbon Budget 2019, Earth Syst. Sci. Data, 11, 1783–1838, https://doi.org/10.5194/essd-11-1783-2019, 2019. a, b, c
Golyandina, N., Nekrutkin, V., and Zhigljavsky, A. A.: Analysis of Time Series Structure: SSA and Related Techniques, Chapman and Hall/CRC, 1 edn., https://doi.org/10.1201/9781420035841, 2001. a
Grose, M. R., Narsey, S., Delage, F. P., Dowdy, A. J., Bador, M., Boschat, G., Chung, C., Kajtar, J. B., Rauniyar, S., Freund, M. B., Lyu, K., Rashid, H., Zhang, X., Wales, S., Trenham, C., Holbrook, N. J., Cowan, T., Alexander, L., Arblaster, J. M., and Power, S.: Insights From CMIP6 for Australia's Future Climate, Earth's Future, 8, e2019EF001469, https://doi.org/10.1029/2019EF001469, 2020. a
Hubau, W., Lewis, S. L., Phillips, O. L., Affum-Baffoe, K., Beeckman, H., Cuní-Sanchez, A., Daniels, A. K., Ewango, C. E., Fauset, S., Mukinzi, J. M., et al.: Asynchronous carbon sink saturation in African and Amazonian tropical forests, Nature, 579, 80–87, https://doi.org/10.1038/s41586-020-2035-0, 2020. a, b
Jones, M. H., Fahnestock, J. T., Walker, D. A., Walker, M. D., and Welker, J. M.: Carbon Dioxide Fluxes in Moist and Dry Arctic Tundra during the Snow-free Season: Responses to Increases in Summer Temperature and Winter Snow Accumulation, Arc. Alp. Res., 30, 373–380, https://doi.org/10.1080/00040851.1998.12002912, 1998. a
Langenbrunner, B., Pritchard, M. S., Kooperman, G. J., and Randerson, J. T.: Why Does Amazon Precipitation Decrease When Tropical Forests Respond to Increasing CO2?, Earth's Future, 7, 450–468, https://doi.org/10.1029/2018EF001026, 2019. a
Lawrence, D. M., Fisher, R. A., Koven, C. D., W, K., Swenson, S. C., and Vertenstein, M.: Technical Description of version 5.0 of the Community Land Model (CLM), https://www.cesm.ucar.edu/models/cesm2/land/CLM50_Tech_Note.pdf (last access: 15 Februar 2021), 2018. a
Lawrence, D. M., Fisher, R. A., Koven, C. D., Oleson, K. W., Swenson, S. C., Bonan, G., Collier, N., Ghimire, B., van Kampenhout, L., Kennedy, D., et al.: The Community Land Model version 5: Description of new features, benchmarking, and impact of forcing uncertainty, J. Adv. Model. Earth Sys., 11, 4245–4287, https://doi.org/10.1029/2018MS001583, 2019. a, b, c
Li, F., Levis, S., and Ward, D. S.: Quantifying the role of fire in the Earth system – Part 1: Improved global fire modeling in the Community Earth System Model (CESM1), Biogeosciences, 10, 2293–2314, https://doi.org/10.5194/bg-10-2293-2013, 2013. a, b
Liu, L., Gudmundsson, L., Hauser, M., Qin, D., Li, S., and Seneviratne, S. I.: Soil moisture dominates dryness stress on ecosystem production globally, Nat. Commun., 11, 1–9, 2020. a
Marcolla, B., Migliavacca, M., Rödenbeck, C., and Cescatti, A.: Patterns and trends of the dominant environmental controls of net biome productivity, Biogeosciences, 17, 2365–2379, https://doi.org/10.5194/bg-17-2365-2020, 2020. a, b, c
Natali, S. M., Watts, J. D., Rogers, B. M., Potter, S., Ludwig, S. M., Selbmann, A.-K., Sullivan, P. F., Abbott, B. W., Arndt, K. A., Birch, L., Björkman, M. P., Bloom, A. A., Celis, G., Christensen, T. R., Christiansen, C. T., Commane, R., Cooper, E. J., Crill, P., Czimczik, C., Davydov, S., Du, J., Egan, J. E., Elberling, B., Euskirchen, E. S., Friborg, T., Genet, H., Göckede, M., Goodrich, J. P., Grogan, P., Helbig, M., Jafarov, E. E., Jastrow, J. D., Kalhori, A. A. M., Kim, Y., Kimball, J. S., Kutzbach, L., Lara, M. J., Larsen, K. S., et al.: Large loss of CO2 in winter observed across the northern permafrost region, Nat. Clim. Chang. 9, 852–857, https://doi.org/10.1038/s41558-019-0592-8, 2019. a, b, c
Pan, S., Yang, J., Tian, H., Shi, H., Chang, J., Ciais, P., Francois, L., Frieler, K., Fu, B., Hickler, T., Ito, A., Nishina, K., Ostberg, S., Reyer, C. P., Schaphoff, S., Steinkamp, J., and Zhao, F.: Climate Extreme Versus Carbon Extreme: Responses of Terrestrial Carbon Fluxes to Temperature and Precipitation, J. Geophys. Res.-Biogeo., 125, e2019JG005252, https://doi.org/10.1029/2019JG005252, 2020. a, b, c, d, e, f, g, h, i
Piao, S., Zhang, X., Chen, A., Liu, Q., Lian, X., Wang, X., Peng, S., and Wu, X.: The impacts of climate extremes on the terrestrial carbon cycle: A review, Sci. China Earth Sci., 62, 1551–1563, 2019. a, b
Reichstein, M., Bahn, M., Ciais, P., Frank, D., Mahecha, M. D., Seneviratne, S. I., Zscheischler, J., Beer, C., Buchmann, N., Frank, D. C., Papale, D., Rammig, A., Smith, P., Thonicke, K., van der Velde, M., Vicca, S., Walz, A., and Wattenbach, M.: Climate extremes and the carbon cycle, Nature, 500, 287–295, https://doi.org/10.1038/nature12350, 2013. a, b, c, d, e
Ribeiro, A. F. S., Russo, A., Gouveia, C. M., Páscoa, P., and Zscheischler, J.: Risk of crop failure due to compound dry and hot extremes estimated with nested copulas, Biogeosciences, 17, 4815–4830, https://doi.org/10.5194/bg-17-4815-2020, 2020. a, b
Seneviratne, S. I., Nicholls, N., Easterling, D., Goodess, C. M., Kanae, S., Kossin, J., Luo, Y., Marengo, J., McInnes, K., Rahimi, M., Reichstein, M., Sorteberg, A., Vera, C., and Zhang, X.: Changes in Climate Extremes and their Impacts on the Natural Physical Environment, in: A Special Report of Working Groups I and II of the Intergovernmental Panel on Climate Change, edited by: Field, C. B., Barros, V., Stocker, T. F., Qin, D., Dokken, D. J., Ebi, K. L., Mastrandrea, M. D., Mach, K. J., Plattner, G.-K., Allen, S. K., Tignor, M., and Midgley, P. M., Cambridge Univ. Press, Cambridge, U.K., New York, IPCC, 109–230, 2012. a, b
Sharma, B.: Codes for Carbon Cycle Extremes Accelerate Weakening of the Land Carbon Sink in the Late 21st Century, in Biogeosciences Discussions, Zenodo [code], https://doi.org/10.5281/zenodo.7854623, last aceess: 22 April 2023. a
Sharma, B., Kumar, J., Collier, N., Ganguly, A. R., and Hoffman, F. M.: Quantifying Carbon Cycle Extremes and Attributing Their Causes Under Climate and Land Use and Land Cover Change From 1850 to 2300, J. Geophys. Res.-Biogeo., 127, e2021JG006738, https://doi.org/10.1029/2021JG006738, 2022a. a, b, c, d, e
Sharma, B., Kumar, J., Ganguly, A. R., and Hoffman, F. M.: Using Image Processing Techniques to Identify and Quantify Spatiotemporal Carbon Cycle Extremes, in: 2022 IEEE International Conference on Data Mining Workshops (ICDMW), 1136–1143, https://doi.org/10.1109/ICDMW58026.2022.00148, 2022b. a
Turetsky, M. R., Abbott, B. W., Jones, M. C., Anthony, K. W., Olefeldt, D., Schuur, E. A. G., Grosse, G., Kuhry, P., Hugelius, G., Koven, C., Lawrence, D. M., Gibson, C., Sannel, A. B. K., and McGuire, A. D.: Carbon release through abrupt permafrost thaw, Nat. Geosci., 13, 138–143, https://doi.org/10.1038/s41561-019-0526-0, 2020. a
von Buttlar, J., Zscheischler, J., Rammig, A., Sippel, S., Reichstein, M., Knohl, A., Jung, M., Menzer, O., Arain, M. A., Buchmann, N., Cescatti, A., Gianelle, D., Kiely, G., Law, B. E., Magliulo, V., Margolis, H., McCaughey, H., Merbold, L., Migliavacca, M., Montagnani, L., Oechel, W., Pavelka, M., Peichl, M., Rambal, S., Raschi, A., Scott, R. L., Vaccari, F. P., van Gorsel, E., Varlagin, A., Wohlfahrt, G., and Mahecha, M. D.: Impacts of droughts and extreme-temperature events on gross primary production and ecosystem respiration: a systematic assessment across ecosystems and climate zones, Biogeosciences, 15, 1293–1318, https://doi.org/10.5194/bg-15-1293-2018, 2018. a, b, c
Walker, A. P., De Kauwe, M. G., Medlyn, B. E., Zaehle, S., Iversen, C. M., Asao, S., Guenet, B., Harper, A., Hickler, T., Hungate, B. A., et al.: Decadal biomass increment in early secondary succession woody ecosystems is increased byCO2 enrichment, Nat. Commun., 10, 1–13, https://doi.org/10.1038/s41467-019-08348-1, 2019. a
Wu, Z., K. Schneider, E., Kirtman, B., Sarachik, E., Huang, N., and J. Tucker, C.: The modulated annual cycle: An alternative reference frame for climate anomalies, Clim. Dynam., 31, 823–841, https://doi.org/10.1007/s00382-008-0437-z, 2008. a
Zhang, T., Xu, M., Xi, Y., Zhu, J., Tian, L., Zhang, X., Wang, Y., Li, Y., Shi, P., Yu, G., Sun, X., and Zhang, Y.: Lagged climatic effects on carbon fluxes over three grassland ecosystems in China, J. Plant Ecol., 8, 291–302, https://doi.org/10.1093/jpe/rtu026, 2014. a
Zscheischler, J., Mahecha, M. D., von Buttlar, J., Harmeling, S., Jung, M., Rammig, A., Randerson, J. T., Schölkopf, B., Seneviratne, S. I., Tomelleri, E., Zaehle, S., and Reichstein, M.: A few extreme events dominate global interannual variability in gross primary production, Environ. Res. Lett., 9, 035001, https://doi.org/10.1088/1748-9326/9/3/035001, 2014. a, b, c, d, e
Zscheischler, J., Westra, S., Van Den Hurk, B. J., Seneviratne, S. I., Ward, P. J., Pitman, A., Aghakouchak, A., Bresch, D. N., Leonard, M., Wahl, T., and Zhang, X.: Future climate risk from compound events, Nat. Clim. Change, 8, 469–477, https://doi.org/10.1038/s41558-018-0156-3, 2018. a, b, c
The requested paper has a corresponding corrigendum published. Please read the corrigendum first before downloading the article.
- Article
(3787 KB) - Full-text XML
- Corrigendum
-
Supplement
(13800 KB) - BibTeX
- EndNote