the Creative Commons Attribution 4.0 License.
the Creative Commons Attribution 4.0 License.
 | 16 Jan 2023
Peatlands and their carbon dynamics in northern high latitudes from 1990 to 2300: a process-based biogeochemistry model analysis
Bailu Zhao
Northern peatlands have been a large C sink during the Holocene, but whether they will keep being a C sink under future climate change is uncertain. This study simulates the responses of northern peatlands to future climate until 2300 with a Peatland version Terrestrial Ecosystem Model (PTEM). The simulations are driven with two sets of CMIP5 climate data (IPSL-CM5A-LR and bcc-csm1-1) under three warming scenarios (RCPs 2.6, 4.5 and 8.5). Peatland area expansion, shrinkage, and C accumulation and decomposition are modeled. In the 21st century, northern peatlands are projected to be a C source of 1.2–13.3 Pg C under all climate scenarios except for RCP 2.6 of bcc-csm1-1 (a sink of 0.8 Pg C). During 2100–2300, northern peatlands under all scenarios are a C source under IPSL-CM5A-LR scenarios, being larger sources than bcc-csm1-1 scenarios (5.9–118.3 vs. 0.7–87.6 Pg C). C sources are attributed to (1) the peatland water table depth (WTD) becoming deeper and permafrost thaw increasing decomposition rate; (2) net primary production (NPP) not increasing much as climate warms because peat drying suppresses net N mineralization; and (3) as WTD deepens, peatlands switching from moss–herbaceous dominated to moss–woody dominated, while woody plants require more N for productivity. Under IPSL-CM5A-LR scenarios, northern peatlands remain as a C sink until the pan-Arctic annual temperature reaches −2.6 to −2.89 ∘C, while this threshold is −2.09 to −2.35 ∘C under bcc-csm1-1 scenarios. This study predicts a northern peatland sink-to-source shift in around 2050, earlier than previous estimates of after 2100, and emphasizes the vulnerability of northern peatlands to climate change.
- Article
(3590 KB) - Full-text XML
-
Supplement
(8824 KB) - BibTeX
- EndNote


Peatlands are an ecosystem type that characteristically has more than 30 cm peat thickness comprised of more than 30 % organic materials within the peat layer (Finlayson and Milton, 2018). The formation of this thick organic soil layer requires wet and low-oxygen conditions that prevent dead plant litter from being fully decomposed (Finlayson and Milton, 2018). Around 85 % of global peatlands C storage is in northern high-latitude regions (415 ± 150 Pg C) (Nichols and Peteet, 2019; Turunen et al., 2002) where low temperature and relatively high precipitation create favorable conditions for peat accumulation (Xu et al., 2018; Hugelius et al., 2020).
Peatlands are vulnerable to disturbances induced by climate warming (Loisel et al., 2021), especially when the warming in the Arctic region is almost 3 times as much as the global average (GISTEMP-Team, 2021). First, warming influences northern terrestrial ecosystem vegetation productivity by increasing spring photosynthesis, triggering spring onset earlier and delaying autumn green down (Piao et al., 2008; Helbig et al., 2017; Richardson et al., 2018). Second, warming could induce drier Arctic conditions with 21 % of lake count and 2 % of lake area decrease found from the 1960s to the present (Finger Higgens et al., 2019), and peatland water table drawdown would result in a net increase in greenhouse gas emissions of 0.86 Gt CO2 eq. yr−1 by 2100 (Huang et al., 2021). Third, decomposition rate increases under higher temperature and previous studies found positive linear correlations between warming and net C loss rate of 31.3 gC m−2 yr−1 ∘C−1 (Hanson et al., 2020). Fourth, permafrost thaw under warming conditions will expose previously frozen C for dissolving and decomposition (Gandois et al., 2019). To date, multiple modeling studies have explored northern peatland responses to future climate changes (Loisel et al., 2021; Qiu et al., 2020; Chaudhary et al., 2020; Müller and Joos, 2021). However, the projection of northern peatland C sink capacity during the 21st century is highly diverse including sink-to-source switch (Chaudhary et al., 2017; Müller and Joos, 2021), higher sink capacity under mild climate changes (Qiu et al., 2020) and the reduced C sink capacity (Chaudhary et al., 2020).
Given the uncertainties in northern peatland response to future climate changes, modeling peatland C dynamics including peatland extent changes could improve the accuracy of future projection. In this study, a process-base model, the Peatland Terrestrial Ecosystem Model (PTEM 2.2), is used to address this issue. PTEM 2.0 has been modified in terms of plant functional type (PFT), peat accumulation and decomposition, fen—bog transition, and soil thermal module to better represent peatland ecosystem processes (Zhao et al., 2022b). The revised PTEM 2.0 is able to capture the peat core age–depth profile at site level (Zhao et al., 2022b) and has been further modified and applied to simulate Holocene (PTEM 2.1, 15 ka–1990) pan-Arctic peatland accumulation and expansion at 0.5∘ resolution (Zhao et al., 2022a). The estimated pan-Arctic peatland C stock is 396–421 Pg C, and the Holocene average C accumulation rate (CAR) is 22.9 g C m−2 yr−1 (Zhao et al., 2022a). The values and spatial pattern of soil C stock are in a close agreement with Qiu et al. (2019), Hugelius et al. (2020), Spahni et al. (2013) and Hugelius et al. (2013), and the values and temporal pattern of CAR are consistent with Loisel et al. (2014), Chaudhary et al. (2020) and Nichols and Peteet (2019). In this study, the results of the Holocene simulation are used as the initial condition for the future simulation.
The methods used in Holocene simulation cannot be applied directly to future simulation due to two issues. First, previous studies on future peatland C dynamics are mostly based on fixed peatland extent (Loisel et al., 2021; Chaudhary et al., 2020), but future peatland extent is likely to vary under climate change. To address this issue, we enhance PTEM 2.2 to simulate wetland dynamic extent during 1990–2300 at sub-grid-cell scales. Notably, although the spatially explicit peat expansion process was considered in the Holocene simulation, the sub-grid-cell expansion trend was simply derived from the fitted curve of existing pan-Arctic peat basal dates (Zhao et al., 2022a). It is problematic to apply this fitted trend to future simulation since severe climate changes may interrupt the Holocene peat expansion pattern. Therefore, a different approach of estimating peatland extent needs to be developed for future simulation.
Second, in PTEM 2.2, peatland water table depth (WTD) and nutrient availability is influenced by run-on, which is the water input from groundwater or adjacent water bodies into the peatlands. The previous model version, PTEM 2.1, assumes run-on is a function of peat thickness, and the theoretical maximum run-on corresponding with 0 cm peat thickness. Under relatively stable climate conditions during the Holocene after peat initiation, the theoretical maximum run-on is assumed to be a constant (i.e., parameter) and thereby run-on solely depends on peat thickness (Zhao et al., 2022a). However, when climate becomes wetter or drier in the future, the theoretical maximum run-on could vary significantly and the original PTEM 2.1 assumption becomes problematic. Therefore, it is necessary to revise the hydrology module of PTEM 2.2 such that run-on could respond to climate change.
To address these two issues, a TOPMODEL approach is used (Lu and Zhuang, 2012). The TOPMODEL approach downscales coarse grid cell WTD into finer resolutions given the sub-grid-cell topographic wetness index (TWI) and decay parameter (f) (Beven and Kirkby, 1979). Previous studies have combined the Terrestrial Ecosystem Model (TEM), TOPMODEL and a variable infiltration capacity (VIC) model to estimate Alaska Yukon River basin methane emissions using 1 km resolution WTD interpolated from 30 km resolution (e.g., Lu and Zhuang, 2012). By applying TOPMODEL, we are able to estimate the dynamics of (a) sub-grid-cell WTD, (b) the spatially explicit wetland fraction defined by annual WTD threshold (25 cm, Fan et al., 2013), (c) sub-grid-cell peat accumulation and decomposition given interpolated WTD, and (d) the spatially explicit peatland fraction defined by the peat thickness threshold (30 cm, Finlayson and Milton, 2018). Furthermore, soil moisture can be estimated from WTD, with which we can estimate run-on from the difference between interpolated WTD and simulated WTD without run-on.
With peatland dynamics being simulated both horizontally (i.e., peatlands expansion and shrink) and vertically (i.e., peat accumulation and decomposition), this study aims to answer the following questions. (a) How will the C sink of pan-Arctic peatlands change during 1990-2300? (b) What are the major drivers for these changes? (c) How does the pan-Arctic peatlands C sink respond to unit temperature and precipitation increase? (d) What is the threshold temperature and precipitation for pan-Arctic peatland C sink and source shift?
In this study, two CMIP5 climate model products (IPSL-CM5A-LR and bcc-csm1-1) are selected as climate inputs, with three warming scenarios considered (RCP 2.6, RCP 4.5 and RCP 8.5). The simulation is divided into two parts: (1) simulating grid cell average WTD with PTEM 2.2 and interpolating grid cell WTD into sub-grid-cell scale with the TOPMODEL approach; (2) simulating sub-grid-cell-scale peat accumulation and decomposition in current and potential peatland regions (Fig. 1). Although this study is aimed at the peatland C expansion, shrinkage, accumulation and decomposition after 1990, the simulations start in 1940. The simulation during 1940–1990 works as spinup process and is also used for calibration against historical data.
2.1 Selection of climate input data
In the previous PTEM 2.0 site-level simulation, among many CMIP5 data products, the IPSL-CM5A-LR product was selected as climate input because it provides long temporal coverage (1850–2300) for RCP 2.6, RCP 4.5 and RCP 8.5 scenarios (Zhao et al., 2022b). In addition, it shows a good agreement with Climatic Research Unit (CRU) temperature in Eurasia and low biases in historical temperature and precipitation in North America (Miao et al., 2014; Sheffield et al., 2013). However, the IPSL-CM5A-LR product also shows more extreme warming than the other CMIP5 products, especially under RCP 8.5 (Palmer et al., 2018). To address the uncertainty caused by climate inputs, another CMIP5 product, bcc-csm1-1, covering 1850–2300 and three RCP scenarios and projecting milder future climate warming, is selected. The comparison of two forcing datasets is provided in Supplement Table 1. In order to run PTEM 2.2, temperature, precipitation, cloudiness and vapor pressure are required. Neither the IPSL-CM5A-LR nor the bcc-csm1-1 model provide vapor pressure data, which are thus calculated with temperature and relative humidity (Zhao et al., 2022b). Both climate products are bias-corrected to Climatic Research Unit data (v4.03, Harris et al., 2014) during 1940–1990 as described in Zhao et al. (2022b). The bias correction makes sure that the differences in future simulations under two climate inputs are mostly introduced by the different level of post-1990 warming rather than by the difference in their historical records before 1990.
2.2 Future grid cell average WTD simulation
2.2.1 TOPMODEL parameter estimation
In this study, the peatland condition in 1940 derived from previous Holocene simulation is used as the initial condition for future peatland simulations (1940–2300) (Zhao et al., 2022a). In order to be consistent with the Holocene simulation, before running a future WTD simulation, it is necessary to make sure that interpolating the PTEM-simulated recent WTD by TOPMODEL could derive the wetland extent as shown in the end of the Holocene simulation. In particular, “recent” in this study refers to 1940–1990, and wetlands are defined as the region with long-term annual WTD shallower than 25 cm (Fan et al., 2013). To satisfy this requirement, the TOPMODEL parameters need to be estimated before the WTD simulation (Fig. 1a). TOPMODEL describes sub-grid-cell WTD variation with topography. The topography effects on the local WTD are estimated with topographic wetness index (TWI) values: the larger TWI values indicate the shallower WTD and higher flooding probability (Stocker et al., 2014). In order to estimate sub-grid-cell wetland and peatland conditions at 1 % accuracy, each grid cell is divided into 100 bins by the TWI histogram (Fig. 1a, Supplement Fig. S1). With global terrestrial TWI values available at 15 arcsec resolution (Marthews et al., 2015), each bin is composed of 36 TWI values where water bodies have null values (Supplement Fig. S1). For bin i within a given grid cell,
where zwti is the WTD of bin i, ki is the average TWI of bin i, λ is the grid cell average TWI, zwt is the grid cell average WTD and f is the decay parameter. In Eq. (1), the parameters need to be estimated are zwt and f. In particular, the zwt here refers to the 50-year average WTD during 1940–1990. zwt and f values are calculated as
where f value is from Kleinen et al. (2020). zwt−thres is the threshold WTD of wetlands (i.e., −0.25 m) and λthres is the TWI value corresponding to zwt−thres. For a given grid cell where wetland abundance is n % (n is an integer), λthres is the TWI value of the nth largest TWI values among 100 bins. The spatially explicit wetland fraction (n %) during 1940–1990 is consistent with the wetland fraction in 1990 in the Holocene simulation, which is the average value of three peatland maps covering the pan-Arctic region (Xu et al., 2018; Hugelius et al., 2020; Melton et al., 2022). The shallowest WTD in each grid cell is
where λmax is the maximum TWI value in 100 bins. If zwt−max is greater than zero (i.e., above surface), zwt−max is assumed to be −0.01 m, and zwt and f values are calculated by Eqs. (2b) and (3). Otherwise, zwt and f values are calculated by Eqs. (2a) and (2b).
2.2.2 PTEM revisions
The PTEM 2.1 used in pan-Arctic Holocene simulations is able to estimate the wetland WTD in a given grid cell, while not being able to estimate the grid-cell average WTD composed of both wetland and non-wetland land covers (Zhao et al., 2022a). In order to simulate the grid-cell average WTD, PTEM 2.1 is revised by applying some of the algorithms from the VIC model (Fig. 1b). The VIC model was developed by Liang et al. (1994) and has been updated to version 5 (VIC-5, Hamman et al., 2018). Compared with the hydrology module of PTEM 2.1, VIC has the same soil vertical structure of three layers. The major hydrological processes including canopy interception of precipitation, infiltration, gravity-driven vertical flow, evapotranspiration, upper-soil-layer evaporation, and the effect of freezing–thaw on soil moisture are considered in both models (Liang et al., 1994; Zhuang et al., 2002). With a similar structure, processes and variables, it is possible to apply some of VIC algorithms to PTEM 2.1. In particular, the algorithms of surface runoff, vertical flow from upper to lower layers, the computation of base flow and the estimation of WTD from given soil moisture are added to PTEM 2.1. The computation of surface runoff in VIC is based on the Xinanjiang model that assumes runoff is the amount of precipitation that falls on the saturated fraction of a grid cell (Zhao et al., 1995). The relationship between soil water storage and saturated fraction is given by
where A is the fraction of the grid cell that the infiltration capacity (i.e., the possible maximum depth of water stored in soil column given area fraction) is less than i, im is the maximum infiltration capacity within the given grid cell and B is a shape parameter (Wood et al., 1992). The calculation of the uppermost-layer runoff given precipitation and the initial soil moisture is well documented in Wood et al. (1992) (Eqs. 1–3) and Liang et al. (1994) (Eqs. 13, 17–18). In addition, gravity-driven water flow from upper to lower layers is given by Liang et al. (1994) (Eqs. 18–20) based on upper-layer soil moisture, residual moisture content, the pore size distribution index and the hydraulic conductivity estimated from Brooks (1965). Following VIC, PTEM 2.2 also assumes base flow only happens in the bottom soil layer. The computation of base flow in VIC is derived from the model in Franchini and Pacciani (1991) and the equations are listed in Liang et al. (1994) (Eq. 21). Computing WTD given soil moisture was first done in VIC 4.1.2 (Bohn et al., 2013). Edited from VIC-5, the WTD–soil moisture relationship in PTEM 2.2 is given by
where Wtot is the total soil moisture of three layers (mm), Wavg is the average relative soil moisture, SMmax is the maximum soil moisture (mm) and SMres is the residual soil moisture (mm). With SMmax and SMres being spatially explicit parameters, Wavg is
where Dtot is the total depth of soil layer (cm), zwt is given WTD (cm below surface), “bubble” is the bubbling pressure (cm) and b is the parameter
where “expt” is the exponent parameter from the Brooks–Corey relationship and is always greater than 3 (Rawls et al., 1992). In PTEM 2.2, the spatially explicit relationship between WTD and total soil moisture is given by Eqs. (5)–(7) at 5 cm WTD interval. During simulation, PTEM 2.2 calculates the total soil moisture and finds the corresponding WTD. In case soil moisture does not correspond with any 5 cm interval WTD, PTEM 2.2 will find the closest upper and lower soil moisture values in the soil-moisture–WTD profile and interpolate from the upper and lower WTD values.
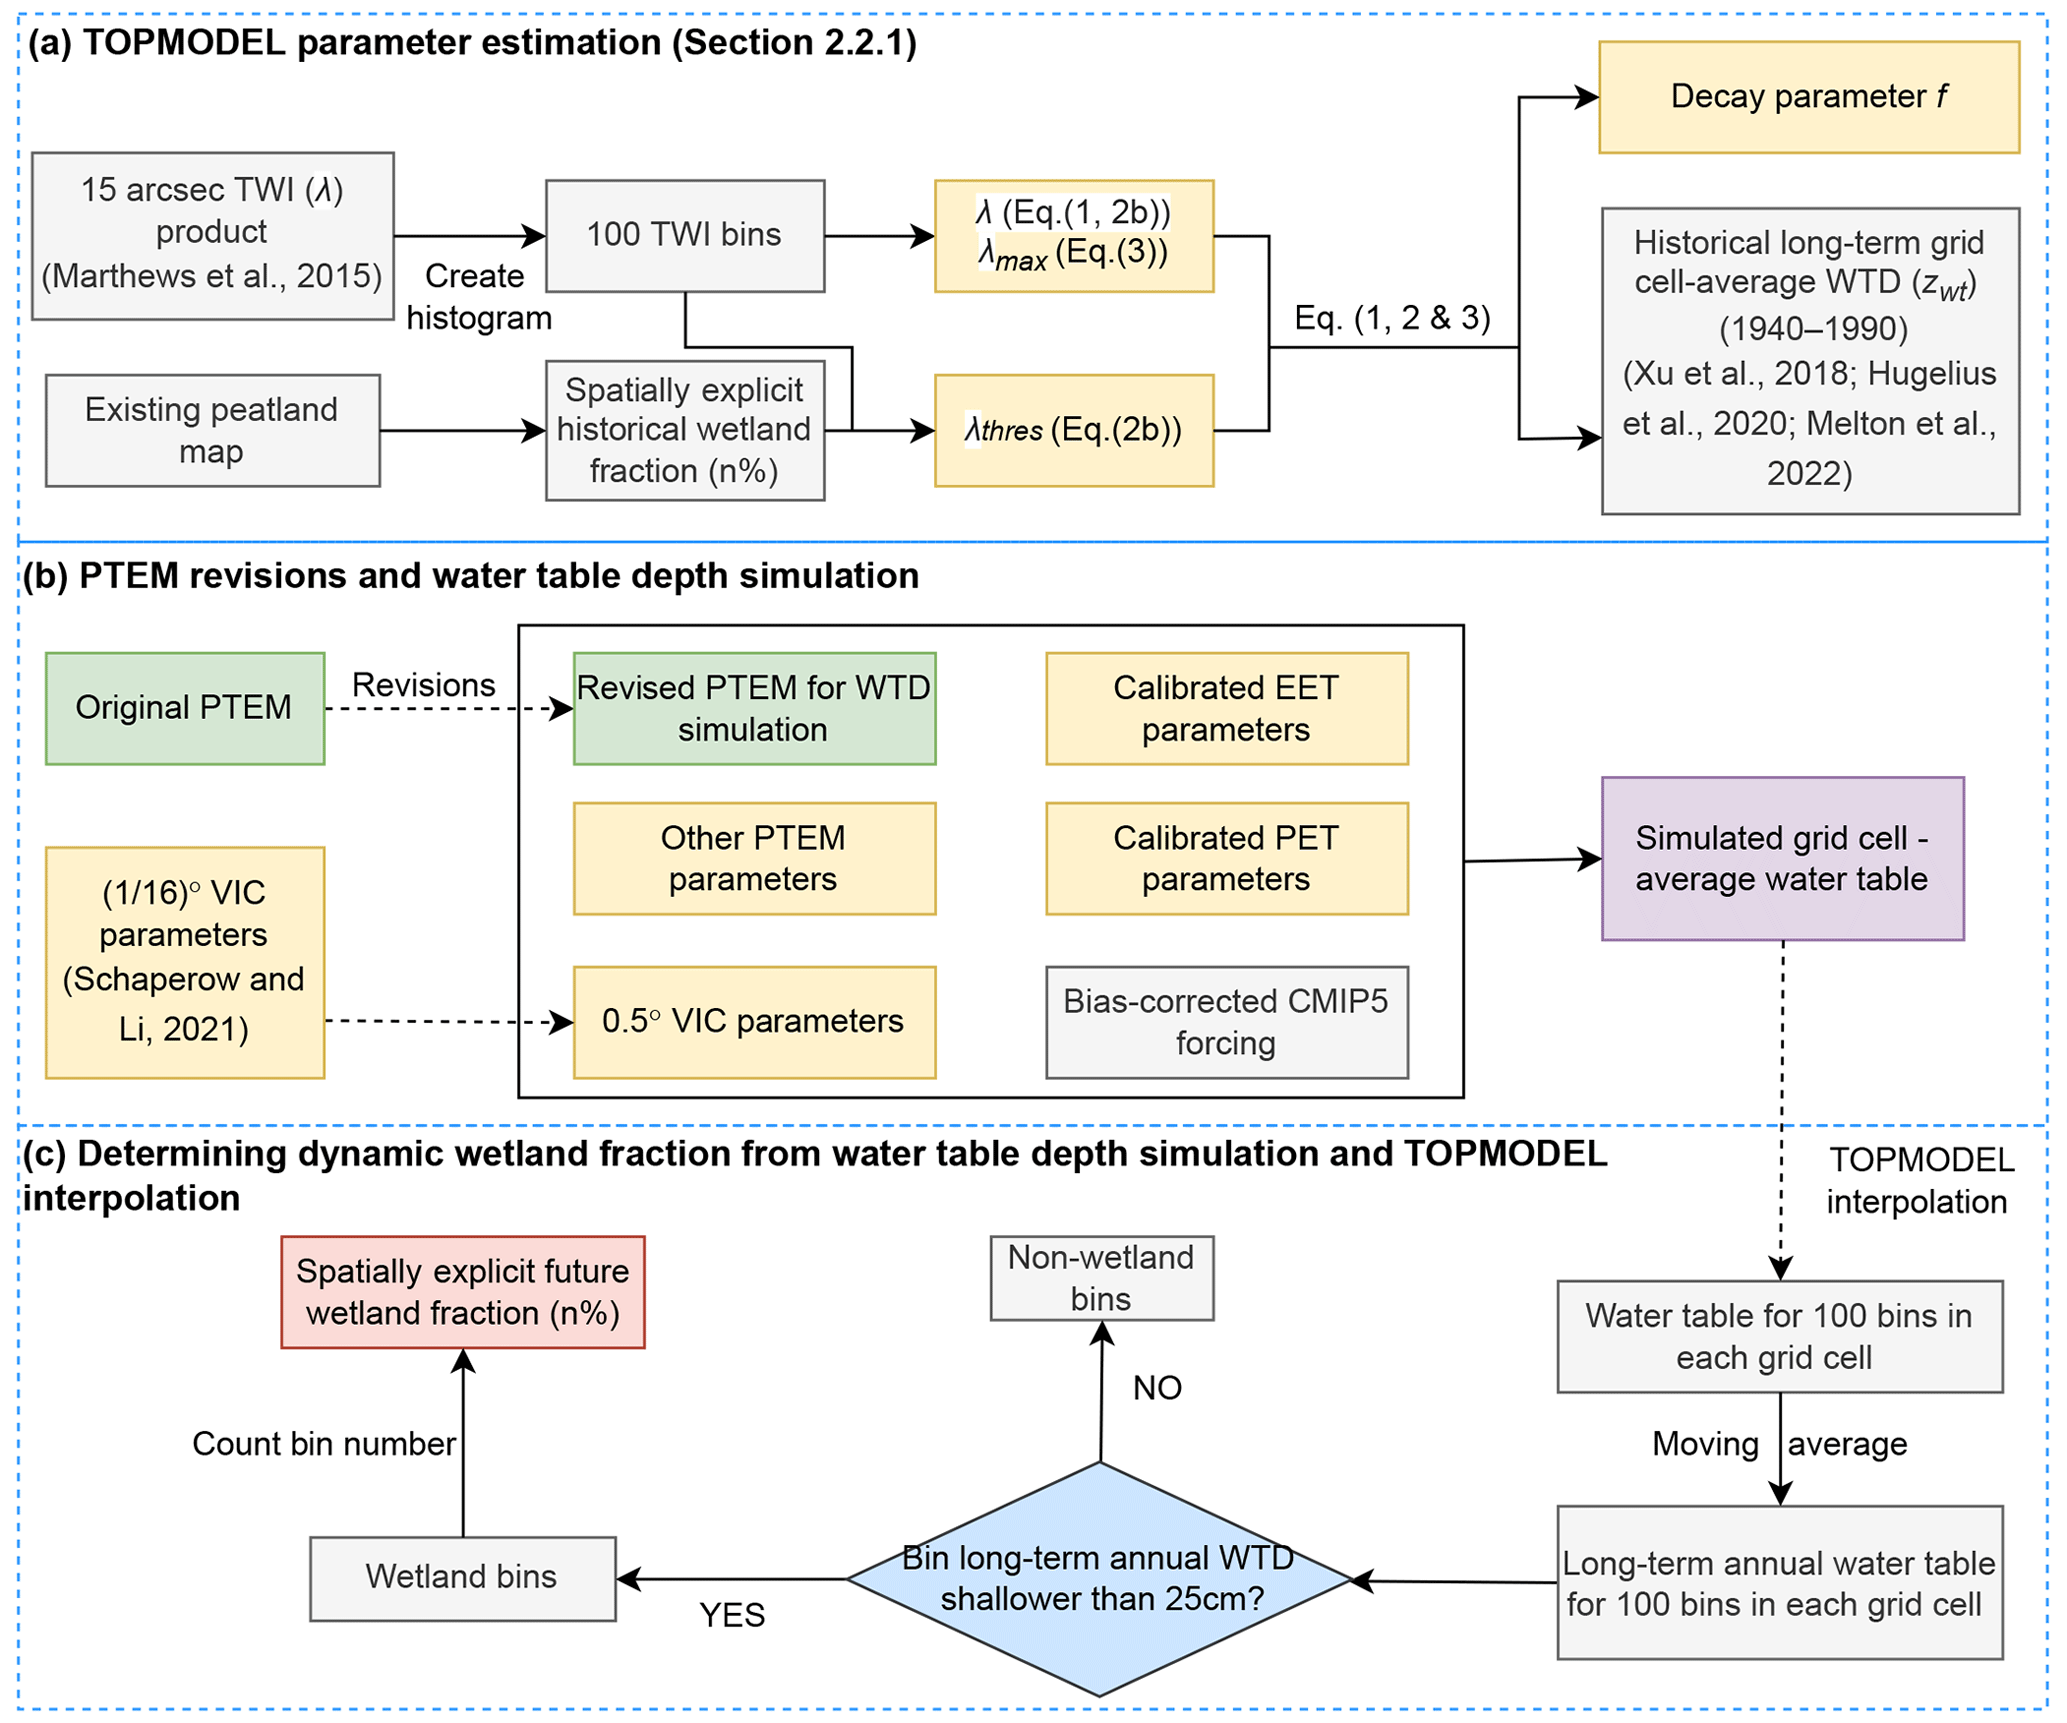
Figure 1Flow chart for Sect. 2.2, “Future grid cell average WTD simulation”, in the Methods section.
In site-level and Holocene simulations, there are three PFTs in PTEM 2.0 and 2.1: moss, herbaceous plant and shrub (Zhao et al., 2022b). However, trees are also an important PFT in northern peatlands (Hanson et al., 2020). Therefore, in both grid-cell average WTD and sub-grid-cell peatland simulations, it is necessary to include trees as a PFT. In particular, the vegetation C and N pools in PTEM 2.2 are now divided into four sub-pools: moss, herbaceous plant, shrub and tree. The dominance of these four PFTs is determined by WTD and their maximum possible productivity. The litter fall from four PFTs becomes the input of soil C and N, and the decomposition ability of litter is influenced by the fraction of litter origin from each PFT. The calculations of C and N cycles of trees are the same as the other three PFTs, although controlled by different PFT-specific parameters. The detailed description and equations are documented in Zhao et al. (2022b).
The calculation of evapotranspiration (EET) of vascular plants in PTEM 2.2 is derived from the Food and Agriculture Organization (FAO) algorithm for calculating crop EET (Allen et al., 1998):
where PET is the potential evapotranspiration given by Penman–Monteith model in PTEM 2.2, kc is a coefficient, Esoil is the evaporation from the top soil layer and “foliage” is a PTEM 2.2 variable describing the relative abundance of leaf biomass (0–1). The is used to represent the evapotranspiration from the top hydrology layer, which is assumed to be a moss layer in PTEM. Although the Food and Agriculture Organization algorithm is widely applied in estimating crop EET, it has also proved to be applicable to shrubland, grassland and forest (Liu et al., 2017). In PTEM 2.2, kc is calculated as
where three vascular PFTs are considered influential for EET (i.e., herbaceous plant, shrub and tree), kc−pft is the spatially explicit coefficient for given PFT and wpft is the weight of given PFT estimated from its dominance:
where VEGCpft is the vegetation C of given PFT and only three vascular PFTs are used for weight calculation. In the WTD simulation, we assume no run-on from adjacent grid cells; thereby the grid cell water balance is
where ΔSM is the change in soil moisture, P is precipitation, Roff is surface runoff and B is the bottom layer base flow.
2.2.3 Grid cell average WTD simulation and post-processing
Adding VIC algorithms to PTEM 2.2 requires VIC parameters at 0.5∘ resolution. These parameters include a variable infiltration curve parameter (binfilt), the maximum velocity of base flow (Dsmax), the fraction of Dsmax where non-linear base flow begins (Ds), the fraction of maximum soil moisture where non-linear base flow occurs (Ws), the exponent used in base flow curve (c), the exponent in Eq. (7), saturated hydrologic conductivity (Ksat), the depth of three soil layers (depth), the bubbling pressure of soil layers (bubble), the bulk density of soil layers (bulk_density) and soil particle density (soil_density). These parameter values are available globally at ∘ resolution (Schaperow and Li, 2021) and are aggregated into 0.5∘ resolution in this study. To run PTEM 2.2, in addition to the climate inputs, the historical (1940–1990) CO2 concentration (ppm) is derived from the TraCE 21ka dataset (He, 2011). The CO2 concentration for three RCP scenarios (1991–2300) is provided by Meinshausen et al. (2011). Spatially explicit soil texture (FAO/UNESCO, 1974) and elevation (Zhuang et al., 2002) were also required (Fig. 1b).
Before conducting the WTD simulation, spatially explicit calibrations for annual PET and kc−pft are conducted. Spatially explicit calibration for annual PET is conducted because the original PTEM 2.1 parameters estimate unreasonably large PET. Therefore, the global aridity index and potential evapotranspiration (ET0) database v3 (Zomer and Trabucco, 2022) is selected as a reference. The dataset is selected because its annual PET is the long-term value of 1970–2000, which can be the approximate reference to the PET during 1940–1990 in this study. In addition, the reference dataset is also based on the Penman–Monteith model but with more detailed estimation of the parameters than PTEM (Zomer and Trabucco, 2022). The 30 arcsec resolution reference PET is aggregated into 0.5∘ resolution for calibration. The spatially explicit Penman–Monteith parameters in PTEM 2.2 are calibrated with PEST (v17.2 for Linux). Since both the reference dataset and PTEM 2.2 estimate PET with the same model, the calibration result is close to the reference for both IPSL-CM5A-LR and bcc-csm1-1 climate inputs (Supplement Fig. S2).
After PET calibration, the spatially explicit calibration for kc−pft is conducted such that the 50-year WTD is consistent with the zwt calculated by Eqs. (2)–(3). As for the PET calibration, spatially explicit kc−pft values are also calibrated by PEST (v17.2 for Linux). The wetland abundance at the end of the Holocene simulation (i.e., reference dataset) (Xu et al., 2018; Hugelius et al., 2020; Melton et al., 2022) and the wetland abundance interpolated by TOPMODEL from calibrated WTD (average of 1940–1990) are shown in Fig. 2. Notably, the extent of pan-Arctic peatlands is used as an approximation of pan-Arctic wetlands because the northern peatland extent is estimated to be 2.9–3.3 Mkm2, with an average of 3.05 Mkm2 (Xu et al., 2018; Hugelius et al., 2020; Melton et al., 2022), while the northern wetland extent is estimated to be 3.2 Mkm2 (Olefeldt et al., 2021), indicating that northern wetlands are dominated by northern peatlands. In addition, the peatland coverage from Xu et al. (2018) and Hugelius et al. (2020) both include shallow peats (<30 cm), which are classified as wetlands rather than peatlands in this study. Since each grid cell is divided into 100 bins by TWI values, the minimum wetland abundance is 1 %. In this study, the grid cells with less than 1 % wetland are not used for peat simulation. Leaving out the grid cells with less than 1 % wetlands, the pan-Arctic wetlands area for the reference dataset is 2.93 Mkm2, the calibrated wetlands area with IPSL-CM5A-LR forcing input is 2.81×10⁶ km2 and that with bcc-csm1-1 forcing input is 2.86×10⁶ km2 (Fig. 2).
After calibration, the WTD simulation is conducted for 1940–2300 at 0.5∘ resolution (Fig. 1b). Notably, the WTD simulation only aims at estimating grid cell average WTD, and the peat accumulation and decomposition processes are not simulated. The grid cell average WTD during 1940–2300 is interpolated by TOPMODEL using the parameters calculated in Sect. 2.2.1 (Fig. 1c). The changes in wetlands extent during 1990–2300 under IPSL-CM5A-LR and bcc-csm1-1 forcing inputs are presented in Supplement Figs. S3 and S4.
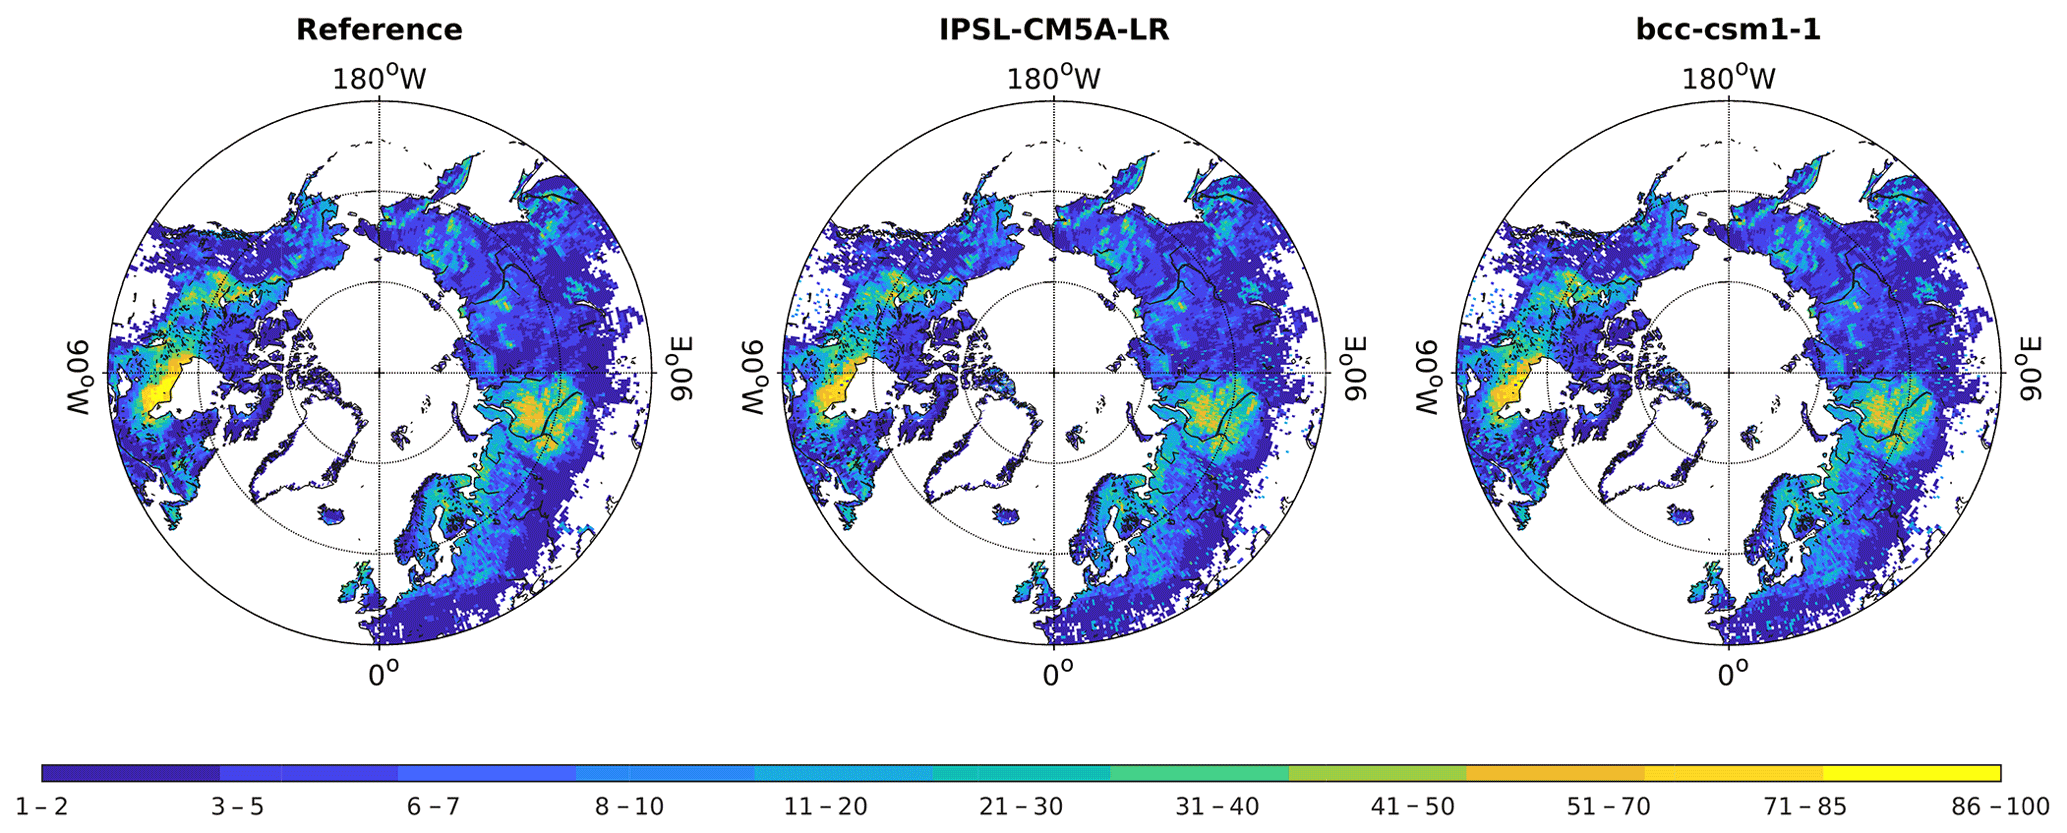
Figure 2Comparison between the reference and calibrated wetland abundance (%) during 1940–1990 interpolated with the TOPMODEL approach. The reference dataset is the average peatland abundance of three peatland maps (Xu et al., 2018; Hugelius et al., 2020; Melton et al., 2022), and calibration is conducted for IPSL-CM5A-LR and bcc-csm1-1 climate inputs. The grid cells with less than 1 % wetlands are left blank. This is the initial wetland extent for future peatland simulation.
2.3 Peatland simulation
2.3.1 PTEM revision
The TOPMODEL-interpolated bin WTD is used as an input in peatland simulation. In contrast to the WTD simulation where the grid cell run-on is assumed to be zero (Eq. 11), the run-on in peatland simulation is calculated with a water balance equation:
where ΔSM is the difference between soil moisture at two adjacent time steps (i.e., months) and the soil moisture in each month is estimated form the input WTD and the WTD–soil moisture relationship given by Eqs. (5)–(7). The runoff (Roff), base flow (B) and evapotranspiration (EET) are calculated in the same way as in the WTD simulation. pH values are influential for CH4 production process and are simulated in both Holocene and future simulations. In the Holocene simulation, soil pH value is calculated as a function of run-on, which is solely controlled by peat thickness. In the revision, soil pH is calculated as
where pH is the soil pH value, is the number of H+ particles and SM is the soil moisture (mm). Notably, on unit area (i.e., 1 m2), 1 mm soil moisture is equal to 1 L soil water. Therefore, calculates the concentration of H+ particles per liter. And the number of H+ particles is calculated as
where pHp is the pH value of precipitation (assumed to be 5.0), pHron is the pH value of run-on water (assumed to be 7.0), pHw is the pH value of EET water (assumed to be 7.0) and pH0 is the pH value of soil water in the previous month. The spatially explicit initial pH values are from Carter and Scholes (2000).
In Holocene simulations, CH4 production is simulated, but since the oxidation process is not considered, CH4 emission is not calculated. In this revision, CH4 oxidation is enabled and thereby it is possible to estimate net CH4 emission. The algorithms are documented in Zhuang et al. (2004).
2.3.2 PTEM simulation
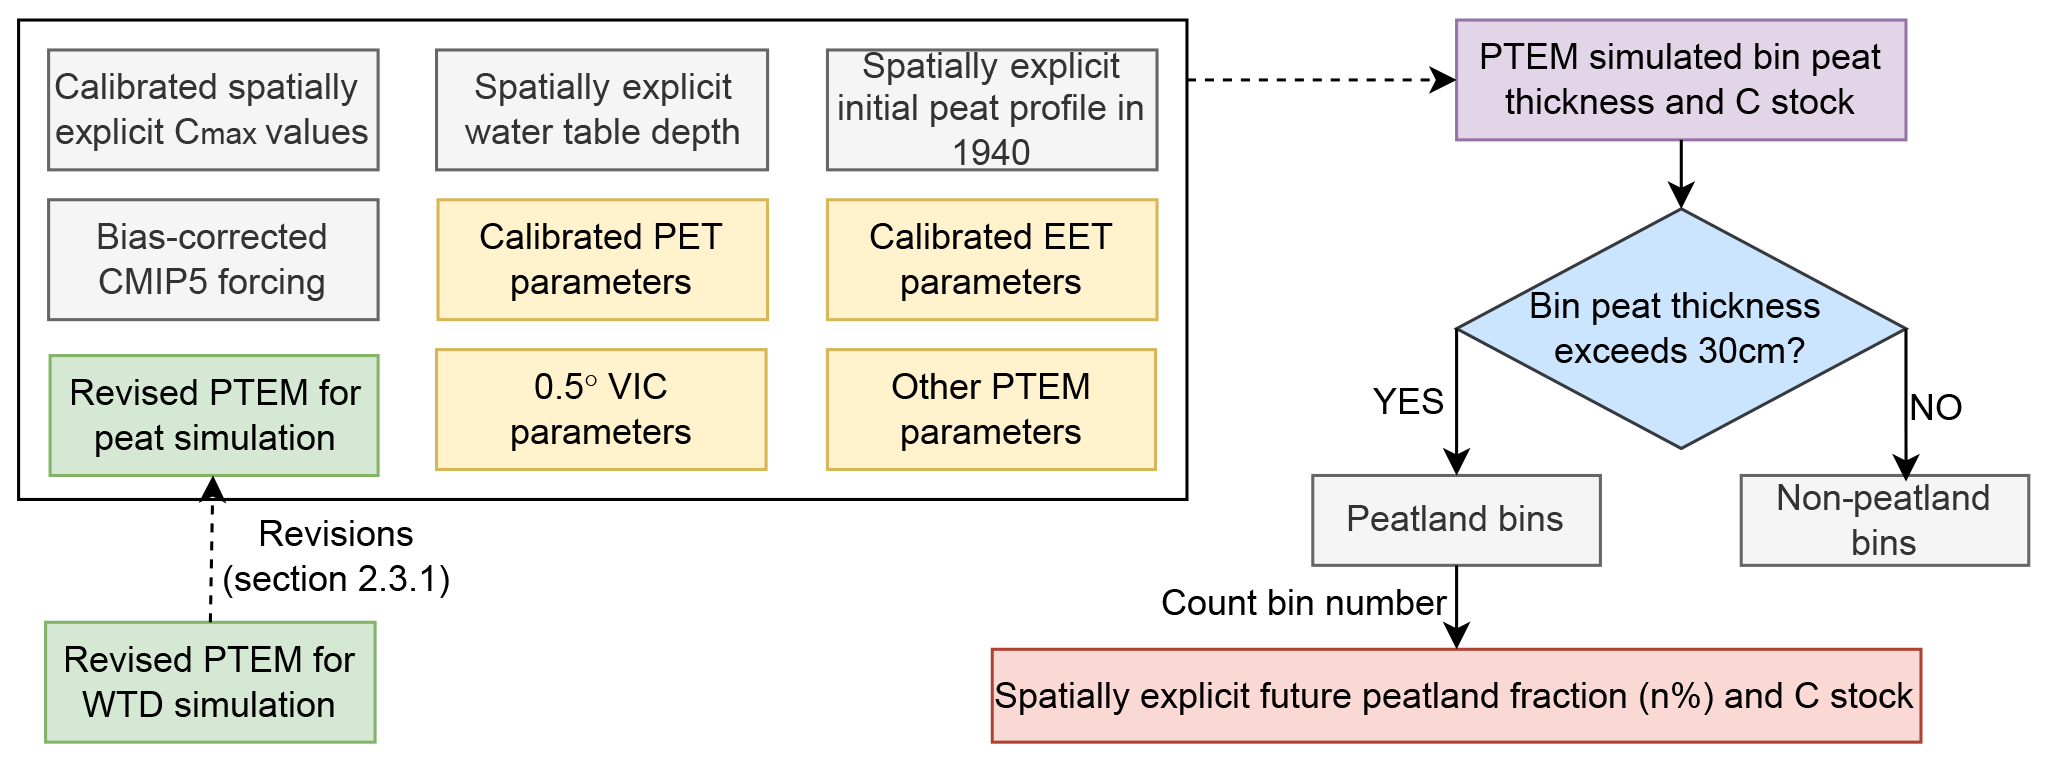
In each grid cell, among the 100 bins classified by TWI, the bins in which the long-term WTD has ever been shallower than 25 cm are classified as “potential peatlands”, which are used for peatland simulation. To be consistent with the WTD simulation, long-term WTD refers to the 50-year moving average of annual WTD. In this study, we assume within each grid cell, that the climate conditions are similar and the key control of whether peat exists at sub-grid-cell scale is the local WTD influenced by sub-grid topography. Therefore, for all the bins in the same grid cell, the forcing data, soil texture, elevation and parameters are the same except for the input WTD.
In Holocene simulations, the maximum C assimilated by ecosystem parameter (cmax) is calibrated for over 2000 peat cores and interpolated into the pan-Arctic region (Zhao et al., 2022a). The calibration process reduces the uncertainty from forcing data, other parameters and model structure, and the simulated spatial and temporal pattern of pan-Arctic peatland C stock is consistent with multiple datasets (Zhao et al., 2022a). However, since the hydrology module of PTEM 2.2 is revised and peat accumulation and decomposition are sensitive to hydrological processes, using the original parameters could result in considerable bias. In order to make sure the revised PTEM 2.2 simulates consistent C accumulation rate (CAR) with the previous study, a spatially explicit calibration on maximum C assimilated by ecosystem (cmax) parameter is conducted.
Before calibrating CAR, it is necessary to initialize PTEM 2.2 with reasonable peat conditions. To initialize the simulation, the peat profile in 1940 derived from the Holocene simulation (Zhao et al., 2022a) is used (Fig. 3). In particular, the peat profile records the physical property of vertical peat layers including bulk density, organic C density, layer thickness (1 cm except for the top layer), fraction of remaining un-decomposed organic matter and decomposition rate of un-decomposed organic matter at 0 ∘C. This information can be used to estimate the decomposition rate of existing peat given WTD, soil pH and soil temperature (Zhao et al., 2022b).
With initial peat profile as an input, cmax values are calibrated with PEST (v17.2 for Linux). In particular, within each grid cell, the 50-year average CAR of historical wetland bins (i.e., the bins that are classified as wetlands during 1940–1990) is simulated and averaged to get the grid cell average 50-year peatland CAR. This grid cell average peatland CAR is calibrated against the CAR derived from the Holocene simulation during the same period (Supplement Fig. S5).
After calibration, the peat simulation is conducted for all pan-Arctic potential peatland bins during 1940–2300 (Fig. 2). For the Greenland grid cells not included in the Holocene simulation and thereby having no calibrated cmax values, the cmax values are interpolated from adjacent grid cells. For the bins not included in the Holocene simulation or not being peatlands before 1990, the peat profile is initialized as 3 cm fully decomposed peat. Notably, under different forcing data and warming scenarios, the number and distribution of potential peatland bins are slightly different, which makes the initial pan-Arctic peatland C storage in 1940 slightly different (Supplement Table S2). When running peat simulation, the forcing input (temperature, precipitation, cloudiness and vapor pressure), soil texture, elevation and parameters are the same as the ones used in the WTD simulation, except for the spatially explicit cmax values.
2.3.3 Peat simulation post-processing
After simulation, the simulated results are analyzed in terms of (1) the temporal pattern of pan-Arctic climate dynamics, (2) the temporal pattern of pan-Arctic peatland C stocks and C fluxes, (3) the main drivers of pan-Arctic peatland C dynamics, and (4) the threshold temperature and precipitation needed to transition the peatland from a C sink to a C source.
Threshold temperature is calculated with logistic regression:
A fitting curve of f(temp) is derived for the pan-Arctic region and for each grid cell. Under sink–source shift, the fitting curve rises from 0 to 1, and the threshold temperature of sink–source shift is determined when f(temp) is 0.5. The threshold precipitation and threshold number of annual unfrozen days is calculated in the same way. In particular, to estimate the number of unfrozen days, the daily temperature is reconstructed from monthly temperature by the algorithms used in Zhao et al. (2022a).

Figure 4Time series of pan-Arctic annual air temperature (∘C), annual precipitation (mm yr−1), wetland area (Mkm2) and permafrost area in peatland regions (Mkm2) during 1990–2300.
3.1 Warmer and drier pan-Arctic peatlands during 1990–2300
Both IPSL-CM5A-LR and bcc-csm1-1 climates show increasing temperature and precipitation during 1990–2300. In particular, under RCP 2.6 and RCP 4.5, temperature increases mostly before 2100 by 2.3–4.1 and 2.0–3.2 ∘C under IPSL-CM5A-LR and bcc-csm1-1, respectively (Fig. 4 1a–b, Supplement Table S3). Meanwhile, precipitation increases by 40.7–59.7 and 38.1–53.9 mm yr−1 for IPSL-CM5A-LR and bcc-csm1-1 (Fig. 4(2a–b), Supplement Table S3). During 2100–2300, under RCP 2.6, the temperature decreases by 0.8 ∘C in IPSL-CM5A-LR and by 1.1 ∘C in bcc-csm1-1. Under RCP 4.5, temperature keeps increasing but at a slower rate than before 2100 (IPSL-CM5A-LR, 1.3 ∘C, vs. bcc-csm1-1, 0.4 ∘C). Meanwhile, precipitation slightly decreases under RCP 2.6 (IPSL-CM5A-LR, −12.0 mm yr−1, vs. bcc-csm1-1, −5.8 mm yr−1), while it increases under RCP 4.5 (IPSL-CM5A-LR, 29.1 mm yr−1, vs. bcc-csm1-1, 8.5 mm yr−1) (Fig. 4(1a–b, 2a–b), Supplement Table S3). Different from RCP 2.6 and RCP 4.5, the increase in temperature and precipitation under RCP 8.5 is stable during 1990–2200 and slows down after 2200. In particular, under IPSL-CM5A-LR, during 1990–2100 and 2100–2300, temperature increases by 8.4 and 8.1 ∘C, while precipitation increases by 106.1 and 131.7 mm yr−1. Under bcc-csm1-1, during 1990–2100 and 2100–2300, temperature increases by 7.2 and 6.9 ∘C, while precipitation increases by 100.9 and 198 mm yr−1, respectively (Fig. 4(1–2c), Supplement Table S3).
The result of pan-Arctic wetland shrinking under all scenarios indicates that the increase in precipitation does not compensate for the increase in evapotranspiration under warmer climate. Therefore, the pan-Arctic generally becomes drier and WTD becomes deeper (Fig. 4(3a–c), Supplement Figs. S6, S7). In particular, during 1990–2100, under IPSL-CM5A-LR, wetland shrinks by 0.6, 0.9 and 1.4×10⁶ km2 under three RCP scenarios. Meanwhile, under bcc-csm1-1, wetland shrinks slightly less by 0.4, 0.6 and 1.2×10⁶ km2 under three RCP scenarios. During 2100–2300, under both IPSL-CM5A-LR and bcc-csm1-1, wetlands slightly expand by 0.1×10⁶ km2 under RCP 2.6, while under the warmer scenarios, wetland further shrinks by 0.2 and 0.9×10⁶ km2, respectively (Fig. 4(3a–c), Supplement Table S3).
Following climate warming, permafrost shrink is simulated across the current pan-Arctic peatland region under all scenarios (Fig. 4(4a–c)). In particular, with IPSL-CM5A-LR forcing, under RCPs 2.6, 4.5 and 8.5, permafrost shrinks by 0.2, 0.7 and 1.2×10⁶ km2 during 1990–2100 and expands by 0.1 and shrinks by 0.1 and 0.5×10⁶ km2 during 2100–2300. Meanwhile, active layer deepening is simulated in the remaining permafrost region (Supplement Fig. S8). Similarly, with bcc-csm1-1 forcing, under RCPs 2.6, 4.5 and 8.5, permafrost shrinks by 0.2, 0.2 and 1.0×10⁶ km2 during 1990–2100 and expands by 0.1 and shrinks by 0.1 and 0.6×10⁶ km2 during 2100–2300 (Fig. 4(4a–c), Supplement Table S3). Meanwhile, active layer deepening is simulated in the remaining permafrost region under RCPs 4.5 and 8.5 (Supplement Fig. S9).
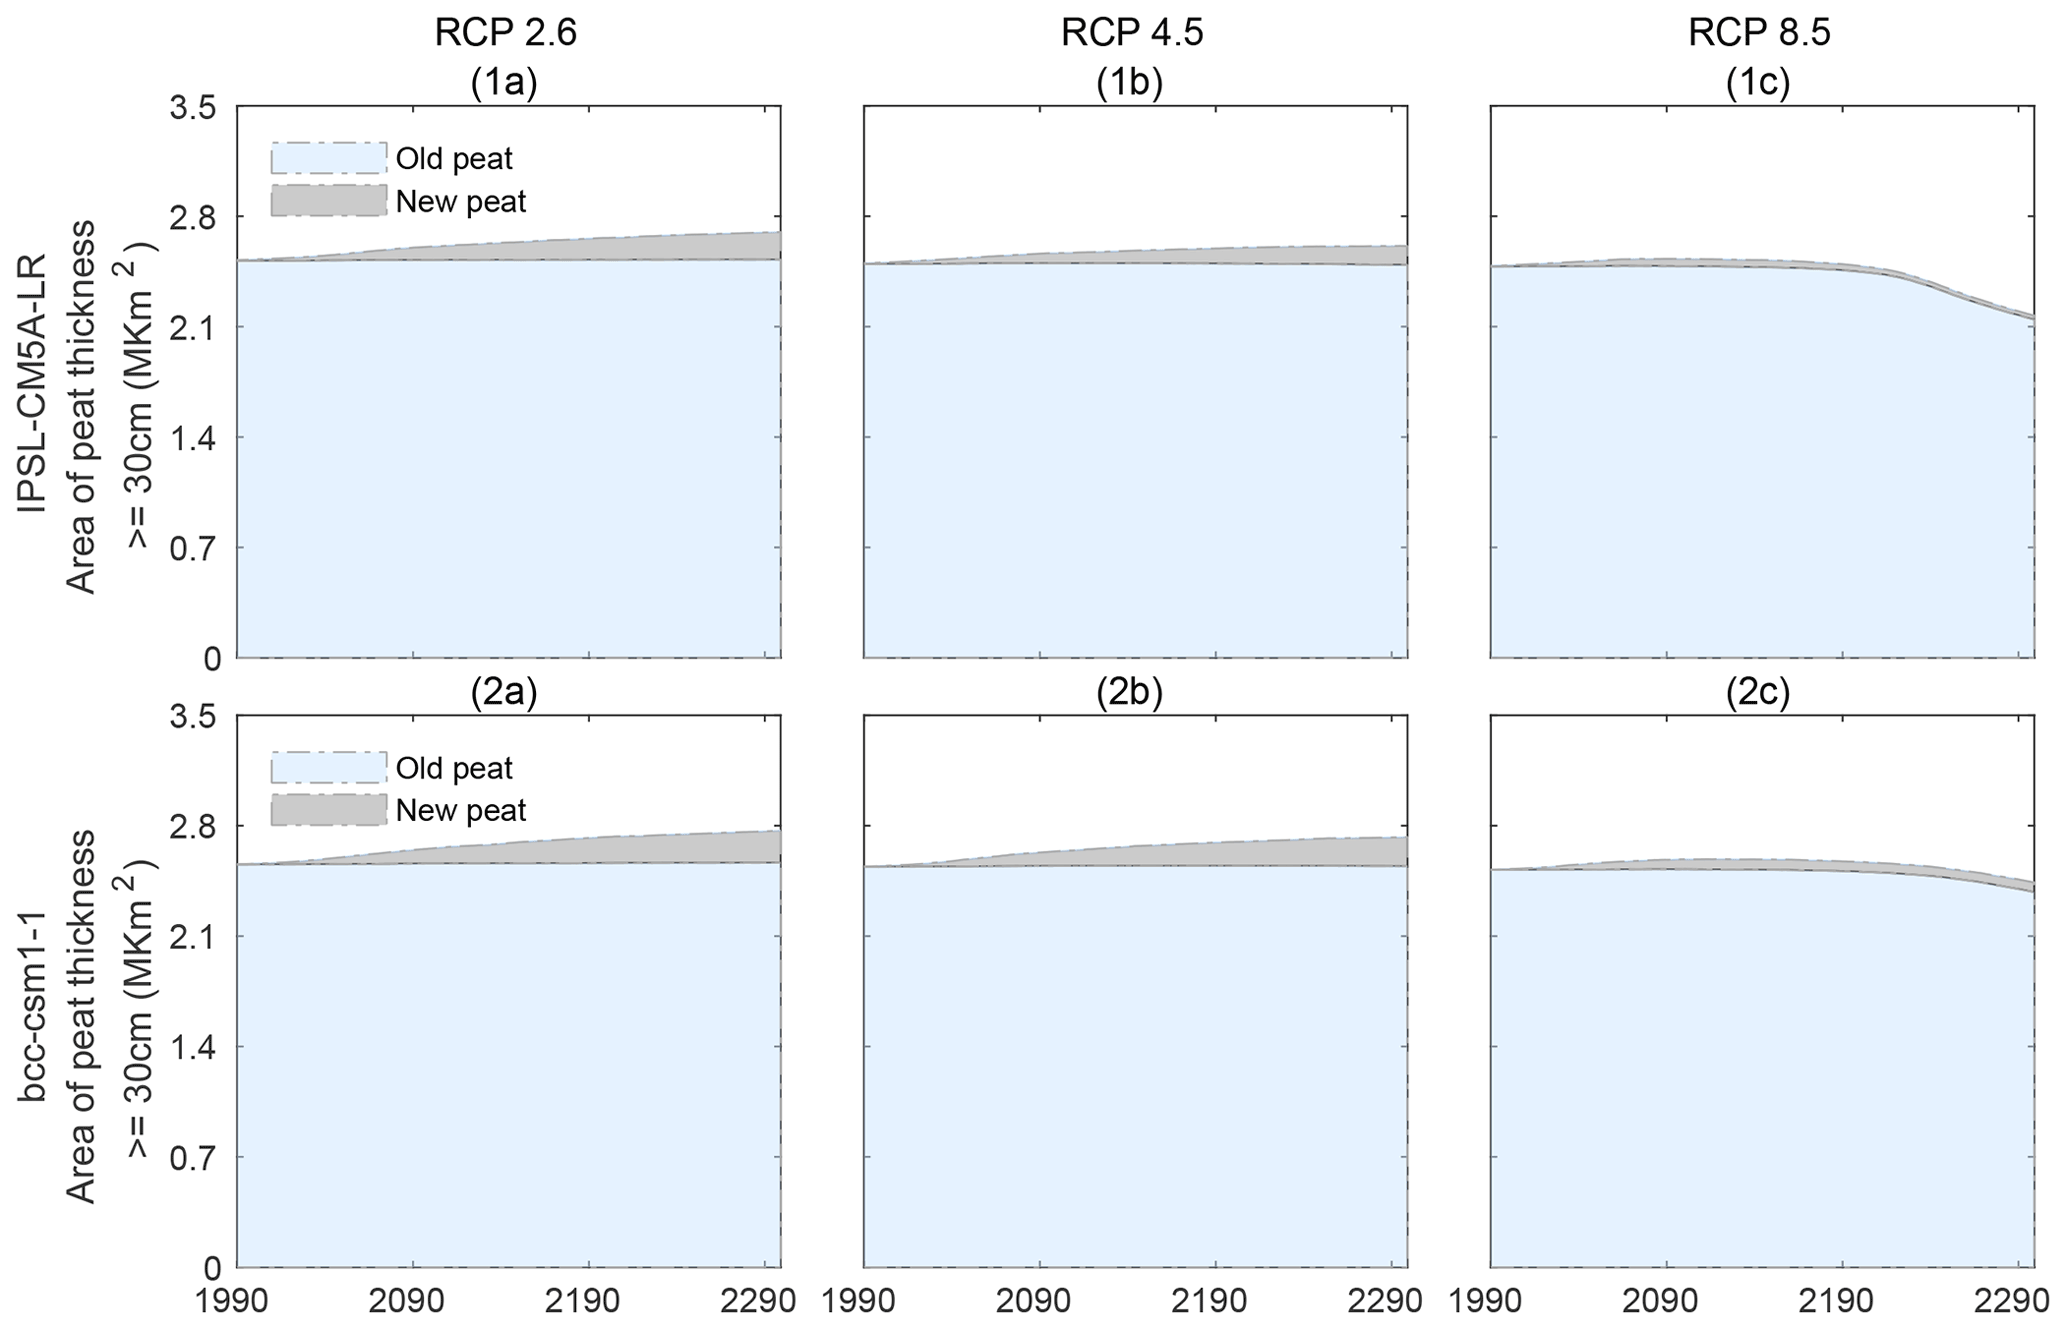
Under RCPs 2.6 and 4.5, with both IPSL-CM5A-LR and bcc-csm1-1 forcing, peatland (i.e., the region with peat thickness ≥ 30 cm) area expands during 1990–2300 (Fig. 5). In particular, the new peat area expands by 0.1 to 0.2×10⁶ km2, while the old peat area is stable (Supplement Table S3). Under RCP 8.5, however, peatland area shrinks. In particular, although the new peatland area expands by 0.1×10⁶ km2, the old peatland area shrinks by 0.1 to 0.4×10⁶ km2, causing a total peatland area decrease (Fig. 5, Supplement Table S3).
3.2 Pan-Arctic C stocks and fluxes under climate change
3.2.1 Before 2100
With WTD becoming deeper, active layer depth becoming deeper and permafrost extent shrinking, it is reasonable that decomposition increases during 1990–2100 under all scenarios (Fig. 6(3, 4a–c), Table 2). Meanwhile, net primary production (NPP) slightly decreases with IPSL-CM5A-LR forcing, while it increases with bcc-csm1-1 forcing (Fig. 6(2a–c), Table 2). In PTEM 2.2, NPP is primarily influenced by temperature and nitrogen availability, and available nitrogen mainly comes from net N mineralization. In all scenarios, the net N mineralization rate increases (negative values indicate higher net N mineralization) during 1990–2100 (Supplement Fig. S10), indicating more available N for vegetation. The increase in both N availability and temperature cannot explain the reason for the NPP decrease. However, the NPP decrease can be explained by the shift in PFTs. In particular, during 1990–2100, with the water table becoming deeper, the dominance of herbaceous plants is gradually replaced by woody plants (i.e., shrubs and trees) that can thrive under drier conditions (Supplement Fig. S11). In PTEM 2.2, compared with herbaceous plants, woody plants require more nitrogen for production. Therefore, although N availability increases, the increase is not sufficient for woody plants to maintain as high an NPP as herbaceous plants, and the overall NPP decreases.
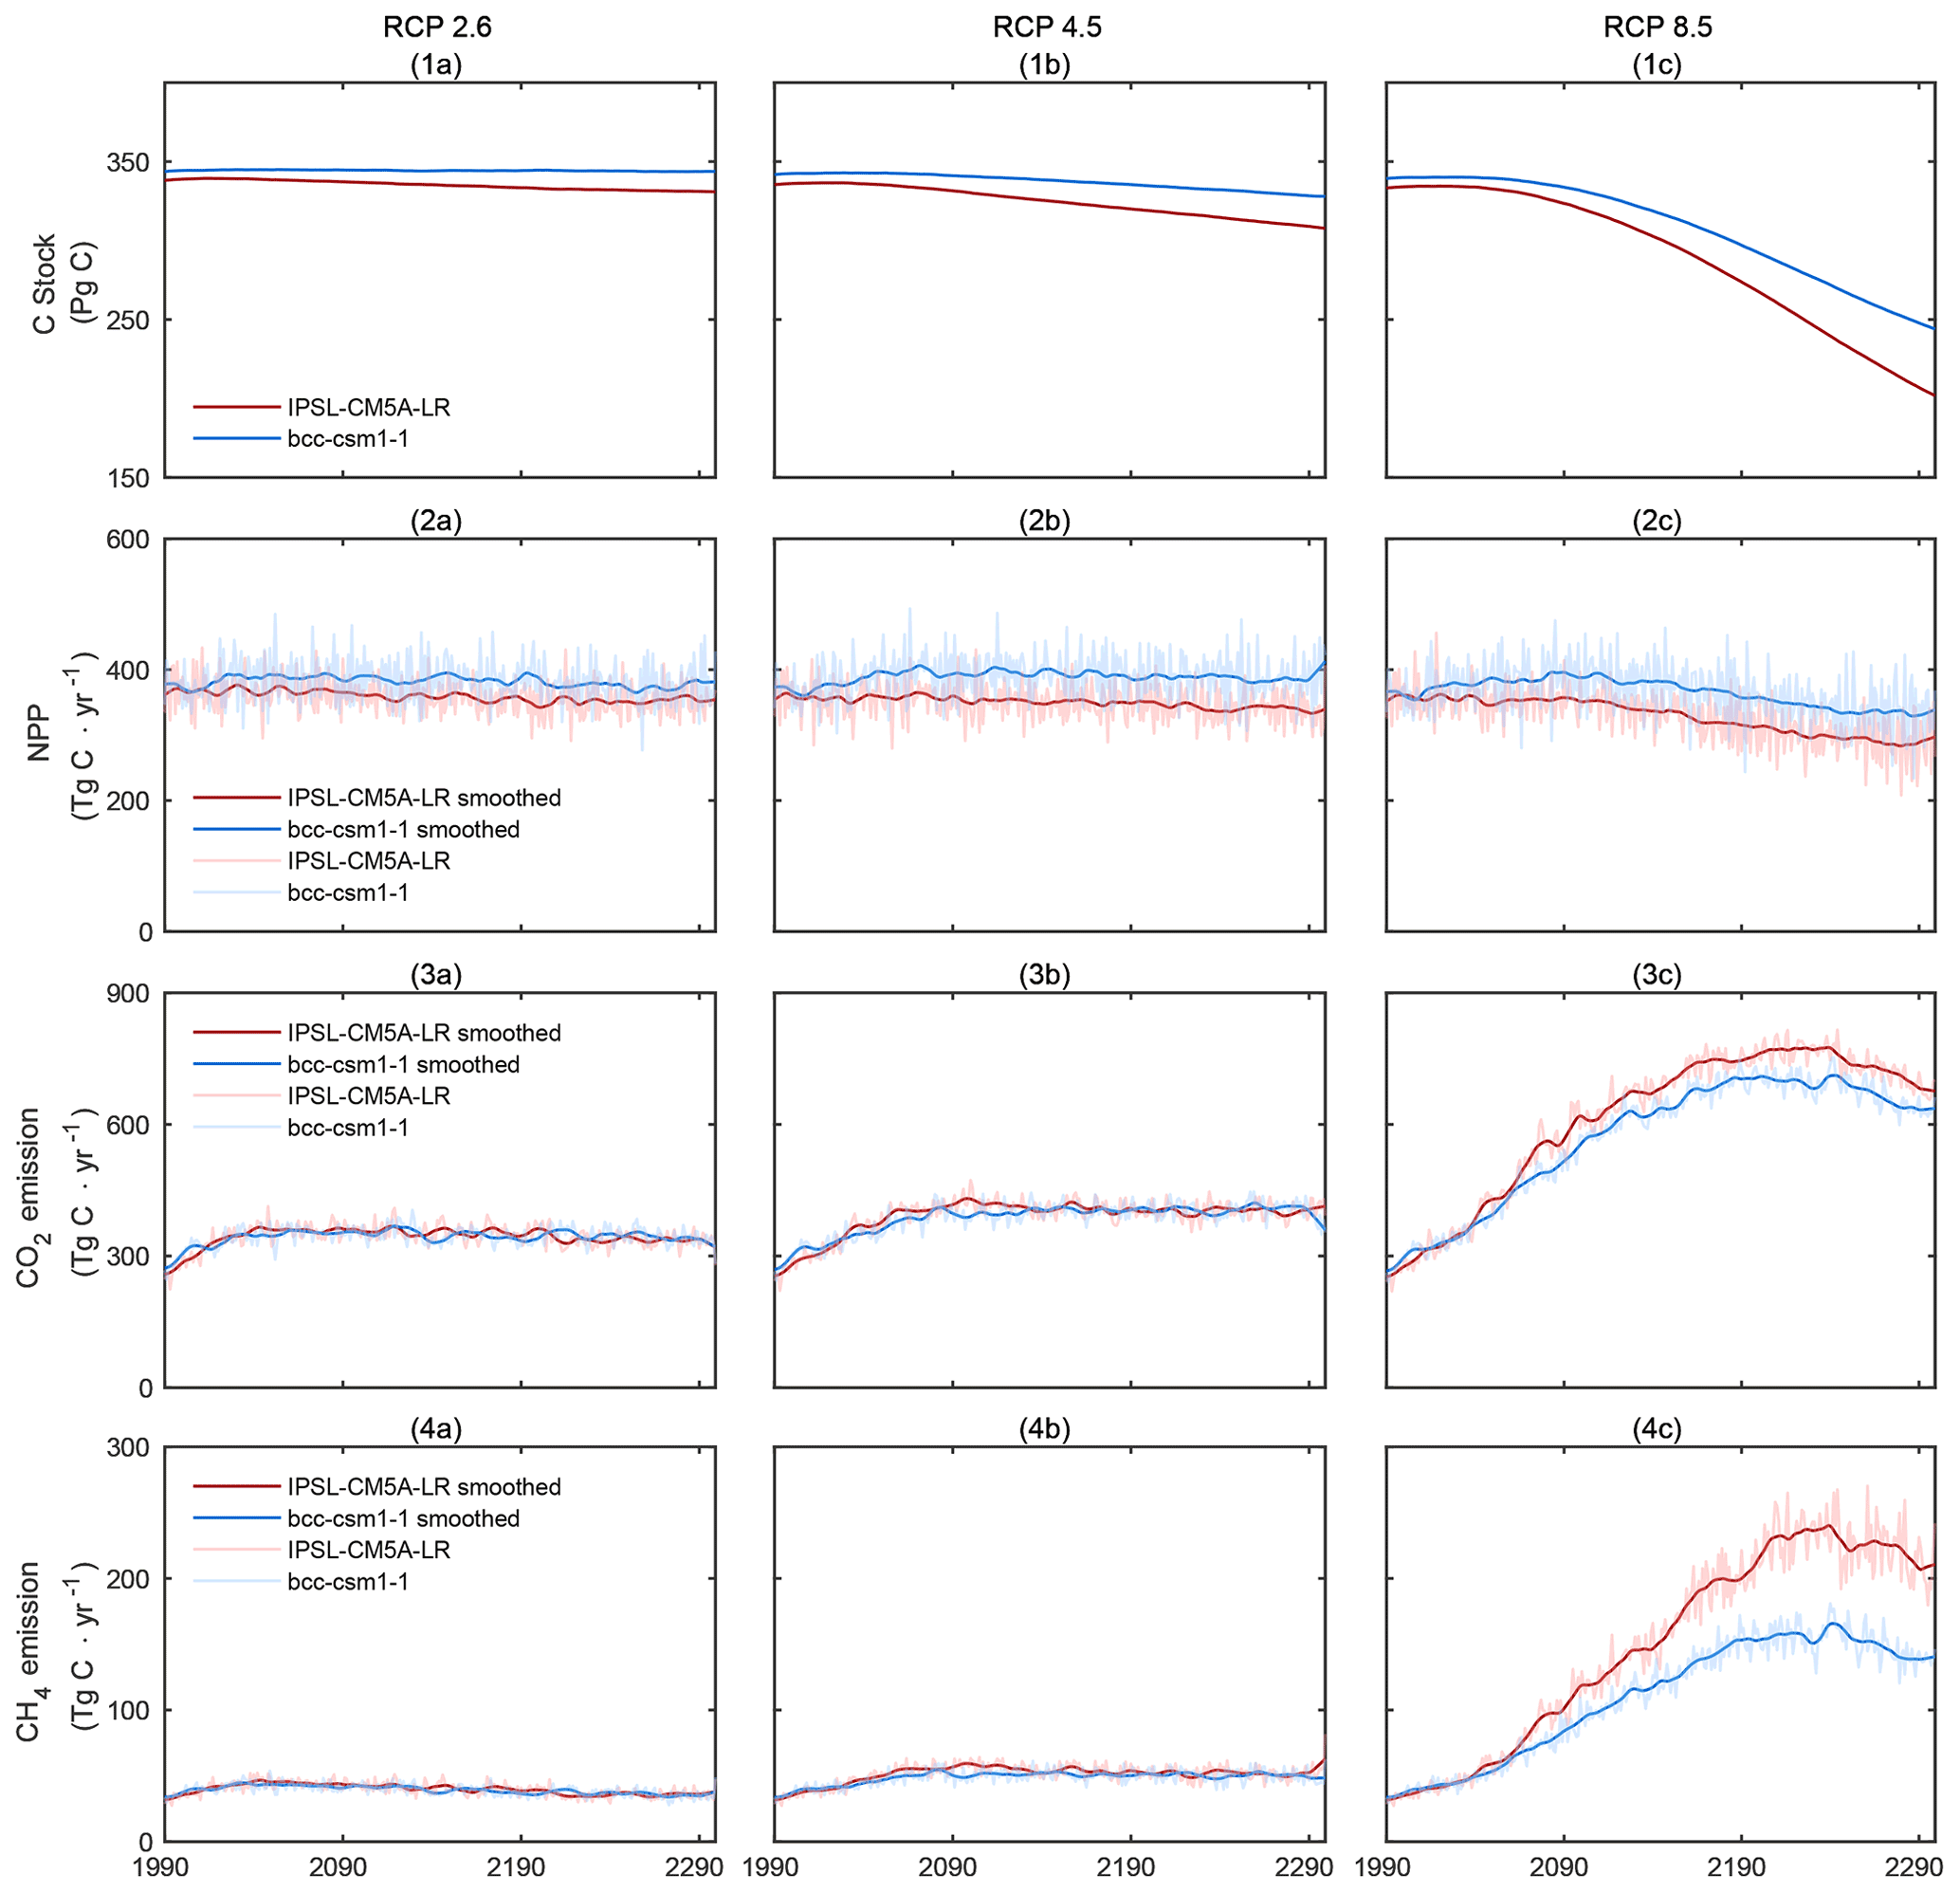
Figure 6Time series of pan-Arctic peatland C storage (vegetation and soil, Pg C), NPP (TgC yr−1), CO2 emissions from soil heterotrophic respiration (TgC yr−1) and CH4 emissions (TgC yr−1) during 1990–2300.
In all scenarios except for bcc-csm1-1 RCP 2.6, the increase in decomposition overrides the increase in NPP and thereby C stock decreases (Fig. 6(1a–c), Table 2). In particular, with IPSL-CM5A-LR forcing, by 2100, C stock decreases by 1.3, 5.2 and 13.3 Pg C under RCPs 2.6, 4.5 and 8.5, respectively. With bcc-csm1-1 forcing, by 2100, C stock increases by 0.8 Pg C under RCP 2.6, while it decreases by 1.2 and 7.8 Pg C under RCPs 4.5 and 8.5, respectively (Fig. 6(1a–c), Table 2). Notably, although pan-Arctic peatlands are C sinks during 1990–2100 under bcc-csm1-1 RCP 2.6, the sink is much lower than that during 1940–1990, with CAR decreasing by 29.1 gC m−2 yr−1. Furthermore, this difference is larger in the other scenarios (IPSL-CM5A-LR: 35.5–63.5 gC m−2 yr−1; bcc-csm1-1: 34.6–50.0 gC m−2 yr−1) (Supplement Figs. S12, S13, Table S3).
Table 2Pan-Arctic total C stock and annual C fluxes in 1990, 2100 and 2300.
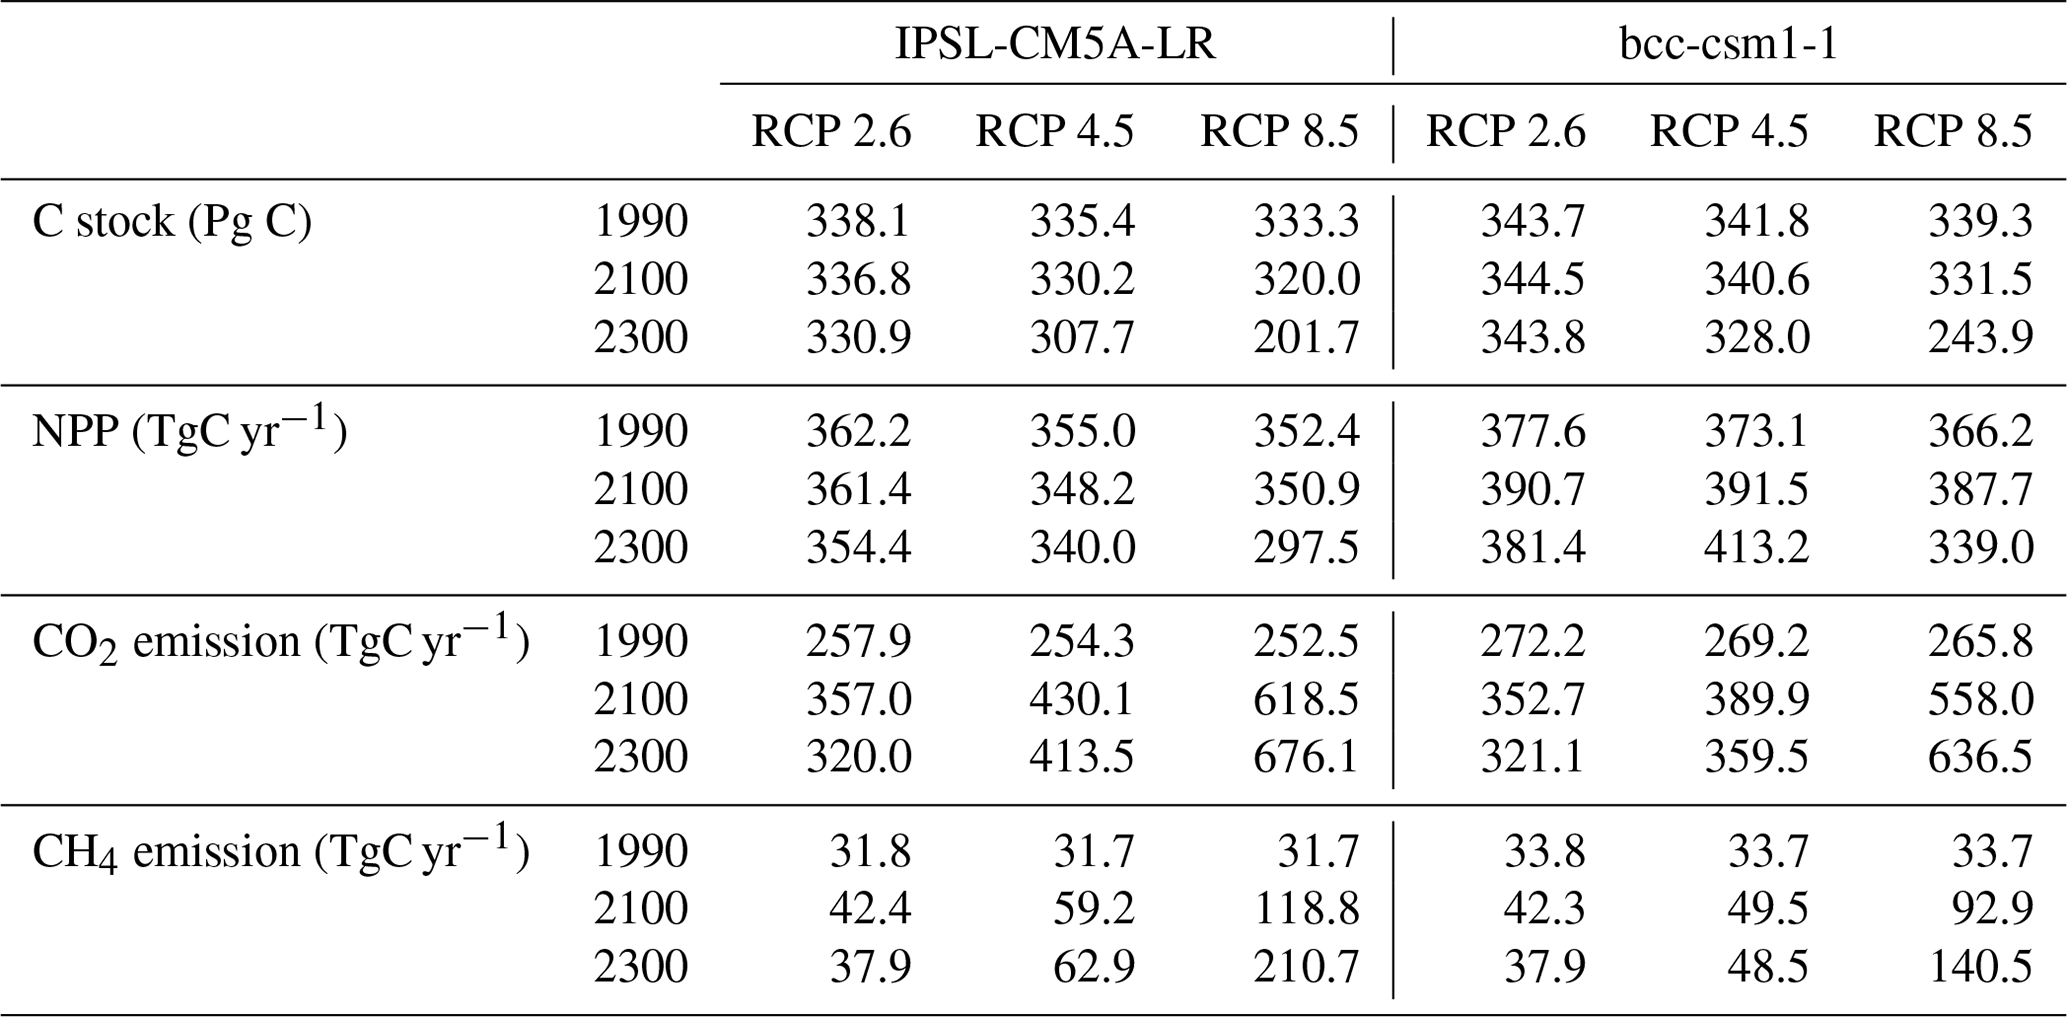
C stock includes both soil and vegetation C.
Table 3Pan-Arctic peatlands C accumulation rate during four time periods.
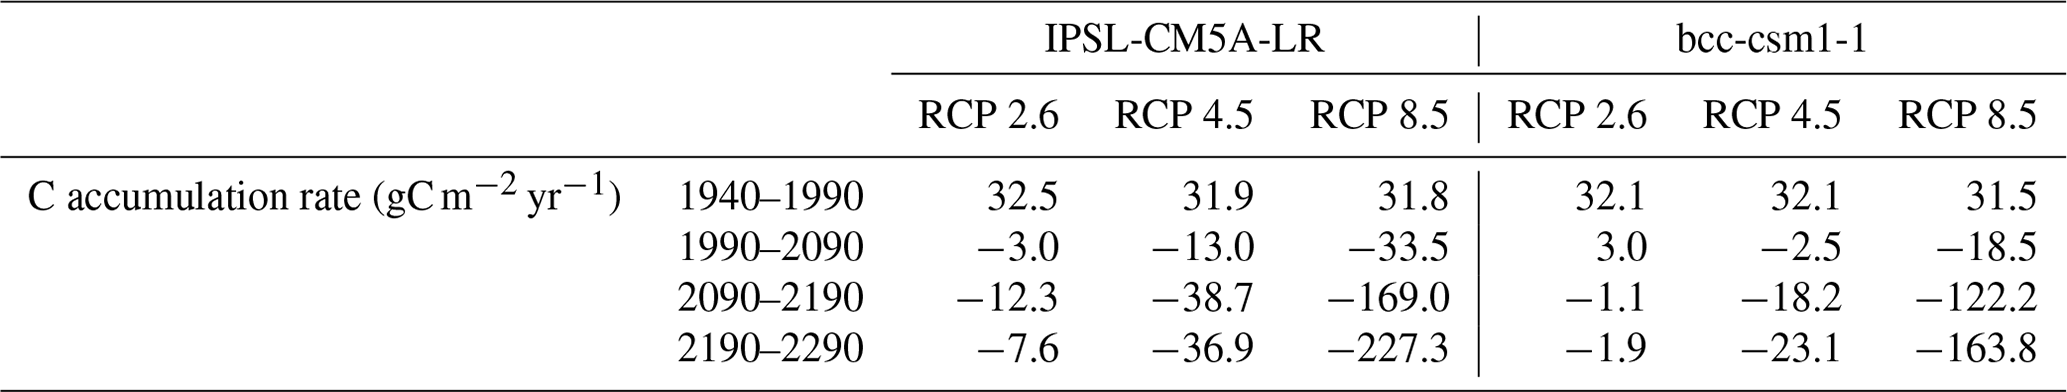
C accumulation rate is averaged from all grid cells weighted by the spatially explicit peatland area.
3.2.2 During 2100–2300
During 2100–2300, the decrease in decomposition rate is simulated in RCPs 2.6 and 4.5 with both forcings, while the decomposition rate becomes higher under RCP 8.5 (Table 2). Under RCP 2.6, the decrease in decomposition is driven by the colder and wetter climate (Fig. 4), while with IPSL-CM5A-LR forcing the decrease in C stock also influences decomposition rate negatively. In contrast, under RCP 4.5 where climate becomes warmer and drier, the decrease in decomposition rate is mostly driven by the lower C stock available for decomposition. However, under RCP 8.5 where the climate change is more severe, the positive effect of warming and drying overrides the negative effect of insufficient C stock and thereby the decomposition rate keeps increasing (Fig. 6(3, 4a–c), Table 2).
During 2100–2300, NPP in all scenarios decreases except for bcc-csm1-1 RCP 4.5 (Fig. 6(2a–b), Table 2). For both forcings, under RCPs 2.6 and 4.5, the PFT distribution is stable after 2100 (Supplement Fig. S11(1, 2a–b)). Therefore, NPP is driven by the balance of net N mineralization and temperature. For bcc-csm1-1 RCP 4.5, the positive effect of temperature overrides the negative effect of decreasing net N mineralization, while the opposite is found in the other scenarios (Supplement Fig. 10). Under RCP 8.5, with a further herbaceous-woody switch and a decrease in net N mineralization, NPP decreases with both forcings (Fig. 6(2c), Table 2). With NPP decrease and decomposition increasing, pan-Arctic peatlands are C sources under all scenarios. In particular, with IPSL-CM5A-LR forcing, under RCPs 2.6, 4.5 and 8.5, pan-Arctic peatlands are sources of 5.9, 22.5 and 118.3 Pg C, respectively, while these values are 0.7, 12.6 and 87.6 Pg C with bcc-csm1-1 forcing, respectively (Fig. 6(1a–c), Table 2). During 2100–2300, CAR is lower than that during the 21st century. In particular, under RCPs 2.6, 4.5 and 8.5, CAR further decreases by 4.6–9.3, 23.9–25.7 and 135.5–193.8 gC m−2 yr−1 with IPSL-CM5A-LR forcing and 4.1–4.9, 15.7–20.6 and 103.7–145.3 gC m−2 yr−1 with bcc-csm1-1 forcing, respectively (Supplement Figs. S12, S13, Table 3).
3.3 Pan-Arctic peatlands C sinks in response to climate change
For both IPSL-CM5A-LR and bcc-csm1-1 forcings, the positive correlation between temperature and precipitation is found at the pan-Arctic scale (Table 4). In particular, with a 1 ∘C annual temperature increase, the annual precipitation increases by 13.84–15.33 mm yr−1 in IPSL-CM5A-LR forcing and 13.78–14.59 mm yr−1 in bcc-csm1-1 forcing. The correlation has higher R2 values in warmer scenarios. The positive correlation between temperature and precipitation is mostly found in Eurasia and northeast America, where the R2 values are also higher than in the other regions (Supplement Figs. S14, S15).
The negative correlation between temperature and pan-Arctic peatland C sink activity is found in both forcing scenarios (Table 4). In particular, with a 1 ∘C annual temperature increase, pan-Arctic peatland C sink decreases by 40.46–46.91 TgC yr−1 in IPSL-CM5A-LR forcing and 33.27–41.1 TgC yr−1 in bcc-csm1-1 forcing. The negative effect of temperature is weaker in the western Eurasia and Alaska regions, while it is stronger in the other regions where most of the current peatlands exist (Supplement Figs. 16, 17). Due to the close positive correlation between temperature and precipitation, the correlation between precipitation and pan-Arctic peatland C sink is also negative. In particular, with a 1 mm annual precipitation increase, pan-Arctic peatland C sink decreases by 2.32–3.28 TgC yr−1 in IPSL-CM5A-LR forcing and 1.85–2.92 TgC yr−1 in bcc-csm1-1 forcing (Table 4). The spatial pattern of the precipitation–C-sink correlation is consistent with the spatial pattern of a temperature–C-sink correlation (Supplement Figs. S18, S19).
At the pan-Arctic scale, a threshold annual temperature and precipitation can be found when peatlands switch from a C sink to a source. In particular, with IPSL-CM5A-LR forcing, the threshold annual temperature is −2.89 to −2.6 ∘C, the corresponding annual unfrozen day number is 169–180 d and the threshold precipitation is 479.59–482.55 mm (Supplement Fig. S24). With bcc-csm1-1 forcing, the threshold annual temperature is −2.35 to −2.09 ∘C, the corresponding annual unfrozen day number is 176–181 d and the threshold precipitation is 484.69–489.02 mm (Table 4, Supplement Fig. S24). The threshold temperature varies spatially and is mostly below −3 ∘C in the northern North American and western Eurasia regions and mostly above 1 ∘C in the lower-latitude regions (Supplement Fig. S20). Notably, the regions with a below −3 ∘C threshold temperature tend to have higher R2 values (Supplement Fig. S21). The spatial pattern of the precipitation threshold is consistent with the temperature threshold, and the region with a 300–500 mm annual precipitation threshold has higher R2 values, mostly seen in northern North American and western Eurasia (Supplement Figs. S22, S23).
Table 4Relationship between pan-Arctic temperature, precipitation and C sink.
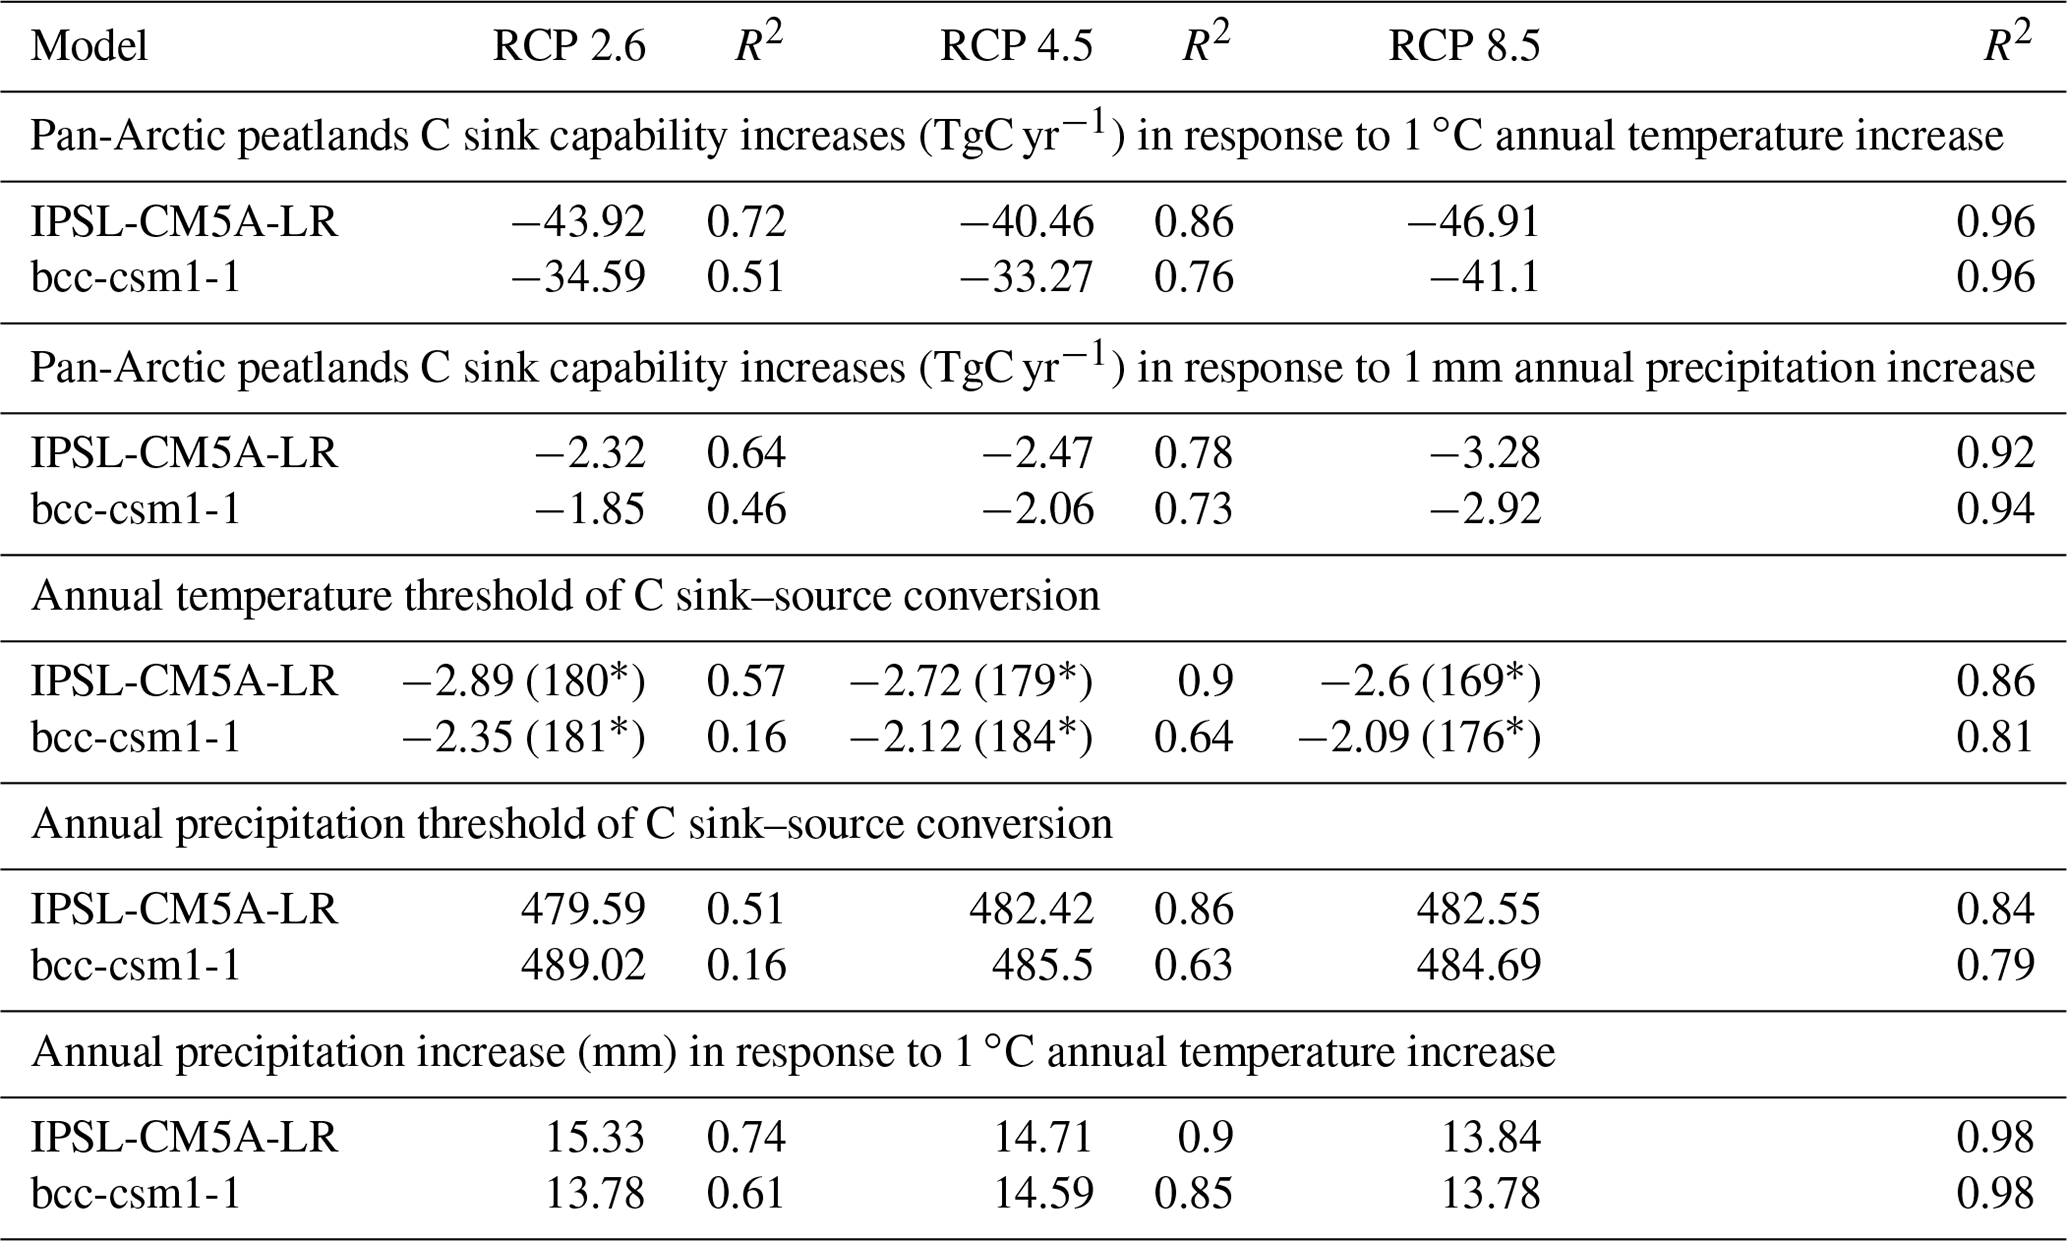
* Values are the number of unfrozen days corresponding with the threshold temperature.
4.1 Wetlands and permafrost dynamics under climate change
Wetland loss is closely related to climate change and human activities. In particular, the loss has been found globally since 1700 CE, with 64 %–71 % loss since 1900 CE (Davidson, 2014). Similarly, a more recent study has found 33 % of global wetland loss as of 2009, with 45 % loss in Europe and 8 % in North America (Hu et al., 2017). In addition, regional studies also report different scales of wetland loss in China and coastal regions (Li et al., 2018; Niu et al., 2012). To date, not many studies focus on future wetland extent simulations, and an inconsistency exists among current wetland extent datasets (Loveland et al., 2000; Friedl et al., 2002; Lehner and Döll, 2004; Bartholomé and Belward, 2005). Similar to this study, one study highlighted the vulnerability of Arctic wetland extent in the 21st century due to permafrost thaw, although most of the permafrost Arctic wetlands can remain stable under RCP 2.6 until at least 2100 (Kåresdotter et al., 2021).
The active layer depth simulated by PTEM 2.2 is compared with two datasets derived from satellite data and models, covering the pan-Arctic region and Alaska, respectively (Obu et al., 2020; Yi and Kimball, 2020). The correlation with the pan-Arctic dataset (2001–2018) is higher than the correlation with the Alaska dataset, while the overall estimation is consistent between our study and two regional datasets (Supplement Tables S4, S5). Consistent with our study, Smith et al. (2022) found deepening active layer depth since the 1990s in the permafrost region, indicating permafrost thaw could continue in a warmer future and possibly at a higher rate. The permafrost thaw progress in the 21st century agrees with the dynamics simulated by the CCSM4 model, suggesting that the CCSM4 permafrost area shrinks by 64 % by 2100 under RCP 8.5 compared to our estimation of 530 %–60 % in this study (Lawrence et al., 2012).
4.2 Future productivity and decomposition in northern peatlands
In this study, NPP does not always increase under warmer climate due to PFT switch and net N mineralization rate limiting. The overall trend of pan-Arctic peatland PFT switch is the expansion of woody plants and shrinking of herbaceous plants (Supplement Fig. S11). A previous study found that peatland WTD deepening benefits shrub dominance, while it suppresses forbs and mosses (Mäkiranta et al., 2018). Meanwhile, shrub expansion is reported in Alaska, Siberian and across the pan-Arctic region under historical climate warming (Tape et al., 2006; Blok et al., 2010). Furthermore, the simulation based on LPJ-GUESS also predicts a higher proportion of shrub NPP in lower-latitude regions due to high insolation and deep WTD (Chaudhary et al., 2020). These studies support our findings that the future warmer and drier conditions are the driver for PFT switch and benefit woody plants. Notably, the fraction of woody plants could be overestimated because the PFTs in the potential peatlands are included, where the WTD is usually lower than the existing peatlands and is more suitable for woody plants (Supplement Fig. S11). In the previous PTEM simulation for 15 ka–1990, when these potential peatlands are not included and WTD is not derived from TOPMODEL, the fraction of herbaceous plants is generally higher than the fraction in this study (Zhao et al., 2022b).
In PTEM 2.2, the net N mineralization rate is related to soil moisture (Zhao et al., 2022b). Therefore, whether future peatlands become more nutrient rich depends on the balance between the positive effect of higher temperature and the negative effect of lower soil moisture. A site-level study on an ombrotrophic bog has found increased plant-available ammonium under multi-year warming treatment (Iversen et al., 2022). The negative effect of drier soil overwhelms the influence of temperature and thereby net N mineralization rate decrease under RCP 8.5 after 2100 (Supplement Fig. S10). Under an N-limiting condition, the modeling study with LPX-Bern 1.0 (Land surface Processes and eXchanges model, Bern version 1.0) found peatlands switch from a C sink to a source under RCP 8.5 with a slow NPP increase, which is consistent with our simulation with bcc-csm1-1 forcing (Spahni et al., 2013).
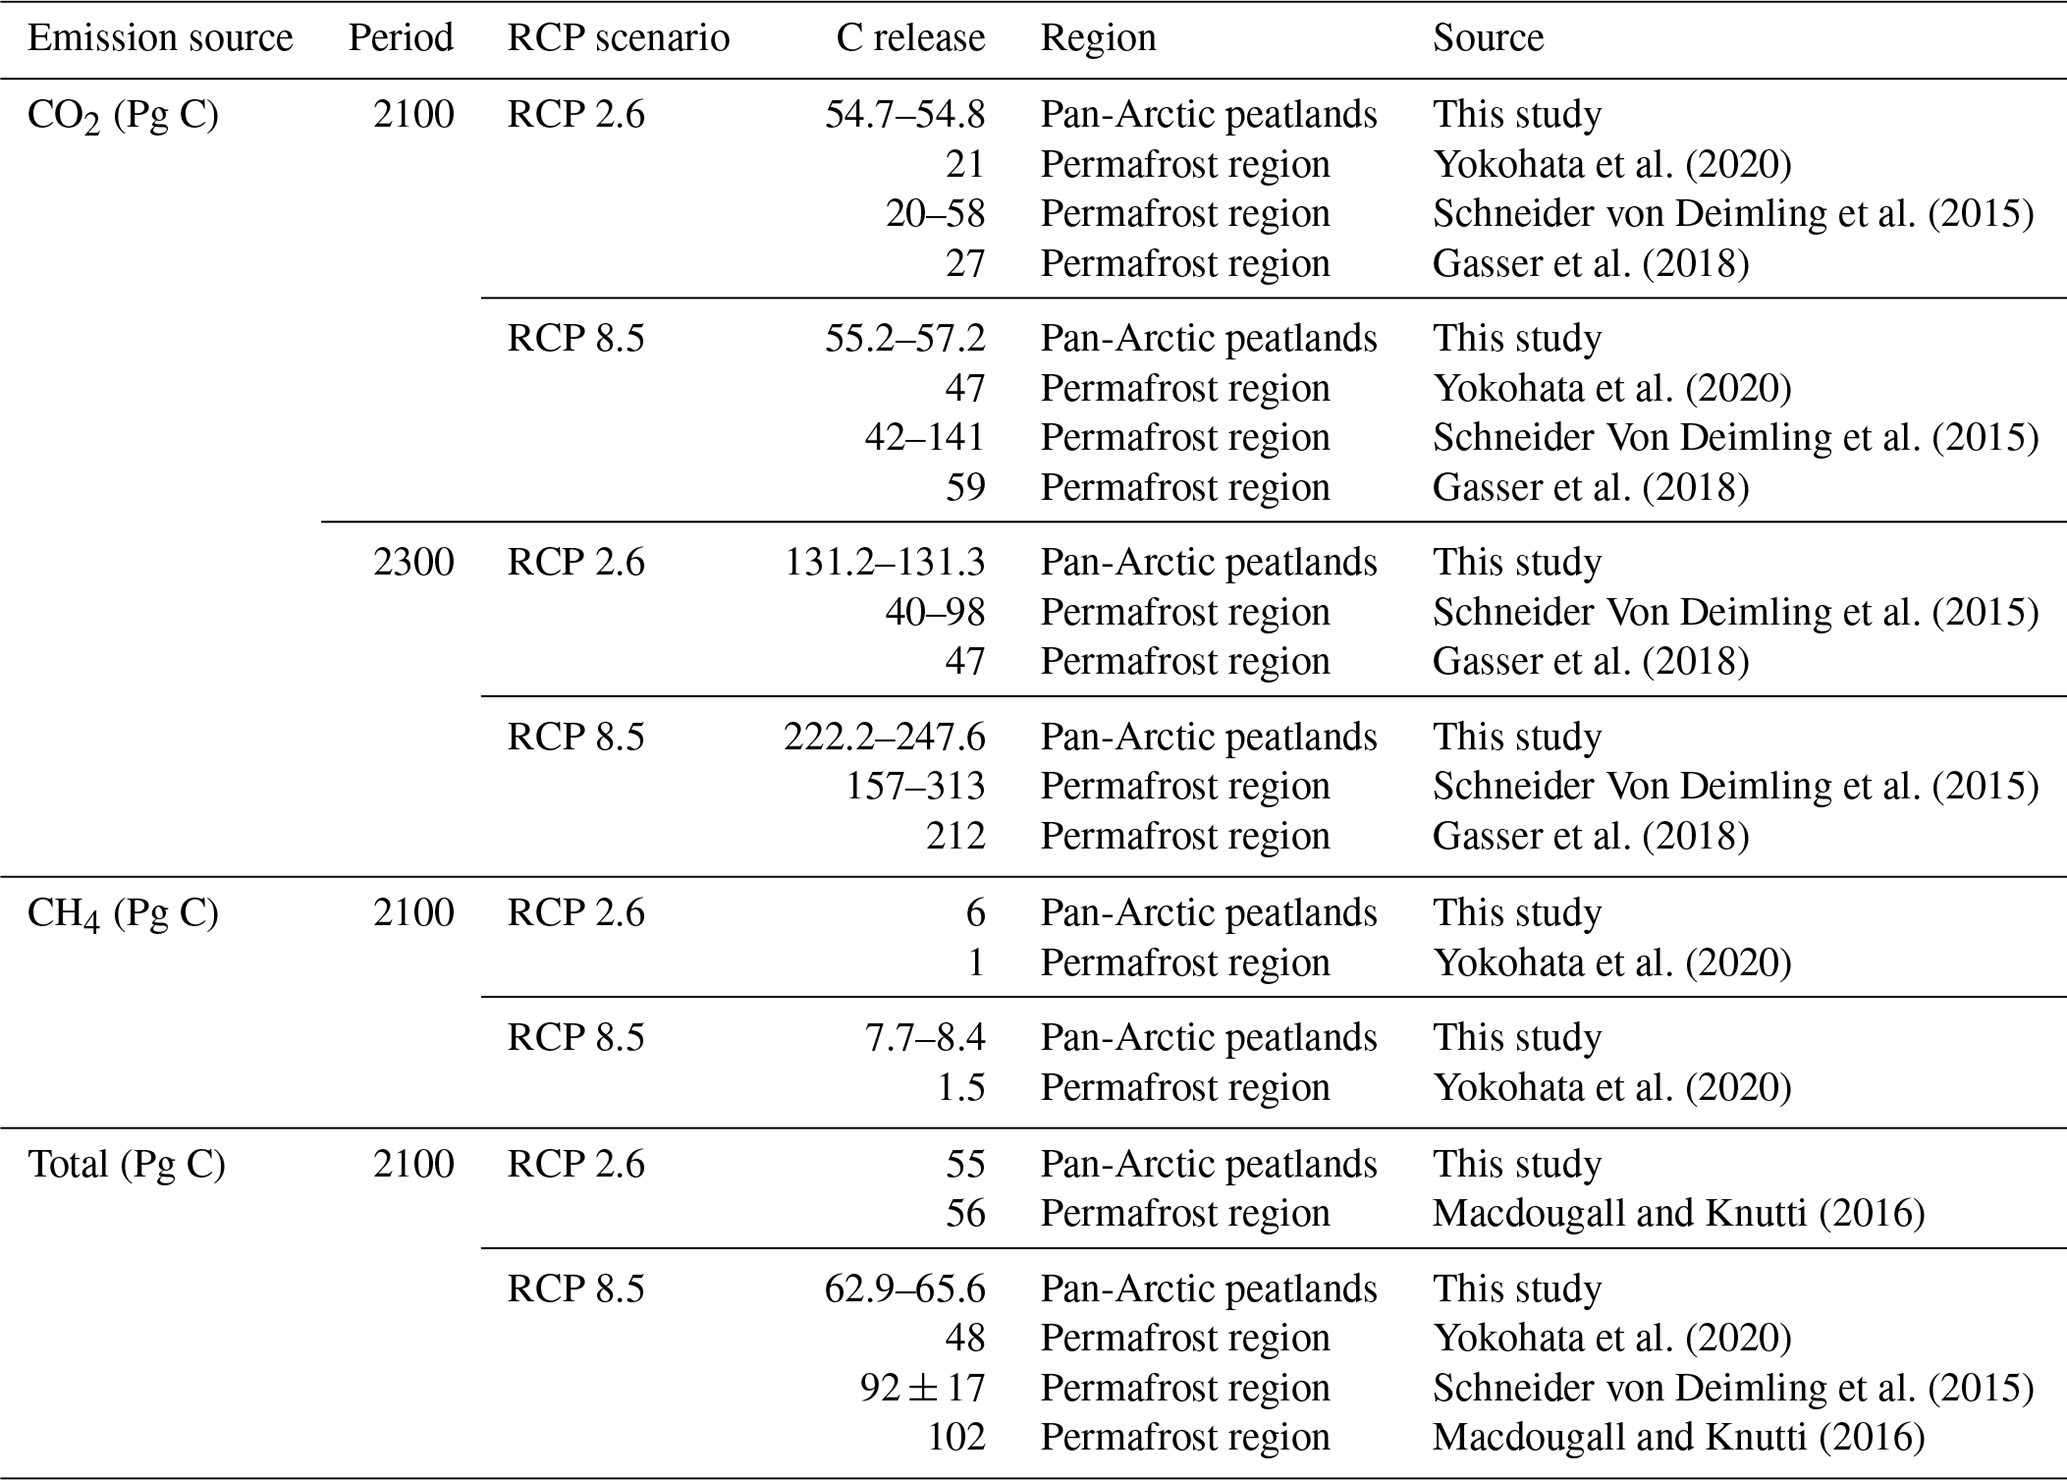
Warming affects decomposition mainly in three ways. First, there is higher decomposition rate due to the lower WTD under warming climate conditions (Huang et al., 2021). Second, higher temperature also enhances decomposition more than productivity (Tang et al., 2022). Third, in high-latitude regions, the soil C decomposition rate is likely to increase under warmer climate and permafrost thaw conditions (Yokohata et al., 2020; Schneider von Deimling et al., 2015; Gasser et al., 2018; MacDougall and Knutti, 2016; Schuur et al., 2015). In the warming future, the estimation of CO2 release under RCP 2.6 tends to be higher than the values estimated from other models (by 2100, 54.7–54.8 Pg C in this study vs. 20–58 Pg C in literature; by 2300, 131.2–131.3 Pg C in this study vs. 40–98 Pg C in literature, Table 5). However, the estimation under RCP 8.5 is closer (by 2100, 55.2–57.2 Pg C in this study vs. 42–141 Pg C in literature; by 2300, 222.2–247.6 Pg C in this study vs. 157–313 Pg C in literature) (Yokohata et al., 2020; Schneider von Deimling et al., 2015; Gasser et al., 2018) (Table 5). The CH4 emission estimation is also higher than that in Yokohata (2020) by 5–6 Pg C by 2100, while the total C emission is close to the estimation of MacDougall (2016) (55 Pg C vs. 56 Pg C).
Table 5Comparison of cumulative C emissions between this study and literature.
4.3 Northern peatland C sink and source shift
Our estimated CAR during 1990–2000 is 19.17–22.73 gC m−2 yr−1, which is lower than that by Chaudhary et al. (2020) during the same period (33.9 gC m−2 yr−1). However, our estimated CAR is closer to the core-based Holocene CAR (18.6–22.9 gC m−2 yr−1) (Yu et al., 2009; Loisel et al., 2014). In this study, the estimated pan-Arctic peatlands annual CH4 emissions are 28.7 TgC yr−1 during 1990–2000, 33.0 TgC yr−1 during 1990–2000 and 38.5 TgC yr−1 during 2000–2020. The estimation after 1990 is close to the 36.0 TgC yr−1 in Kleinen et al. (2020), while it is larger than the 25.0 TgC yr−1 reconstructed from historical data (Treat et al., 2021). However, the difference between our study and Treat et al. (2021) might result from the different peatland coverages used in two studies. Under the peatland coverage of Nichols and Peteet (2019), the CH4 emissions in Treat et al. (2021) were 32.3–43.5 TgC yr−1, which agrees better with our estimates.
Multiple studies have indicated there is a C loss trend of northern ecosystems under a warming climate (Hanson et al., 2020; Piao et al., 2008; Helbig et al., 2017). In particular, the peatland experiment in Minnesota, USA, suggests that each 1 ∘C of warming increases the C loss rate by 31.3 gC m−2 yr−1 (Hanson et al., 2020). Similarly, another site-level study on a Canadian boreal-wetland biome shows a decline in CO2 uptake from 25 ± 14 gC m−2 yr−1 to 103 ± 38 gC m−2 yr−1 by 2100 depending on the warming scenarios (Helbig et al., 2017). These studies are consistent with our estimates, suggesting that northern peatland CAR during 1990–2100 is lower than that during 1940–1990 by 29.1–63.5 gC m−2 yr−1.
At the regional scale, whether northern peatlands will switch from a C sink to a C source is still uncertain. For example, Gallego-Sala et al. (2018) indicates northern peatlands are likely to sequester more C under RCP 2.6 and RCP 8.5 until 2100. Chaudhary et al. (2020), however, indicate that the C sink capacity of northern peatlands will decreases under RCP 8.5 after 2050. Similarly, McGuire et al. (2018) suggest northern permafrost regions could be C sources after 2100 unless under aggressive climate change mitigation pathways. Furthermore, Qiu et al. (2022) simulates northern peatlands dynamics until 2300, suggesting a sink–source shift under RCP 8.5 but no such shift under RCP 2.6. Although conclusions vary among studies, they generally suggest a higher C source possibility under warmer scenarios, which agrees with the negative correlation between temperature and C sink capacity from this study. Furthermore, the arguments that northern peatlands keep being C sinks under RCP 2.6 (Gallego-Sala et al., 2018; Qiu et al., 2022) is consistent with our study under bcc-csm1-1 forcing. However, different from previous works (Gallego-Sala et al., 2018; Qiu et al., 2022; McGuire et al., 2018; Chaudhary et al., 2020), our study predicts northern peatlands to be C sources under RCP 2.6 before 2100 with IPSL-CM5A-LR forcing. In addition, the C sink–source switch will occur before 2100 under RCP 4.5 and RCP 8.5. Except for the future decomposition increase, which is common among model predictions (Yokohata et al., 2020; Schneider Von Deimling et al., 2015; Gasser et al., 2018; Macdougall and Knutti, 2016; Schuur et al., 2015), these differences are mainly due to the suppressed NPP in this study.
Northern peatland responses to future climate change during 1990–2300 are simulated with PTEM. The peatlands' shrinking or expansion, peat accumulation, and decomposition processes are considered. Two sets of CMIP5 forcing data (IPSL-CM5A-LR and bcc-csm1-1) are used to drive the model with three warming scenarios (RCP 2.6, RCP 4.5 and RCP 8.5). We found that wetlands will shrink and permafrost will thaw under all scenarios, indicating pan-Arctic peatlands becoming warmer and drier. The northern peatland area expands under RCP 2.6 and RCP 4.5, while it shrinks under RCP 8.5 due to the shrinkage of the area with over 30 cm peat thickness under a high decomposition rate. NPP does not always increase with temperature because of the PFT switch and N-limiting effects. However, both CO2 and CH4 emissions increase with temperature due to lower WTD, thawing permafrost and higher temperature. By 2100, northern peatlands will be a minor C sink of 0.8 Pg C under RCP 2.6 with bcc-csm1-1 forcing, while they will be C sources under other scenarios. During 2100–2300, northern peatlands are C sources under all scenarios, the warmer climate resulting in the larger C source. There are negative correlations between temperature and northern peatland C sinks under all scenarios. The negative correlation between precipitation and northern peatland C sinks is also found under all scenarios, which is likely due to the positive correlation between temperature and precipitation. When pan-Arctic annual temperature is −2.89 to −2.6 ∘C with IPSL-CM5A-LR forcing or −2.35 to −2.09 ∘C with bcc-csm1-1 forcing, the northern peatlands switch from a C sink to a source. Similarly, this threshold for annual precipitation is 479.59–482.55 mm with IPSL-CM5A-LR forcing and 484.69–489.02 mm with bcc-csm1-1 forcing. Our study highlights that the current northern peatlands C sink might shift to a source under future warming and drying climate conditions.
The data used to reproduce figures in both the text and the Supplement, PTEM 2.2 codes, model, and samples of running directory can be accessed via the Purdue University Research Repository https://doi.org/10.4231/QP7V-V527 (Zhao and Zhuang, 2022).
The supplement related to this article is available online at: https://doi.org/10.5194/bg-20-251-2023-supplement.
BZ was responsible for model revision, model simulation and paper writing. QZ was responsible for project design and paper revision.
The contact author has declared that neither of the authors has any competing interests.
Publisher’s note: Copernicus Publications remains neutral with regard to jurisdictional claims in published maps and institutional affiliations.
This article is part of the special issue “Global change effects on terrestrial biogeochemistry at the plant–soil interface”. It is not associated with a conference.
This research has been supported by the National Science Foundation (grant no. 1802832).
This paper was edited by Albert C. Brangarí and reviewed by three anonymous referees.
Allen, R. G., Pereira, L. S., Raes, D., and Smith, M.: Crop evapotranspiration – Guidelines for computing crop water requirements – FAO Irrigation and drainage paper, 56, ISBN 92-5-104219-5, 1998.
Bartholomé, E. and Belward, A. S.: GLC2000: a new approach to global land cover mapping from Earth observation data, Int. J. Remote Sens., 26, 1959–1977, https://doi.org/10.1080/01431160412331291297, 2005.
Beven, K. J. and Kirkby, M. J.: A physically based, variable contributing area model of basin hydrology / Un modèle à base physique de zone d'appel variable de l'hydrologie du bassin versant, Hydrol. Sci. Bull., 24, 43–69, https://doi.org/10.1080/02626667909491834, 1979.
Blok, D., Heijmans, M. M. P. D., Schaepman-Strub, G., Kononov, A. V., Maximov, T. C., and Berendse, F.: Shrub expansion may reduce summer permafrost thaw in Siberian tundra, Glob. Change Biol., 16, 1296–1305, https://doi.org/10.1111/j.1365-2486.2009.02110.x, 2010.
Bohn, T. J., Podest, E., Schroeder, R., Pinto, N., McDonald, K. C., Glagolev, M., Filippov, I., Maksyutov, S., Heimann, M., Chen, X., and Lettenmaier, D. P.: Modeling the large-scale effects of surface moisture heterogeneity on wetland carbon fluxes in the West Siberian Lowland, Biogeosciences, 10, 6559–6576, https://doi.org/10.5194/bg-10-6559-2013, 2013.
Brooks, R. H.: Hydraulic properties of porous media, Ph.D., Colorado State University, Ann Arbor, 101 pp., 1965.
Carter, A. J. and Scholes, R. J.: SoilData v2.0: Generating a Global Database of Soil Properties CSIR Environmentek, Pretoria, South Africa, 2000.
Chaudhary, N., Miller, P. A., and Smith, B.: Modelling past, present and future peatland carbon accumulation across the pan-Arctic region, Biogeosciences, 14, 4023–4044, https://doi.org/10.5194/bg-14-4023-2017, 2017.
Chaudhary, N., Westermann, S., Lamba, S., Shurpali, N., Sannel, A. B. K., Schurgers, G., Miller, P. A., and Smith, B.: Modelling past and future peatland carbon dynamics across the pan-Arctic, Glob. Change Biol., 26, 4119–4133, https://doi.org/10.1111/gcb.15099, 2020.
Davidson, N. C.: How much wetland has the world lost? Long-term and recent trends in global wetland area, Mar. Fresh. Res., 65, 934–941, https://doi.org/10.1071/MF14173, 2014.
Fan, Y., Li, H., and Miguez-Macho, G.: Global Patterns of Groundwater Table Depth, Science, 339, 940–943, 2013.
FAO/UNESCO: Soil Map of the World, Food and Agriculture Organization of the United Nations, Paris, ISBN: 92-3-101125-1, 1974.
Finger Higgens, R. A., Chipman, J. W., Lutz, D. A., Culler, L. E., Virginia, R. A., and Ogden, L. A.: Changing Lake Dynamics Indicate a Drier Arctic in Western Greenland, J. Geophys. Res.-Biogeo., 124, 870–883, https://doi.org/10.1029/2018JG004879, 2019.
Finlayson, C. M. and Milton, G. R.: Peatlands, in: The Wetland Book: II: Distribution, Description, and Conservation, edited by: Finlayson, C. M., Milton, G. R., Prentice, R. C., and Davidson, N. C., Springer Netherlands, Dordrecht, 227–244, https://doi.org/10.1007/978-94-007-4001-3_202, 2018.
Franchini, M. and Pacciani, M.: Comparative analysis of several conceptual rainfall-runoff models, J. Hydrol., 122, 161–219, https://doi.org/10.1016/0022-1694(91)90178-K, 1991.
Friedl, M. A., McIver, D. K., Hodges, J. C. F., Zhang, X. Y., Muchoney, D., Strahler, A. H., Woodcock, C. E., Gopal, S., Schneider, A., Cooper, A., Baccini, A., Gao, F., and Schaaf, C.: Global land cover mapping from MODIS: algorithms and early results, Remote Sens. Environ., 83, 287–302, https://doi.org/10.1016/S0034-4257(02)00078-0, 2002.
Gallego-Sala, A. V., Charman, D. J., Brewer, S., Page, S. E., Prentice, I. C., Friedlingstein, P., Moreton, S., Amesbury, M. J., Beilman, D. W., Björck, S., Blyakharchuk, T., Bochicchio, C., Booth, R. K., Bunbury, J., Camill, P., Carless, D., Chimner, R. A., Clifford, M., Cressey, E., Courtney-Mustaphi, C., De Vleeschouwer, F., de Jong, R., Fialkiewicz-Koziel, B., Finkelstein, S. A., Garneau, M., Githumbi, E., Hribjlan, J., Holmquist, J., Hughes, P. D. M., Jones, C., Jones, M. C., Karofeld, E., Klein, E. S., Kokfelt, U., Korhola, A., Lacourse, T., Le Roux, G., Lamentowicz, M., Large, D., Lavoie, M., Loisel, J., Mackay, H., MacDonald, G. M., Makila, M., Magnan, G., Marchant, R., Marcisz, K., Martínez Cortizas, A., Massa, C., Mathijssen, P., Mauquoy, D., Mighall, T., Mitchell, F. J. G., Moss, P., Nichols, J., Oksanen, P. O., Orme, L., Packalen, M. S., Robinson, S., Roland, T. P., Sanderson, N. K., Sannel, A. B. K., Silva-Sánchez, N., Steinberg, N., Swindles, G. T., Turner, T. E., Uglow, J., Väliranta, M., van Bellen, S., van der Linden, M., van Geel, B., Wang, G., Yu, Z., Zaragoza-Castells, J., and Zhao, Y.: Latitudinal limits to the predicted increase of the peatland carbon sink with warming, Nat. Clim. Change, 8, 907–913, https://doi.org/10.1038/s41558-018-0271-1, 2018.
Gandois, L., Hoyt, A. M., Hatté, C., Jeanneau, L., Teisserenc, R., Liotaud, M., and Tananaev, N.: Contribution of Peatland Permafrost to Dissolved Organic Matter along a Thaw Gradient in North Siberia, Environ. Sci. Technol., 53, 14165–14174, https://doi.org/10.1021/acs.est.9b03735, 2019.
Gasser, T., Kechiar, M., Ciais, P., Burke, E. J., Kleinen, T., Zhu, D., Huang, Y., Ekici, A., and Obersteiner, M.: Path-dependent reductions in CO2 emission budgets caused by permafrost carbon release, Nat. Geosci., 11, 830–835, https://doi.org/10.1038/s41561-018-0227-0, 2018.
GISTEMP-Team: GISS Surface Temperature Analysis (GISTEMP), version 4, NASA Goddard Institute for Space Studies [dataset], https://data.giss.nasa.gov/gistemp/ (last access date: 1 November 2023), 2021.
Hamman, J. J., Nijssen, B., Bohn, T. J., Gergel, D. R., and Mao, Y.: The Variable Infiltration Capacity model version 5 (VIC-5): infrastructure improvements for new applications and reproducibility, Geosci. Model Dev., 11, 3481–3496, https://doi.org/10.5194/gmd-11-3481-2018, 2018.
Hanson, P. J., Griffiths, N. A., Iversen, C. M., Norby, R. J., Sebestyen, S. D., Phillips, J. R., Chanton, J. P., Kolka, R. K., Malhotra, A., Oleheiser, K. C., Warren, J. M., Shi, X., Yang, X., Mao, J., and Ricciuto, D. M.: Rapid Net Carbon Loss From a Whole-Ecosystem Warmed Peatland, AGU Advances, 1, e2020AV000163, https://doi.org/10.1029/2020AV000163, 2020.
Harris, I., Jones, P. D., Osborn, T. J., and Lister, D. H.: Updated high-resolution grids of monthly climatic observations – the CRU TS3.10 Dataset, Int. J. Climatol., 34, 623–642, https://doi.org/10.1002/joc.3711, 2014.
He, F.: Simulating transient climate evolution of the last deglaciation with CCSM3, Atmospheric and Oceanic Sciences, University of Wisconsin-Madison, Madison, 2011.
Helbig, M., Chasmer, L. E., Desai, A. R., Kljun, N., Quinton, W. L., and Sonnentag, O.: Direct and indirect climate change effects on carbon dioxide fluxes in a thawing boreal forest–wetland landscape, Glob. Change Biol., 23, 3231–3248, https://doi.org/10.1111/gcb.13638, 2017.
Hu, S., Niu, Z., Chen, Y., Li, L., and Zhang, H.: Global wetlands: Potential distribution, wetland loss, and status, Sci. Total Environ., 586, 319–327, https://doi.org/10.1016/j.scitotenv.2017.02.001, 2017.
Huang, Y., Ciais, P., Luo, Y., Zhu, D., Wang, Y., Qiu, C., Goll, D. S., Guenet, B., Makowski, D., De Graaf, I., Leifeld, J., Kwon, M. J., Hu, J., and Qu, L.: Tradeoff of CO2 and CH4 emissions from global peatlands under water-table drawdown, Nat. Clim. Change, 11, 618–622, https://doi.org/10.1038/s41558-021-01059-w, 2021.
Hugelius, G., Bockheim, J. G., Camill, P., Elberling, B., Grosse, G., Harden, J. W., Johnson, K., Jorgenson, T., Koven, C. D., Kuhry, P., Michaelson, G., Mishra, U., Palmtag, J., Ping, C. L., O'Donnell, J., Schirrmeister, L., Schuur, E. A. G., Sheng, Y., Smith, L. C., Strauss, J., and Yu, Z.: A new data set for estimating organic carbon storage to 3 m depth in soils of the northern circumpolar permafrost region, Earth Syst. Sci. Data, 5, 393–402, https://doi.org/10.5194/essd-5-393-2013, 2013.
Hugelius, G., Loisel, J., Chadburn, S., Jackson, R. B., Jones, M., MacDonald, G., Marushchak, M., Olefeldt, D., Packalen, M., Siewert, M. B., Treat, C., Turetsky, M., Voigt, C., and Yu, Z.: Large stocks of peatland carbon and nitrogen are vulnerable to permafrost thaw, P. Natl. Acad. Sci. USA, 117, 20438, https://doi.org/10.1073/pnas.1916387117, 2020.
Iversen, C. M., Latimer, J., Brice, D. J., Childs, J., Vander Stel, H. M., Defrenne, C. E., Graham, J., Griffiths, N. A., Malhotra, A., Norby, R. J., Oleheiser, K. C., Phillips, J. R., Salmon, V. G., Sebestyen, S. D., Yang, X., and Hanson, P. J.: Whole-Ecosystem Warming Increases Plant-Available Nitrogen and Phosphorus in an Ombrotrophic Bog, Ecosystems, https://doi.org/10.1007/s10021-022-00744-x, 2022.
Kåresdotter, E., Destouni, G., Ghajarnia, N., Hugelius, G., and Kalantari, Z.: Mapping the Vulnerability of Arctic Wetlands to Global Warming, Earth's Future, 9, e2020EF001858, https://doi.org/10.1029/2020EF001858, 2021.
Kleinen, T., Mikolajewicz, U., and Brovkin, V.: Terrestrial methane emissions from the Last Glacial Maximum to the preindustrial period, Clim. Past, 16, 575–595, https://doi.org/10.5194/cp-16-575-2020, 2020.
Lawrence, D. M., Slater, A. G., and Swenson, S. C.: Simulation of Present-Day and Future Permafrost and Seasonally Frozen Ground Conditions in CCSM4, J. Clim., 25, 2207–2225, https://doi.org/10.1175/JCLI-D-11-00334.1, 2012.
Lehner, B. and Döll, P.: Development and validation of a global database of lakes, reservoirs and wetlands, J. Hydrol., 296, 1–22, https://doi.org/10.1016/j.jhydrol.2004.03.028, 2004.
Li, X., Bellerby, R., Craft, C., and Widney, S. E.: Coastal wetland loss, consequences, and challenges for restoration, Anthropocene Coasts, 1, 1–15, https://doi.org/10.1139/anc-2017-0001, 2018.
Liang, X., Lettenmaier, D. P., Wood, E. F., and Burges, S. J.: A simple hydrologically based model of land surface water and energy fluxes for general circulation models, J. Geophys. Res.-Atmos., 99, 14415–14428, https://doi.org/10.1029/94JD00483, 1994.
Liu, C., Sun, G., McNulty, S. G., Noormets, A., and Fang, Y.: Environmental controls on seasonal ecosystem evapotranspiration/potential evapotranspiration ratio as determined by the global eddy flux measurements, Hydrol. Earth Syst. Sci., 21, 311–322, https://doi.org/10.5194/hess-21-311-2017, 2017.
Loisel, J., Yu, Z., Beilman, D. W., Camill, P., Alm, J., Amesbury, M. J., Anderson, D., Andersson, S., Bochicchio, C., Barber, K., Belyea, L. R., Bunbury, J., Chambers, F. M., Charman, D. J., De Vleeschouwer, F., Fiałkiewicz-Kozieł, B., Finkelstein, S. A., Gałka, M., Garneau, M., Hammarlund, D., Hinchcliffe, W., Holmquist, J., Hughes, P., Jones, M. C., Klein, E. S., Kokfelt, U., Korhola, A., Kuhry, P., Lamarre, A., Lamentowicz, M., Large, D., Lavoie, M., MacDonald, G., Magnan, G., Mäkilä, M., Mallon, G., Mathijssen, P., Mauquoy, D., McCarroll, J., Moore, T. R., Nichols, J., O'Reilly, B., Oksanen, P., Packalen, M., Peteet, D., Richard, P. J. H., Robinson, S., Ronkainen, T., Rundgren, M., Sannel, A. B. K., Tarnocai, C., Thom, T., Tuittila, E.-S., Turetsky, M., Väliranta, M., van der Linden, M., van Geel, B., van Bellen, S., Vitt, D., Zhao, Y., and Zhou, W.: A database and synthesis of northern peatland soil properties and Holocene carbon and nitrogen accumulation, The Holocene, 24, 1028–1042, https://doi.org/10.1177/0959683614538073, 2014.
Loisel, J., Gallego-Sala, A. V., Amesbury, M. J., Magnan, G., Anshari, G., Beilman, D. W., Benavides, J. C., Blewett, J., Camill, P., Charman, D. J., Chawchai, S., Hedgpeth, A., Kleinen, T., Korhola, A., Large, D., Mansilla, C. A., Müller, J., van Bellen, S., West, J. B., Yu, Z., Bubier, J. L., Garneau, M., Moore, T., Sannel, A. B. K., Page, S., Väliranta, M., Bechtold, M., Brovkin, V., Cole, L. E. S., Chanton, J. P., Christensen, T. R., Davies, M. A., De Vleeschouwer, F., Finkelstein, S. A., Frolking, S., Gałka, M., Gandois, L., Girkin, N., Harris, L. I., Heinemeyer, A., Hoyt, A. M., Jones, M. C., Joos, F., Juutinen, S., Kaiser, K., Lacourse, T., Lamentowicz, M., Larmola, T., Leifeld, J., Lohila, A., Milner, A. M., Minkkinen, K., Moss, P., Naafs, B. D. A., Nichols, J., O'Donnell, J., Payne, R., Philben, M., Piilo, S., Quillet, A., Ratnayake, A. S., Roland, T. P., Sjögersten, S., Sonnentag, O., Swindles, G. T., Swinnen, W., Talbot, J., Treat, C., Valach, A. C., and Wu, J.: Expert assessment of future vulnerability of the global peatland carbon sink, Nat. Clim. Change, 11, 70–77, https://doi.org/10.1038/s41558-020-00944-0, 2021.
Loveland, T. R., Reed, B. C., Brown, J. F., Ohlen, D. O., Zhu, Z., Yang, L., and Merchant, J. W.: Development of a global land cover characteristics database and IGBP DISCover from 1 km AVHRR data, Int. J. Remote Sens., 21, 1303–1330, https://doi.org/10.1080/014311600210191, 2000.
Lu, X. and Zhuang, Q.: Modeling methane emissions from the Alaskan Yukon River basin, 1986–2005, by coupling a large-scale hydrological model and a process-based methane model, J. Geophys. Res.-Biogeo., 117, https://doi.org/10.1029/2011JG001843, 2012.
MacDougall, A. H. and Knutti, R.: Projecting the release of carbon from permafrost soils using a perturbed parameter ensemble modelling approach, Biogeosciences, 13, 2123–2136, https://doi.org/10.5194/bg-13-2123-2016, 2016.
Mäkiranta, P., Laiho, R., Mehtätalo, L., Straková, P., Sormunen, J., Minkkinen, K., Penttilä, T., Fritze, H., and Tuittila, E.: Responses of phenology and biomass production of boreal fens to climate warming under different water-table level regimes, Glob. Change Biol., 24, 944–956, https://doi.org/10.1111/gcb.13934, 2018.
Marthews, T. R., Dadson, S. J., Lehner, B., Abele, S., and Gedney, N.: High-resolution global topographic index values for use in large-scale hydrological modelling, Hydrol. Earth Syst. Sci., 19, 91–104, https://doi.org/10.5194/hess-19-91-2015, 2015.
McGuire, A. D., Lawrence, D. M., Koven, C., Clein, J. S., Burke, E., Chen, G., Jafarov, E., MacDougall, A. H., Marchenko, S., Nicolsky, D., Peng, S., Rinke, A., Ciais, P., Gouttevin, I., Hayes, D. J., Ji, D., Krinner, G., Moore, J. C., Romanovsky, V., Schädel, C., Schaefer, K., Schuur, E. A. G., and Zhuang, Q.: Dependence of the evolution of carbon dynamics in the northern permafrost region on the trajectory of climate change, P. Natl. Acad. Sci. USA, 115, 3882, https://doi.org/10.1073/pnas.1719903115, 2018.
Meinshausen, M., Smith, S. J., Calvin, K., Daniel, J. S., Kainuma, M. L. T., Lamarque, J. F., Matsumoto, K., Montzka, S. A., Raper, S. C. B., Riahi, K., Thomson, A., Velders, G. J. M., and van Vuuren, D. P. P.: The RCP greenhouse gas concentrations and their extensions from 1765 to 2300, Climatic Change, 109, 213, https://doi.org/10.1007/s10584-011-0156-z, 2011.
Melton, J. R., Chan, E., Millard, K., Fortier, M., Winton, R. S., Martín-López, J. M., Cadillo-Quiroz, H., Kidd, D., and Verchot, L. V.: A map of global peatland extent created using machine learning (Peat-ML), Geosci. Model Dev., 15, 4709–4738, https://doi.org/10.5194/gmd-15-4709-2022, 2022.
Miao, C., Duan, Q., Sun, Q., Huang, Y., Kong, D., Yang, T., Ye, A., Di, Z., and Gong, W.: Assessment of CMIP5 climate models and projected temperature changes over Northern Eurasia, Environ. Res. Lett., 9, 055007, https://doi.org/10.1088/1748-9326/9/5/055007, 2014.
Müller, J. and Joos, F.: Committed and projected future changes in global peatlands – continued transient model simulations since the Last Glacial Maximum, Biogeosciences, 18, 3657–3687, https://doi.org/10.5194/bg-18-3657-2021, 2021.
Nichols, J. E. and Peteet, D. M.: Rapid expansion of northern peatlands and doubled estimate of carbon storage, Nat. Geosci., 12, 917–921, https://doi.org/10.1038/s41561-019-0454-z, 2019.
Niu, Z., Zhang, H., Wang, X., Yao, W., Zhou, D., Zhao, K., Zhao, H., Li, N., Huang, H., Li, C., Yang, J., Liu, C., Liu, S., Wang, L., Li, Z., Yang, Z., Qiao, F., Zheng, Y., Chen, Y., Sheng, Y., Gao, X., Zhu, W., Wang, W., Wang, H., Weng, Y., Zhuang, D., Liu, J., Luo, Z., Cheng, X., Guo, Z., and Gong, P.: Mapping wetland changes in China between 1978 and 2008, Chinese Sci. Bull., 57, 2813–2823, https://doi.org/10.1007/s11434-012-5093-3, 2012.
Obu, J., Westermann, S., Barboux, C., Bartsch, A., Delaloye, R., Grosse, G., Heim, B., Hugelius, G., Irrgang, A., Kääb, A. M., Kroisleitner, C., Matthes, H., Nitze, I., Pellet, C., Seifert, F. M., Strozzi, T., Wegmüller, U., Wieczorek, M., and Wiesmann, A.: ESA Permafrost Climate Change Initiative (Permafrost_cci): Permafrost Climate Research Data Package v1., Centre for Environmental Data Analysis [dataset], https://catalogue.ceda.ac.uk/uuid/1f88068e86304b0fbd34456115b6606f (last access: 1 November 2023), 2020.
Olefeldt, D., Hovemyr, M., Kuhn, M. A., Bastviken, D., Bohn, T. J., Connolly, J., Crill, P., Euskirchen, E. S., Finkelstein, S. A., Genet, H., Grosse, G., Harris, L. I., Heffernan, L., Helbig, M., Hugelius, G., Hutchins, R., Juutinen, S., Lara, M. J., Malhotra, A., Manies, K., McGuire, A. D., Natali, S. M., O'Donnell, J. A., Parmentier, F. J. W., Räsänen, A., Schädel, C., Sonnentag, O., Strack, M., Tank, S. E., Treat, C., Varner, R. K., Virtanen, T., Warren, R. K., and Watts, J. D.: The Boreal–Arctic Wetland and Lake Dataset (BAWLD), Earth Syst. Sci. Data, 13, 5127–5149, https://doi.org/10.5194/essd-13-5127-2021, 2021.
Palmer, M. D., Harris, G. R., and Gregory, J. M.: Extending CMIP5 projections of global mean temperature change and sea level rise due to thermal expansion using a physically-based emulator, Environ. Res. Lett., 13, 084003, https://doi.org/10.1088/1748-9326/aad2e4, 2018.
Piao, S., Ciais, P., Friedlingstein, P., Peylin, P., Reichstein, M., Luyssaert, S., Margolis, H., Fang, J., Barr, A., Chen, A., Grelle, A., Hollinger, D. Y., Laurila, T., Lindroth, A., Richardson, A. D., and Vesala, T.: Net carbon dioxide losses of northern ecosystems in response to autumn warming, Nature, 451, 49–52, https://doi.org/10.1038/nature06444, 2008.
Qiu, C., Zhu, D., Ciais, P., Guenet, B., and Peng, S.: The role of northern peatlands in the global carbon cycle for the 21st century, Glob. Ecol. Biogeogr., 29, 956–973, https://doi.org/10.1111/geb.13081, 2020.
Qiu, C., Zhu, D., Ciais, P., Guenet, B., Peng, S., Krinner, G., Tootchi, A., Ducharne, A., and Hastie, A.: Modelling northern peatland area and carbon dynamics since the Holocene with the ORCHIDEE-PEAT land surface model (SVN r5488), Geosci. Model Dev., 12, 2961–2982, https://doi.org/10.5194/gmd-12-2961-2019, 2019.
Qiu, C., Ciais, P., Zhu, D., Guenet, B., Chang, J., Chaudhary, N., Kleinen, T., Li, X., Müller, J., Xi, Y., Zhang, W., Ballantyne, A., Brewer, S. C., Brovkin, V., Charman, D. J., Gustafson, A., Gallego-Sala, A. V., Gasser, T., Holden, J., Joos, F., Kwon, M. J., Lauerwald, R., Miller, P. A., Peng, S., Page, S., Smith, B., Stocker, B. D., Sannel, A. B. K., Salmon, E., Schurgers, G., Shurpali, N. J., Wårlind, D., and Westermann, S.: A strong mitigation scenario maintains climate neutrality of northern peatlands, One Earth, 5, 86–97, https://doi.org/10.1016/j.oneear.2021.12.008, 2022.
Rawls, W. J., Ahuja, L. R., Brakensiek, D. L., and Shirmohammadi, A.: Infiltration and soil water movement, McGraw-Hill Inc., New York, 5.1–5.51, ISBN: 9780070397323, 1992.
Richardson, A. D., Hufkens, K., Milliman, T., Aubrecht, D. M., Furze, M. E., Seyednasrollah, B., Krassovski, M. B., Latimer, J. M., Nettles, W. R., Heiderman, R. R., Warren, J. M., and Hanson, P. J.: Ecosystem warming extends vegetation activity but heightens vulnerability to cold temperatures, Nature, 560, 368–371, https://doi.org/10.1038/s41586-018-0399-1, 2018.
Schaperow, J. and Li, D.: VICGlobal: soil and vegetation parameters for the Variable Infiltration Capacity hydrological model (1.6d), Zenodo [dataset], https://doi.org/10.5281/zenodo.5038653, 2021.
Schneider von Deimling, T., Grosse, G., Strauss, J., Schirrmeister, L., Morgenstern, A., Schaphoff, S., Meinshausen, M., and Boike, J.: Observation-based modelling of permafrost carbon fluxes with accounting for deep carbon deposits and thermokarst activity, Biogeosciences, 12, 3469–3488, https://doi.org/10.5194/bg-12-3469-2015, 2015.
Schuur, E. A. G., McGuire, A. D., Schädel, C., Grosse, G., Harden, J. W., Hayes, D. J., Hugelius, G., Koven, C. D., Kuhry, P., Lawrence, D. M., Natali, S. M., Olefeldt, D., Romanovsky, V. E., Schaefer, K., Turetsky, M. R., Treat, C. C., and Vonk, J. E.: Climate change and the permafrost carbon feedback, Nature, 520, 171–179, https://doi.org/10.1038/nature14338, 2015.
Sheffield, J., Barrett, A., Colle, B., Fernando, D., Fu, R., Geil, K., Hu, Q., Kinter, J., Kumar, S., Langenbrunner, B., Lombardo, K., Long, L., Maloney, E., Mariotti, A., Meyerson, J., Mo, K., Neelin, J., Nigam, S., Pan, Z., and Yin, L.: North American Climate in CMIP5 Experiments, Part I: Evaluation of Historical Simulations of Continental and Regional Climatology*, J. Clim., 26, 9209–9245, https://doi.org/10.1175/JCLI-D-12-00592.1, 2013.
Smith, S. L., O'Neill, H. B., Isaksen, K., Noetzli, J., and Romanovsky, V. E.: The changing thermal state of permafrost, Nat. Rev. Earth Environ., 3, 10–23, https://doi.org/10.1038/s43017-021-00240-1, 2022.
Spahni, R., Joos, F., Stocker, B. D., Steinacher, M., and Yu, Z. C.: Transient simulations of the carbon and nitrogen dynamics in northern peatlands: from the Last Glacial Maximum to the 21st century, Clim. Past, 9, 1287–1308, https://doi.org/10.5194/cp-9-1287-2013, 2013.
Stocker, B. D., Spahni, R., and Joos, F.: DYPTOP: a cost-efficient TOPMODEL implementation to simulate sub-grid spatio-temporal dynamics of global wetlands and peatlands, Geosci. Model Dev., 7, 3089–3110, https://doi.org/10.5194/gmd-7-3089-2014, 2014.
Tang, R., He, B., Chen, H. W., Chen, D., Chen, Y., Fu, Y. H., Yuan, W., Li, B., Li, Z., Guo, L., Hao, X., Sun, L., Liu, H., Sun, C., and Yang, Y.: Increasing terrestrial ecosystem carbon release in response to autumn cooling and warming, Nat. Clim. Change, 12, 380–385, https://doi.org/10.1038/s41558-022-01304-w, 2022.
Tape, K. E. N., Sturm, M., and Racine, C.: The evidence for shrub expansion in Northern Alaska and the Pan-Arctic, Glob. Change Biol., 12, 686–702, https://doi.org/10.1111/j.1365-2486.2006.01128.x, 2006.
Treat, C. C., Jones, M. C., Brosius, L., Grosse, G., Walter Anthony, K., and Frolking, S.: The role of wetland expansion and successional processes in methane emissions from northern wetlands during the Holocene, Quaternary Sci. Rev., 257, 106864, https://doi.org/10.1016/j.quascirev.2021.106864, 2021.
Turunen, J., Tomppo, E., Tolonen, K., and Reinikainen, A.: Estimating carbon accumulation rates of undrained mires in Finland–application to boreal and subarctic regions, The Holocene, 12, 69–80, https://doi.org/10.1191/0959683602hl522rp, 2002.
Wood, E. F., Lettenmaier, D. P., and Zartarian, V. G.: A land-surface hydrology parameterization with subgrid variability for general circulation models, J. Geophys. Res.-Atmos., 97, 2717–2728, https://doi.org/10.1029/91JD01786, 1992.
Xu, J., Morris, P. J., Liu, J., and Holden, J.: PEATMAP: Refining estimates of global peatland distribution based on a meta-analysis, CATENA, 160, 134–140, https://doi.org/10.1016/j.catena.2017.09.010, 2018.
Yi, Y. and Kimball, J. S.: ABoVE: Active Layer Thickness from Remote Sensing Permafrost Model, Alaska, 2001–2015, https://doi.org/10.3334/ORNLDAAC/1760, 2020.
Yokohata, T., Saito, K., Ito, A., Ohno, H., Tanaka, K., Hajima, T., and Iwahana, G.: Future projection of greenhouse gas emissions due to permafrost degradation using a simple numerical scheme with a global land surface model, Prog. Earth Pl. Sci., 7, 56, https://doi.org/10.1186/s40645-020-00366-8, 2020.
Yu, Z., Beilman, D., and Jones, M.: Sensitivity of Northern Peatland Carbon Dynamics to Holocene Climate Change, Washington DC American Geophysical Union Geophysical Monograph Series, 184, 55–69, https://doi.org/10.1029/2008GM000822, 2009.
Zhao, B. and Zhuang, Q.: Peatlands and their carbon dynamics in northern high latitudes from 1990 to 2300: A process-based biogeochemistry model analysis, Purdue University Research Repository (data set), https://doi.org/10.4231/QP7V-V527, 2022.
Zhao, B., Zhuang, Q., Treat, C., and Frolking, S.: A Model Intercomparison Analysis for Controls on C Accumulation in North American Peatlands, J. Geophys. Res.-Biogeo., 127, e2021JG006762, https://doi.org/10.1029/2021JG006762, 2022a.
Zhao, B., Zhuang, Q., and Frolking, S.: Modeling Carbon Accumulation and Permafrost Dynamics of Northern Peatlands Since the Holocene, J. Geophys. Res.-Biogeo., 127, e2022JG007009, https://doi.org/10.1029/2022JG007009, 2022b.
Zhao, R. J., Liu, X. R., and Singh, V. P.: The Xinanjiang model, edited by: Singh, V. P., Water Resources Publications, Colorado, ISBN: 9780918334916, 1995.
Zhuang, Q., McGuire, A. D., O'Neill, K. P., Harden, J. W., Romanovsky, V. E., and Yarie, J.: Modeling soil thermal and carbon dynamics of a fire chronosequence in interior Alaska, J. Geophys. Res.-Atmos., 107, FFR 3-1–FFR 3-26, https://doi.org/10.1029/2001JD001244, 2002.
Zhuang, Q., Melillo, J. M., Kicklighter, D. W., Prinn, R. G., McGuire, A. D., Steudler, P. A., Felzer, B. S., and Hu, S.: Methane fluxes between terrestrial ecosystems and the atmosphere at northern high latitudes during the past century: A retrospective analysis with a process-based biogeochemistry model, Global Biogeochem. Cy., 18, GB3010, https://doi.org/10.1029/2004GB002239, 2004.
Zomer, R. J., Xu, J., and Trabucco, A.: Version 3 of the Global Aridity Index and Potential Evapotranspiration Database, Sci. Data, 9, 409, https://doi.org/10.1038/s41597-022-01493-1, 2022.