the Creative Commons Attribution 4.0 License.
the Creative Commons Attribution 4.0 License.
 | 04 Jul 2023
Exploring environmental and physiological drivers of the annual carbon budget of biocrusts from various climatic zones with a mechanistic data-driven model
Bettina Weber
Alexandra Kratz
José Raggio
Claudia Colesie
Maik Veste
Maaike Y. Bader
Philipp Porada
Biocrusts are a worldwide phenomenon, contributing substantially to ecosystem functioning. Their growth and survival depend on multiple environmental factors, including climatic ones, and the relations of these factors to physiological processes. Responses of biocrusts to individual environmental factors have been examined in a large number of field and laboratory experiments. These observational data, however, have rarely been assembled into a comprehensive, consistent framework that allows quantitative exploration of the roles of multiple environmental factors and physiological properties for the performance of biocrusts, in particular across climatic regions. Here we used a data-driven mechanistic modelling framework to simulate the carbon balance of biocrusts, a key measure of their growth and survival. We thereby assessed the relative importance of physiological and environmental factors for the carbon balance at six study sites that differ in climatic conditions. Moreover, we examined the role of seasonal acclimation of physiological properties using our framework, since the effects of this process on the carbon balance of biocrusts are poorly constrained so far. We found substantial effects of air temperature, CO2 concentration, and physiological parameters that are related to respiration on biocrust carbon balance, which differ, however, in their patterns across regions. The ambient CO2 concentration is the most important factor for biocrusts from drylands, while air temperature has the strongest impact at alpine and temperate sites. Metabolic respiration cost plays a more important role than optimum temperature for gross photosynthesis at the alpine site; this is not the case, however, in drylands and temperate regions. Moreover, we estimated a small annual carbon gain of 1.5 by lichen-dominated biocrust and 1.9 by moss-dominated biocrust at a dryland site, while the biocrusts lost a large amount of carbon at some of the temperate sites (e.g. −92.1 for lichen-dominated and −74.7 for moss-dominated biocrust). These strongly negative values contradict the observed survival of the organisms at the sites and may be caused by the uncertainty in environmental conditions and physiological parameters, which we assessed in a sensitivity analysis. Another potential explanation for this result may be the lack of acclimation in the modelling approach, since the carbon balance can increase substantially when testing for seasonally varying parameters in the sensitivity analysis. We conclude that the uncertainties in air temperature, CO2 concentration, respiration-related physiological parameters, and the absence of seasonal acclimation in the model for humid temperate and alpine regions may be a relevant source of error and should be taken into account in future approaches that aim at estimating the long-term biocrust carbon balance based on ecophysiological data.
- Article
(3116 KB) - Full-text XML
-
Supplement
(6460 KB) - BibTeX
- EndNote


Non-vascular photoautotrophs, such as lichens, mosses, eukaryotic algae, and cyanobacteria, together with heterotrophic microorganisms form biological soil crusts (biocrusts), which occur in various environments across the globe and provide a wide range of important ecosystem functions, such as build-up of soil organic carbon and nutrients (Belnap et al., 2016; Chamizo et al., 2012; Dümig et al., 2014; Ferrenberg et al., 2018). Due to the importance of biocrusts in ecosystem functioning, their growth and survival have been extensively studied through different methodological approaches (e.g. Ladrón de Guevara et al., 2018; Lange et al., 2006; Porada et al., 2019). An established measure to quantify the growth of biocrusts is their long-term carbon balance (hereafter, C balance), which corresponds to the (accumulated) net carbon flux across the system boundaries, including all relevant carbon gains and losses.
In order to ensure survival, any species needs to achieve a positive C balance in the long term, while negative values may occur for short periods. Acknowledging the importance of C balance, an increasing number of studies have investigated the long-term C balance of individual non-vascular organisms as well as biocrust communities and their environmental drivers. An annual carbon budget of 21.49 g C m−2 based on measured field data was reported in the study by Lange (2003b) on the crustose lichen Lecanora muralis growing on a rock surface in a temperate climate of southern Germany. Furthermore, Büdel et al. (2018) estimated an annual C balance of 1.7 g C m−2 based on measurements on cyanobacteria-dominated biocrust in an Australian dry savannah ecosystem. Several other studies obtained long-term, large-scale values of the C balance by scaling up short-term, local measurements of CO2 exchange rate under natural field conditions (Lange et al., 1994; Zotz et al., 2003). For an estimation of the global C balance of cryptogamic covers, which include biocrusts, conversion factors based on the maximum photosynthesis rate have been suggested as a best-guess solution (Elbert et al., 2012). However, there are some drawbacks to these approaches for acquiring a C balance at both organism and community scale. First, the measurement of the long-term continuous CO2 exchange rate of an individual organism or biocrust community has technical limitations and is highly time- and resource-consuming. Second, upscaling via extrapolation may result in bias in annual C-balance estimation if the length and the frequency of sampling cannot capture the full variability of CO2 exchange throughout the year (Bader et al., 2010). Moreover, using empirical approaches alone, it is difficult to understand the underlying mechanisms of how climatic conditions affect individual physiological processes and consequently which role these processes play in the observed changes in C balance and growth at the individual as well as community level. Such approaches are thus subject to large uncertainty when used for projections of C balance under climate change.
Most studies on the relationships between C balance and environmental factors for biocrusts are based on laboratory experiments (e.g. Coe et al., 2012b; Cowan et al., 1992; Lange et al., 1998) or direct field measurements in situ over short periods of time (e.g. Brostoff et al., 2005; Lange et al., 1994). From this work cited above, it has been recognized that the C balance of biocrusts is strongly influenced by factors such as water supply, temperature, radiation, and CO2 concentration and the complex relations of these factors to physiological processes such as photosynthesis and respiration. While the highest values of productivity under field conditions are achieved when the environmental factors are in the range that is optimal for the specific biocrust, it has been found that biocrusts are also able to achieve metabolic activity and, thus, potential productivity under sub-optimal conditions of temperature and light (Colesie et al., 2016; Raggio et al., 2017, 2014). It is largely unknown, however, which relative importance each of these environmental factors and physiological parameters has for the long-term C balance of biocrusts under natural field conditions and if the importance of factors and parameters shows a spatial and temporal pattern. In addition, seasonal acclimation of photosynthetic and respiratory properties of species to intra-annually varying climate factors found by several studies (e.g. Gauslaa et al., 2006; Lange and Green, 2005; Wagner et al., 2014) may substantially affect biocrust C balance, thus leading to further complexity in the spatio-temporal relations between C balance and environmental factors and physiological parameters. One of the few experimental studies investigating biocrust acclimation potential to changing temperatures has found threshold temperatures for the survival of lichen species (Colesie et al., 2018), but the overall extent of the impact is poorly understood.
Here, we applied a mechanistic data-driven model to (a) complement empirical estimates of the annual C balance of biocrusts and (b) to address the knowledge gaps concerning the relative importance of different environmental factors and physiological parameters for the C balance in contrasting climates, thereby accounting for the role of seasonal acclimation. The advantage of this modelling approach is that it can predict at high temporal resolution the dynamic C balance of biocrust organisms for given locations by simulating the physiological processes driven by environmental factors. The model allows for a deeper mechanistic understanding of the C balance of biocrusts through factorial experiments and sensitivity analyses regarding physiological parameters and individual environmental factors, which would be impractical to realize in field or laboratory experiments. To complement our analyses using the data-driven model, a process-based dynamic non-vascular vegetation model, called LiBry, was employed as a supporting tool (Porada et al., 2013).
We simulated the C balance of biocrusts from six climatically different study sites in a semi-empirical way using a data-driven model. The model simulates photosynthetic rate based on the Farquhar photosynthesis model developed by Farquhar and von Caemmerer (1982) and respiration rate based on a Q10 relationship. The C balance is computed as the difference of photosynthesis and respiration accumulated over a given time period. In the model, both photosynthesis and respiration depend on surface temperature, relative water saturation, and the activity of the biocrust, which are all simulated in a coupled way via the surface energy balance as a function of climate input data. Photosynthesis additionally depends on ambient CO2 concentration.
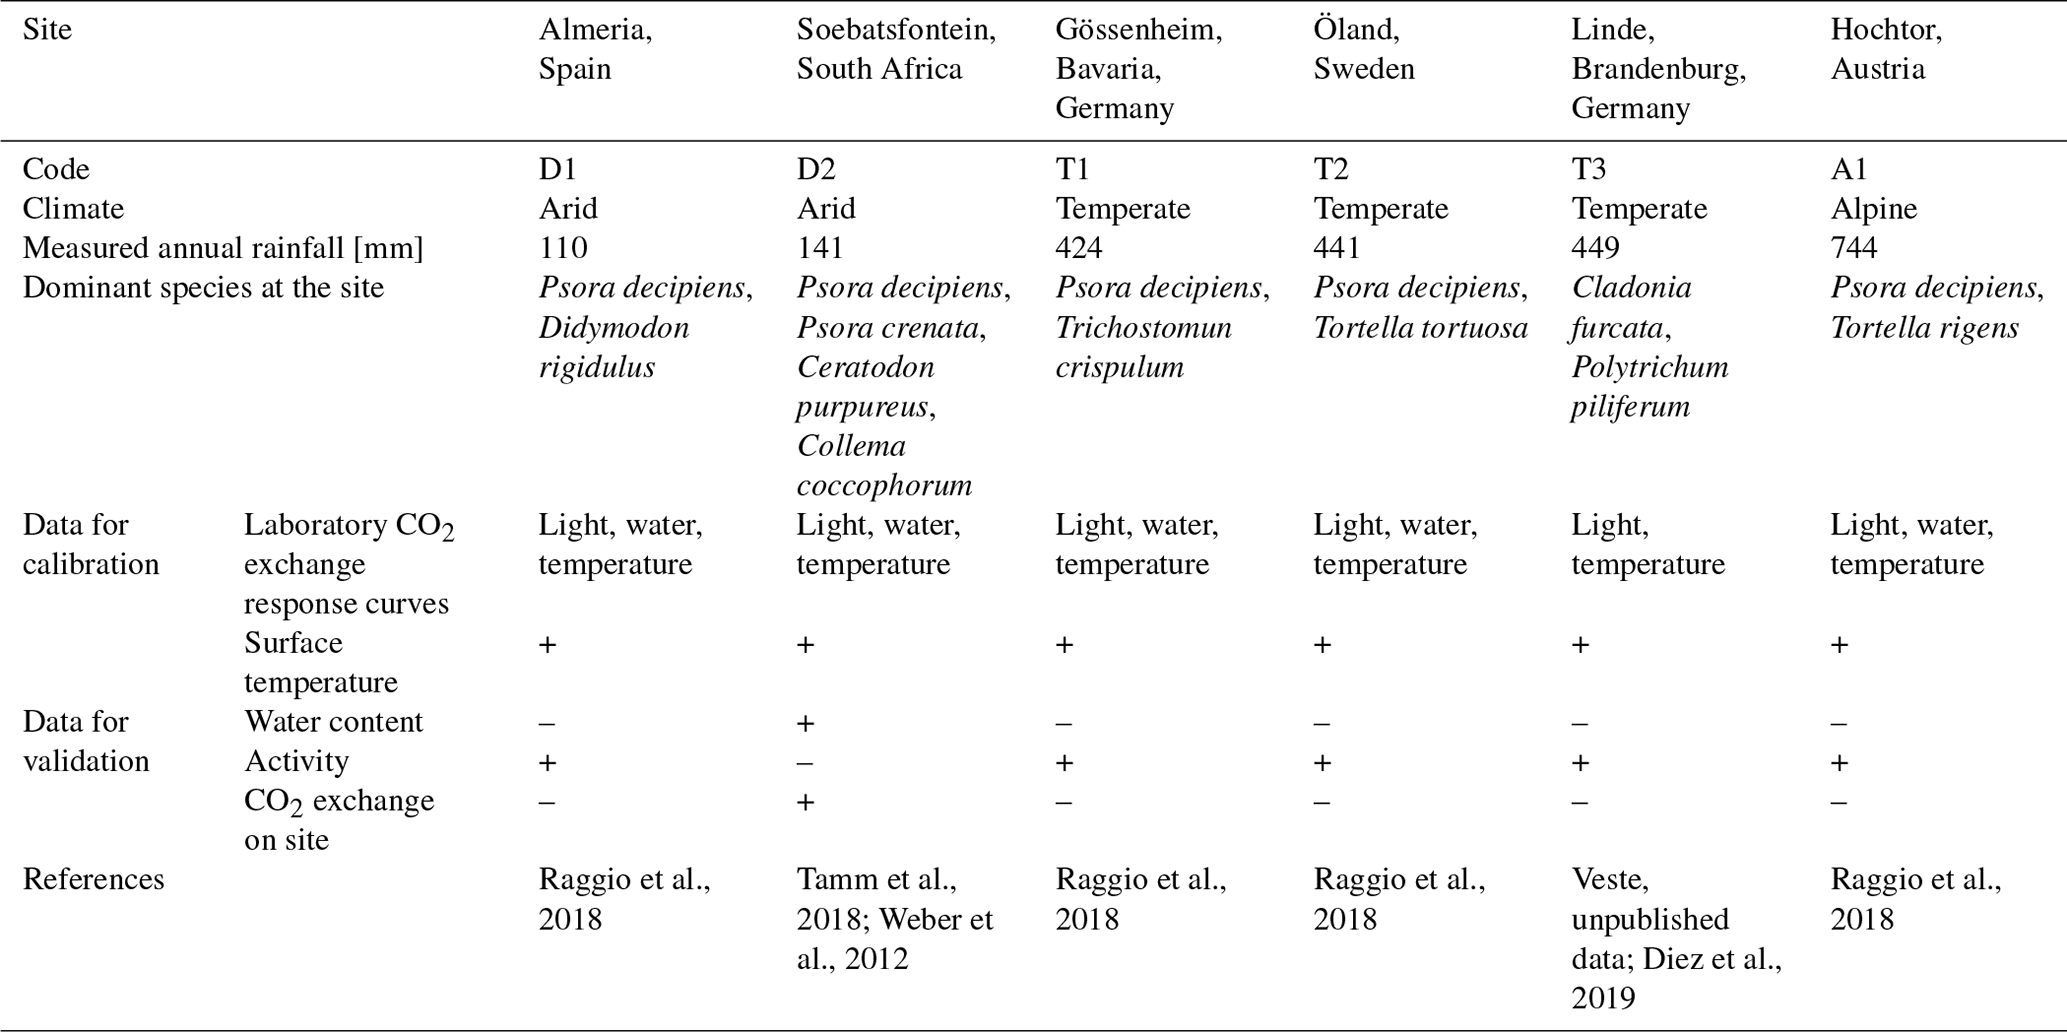
To calibrate the model, we first determined soil and land surface properties that are required for the coupled energy and water balance in the model through fitting simulated to measured surface temperature patterns. Then, we parameterized the physiological properties of the organisms using measured relationships between net photosynthesis and light intensity, water content, and temperature. Finally, we validated the model with regard to the water content or activity patterns of biocrusts and compared the modelled CO2 assimilation rate to measured values. The datasets used for calibration and validation of the model as well as basic climate conditions of each site are described in Table 1. Sites were listed in ascending order of total annual precipitation based on measured data.
Table 1Properties of the study sites and data which are available (+ sign) for calibration and validation of the data-driven model.
2.1 Study sites
In our study we considered six sites, namely two dryland sites at Almeria (Spain) and Soebatsfontein (South Africa; hereafter D1 and D2); three temperate sites at Gössenheim (Germany), Öland (Sweden), and Linde (Germany; hereafter T1, T2, and T3); and one alpine site at Hochtor (Austria; hereafter A1) (Table 1). These sites were chosen based on data availability for C-balance estimation and because they cover a broad range of climatic conditions. The field and laboratory measurements conducted at all sites were following a similar protocol, which allows comparing the simulation results among sites. The necessary empirical data for C-balance estimation regarding climatic conditions, species physiological characteristics, and status, especially in terms of moisture such as water content or activity, have been monitored in a relatively small number of experiments, so far, and the six study sites are chosen here to provide a good opportunity to utilize these data for an extended modelling approach. In this context, activity measurements are more suitable than soil moisture records since they are direct, non-invasive, and do not show deviations in the temporal patterns at high resolution, which may occur with soil moisture time series.
Sites D1 and D2 are characterized by an arid climate with mean annual precipitation of less than 250 mm but a wet winter season (Büdel et al., 2014; Haarmeyer et al., 2010). Sites T1, T2, and T3 have a temperate climate. The mean precipitation in these three sites is around 550 mm (Büdel et al., 2014; Diez et al., 2019). Site A1 is located in a humid alpine region with a mean annual precipitation between 1750 and 2000 mm, of which more than 70 % are snowfall; the A1 site is covered by snow for at least 200 d yr−1 (Büdel et al., 2014). More detailed site descriptions are provided in the corresponding studies cited above.
2.2 Observational data
2.2.1 Climatic variables
The proposed data-driven model for estimating the annual C balance of dominant biocrust types at each site was forced by hourly microclimatic variables. The forcing datasets of the data-driven model include photosynthetically active radiation (PAR), long-wave radiation (near-infrared), relative air humidity, air temperature, wind speed, rainfall, and snowfall. All the microclimatic variables were measured on-site by climate stations with a temporal resolution of 10 min (5 min in A1 and D1; data available at http://www.biota-africa.org, last access: 12 June 2023 and by B. Weber, unpublished data; Raggio et al., 2017; M. Veste, unpublished data), except for long-wave radiation and snowfall, which were taken from the ERA5 dataset (https://www.ecmwf.int/en/forecasts/datasets/reanalysis-datasets/era5, last access: 8 October 2020). Although directly measured surface temperature data are available for all sites, we use ERA5-based down-welling long-wave radiation instead to simulate surface temperature on biocrusts. This is necessary since, in our model, calculations of photosynthesis and respiration not only require surface temperature but also depend on water saturation of biocrusts (affecting activity). However, we do not have water saturation data available at most sites. Therefore, we instead simulate the dynamic water saturation of biocrusts based on climate, via processes such as evaporation, rainfall, and dew. The calculation of evaporation and dew automatically includes the computation of a surface temperature that emerges from solving the surface energy balance, thereby including down-welling long-wave radiation. Since the simulated surface temperature that is connected to simulated water saturation slightly deviates from the observed surface temperature (see Figs. 1 and S1 in the Supplement), we do not directly use the observed surface temperature as input in the modelling approach, to avoid inconsistencies. Then all these microclimate data were aggregated to data with hourly temporal resolution.
2.2.2 Dynamic biocrust variables
Besides the surface temperature, biocrust activity was either monitored directly (binary: active or not active) using a continuous chlorophyll fluorescence monitoring system (Raggio et al., 2014, 2017) or indirectly via the electrical conductivity of the substrate (BWP, Umweltanalytische Produkte GmbH, Cottbus, Germany; Weber et al., 2016; M. Veste, unpublished data). For site D2, the biocrust water content was calculated instead of activity based on electrical conductivity. Due to snow covering the measuring instruments, the data of site A1 only cover the time from August to October. Samples from both lichen- and moss-dominated biocrusts were measured at all sites, except for site T3 where four BWPs were mostly located in moss-dominated biocrusts. At site D2, additionally, cyanolichen- and cyanobacteria-dominated biocrusts were monitored. The measured surface temperature, water content, and activity data at all sites were then aggregated to data with a temporal resolution of 1 h.
As explained in Sect. 2.2.1, we did not directly use the observed surface temperature and activity (or water content) as forcing data for the model but estimated the time series of surface temperature and water saturation data at all sites based on a simulation of the energy and water balance. The activity of the organisms was then approximated via the empirical equations describing the link between water saturation and metabolic activity (see Porada et al., 2013). Furthermore, ambient CO2 concentration was assumed to be constant at 400 ppm. The CO2 concentration at the soil surface may be higher than 400 ppm due to the flux of respired CO2 from the soil. Since our study sites are on open ground, we do not assume substantial accumulation of CO2 in the near-surface boundary layer. We discuss the effect of uncertainties in CO2 concentration below in Sect. 4.2.
For validation of C balance, we used data of the on-site CO2 exchange rate of different biocrust types (lichen-, moss-, and cyano-dominated biocrusts removed from surplus soil; the latter composed of cyanolichen and cyanobacteria) that were measured by a portable gas exchange system at several time intervals from 4 to 8 November at site D2 (Tamm et al., 2018). For the other sites, additional field measurements of CO2 exchange were not available.
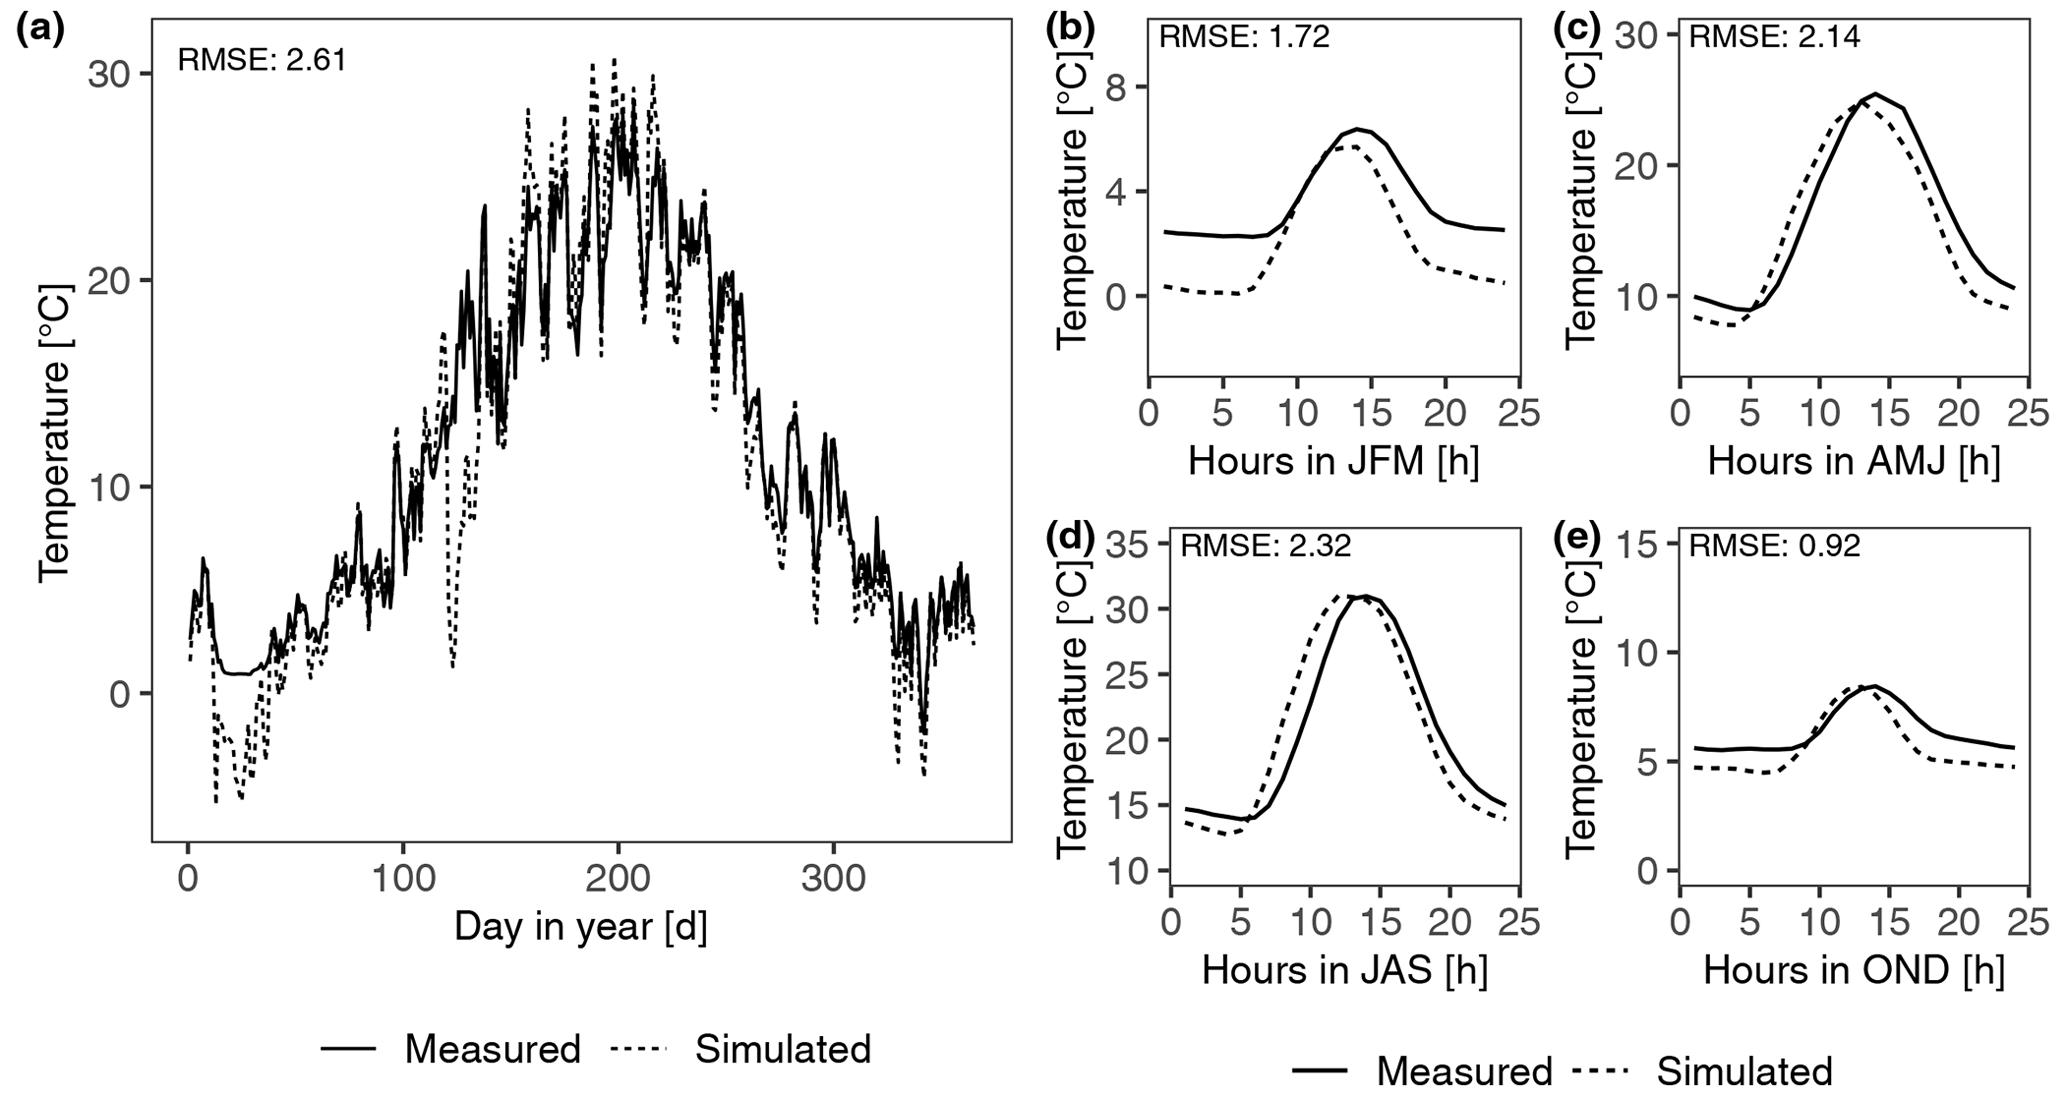
Figure 1Calibration results of abiotic parameters of the data-driven model by fitting the daily (a) and diurnal (b–e) patterns of surface temperature at site T2. Panels (b) to (e) represent the patterns of average hourly surface temperature from January to March (JFM), April to June (AMJ), July to September (JAS), and October to December (OND), respectively.
2.2.3 Photosynthesis response and water storage
For all sites, CO2 exchange measurements under controlled conditions in the laboratory or in the field (site T3) were conducted using a mobile gas exchange system GFS-3000 (Walz GmbH, Effeltrich, Germany) with an infrared-gas analyser to explore the physiological characteristics of samples of different biocrust types (same as those measured for validation; main species, see Table 1; Diez et al., 2019; Raggio et al., 2018; Tamm et al., 2018). Before measurements, the soil underneath these biocrust samples was removed up to the amount necessary to preserve the physical structure of the biocrusts. And the samples were subjected to reactivation for at least 2 d (D2) or 3 d (T1, T2, D1, A1). At T1, T2, A1, and D1, for instance, samples were kept at 12 ∘C under 12 h dark and 12 h light (100 ) conditions for 3 d and wetted once a day. Net photosynthesis was measured at different ranges of light intensity, water content, and temperature. Light response curves, for instance, were determined at optimum water saturation and 15 ∘C; water response curves were measured at 400 and 15 ∘C at sites D1, T1, T2, and A1 (Raggio et al., 2018). Moreover, the maximum water storage capacity (MWC) of the samples was quantified in the laboratory for samples from sites D1, T1, T2, and A1 (Raggio et al., 2018), whereas the MWC at site D2 was approximated as the maximum value when measuring water response curves (Tamm et al., 2018; Weber et al., 2012). MWC at site T3 was estimated as the value of the same genus measured in Hamburg, Germany (Cladonia portentosa and Polytrichum formosum, Petersen et al., 2023). MWC was acquired since it is one of the essential parameters of the model to convert the specific water content in millimetre to relative water saturation required by the model used here.
2.3 Parameterization of the data-driven model
2.3.1 Abiotic surface properties
Several abiotic parameters of the data-driven model describing soil and land surface properties, such as roughness length or soil thermal conductivity, were required to simulate the energy and water balance. These parameters were obtained by fitting the daily and diurnal surface temperature patterns of lichen-dominated biocrust at all sites except for site T3. At site T3, we compared the surface temperature patterns of simulated moss-dominated biocrusts to data collected by sensors in four locations.
The set of parameters that corresponded to minimum differences between simulated and measured values (visual assessment) was used in the data-driven model. The calibration results of surface temperature and the photosynthesis response curves at site T2 are shown in Figs. 1 and 2, respectively. The results of dominant species at other sites are shown in Figs. S1 and S2 in the Supplement.
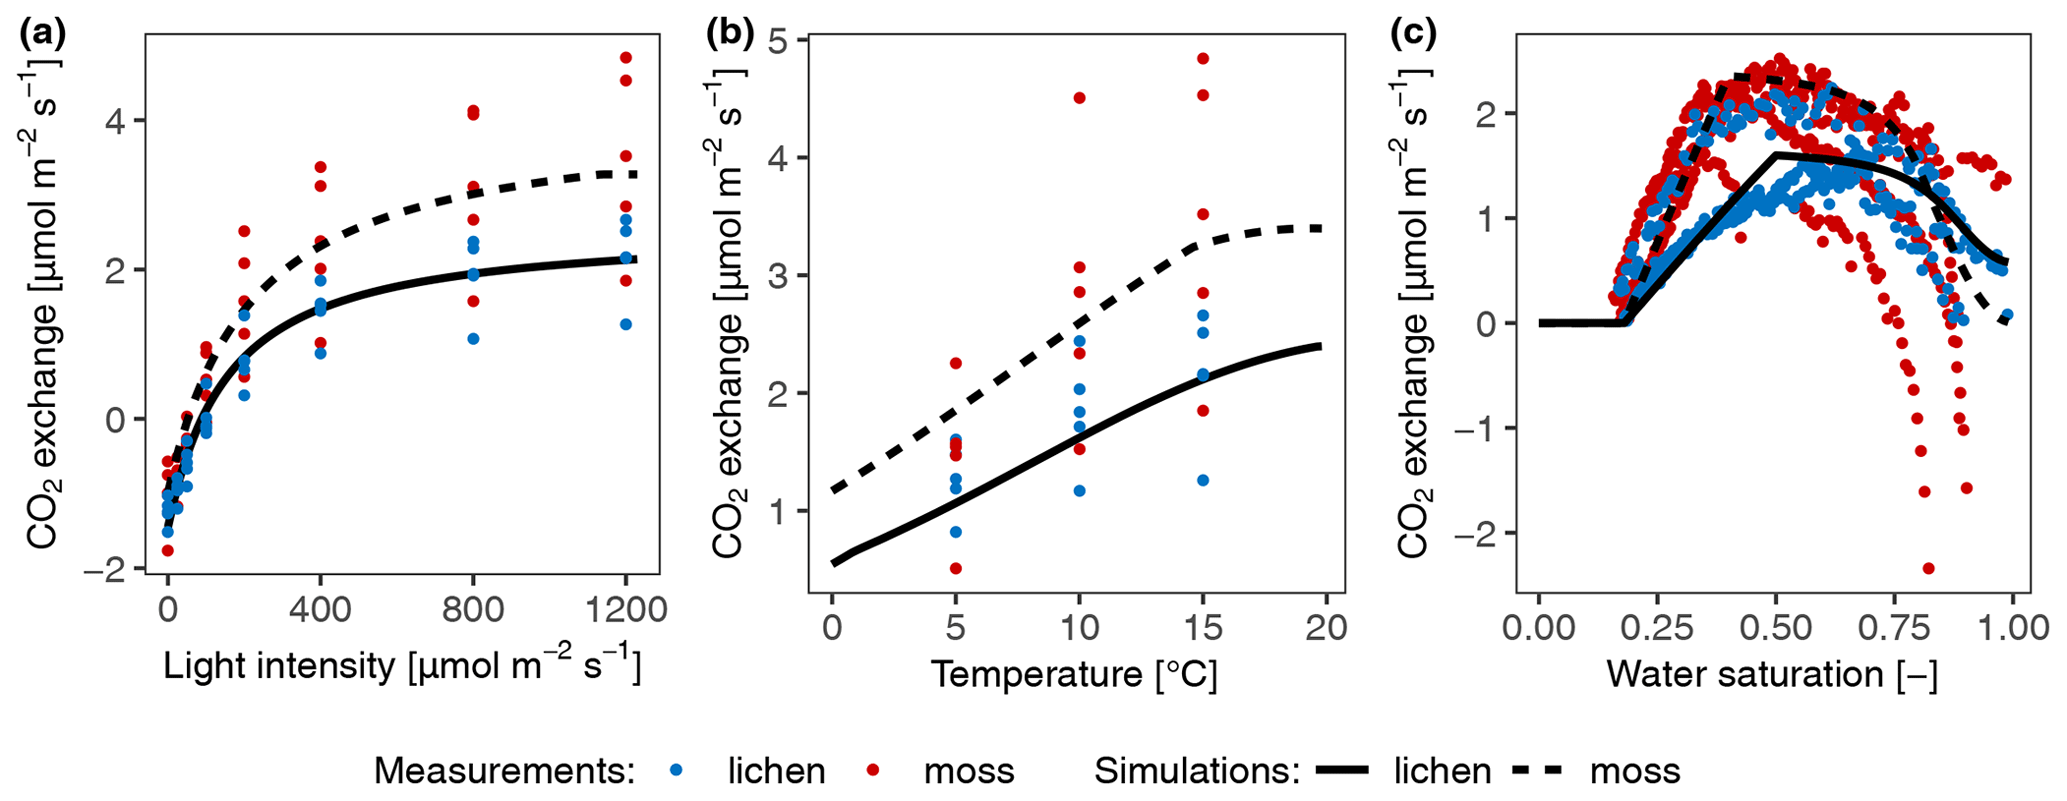
Figure 2Calibration of photosynthesis parameters of the model by fitting photosynthesis response curves of moss- and lichen-dominated biocrust samples to measurements at site T2. (a) Net photosynthesis rate in response to light, at optimum water content, and at 15 ∘C. (b) Net photosynthesis rate in response to temperature, at 1200 light, and at optimal water content. (c) Net photosynthesis rate in response to relative water saturation, at 400 light, and at 15 ∘C.
The daily surface temperature was simulated accurately (the maximum value of root mean square error (RMSE) at all sites is 3.78) except for site T3, where the temperature during cold seasons was underestimated, and at site D1 the peak temperature within a day in hot seasons was underestimated (Fig. S1). The peak in surface temperature occurred too early by around 1–2 h at sites D1, A1, T1, and T2, but the magnitude of the peak corresponded well to the measured data (Figs. 1 and S1). Therefore, in general, the fitting of the surface temperature patterns was satisfactory. The mismatches may result from the measured climate variables such as PAR or air temperature at 2 m being inconsistent with the measured surface temperature (detailed descriptions are in Supplement) and bias in the calibrated soil properties such as soil thermal conductivity, since it may affect the surface temperature difference between morning and evening. A sensitivity analysis of soil thermal conductivity to C balance is shown in the Supplement.
2.3.2 Biocrust physiological properties
Furthermore, several parameters required by the Farquhar photosynthesis scheme and the respiration scheme were directly measured or calculated from gas exchange datasets, such as MWC of the thallus, optimum water content, the optimum temperature for gross photosynthesis, metabolic respiration cost, and the Q10 value of respiration. Since the ambient temperature range that was applied in the laboratory for samples from all sites except D2 was too small to capture the optimum temperature of photosynthesis reliably, we approximated the optimum temperature from the measured dataset as the average surface temperature during active periods. In addition, the optimum temperature was also constrained by fitting the Farquhar equations to photosynthesis curves, as related to environmental factors light, water content, and temperature. Such fitting method was also used to obtain some other photosynthesis-related parameters of organisms, such as molar carboxylation and oxygenation rate of RuBisCO (Vcmax, Vomax), respiration cost of RuBisCO enzyme (Rub_ratio), and minimum saturation for activation (Sat_act0).
Since the measured values between replicates showed large variation, in particular the water and temperature-dependent data, as illustrated by the coloured points in Fig. 2, we fitted the curves to the average values of all replicates. The calibration results showed that, visually and overall, the photosynthetic curves could be parameterized to fit the measurements well (Figs. 2 and S2 in the Supplement), given that different samples were used for measuring responses to different driving factors and considering the methodological differences between light and water response curve measurements. However, the water responses were least well fitted, especially at high water contents. The measured net photosynthesis response rate was negative in some cases at high water saturation, but it is not possible to reproduce this negative net photosynthesis rates with our adapted Farquhar photosynthetic model for the light and CO2 conditions of the laboratory setup. Under these conditions, gross photosynthesis is larger than respiration, and thus CO2 is required to diffuse from the atmosphere into the thallus, not out of it. Even under low diffusivity, caused by high water saturation, there will be no net diffusion of CO2 from the thallus into the ambient air, assuming that inward and outward flows of CO2 share the same pathway and that diffusion of CO2 between atmosphere and thallus is in steady state with the flux (respiration minus gross photosynthesis). For details please see the Supplement. Furthermore, matching the simulated temperature response of net photosynthesis to the measured data under cool conditions turned out to be difficult for samples from site T1 and A1 (Fig. S2). There were too few data points in the measured temperature response dataset to constrain the optimum temperature and temperature relation (see Fig. 2), but the fitting turned out well because the simulated optimum temperature for net photosynthesis at site T1 was coincidentally close to the value of 17 ∘C, reported by Colesie et al. (2014) for this site (see Fig. S2).
2.4 Validation of the data-driven model
The water saturation and activity estimated by the data-driven model were validated by comparing with the daily and diurnal patterns of measured activity (5 sites, not at site D2) and water content data (only at D2). Furthermore, the C balance estimated by the data-driven model was validated by comparison to the in situ measured net CO2 exchange rate of moss-, lichen-, and cyanocrust-dominated biocrusts. These data were sampled at site D2 by removing the soil respiration rate, predicted by means of a fitted regression (Weber et al., 2012). Since data on water saturation were available, measured PAR, surface temperature, and water content were used to simulate the C balance using the data-driven model, in contrast to the setup described above. The activity, however, was calculated in the same way as described in the setup. Moreover, the parameters of the model were the same as the calibrated ones of the corresponding biocrust types.
2.5 Sensitivity analysis
To investigate the role of environmental factors, physiological properties, and also seasonal acclimation for the simulated annual C balance of biocrusts, we conducted three sensitivity analyses using our data-driven model. With this setup, we intend to put into context the effects of environmental conditions and the uncertainty associated with the physiological properties that were used to parameterize the model. We additionally explore the impact of seasonally acclimatized physiological properties on carbon assimilation at site T1, since variation between seasons represents additional uncertainty in the estimation of the C balance.
2.5.1 Effects of environmental factors
To investigate the role that environmental factors, namely air temperature (T_air), light intensity (Light), ambient CO2 concentration (CO2), and different types of water sources, play in regulating the C balance of biocrusts, sensitivity analyses were conducted for lichen-dominated biocrusts from all study sites. The different types of water sources include rainfall (Rain) and non-rainfall water inputs such as dew and water vapour, which are determined by relative air humidity (R_hum). All the environmental factors were reduced and increased by half (±50 %), except for T_air and R_hum. The T_air differences varied by 5 K and R_hum by 20 %. Moreover, relative humidity was constrained between 0 % and 100 % when the varied relative humidity exceeded this range.
The annual C balance for each modified environmental factor was then normalized following Eq. (1) and normalized again among different environmental factors within each climatic zone for comparing the relative importance of environmental factors:
where Cij is the C balance of factor j under operation i, and Cj is the original C balance of factor j.
A positive normalized C balance demonstrates an increase in annual C balance when certain environmental factors change, and a larger magnitude of the normalized C-balance number demonstrates a larger effect of this environmental factor compared to a factor with a smaller value.
2.5.2 Effect of physiological parameters
The sensitivity analysis of physiological parameters was conducted for lichen-dominated biocrust at all study sites. The original parameter values were obtained by calibration to measured net photosynthesis response curves. We then varied the values of the following physiological parameters by a consistent range for all sites: metabolic respiration cost per surface area (Resp_main), Q10 value of respiration (q10), the optimum temperature for gross photosynthesis (Topt), respiration cost of RuBisCO enzyme (Rub_ratio), light absorption fraction in cells (ExtL), minimum saturation for activation (Sat_act0), and minimum saturation for full activation (Sat_act1). Specifically, we increased or decreased Resp_main, ExtL, q10, and Sat_act0 by 30 %; Rub_ratio and Sat_act1 by 20 %; and Topt by 5 K. These parameters are chosen since they are closely related to the response of photosynthesis and respiration to water, light, and temperature. These ranges of different parameters were determined based on the observed bounds of the photosynthetic response curves of all replicates (see calibration results with varied parameters at all sites in Figs. S5–S10 in the Supplement), which have large deviations between each other at most sites, as shown in Figs. 2 and S2. The effects of the varied physiological parameters on the C balance were then normalized using the same normalization method as for the environmental factors (in Sect. 2.5.1) for comparison among parameters and climatic zones.
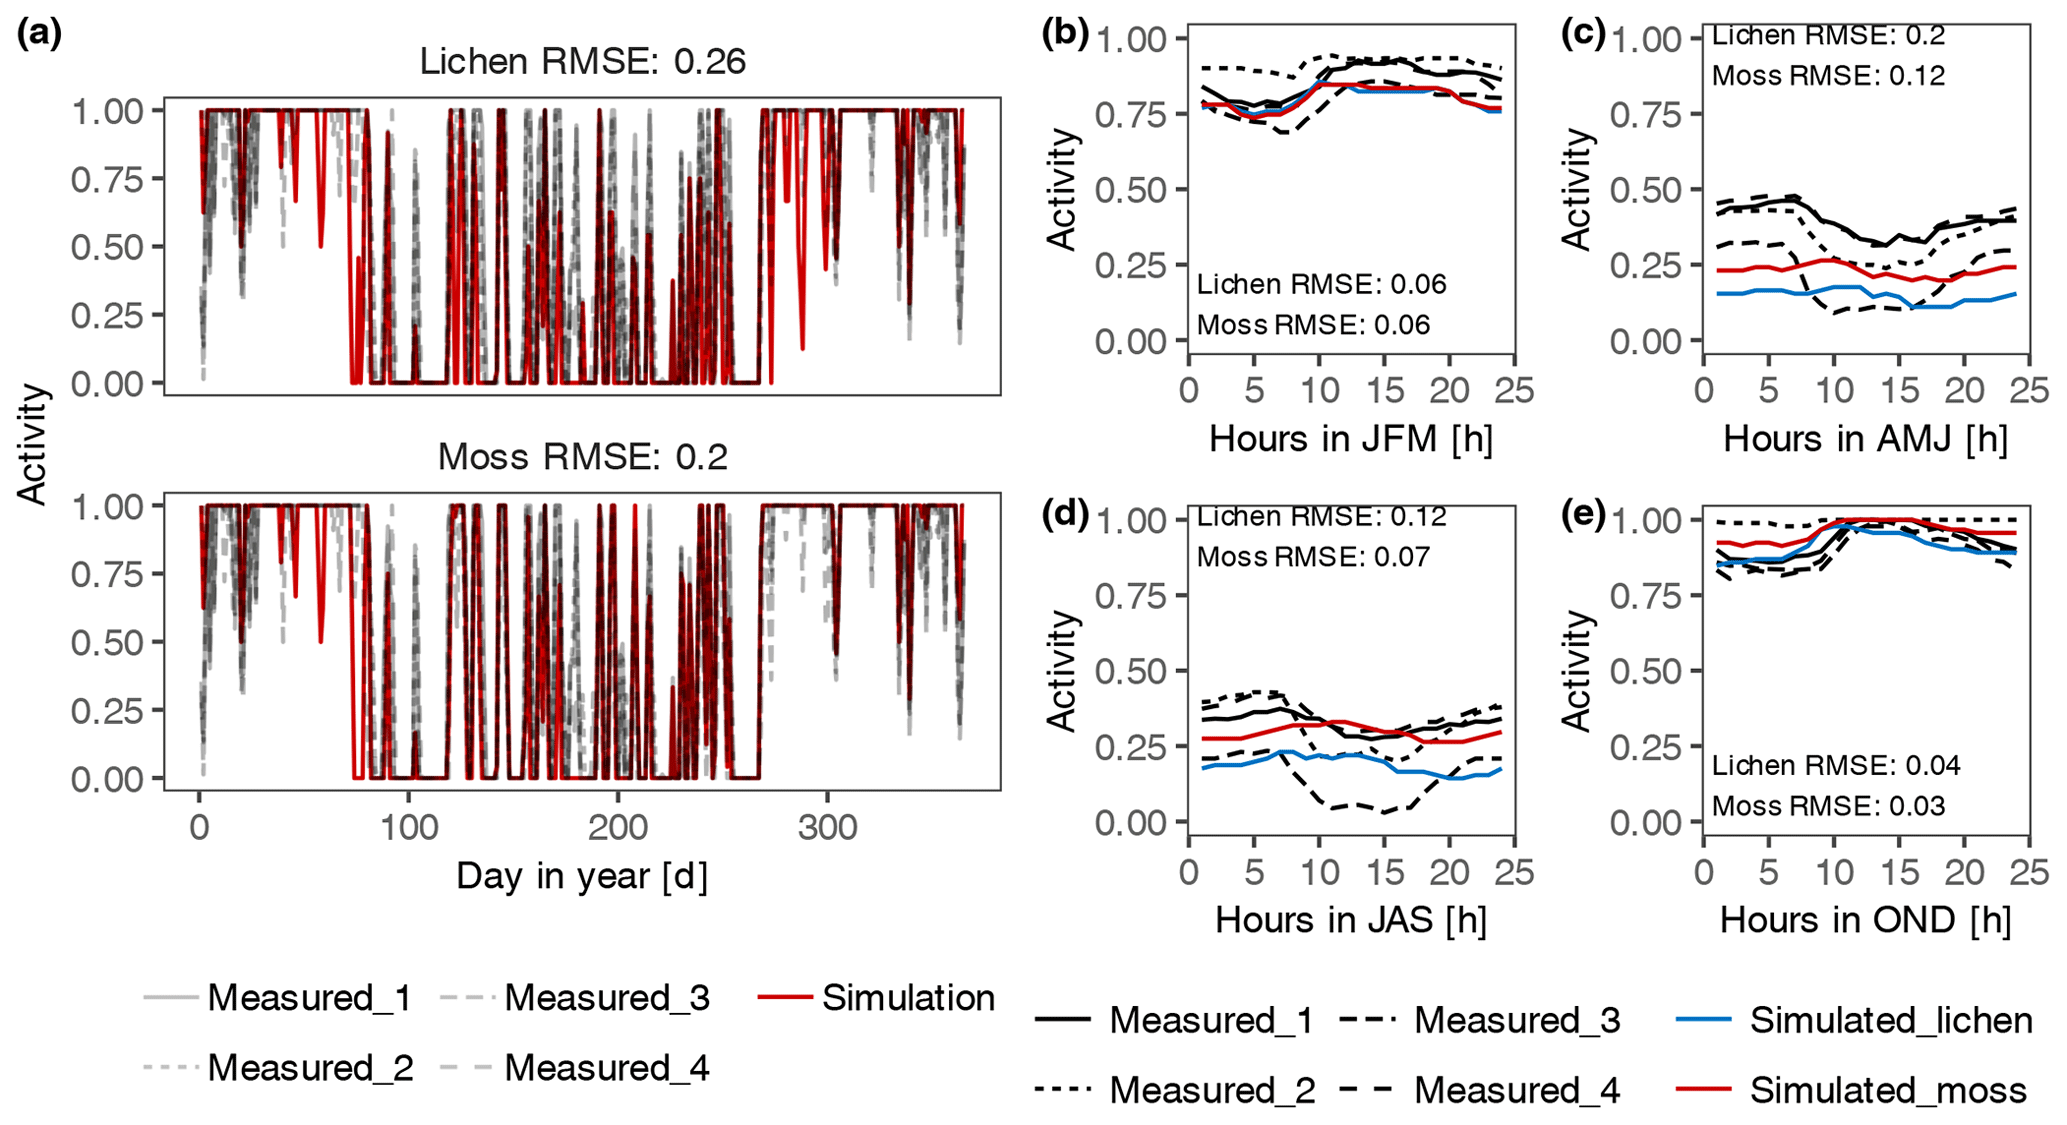
Figure 3Validation of the estimated daily (a) and diurnal (b–e) patterns of activity of lichen- and moss-dominated biocrusts at site T3. The simulated patterns of activity were compared to measured data by four sensors at different locations. Panels (b) to (e) represent the patterns of average hourly activity from January to March (JFM), April to June (AMJ), July to September (JAS), and October to December (OND), respectively.
2.5.3 Effect of seasonal acclimation
Another sensitivity analysis was performed for site T1 to investigate the impact of seasonally acclimatized physiological properties on the C balance. We analysed the lichen- and moss-dominated biocrusts at site T1 as an example because the measured time series of activity showed that, in temperate sites such as T1, the organisms were active most of the time, and thus the C balance would be more sensitive to seasonally varying properties.
In the analysis, rather than keeping all calibrated parameters fixed throughout the simulation period of the data-driven model, the physiological parameters of metabolic respiration cost per surface area (Resp_main), light absorption fraction in cells (ExtL), and the ratio of Jmax to Vcmax (jvratio) were set to another set of values in the winter months in order to adapt to the climatic conditions, since biocrusts at sites T1 were collected in the summer months. These new, “dynamic” parameters were applied in an additional simulation, and the resulting C balance was compared to the original simulation based on the “fixed” parameters. The dynamic parameters were chosen and varied based on the literature: respiration of lichens was found to acclimate to seasonal changes in temperature (Lange and Green, 2005). Moreover, under low light, organisms showed shade-adapted physiological characteristics with low PAR compensation and saturation points (LCP and LSP; Green and Lange, 1991). These properties can be expressed by certain parameters of the data-driven model. For instance, the respiration rate is determined by the parameter Resp_main; LCP and LSP can be affected by changing the slope of the photosynthesis–light relations through the parameter ExtL; LCP and LSP can also be modified via the parameter jvratio, as it influences the value of light use efficiency at unsaturated light.
Accordingly, in an hourly simulation during September and December, January, and February, the parameter Resp_main was reduced to half to lighten the respiratory cost for the samples collected at site T1. The size of ExtL was doubled to increase the slope of photosynthesis–light relations. In addition, the parameter jvratio was doubled as well to enhance the light use efficiency.
2.6 LiBry model
LiBry is a process-based dynamic global vegetation model (DGVM) specific to non-vascular vegetation. The model mimics environmental filtering in the real world by simulating many different functional strategies and selecting those which maintain a positive C balance under the respective climatic conditions. The strategies are characterized by a combination of 11 physiological and morphological parameters. More information about the model is briefly described in the Supplement, and a full detailed description can be found in Porada et al. (2013, 2019).
For this study, the LiBry model was run for 300 years, with repeated microclimate forcing data of 1 year from the six study sites, calibrated abiotic parameters same as the data-driven model, and initially generated 1000 strategies. C balance and dynamics of the surface cover of the strategies were simulated until a steady state was reached, so that the final successful strategies were those where long-term biomass values were positive. Moreover, at the end of the simulation, the average values of functional traits were estimated by weighting all surviving strategies based on their relative cover. The (hypothetical) strategy characterized by these average values is called average strategy. The strategy with the largest cover area is called dominant strategy.
Furthermore, we compared the physiological parameters of the average strategy and the selected dominant strategies to the ones of organisms in the field by means of their respective photosynthesis response curves. This comparison can verify the C balance estimated by the data-driven model from a reversed perspective, as the LiBry model is based on the same processes as the data-driven model, but the strategies were freely selected by the LiBry model based on their C balance, without prescribing values based on site level observations.
3.1 Data-driven model
3.1.1 Validation of the data-driven model
In general, the simulated daily and diurnal patterns of activity (water content at site D2) fit the measurements reasonably well in magnitude (Figs. 3 and S3 in the Supplement). However, our fitting resulted in a more dampened diurnal activity pattern simulated by the model, and the activity at night and in the morning was underestimated during several seasons at sites D1, T1, T2, and A1. In addition, both the daily and diurnal activity during April and June at site T1 were underestimated. Furthermore, water content was overestimated for moss-dominated biocrust, especially when there was a large amount of water input at D2, although the patterns corresponded well to the measured data for all three biocrust types (Fig. S3). This overestimation may have resulted from the bias in measured MWC of samples used for constraining the water content in the model.
The comparison of simulated and on-site measured CO2 exchange rates of three biocrust types (moss, lichen, and cyanocrust, composed of cyanolichens and cyanobacteria) at site D2 showed mismatches, especially when water saturation was at both ends of the gradient (Fig. 4). The CO2 exchange rate at high water content was overestimated compared to the measurements. Moreover, there were large variations in measurements of respiration and CO2 exchange rate, as water content was low, and thus the simulated CO2 exchange rate was zero. Excluding the values at both ends of water content (0.58 and 1.74 mm for moss, 0.22 and 0.68 mm for lichen, 0.65 and 1.24 mm for cyanocrust), the accuracy of the model predictions was improved (root mean square error (RMSE) decreased from 1.44 to 1.36 for moss, 1.27 to 0.65 for lichen, and 0.79 to 0.77 for cyanocrust). Furthermore, the simulations were similar to measurements in magnitude. Therefore, despite the large variation, we are confident about the general validity of the model.
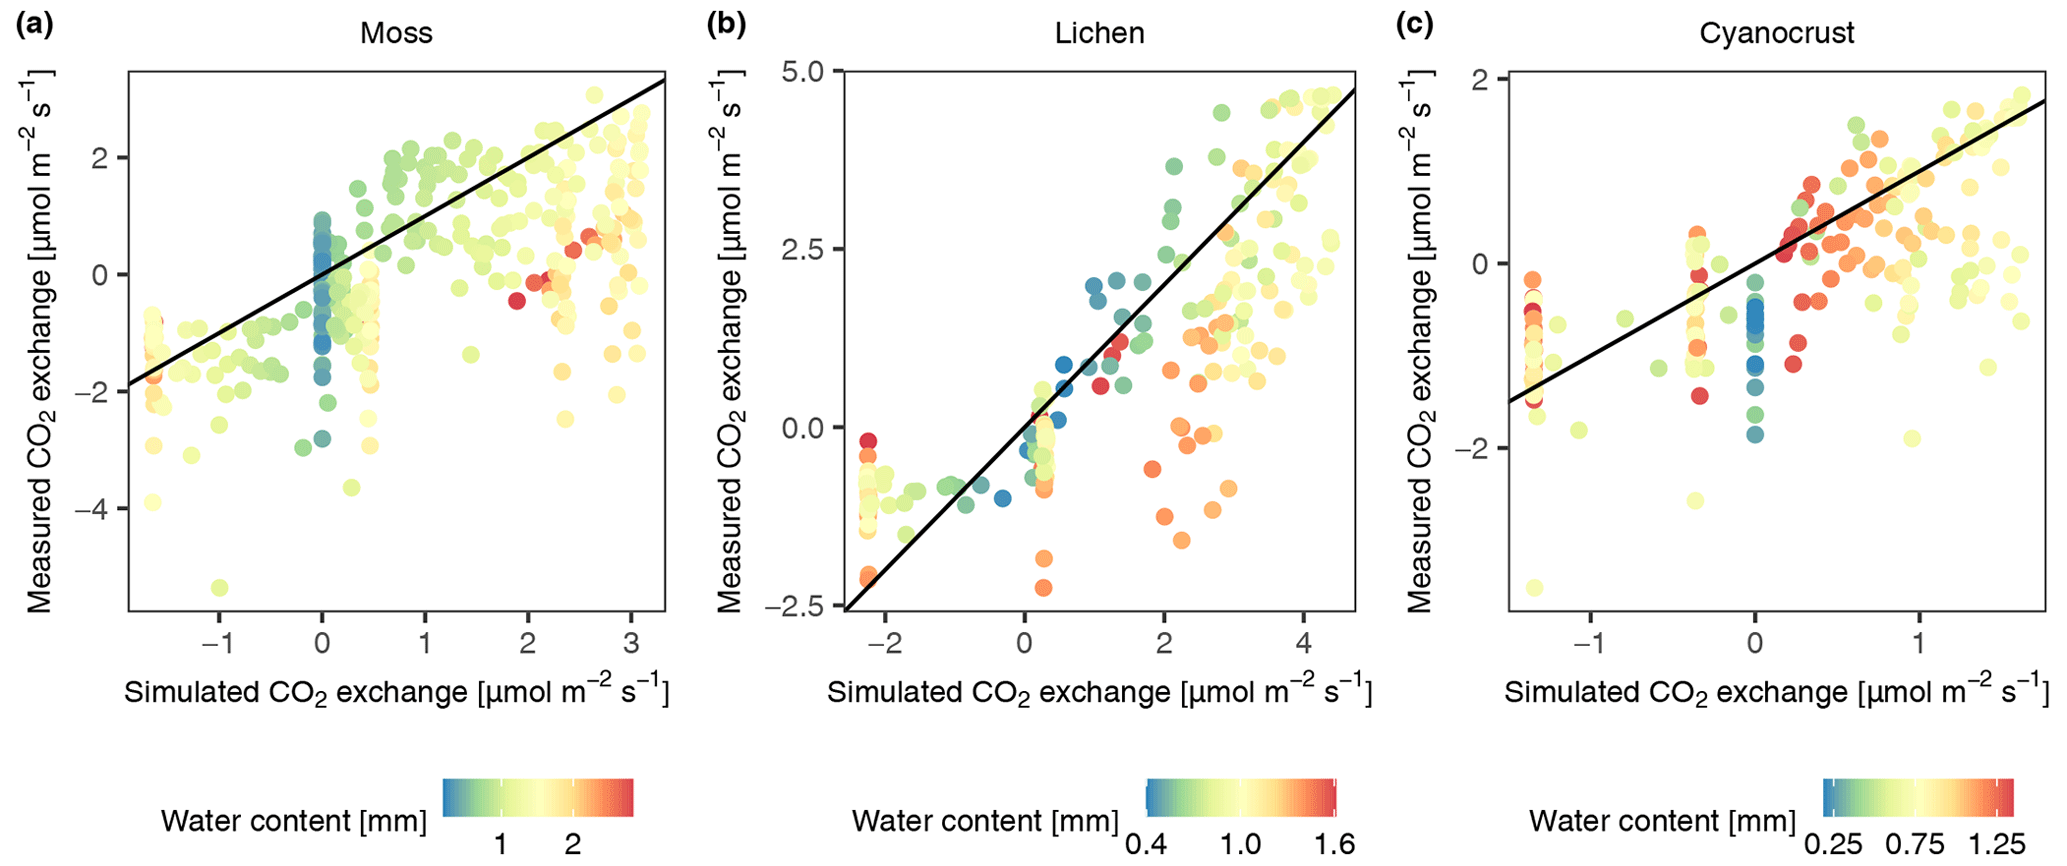
Figure 4Validation of the photosynthesis and respiration scheme of the data-driven model through comparison of modelled and measured CO2 exchange rate of moss (a), lichen (b), and cyanocrust (c) given the measured water content, surface temperature, PAR, and calculated activity. Observational data were collected in November in 2013 at site D2. The 1:1 line is shown in black.
3.1.2 Estimated C balance by data-driven model
The simulated annual C balance of each collected biocrust type at each site is listed in Table 2. The annual C balance of lichen- and moss-dominated biocrusts at dryland D1 showed a small positive value. Moreover, the moss-dominated biocrust at dryland D2 gained small amount of carbon, while lichen-dominated biocrust and a cyanocrust additionally measured at site D2 showed a small net release of carbon in the model.
Table 2Simulated annual carbon budgets of each biocrust type at all sites.
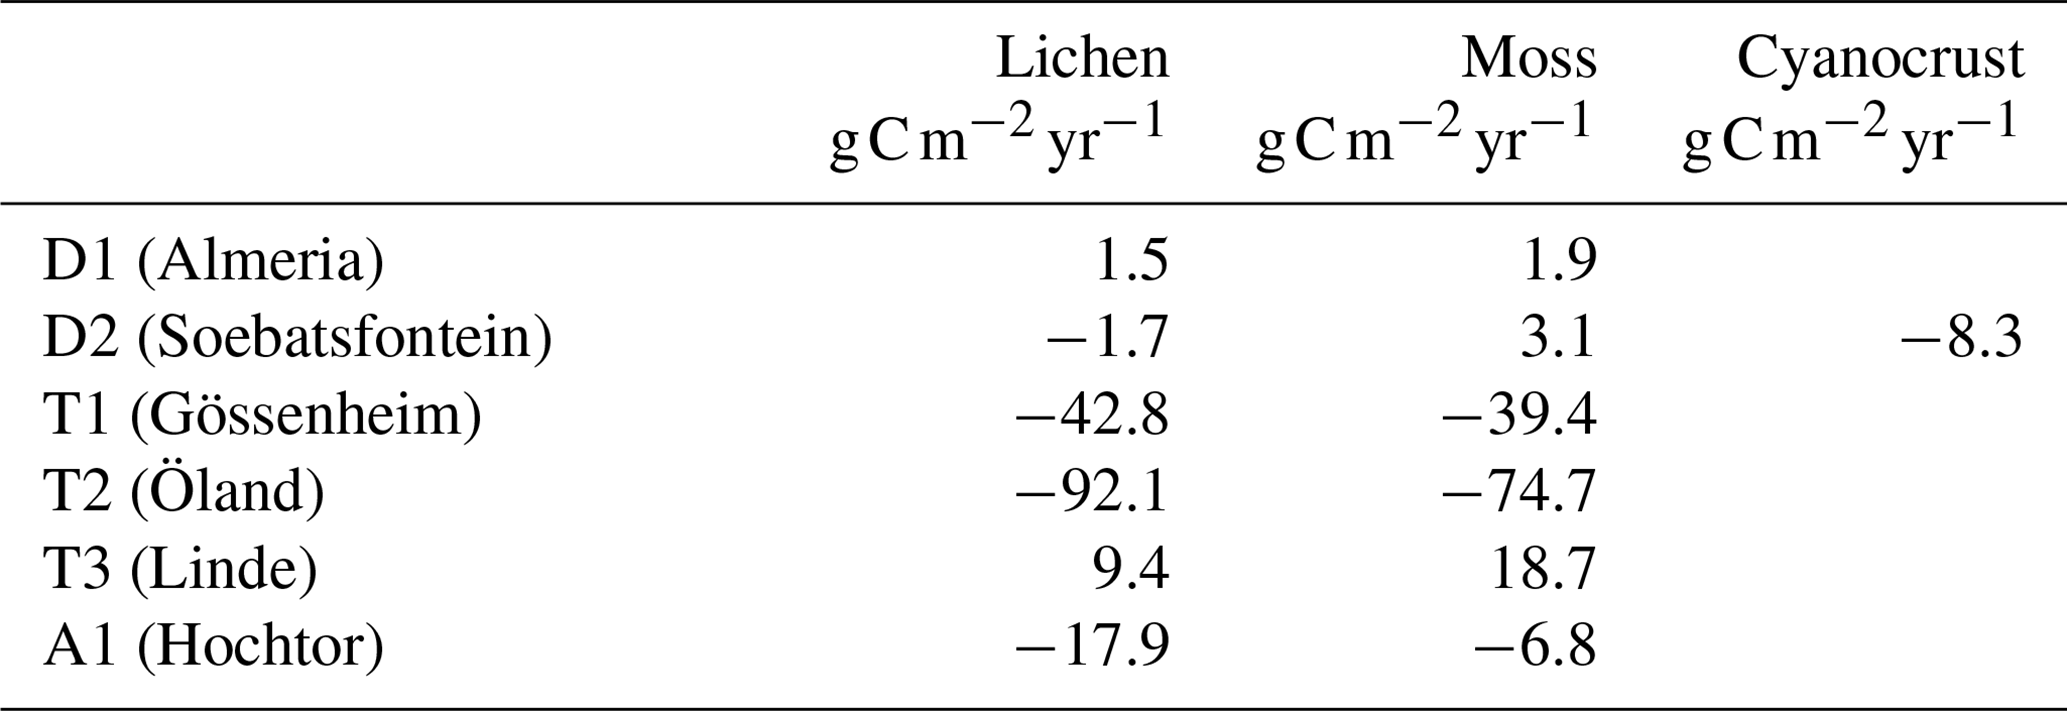
Furthermore, according to these data-driven model simulations, despite the C balance of two biocrust types being positive at site T3, a large amount of carbon was lost at the sites T1 and T2 in temperate humid regions. These results imply that, according to the data-driven model, the biocrusts would not survive in the long term at most of the temperate humid research sites. At the alpine site A1, both lichen- and moss-dominated biocrust lost carbon in a year with long periods of ice cover.
3.2 Dominant strategies selected by the LiBry model
In general, the photosynthesis response curves of dominant and average strategies selected by the LiBry model did not fit well to the measurements, especially at temperate site T2 (Fig. 5; the results for the other sites with negative C balance are shown in Fig. S4 in the Supplement). Specifically, the selected physiological traits which determine water and light acquisition of the dominant and average strategies in LiBry differed from those of the collected samples at all sites. Compared to the measured samples, the LiBry strategies showed markedly higher efficiency at low light intensity and faster activation. By design, the LiBry model selected strategies with a positive C balance in the long-term run, and thus the mismatches are consistent with the fact that the data-driven model simulated negative C balances.
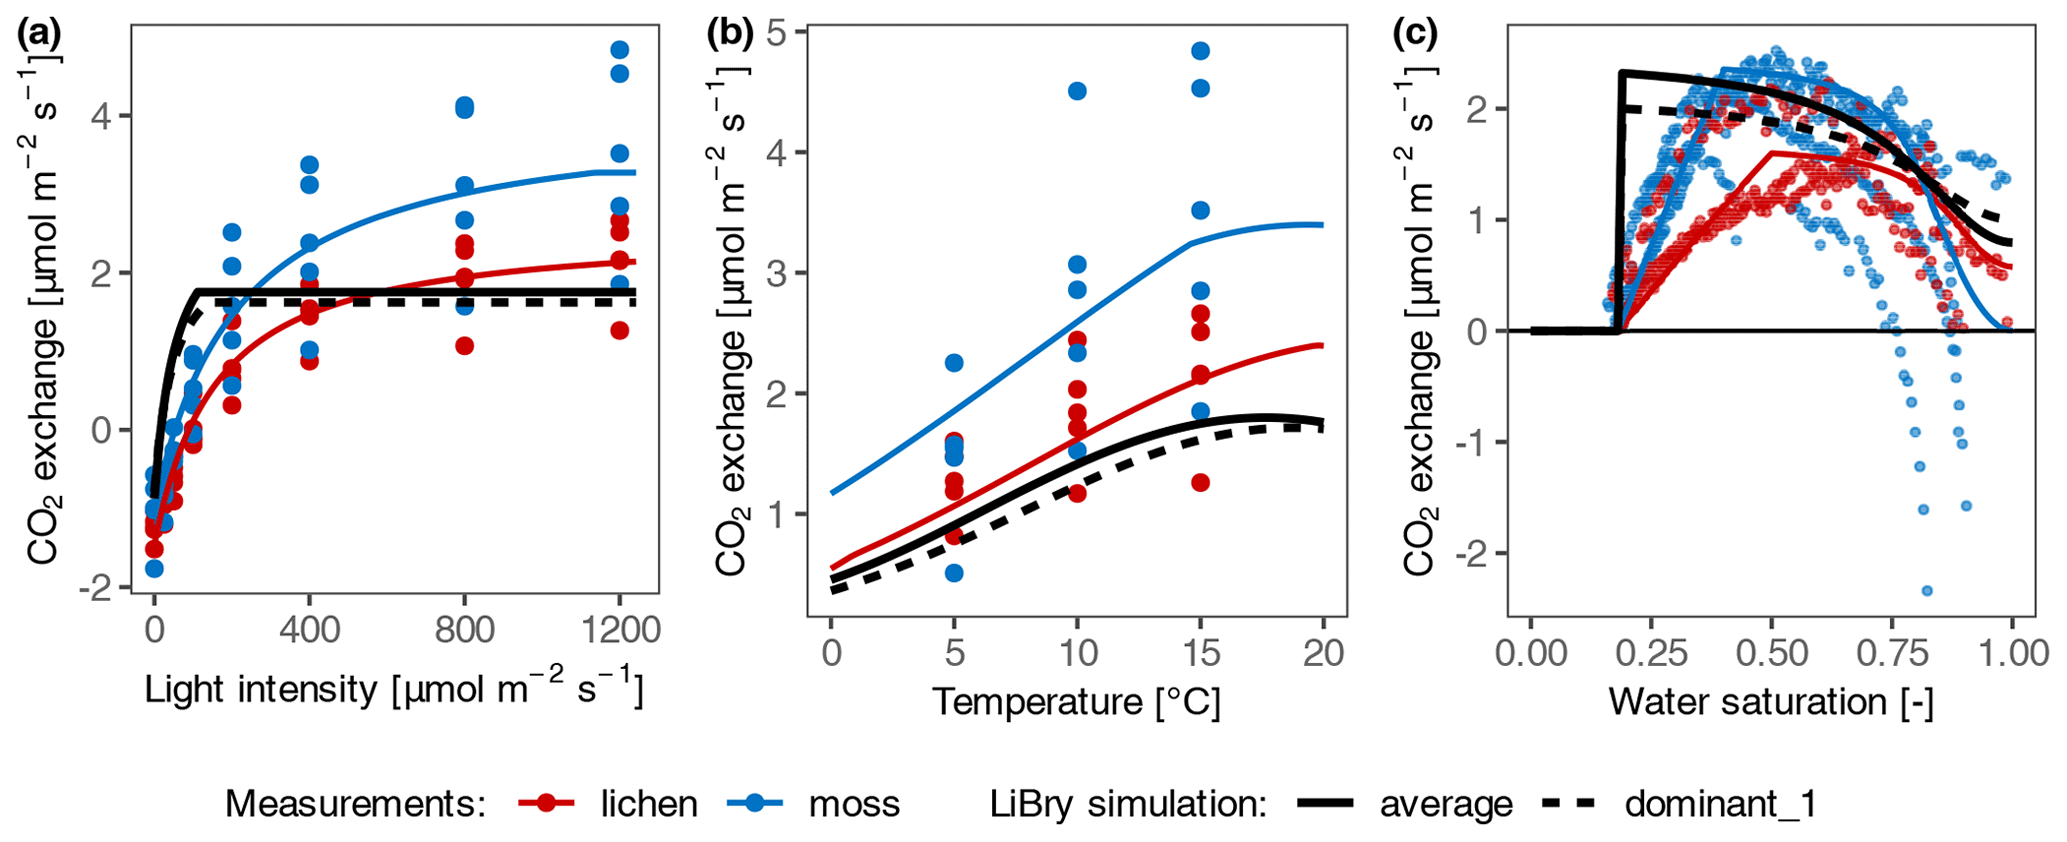
Figure 5Comparison of net photosynthesis response of measured samples with simulated selected dominant and average strategies of LiBry at site T2. (a) Light response curve; (b) temperature response curve; and (c) water response relation. The coloured points represent the measured CO2 exchange rates of moss and lichen, and the coloured lines correspond to the data-driven model. The black lines show the photosynthesis response of the dominant strategy selected by the LiBry model (dashed) and the average strategy (solid). The parameter values of the average strategy correspond to the average of all surviving strategies.
3.3 Driving factors of variation of the C balance
3.3.1 Environmental factors
The environmental factors of light intensity, CO2 concentration, air temperature, and various water sources had different effects on the C balance of lichens in different climate zones (Fig. 6). For all sites within a given climate zone, the effects of different environmental factors on C balance were overall similar but showed an apparent larger variation at the temperate site T3 in contrast to the other two temperate sites, and at site D2 compared to D1 (Fig. 6a). This may be due to physiological differences of the investigated biocrust species between these sites and, consequently, variations in the responses of net photosynthesis rate to temperature, water, and light between them (Figs. 2 and S2).
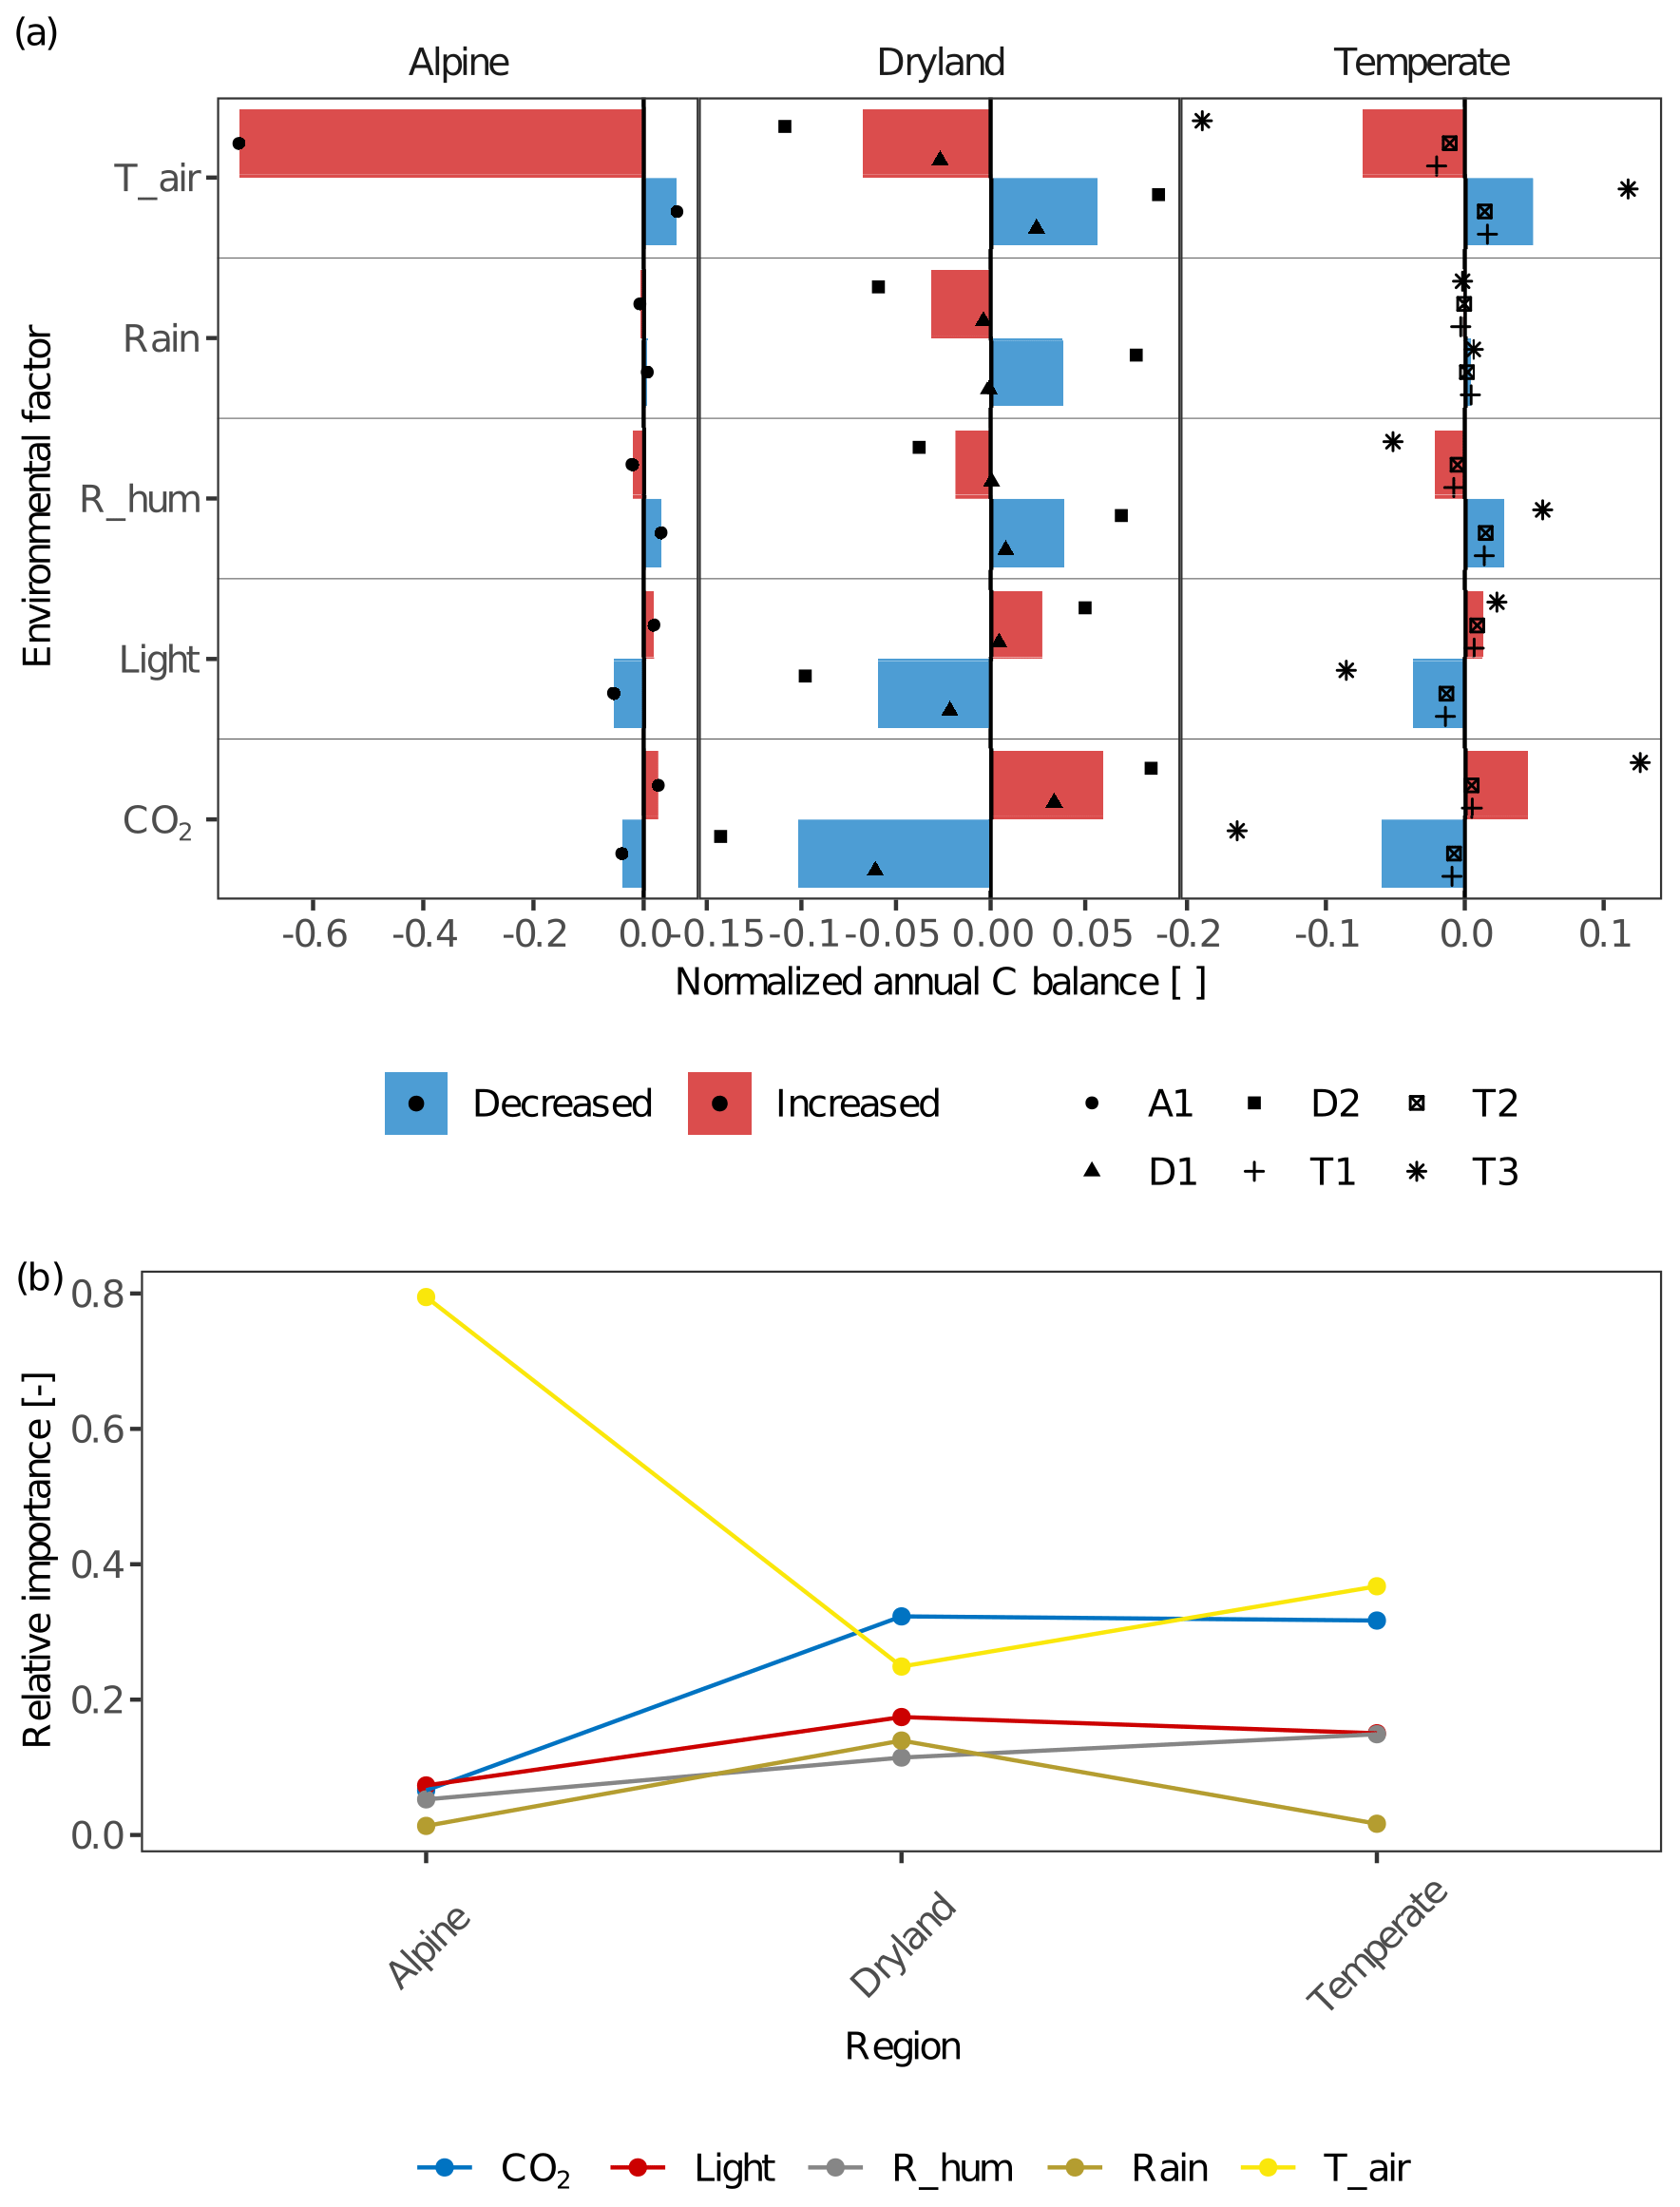
Figure 6(a) The effects of environmental factors – CO2 concentration (CO2), relative air humidity (R_hum), rainfall amount (Rain), air temperature (T_air), and light intensity (Light) – on the annual C balance of lichens in different climate regions. The altered annual C balance resulting from increasing or decreasing environmental factors is normalized by the C balance under original environmental conditions. The coloured columns indicate the average value of the normalized C balance at sites with similar climate conditions. Various styles of black points indicate different sites. Positive normalized C balance implies that the annual C balance increases with varying environmental factors and that more carbon was accumulated in a year at the site, and vice versa. A larger normalized C balance reflects that the C balance is more sensitive to the altering environmental factor, and thus the environmental factor has a larger effect on C balance. (b) Relative importance of each environmental factor compared to other factors across the climatic regions. Larger relative importance implies a more important effect that the factor has on the C balance compared to other factors in the given climatic region, and vice versa.
Furthermore, the spatial patterns of the relative importance of different environmental factors show that the factors which have the strongest effects differ between climatic regions (Fig. 6b).
In general, air temperature and CO2 concentration were the most important drivers for C balance of biocrust organisms between climate zones. Light intensity and relative humidity played a relevant role in impacting the C balance as well. Rainfall amount had lower relative importance at all sites except dryland D2, where the effect of rainfall on C balance was similar to other factors (Fig. 6a). Therefore, rainfall amount showed a maximum in relative importance in drylands compared to other regions. In general, the effect of the other water source, relative air humidity, was moderate but notable at all climate zones and was slightly larger in temperate regions in comparison to other climate zones. Furthermore, the humidity had a slightly larger impact on C balance in comparison to rainfall amount at all temperate and alpine sites (e.g. change amplitude was 0.007 for rainfall and 0.021 for humidity at T1). In drylands, however, the impacts of water sources on C balance varied between sites. The results showed that relative humidity had a slightly larger impact than rainfall amount at D1, while smaller at D2 (the change in amplitude at D2 was 0.108 for humidity and 0.137 for rainfall).
The ambient CO2 concentration was an essential factor for the C balance at all sites especially in drylands, resulting in positive effects on C balance with increasing CO2. Furthermore, light intensity had a marked impact on the C budget at all sites, and it was relatively more important in drylands and temperate regions than the alpine site. At all sites, the normalized C balance increased with enhanced light intensity and vice versa (e.g. normalized C balance at T2 are −0.013 and 0.008 for half and doubled light intensity). Air temperature had a large impact on C balance at all sites. Especially at the alpine site A1, C balance decreased strongly as air temperature raised by 5 K (normalized C balance of −0.735), and at all sites, the direction of the effect remained constant, namely, warming decreased the C balance and vice versa.
3.3.2 Physiological parameters
We found that physiology plays an important role in all regions. In particular, the respiration-related parameters such as q10, Resp_main, and Topt have a notably higher impact on C-balance estimation (Fig. 7). Furthermore, the relative importance of several physiological parameters showed similar patterns across climatic zones: in all regions, q10 is the most essential parameter, and Sat_act0 and Sat_act1 play little roles in affecting C balance. Other parameters showed slightly different patterns among regions. Metabolic respiration cost (Resp_main), for instance, plays a more important role than optimum temperature for gross photosynthesis (Topt) at the alpine site, while the optimum temperature is more essential in drylands and temperate regions (Fig. 7b).
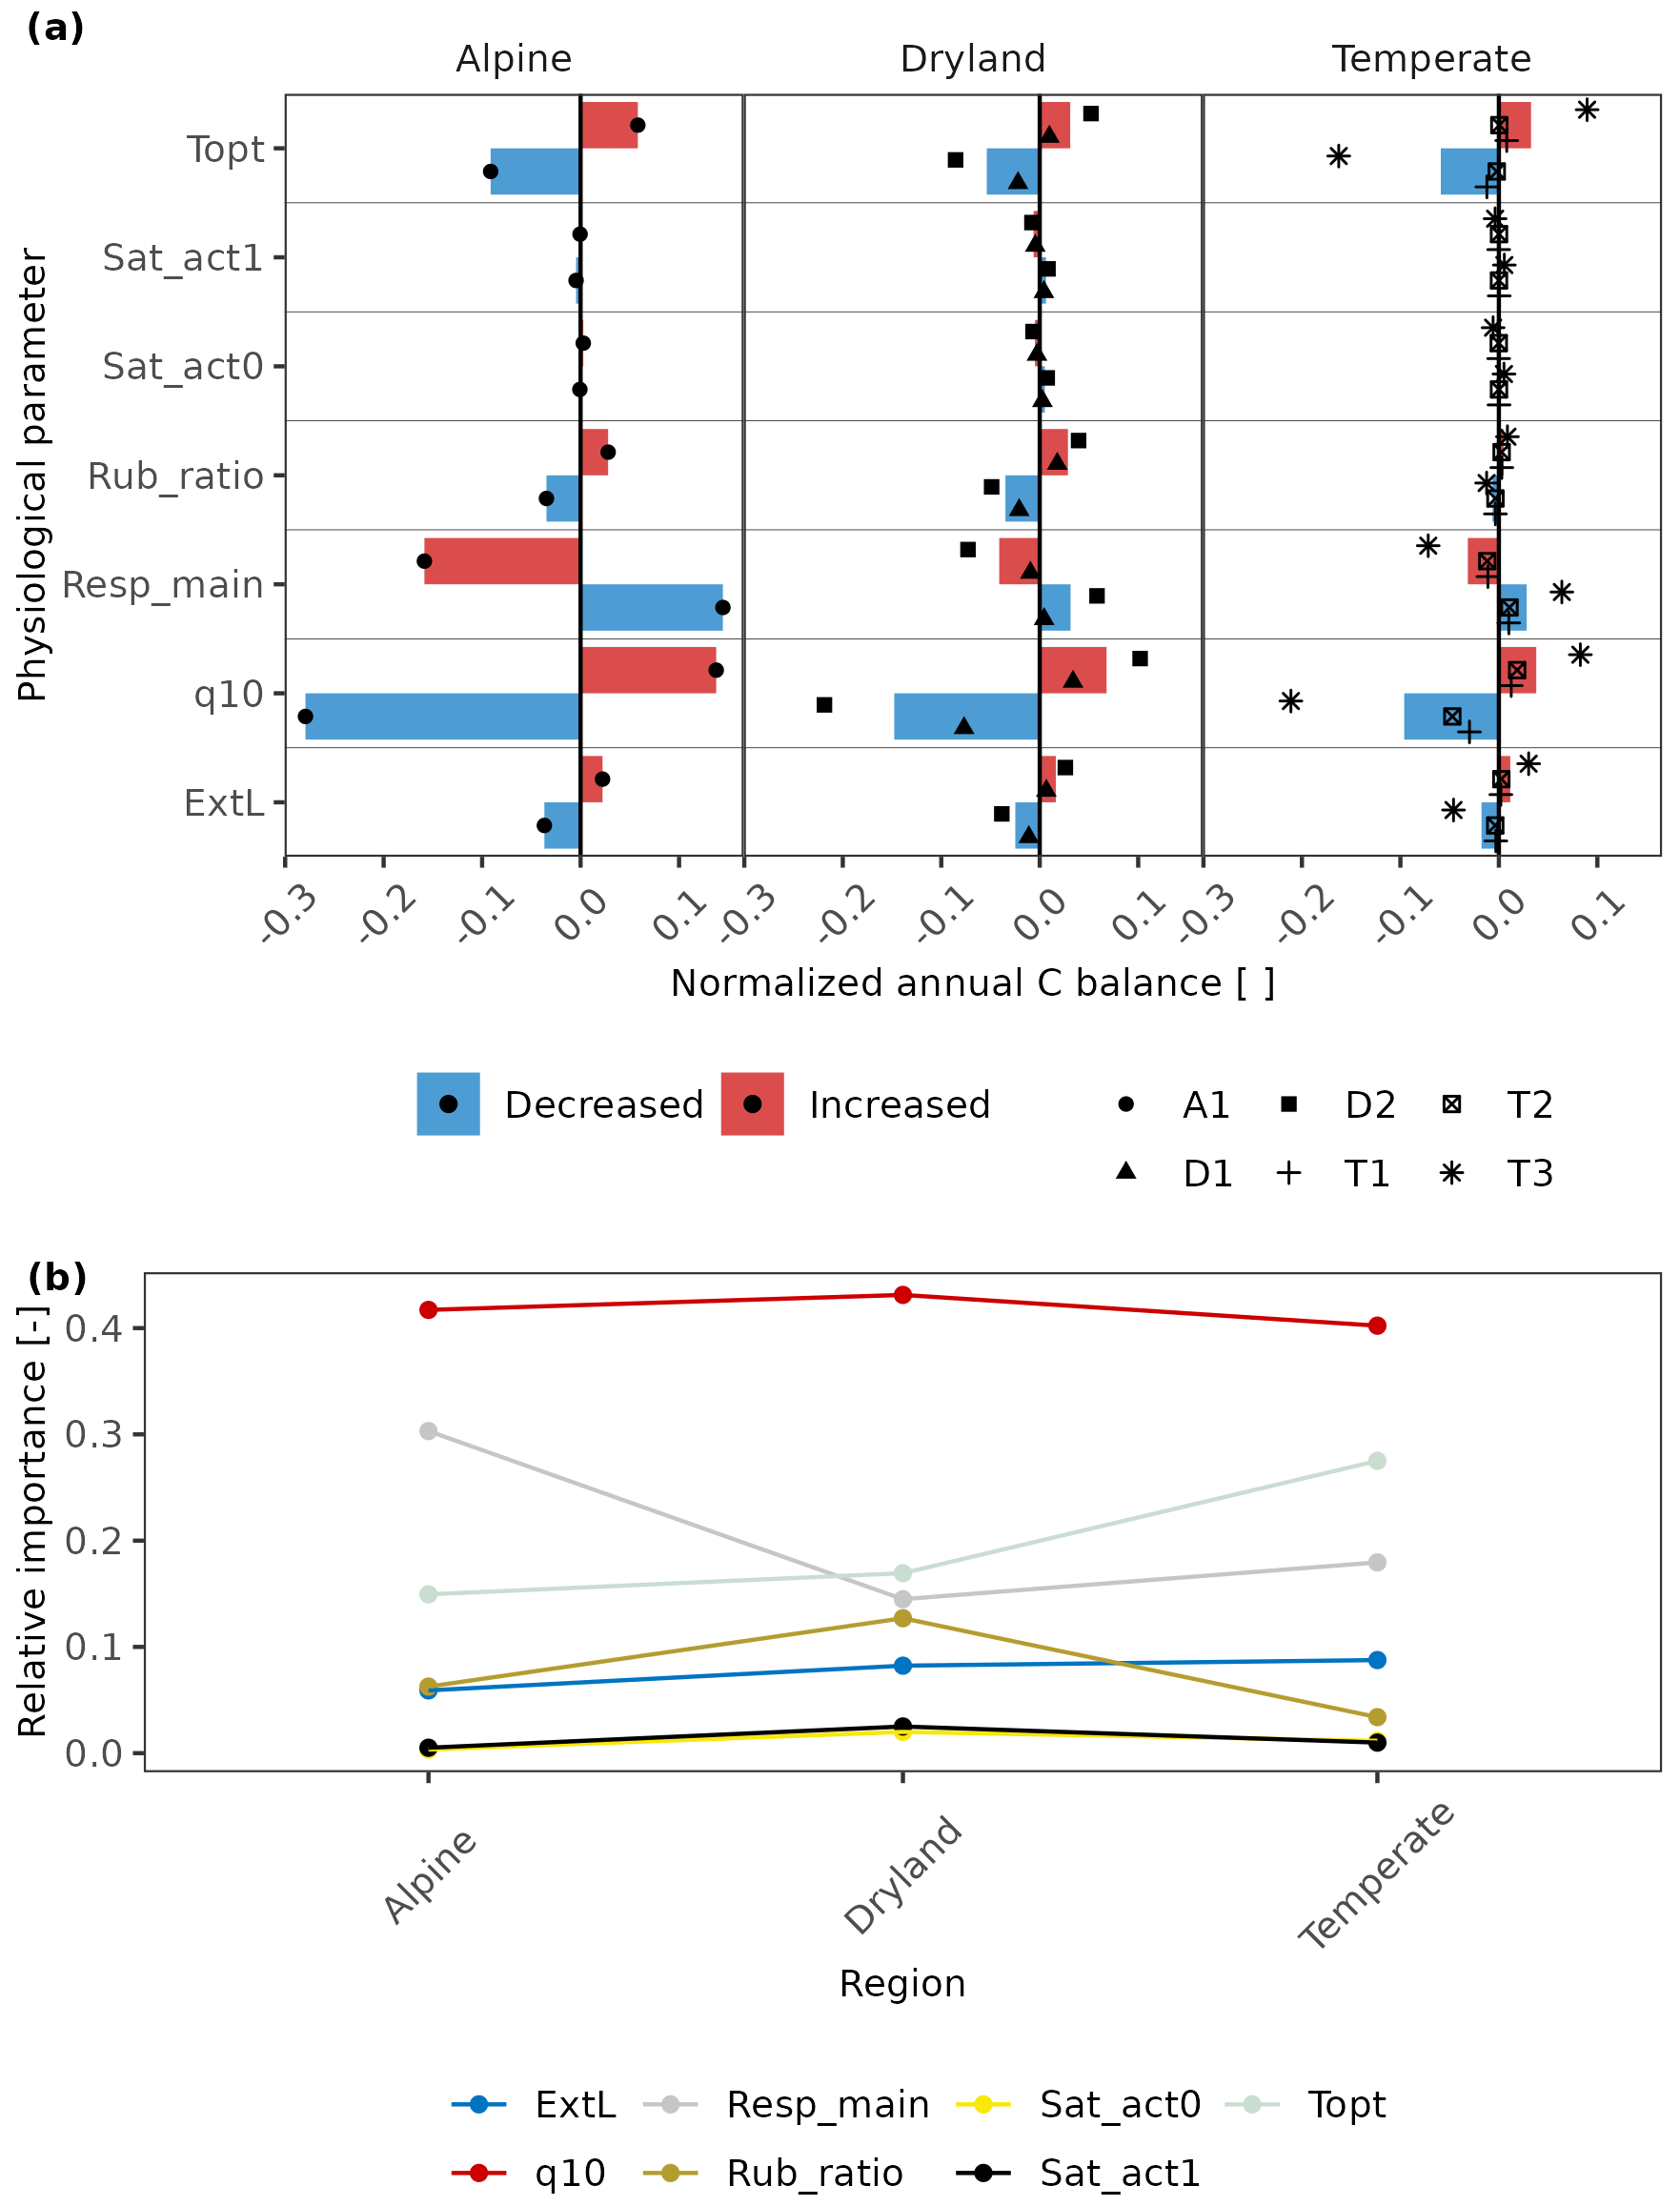
Figure 7(a) The effects of physiological parameters – metabolic respiration cost per surface area (Resp_main), Q10 value of respiration (q10), the optimum temperature for gross photosynthesis (Topt), respiration cost of RuBisCO enzyme (Rub_ratio), light absorption fraction in cells (ExtL), minimum saturation for activation (Sat_act0), and minimum saturation for full activation (Sat_act1) – on the annual C balance of lichen-dominated biocrusts in different climate regions. The parameters decreased or increased by a consistent range for all sites based on the measured deviation in photosynthesis response curves of replicates. The altered annual C balance resulting from increasing or decreasing parameters is normalized by the original C balance. The coloured columns indicate the average value of the normalized C balance at sites with similar climate conditions. Various styles of black points indicate different sites. (b) Relative importance of each physiological parameter compared to other parameters across the climatic regions. Larger relative importance implies a more important effect that the parameter has on the C balance compared to other parameters in the given climatic region, and vice versa.
However, even though physiology parameters play an important role in all regions, the C balance at T1, T2, and A1 did not become positive when the physiological parameters were varied reasonably, that is, the parameters were varied to relatively cover the deviation of response curves of replicates. Furthermore, the change in C-balance value is much smaller in drylands compared to other regions (as shown in Fig. S11 in the Supplement).
3.3.3 Acclimation of physiological properties
The sensitivity analysis for acclimation showed a marked increase in annual productivity of lichen- and moss-dominated biocrusts at site T1 (Fig. 8) when the seasonal acclimation of several physiological parameters was included in the model (from −42.8 to −15.5 and from −39.4 to −4.2 ).
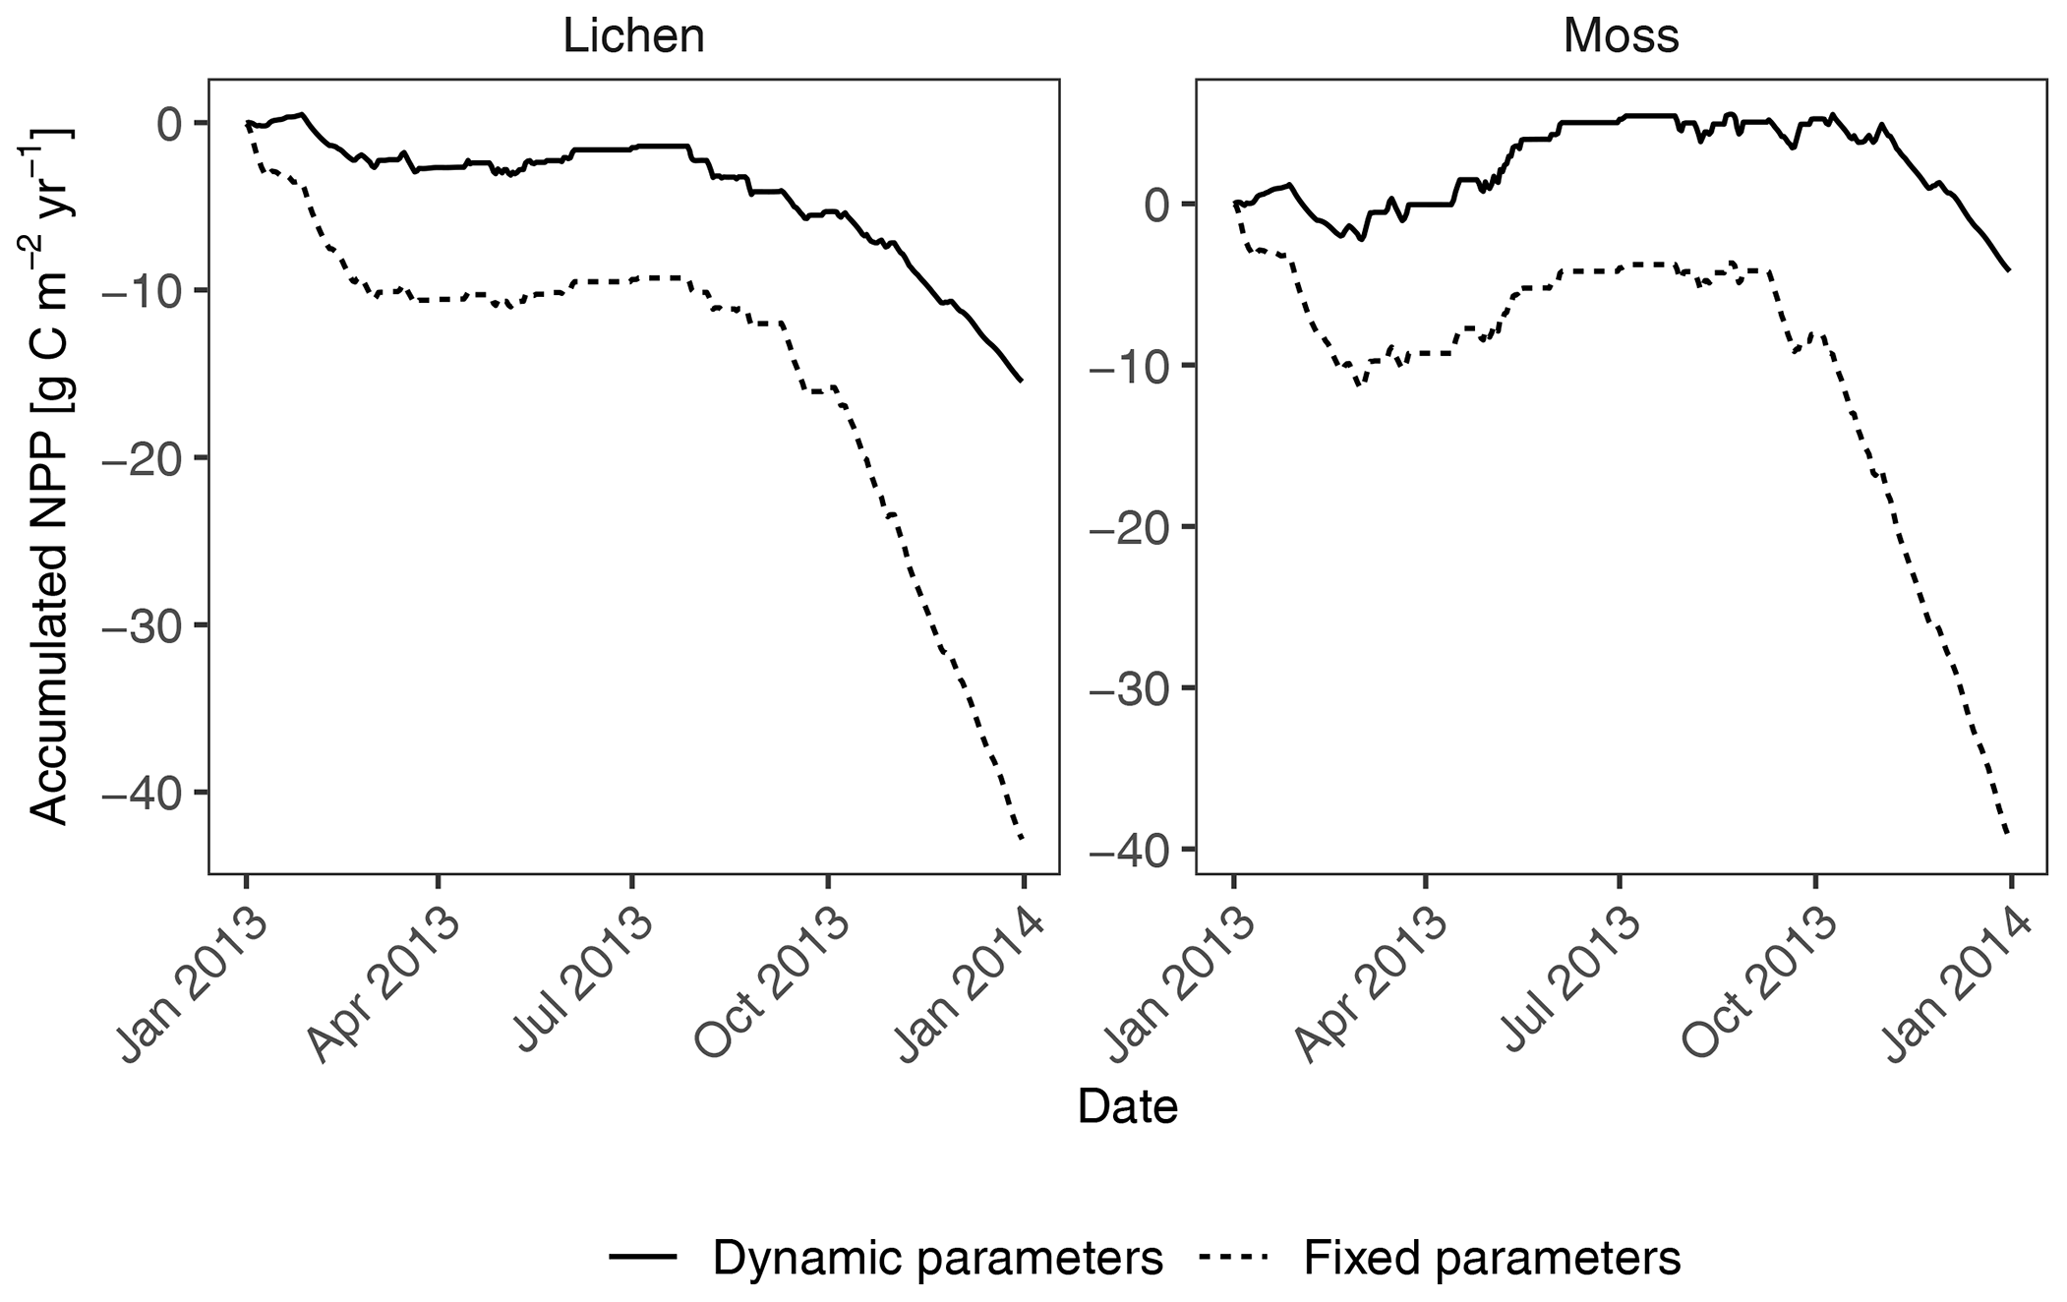
Figure 8Comparison of accumulated annual C balance between two simulations in the sensitivity analysis of seasonal acclimation of physiological properties. In the simulation “fixed parameters”, all parameters that have been calibrated or measured remained constant throughout the simulation year. For the simulation “dynamic parameters” at site T1, parameter metabolic respiration cost per surface area (Resp_main) was reduced by half, light absorption fraction in cells (ExtL) was doubled but restricted to one, and the ratio of Jmax to Vcmax (jvratio) was increased by 2 times from September to February to adapt to the winter climates. For the other months, the “fixed” values were used.
4.1 Simulated C balance of the data-driven model
The data-driven model aims to provide observation-based estimates of the carbon fluxes of non-vascular photoautotrophs, which may serve as an approximation for the C balance of vegetation in biocrust-dominated ecosystems. At the two dryland sites, the moss-dominated biocrusts were estimated to be carbon sinks on an annual basis, and lichen-dominated biocrust can also be a carbon sink at one of the dryland sites. As shown in the results, mosses accumulated 1.9 and 3.1 at site D1 and D2, respectively, and lichens accumulated 1.5 at site D1.
The estimated C balance at the two dryland sites is consistent with the magnitude of the annual C balance of different biocrust types reported by various studies in arid habitats. Feng et al. (2014) recorded that the biocrusts composed of lichens, mosses, and cyanobacteria of the Mu Us Desert in China took up 3.46 to 6.05 . Brostoff et al. (2005) estimated a larger carbon gain by lichen biocrust of 11.7 in the Mojave Desert, USA. For cyanobacteria, an annual carbon uptake of 0.02 to 2.3 g C m−2 was reported for deserts (Jeffries et al., 1993). The estimated C-balance values in drylands fluctuate relatively largely, but the magnitude is consistent with the simulated results by the data-driven model at D1 and D2.
For biocrust lichens growing on a rock surface without soil attached underneath in a temperate grassland, Lange (2003b) measured an annual carbon gain of 21.49 g C m−2. Additionally, several studies estimated the carbon budget in humid tundra habitats. An amount of ∼12–70 of carbon was fixed by moss-dominated biocrust, for instance (Schuur et al., 2007). The magnitude of these values corresponds to the estimation of the C balance at T3. However, the estimated annual carbon losses of lichens and mosses by the data-driven model in temperate regions T1 and T2 should actually lead to the death of these organisms, which is not consistent with their dominant abundance in the field and is much lower than published by previous studies.
The mismatches of trait values between strategies predicted via selection by the LiBry model for the sites and the collected species with regard to their net photosynthesis response curves indicate that the physiological parameter values that would be necessary to maintain a positive C balance in LiBry are not compatible with those of the sampled biocrusts. This is in line with the results of the data-driven model, which also simulates a negative C balance and is based on the same physiological processes as LiBry. This also applies to the lack of seasonal acclimation in both modelling approaches, since the strategies in LiBry are assumed to have constant functional properties throughout the simulation.
4.2 Uncertainties of long-term C balance simulated by the data-driven model
The data-driven model simulated relatively reasonable C-balance values in drylands but unrealistic, negative values at temperate sites T1 and T2. Since the same or similar gas exchange methodology has been used for all sites; differences in the simulated C balance among these regions likely result from variation in the species-specific interactions between climate and physiological processes, including seasonal variation in physiological properties due to acclimation.
As the results (Fig. 6) show, CO2 concentration is an essential factor for the annual C balance of biocrusts, especially at dryland and some temperate sites. Therefore, uncertainty in the CO2 value prescribed in the model may be a source of error. The CO2 concentration at the surface boundary might exceed the value of 400 ppm that was prescribed in the model because of CO2 diffusion from the soil, which may lead to an underestimated C balance (Fig. 6a). However, with enhanced CO2 concentration in the sensitivity analysis (600 ppm) at site T1, for instance, the estimated C balance increased only slightly and is still strongly negative (−37.0 for lichen and −30.2 for moss). Hence, the lower CO2 concentration can partially contribute to the strongly negative C balance at T1 and T2 but is not a major factor.
Furthermore, the negative C balance at temperate and alpine sites may result from the uncertainties in physiology, which were also observed between replicates (see Figs. 2 and S2). An overestimation of dark respiration rates of the photoautotrophs in the biocrust may result from including a small amount of heterotrophic respiration. The overestimated respiration rate then leads to an overestimation of the parameter of metabolic respiration cost per surface area (Resp_main) and might also cause an underestimated Q10 value (q10) calculated from the respiration rates. The uncertainties of these two parameters reduce the estimated C balance largely (Fig. 7). Additionally, the optimum temperature (Topt), which is also the reference temperature for calculating the respiration rate, cannot be well constrained by the limited measured temperature response dataset. Thus, Topt may be underestimated. The larger difference in surface temperature to Topt results in a larger respiration rate, and lower gross photosynthesis, which leads to a lower C balance.
Although the uncertainty in individual physiological parameters may not lead to the markedly negative C-balance estimates, as indicated by still negative values upon variation of these parameters (Fig. S11), additive effects of all parameters combined with long-term unfavourable environmental conditions may cause a large amount of carbon lost over a year. The optimal conditions are rare within a year, which was also described by Lange (2003b). Thus, the overestimated respiration rate leads to a lower carbon gain during the relatively optimal conditions, which may not be sufficient to compensate for exaggerated C losses under long-term harsh conditions, such as autumn and winter at site T1, for instance. For this reason, the simulated C balance of mosses and lichens in temperate humid regions was mostly negative.
In addition to the uncertainty in the values of physiological parameters, seasonal acclimation of these physiological traits to the current climatic conditions may play an important role in regulating the C balance at humid sites where the organisms are active throughout the year, such as site T1 (Fig. 8). It was observed, for instance, that the respiration of lichens shows acclimation to seasonal changes in temperature, and the maximum CO2 exchange rate of the organisms remains steady throughout the year (Lange and Green, 2005). Gauslaa et al. (2006) found a higher chlorophyll ratio in forest lichens with increasing light. Moreover, depression in quantum efficiency in summer under extremely dry conditions has been observed (Vivas et al., 2017). These varied physiological properties of organisms within a year may result in different photosynthesis and respiration rates and thus different C balances in comparison to the ones that cannot acclimate to the seasonal climate. The missing seasonal acclimation of physiological traits may explain why the data-driven model estimated a negative C balance for biocrusts in humid regions.
Another limitation of the modelling approach may be the lack of separate responses of respiration and photosynthesis to metabolic activity. Both photosynthetic activity and respiration reach their maximum in the model once the water saturation reaches the optimum value for net photosynthesis (Wopt_np). In some cases, however, respiration rate may reach the maximum value only at a higher saturation than Wopt_np (Lange, 1980), indicating that the model may overestimate respiration in the long term.
In comparison with the unrealistic C-balance numbers at T1 and T2, we estimated more reasonable values in drylands and at T3. However, we do not make a definitive statement about whether or not the model predicts an accurate C balance in drylands, since the measured climate data and photosynthesis response curves that were used for calibrating land surface properties and various physiological parameters represent only samples of the large physiological and climatic variation. A higher accuracy would be more likely to be expected in drylands, as these regions have a more uniform climate throughout the year than temperate regions that show substantial seasonality. Additionally, variation in light conditions is slightly more relevant for the simulated C balance than variation in moisture (see Fig. 6) because the organisms are able to become inactive, meaning that the dry season in drylands does not have a decisive effect on the C balance, while low light in winter in temperate climates does, since organisms have to be active then. Furthermore, the longer total inactive period in drylands could reduce the bias in the magnitude of the simulated C balance caused by incorrectly estimated physiological parameter values. We estimated a smaller absolute change in annual C balance in drylands with varied physiological parameters in the sensitivity analysis (for instance, the C balance of lichens changed by 34.6 for parameter Topt at T1, while it changed only by 1.5 at D1).
Furthermore, the estimated C balance may be inaccurate due to the potential bias in estimated relative water saturation, which partly depends on prescribed MWC obtained by measurements. However, the outcome of the sensitivity analysis of MWC at T1 revealed that the annual carbon estimation is robust to the uncertainties with regard to the prescribed MWC (details in the Supplement). Another factor that potentially affects the accuracy of C-balance estimates is interannual climatic variability. While the model estimated unrealistic C-balance values of lichen-dominated biocrusts at T1 and T2 for current conditions, the C balance may have been different in other years. Therefore, the simulation of annual C balance based on multi-year climate data is worthy of future study to understand the long-term C balance better. Moreover, the estimated negative C balance of certain lichen and moss species may not be generalizable and representative of the overall situation in the field due to the large variation in physiological adaptation strategies to climate. There could be other organisms that form cryptogamic covers, for instance, that show a different degree of depression in net photosynthesis at high water content (Lange et al., 1995) and thus have more reasonable C-balance values.
4.3 Potential factors influencing the C balance
Despite diverse climatic conditions, we found similarities regarding the dominant environmental factors and physiological parameters controlling the C balance. Thereby, CO2 and air temperature were the two most important environmental factors at all sites. Relative air humidity, partly precipitation, and light intensity were also relevant for the estimation of the C balance. In terms of physiological parameters, the respiration-related parameters were the most important drivers, while parameters that affect Vcmax and thus the light-independent CO2 assimilation rate were relevant, too.
The relative importance of these factors and parameters varied slightly among climatic regions. Regarding the comparison between environmental factors, we cannot rule out that the magnitudes of changes in environmental factors that we applied in the sensitivity analysis were not balanced, which may have led to an overestimation of the relative importance of certain factors, such as air temperature, for instance, compared to the others. The spatial patterns across climate regions of a given environmental factor, however, are not affected by this, which means that differences between climatic regions for a given factor are most likely robust. Hence, air temperature is more relevant at the alpine site and relative air humidity has a higher impact in temperate than in other regions; rainfall and CO2 are likely to have the largest effect on C balance in drylands. Even though the data-driven model failed to estimate reasonable C balance at some sites, the comparison of the relative importance of the environmental factors across climatic regions may be valid, since the measurement procedure is consistent. Moreover, the patterns of relative importance remain similar when excluding the sites with strongly negative C balance (T1, T2, and A1; as shown in Fig. S12 in the Supplement). Nevertheless, we only studied the sensitivity of the C balance of biocrusts dominated by the lichen Psora decipiens and Cladonia furcata (at T3), and there are variations between lichens of different growth forms and between biocrust types. For example, cyanolichens increase in abundance with increasing rainfall, but trebouxioid lichens have their physiological optimum in drier conditions (Phinney et al., 2021). Moreover, the impact of precipitation on isidiate lichens is weaker than that of temperature (Phinney et al., 2021).
4.3.1 Environmental factors
Our results suggest that warming can result in a large amount of carbon loss at all sites, with a particular large effect in the alpine region. The consistent effects of warming on C balance of biocrusts are found in various field studies (e.g. Darrouzet-Nardi et al., 2015; Ladrón de Guevara et al., 2014; Li et al., 2021; Maestre et al., 2013). This can be explained by the overall less-optimal water and temperature conditions associated with warming. The simulated increasing respiratory costs with warming overcompensate gains in gross photosynthesis.
Ambient CO2 concentration affects the gross photosynthesis rate to a large extent in the model. Although the intra-annual change in air CO2 concentration may be small in the field compared to other environmental factors, the increase of CO2 in the atmosphere in recent decades (IPCC, 2021) may alter the long-term C balance substantially. However, this beneficial effect of elevated CO2 on photosynthesis and C balance may be reduced in reality due to future limitation of growth by nitrogen (Coe et al., 2012a), which is not considered in the model, or also due to shortened activity periods resulting from warmer and drier future climatic conditions.
Light intensity has the third largest effect on C balance, slightly larger than moisture. Light is one of the essential factors for photosynthesis, as simulated by our model, and it is a limiting factor of photosynthetic carbon assimilation, in particular in winter at temperate and alpine sites (the mean value of radiation maxima in January is 244 at T1 and 245 at the alpine site). Hence, increasing light intensity can promote carbon accumulation.
Factors that determine water supply are rainfall and non-rainfall inputs, such as dew and water vapour, that are related to relative humidity. The relative importance of different moisture factors in mediating C balance varies in the model. Relative humidity plays a more important role in mediating the C balance than rainfall amount. This may be due to the timing of dew or water vapour uptake, which is greatest before sunrise (Chamizo et al., 2021; Ouyang et al., 2017) and prolongs the activated periods in the early morning when the organisms start assimilating carbon (Veste and Littmann, 2006). This may result in a markedly increased annual C balance in the model. Rainfall amount was not a key factor affecting the simulated biocrust performance at one of the arid sites, which is consistent with another study (Baldauf et al., 2021). At the other dryland site (D2), however, this was not the case. Moreover, we found that the effect of the amount of rainfall is small in humid temperate and alpine regions as well. The differing effects of rainfall on the C balance depend on the change in relative water saturation that follows from rainfall event sizes and patterns throughout the year (Reed et al., 2012). In some cases, decreased rainfall leading to lower water saturation of biocrusts may facilitate photosynthetic carbon gain via increasing the CO2 diffusivity from the atmosphere into the chloroplast (Lange et al., 1997). Nevertheless, reducing water saturation below a certain value can cause a decline in the duration of activity (Proctor, 2001; Veste et al., 2008), which thus reduces carbon accumulation. Thus, there may be a rain threshold below which decreasing rain may start having a negative effect on biocrust C balances. The threshold is likely species-specific, as it is associated with the water-holding capacity of the organism. Our simulation results thus highlight the need for the combined application of field experiments and data-driven modelling to improve our understanding of differential responses to variation in precipitation.
4.3.2 Physiological parameters
The parameter q10 is a key parameter that substantially affects respiration. Resp_main is the dark respiration rate at a reference temperature that is linked in the model to Vcmax, the maximum rate of carboxylation of RuBisCO in the Calvin Cycle of photosynthesis (Walker et al., 2014). Topt is a parameter that controls gross photosynthesis as well as respiration, as it is also the reference temperature for calculating respiration rates. Rub_ratio can affect Vcmax and hence the maximum CO2 assimilation rate, while ExtL regulates the light using efficiency under limited light conditions. Sat_act0 and Sat_act1 are two parameters that determine the range of water saturation for initial activation and full metabolic activity. They have the smallest effects on the C balance of lichen-dominated biocrusts at all sites.
Our modelling results give insight into the relative effects of individual physiological parameters on annual C balance across different climatic zones. However, the impacts of physiology on biocrust C balance are complex, since they always arise from combinations of these physiological parameters. Thereby, different parameter combinations that correspond to different relative impacts on the C balance may lead to the same response curves. Hence, we cannot directly link individual physiological parameters to the underlying mechanisms, since we do not have enough data to distinguish multiple possible parameter combinations from each other, in case they produce the same response curves.
4.4 Validation of the data-driven model
The validation results of the model showed an overall good fit of daily and diurnal patterns of water content and activity (Figs. 3 and S3) and C balance at D2 (shown in Fig. 4), given the uncertainties in the data used to parameterize and evaluate the model. This indicates that the data-driven model may be a reliable tool for C-balance estimation, provided that a sufficient number of suitable forcing data are available.
A potential explanation for the general underestimation of activity at night and morning during several periods in a year is the larger prescribed MWC and Sat_act0 of organisms in the model compared to those of the samples from the activity measurements. Consequently, simulated saturation was lower, but minimal saturation for being active was higher than the samples. Thus, the activity may have been underestimated at small water inputs such as dew and water vapour, which occur mainly during the night and in the morning hours (Fig. S13 in the Supplement). Moreover, underestimated activity in April and June at site T1 (Fig. S3 F(b)) may have resulted from a gap in rainfall measurements during this period. Not only rainfall amount but also timing and frequency of rainfall events are essential for the physiological responses of biocrust communities (Belnap et al., 2004; Coe et al., 2012b; Reed et al., 2012). Therefore, although the measured annual total amount of rainfall is reasonable (424 mm at site T1), the missing rainfall during a series of days in summer at site T1 would lead us to incorrectly predict that the biocrusts remain inactive on these days.
Moreover, the mismatch between modelled and observed CO2 assimilation rates at low or high water contents at site D2 (Fig. 4) may have partly resulted from the calibration procedure. In the calibration, the simulated CO2 exchange rates were higher than measurements when the saturation exceeded the optimum saturation and hardly showed any negative values at high saturation (Fig. S2f). In turn, the simulated CO2 exchange rates of biocrusts with an extremely low water content were zero, while the measurements showed negative values (see Fig. S2f), pointing at a certain degree of metabolic activity in natural conditions. Furthermore, the samples used for validation were different from the ones for calibration, which can also lead to inaccuracies.
Additionally, the ability of the model to capture seasonality variations of C balance, which have been shown by other studies (Büdel et al., 2018; Lange, 2003a; Zhao et al., 2016), could not be evaluated here, since the monitoring of C balance in the field and collection of samples used for photosynthesis performance measurements were conducted only during October and early November.
Our data-driven model provides possibilities to predict the long-term C balance of biocrusts in the field across various climate zones, and it enables us to analyse mechanisms that drive the C balance, despite marked uncertainties in the parametrization. We simulated reasonable C-balance values in drylands but unrealistic ones at temperate sites with substantial seasonality. Uncertainties in environmental factors and respiration rate are likely to be the source of error for the C-balance estimation since (1) all environmental factors that were examined in our study may act as relevant drivers for the C balance of biocrusts and (2) respiration-related parameters had the largest impacts compared to other physiological parameters, such as water relations or parameters solely related to Vcmax. CO2 and air temperature showed the strongest effects among environmental factors, and at the alpine site, the air temperature was most relevant. Compared to environmental factors, the relative impacts of physiological parameters are rather equal across climate regions. The optimum temperature may be slightly more relevant in temperate regions, while metabolic respiration cost is most important at the alpine site. Due to the importance of respiration-related physiological parameters, more studies to improve their accuracy are warranted in the future application of C-balance modelling approaches.
Our study suggests that a better, more detailed understanding of the seasonal variation of physiological traits is necessary, as the more realistic estimations in drylands compared to temperate sites could be due to the weaker climate seasonality. The model needs to be calibrated with a larger number of samples collected and measured in various seasons to take the acclimation of physiological properties into account. Additionally, the integration of acclimation of physiological traits in process-based models may improve their accuracy in C-balance estimation.
Source code of the data-driven model, LiBry modelling results, and R-scripts to run the analysis in this paper are available in the Zenodo repository at https://doi.org/10.5281/Zenodo.7756960 (Ma, 2023). Field and laboratory data are available in the corresponding publications cited in the paper and also from the corresponding author upon request.
The supplement related to this article is available online at: https://doi.org/10.5194/bg-20-2553-2023-supplement.
YM and PP designed the study; BW, AK, MV, and JR provided the observational data. YM did the data processing and ran the model; YM, PP, CC, BW, and MYB did the data analysis and interpretation; YM wrote the paper; and all authors revised the paper.
The contact author has declared that none of the authors has any competing interests.
Publisher's note: Copernicus Publications remains neutral with regard to jurisdictional claims in published maps and institutional affiliations.
The research was conducted with Northern Cape research permits (nos. 22/2008 and 38/2009), and the appendant export permits and lab facilities were provided by Burkhard Büdel at the University of Kaiserslautern and Ulrich Pöschl at the Max Planck Institute for Chemistry in Mainz. José Raggio acknowledges the research projects SCIN (PRI-PIMBDV-2011-0874) and POLAR ROCKS (PID2019-105469RB-C21), both funded by the Spanish Ministry of Science, the possibility of obtaining part of the data and analysing them, respectively, in the frame of this research.
This research in South Africa has been supported by the Universität Hamburg. The research in Linde is funded by Zwillenberg-Tietz Stiftung by a grant to Maik Veste. José Raggio was supported by the research projects SCIN (PRI-PIMBDV-2011-0874) and POLAR ROCKS (PID2019-105469RB-C21), both funded by the Spanish Ministry of Science. The research in South Africa was funded by the Federal Ministry of Education and Research (BMBF), Germany, through its BIOTA project (promotion no. 01 LC 0024A), the German Research Foundation (project nos. WE 2393/2-1, WE2393/2-2), and the Max Planck Society. Claudia Colesie received funding support from a NERC standard grant (NE/V000764/1) and the Feodor Lynen Research fellowship from the Alexander von Humboldt foundation.
This paper was edited by Paul Stoy and reviewed by two anonymous referees.
Bader, M. Y., Zotz, G., and Lange, O. L.: How to minimize the sampling effort for obtaining reliable estimates of diel and annual CO2 budgets in lichens, Lichenologist, 42, 97–111, https://doi.org/10.1017/S0024282909990338, 2010.
Baldauf, S., Porada, P., Raggio J., Maestre, F. T., and Tietjen, B.: Relative humidity predominantly determines long-term biocrust-forming lichen cover in drylands under climate change, J. Ecol., 109, 1370–1385, https://doi.org/10.1111/1365-2745.13563, 2021.
Belnap, J., Phillips, S. L., and Miller, M. E.: Response of desert biological soil crusts to alterations in precipitation frequency, Oecologia, 141, 306–316, https://doi.org/10.1007/s00442-003-1438-6, 2004.
Belnap, J., Weber, B., and Büdel, B.: Biological Soil Crusts as an Organizing Principle in Drylands, in: Biological Soil Crusts: An Organizing Principle in Drylands, Ecological Studies 226, edited by: Weber, B., Büdel, B., Belnap, J., Springer International Publishing Switzerland, 3–13, https://doi.org10.1007/978-3-319-30214-0_1, 2016.
Brostoff, W. N., Sharifi, M. R., and Rundel, P. W.: Photosynthesis of cryptobiotic soil crusts in a seasonally inundated system of pans and dunes in the western Mojave Desert, CA: Field studies, Flora: Morphol. Distrib. Funct. Ecol. Plants., 200, 592–600, https://doi.org/10.1016/j.flora.2005.06.008, 2005.
Büdel, B., Colesie, C., Green, T. G. A., Grube, M., Lázaro Suau, R., Loewen-Schneider, K., Maier, S., Peer, T., Pintado, A., Raggio, J., Ruprecht, U., Sancho, L. G., Schroeter, B., Türk, R., Weber, B., Wedin, M., Westberg, M., Williams, L., and Zheng, L.: Improved appreciation of the functioning and importance of biological soil crusts in Europe: The Soil Crust International Project (SCIN), Biodivers. Conserv., 23, 1639–1658, https://doi.org/10.1007/s10531-014-0645-2, 2014.
Büdel, B., Williams, W. J., and Reichenberger, H.: Annual net primary productivity of a cyanobacteria-dominated biological soil crust in the Gulf Savannah, Queensland, Australia, Biogeosciences, 15, 491–505, https://doi.org/10.5194/bg-15-491-2018, 2018.
Chamizo, S., Cantón, Y., Miralles, I., and Domingo, F.: Biological soil crust development affects physicochemical characteristics of soil surface in semiarid ecosystems, Soil Biol. Biochem., 49, 96–105, https://doi.org/10.1016/j.soilbio.2012.02.017, 2012.
Chamizo, S., Rodríguez-Caballero, E., Moro, M. J., and Cantón, Y.: Non-rainfall water inputs: A key water source for biocrust carbon fixation, Sci. Total Environ., 792, 148299, https://doi.org/10.1016/j.scitotenv.2021.148299, 2021.
Coe, K. K., Belnap, J., Grote, E. E., and Sparks, J. P.: Physiological ecology of desert biocrust moss following 10 years exposure to elevated CO2: Evidence for enhanced photosynthetic thermotolerance, Physiol. Plantarum, 144, 346–356, https://doi.org/10.1111/j.1399-3054.2012.01566.x, 2012a.
Coe, K. K., Belnap, J., and Sparks, J. P.: Precipitation-driven carbon balance controls survivorship of desert biocrust mosses, Ecology, 93, 1626–1636, https://doi.org/10.1890/11-2247.1, 2012b.
Colesie, C., Green, T. G. A., Haferkamp, I., and Büdel, B.: Habitat stress initiates changes in composition, CO2 gas exchange and C-allocation as life traits in biological soil crusts, ISME J., 8, 2104–2115, https://doi.org/10.1038/ismej.2014.47, 2014.
Colesie, C., Green, T. G. A., Raggio, J., and Büdel, B.: Summer Activity Patterns of Antarctic and High Alpine Lichendominated Biological Soil Crusts – Similar But Different?, Arct. Antarct. Alp. Res., 48, 449–460, https://doi.org/10.1657/AAAR0015-047, 2016.
Colesie, C., Büdel, B., Hurry, V., and Green, T. G. A.: Can Antarctic lichens acclimatize to changes in temperature?, Glob. Change Biol., 24, 1123–1135, https://doi.org/10.1111/gcb.13984, 2018.
Cowan, I. R., Lange, O. L., and Green, T. G. A.: Carbon-dioxide exchange in lichens: determination of transport and carboxylation characteristics, Planta, 187, 282–294, https://doi.org/10.1007/BF00201952, 1992.
Darrouzet-Nardi, A., Reed, S. C., Grote, E. E., and Belnap, J.: Observations of net soil exchange of CO2 in a dryland show experimental warming increases carbon losses in biocrust soils, Biogeochemistry, 126, 363–378, https://doi.org/10.1007/s10533-015-0163-7, 2015.
Diez, M., Schmitt, D., Küppers, M., Wachendorf, M., Stefan, T., Gypser, S., and Veste, M.: Modelling photosynthesis and carbon fluxes of moss-and lichen-dominated biological soil crusts in temperate dry acid grasslands in Brandenburg, 49th Annual Meeting of the Ecological Society of Germany, Austria and Switzerland, Münster, Germany, 9–13 September 2019. https://doi.org/10.13140/RG.2.2.27244.51849, 2019.
Dümig, A., Veste, M., Hagedorn, F., Fischer, T., Lange, P., Spröte, R., and Kögel-Knabner, I.: Organic matter from biological soil crusts induces the initial formation of sandy temperate soils, Catena, 122, 196–208, https://doi.org/10.1016/j.catena.2014.06.011, 2014.
Elbert, W., Weber, B., Burrows, S., Steinkamp, J., Büdel, B., Andreae, M. O., and Pöschl, U.: Contribution of cryptogamic covers to the global cycles of carbon and nitrogen, Nat. Geosci., 5, 459–462, https://doi.org/10.1038/ngeo1486, 2012.
Farquhar, G. D. and von Caemmerer, S.: Modelling of Photosynthetic Response to Environmental Conditions, in: Physiological Plant Ecology II. Encyclopedia of Plant Physiology, vol 12/B, edited by: Lange, O. L., Nobel, P. S., Osmond, C. B., and Ziegler, H., Springer, Berlin, Heidelberg, 549–587, https://doi.org/10.1007/978-3-642-68150-9_17, 1982.
Feng, W., Zhang, Y., Wu, B., Qin, S., and Lai, Z.: Influence of Environmental Factors on Carbon Dioxide Exchange in Biological Soil Crusts in Desert Areas, Arid Land Res. Manag., 28, 186–196, https://doi.org/10.1080/15324982.2013.835006, 2014.
Ferrenberg, S., Faist, A. M., Howell, A., and Reed, S. C.: Biocrusts enhance soil fertility and Bromus tectorum growth, and interact with warming to influence germination, Plant Soil, 429, 77–90, https://doi.org/10.1007/s11104-017-3525-1, 2018.
Gauslaa, Y., Lie, M., Solhaug, K. A., and Ohlson, M.: Growth and ecophysiological acclimation of the foliose lichen Lobaria pulmonaria in forests with contrasting light climates, Oecologia, 147, 406–416, https://doi.org/10.1007/s00442-005-0283-1, 2006.
Green, T. G. A. and Lange, O. L.: Ecophysiological adaptations of the lichen genera pseudocyphellaria and sticta to south temperate rainforests, Lichenologist, 23, 267–282, https://doi.org/10.1017/S0024282991000427, 1991.
Haarmeyer, D. H., Luther-Mosebach, J., Dengler, J., Schmiedel, U., Finckh, M., Berger, K., Deckert, J., Domptail, S. E., Dreber, N., Gibreel, T., Grohmann, C., Gröngröft, A., Haensler, A., Hanke, W., Hoffmann, A., Husted, L. B., Kangombe, F. N., Keil, M., Krug, C. B., Labitzky, T., Linke, T., Mager, D., Mey, W., Muche, G., Naumann, C., Pellowski, M., Powrie, L. W., Pröpper, M., Rutherford, M. C., Schneiderat, U., Strohbach, B. J., Vohland, K., Weber, B., Wesuls, D., Wisch, U., Zedda, L., Büdel, B., Darienko, T., Deutschewitz, K., Dojani, S., Erb, E., Falk, T., Friedl, T., Kanzler, S.-E., Limpricht, C., Linsenmair, K. E., Mohr, K., Oliver, T., Petersen, A., Rambold, G., Zeller, U., Austermühle, R., Bausch, J., Bösing, B. M., Classen, N., Dorendorf, J., Dorigo, W., Esler, K. J., Etzold, S., Graiff, A., Grotehusmann, L., Hecht, J., Hoyer, P., Kongor, R. Y., Lang, H., Lieckfeld, L. A. B., Oldeland, J., Peters, J., Röwer, I. U., September, Z. M., Sop, T. K., van Rooyen, M. W., Weber, J., Willer, J., and Jürgens, N.: The BIOTA Observatories, in: Biodiversity in southern Africa. Vol. I: Patterns at local scale – the BIOTA Observatories, edited by: Jürgens, N., Haarmeyer, D. H., Luther-Mosebach, J., Dengler, J., Finckh, M., and Schmiedel, U., Klaus Hess Publisher, Göttingen and Windhoek, 6–801, ISBN 978-3-933117-45-8 (Germany), ISBN 978-99916-57-31-8 (Namibia), 2010.
IPCC: Climate Change 2021: The Physical Science Basis. Contribution of Working Group I to the Sixth Assessment Report of the Intergovernmental Panel on Climate Change, edited by: Masson-Delmotte, V., Zhai, P., Pirani, A., Connors, S. L., Péan, C., Berger, S., Caud, N., Chen, Y., Goldfarb, L., Gomis, M. I., Huang, M., Leitzell, K., Lonnoy, E., Matthews, J. B. R., Maycock, T. K., Waterfield, T., Yelekçi, O., Yu, R., and Zhou, B., Cambridge University Press, Cambridge, United Kingdom and New York, NY, USA, 2391 pp., https://doi.org/10.1017/9781009157896, 2021.
Jeffries, D. L., Link, S. O., and Klopatek, J. M.: CO2 fluxes of cryptogamic crusts: I. Response to resaturation, New Phytol., 125, 163–173, https://doi.org/https://doi.org/10.1111/j.1469-8137.1993.tb03874.x, 1993.
Ladrón de Guevara, M., Lázaro, R., Quero, J. L., Ochoa, V., Gozalo, B., Berdugo, M., Uclés, O., Escolar, C., and Maestre, F. T.: Simulated climate change reduced the capacity of lichen-dominated biocrusts to act as carbon sinks in two semi-arid Mediterranean ecosystems, Biodivers. Conserv., 23, 1787–1807, https://doi.org/10.1007/s10531-014-0681-y, 2014.
Ladrón de Guevara, M., Gozalo, B., Raggio, J., Lafuente, A., Prieto, M., and Maestre, F. T.: Warming reduces the cover, richness and evenness of lichen-dominated biocrusts but promotes moss growth: insights from an 8 yr experiment, New Phytol., 220, 811–823, https://doi.org/10.1111/nph.15000, 2018.
Lange, O. L.: Moisture content and CO2 exchange of lichens – I. Influence of temperature on moisture-dependent net photosynthesis and dark respiration in Ramalina maciformis, Oecologia, 45, 82–87, https://doi.org/10.1007/BF00346710, 1980.
Lange, O. L.: Photosynthetic productivity of the epilithic lichen Lecanora muralis: Long-term field monitoring of CO2 exchange and its physiological interpretation. II. Diel and seasonal patterns of net photosynthesis and respiration, Flora: Morphol. Distrib. Funct. Ecol. Plants, 198, 55–70, https://doi.org/10.1078/0367-2530-00076, 2003a.
Lange, O. L.: Photosynthetic productivity of the epilithic lichen Lecanora muralis: Long-term field monitoring of CO2 exchange and its physiological interpretation. III. Diel, seasonal, and annual carbon budgets, Flora: Morphol. Distrib. Funct. Ecol. Plants, 198, 277–292, https://doi.org/10.1078/0367-2530-00100, 2003b.
Lange, O. L. and Green, T. G. A.: Lichens show that fungi can acclimate their respiration to seasonal changes in temperature, Oecologia, 142, 11–19, https://doi.org/10.1007/s00442-004-1697-x, 2005.
Lange, O. L., Meyer, A., Zellner, H., and Heber, U.: Photosynthesis and Water Relations of Lichen Soil Crusts: Field Measurements in the Coastal Fog Zone of the Namib Desert, Funct. Ecol., 8, 253–264, https://doi.org/10.2307/2389909, 1994.
Lange, O. L., Reichenberger, H., and Meyer, A.: High thallus water content and photosynthetic CO2 exchange of lichens. Laboratory experiments with soil crust species from local xerothermic steppe formations in Franconia, Germany, in: Flechten Follmann: contributions to lichenology in honour of Gerhard Follmann, edited by: Daniels, F., Schulz, M., Peine, J., Geobotanical and Phytotaxonomical Study Group, University of Cologne, Cologne, 139–153, ISBN 3 87429 380 7, 1995.
Lange, O. L., Belnap, J., Reichenberger, H., and Meyer, A.: Photosynthesis of green algal soil crust lichens from arid lands in southern Utah, USA: Role of water content on light and temperature responses of CO2 exchange, Flora, 192, 1–15, https://doi.org/10.1016/S0367-2530(17)30749-1, 1997.
Lange, O. L., Belnap, J., and Reichenberger, H.: Photosynthesis of the cyanobacterial soil-crust lichen Collema tenax from arid lands in southern Utah, USA: Role of water content on light and temperature responses of CO2 exchange, Funct. Ecol., 12, 195–202, https://doi.org/10.1046/j.1365-2435.1998.00192.x, 1998.
Lange, O. L., Green, T. G. A., Melzer, B., Meyer, A., and Zellner, H.: Water relations and CO2 exchange of the terrestrial lichen Teloschistes capensis in the Namib fog desert: Measurements during two seasons in the field and under controlled conditions, Flora – Morphol. Distrib. Funct. Ecol. Plants, 201, 268–280, https://doi.org/10.1016/j.flora.2005.08.003, 2006.
Li, X., Hui, R., Zhang, P., and Song, N.: Divergent responses of moss- and lichen-dominated biocrusts to warming and increased drought in arid desert regions, Agr. Forest Meteorol., 303, 108387, https://doi.org/10.1016/j.agrformet.2021.108387, 2021.
Ma, Y.: Ma_et_al: Carbon balance Modelling, Zenodo [code], https://doi.org/10.5281/zenodo.7756960, 2023.
Maestre, F. T., Escolar, C., Ladrón de Guevara, M., Quero, J. L., Lázaro, R., Delgado-Baquerizo, M., Ochoa, V., Berdugo, M., Gozalo, B., and Gallardo, A.: Changes in biocrust cover drive carbon cycle responses to climate change in drylands, Glob. Change Biol., 19, 3835–3847, https://doi.org/10.1111/gcb.12306, 2013.
Ouyang, H., Lan, S., Yang, H., and Hu, C.: Mechanism of biocrusts boosting and utilizing non-rainfall water in Hobq Desert of China, Appl. Soil Ecol., 120, 70–80, https://doi.org/10.1016/j.apsoil.2017.07.024, 2017.
Petersen, I., Weber, B., Lahajnar, N., Wang, Z., Jensen, K., and Porada, P.: Effects of nutrient content on photosynthetic capacity and respiration of non-vascular photoautotrophs, Plant Cell Environ., in review, 2023.
Phinney, N. H., Gauslaa, Y., Palmqvist, K., and Esseen, P. A.: Macroclimate drives growth of hair lichens in boreal forest canopies, J. Ecol., 109, 478–490, https://doi.org/10.1111/1365-2745.13522, 2021.
Porada, P., Weber, B., Elbert, W., Pöschl, U., and Kleidon, A.: Estimating global carbon uptake by lichens and bryophytes with a process-based model, Biogeosciences, 10, 6989–7033, https://doi.org/10.5194/bg-10-6989-2013, 2013.
Porada, P., Tamm, A., Raggio, J., Cheng, Y., Kleidon, A., Pöschl, U., and Weber, B.: Global NO and HONO emissions of biological soil crusts estimated by a process-based non-vascular vegetation model, Biogeosciences, 16, 2003–2031, https://doi.org/10.5194/bg-16-2003-2019, 2019.
Proctor, M.: Patterns of desiccation tolerance and recovery in bryophytes, Plant Growth Regul., 35, 147–156, https://doi.org/10.1023/A:1014429720821, 2001.
Raggio, J., Pintado, A., Vivas, M., Sancho, L. G., Büdel, B., Colesie, C., Weber, B., Schroeter, B., Lázaro, R., and Green, T. G. A.: Continuous chlorophyll fluorescence, gas exchange and microclimate monitoring in a natural soil crust habitat in Tabernas badlands, Almería, Spain: Progressing towards a model to understand productivity, Biodivers. Conserv., 23, 1809–1826, https://doi.org/10.1007/s10531-014-0692-8, 2014.
Raggio, J., Green, T. G. A., Sancho, L. G., Pintado, A., Colesie, C., Weber, B., and Büdel, B.: Metabolic activity duration can be effectively predicted from macroclimatic data for biological soil crust habitats across Europe, Geoderma, 306, 10–17, https://doi.org/10.1016/j.geoderma.2017.07.001, 2017.
Raggio, J., Green, T. G. A., Pintado, A., Sancho, L. G., and Büdel, B.: Environmental determinants of biocrust carbon fluxes across Europe: possibilities for a functional type approach, Plant Soil, 429, 147–157, https://doi.org/10.1007/s11104-018-3646-1, 2018.
Reed, S. C., Coe, K. K., Sparks, J. P., Housman, D. C., Zelikova, T. J., and Belnap, J.: Changes to dryland rainfall result in rapid moss mortality and altered soil fertility, Nat. Clim. Change, 2, 752–755, https://doi.org/10.1038/nclimate1596, 2012.
Schuur, E. A. G., Crummer, K. G., Vogel, J. G., and Mack, M. C.: Plant species composition and productivity following permafrost thaw and thermokarst in Alaskan tundra, Ecosystems, 10, 280–292, https://doi.org/10.1007/s10021-007-9024-0, 2007.
Tamm, A., Caesar, J., Kunz, N., Colesie, C., Reichenberger, H., and Weber, B.: Ecophysiological properties of three biological soil crust types and their photoautotrophs from the Succulent Karoo, South Africa, Plant Soil, 429, 127–146, https://doi.org/10.1007/s11104-018-3635-4, 2018.
Veste, M. and Littmann, T.: Dewfall and its Geo-ecological Implication for Biological Surface Crusts in Desert Sand Dunes (North-western Negev, Israel), J. Arid Land Stud., 16, 139–147, 2006.
Veste, M., Heusinkveld, B. G., Berkowicz, S. M., Breckle, S.-W., Littmann, T., and Jacobs, A. F. G.: Dew formation and activity of biological soil crusts, in: Arid Dune Ecosystems – The Nizzana Sands in the Negev Desert, Ecological Studies 200, edited by: Breckle, S.-W., Yair, A., and Veste, M., Springer, 305–318, https://doi.org/10.1007/978-3-540-75498-5_21, 2008.
Vivas, M., Pérez-Ortega, S., Pintado, A., and Sancho, L. G: acclimation to the Mediterranean summer drought in two sympatric Lasallia species from the Iberian mountains, Lichenologist, 49, 157–165, https://doi.org/10.1017/S0024282917000032, 2017.
Wagner, S., Zotz, G., and Bader, M. Y.: The temperature acclimation potential of tropical bryophytes, Plant Biol., 16, 117–124, https://doi.org/10.1111/plb.12037, 2014.
Walker, A. P., Beckerman, A. P., Gu, L., Kattge, J., Cernusak, L. A., Domingues, T. F., Scales, J. C., Wohlfahrt, G., Wullschleger, S. D., and Woodward, F. I.: The relationship of leaf photosynthetic traits – Vcmax and Jmax – to leaf nitrogen, leaf phosphorus, and specific leaf area: a meta-analysis and modeling study, Ecol. Evol., 4, 3218–3235, https://doi.org/10.1002/ece3.1173, 2014.
Weber, B., Graf, T., and Bass, M.: Ecophysiological analysis of moss-dominated biological soil crusts and their separate components from the Succulent Karoo, South Africa, Planta, 236, 129–139, https://doi.org/10.1007/s00425-012-1595-0, 2012.
Weber, B., Berkemeier, T., Ruckteschler, N., Caesar, J., Heintz, H., Ritter, H., and Braß, H.: Development and calibration of a novel sensor to quantify the water content of surface soils and biological soil crusts, Methods Ecol. Evol., 7, 14–22, https://doi.org/10.1111/2041-210X.12459, 2016.
Zhao, Y., Zhang, Z., Hu, Y., and Chen, Y.: The seasonal and successional variations of carbon release from biological soil crust-covered soil, J. Arid Environ., 127, 148–153, https://doi.org/10.1016/j.jaridenv.2015.11.012, 2016.
Zotz, G., Schultz, S., and Rottenberger, S.: Are tropical lowlands a marginal habitat for macrolichens? Evidence from a field study with Parmotrema endosulphureum in Panama, Flora: Morphol. Distrib. Funct. Ecol. Plants, 198, 71–77, https://doi.org/10.1078/0367-2530-00077, 2003.