the Creative Commons Attribution 4.0 License.
the Creative Commons Attribution 4.0 License.
 | 16 Feb 2023
Stable isotopic evidence for the excess leaching of unprocessed atmospheric nitrate from forested catchments under high nitrogen saturation
Weitian Ding
Urumu Tsunogai
Fumiko Nakagawa
Takashi Sambuichi
Masaaki Chiwa
Tamao Kasahara
Ken'ichi Shinozuka
Owing to the elevated loading of nitrogen through atmospheric deposition, some forested ecosystems become nitrogen saturated, from which elevated levels of nitrate are exported. The average concentration of stream nitrate eluted from upstream and downstream of the Kasuya Research forested catchments (FK1 and FK2 catchments) in Japan were more than 90 µM, implying that these forested catchments were under nitrogen saturation. To verify that these forested catchments were under the nitrogen saturation, we determined the export flux of unprocessed atmospheric nitrate relative to the entire deposition flux ( ratio) in these catchments; because the ratio has recently been proposed as a reliable index to evaluate nitrogen saturation in forested catchments. Specifically, we determined the temporal variation in the concentrations and stable isotopic compositions, including Δ17O, of stream nitrate in the FK catchments for more than 2 years. In addition, for comparison, the same parameters were also monitored in the Shiiba Research forested catchment (MY catchment) in Japan during the same period, where the average stream nitrate concentration was low, less than 10 µM. While showing the average nitrate concentrations of 109.5, 90.9, and 7.3 µM in FK1, FK2, and MY, respectively, the catchments showed average Δ17O values of +2.6 ‰, +1.5 ‰, and +0.6 ‰ in FK1, FK2, and MY, respectively. Thus, the average concentration of unprocessed atmospheric nitrate ([NOatm]) was estimated to be 10.8, 5.1, and 0.2 µM in FK1, FK2, and MY, respectively, and the ratio was estimated to be 14.1 %, 6.6 %, and 1.3 % in FK1, FK2, and MY, respectively. The estimated ratio in FK1 (14.1 %) was the highest ever reported from temperate forested catchments monitored for more than 1 year. Thus, we concluded that nitrogen saturation was responsible for the enrichment of stream nitrate in the FK catchments, together with the elevated NOatm leaching from the catchments. While the stream nitrate concentration ([NO]) can be affected by the amount of precipitation, the ratio is independent of the amount of precipitation; thus, the ratio can be used as a robust index for evaluating nitrogen saturation in forested catchments.
- Article
(3530 KB) - Full-text XML
-
Supplement
(420 KB) - BibTeX
- EndNote


Nitrate is important as a nitrogenous nutrient in the biosphere. Traditionally, forested ecosystems have been considered as nitrogen limited (Vitousek and Howarth, 1991). However, owing to the elevated loading of nitrogen through atmospheric deposition, some forested ecosystems become nitrogen saturated (Aber et al., 1989), from which elevated levels of nitrate are exported (Mitchell et al., 1997; Peterjohn et al., 1996). Such excessive leaching of nitrate from forested catchments degrades water quality and causes eutrophication in downstream areas (Galloway et al., 2003; Paerl and Huisman, 2009). Thus, evaluating the stage of nitrogen saturation in each forested catchment, including its temporal variation, is critical for sustainable forest management, especially for forested ecosystems under high nitrogen deposition.
Both concentration and seasonal variation of stream nitrate have been used as indexes to evaluate the nitrogen saturation of each forested catchment in past studies (Aber, 1992; Rose et al., 2015; Stoddard, 1994). A forested stream eluted from Fernow Experimental Forest USA, for instance, showed an elevated average nitrate concentration of 60 µM, along with the absence of a seasonal variation in the stream nitrate concentration, so the forest was classified into stage 3, the highest stage of nitrogen saturation (Rose et al., 2015).
However, using both the concentration level (high or low) and seasonal variation (clear or absent) of stream nitrate as indexes to evaluate nitrogen saturation has limitations, including the following: (1) seasonal variation of soil nitrate can be buffered by groundwater with long residence time, so that the seasonal variation is unclear in stream nitrate concentration in Japan, even in normal forests under the nitrogen saturation stage of 0 (Mitchell et al., 1997); and (2) the stream nitrate concentration can be enriched or diluted depending on the volume of rainfall, so the concentration level can be high in low precipitation area irrespective of the stage of nitrogen saturation.
Nakagawa et al. (2018) lately proposed that the ratio, the export flux of unprocessed atmospheric nitrate (Matm) relative to the deposition flux of NOatm (Datm), can be an alternative, more robust index for evaluating nitrogen saturation in each forested catchment, because the ratio directly reflects the demand for atmospheric nitrate deposited onto each forested catchment as a whole, and thus reflects the nitrogen saturation in each forested catchment. That is, we can expect high ratios in forested catchments under nitrogen saturation and low ratios in forested catchments with nitrogen deficiency.
To estimate the ratio accurately and precisely in each forested catchment, the fraction of unprocessed atmospheric nitrate (NOatm) in the stream needs to be estimated accurately and precisely. Triple oxygen isotopic compositions of nitrate (Δ17O) have recently been used as a conservative tracer of NOatm deposited onto each forested catchment (Inoue et al., 2021; Michalski et al., 2004; Nakagawa et al., 2018; Tsunogai et al., 2014; Ding et al., 2022), showing distinctively different Δ17O from that of remineralized nitrate (NOre) derived from organic nitrogen through general chemical reactions, including microbial N mineralization and microbial nitrification. While NOre, the oxygen atoms of which are derived from either terrestrial O2 or H2O through microbial processing (i.e., nitrification), always shows the relation close to the “mass-dependent” relative relation between ratios and ratios, NOatm displays an anomalous enrichment in 17O reflecting oxygen atom transfers from atmospheric ozone (O3) during the conversion of NOx to NOatm (Alexander et al., 2009; Michalski et al., 2003; Morin et al., 2011; Nelson et al., 2018). As a result, the Δ17O signature defined by the following equation (Kaiser et al., 2007) enables us to distinguish NOatm (Δ17O > 0) from NOre (Δ17O = 0):
where the constant β is 0.5279 (Kaiser et al., 2007), δ18O = , and R is the ratio (or the ratio in the case of δ17O or the ratio in the case of δ15N) of the sample and each standard reference material. In addition, Δ17O is almost stable during mass-dependent isotope fractionation processes within terrestrial ecosystems. Therefore, while the δ15N or δ18O signature of NOatm can be overprinted by the biological processes subsequent to deposition, Δ17O can be used as a robust tracer of unprocessed NOatm to reflect its accurate mole fraction within total NO, regardless of the progress of the partial metabolism (partial removal of nitrate through denitrification and assimilation) subsequent to deposition (Michalski et al., 2004; Nakagawa et al., 2013, 2018; Tsunogai et al., 2011, 2014, 2018).
Past studies reported that the maximum concentration of stream nitrate was 58.4 µM in the KJ forested catchment in Japan, with the maximum value of the ratio as 9.4 % (Nakagawa et al., 2018; Sase et al., 2022). Whether the index of the ratio can be applied to forested catchments, where the leaching of stream nitrate is much higher than the KJ forested catchment, remained unclarified. Besides, the advantages of the ratio within the past indexes of nitrogen saturation have not been discussed.
Chiwa (2021) has recently reported the enrichment of nitrate of more than 90 µM on the annual average in forested streams eluted from the catchments (FK1 and FK2) in the Kasuya Research Forest, Kyushu University, Japan (Fig. 1a and b). The observed enrichment of stream nitrate implied that these forested catchments were under nitrogen saturation. Thus, in this study, we determined the ratio in the FK1 and FK2 forested catchments by monitoring both the concentration and Δ17O of stream nitrate for more than 2 years to verify that these forested catchments were under nitrogen saturation. For comparison, the catchment (MY catchment) in Shiiba Research Forest, Kyushu University, Japan (Fig. 1a and c), was also monitored during the same period, where the average stream nitrate concentration was low (less than 10 µM). Furthermore, the ratios in these forested catchments were compared with those reported in past studies to verify the reliability of the ratio as an index of nitrogen saturation.

Figure 1A map showing the locations of the study catchments (FK and MY) in Japan (a), and the maps of FK1, FK2 (b), and MY catchments (c), shown by orange, yellow, and green areas, respectively, together with the sampling station A, B, and C, respectively, shown by orange, yellow, and green circles, respectively. The blue arrows indicate the flow direction of stream water.
2.1 Study sites
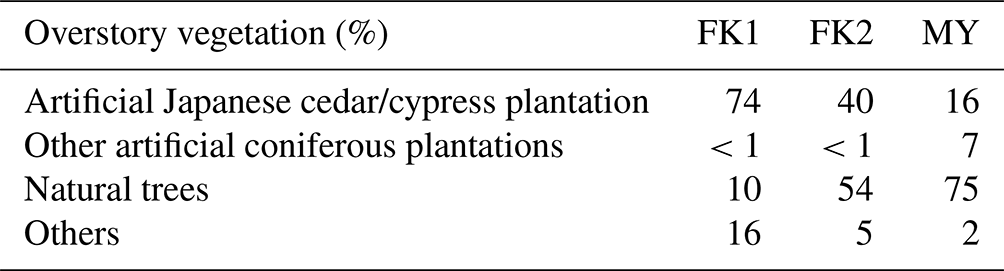
The FK forested catchments (33∘38′ N, 130∘31′ E) are located in a suburban area about 15 km west of the Fukuoka metropolitan area (the fourth largest metropolitan area in Japan). The main plantation in these catchments was Japanese cedar/cypress (Table 1). The MY forested catchment (32∘22′ N, 131∘09′ E) is located in a rural area at the village of Shiiba in southern Japan's central Kyushu mountain range. This catchment is a mixed forest consisting of coniferous trees such as Abies firma Sieb. & Zucc. and Tsuga sieboldii Carr., as well as deciduous broadleaved trees such as Quercus crispula Blume, Fagus crenata Blume, and Acer sieboldianum Miq. Details on the studied forested catchments have been described in the past studies (Chiwa, 2020, 2021).
Table 1Plant information for each forested catchment (Chiwa, 2021).
2.2 Sampling
The stream water eluted from the FK1 (14 ha), FK2 (62 ha), and MY (43 ha) forested catchments was collected about once every month in principle from November 2019 to December 2021 (Fig. 1). At the FK catchments, stream water was collected at upstream (station A) and downstream (station B) locations (Fig. 1b). At the MY catchment, stream water was collected at station C (Fig. 1c). Samples of stream water to determine the concentration and stable isotopic compositions (δ15N, δ18O, and Δ17O) of stream nitrate were collected manually in bottles washed with deionized water before sampling and then rinsed at least twice with the sample before sampling at each sampling site.
2.3 Analysis
All the stream water samples were passed through a membrane filter (pore size 0.45 µm) within 2 days after sampling and stored in a refrigerator (4 ∘C) until analysis. The concentrations of nitrate were measured by ion chromatography (Prominence HIC-SP, Shimadzu, Japan). To determine the stable isotopic compositions of nitrate in the stream water samples, nitrate in each sample was chemically converted to N2O using a method originally developed to determine the and ratios of seawater and freshwater nitrate (McIlvin and Altabet, 2005) that was later modified (Konno et al., 2010; Tsunogai et al., 2011; Yamazaki et al., 2011). In brief, 11 mL of each sample solution was pipetted into a vial with a septum cap. Then, 0.5 g of spongy cadmium was added, followed by 150 µL of a 1 M NaHCO3 solution. The sample was then shaken for 18–24 h at a rate of 2 cycles s−1. Then, the sample solution (10 mL) was decanted into a different vial with a septum cap. After purging the solution using high-purity helium, 0.4 mL of an azide–acetic acid buffer, which had also been purged using high-purity helium, was added. After 45 min, the solution was alkalinized by adding 0.2 mL of 6 M NaOH. Then, the stable isotopic compositions (δ15N, δ18O, and Δ17O) of the N2O in each vial were determined using the continuous-flow isotope ratio mass spectrometry (CF-IRMS) system at Nagoya University. The analytical procedures performed using the CF-IRMS system were the same as those detailed in previous studies (Hirota et al., 2010; D. D. Komatsu et al., 2008). The obtained values of δ15N, δ18O, and Δ17O for the N2O derived from the nitrate in each sample were compared with those derived from our local laboratory nitrate standards to calibrate the values of the sample nitrate to an international scale and to correct for both isotope fractionation during the chemical conversion to N2O and the progress of oxygen isotope exchange between the nitrate-derived reaction intermediate and water (ca. 20 %). In this study, we adopted the internal standard method to calibrate the stable isotopic compositions of sample nitrate. Specifically, three kinds of the local laboratory nitrate standards were used in this study, which were named to be GG01 (δ15N = −3.07 ‰, δ18O = +1.10 ‰, and Δ17O = 0 ‰), HDLW02 (δ15N = +8.94 ‰, δ18O = +24.07 ‰), and NF (Δ17O = +19.16 ‰), which the GG01 and the HDLW02 were used to determine the δ15N and δ18O of stream nitrate, and the GG01 and the NF was used to determine the Δ17O of stream nitrate. The GG01, HDLW02, and NF had been calibrated using the internationally distributed isotope reference materials (USGS 34 and USGS 35). The oxygen exchange rate between nitrate and water during the chemical conversion was calculated through Eq. (2):
where the Δ17O(N2O)NF denote the Δ17O value of N2O that convert from the NF nitrate, and the Δ17O(NO)NF denote the Δ17O value of NF nitrate (Δ17O = +19.16 ‰) (Tsunogai et al., 2016; Nakagawa et al., 2013, 2018; Ding et al., 2022).
The δ2H and δ18O values of H2O of the stream water samples were analyzed using the cavity ring-down spectroscopy method by employing an L2120-i instrument (Picarro Inc., Santa Clara, CA, USA) equipped with an A0211 vaporizer and autosampler. The errors (standard errors of the mean) in this method were ±0.5 ‰ for δ2H and ±0.1 ‰ for δ18O. Both the VSMOW and standard light Antarctic precipitation (SLAP) were used to calibrate the values to the international scale. The δ18O values of H2O were used to calibrate the differences in δ18O of H2O between the samples and those our local laboratory nitrate standard samples (Tsunogai et al., 2010, 2011, 2014).
To determine whether the conversion rate from nitrate to N2O was sufficient, the concentration of nitrate in the samples was determined each time we analyzed the isotopic composition using CF-IRMS based on the N2O+ or O outputs. We adopted the δ15N, δ18O, and Δ17O values only when the concentration measured via CF-IRMS correlated with the concentration measured via ion chromatography prior to isotope analysis within a difference of 10 %. We repeated the analysis of δ15N, δ18O, and Δ17O values for each sample at least three times to attain high precision. All samples had a nitrate concentration of greater than 3.5 µM, which corresponded to a nitrate quantity greater than 35 nmol in a 10 mL sample. Thus, all isotope values presented in this study have an error (standard error of the mean) better than ±0.2 ‰ for δ15N, ±0.3 ‰ for δ18O, and ±0.1 ‰ for Δ17O.
Nitrite (NO) in the samples interferes with the final N2O produced from nitrate, because the chemical method also converts NO to N2O (McIlvin and Altabet, 2005). Therefore, it is sometimes necessary to remove NO prior to converting nitrate to N2O. In this study, however, we skipped the processes for removing NO because all the stream samples analyzed for stable isotopic composition had NO concentrations lower than the detection limit (0.05 µM).
2.4 Deposition rate of atmospheric nitrate
The annual deposition rate of atmospheric nitrate (Datm; total dry and wet deposition rate of atmospheric nitrate) in each catchment was estimated using the annual “bulk” deposition rate of atmospheric nitrate (Dbulk) calculated in Chiwa (2020) at each catchment by multiplying the volume-weighted mean concentration of nitrate in the bulk deposition samples collected every 2 weeks at each catchment for 10 years (from January 2009 to December 2018) by the annual amount of precipitation. The bulk deposition samples were those accumulated in a plastic bucket installed in an open site of each catchment 55 cm above the ground. The distances between the monitoring sites of bulk deposition in the FK1, FK2, and MY forested catchments and the stations of stream water sampling (stations A, B, and C) were 3.9, 2.9, and 4.5 km, respectively. The concentrations of nitrate in the bulk deposition samples were measured by ion chromatography.
The Dbulk determined through this method, however, is less than Datm (Aikawa et al., 2003) because the dry deposition velocities of gases and particles on the water surface of the plastic bucket are smaller than those on the forest (Matsuda, 2008). Thus, we corrected the differences by using Eq. (3) to estimate Datm from Dbulk:
where Ddry(W) and Ddry(F) denote the annual dry deposition rates onto water and forest, respectively.
The Ddry(W) and Ddry(F) at each catchment were determined using an inferential method (Endo et al., 2011) through Eqs. (4) and (5), respectively:
where [NOatm]gas denotes the concentration of gaseous nitrate in air; [NOatm]p denotes the concentration of particle nitrate in air; Vgas(W) and Vgas(F) denote the deposition velocities of gaseous nitrate on the water surface and forest, respectively; and Vp(W) and Vp(F) denote the deposition velocities of particulate nitrate on the water surface and forest, respectively. Those determined by Chiwa (2010) using the annular denuder method from May 2006 to April 2007 were used for the [NO]gas and [NO]p in the FK catchments. Those determined by the National Institute for Environmental Studies (Environmental Laboratories Association of Japan, 2017) using the filter-pack method at Miyazaki (31∘83′ N, 131∘42′ E) from 2011 to 2017 were used for the [NO]gas and [NO]p in the MY catchment. The Vgas(F), Vgas(W), Vp(F), and Vp(W) of each catchment were determined by applying the estimation file for dry deposition (Matsuda, 2008; http://www.hro.or.jp/list/environmental/research/ies/katsudo/acid_rain/kanseichinchaku/kanseichinchaku.html, last access: 20 December 2022), where Vgas and Vp were calculated using the meteorological data of wind speed, temperature, humidity, radiation, cloud amount, and land use. The meteorological data monitored by the Japan Meteorological Agency at the nearest Fukuoka station (33∘34′ N, 130∘22′ E) and Miyazaki station (31∘56′ N, 131∘24′ E) from 2009 to 2021 were used for the FK and MY catchments, respectively. The forested land use of 100 % was chosen for each area.
2.5 Flux of stream water
The flux of stream water (Fstream) in each catchment was not measured fully in this study. Instead, the water balance in each catchment was used to estimate Fstream, assuming that the outflux of water from the study catchments to deep groundwater was negligible:
where P denotes the annual average precipitation and E denotes the annual evapotranspiration flux of water in each catchment. In this paper, the equation obtained by H. Komatsu et al. (2008) was used to estimate the E of the FK and MY catchments. Details on this equation are shown below.
H. Komatsu et al. (2008) compiled the annual flux of evapotranspiration determined in 43 forested catchments in Japan and found that E shows a positive correlation with the average temperature (Tavg) of each catchment. Thus, they proposed the modeled relation of E (mm) = 31.4 Tavg (∘C) + 376 to estimate E in each forested catchment in Japan, where the standard error of 162.3 mm was included in the estimated evapotranspiration flux (E). They also confirmed that the estimated Fstream using the model corresponded well with the observed Fstream in three forested catchments, with estimated errors of less than 6 %. As a result, we utilized the water balance method proposed by H. Komatsu et al. (2008) to quantify the Fstream in each catchment.
2.6 Concentration of unprocessed NOatm in each water sample
The Δ17O data of nitrate in each sample were used to estimate the concentration of NOatm ([NOatm]) in each water sample by applying Eq. (7):
where [NOatm] and [NO] denote the concentrations of NOatm and nitrate (total) in each water sample, respectively, and Δ17Oatm and Δ17O denote the Δ17O values of NOatm and nitrate (total) in the stream water sample, respectively. In this study, we used the annual average Δ17O value of NOatm determined at the Sado-Seki monitoring station in Japan (Sado Island; Fig. 1a) from April 2009 to March 2012 (Δ17O ‰; Tsunogai et al., 2016) for Δ17Oatm in Eq. (7) to estimate [NOatm] in the stream. We allow for an error range of 3 ‰ in Δ17Oatm, where the factor changes in Δ17Oatm from +26.3 ‰ caused by both areal and seasonal variations in the Δ17O values of NOatm have been considered (Nakagawa et al., 2018; Tsunogai et al., 2016; Ding et al., 2022).
The annual export flux of unprocessed NOatm per unit area of the catchment (Matm) was determined by applying Eq. (8):
where [NOatm]avg denotes the annual average [NOatm] in each stream. The index of nitrogen saturation ( ratio) was calculated by dividing Matm with Datm in each catchment.
2.7 Concentration and isotopic compositions of stream nitrate eluted only from the FK2 catchment
The concentration and isotopic compositions (δ15N, δ18O, and Δ17O) of stream nitrate determined at station B were the mixtures of those eluted from FK1 and FK2 catchments (Fig. 1b). Assuming that the stream nitrate eluted from FK1 catchment was stable during the flow path from station A to station B, the concentration of stream nitrate eluted from the FK2 catchment was determined by applying Eq. (9):
where FFK1, FFK2, and FFK1+FK2 denote the flux of stream water eluted from the FK1, FK2 (only), and FK1+FK2 catchment, respectively. [NO]FK1, [NO]FK2, and [NO]FK1+FK2 denote the concentration of stream nitrate eluted from the FK1, FK2 (only), and FK1+FK2 catchment, respectively. In this study, the flow rates measured at stations A and B on 15 January 2021 by using the salt dilution method (Sappa et al., 2015) were used for FFK1 (0.85 L s−1) and FFK1+FK2 (4.75 L s−1), respectively, and the measured [NO] at stations A and B was used for [NO]FK1 and [NO]FK1+FK2, respectively. Because the relation between the measured flow rates was comparable with the relation between the catchment area of FK1 (14 ha) and that of FK1+FK2 (76 ha), we concluded that the measured flow rates of 0.85 L s−1 and 4.75 L s−1 were reasonable as for those representing the FFK1 and FFK1+FK2, respectively. According to the mass balance of water, we can estimate the FFK2 eluted from the FK2 catchment only to be 3.90 L s−1.
Assuming that the stream nitrate eluted from the FK1 catchment was stable during the flow path from station A to station B, the δ15N, δ18O, and Δ17O values of stream nitrate eluted from the FK2 catchment only were determined by applying Eq. (10):
where δFK1, δFK2, and δFK1+FK2 denote the δ15N (or δ18O or Δ17O) of stream nitrate eluted from the FK1, FK2, and FK1+FK2 catchment, respectively. The δ15N (or δ18O or Δ17O) values of stream nitrate measured at stations A and B were used for δFK1 and δFK1+FK2, respectively.
3.1 Deposition rate of atmospheric nitrate
The mean annual precipitation (P) from 2009 to 2021 was 1777 and 3981 mm for FK and MY catchments, respectively (Chiwa, 2020; Masaaki Chiwa, personal communication, 21 September 2022). The mean annual temperature (Tavg) was reported to be 15.9 and 10.8 ∘C for FK and MY catchments, respectively (Chiwa, 2020). Based on these data, the annual flux of stream water (Fstream) was estimated to be 902.0±162.3 mm at FK catchments and 3266.1±162.3 mm at MY catchment, respectively, using Eq. (6).
Chiwa (2020) reported the annual bulk deposition rates of atmospheric nitrate (Dbulk) to be 34.0 mmol m−2 yr−1 at the FK catchments and 24.2 mmol m−2 yr−1 at the MY catchment. On the other hand, the annual dry deposition rate of atmospheric nitrate (Ddry) deposited on the forest (Ddry(F)) and on the water surface (Ddry(W)) were estimated to be 39.9 and 4.1 mmol m−2 yr−1, respectively, at FK catchments and 18.4 and 2.4 mmol m−2 yr−1, respectively, at MY catchment. As a result, Datm was estimated to be 69.3 mmol m−2 yr−1 at FK catchments and 40.1 mmol m−2 yr−1 at MY catchment using Eq. (3).
3.2 Concentration and isotopic composition of stream nitrate
The concentrations of stream nitrate eluted from the FK1, FK2 (only), and MY catchments ranged from 97.5 to 121.3 µM, from 65.7 to 148.5 µM, and from 3.5 to 15.3 µM, respectively, with the average concentrations of 109.5, 90.9, and 7.3 µM, respectively, and the standard deviations (SD) of 6.3, 18.5, and 3.0 µM, respectively, which correspond to the coefficients of variation (CV) of 5.7 %, 20.4 %, and 40.7 %, respectively (Fig. 2a). All catchments showed no clear seasonal variation during the observation periods. The variation ranges and the average concentrations of stream nitrate eluted from the three catchments agreed well with the past observations performed in the same catchments (Chiwa, 2021).

Figure 2Temporal variations in concentrations of stream nitrate (FK1: orange circles; FK2: yellow circles; MY: green circles) (a), together with those in δ15N (b), δ18O (c), and Δ17O (d) of nitrate, and the concentration of unprocessed NOatm ([NOatm]) (e) in the stream water of the FK1, FK2, and MY forested catchments. Error bars smaller than the sizes of the symbols are not presented.
The stable isotopic compositions of stream nitrate eluted from the FK1, FK2 (only), and MY catchments ranged from −0.9 ‰ to +1.5 ‰, from −1.4 ‰ to +5.8 ‰, and from −0.8 ‰ to +2.4 ‰, respectively, for δ15N (Fig. 2b), from +3.9 ‰ to +8.5 ‰, from −2.2 ‰ to +2.8 ‰, and from −5.6 ‰ to +1.7 ‰, respectively, for δ18O (Fig. 2c), and from +2.0 ‰ to +3.3 ‰, from +0.6 ‰ to +2.2 ‰, and from +0.2 ‰ to +1.0 ‰, respectively, for Δ17O (Fig. 2d), with no clear seasonal variation during the observation periods. The concentration-weighted averages for the δ15N, δ18O, and Δ17O values of stream nitrate were +0.2 ‰, +6.4 ‰, and +2.6 ‰, respectively, at FK1, +1.0 ‰, +0.5 ‰, and +1.5 ‰, respectively, at FK2, +0.7 ‰, −2.5 ‰, and +0.6 ‰, respectively, at MY.
3.3 Concentration of unprocessed atmospheric nitrate and the ratio in each catchment
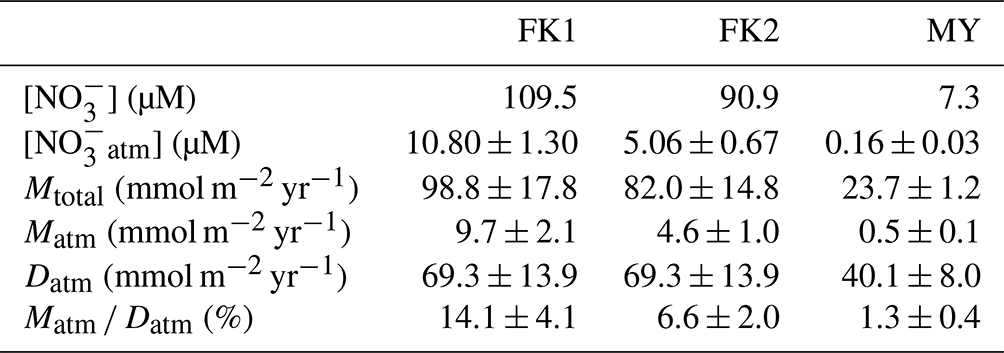
The concentration of unprocessed atmospheric nitrate ([NOatm]) in the streams eluted from the FK1, FK2 (only), and MY catchments ranged from 8.64 to 14.30 µM, from 2.27 to 10.71 µM, and from 0.03 to 0.46 µM with the average concentration of 10.80 ± 1.30, 5.06 ± 0.67, and 0.16 ± 0.03 µM, respectively, even though these studied catchments showed little seasonal variations during the observation periods (Fig. 2e). The annual export flux of nitrate (Mtotal), the annual export flux of NOatm (Matm), and the ratio were 98.8 ± 17.8 mmol m−2 yr−1, 9.7 ± 2.1 mmol m−2 yr−1, and 14.1 ± 4.1 % at FK1 catchment, respectively, 82.0 ± 14.8 mmol m−2 yr−1, 4.6 ± 1.0 mmol m−2 yr−1, and 6.6 ± 2.0 % at FK2 catchment, respectively, 23.7 ± 1.2 mmol m−2 yr−1, 0.5 ± 0.1 mmol m−2 yr−1, and 1.3 ± 0.4 % at MY catchment, respectively (Table 2). The uncertainties of [NOatm], Matm, and ratio in each catchment were determined from the uncertainties of Δ17O, Δ17Oatm, Fstream, and Datm according to the equations of error propagation. The details were described in Appendix A.
Table 2Average concentrations of stream nitrate ([NO]), the average concentrations of unprocessed NOatm in streams ([NOatm]), the annual export flux of NO per unit area of catchments (Mtotal), the annual export flux of NOatm per unit area of catchments (Matm), the deposition flux of NOatm per unit area of catchment (Datm), and the ratios in the study catchments.
4.1 Deposition rate of atmospheric nitrate at the study catchments
Based on the air monitoring data determined at the stations of Fukuoka (33∘51′ N, 130∘50′ E) and Miyazaki (31∘83′ N, 131∘42′ E) from 2011 to 2017, the Environmental Laboratories Association of Japan (2017) reported Datm to be 57.8 mmol m−2 yr−1 at Fukuoka and 49.1 mmol m−2 yr−1 at Miyazaki. Those values are consistent with the Datm estimated in this study (69.3 and 40.1 mmol m−2 yr−1 at the FK and MY catchments, respectively), within a difference of approximately 20 %. Thus, we concluded that the Datm estimated in this study was reliable within the error margin of 20 % (Table 2). Because the Datm determined at the FK catchments was the highest among the forested catchments in Table 3, we further compared the Datm of the FK catchments with those from the other air monitoring stations in Japan reported in past studies, along with that of the MY catchment (Table S1 in the Supplement). While the Datm of the MY catchment corresponded to the average level among the sites compiled in Table S1, the Datm of the FK catchments exceeded the average level significantly. In addition, the Datm of the FK catchments corresponded to one of the highest among the Japanese forested areas (Table S1). All the catchments in Japan can be suffered from the long-range transport of air pollutants derived from megacities in the East Asian region (Chiwa, 2021; Chiwa et al., 2012, 2013). In addition, the shorter transport distance from the Fukuoka metropolitan area (total population: 1.62 million people; population density: 4715 people km−2) may be mainly responsible for the Datm higher in FK than in MY, because the FK catchments are only 15 km west of the Fukuoka metropolitan area.
Table 3The annual amount of precipitation (P), the average concentration of stream nitrate ([NO]), the nitrogen saturation stage, the average concentration of unprocessed NOatm in streams ([NOatm]), the annual export flux of NO per unit area of catchment (Mtotal), the annual export flux of NOatm per unit area of catchment (Matm), the deposition flux of NOatm per unit area of catchment (Datm), and the ratio in the FK1, FK2, and MY, along with those in the catchments studied in past studies using Δ17O of nitrate as a tracer.
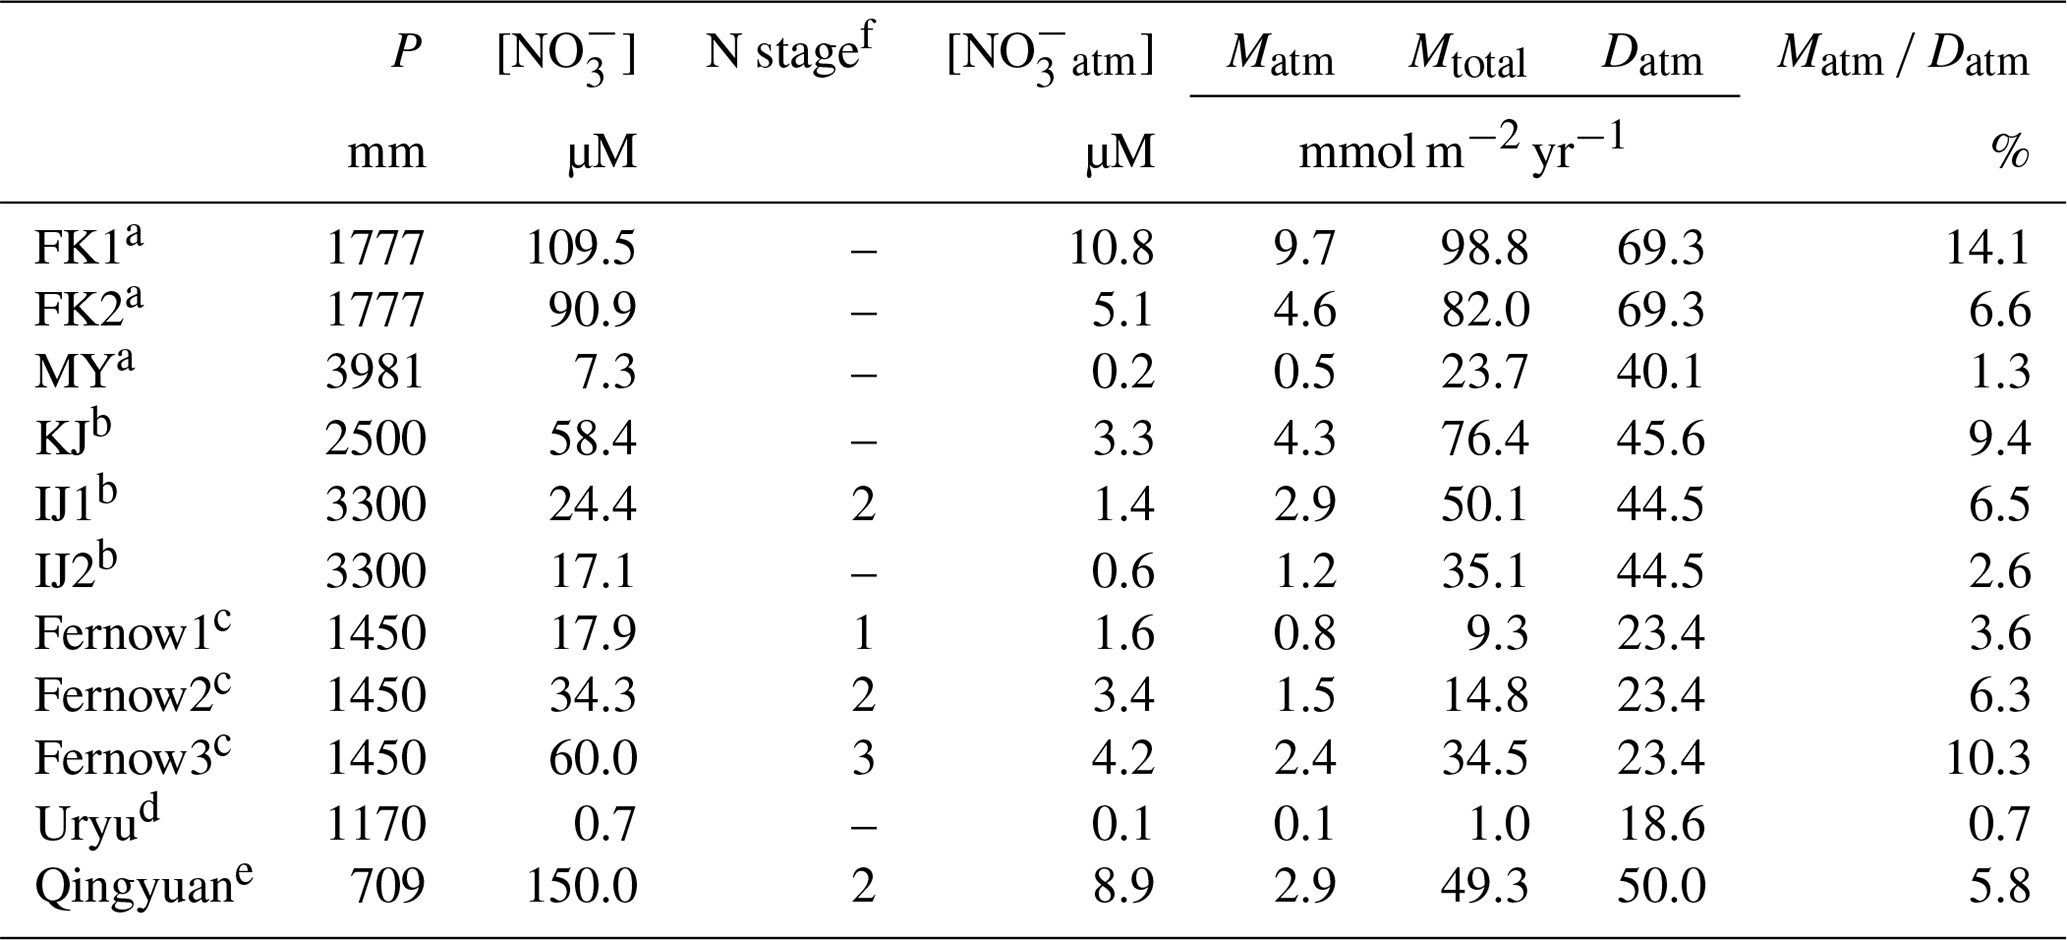
a This study. b Nakagawa et al. (2018), Nakahara et al. (2010). c Rose et al. (2015). d Tsunogai et al. (2014). e Huang et al. (2020). f N saturation stage estimated in past studies – means no data.
4.2 Excess leaching of unprocessed atmospheric nitrate from FK catchments
The isotopic compositions (δ15N, δ18O, and Δ17O) of stream nitrate eluted from the FK and MY catchments were typical for those eluted from forested catchments (Hattori et al., 2019; Huang et al., 2020; Nakagawa et al., 2013, 2018; Riha et al., 2014; Sabo et al., 2016; Tsunogai et al., 2014, 2016). The striking features found in the FK catchments were that, in addition to the high [NO] and high Mtotal that had been clarified in a past study (Chiwa, 2021), both [NOatm] and Matm in FK were higher than those eluted from MY (Table 2). Especially, the average [NOatm] in the stream eluted from the FK1 catchment was the highest ever reported in forested streams determined through continuous monitoring for more than 1 year (Bostic et al., 2021; Bourgeois et al., 2018a, b; Hattori et al., 2019; Huang et al., 2020; Nakagawa et al., 2018; Rose et al., 2015; Sabo et al., 2016; Tsunogai et al., 2014, 2016).
The observed high [NOatm] in the stream eluted from the FK1 catchment could be caused just by the high [NOatm] deposition in the catchment. Thus, we compiled all past data ever reported in forested streams through continuous monitoring in Table 3, where the data of average [NO], average [NOatm], Matm, Mtotal, Datm, and ratio were included for comparison. The result showed that the ratio, along with Matm, was the highest as well in the FK1 catchment among the forested catchments (Table 3).
Elevated loading of nitrogen through atmospheric deposition was responsible for the occurrence of nitrogen saturation in forest ecosystems, from which elevated levels of nitrate are exported (Aber et al., 1989). Nakagawa et al. (2018) proposed that the ratio can be an index for evaluating the nitrogen saturation in each forested catchment, because the ratio directly reflects the present demand for atmospheric nitrate deposited in each forested catchment, and thus reflects the nitrogen saturation in each forested catchment. The high ratios observed in the FK catchments implied that the demand for atmospheric nitrate was low in the FK catchments and that the stages of nitrogen saturation at the FK catchments were higher than those at other forested catchments. That is, the nitrogen saturation at the FK catchments was responsible for the observed high [NO] and high Mtotal at the FK catchments than at MY and any other catchment ever studied (Table 3).
The stand age of forests can affect the retention or loss of N (Fukushima et al., 2011; Ohrui and Mitchell, 1997). Fukushima et al. (2011) evaluated N uptake rates of Japanese cedars at different ages (5–89 years old) and demonstrated that the N uptake rates of Japanese cedars were higher in younger stands (53 kg N ha−1 yr−1 in 16 years old) than in older stands (29 kg N ha−1 yr−1 in 31 years old; 24 kg N ha−1 yr−1 in 42 years old; 34 kg N ha−1 yr−1 in 89 years old). In addition, Yang and Chiwa (2021) found that the nitrate concentration in the soil water taken beneath the rooting zone of matured artificial Japanese cedar plantations (607 ± 59 µM; 64–69 years old) was significantly higher than that of normal Japanese oak plantations (8.7 ± 8.1 µM; 24 years old). Moreover, by adding ammonium nitrate (50 kg N ha−1 yr−1) to the forest floor directly, Yang and Chiwa (2021) found that the nitrate concentration in the soil water of the matured artificial Japanese cedar plantations increased significantly faster than that of the normal Japanese oak plantations, probably because of the lower N uptake rates in the matured artificial Japanese cedar plantations. Because most of the artificial Japanese cedar/cypress plantations in the FK and MY catchments have reached their maturity (>50 years; Yang and Chiwa, 2021), the higher proportion of matured artificial Japanese cedar/cypress plantations in the FK1 catchment (Table 1) was highly responsible for the observed elevated leaching of nitrate, caused by the reduction in N uptake rates.
As a result, we concluded that the FK forested catchments were under the high nitrogen saturation stage, FK1 catchment especially, and the nitrogen saturation in the FK1 catchment was responsible for the elevated Mtotal, Matm, [NO], [NOatm] found in the stream eluted from the catchment (Fig. 3a, b, c and d).

Figure 3Annual export flux of nitrate per unit area (Mtotal) plotted as a function of the ratio in each forested catchment (a); the annual export flux of unprocessed atmospheric nitrate per unit area (Matm) plotted as a function of the ratio (b); the average concentration of NOatm ([NOatm]) plotted as a function of the ratio (c); the ratio plotted as a function of the average concentration of nitrate ([NO]) (d); the Mtotal plotted as a function of [NO] (e); the Matm plotted as a function of [NO] (f) (FK1: orange circles; FK2: yellow circles; MY: green circles). Those determined for the forested catchments in past studies are plotted as well (Qingyuan: white circle, Huang et al., 2020; KJ, IJ1, and IJ2: white squares, Nakagawa et al., 2018; Fernow 1, 2, and 3: white diamonds, Rose et al., 2015; Uryu: white triangle, Tsunogai et al., 2014). The data obtained in the Qingyuan forested catchment are shown in parentheses and excluded from the calculation to estimate correlation coefficients (see text for the reason).
4.3 The ratio as an index of nitrogen saturation
Past studies have used the concentration of stream nitrate as one of the important indexes to evaluate the stage of nitrogen saturation in each forest (Aber, 1992; Huang et al., 2020; Rose et al., 2015; Stoddard, 1994). The strong linear relationship (R2=0.76; P<0.0001) between the stream nitrate concentration and the ratio, except for the Qingyuan forested catchment (Fig. 3d), further supported that the ratio can be used as an alternative index of nitrogen saturation, as pointed out in Nakagawa et al. (2018).
The differences in the number of storm and/or snowmelt events could affect the ratio as well, because NOatm could be injected into the stream water directly, along with the storm/snowmelt water (Tsunogai et al., 2014; Ding et al., 2022; Inamdar and Mitchell, 2006). In a recent study, however, we found that storm events have little impact on the ratio, based on monitoring temporal variation of [NOatm] in stream water during storm events (Ding et al., 2022). In addition, the low ratio found in Uryu forested catchment (0.7 %; Table 3) implied that the snowmelt has little impact on the ratio as well, because 30 % of the annual mean precipitation was snow in Uryu forested catchment (Tsunogai et al., 2014).
The differences in the amount of precipitation, temperature, and the flux of stream water could affect the ratio as well. As a result, the annual amount of precipitation, mean temperature, and the annual mean flux of stream water (Fstream) in the forested catchments were compiled in Table S2. While the stream nitrate concentration showed a strong linear relationship (R2=0.76; P<0.0001) with the ratio (Fig. 3d), the precipitation, temperature, and Fstream did not show a significant relationship with the ratio (P>0.14; Fig. 4). As a result, we concluded that the ratio was mainly controlled by the progress of nitrogen saturation, rather than the differences in the number of storm and/or snowmelt events, the amount of precipitation, temperature, and the flux of stream water.

Figure 4The ratio plotted as a function of the amount of precipitation (a), the ratio plotted as a function of the temperature (b), and the ratio plotted as a function of flux of stream water (c) (FK1: orange circles; FK2: yellow circles; MY: green circles). Those determined for the forested catchments in past studies are plotted as well.
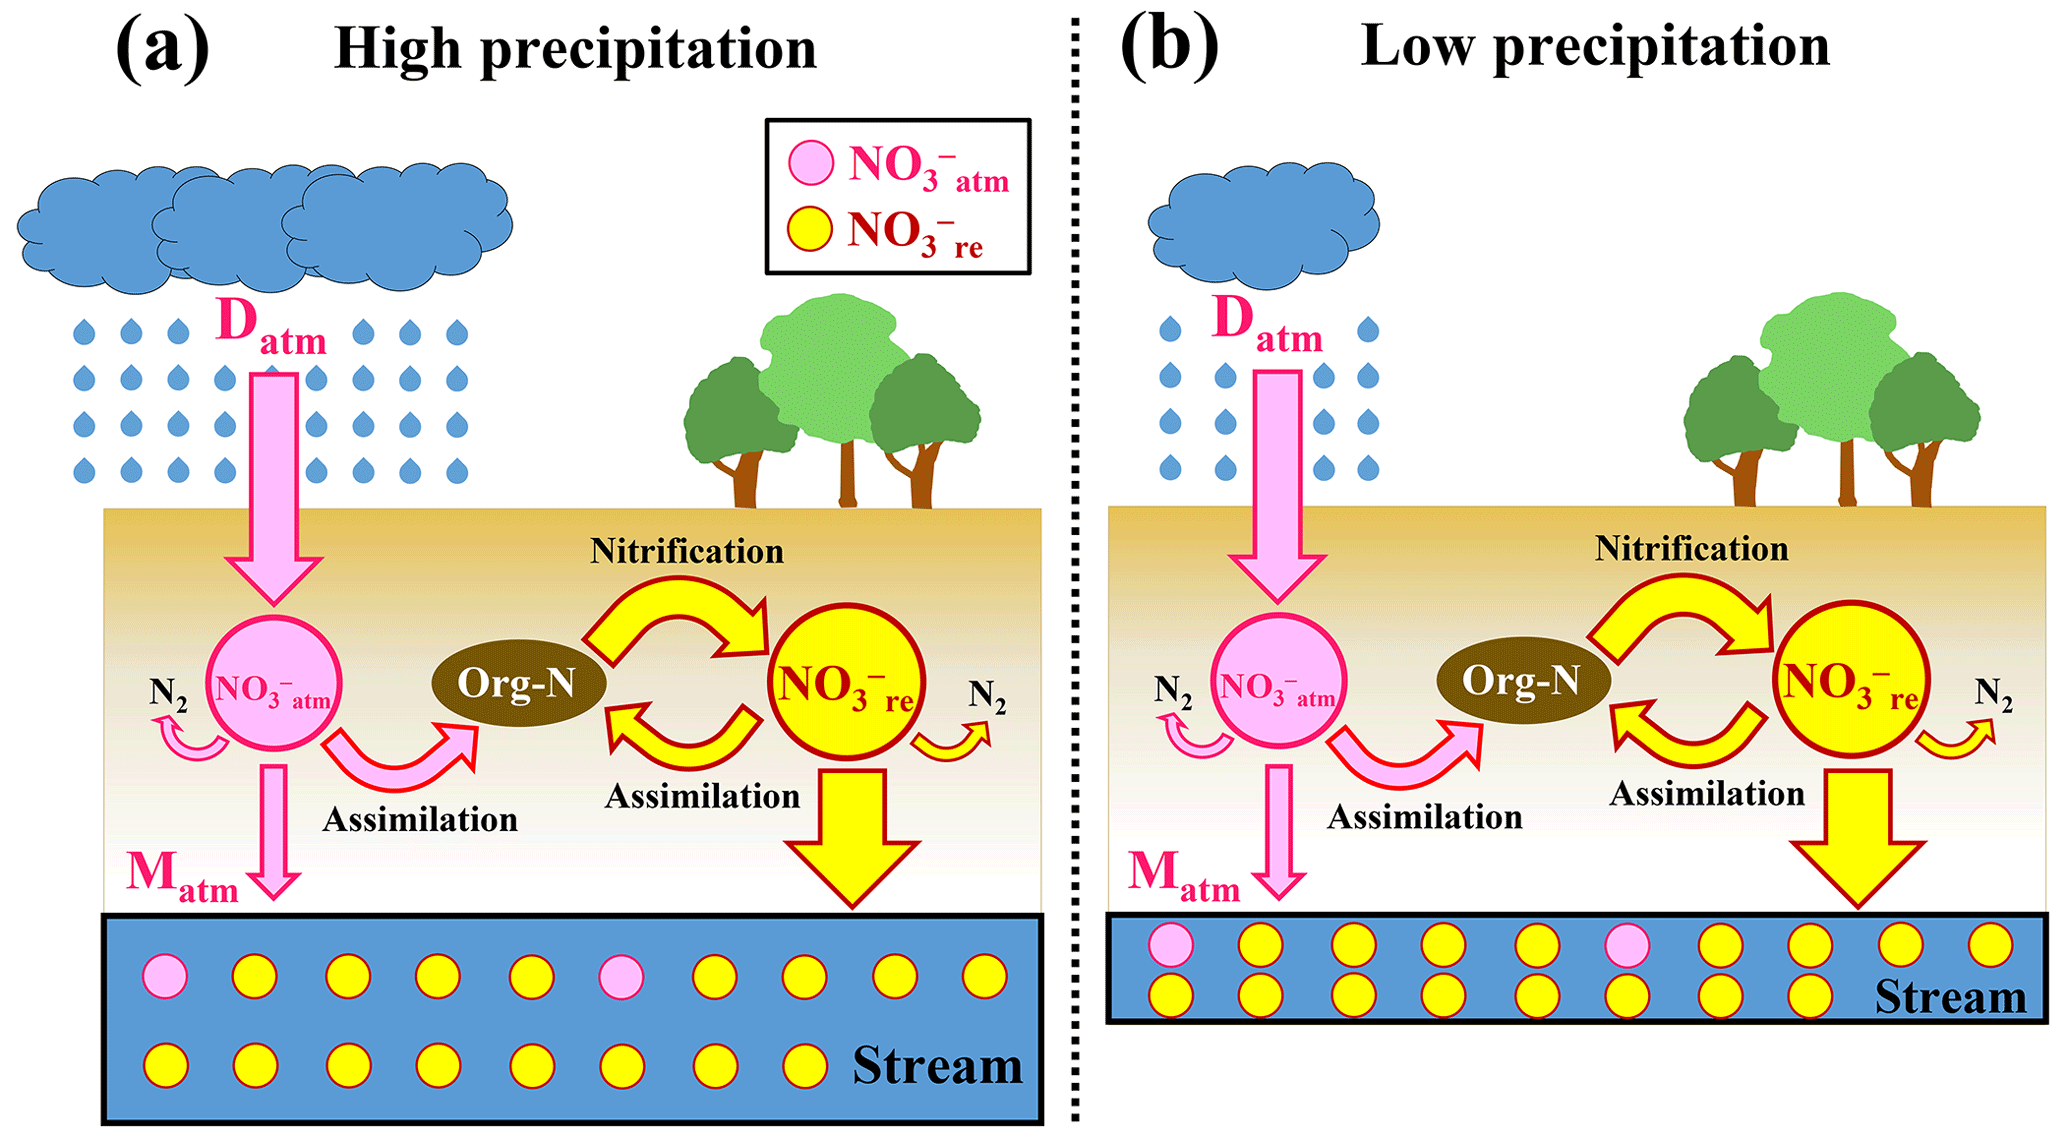
Figure 5Schematic diagram showing the biogeochemical processing of nitrate in forested catchments under high precipitation (a) and low precipitation (b), where NOatm (unprocessed atmospheric nitrate) is represented by pink circles, NOre by yellow circles, the flows of NOatm by pink arrows, and those of NOre (remineralized nitrate) by yellow arrows (modified after Nakagawa et al., 2018). Although the deposition rates of NOatm (Datm) and the biogeochemical reaction rates between (a) and (b) are the same, we can expect high [NO] in (b). On the other hand, the ratio between (a) and (b) are the same.
The differences in the residence time of water in each catchment could also impact the ratio, as the residence time of water in forested catchments ranges from one month to more than one year (Asano et al., 2002; Farrick and Branfireun, 2015; Kabeya et al., 2008; Rodgers et al., 2005; Soulsby et al., 2006; Tetzlaff et al., 2007). While the ratio could be higher in catchments with a shorter water residence time, it is difficult to explain high [NO] and high Mtotal eluted from the catchment by the residence time of water alone, as the majority of nitrate eluted from the catchment with a high ratio was NOre produced by microbial nitrification. The significant correlation between Mtotal and ratios (P<0.0001; Fig. 3a) supported nitrogen saturation as the leading cause of high Mtotal in catchments with a high ratio. Additionally, the high loading of atmospheric nitrogen, the type of plantation, and the old age of plantation in the FK1 catchment all supported the conclusion that the FK1 catchment was under nitrogen saturation.
The ratio is a more reliable and robust index than the stream nitrate concentration, as explained below. The Qingyuan forested catchment can be classified into the highest nitrogen saturation stage based only on the highest stream nitrate concentration of 150 µM (Table 3). However, based on the leaching flux of nitrogen via stream water monitored by Huang et al. (2020) for 4 years in the Qingyuan forested catchment, along with the deposition flux of nitrogen, we can obtain the ratio in the catchment to be a medium level of 5.8 ± 1.3 %, implying that the nitrogen saturation stage was not so high (Table 3). Huang et al. (2020) also concluded that the input of nitrogen exceeded the output in the catchment, and thus, the catchment was at stage 2 of nitrogen saturation. The ratio in the Qingyuan forested catchment with a medium level among all forested catchments (Fig. 3d) should be a more reliable index of nitrogen saturation.
Compared with those in the other forested catchments in Table 3, the annual amount of precipitation (P) has the lowest value of 709 mm in the Qingyuan forested catchment. The flux of stream water (Fstream) has the lowest value of 309 mm as well. Thus, we concluded that nitrate was relatively concentrated in the catchment because of the small precipitation, resulting in relative enrichment in the concentrations of both nitrate (150 µM) and unprocessed atmospheric nitrate (8.9 µM) in the stream.
While the concentration of stream nitrate, as an index of nitrogen saturation traditionally, can be influenced by the amount of precipitation, as demonstrated in the Qingyuan forested catchment, the ratio is independent of the amount of precipitation (Fig. 5). Therefore, the ratio can be used as a more robust index for evaluating nitrogen saturation in each forested catchment.
Both the concentrations and Δ17O of stream nitrate were determined for more than 2 years in the forested catchments of FK (FK1 and FK2) and MY to determine the ratio for each catchment. The FK catchments exhibited higher ratio than the MY catchment and other forested catchments reported in past studies, implying that the progress of nitrogen saturation in the FK catchments was severe. Both age and proportion of artificial plantation in the FK catchments were responsible for the progress of nitrogen saturation. In addition, although past studies have commonly used the concentration of stream nitrate as an index to evaluate the progress of nitrogen saturation in forested catchments, it can be influenced by the amount of precipitation. As a result, we concluded that the ratio should be used as a more reliable index for evaluating the progress of nitrogen saturation because the ratio is independent from the amount of precipitation.
The uncertainty in the values of [NOatm] was estimated from the uncertainties in the Δ17O values of stream nitrate (Δ17O) and NOatm (Δ17Oatm) according to the divisive equation of error propagation (Eq. A1):
where , , and denote the uncertainties in [NOatm], Δ17O values of stream nitrate, and Δ17O values of NOatm, respectively. The standard error of the mean (SE) of ±0.1 ‰ and the areal/seasonal variations of ±3 ‰ was used in calculating and , respectively. As a result, the uncertainty in [NOatm] () was ±1.30, ±0.67, and ±0.03 µM at FK1, FK2, and MY catchments, respectively.
The uncertainty in the values of Matm was estimated from the uncertainties in [NOatm] and in Fstream according to the multiplicative equation of error propagation (Eq. A2):
where , , and denote the uncertainties in Matm, [NOatm], and Fstream, respectively. H. Komatsu et al. (2008) proposed the uncertainty in Fstream to be ±162.3 mm when using the water balance method in estimating Fstream. Here, the uncertainty in Matm () was ±2.1, ±1.0, and ±0.1 mmol m−2 yr−1 at FK1, FK2, and MY catchments, respectively.
The uncertainty in ratio was estimated from the uncertainties in Matm and in Datm according to the divisive equation of error propagation (Eq. A3):
where , , and denote the uncertainty in ratio, Matm, and Datm, respectively. Comparing the deposition rate of NOatm obtained at the other atmospheric monitoring stations nearby, the uncertainty of 20 % was adopted for those of Datm in each catchment, which corresponds to the uncertainty in Datm of ±13.9, ±13.9, ±8.0 mmol m−2 yr−1 at FK1, FK2, and MY catchments, respectively. As a result, the uncertainty in ratio was ± 4.1 %, ±2.0 %, and ±0.4 % at FK1, FK2, and MY catchments, respectively.
All the primary data are presented in the Supplement. The other data are available upon request to the corresponding author (Weitian Ding).
The supplement related to this article is available online at: https://doi.org/10.5194/bg-20-753-2023-supplement.
UT, FN, KS, and MC designed the study. MC and TK performed the field observations. WD, UT, and FN determined the concentrations and isotopic compositions of the samples. WD, TS, FN, and UT performed data analysis, and WD and UT wrote the paper with input from MC, TK, and KS.
The contact author has declared that none of the authors has any competing interests.
Publisher's note: Copernicus Publications remains neutral with regard to jurisdictional claims in published maps and institutional affiliations.
We thank the anonymous referees for their valuable remarks on an earlier version of this paper. We also thank Daisuke Nanki, Takuma Nakamura and Yuko Muramatsu for their long-term water sampling. Additionally, we are grateful to the members of the Biogeochemistry Group, Graduate School of Environmental Studies, Nagoya University, for their valuable support throughout this study. This work was supported by a Grant-in-Aid for Scientific Research from the Ministry of Education, Culture, Sports, Science, and Technology of Japan under grant numbers 22H00561, and 17H00780, the Yanmar Environmental Sustainability Support Association, and the River Fund of the River Foundation, Japan. Weitian Ding would like to take this opportunity to thank the Nagoya University Interdisciplinary Frontier Fellowship supported by Nagoya University and JST, the establishment of university fellowships towards the creation of science technology innovation, Grant Number JPMJFS2120.
This research has been supported by the Ministry of Education, Culture, Sports, Science, and Technology of Japan (grant nos. 22H00561 and 17H00780); the Yanmar Environmental Sustainability Support Association; the River Fund of the River Foundation, Japan; and the Nagoya University and JST (grant no. JPMJFS2120).
This paper was edited by Perran Cook and reviewed by two anonymous referees.
Aber, J. D.: Nitrogen cycling and nitrogen saturation in temperate forest ecosystems, Trends Ecol. Evol., 7, 220–224, https://doi.org/10.1016/0169-5347(92)90048-G, 1992.
Aber, J. D., Nadelhoffer, K. J., Steudler, P., and Melillo, J. M.: Nitrogen Saturation in Northern Forest Ecosystems, Bioscience, 39, 378–386, https://doi.org/10.2307/1311067, 1989.
Aikawa, M., Hiraki, T., Tamaki, M., and Shoga, M.: Difference between filtering-type bulk and wet-only data sets based on site classification, Atmos. Environ., 37, 2597–2603, https://doi.org/10.1016/S1352-2310(03)00214-0, 2003.
Alexander, B., Hastings, M. G., Allman, D. J., Dachs, J., Thornton, J. A., and Kunasek, S. A.: Quantifying atmospheric nitrate formation pathways based on a global model of the oxygen isotopic composition (Δ17O) of atmospheric nitrate, Atmos. Chem. Phys., 9, 5043–5056, https://doi.org/10.5194/acp-9-5043-2009, 2009.
Asano, Y., Uchida, T., and Ohte, N.: Residence times and flow paths of water in steep unchannelled catchments, Tanakami, Japan, J. Hydrol., 261, 173–192, https://doi.org/10.1016/S0022-1694(02)00005-7, 2002.
Bostic, J. T., Nelson, D. M., Sabo, R. D., and Eshleman, K. N.: Terrestrial Nitrogen Inputs Affect the Export of Unprocessed Atmospheric Nitrate to Surface Waters: Insights from Triple Oxygen Isotopes of Nitrate, Ecosystems, 25, 1384–1399, https://doi.org/10.1007/s10021-021-00722-9, 2021.
Bourgeois, I., Savarino, J., Némery, J., Caillon, N., Albertin, S., Delbart, F., Voisin, D., and Clément, J. C.: Atmospheric nitrate export in streams along a montane to urban gradient, Sci. Total Environ., 633, 329–340, https://doi.org/10.1016/j.scitotenv.2018.03.141, 2018a.
Bourgeois, I., Savarino, J., Caillon, N., Angot, H., Barbero, A., Delbart, F., Voisin, D., and Clément, J. C.: Tracing the Fate of Atmospheric Nitrate in a Subalpine Watershed Using Δ17O, Environ. Sci. Technol., 52, 5561–5570, https://doi.org/10.1021/acs.est.7b02395, 2018b.
Chiwa, M.: Characteristics of atmospheric nitrogen and sulfur containing compounds in an inland suburban-forested site in northern Kyushu, western Japan, Atmos. Res., 96, 531–543, https://doi.org/10.1016/j.atmosres.2010.01.001, 2010.
Chiwa, M.: Ten-year determination of atmospheric phosphorus deposition at three forested sites in Japan, Atmos. Environ., 223, 1–7, https://doi.org/10.1016/j.atmosenv.2019.117247, 2020.
Chiwa, M.: Long-term changes in atmospheric nitrogen deposition and stream water nitrate leaching from forested watersheds in western Japan, Environ. Pollut., 287, 117634, https://doi.org/10.1016/j.envpol.2021.117634, 2021.
Chiwa, M., Onikura, N., Ide, J., and Kume, A.: Impact of N-Saturated Upland Forests on Downstream N Pollution in the Tatara River Basin, Japan, Ecosystems, 15, 230–241, https://doi.org/10.1007/s10021-011-9505-z, 2012.
Chiwa, M., Enoki, T., Higashi, N., Kumagai, T., and Otsuki, K.: The Increased Contribution of Atmospheric Nitrogen Deposition to Nitrogen Cycling in a Rural Forested Area of Kyushu, Japan, Water, Air, Soil Pollut., 224, 1763, https://doi.org/10.1007/s11270-013-1763-2, 2013.
Ding, W., Tsunogai, U., Nakagawa, F., Sambuichi, T., Sase, H., Morohashi, M., and Yotsuyanagi, H.: Tracing the source of nitrate in a forested stream showing elevated concentrations during storm events, Biogeosciences, 19, 3247–3261, https://doi.org/10.5194/bg-19-3247-2022, 2022.
Endo, T., Yagoh, H., Sato, K., Matsuda, K., Hayashi, K., Noguchi, I., and Sawada, K.: Regional characteristics of dry deposition of sulfur and nitrogen compounds at EANET sites in Japan from 2003 to 2008, Atmos. Environ., 45, 1259–1267, https://doi.org/10.1016/j.atmosenv.2010.12.003, 2011.
Environmental Laboratories Association of Japan: Acid Rain National Survey Report 2017, https://tenbou.nies.go.jp/envgis_explain/acid_rain/content.html (last access: 20 December 2022), 2017.
Farrick, K. K. and Branfireun, B. A.: Flowpaths, source water contributions and water residence times in a Mexican tropical dry forest catchment, J. Hydrol., 529, 854–865, https://doi.org/10.1016/j.jhydrol.2015.08.059, 2015.
Fukushima, K., Tateno, R., and Tokuchi, N.: Soil nitrogen dynamics during stand development after clear-cutting of Japanese cedar (Cryptomeria japonica) plantations, J. Forest Res., 16, 394–404, https://doi.org/10.1007/s10310-011-0286-1, 2011.
Galloway, J. N., Aber, J. D., Erisman, J. W., Seitzinger, S. P., Howarth, R. W., Cowling, E. B., and Cosby, B. J.: The nitrogen cascade, Bioscience, 53, 341–356, https://doi.org/10.1641/0006-3568(2003)053[0341:TNC]2.0.CO;2, 2003.
Hattori, S., Nuñez Palma, Y., Itoh, Y., Kawasaki, M., Fujihara, Y., Takase, K., and Yoshida, N.: Isotopic evidence for seasonality of microbial internal nitrogen cycles in a temperate forested catchment with heavy snowfall, Sci. Total Environ., 690, 290–299, https://doi.org/10.1016/j.scitotenv.2019.06.507, 2019.
Hirota, A., Tsunogai, U., Komatsu, D. D., and Nakagawa, F.: Simultaneous determination of δ15N and δ18O of N2O and δ13C of CH4 in nanomolar quantities from a single water sample, Rapid Commun. Mass Sp., 24, 1085–1092, https://doi.org/10.1002/rcm.4483, 2010.
Huang, S., Wang, F., Elliott, E. M., Zhu, F., Zhu, W., Koba, K., Yu, Z., Hobbie, E. A., Michalski, G., Kang, R., Wang, A., Zhu, J., Fu, S., and Fang, Y.: Multiyear Measurements on Δ17O of Stream Nitrate Indicate High Nitrate Production in a Temperate Forest, Environ. Sci. Technol., 54, 4231–4239, https://doi.org/10.1021/acs.est.9b07839, 2020.
Inamdar, S. P. and Mitchell, M. J.: Hydrologic and topographic controls on storm-event exports of dissolved organic carbon (DOC) and nitrate across catchment scales, Water Resour. Res., 42, 1–16, https://doi.org/10.1029/2005WR004212, 2006.
Inoue, T., Nakagawa, F., Shibata, H., and Tsunogai, U.: Vertical Changes in the Flux of Atmospheric Nitrate From a Forest Canopy to the Surface Soil Based on Δ17O Values, J. Geophys. Res.-Biogeo., 126, e2020JG005876, https://doi.org/10.1029/2020JG005876, 2021.
Kabeya, N., Shimizu, A., Nobuhiro, T., and Tamai, K.: Preliminary study of flow regimes and stream water residence times in multi-scale forested watersheds of central Cambodia, Paddy Water Environ., 6, 25–35, https://doi.org/10.1007/s10333-008-0104-3, 2008.
Kaiser, J., Hastings, M. G., Houlton, B. Z., Röckmann, T., and Sigman, D. M.: Triple oxygen isotope analysis of nitrate using the denitrifier method and thermal decomposition of N2O, Anal. Chem., 79, 599–607, https://doi.org/10.1021/ac061022s, 2007.
Komatsu, D. D., Ishimura, T., Nakagawa, F., and Tsunogai, U.: Determination of the , , and ratios of nitrous oxide by using continuous-flow isotope-ratio mass spectrometry, Rapid Commun. Mass Sp., 22, 1587–1596, https://doi.org/10.1002/rcm.3493, 2008.
Komatsu, H., Maita, E., and Otsuki, K.: A model to estimate annual forest evapotranspiration in Japan from mean annual temperature, J. Hydrol., 348, 330–340, https://doi.org/10.1016/j.jhydrol.2007.10.006, 2008.
Konno, U., Tsunogai, U., Komatsu, D. D., Daita, S., Nakagawa, F., Tsuda, A., Matsui, T., Eum, Y.-J., and Suzuki, K.: Determination of total N2 fixation rates in the ocean taking into account both the particulate and filtrate fractions, Biogeosciences, 7, 2369–2377, https://doi.org/10.5194/bg-7-2369-2010, 2010.
Matsuda, K.: Estimation of dry deposition for sulfur and nitrogen compounds in the atmosphere: Updated parameterization of deposition velocity, J. Jpn. Soc. Atmos. Environ., 43, 332–339, https://doi.org/10.11298/taiki1995.43.332, 2008.
McIlvin, M. R. and Altabet, M. A.: Chemical conversion of nitrate and nitrite to nitrous oxide for nitrogen and oxygen isotopic analysis in freshwater and seawater, Anal. Chem., 77, 5589–5595, https://doi.org/10.1021/ac050528s, 2005.
Michalski, G., Scott, Z., Kabiling, M., and Thiemens, M. H.: First measurements and modeling of Δ17O in atmospheric nitrate, Geophys. Res. Lett., 30, 3–6, https://doi.org/10.1029/2003GL017015, 2003.
Michalski, G., Meixner, T., Fenn, M., Hernandez, L., Sirulnik, A., Allen, E., and Thiemens, M.: Tracing Atmospheric Nitrate Deposition in a Complex Semiarid Ecosystem Using Δ17O, Environ. Sci. Technol., 38, 2175–2181, https://doi.org/10.1021/es034980+, 2004.
Mitchell, M. J., Iwatsubo, G., Ohrui, K., and Nakagawa, Y.: Nitrogen saturation in Japanese forests: An evaluation, For. Ecol. Manag., 97, 39–51, https://doi.org/10.1016/S0378-1127(97)00047-9, 1997.
Morin, S., Sander, R., and Savarino, J.: Simulation of the diurnal variations of the oxygen isotope anomaly (Δ17O) of reactive atmospheric species, Atmos. Chem. Phys., 11, 3653–3671, https://doi.org/10.5194/acp-11-3653-2011, 2011.
Nakagawa, F., Suzuki, A., Daita, S., Ohyama, T., Komatsu, D. D., and Tsunogai, U.: Tracing atmospheric nitrate in groundwater using triple oxygen isotopes: evaluation based on bottled drinking water, Biogeosciences, 10, 3547–3558, https://doi.org/10.5194/bg-10-3547-2013, 2013.
Nakagawa, F., Tsunogai, U., Obata, Y., Ando, K., Yamashita, N., Saito, T., Uchiyama, S., Morohashi, M., and Sase, H.: Export flux of unprocessed atmospheric nitrate from temperate forested catchments: a possible new index for nitrogen saturation, Biogeosciences, 15, 7025–7042, https://doi.org/10.5194/bg-15-7025-2018, 2018.
Nakahara, O., Takahashi, M., Sase, H., Yamada, T., Matsuda, K., Ohizumi, T., Fukuhara, H., Inoue, T., Takahashi, A., Kobayashi, H., Hatano, R., and Hakamata, T.: Soil and stream water acidification in a forested catchment in central Japan, Biogeochemistry, 97, 141–158, https://doi.org/10.1007/s10533-009-9362-4, 2010.
Nelson, D. M., Tsunogai, U., Ding, D., Ohyama, T., Komatsu, D. D., Nakagawa, F., Noguchi, I., and Yamaguchi, T.: Triple oxygen isotopes indicate urbanization affects sources of nitrate in wet and dry atmospheric deposition, Atmos. Chem. Phys., 18, 6381–6392, https://doi.org/10.5194/acp-18-6381-2018, 2018.
Ohrui, K. and Mitchell, M. J.: Nitrogen Saturation in Japanese Forested Watersheds, Ecol. Appl., 7, 391–401, 1997.
Paerl, H. W. and Huisman, J.: Climate change: A catalyst for global expansion of harmful cyanobacterial blooms, Env. Microbiol. Rep., 1, 27–37, https://doi.org/10.1111/j.1758-2229.2008.00004.x, 2009.
Peterjohn, W. T., Adams, M. B., and Gilliam, F. S.: Symptoms of nitrogen saturation in two central Appalachian hardwood forest ecosystems, Biogeochemistry, 35, 507–522, https://doi.org/10.1007/BF02183038, 1996.
Riha, K. M., Michalski, G., Gallo, E. L., Lohse, K. A., Brooks, P. D., and Meixner, T.: High Atmospheric Nitrate Inputs and Nitrogen Turnover in Semi-arid Urban Catchments, Ecosystems, 17, 1309–1325, https://doi.org/10.1007/s10021-014-9797-x, 2014.
Rodgers, P., Soulsby, C., Waldron, S., and Tetzlaff, D.: Using stable isotope tracers to assess hydrological flow paths, residence times and landscape influences in a nested mesoscale catchment, Hydrol. Earth Syst. Sci., 9, 139–155, https://doi.org/10.5194/hess-9-139-2005, 2005.
Rose, L. A., Elliott, E. M., and Adams, M. B.: Triple Nitrate Isotopes Indicate Differing Nitrate Source Contributions to Streams Across a Nitrogen Saturation Gradient, Ecosystems, 18, 1209–1223, https://doi.org/10.1007/s10021-015-9891-8, 2015.
Sabo, R. D., Nelson, D. M., and Eshleman, K. N.: Episodic, seasonal, and annual export of atmospheric and microbial nitrate from a temperate forest, Geophys. Res. Lett., 43, 683–691, https://doi.org/10.1002/2015GL066758, 2016.
Sappa, G., Ferranti, F., and Pecchia, G. M.: Validation Of Salt Dilution Method For Discharge Measurements In The Upper Valley Of Aniene River (Central Italy), Recent Adv. Environ. Ecosyst. Dev., 26, 42–48, 2015.
Sase, H., Takahashi, M., Matsuda, K., Yamashita, N., Tsunogai, U., Nakagawa, F., Morohashi, M., Yotsuyanagi, H., Ohizumi, T., Sato, K., Kurokawa, J., and Nakata, M.: Nitrogen saturation of forested catchments in central Japan – Progress or recovery?, Soil Sci. Plant Nutr., 68, 5–14, https://doi.org/10.1080/00380768.2021.1991228, 2022.
Soulsby, C., Tetzlaff, D., Rodgers, P., Dunn, S., and Waldron, S.: Runoff processes, stream water residence times and controlling landscape characteristics in a mesoscale catchment: An initial evaluation, J. Hydrol., 325, 197–221, https://doi.org/10.1016/j.jhydrol.2005.10.024, 2006.
Stoddard, J. L.: Long-Term Changes in Watershed Retention of Nitrogen: Its Causes and Aquatic Consequences, in: Environmental Chemistry of Lakes and Reservoirs, edited by: Baker, L. A., Advances in Chemistry Series, American Chemical Society, Washington DC, 1994.
Tetzlaff, D., Malcolm, I. A., and Soulsby, C.: Influence of forestry, environmental change and climatic variability on the hydrology, hydrochemistry and residence times of upland catchments, J. Hydrol., 346, 93–111, https://doi.org/10.1016/j.jhydrol.2007.08.016, 2007.
Tsunogai, U., Komatsu, D. D., Daita, S., Kazemi, G. A., Nakagawa, F., Noguchi, I., and Zhang, J.: Tracing the fate of atmospheric nitrate deposited onto a forest ecosystem in Eastern Asia using Δ17O, Atmos. Chem. Phys., 10, 1809–1820, https://doi.org/10.5194/acp-10-1809-2010, 2010.
Tsunogai, U., Daita, S., Komatsu, D. D., Nakagawa, F., and Tanaka, A.: Quantifying nitrate dynamics in an oligotrophic lake using Δ17O, Biogeosciences, 8, 687–702, https://doi.org/10.5194/bg-8-687-2011, 2011.
Tsunogai, U., Komatsu, D. D., Ohyama, T., Suzuki, A., Nakagawa, F., Noguchi, I., Takagi, K., Nomura, M., Fukuzawa, K., and Shibata, H.: Quantifying the effects of clear-cutting and strip-cutting on nitrate dynamics in a forested watershed using triple oxygen isotopes as tracers, Biogeosciences, 11, 5411–5424, https://doi.org/10.5194/bg-11-5411-2014, 2014.
Tsunogai, U., Miyauchi, T., Ohyama, T., Komatsu, D. D., Nakagawa, F., Obata, Y., Sato, K., and Ohizumi, T.: Accurate and precise quantification of atmospheric nitrate in streams draining land of various uses by using triple oxygen isotopes as tracers, Biogeosciences, 13, 3441–3459, https://doi.org/10.5194/bg-13-3441-2016, 2016.
Tsunogai, U., Miyauchi, T., Ohyama, T., Komatsu, D. D., Ito, M., and Nakagawa, F.: Quantifying nitrate dynamics in a mesotrophic lake using triple oxygen isotopes as tracers, Limnol. Oceanogr., 63, S458–S476, https://doi.org/10.1002/lno.10775, 2018.
Vitousek, P. M. and Howarth, R. W.: Nitrogen limitation on land and in the sea: How can it occur?, Biogeochemistry, 13, 87–115, https://doi.org/10.1007/BF00002772, 1991.
Yamazaki, A., Watanabe, T., and Tsunogai, U.: Nitrogen isotopes of organic nitrogen in reef coral skeletons as a proxy of tropical nutrient dynamics, Geophys. Res. Lett., 38, 1–5, https://doi.org/10.1029/2011GL049053, 2011.
Yang, R. and Chiwa, M.: Low nitrogen retention in a Japanese cedar plantation in a suburban area, western Japan, Sci. Rep., 11, 1–7, https://doi.org/10.1038/s41598-021-84753-1, 2021.