the Creative Commons Attribution 4.0 License.
the Creative Commons Attribution 4.0 License.
 | 27 Mar 2024
Regional assessment and uncertainty analysis of carbon and nitrogen balances at cropland scale using the ecosystem model LandscapeDNDC
Odysseas Sifounakis
Klaus Butterbach-Bahl
Maria P. Papadopoulou
The assessment of cropland carbon and nitrogen (C and N) balances plays a key role in identifying cost-effective mitigation measures to combat climate change and reduce environmental pollution. In this paper, a biogeochemical modelling approach is adopted to assess all C and N fluxes in a regional cropland ecosystem of Thessaly, Greece. Additionally, the estimation and quantification of the modelling uncertainty in the regional inventory are realized through the propagation of parameter distributions through the model, leading to result distributions for modelling estimations. The model was applied to a regional dataset of approximately 1000 polygons, deploying model initializations and crop rotations for the five major crop cultivations and for a time span of 8 years. The full statistical analysis on modelling results (including the uncertainty ranges given as ± values) yields for the C balance carbon input fluxes into the soil of 12.4 ± 1.4 t C ha−1 yr−1 and output fluxes of 11.9 ± 1.3 t C ha−1 yr−1, with a resulting average carbon sequestration of 0.5 ± 0.3 t C ha−1 yr−1. The averaged N influx was 212.3 ± 9.1 kg N ha−1 yr−1, while outfluxes of 198.3 ± 11.2 kg N ha−1 yr−1 were estimated on average. The net N accumulation into the soil nitrogen pools was estimated to be 14.0 ± 2.1 kg N ha−1 yr−1. The N outflux consists of gaseous N fluxes composed of N2O emissions of 2.6 ± 0.8 kg N2O–N ha−1 yr−1, NO emissions of 3.2 ± 1.5 kg NO–N ha−1 yr−1, N2 emissions of 15.5 ± 7.0 kg N2–N ha−1 yr−1 and NH3 emissions of 34.0 ± 6.7 kg NH3–N ha−1 yr−1, as well as aquatic N fluxes (only nitrate leaching into surface waters) of 14.1 ± 4.5 kg NO3–N ha−1 yr−1 and N fluxes of N removed from the fields in yields, straw and feed of 128.8 ± 8.5 kg N ha−1 yr−1.
- Article
(2516 KB) - Full-text XML
-
Supplement
(448 KB) - BibTeX
- EndNote


Food security and agricultural productivity depend, to a major extend, on the applied nitrogen (N) fertilizers (Klatt et al., 2015). Worldwide, the N fertilizer use for the years 1960 to 2005 increased from 30×106 to 154×106 t (IFADATA, 2015). In Europe, the increase in yields of arable land and grassland systems was 45 %–70 % from 1950 (European Fertilizer Manufacturers Association, 2009) due to the intensification of agricultural production systems. Excessive use of N fertilizers, though beneficially affecting the yield, could have a harmful impact on the environment, e.g. increased gaseous emissions and aquatic fluxes of nitrous oxide (N2O) to the atmosphere and leaching of nitrate (NO3) into waterbodies (Erisman et al., 2011; Galloway et al., 2013; Kim et al., 2015)
N2O poses a twofold environmental threat. On the one hand, it is a strong greenhouse gas with a warming potential that is 300 times greater (in a 100-year time period) than carbon dioxide (CO2), and on the other hand, it is a major driver of ozone depletion in the stratosphere (Ravishankara et al., 2009). Fertilizer use aimed at an increase in agricultural production is the most crucial anthropogenic source of atmospheric N2O, which, at present, contributes approximately 45 % of the total anthropogenic N2O emissions on a global scale (Jones et al., 2014). Because of global population growth and, thus, growing food demand (Godfray et al., 2010), fertilizer use will probably increase. Consequently, the predictions of the current business-as-usual scenarios show doubled anthropogenic N2O emissions by the year 2050 (Davidson and Kanter, 2014). The European countries have recently set up bilateral agreements in order to reduce N2O emissions from cultivated croplands (EU-Commission, 2014). Similarly, the European Nitrates Directive (EU-Commission, 2019; Musacchio et al., 2020) aims to reduce NO3 leaching to waterbodies to avoid an increase in both eutrophication (Camargo and Alonso, 2006) and drinking-water pollution. Because of the hazardous N2O and NO3 effects, it is necessary to evaluate agricultural systems in terms of their profitability and productivity and in terms of their impacts on the environment.
The N2O and NO3 production and consumption in agricultural lands are regulated, to a large extent, by N plant uptake and, also, by the microbial processes of denitrification and nitrification (Butterbach-Bahl et al., 2013). The factors controlling both the microbial metabolism and plant N uptake are (a) soil conditions (Butterbach-Bahl et al., 2013) and (b) cultivation management practices, e.g. crop rotation, fertilizing amount and timing, and ploughing (Smith et al., 2008).
In order to reach a minimization of the environmental footprint of agricultural production while securing global food security (Garnett et al., 2013), it is mandatory to tighten the N cycling of intensified agricultural systems, e.g. by harmonizing the N demand of crops with soil N availability by means of N fertilization.
Full nitrogen balance inventories provide a comprehensive description of the different N input and output fluxes within an arable system to the scientific community, farmers and policymakers. The assessment of the N balance is essential to optimize nitrogen use and production and to minimize environmental impacts and pollution. In particular, policymaking and regulatory bodies require accurate and robust information on all different nitrogen fluxes to develop effective strategies in agricultural N management. Until now, our descriptions of N cycling in arable land have lacked observations of the full N balance as only a few studies have tried to quantify the total N balance of agricultural systems, e.g. the study by Zistl-Schlingmann et al. (2020) using stable isotope techniques or the study by Schroeck et al. (2019) using process-based modelling.
A recent opinion paper by a large group of leading scientists in the field of process-based ecosystem modelling, Grosz et al. (2023), identified the lack of knowledge of the full N balance and the fact “the scarcity of complete modeled N balances in the literature stems from the reluctance of the scientific community to support the publication of unvalidated modeled results, especially given that the simulation results of these neglected N pools and fluxes may be unrealistic”. It is further noted that “This self-censorship of authors has resulted in a missed opportunity to share knowledge and improve our understanding of modelled processes”.
Grosz et al. (2023) conclude that “including the entire N balance and related parameters should become standard when publishing the results of N model studies”. Grosz et al. (2023) emphasize that this would allow us to assess the robustness of modelled N fluxes and full N balances and to illustrate the diversity and uncertainty of the different process-based modelling approaches, e.g. modelling denitrification processes in soils.
In this analysis, the process-based bio-geochemical model LandscapeDNDC (Haas et al., 2013) was applied to the agricultural cropland systems in the region of Thessaly (Greece). The objective of our study was threefold.
We assess and report the cropland C and N balances, including all associated fluxes such as CO2, N2O and NH3 emissions; NO3 leaching; and the soil carbon stock changes as demanded by Grosz et al. (2023).
We increase the robustness and trustworthiness of the balance modelling by assessing and quantifying the modelling uncertainty of the simulated C and N balances and flux estimations, as requested before by the IPCC (IPCC, 2019).
We present a regional uncertainty assessment methodology for C and N cycling to advance the balance modelling by propagating 500 joint parameter and input data distributions through the model (each representing a full regional C and N balance inventory simulation), yielding regional result distributions for any modelling estimations.
2.1 Model description
LandscapeDNDC is a modular, process-based ecosystem model for simulating the bio-geochemical change in C and N in cropland, forest and grassland systems at both the site scale and regional scale. The modules combined are about plant growth, micro-meteorology, water cycling, physico-chemical plant and microbial C and N cycling, and the exchange processes of the atmosphere and hydrosphere of terrestrial ecosystems. LandscapeDNDC is a generality of the plant development and soil biogeochemistry of the agricultural DNDC and Forest-DNDC (Li, 2000). There has been a successful application of earlier model versions in a number of studies, e.g. for water balance (Grote et al., 2009; Holst et al., 2010), for plant growth (Cameron et al., 2013; Werner et al., 2012), for NO3 leaching (Thomas et al., 2016; Kim et al., 2015), and for soil respiration and gas emission traces (Chirinda et al., 2011; Kraus et al., 2014; Molina-Herrera et al., 2015). For the initialization of LandscapeDNDC, physical and chemical site-specific soil profile information is used (specified for different soil depths): soil organic carbon (SOC) and nitrogen (SON) content, soil texture (clay, sand and silt content), the plant growth and soil biogeochemistry, bulk density, pH value, saturated hydraulic conductivity, field capacity, and wilting point. Daily or hourly climate data of air temperature (max, min and average), N deposition, precipitation and atmospheric CO2 concentration are used in LandscapeDNDC in combination with agricultural management practices; e.g. crop planting and harvesting, fertilization (synthetic and organic), or feed cutting and tilling are used to drive LandscapeDNDC simulations. Regarding fertilization management, three types of mineral fertilizers, namely urea, compound fertilizers based on NH4 and NO3, and organic amendments (i.e. green manure, farmyard manure, slurry, straw, bean cake and compost), are currently considered. The growth of crops and grasses is similar to the DNDC approach using two major parameters that describe seasonal plant development (cumulative-temperature degree days) and maximum reachable biomass under optimum conditions (Li, 2000), with daily growth limitations due to water and nutrient availability considered. Model parameters describing soil and vegetation characteristics are obtained from an external parameter library. In LandscapeDNDC, the parameterization of the main cultivated commodity crops in Europe is performed using default parameter sets representing an average plant type, while process parameter values for micro-meteorology, water cycle and bio-geochemical processes were obtained from previous validation studies (e.g. Molina-Herrera et al., 2016; Klatt et al., 2015; Rahn et al., 2012), proving that the LandscapeDNDC model could be universally applicable to similar conditions.
For all simulations in the current study, site-specific crop parameterizations were derived in a preceding analysis of various site-scale simulations and validations of yield characteristics across the region. An overview of the crops cultivated at the different study sites and detailed information on the specific crop rotations used to simulate crop growth are provided in Table S2 in the Supplement.
2.2 Case study description and input data
The region of Thessaly is located in central Greece, covering a total area of 14 000 km2, where 5000 km2 is lowland and approximately 2300 and 6500 km2 are semi-mountainous and mountainous land respectively. The plain of Thessaly is considered to be among the largest agricultural lands of the country (Kalivas et al., 2001), accounting for almost 410 000 ha, of which about 370 000 ha is arable land, where almost 80 % is covered by annual crops, and 10 % is covered by perennial crops (ELSTAT: https://www.statistics.gr/el/statistics/-/publication/SPG06/2012, last access: March 2017, 2021.). The crop or plant production of the region is around 14.2 % (ELSTAT, 2012) of the total production of the country (second in Greece).
Soil input data for the region were available from the European project NitroEurope IP (Sutton et al., 2013) based on the European Soil Database (ESDB, 2004) containing soil type and soil profile descriptions of bulk density, SOC content, texture (sand, silt clay), pH value, stone fraction, saturated hydraulic conductivity, wilting point and water-holding capacity for various soil strata (Cameron et al., 2013). A regional soil dataset for the area of interest contained about 1500 spatial polygons, out of which approximately 1000 covered the cultivated cropland that was finally simulated. The climate data for the regional simulations were derived at polygon level from gridded ERA5 climate data for Greece.
2.3 Agricultural management and model input data processing
The total cultivated area and the yields for the years 2010 to 2016, as used in the current analysis, were obtained from the Hellenic Statistical Authority (ELSTAT). Moreover, data associated with the animal capital for the indicated years were also provided (ELSTAT) in order to estimate the annual manure production in the region; however, no data are available on whether the manure is used in croplands and, if this is the case, how much of it is used. For the water management, the percentage of irrigated and non-irrigated land (estimated to be almost 50 % for each case) was also given (ELSTAT), while indicative sets of irrigation management data were acquired through the River Basin Management Plans of the Special Secretariat for Water – Ministry of Environment, Energy and Climate Change (YPEKA, Portmann et al., 2010). The irrigation water volumes were estimated based on the crop needs and the minimum and maximum quantities necessary (according to the literature) while using upscaling tools to obtain the regional values. The fertilization datasets were provided by the Fertilizer Producers and Merchandiser Association (FPMA) for recent years (2010–2016) and are equated to the national-scale annually consumed quantities scaled down to a regional level based on crop patterns in Thessaly's cultivated land.
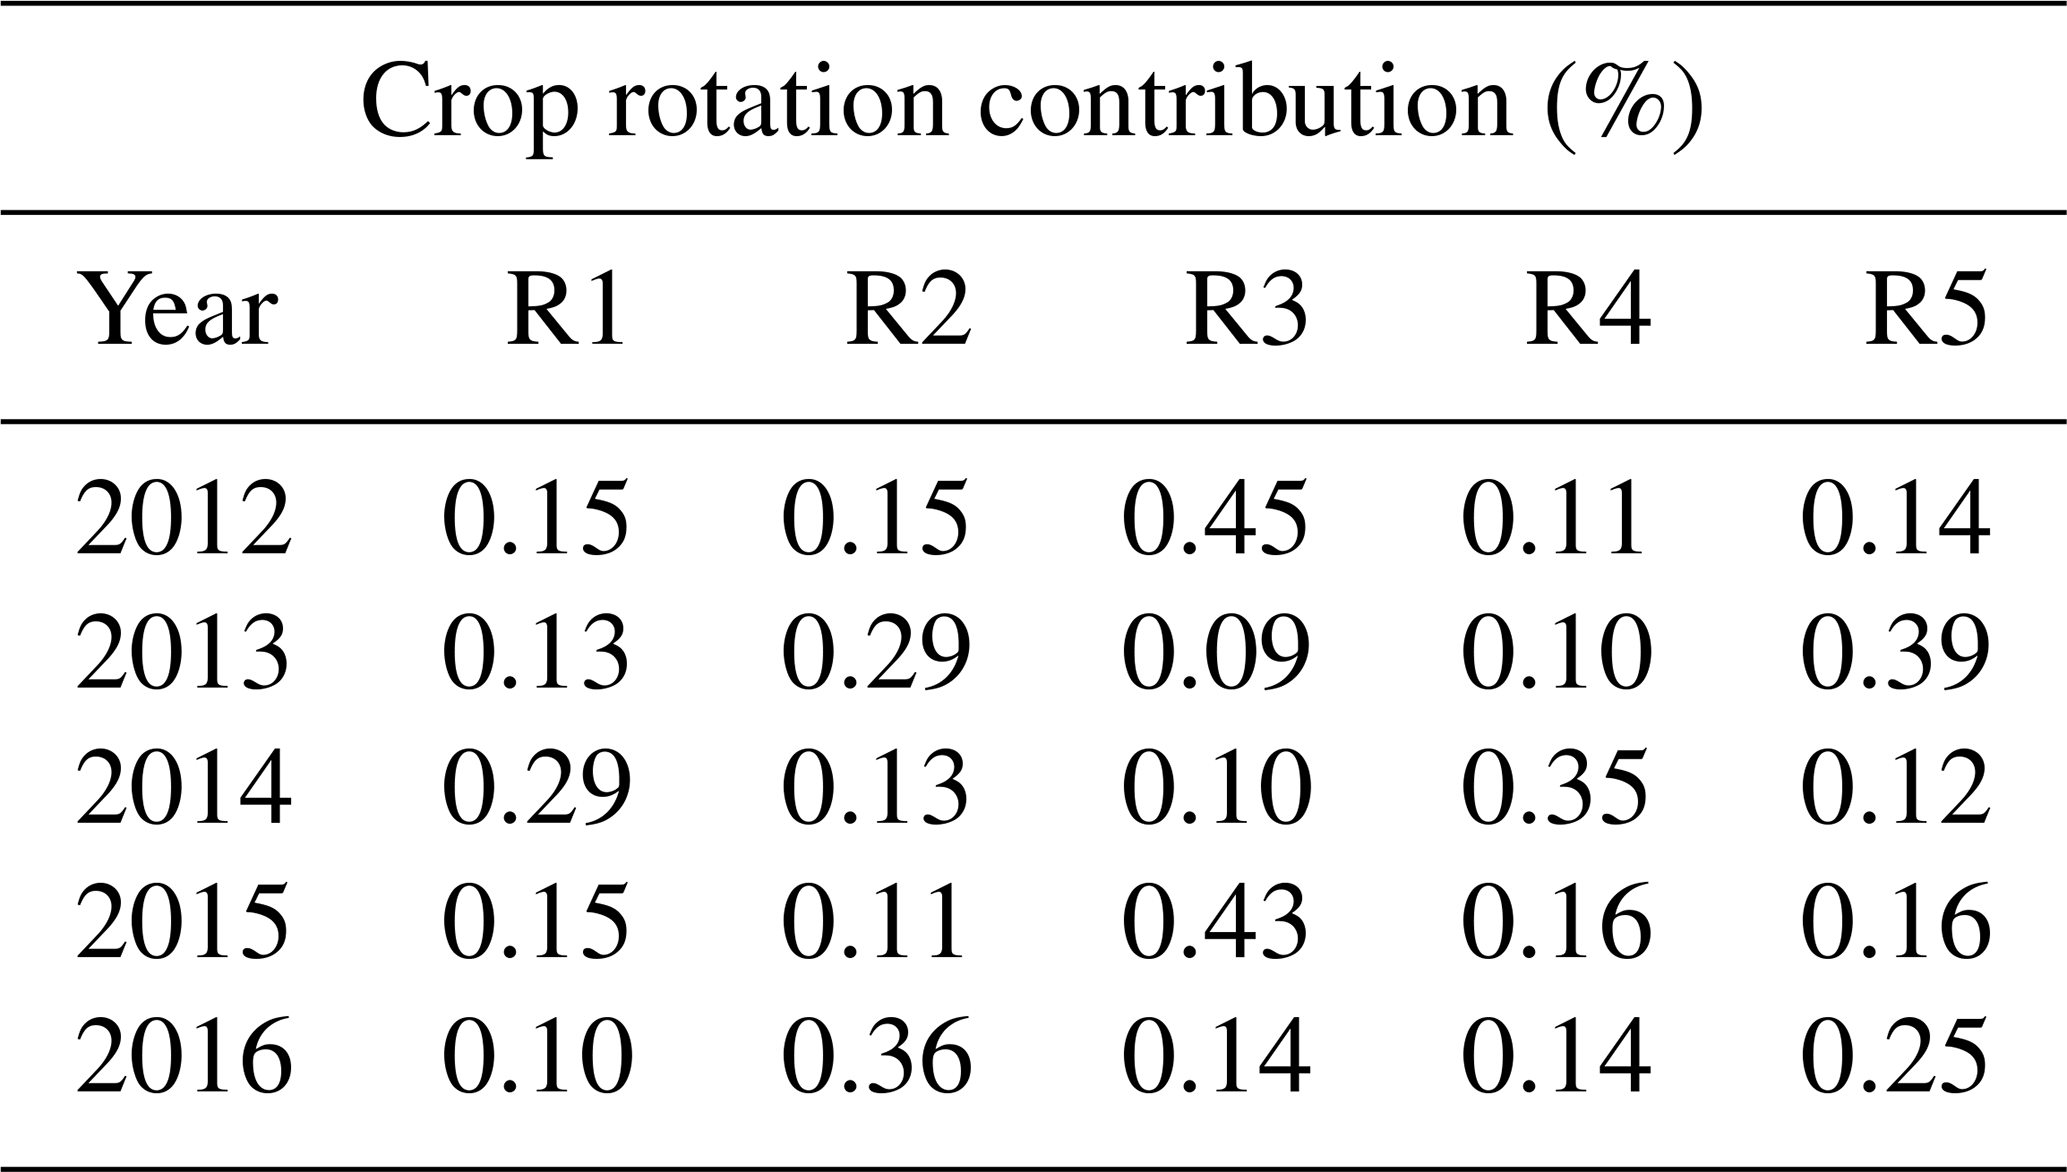
In this study, the five main crops of maize, wheat, clover, cotton and barley were considered, covering the majority of the cultivated arable land in the region (over 95 %), while the remaining cropland was included, acquiring the final corrected land–crop coverage. In Table 1, the resulting crop rotation scenarios (R1–R5) are presented for the evaluation period of 2012–2016. Note that each rotation sequence (R1–R5) is shifted in time such that, for each year, each crop appears in one rotation. Based on the crop cover contribution in each simulated year, the crop rotation contribution factors were estimated and are summarized in Table 2. The management practices were based on the general agricultural practices applied in the region and on information provided by farmers.
Table 1Summary of the crop rotation scenarios (R1–R5) for the region of Thessaly. The crop abbreviations corn, wiwh, clover, cott and wbar refer to maize (food corn and silage maize), winter wheat, clover (legume feed crops such as alfalfa or vetch), cotton and winter barley respectively.
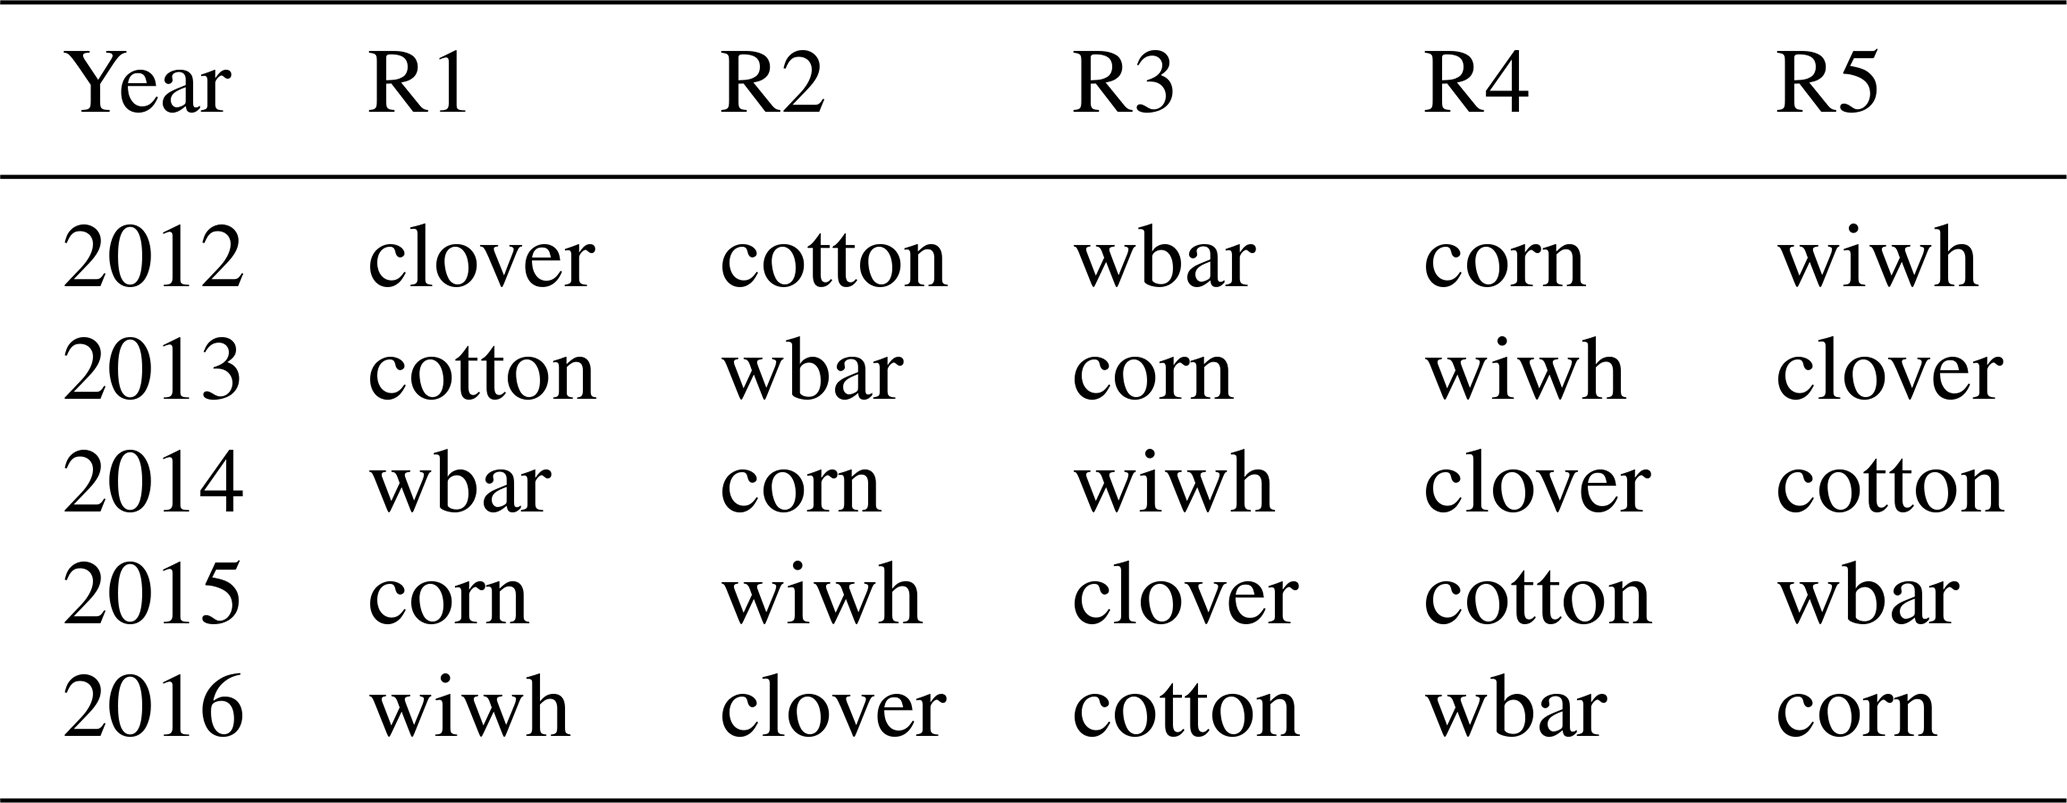
Table 2Crop cultivation area contribution per year to the aggregation of the five rotations; data constant across the region of Thessaly.
2.4 Uncertainty analysis
As stated in the IPCC 2006 guidelines, updated in 2019, the assessment of uncertainty is considered to be a major and crucial or mandatory component when compiling regional or national GHG emission inventories (Larocque et al., 2008). The difference in terms of the scale at which the model is used results in divergent errors in the C and N dynamic predictions across different climate zones and scales. Thus, uncertainty analysis is a crucial step towards a higher-quality decision-making process. The sources of uncertainty can vary and are related to (a) the initial conditions (starting values), (b) the drivers (e.g. climate and crop management data), (c) the conceptual model uncertainty and (d) the parameter uncertainty of the various processes (Refsgaard et al., 2007; Wang and Chen, 2012).
Santabárbara (2019) performed a Bayesian model calibration and uncertainty analysis using a Monte Carlo Markov chain (MCMC) approach targeting uncertainties associated with the data (bulk density, SOC, pH, clay content) of the initial soil conditions, drivers (cropland management such as fertilization or manure rates and timing, harvest and seeding timing, tillage timing) and bio-geochemical process parameterizations.
In order to identify the most sensitive process parameters with a reduced number of model simulations, the Morris method (Morris, 1991) obtains a hierarchy of parameter influences on a given output (gaseous N fluxes) and evaluates whether or not a non-linearity exists. Morris (1991) proposed that this order can be assessed through the statistical analysis of the changes in the model output that are produced by the one-step-at-a-time changes in n number of proposed parameters. Incremental steps in the number of parameters lead to the identification of parameters having substantial influence over the concerned results without neglecting that some effects could cancel each other out (Saltelli et al., 2000), leading to the identification of the 24 most sensitive process parameters (Myrgiotis et al., 2018b; Houska et al., 2017).
2.5 Metropolis – Hastings algorithm
The Markov Chain Monte carlo (MCMC) Metropolis–Hastings algorithm results in numerous parameter sets that approximate the posterior joint parameter distribution by performing a random walk through the space of joint parameter values. This probability evaluation of the data obtained from each step leads to the update of the initial uniform parameter distributions. Bayes' formula relating conditional probabilities may become a powerful and practical computational tool when combined with Markov chain processes and Monte Carlo methods or the so-called Markov Chain Monte carlo (MCMC) approach. A Markov chain is a special type of discrete stochastic process wherein the probability of an event depends only on the event that immediately precedes it. Integrating parameters (θ) and observation data (D) into Bayes' rule results in the following formula:
where P(D|θ), the probability of the data, is used to obtain the probability of these parameters updated by the data, P(θ|D), where the evidence is computed as
where P(D) can be numerically approximated with the aforementioned MCMC method (Robert and Casella, 2011).
The method uses prior knowledge concerning the sources of the model uncertainty to obtain a narrowed posterior distribution for each one of the sources. By propagating the parameter distributions through the model, the overall uncertainty in the model results can be quantified.
In a previous study by Santabárbara (2019), an extensive sensitivity analysis on all soil bio-geochemical process parameters, soil initial data and arable management data was performed, identifying the 24 most sensitive process parameters (listed in the Supplement), the most sensitive soil initial data (soil profile data on bulk density, soil organic carbon content and pH value) and the most sensitive management information (fertilization and manure N rates, tilling depth) in relation to aquatic and gaseous N fluxes from arable soils. This was depicted in the MCMC simulation through sampling a combination of 24 parameter values, 3 values of soil initial data and 3 items of management information. The sampling of the soil initial data and the management data was performed as perturbations to the existing data. For each quantity, a perturbation was sampled individually and applied to all corresponding values in the soil profile or to all years in the management description. The MCMC simulation performed by Santabárbara (2019) simulated more than 100 000 iterations for various arable sites until the MCMC simulation converged towards a stable combined posterior distribution of parameter values and soil and management input data perturbations. In the current analysis, we have sampled 500 joint parameter and input data perturbation sets from the posterior distributions reported by Santabárbara (2019), and we deployed them in simulations (propagation through the model) for the regional inventory, leading to 500 inventory simulations. Afterwards, a statistical analysis was applied to estimate the updated regional and temporal result distributions.
2.6 Statistical methods and data aggregation
2.6.1 Regional result aggregation
One full regional inventory simulation consists of 10 individual inventory simulations: five different crop rotations for irrigated conditions and five different crop rotations for rain-fed conditions were simulated in parallel (see Sect. 2.3). The results of the crop rotations were aggregated according to the crop shares per year (see Table 2), accounting for all the effects of the different crops cultivated in the region under irrigated and rain-fed conditions. The final inventory simulation results were obtained by considering irrigated versus rain-fed water management. The final inventory contains simulation results aggregated to area-weighted yearly means across the total simulation domain, accounting for the cropland area of each polygon.
2.6.2 Uncertainty quantification and statistical analysis
A regional aggregation was performed for all 500 uncertainty simulations. All the uncertainty results were finally reported via statistical measures evaluating the 500 regional uncertainty simulation runs reporting mean values, standard deviations, medians, and the 25th and 75th interquartile ranges (IQRs, Q25 to Q75).
The simulation time span was from 2009 to 2016, while the years 2009–2011 were used as spin-up to get all soil C and N pools into equilibrium after the initialization. Therefore, reported simulation results are limited to the years 2012–2016. The assessment of the regional C and N balances (CB and NB) were obtained and, as a consequence of the uncertainty quantification, resulted in distributions; they were therefore reported by statistical measures such as the mean and/or median or interquartile ranges of the uncertainty ensemble.
3.1 Regional yield simulations and validation
The evaluation of the model performance in estimating the NB and CB components was analysed based on the comparison of the simulated yield values with the observed yield data provided by the Hellenic Statistical Authority (ELSTAT), averaged for the total simulated period.
Crop yields and feed production
For model validation, datasets of crop yields from the Hellenic Statistical Authority (ELSTAT) were used. Table 3 summarizes the aggregated regional crop yields for all the simulated years and the respective mean, median and standard deviation values that resulted from the statistical analysis of the simulation results together with the observed yield and feed production provided by the Hellenic Statistical Authority (ELSTAT). Simulated yields consist of the cotton bolls of cotton; the clover feed, which is the total cut and harvested aboveground biomass; the grain yield of wheat and barley; and the grain ear and the stems of maize. Based on the observations, maize appears to be the dominant crop, with an average yield of 12 t ha−1, followed by clover products at 8.4 t ha−1. The rest of the three crop yields appear to be of the same order of magnitude from 3.3 up to 3.4 t ha−1.
Table 3Simulated and observed yields and feed production (t dry matter ha−1) in the region of Thessaly. All results are based on statistical aggregation across all polygons, rotations and years and, finally, across all 500 UA (uncertainty analysis) inventory simulations. The observed values of dry matter (DM) are provided by the Hellenic Statistical Authority.
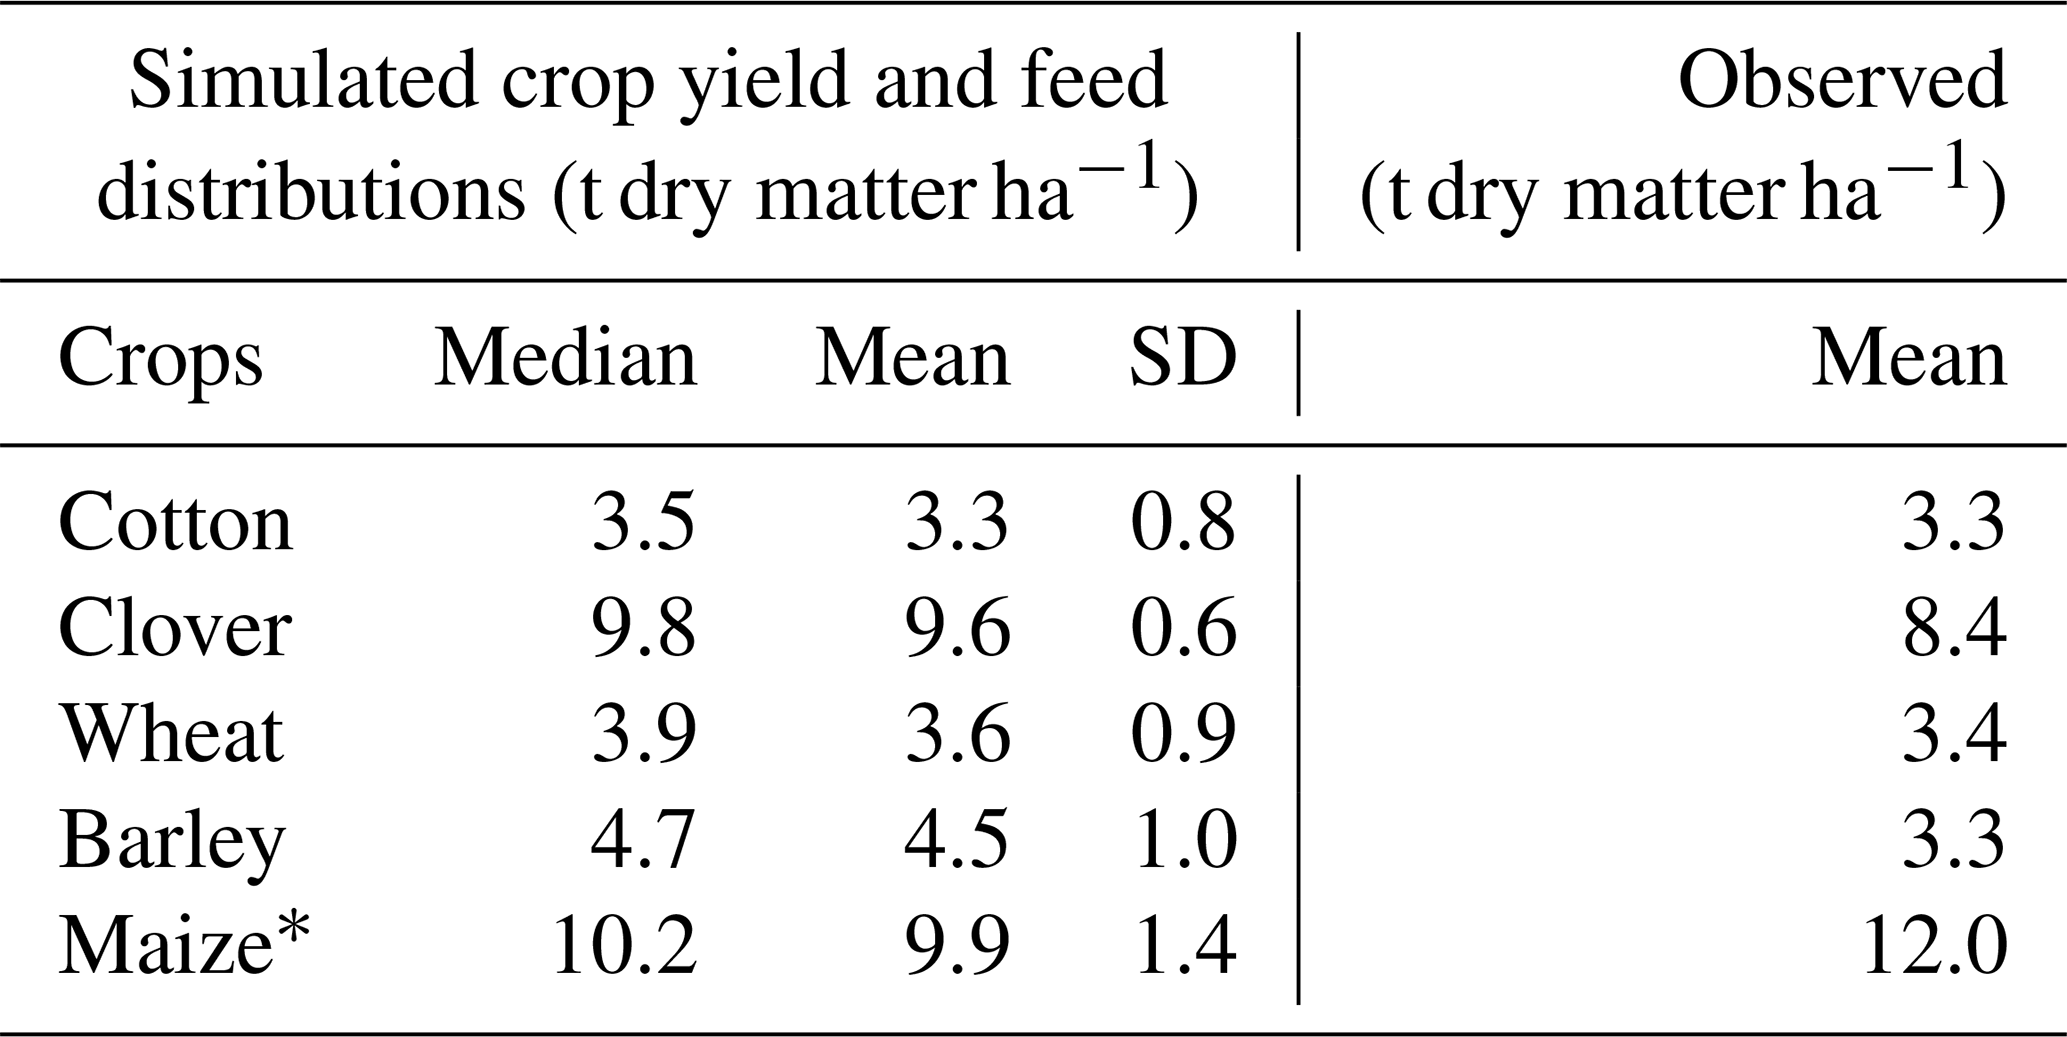
* Observation data for maize did not distinguish between food corn and silage maize.
Additionally, the simulated average yield of cotton was estimated to be 3.3 ± 0.8 t DM ha−1, the simulated average yield of wheat was estimated to be 3.6 ± 0.9 t DM ha−1, the simulated average yield of barley was estimated to be 4.5 ± 1 t DM ha−1, and the simulated average yield of maize was estimated to be 9.9 ± 1.4 t DM ha−1. As for the feed, the clover was estimated to be 9.6 ± 0.6 t DM ha−1. The average nitrogen use efficiency (NUE) across time and space is 63.29 %.
Figure 1 presents the uncertainties of the simulated crop yield across the whole evaluation time span of 2012–2016 in both irrigated and rain-fed conditions. As shown, corn shows a much more narrow distribution with a higher median for the irrigated scenario compared to the rain feed. On the contrary, winter barley has a wider distribution and a slightly higher median for the irrigated scenario and, also, a wider extreme value variation. As for cotton, the distribution appears to be bimodal for the rain-fed scenario, in which the median is also lower than the one in the irrigated scenario. In addition, the extreme value variation is wider in the latter case. Finally, for the example of winter wheat, the irrigated and rain-fed scenarios reach the same results.
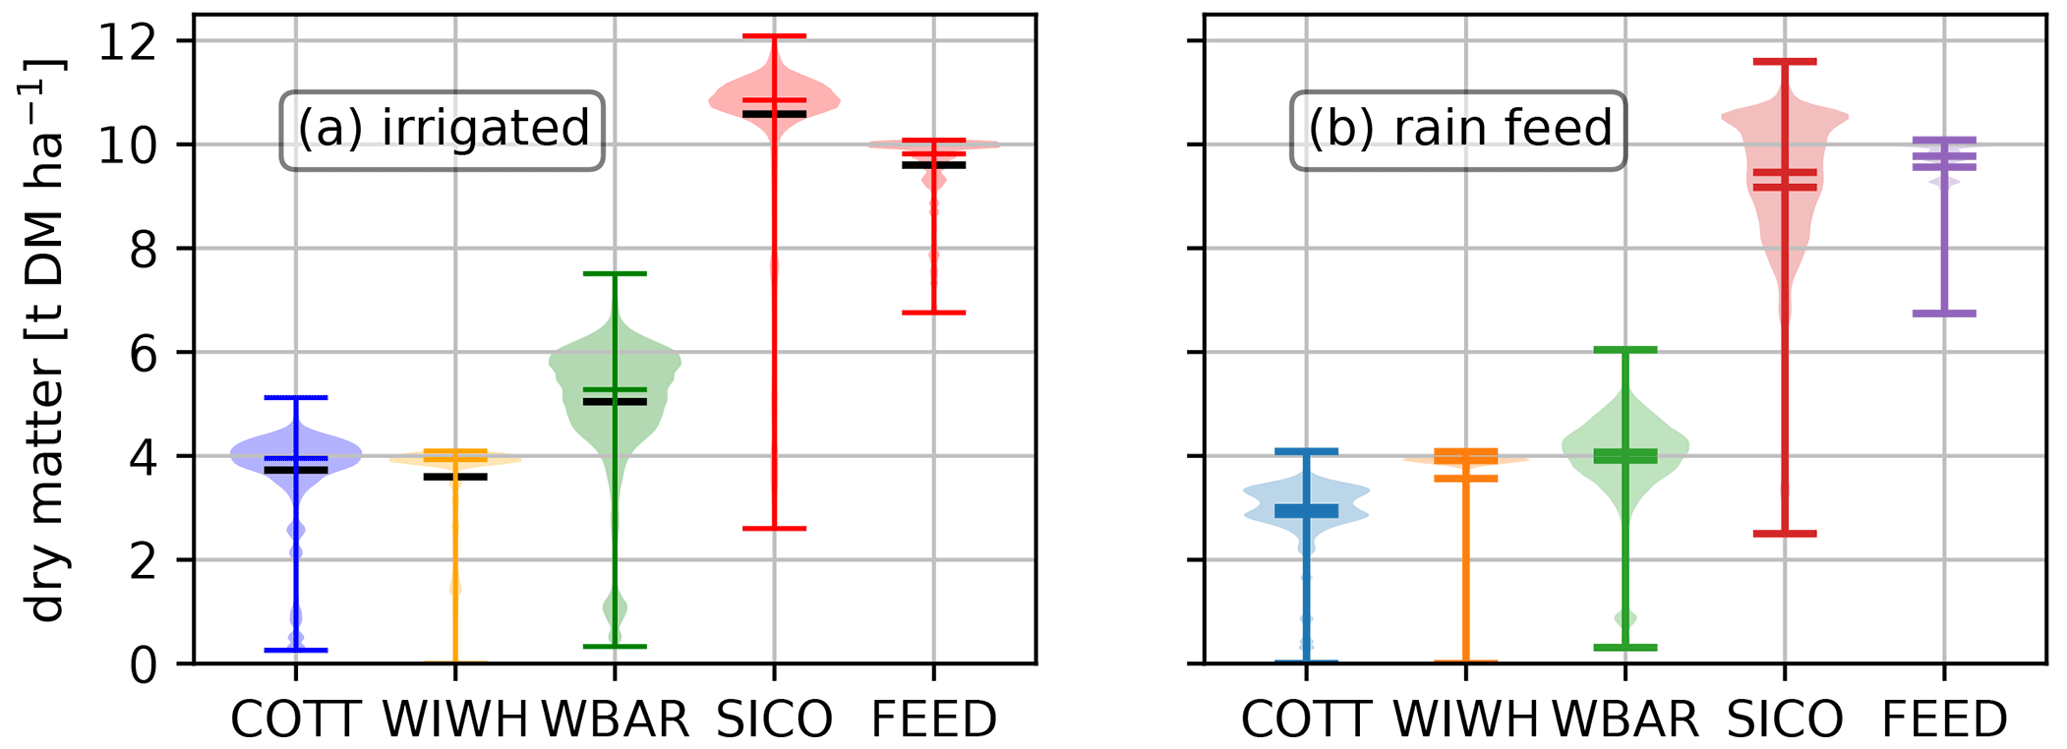
Figure 1Simulated crop yield uncertainties across the evaluation time span of 2012–2016 for (a) irrigated and (b) rain-fed conditions. Horizontal lines indicate the median, mean, maximum and minimum values of the distributions.
3.2 Regional carbon and nitrogen balance
3.2.1 Carbon balance (CB)
For the CB, Fig. 2 presents average C input fluxes into the soil of 12.4 ± 1.4 t C ha−1 yr−1 (with an interquartile range (IQR) (from Q25 to Q75) of 12.1 to 13.2 t C ha−1 yr−1) and output fluxes of 11.9 ± 1.3 t C ha−1 yr−1 (with an IQR from 11.6 to 12.7 t C ha−1 yr−1). The resulting carbon sequestration was estimated to be 0.5 ± 0.3 t C ha−1 yr−1, with an IQR from 0.4 to 0.7 t C ha−1 yr−1 (data summarized in Table 4).
Figure 2Carbon balance for cropland cultivation for the region of Thessaly: (a) averaged carbon balance (in t C ha−1), (b) total carbon balance of cropland soils (in mio. t C) and (c) averaged fluxes across the region and the years 2012–2016. Positive change indicates soil C sequestration.
The input fluxes consist of annual gross primary productivity (GPP) of 11.7 ± 1.4 t C ha−1 yr−1, with an IQR from 11.4 to 12.4 t C ha−1 yr−1, and the carbon in manure applied to soils is estimated to be 0.7 ± 0.001 t C ha−1 yr−1 (see Table 4). This compares, on the other hand, to respirative carbon fluxes from the soil to the atmosphere (TER) of 8.5 ± 1.1 t C ha−1 yr−1, with an IQR from 8.2 to 9.1 t C ha−1 yr−1, and carbon fluxes via exported crop yields and feed (including all straws and removed crop residues) of 3.4 ± 0.3 t C ha−1 yr−1, with an IQR from 3.4 to 3.6 t C ha−1 yr−1. The aggregation of the carbon fluxes to the regional level of approximately 360 000 ha of cropland results in 4.25 ± 0.20Ṁ t C yr−1 in terms of GPP and 0.25 ± 0.01 M t C yr−1 of carbon influx via organic fertilizers compared to 3.08 ± 2.97 M t C yr−1 of TER and 1.24 ± 0.05 M t C yr−1 of carbon exports via crop yields and feed production, leading to a net carbon sequestration of 0.5 ± 0.3 M t C ha−1 yr−1, with an IQR from 0.4 to 0.7 M t C ha−1 yr−1 (M t C indicates million tonnes of carbon).
Table 4Carbon balance (per hectare) assessment and uncertainty analysis of the of cropland cultivation in the region of Thessaly, Greece. The 1 mean; 2 standard deviation; 3 median; 4 Q25, 25th quartile; and 5 Q75, 75th quartile are applied across the 500 values for the quantities in this table. 6 C inputs as the sum of the absolute values of all the input fluxes of the 500 simulations. 7 C outputs as the sum of the absolute values of all the output fluxes of the 500 simulations. 8 SOC changes as the difference between the input and output fluxes of each of the 500 simulations. Note that the underlying arable management or crop rotations include the ploughing-in of a perennial feed crop leading to large C inputs to the soil.
3.2.2 Nitrogen balance (NB)
In Fig. 3, the assessment of the distribution of the NB with the in- and outfluxes is presented. The averaged nitrogen influx (represented by the uncertainty ensemble mean) per hectare was estimated to be 212.3 ± 9.1 kg N ha−1 yr−1, with an IQR from 203.3 to 220.0 kg N ha−1 yr−1, while nitrogen outfluxes were estimated, on average, to be 198.3 ± 11.2 kg N ha−1 yr−1, with an IQR from 191.4 to 204.0 kg N ha−1 yr−1 (Fig. 3), leading to a net N accumulation in the soil of 14.0 ± 2.1 kg N ha−1 yr−1, with an IQR from 11.9 to 16.0 kg N ha−1 yr1.
Figure 3Nitrogen balance for cropland cultivation for the region of Thessaly: (a) total NB (in k t N) and (b) averaged NB (in kg N ha−1). Data are averaged for the years 2012-2016. Horizontal lines indicate the mean (red), median, and minimum and maximum of the distribution.
Table 5Nitrogen balance (per hectare). Summary of the assessment and uncertainty analysis of the NB fluxes (per hectare) of cropland cultivation in the region of Thessaly, Greece. 1 N inputs as the sum of the absolute values of all input fluxes of the 500 simulations. 2 N outputs as the sum of the absolute values of all the output fluxes of the 500 simulations. 3 N stock changes as the difference between the input and output fluxes of each of the 500 simulations. 4 Gaseous emissions are the sum of N2O, NO, N2 and NH3 fluxes. 5 Aquatic flux is nitrate leaching (NO).
The N influx was composed of the input of synthetic fertilizer of 80.2 ± 4.8 kg N ha−1 yr−1 (IQR 76.6 to 82.7) and the input of organic fertilizer of 80.2 ± 3.6 kg N ha−1 yr−1 (IQR from 77.5 to 82.7), followed by the biological nitrogen fixation (BNF) via legumes, estimated to be 45.6 ± 4.3 kg N ha−1 yr−1 (IQR from 43.7 to 47.7), and nitrogen deposition of 6.3 ± 0.8 kg N ha−1 yr−1 (IQR from 6.0 to 6.8). Thus, almost 75 % of the nitrogen input influx is related to the fertilization (mineral and organic), whilst the minor part that corresponds to nitrogen fixation and deposition approximates to 25 %.
The N outflux consist of gaseous N fluxes of 55.4 ± 8.8 kg N ha−1 yr−1 (IQR from 48.9 to 61.6); aquatic N fluxes (only nitrate leaching into surface waters was considered) of 14.1 ± 4.5 kg N ha−1 yr−1 (IQR from 11.0 to 17.0); and N fluxes of N removed in yields, straw and feed of 128.8 ± 8.5 kg N ha−1 yr−1 (IQR of 125.2 to 131.7) (see Fig. 4 and Table 5). Based on the aforementioned results, all gaseous and aquatic N fluxes correspond to about 28 % and 7 % of the N output flux respectively, while the far-largest N output flux was N removed in yields, straw and feed, representing almost 65 % of the N outflux (Fig. 4).
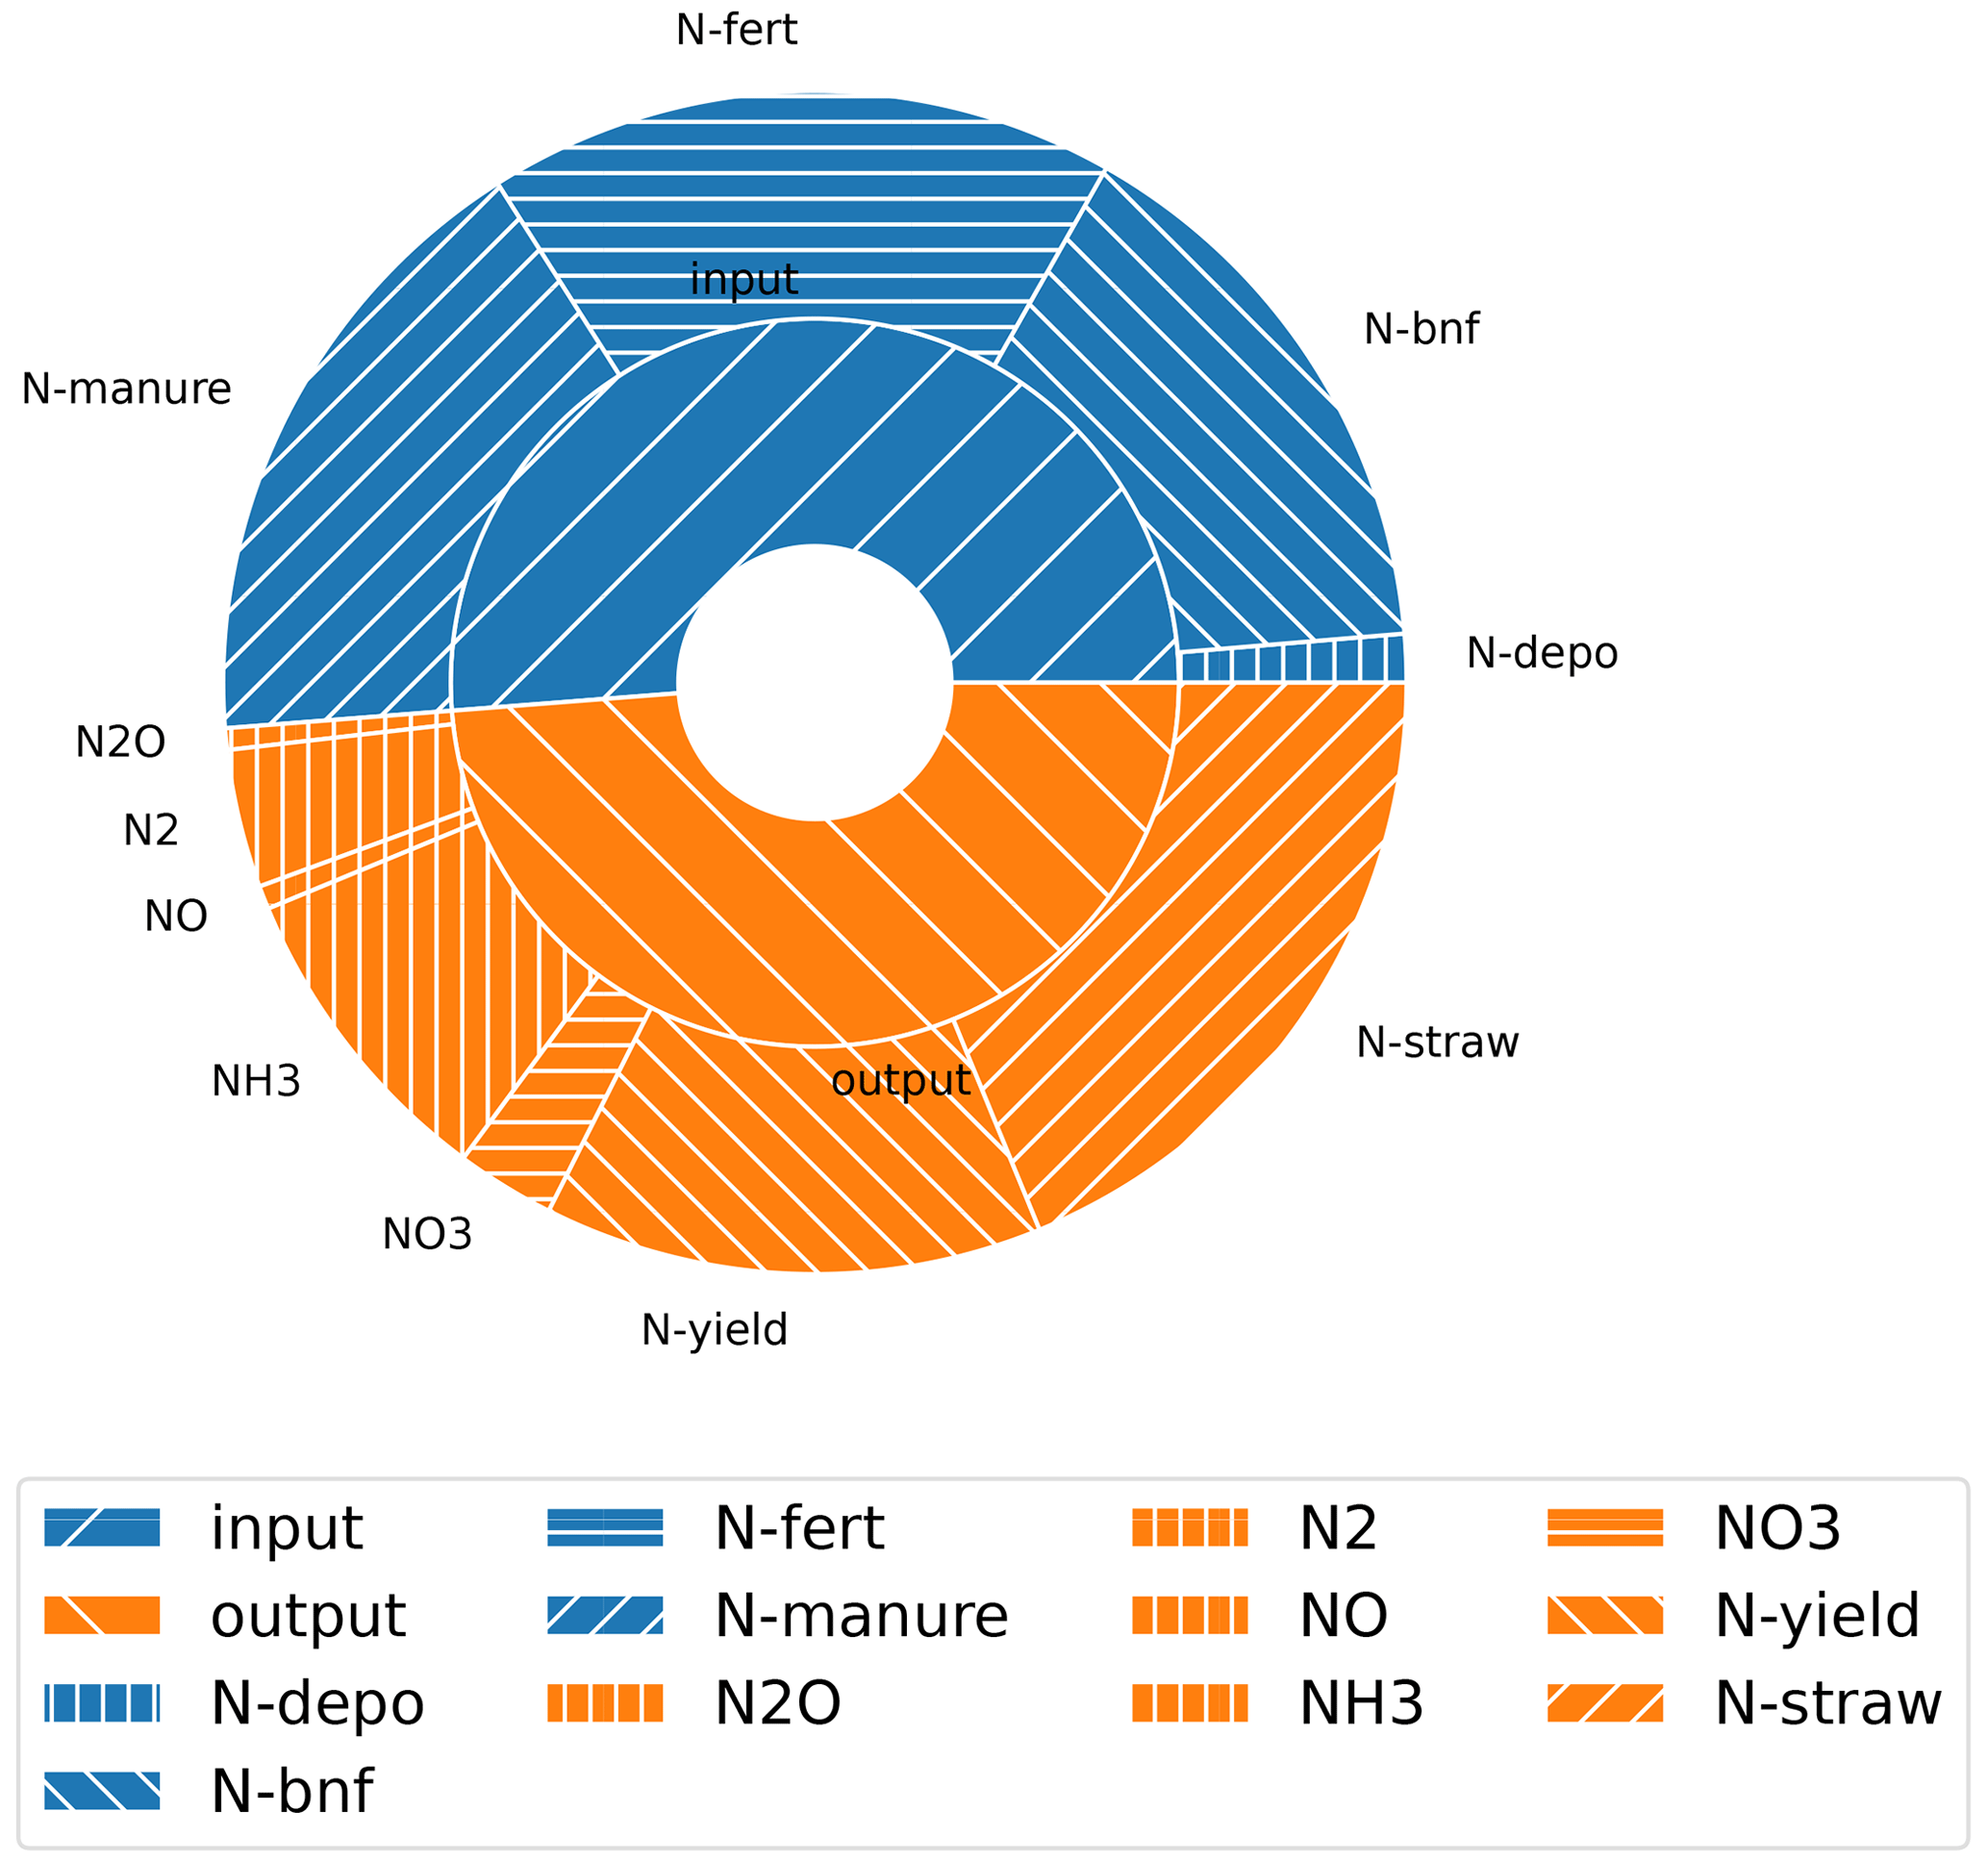
Figure 4Averaged annual nitrogen balance (inner ring of the pie diagram) and their decomposition into the various components of the N fluxes (outer ring of the pie diagram); all data are summarized in Table 5.
The simulated gaseous fluxes were composed of N2O emissions estimated to be 2.6 ± 0.8 kg N2O–N ha−1 yr−1 (IQR from 2.1 to 3.1), NO emissions of 3.2 ± 1.5 kg NO–N ha−1 yr−1 (IQR from 2.0 to 4.1), N2 emissions of 15.5 ± 7.0 kg N2–N ha−1 yr−1 (IQR range from 9.9 to 20.7) and NH3 emissions of 34.0 ± 6.7 kg NH3–N ha−1 yr−1 (IQR from 29.3 to 36.9). Ammonia volatilization represents the largest share (61.48 %) of gaseous N losses, with the highest densities in the emission distribution between approximately 25 and 35 kg N ha−1, followed by di-nitrogen losses (28.03 %) of gaseous N losses, with a much wider emission variability in the distribution, followed by NO3 (5.79 %) and N2O (4.7 %). Figure 5 shows the overall NB in a waterfall diagram adding up cumulatively all in- and outfluxes, illustrating the uncertainty distribution of each flux contribution. The waterfall diagram illustrates the overall outcome of the NB, an N accumulation into the soil as the difference between all outfluxes minus all influxes.
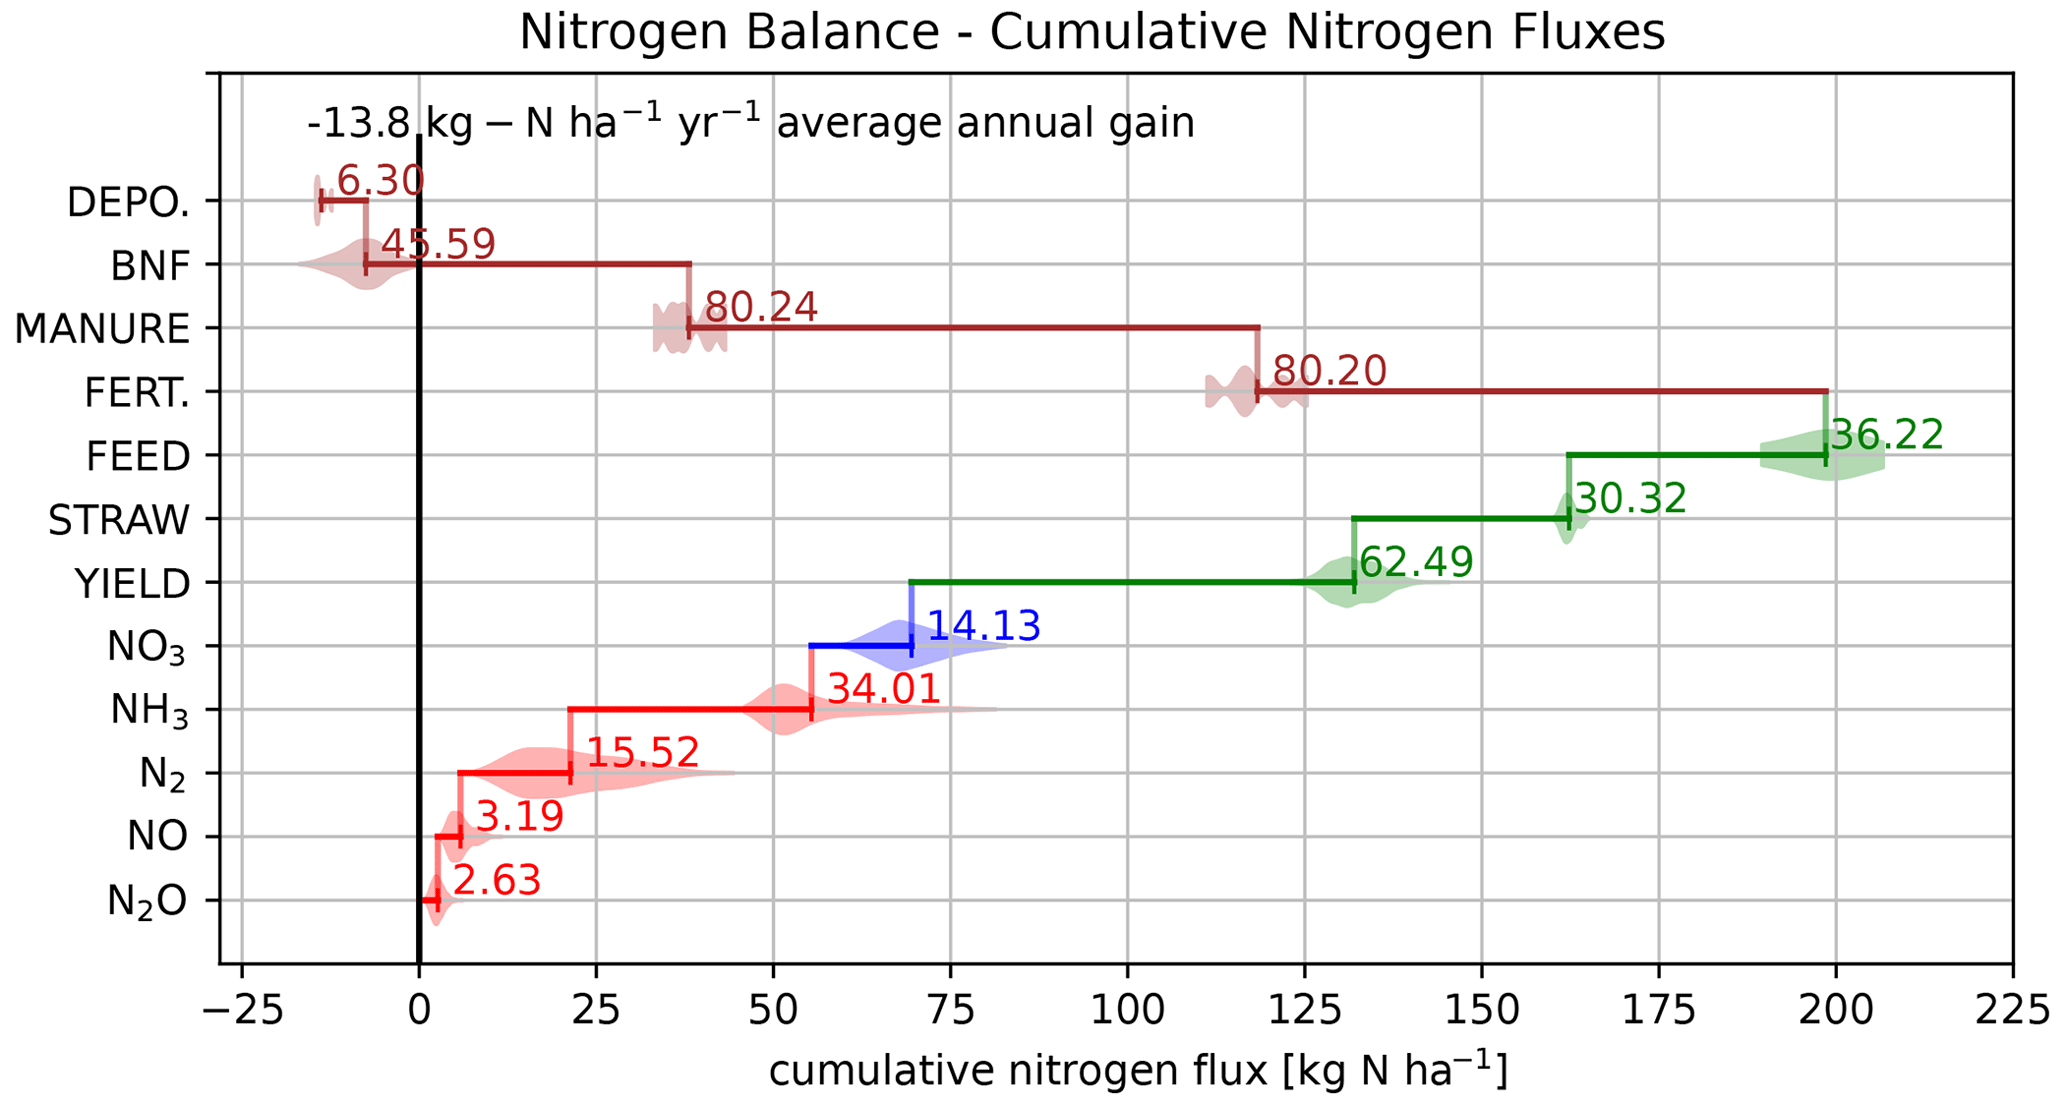
Figure 5Waterfall representation of the result distributions of the different nitrogen in- and outfluxes of the cropland cultivation in Thessaly. Vertical lines in the distributions indicate mean values of the corresponding N flux. Red indicates gaseous outfluxes; blue indicates aquatic fluxes; green indicates biomass yield and feed production outfluxes; and brown indicates indicates N influxes such as synthetic N fertilizer, N manure, biological N fixation (BNF) and N deposition. The resulting N sink of the nitrogen balance (based on distribution means) is −13.8 kg N ha−1 yr−1. A negative value indicates flux into the soil.
The nitrate-leaching mean estimate was 14.1 ± 4.5 kg NO3–N ha−1 yr−1 (IQR from 11.0 to 17.0) with a bell-shaped distribution.
Total yield and biomass (straw and feed) N export fluxes were 62.4 ± 4.4 kg N ha−1 yr−1, with uncertainty ranges from 59.9 to 65.1, consisting of yield N exports (grains and cotton balls) of 30.3 ± 1.7 kg N ha−1 yr−1 (IQR from 29.6 to 30.9) and straw and feed N exports of 36.1 ± 6.0 kg N ha−1 yr−1 (IQR from 34.9 to 37.6). The result distributions for yield N are notably bell shaped; for feed biomass N, they are very moderately bell shaped and well distributed within the bounds; and for straw N, they are very sharp within a comparably small interval.
Figure 5 illustrates the cumulative nitrogen fluxes of which the NB is composed as a waterfall diagram considering the mean of each component. The NB results in a net N sink of 13.8 kg N ha−1 yr−1 (see result distribution in Fig. 6) for the region, corresponding to an annual carbon sequestration of approximately 0.5 t C ha−1 yr−1 (as depicted in Fig. 2b) (see also the annual dynamics of the topsoil (3 cm) soil organic carbon and nitrogen distributions in Fig. 8).
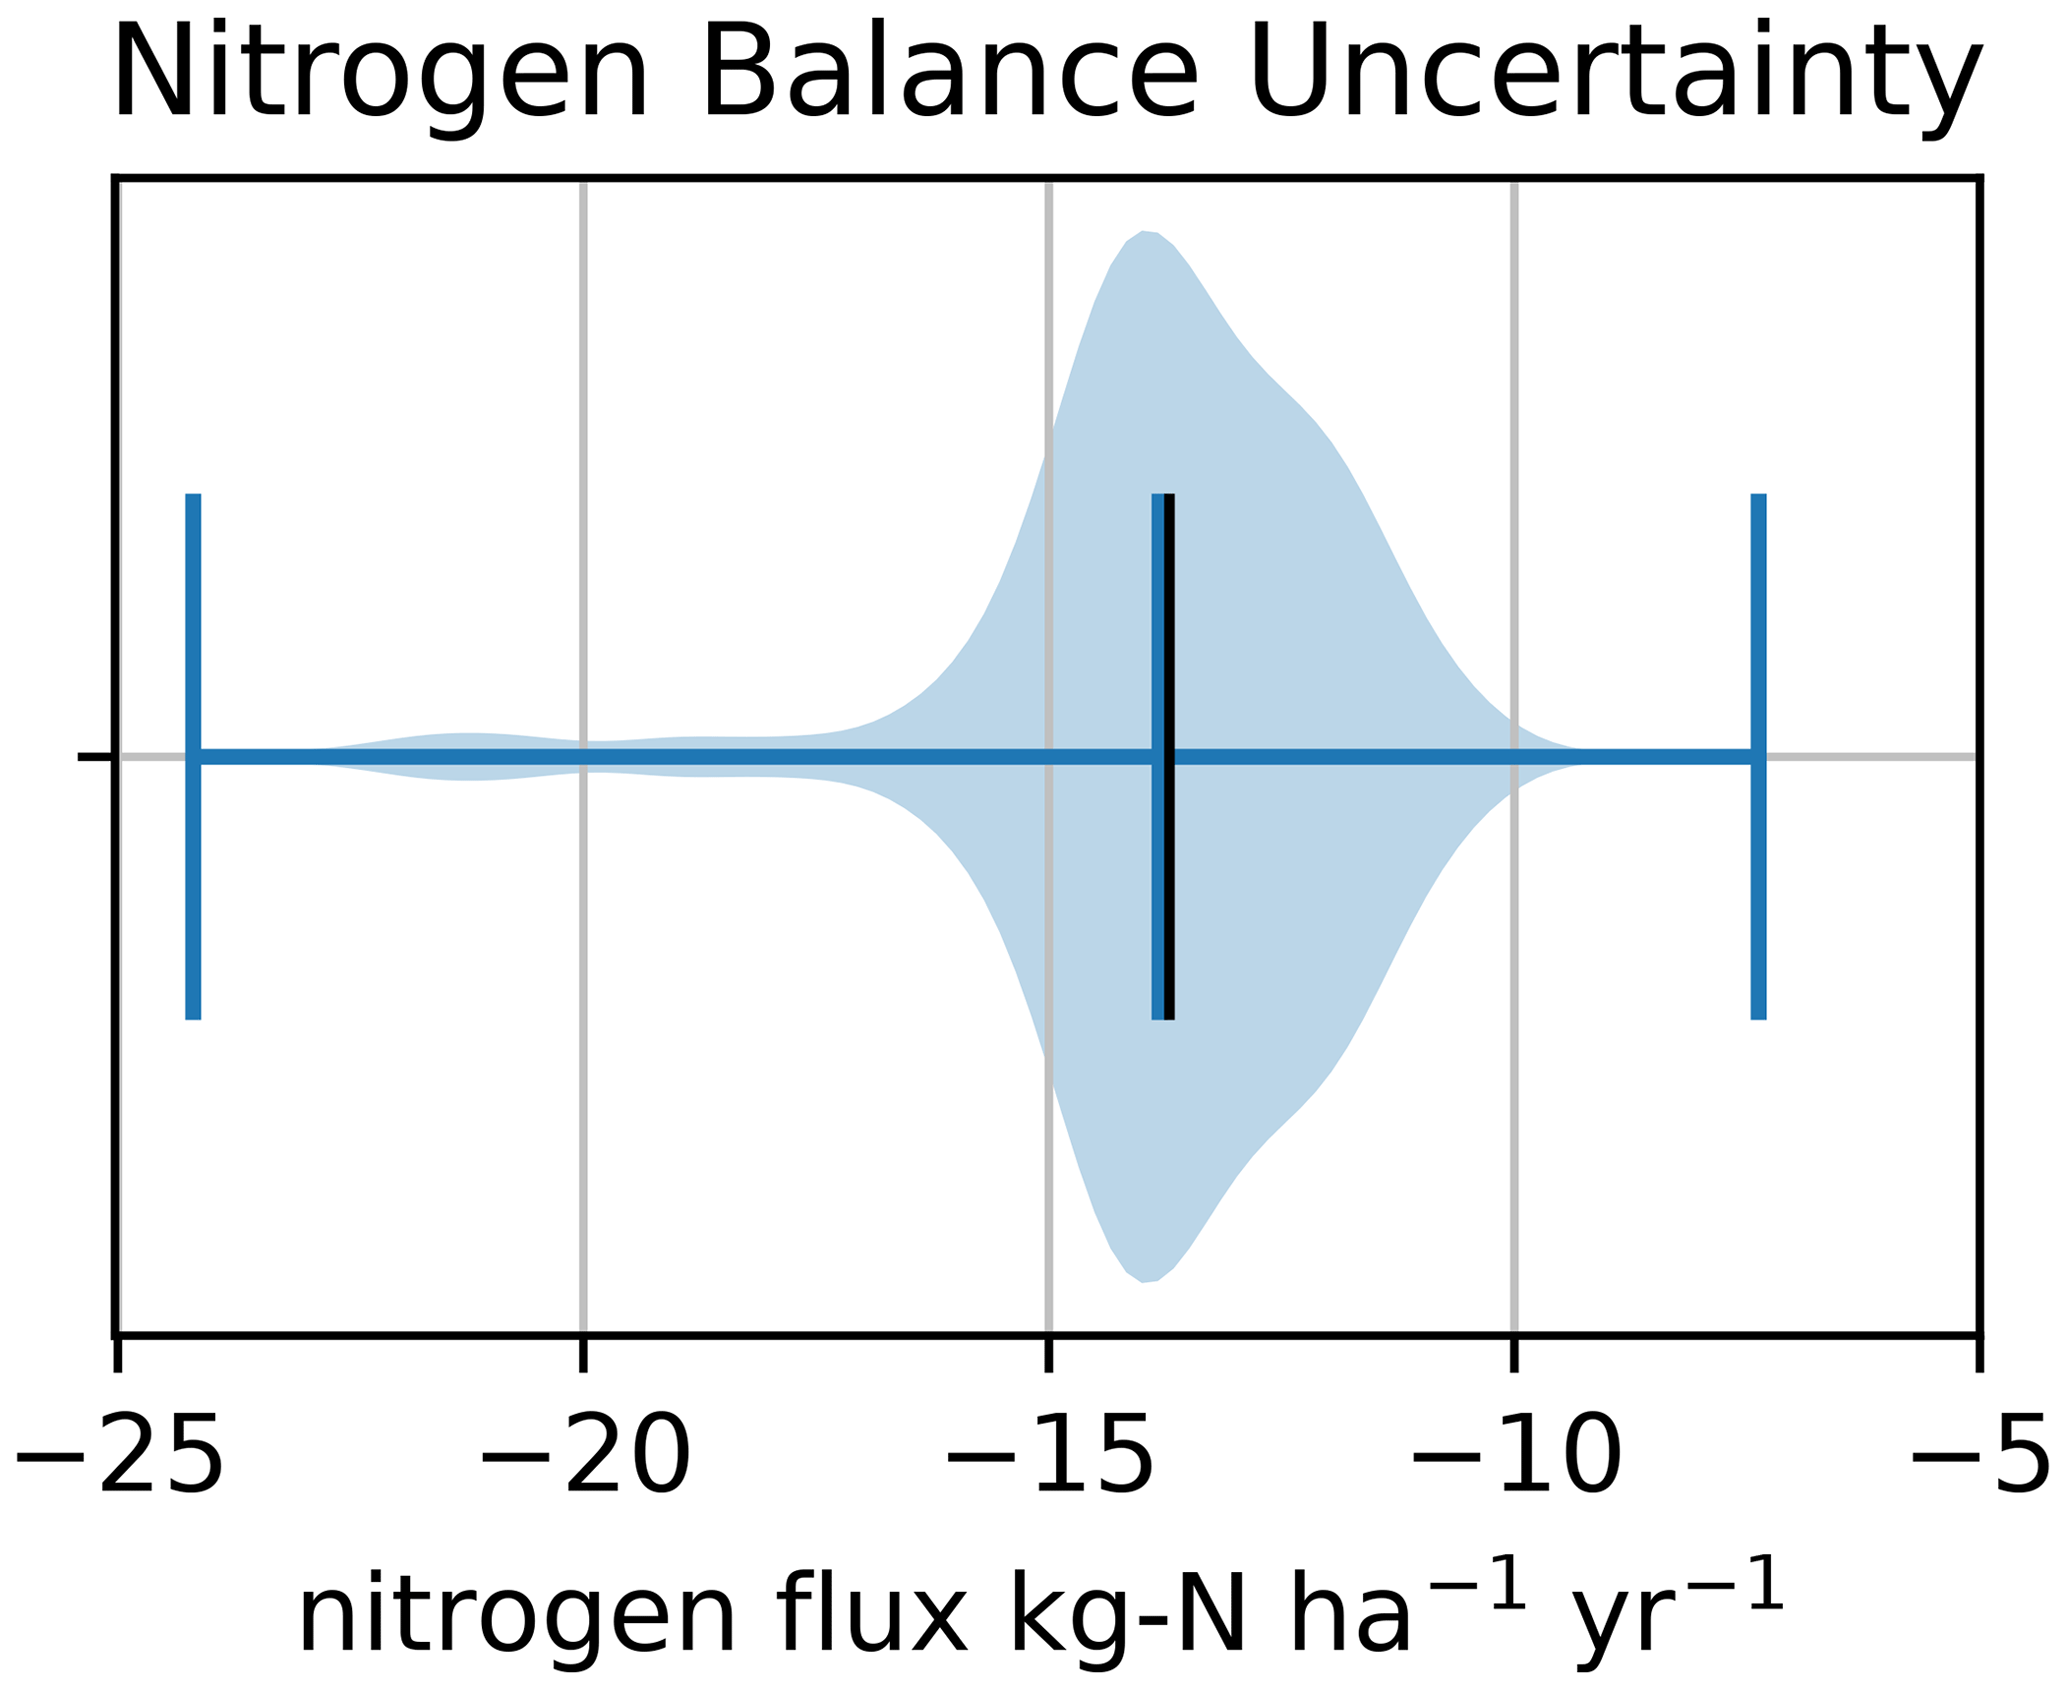
Figure 6Distribution of the overall nitrogen balance of the cropland cultivation in Thessaly: statistical analysis across all 500 individual NB results of the inventory simulations (mean 13.8 kg N ha−1 yr−1, median 13.7 kg N ha−1 yr−1) corresponding to the carbon balance in Fig. 2.
Figures 7 and 8 show the dynamics of the annual distribution of the gaseous and aquatic outfluxes, as well as the dynamics of the annual distributions of the topsoil (30 cm) soil organic carbon and nitrogen pools for the evaluation period 2011–2016.
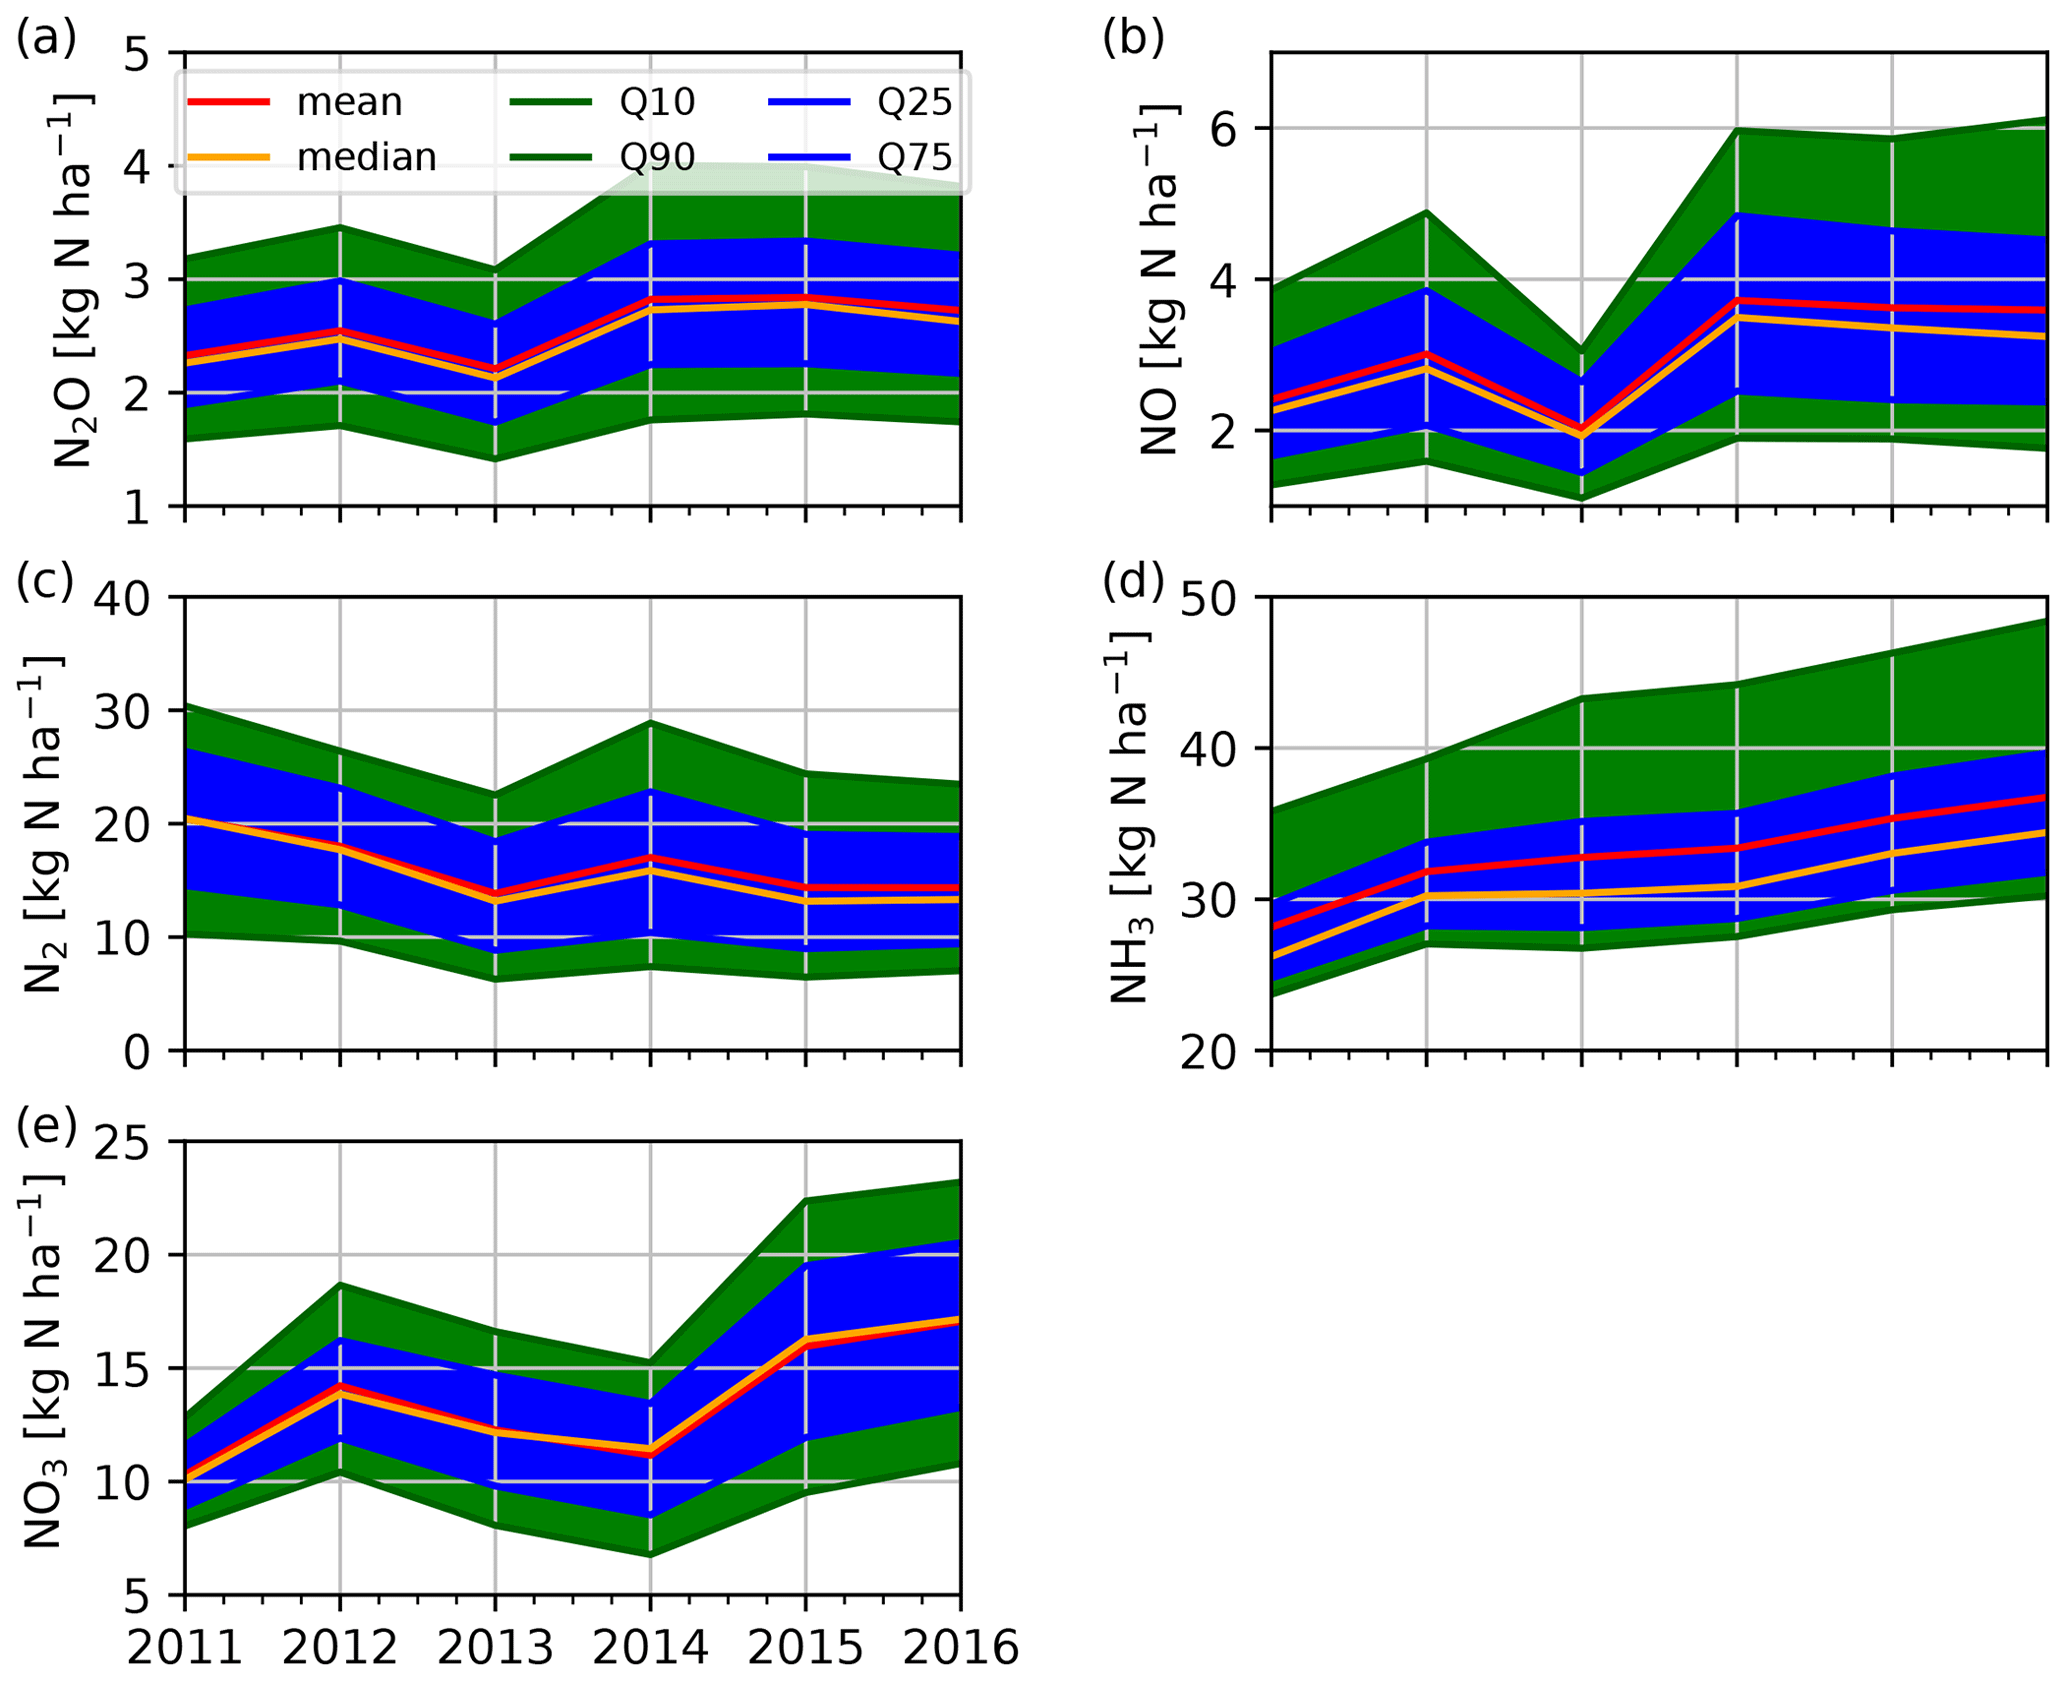
Figure 7Annual dynamics of the uncertainty distributions of the gaseous (a–d) and aquatic (e) N outfluxes for the period 2011–2016. Uncertainty bandwidth (blue band) is defined as the range between the Q25 and the Q75 quartiles; the green band (Q10 to Q90 interval) indicates the variance of the fluxes, neglecting the outliers of the distribution.
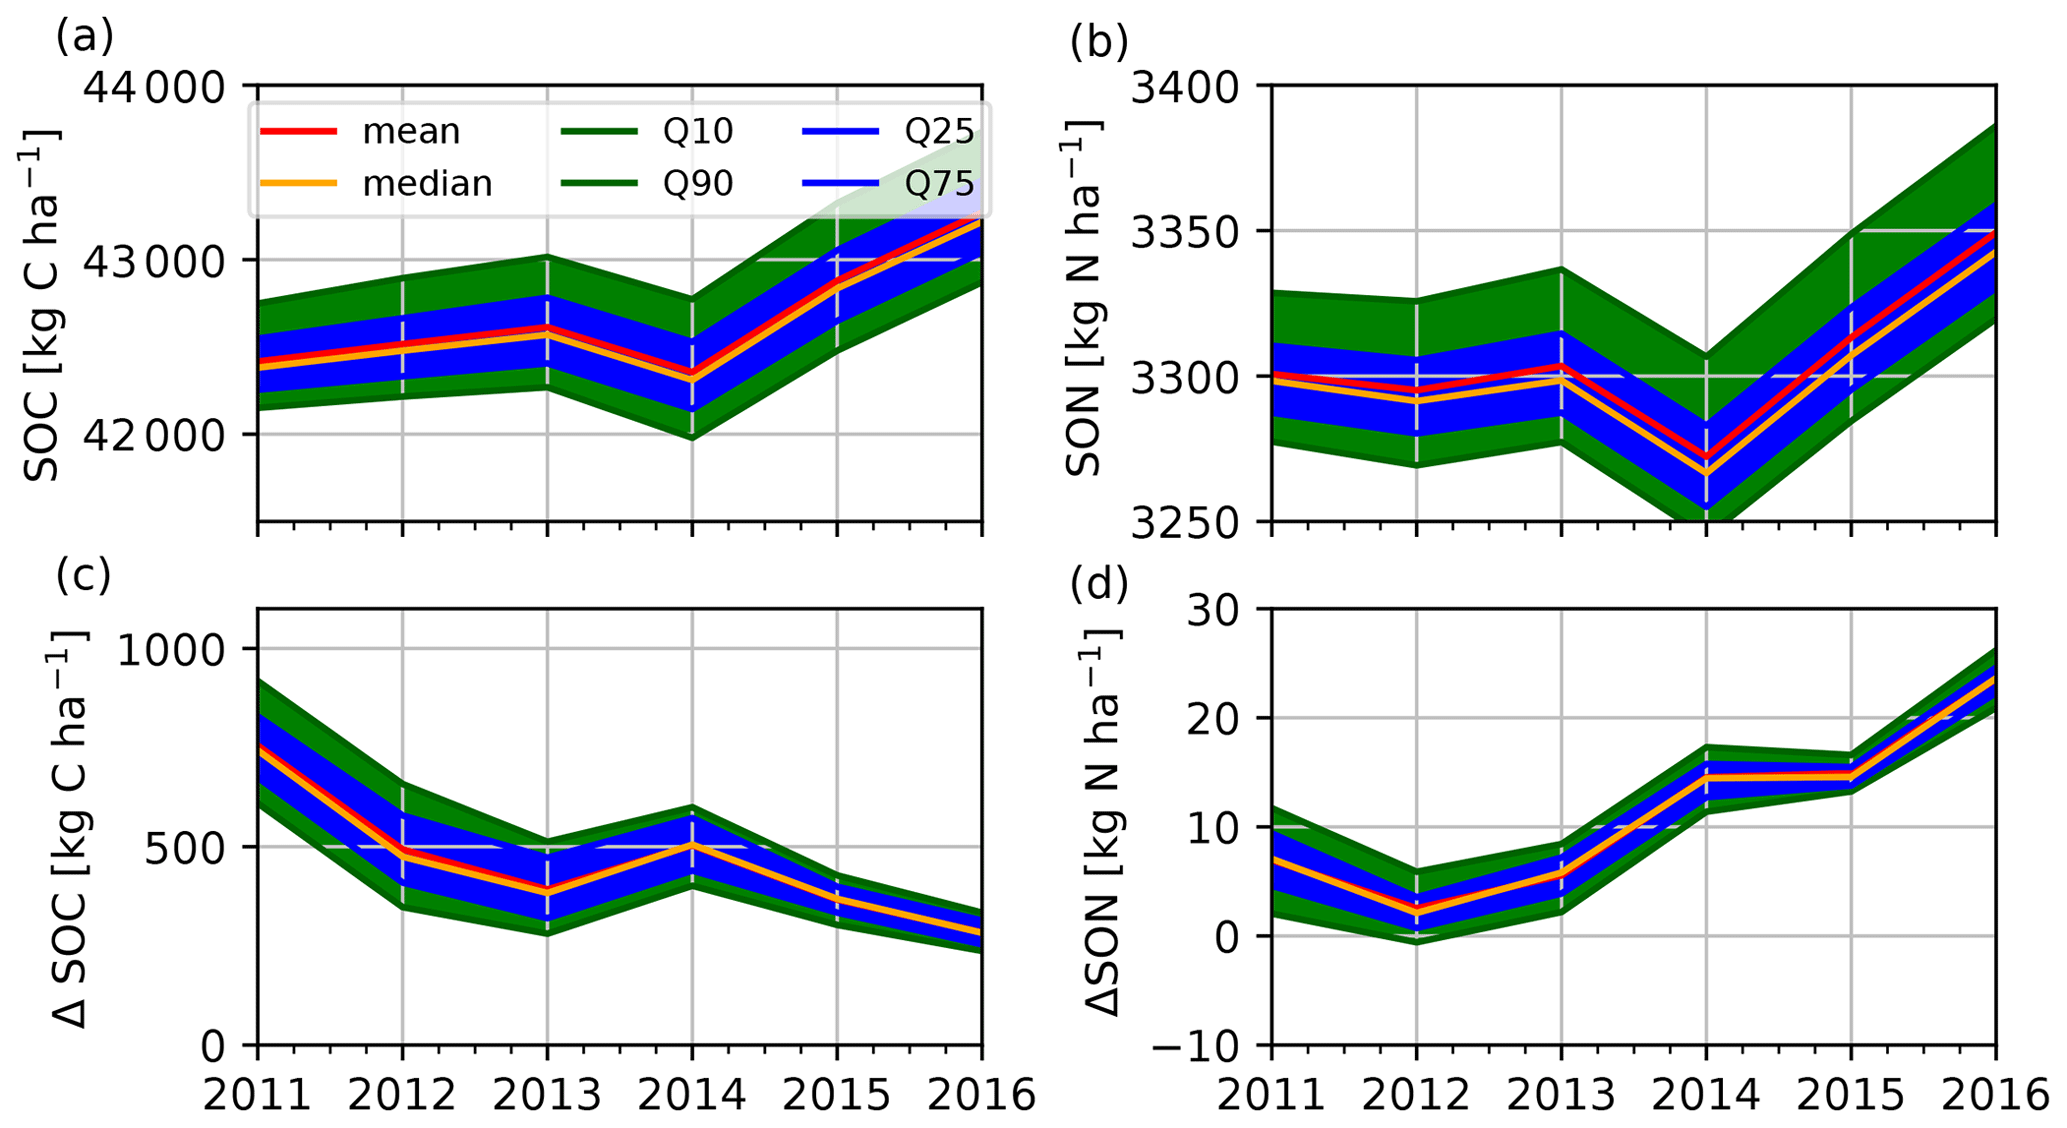
Figure 8Annual dynamics of the uncertainty distributions of the soil carbon (a) and soil organic nitrogen (b) and the corresponding dynamics of the uncertainty distributions of the annual change rates of the total soil carbon and nitrogen pools (c, d) respectively.
In this study, following the recommendation of Grosz et al. (2023), an assessment of the combined full C and N balances of a regional cropland agroecosystem is reported for the first time using inventory simulations with a process-based ecosystem model. The additional quantification of the associated modelling uncertainty of the balance simulations increases the trustworthiness of the study.
Up to present, process-based modelling studies have mainly focused on single-site applications, e.g. Daycent (del Grosso et al., 2005; Gurung et al., 2020), APSIM (Vogeler et al., 2013), CERES-EGC (Gabrielle et al., 2006; Dambreville et al., 2008; Heinen, 2006; Hénault et al., 2005), CERES-Wheat (Mavromatis, 2016), DNDC (Li, 2000) and LandscapeDNDC (Haas et al., 2013; Zhang et al., 2015; Klatt et al., 2015; Molina-Herrera et al., 2016). Fewer studies deploy models on the regional to national scale (del Grosso et al., 2005; Klatt et al., 2015; Kim et al., 2015) or the continental to global scale (del Grosso et al., 2009; Thompson et al., 2019; Franke et al., 2020; Smerald et al., 2022; Jägermeyr et al., 2021). All of these studies are subject to criticism, as stated by Grosz et al. (2023), as they are reporting, in general, on only one specific component or only a few components of the carbon or nitrogen cycles, such as soil carbon stocks or N2O emissions, lacking any information on the full C and N balance.
There are very few cases where an attempt at a regional estimation of the NB has been made. The study by Schroeck et al. (2019) is the only previous attempt fulfilling the requirements of Grosz et al. (2023) in reporting on the full NB for a large alpine watershed in the Austrian Alps, characterized by arable production in the low-lying areas and grassland in the mountains, using a process-based model. In addition, Lee et al. (2020) tried to estimate nitrogen balances in Switzerland by alternating the cropping systems or management practices. There were also cases where the regional NB was estimated with the use of nitrogen balance equations (He et al., 2018). Recently, Zistl-Schlingmann et al. (2020) assessed the full N balance of alpine grasslands using the 15N stable isotope techniques.
In order to achieve a more concrete and complete analysis of the CB and NB that could be used for future policy development, an uncertainty analysis is considered to be necessary and mandatory. The IPCC guidelines demand UNFCCC (United Nations Framework Convention on Climate Change) reporting of the uncertainty quantification of any reported inventory study (IPCC, 2019). Recent publications have reported the deployment of different methods to assess and quantify the various sources of uncertainty in ecosystem modelling. Klatt et al. (2015) published a study on the impact of parameter uncertainty on N2O emissions and NO3 leaching at a regional scale. Houska et al. (2017) deployed the GLUE method (generalized likelihood uncertainty estimation) for the LandscapeDNDC model on a grassland site; other studies such as Lehuger et al. (2009a), Li et al. (2015) and Myrgiotis et al. (2018a) used the Bayesian model calibration and uncertainty assessment approach, which has been used in the current study as well.
4.1 Yield and feed production
LandscapeDNDC was validated in a study by Molina-Herrera et al. (2016) on cropland and grassland sites across Europe, showing good agreement in terms of reproducing observed above ground biomass and yield estimates. Similar model performance for the cultivation of commodity crops was reported by Kasper et al. (2019), Klatt et al. (2015), Molina-Herrera et al. (2017) and R. J. Petersen et al. (2021).
Lyra and Loukas (2021) used the REPIC model to estimate the crop growth and/or yield production of several crops in the Basin of Almyros, Thessaly. The simulated results were approximately 11 t ha−1 clover, 3.3/3.5 t ha−1 cereals and/or wheat, 3.8 t ha−1 cotton, and 9 t ha−1 maize; these values compare well to the results of our research, as shown in Table 3. The simulated results presented in our study are in line with the results by Voloudakis et al. (2015), simulating cotton production in seven different areas of Greece through application of the AquaCrop model. Similar results were reported by Tsakmakis et al. (2019).
There are few cases in the literature concerning yield simulations on a European level. Based on the yield datasets of FAO and EUROSTAT, Ciais et al. (2010a) estimated mean crop yields for the period 1990–1999 at the scale of EU-25 as 6.1 (FAO) and 5.3 (EUROSTAT) t DM ha−1 yr−1 respectively, which corresponds well to the results of our study. Haas et al. (2022) estimated with a model ensemble mean for crop yields for EU-27 a value of 4.41 ± 1.85 t DM ha−1 yr−1 for the period 1990–1999. Lugato et al. (2018) estimated cropland yield projections of 4.34 t DM ha−1 yr−1 (mean), ranging from 3.69 to 4.90 t DM ha−1 yr−1, with the DayCent model for EU-27, comparable to the 6.18 t DM ha−1 yr−1 average simulated crop yields of this study. The simulated yields in the current study vary from 3.3 to 9.9 t DM ha−1 yr−1 for the cases of cotton and maize respectively.
Higher yield estimates for the region of Thessaly in this study are certainly due to the inclusion of the legume feed crops in the rotations. This argument is supported by a recent meta-analysis by Lu (2020) that concluded that, on average, yield increases of 5.0 % to 25 % can be expected for various conditions if residues are completely returned to the field as compared to no-residue-return systems. Similar results were reported by Fuchs et al. (2020) and Barneze et al. (2020).
Following the recommendations of Grosz et al. (2023), our study has reported transparently all the major C and N fluxes of the region as simulated by the model. In our study, we have not calibrated the model against any observations; therefore, all simulation results will be discussed in comparison to other modelling results available. Presently, there is only one comparable modelling study available in the literature reporting and discussing the total N balance of a site or region, which we have used to compare our N balance to.
4.2 Carbon and nitrogen balance
Full N balance
At present, the studies of Schroeck et al. (2019) and Lee et al. (2020) are the only ones to be found on the Web of Science when searching the keywords “nitrogen”, “balance”, “process”, “based” and “modelling” simultaneously; these studies report a compilation of the nitrogen balance and all associated N fluxes for a site or region through applying a process-based ecosystem model, as demanded by Gosz et al. (2023).
Leip et al. (2011) reported the first nitrogen balance for Europe following a mixed approach combining the CAPRI (Common Agricultural Policy Regionalised Impact) model (a global economic model for agriculture) with different approaches estimating various nitrogen fluxes in arable land cultivation, but the approach lacks the explicit quantification of the different gaseous N fluxes. The study of Schroeck et al. (2019) overcame this hurdle and applied the process-based ecosystem model LandscapeDNDC to estimate the full regional nitrogen budgets, including all the fluxes of different ecosystems (cropland, grassland and pastures) and climatic zones, of a watershed in Austria. That has been the first attempt at estimating and reporting all the N fluxes possible, as demanded by Gosz et al. (2023).
The N balance estimate in Schroeck et al. (2019) for a catchment in Austria and the N balance reported in our study compare very well despite the inherent differences in land management and N inputs. As highlighted by Grosz et al. (2023), such intercomparisons demonstrate the different model behaviours when applied to different ecosystem. In our study, we see the partitioning of the N outfluxes from our arable system in similar shares as reported by Schroeck et al. (2019) for the arable land.
The N2O estimates in Schroeck et al. (2019) and in the current study are of a comparable level. We estimated N2O emissions of 2.6 kg N ha−1 yr−1, while Schroeck et al. (2019) report 1.51 kg N ha−1 yr−1, which is about 40 % lower. The NO fluxes differ significantly since we reported a mean value of 3.2 kg NO–N ha−1 yr−1, while Schroeck et al. (2019) reported 0.08 kg NO-N ha−1 yr−1. On the one hand, this is related to some recent model advances which were made during this study and which elevated the NO production in LandscapeDNDC (Molina-Herrera et al., 2017), and on the other hand, this is due to the high share of organic N fertilization in our study fostering NO emissions. Ammonia volatilization differs substantially between the two studies – while our study reports 34 kg NH3–N ha−1 yr−1, Schroeck et al. (2019) reported moderate emissions of 0.23 kg NH3–N ha−1 yr−1. The strong NH3 volatilization in our study is mostly driven by the high pH values of the soils in the region of Thessaly (pH values from 6.5 to 8.2, with a considerable spatial variation; Greek Soil Map: https://iris.gov.gr/SoilServices/js/pdf/SOIL%20MAP%20OF%20GREECE%20e-SOILBOOK.pdf, last access: 17 April 2019, 2015) and the comparably high manure inputs into the arable system in our study, while in the research of Schroeck et al. (2019), the manure was preferably applied only to the grassland systems, and mineral fertilizers were applied to the arable land. Concerning the NO3, Schroeck et al. (2019) reported a value of 45.3 kg NO3–N ha−1 yr−1, which is 3 times higher than that estimated in this study (14.1 kg N ha−1 yr−1) considering N inputs of approximately 160 and 212.3 kg N ha−1 yr−1 respectively. Even though 50 % of the arable land in our study was irrigated, the resulting water percolation rates in our study were, by far, lower than the percolation simulated in the study of Schroeck et al. (2019) as the Austrian pre-alpine catchment received nearly double the annual precipitation.
The N balance modelling study of Lee et al. (2020) made estimations of a national cropland N balance for Switzerland using an upscaling method based on process-based site simulations with the DayCent model, distinguishing the management information of the considered cropping systems, e.g. fertilizer rates, tillage or land cover change. The study reported for conventional cultivations (averaged across 20 years) the yield-related N outfluxes, NO3 leaching and gaseous N emissions, accounting for about 60 %, 36.1 % and 4.1 % respectively of the total N outputs. Lee et al. (2020) did not report the different gaseous N fluxes even though the DayCent model must have simulated all of them. Although the yield-related N outflux is in accordance with our result of 64.95 %, there seems to be a discrepancy in the reported gaseous and aquatic N flux contributions as we report 27.94 % for gaseous and 7.11 % for NO3 leaching in our study. As demanded by Gosz et al (2023), we can elaborate upon different preferences in simulated N outflux partitioning (36 % NO3 and 4 % gaseous losses for DayCent versus 7 % NO3 and 28 % gaseous losses for LandscapeDNDC) due to the different simulation models and regionalization and upscaling approaches, as well as the different soil, climatic and management conditions included in the respective studies.
Velthof et al. (2009) used the MITTERA-EUROPE model and method, based on the concoction of the GAINS and CAPRI models, to estimate N fluxes of European soils on a NUTS2 scale, making use of European datasets and literature coefficients, where the fertilizer application and management were similar to our methodology. The average N input–output balance was calculated as 117 kg N ha−1 yr−1, composed of manure at 49 kg N ha−1 yr−1, synthetic fertilizer at 58 kg N ha−1 yr−1 (in the current study, for both cases equating to 80.2 kg N ha−1 yr−1), biological nitrogen fixation at 2 kg N ha−1 yr−1 (our research indicates 45.6 kg N ha−1 yr−1) and N deposition at 7 kg N ha−1 (current study indicates 6.3 kg N ha−1 yr−1). In contrast to our study, the reported output fluxes are 8 kg NH3–N ha−1 yr−1 for NH3, 2 kg N2O–N ha−1 yr−1 for N2O, 2 kg NOx–N ha−1 yr−1 for NOx, 51 kg N2–N ha−1 yr−1 for N2 and 7 kg NO3–N ha−1 yr−1 for NO3 leaching, while the results presented in our study are 34.0 kg NH3–N ha−1 yr−1 for NH3, 2.6 kg N2O–N ha−1 yr−1 for N2O, 3.2 kg NOx–N ha−1 yr−1 for NOx, 15.5 kg N2–N ha−1 yr−1 for N2 and 14.1 kg NO3–N ha−1 yr−1 for NO3 leaching. Additionally, the yield output is estimated as 48 kg N ha−1 yr−1. Again, we see a different preference in N outflux partitioning for large shares in gaseous N fluxes versus small NO3-leaching shares; the difference compared to the results presented in our study is related to the different input data used for initialization and driving of the model based on regional statistics and the use of a biogeochemical model versus emission factor approaches.
He et al. (2018) assessed the soil N balance for a time span between 1984 to 2014 based on the N budget equations (N input – N output) using multiple coefficients from the literature in order to estimate the nitrogen input and output fluxes of six grouped regions in China. The used datasets were acquired from national authorities and include cropping land and yields, synthetic fertilizers, animal heads, soil types, etc. The N synthetic fertilizer input is, on average, 182.4 kg N ha−1; the organic fertilizer is 97.3 kg N ha−1; N fixation is estimated as 16.8 kg N ha−1; and the atmospheric deposition is estimated as 22 kg N ha−1. Almost half of the total averaged N output losses, 48.9 %, was attributed to crop uptake, while the respective gaseous losses were 19.9 % for N2, 17.3 % for volatilized NH3, 1.2 % for N2O and 0.7 % for NO. As for the NO3 leaching, the share was 5.8 % of the total output N fluxes. These reported N outflux proportions were notably comparable to our study. The differences in the N uptake data remain and are mainly due to the differences in the crops and management.
As reported by the OECD (OECD, 2020), the net averaged nitrogen balance of the area of our study is 11.6 kg N ha−1 yr−1 input to the soil, which corresponds very well to the simulated mean nitrogen balance as an influx of 13.8 kg N ha−1 yr−1 (IQR 11.9 to 16.0) into the soil.
So far, the discussion of the presented N balance and N outfluxes compares well to most of the available studies reporting N balances; however, one modelling study reported different N outflux partitioning between gaseous and NO3-leaching fluxes. For a more detailed intercomparison of the overall quality of our C and N fluxes, we aim to compare our results to various studies, addressing individual components of the C and N balance and associated fluxes.
SOC stocks
Haas et al. (2022) reported results of a European inventory simulation of soil carbon stocks and N2O emissions using a model ensemble. The study was deployed in a baseline simulation across EU-27 with a similar residue management as compared to our study, resulting in very stable carbon stock dynamics over a long period (1950–2100). In this study, the estimated carbon sequestration of 0.5 (UA mean and median) ± 0.3 t C ha−1 yr−1 is mainly caused by the inclusion of legume feed crops within the crop rotation, leading to increased litter production and C input into the soil (K. Petersen et al., 2021; Fuchs et al., 2020; Barneze et al., 2020). Haas et al. (2022) reported a management scenario with 100 % of the crop litter remaining on the field, leading to averaged C sequestration rates of over 1 t C ha−1 yr−1 across EU-27. As the residue management in this study is between the baseline and buried scenario of Haas et al. (2022), our results compare well to the results reported in that study.
Other modelling studies such as Lugato et al. (2014) reported C sequestration rates for the conversion of cropland into grassland ranging between 0.4 and 0.8 t C ha−1 yr−1. Lugato et al. (2014) reported averaged SOC change rates for a cereal straw incorporation scenario for EU-27 of 0.1 t C ha−1 yr−1 (estimates from 2000–2020).
The SOC dynamics reported in this study show a stable carbon dynamic in the soil within the simulation time span (2009–2014) with only 3 years of model spin-up. The initialization of the various carbon pools with the SOC data from the soil database is balanced by the average litter production of the deployed crop rotations. The SOC increase in 2015 and 2016 is due to climatic conditions and higher litter inputs simulated by the model.
N2O emissions
This study reported estimates of N2O emissions of 2.6 ± 0.8 kg N2O–N ha−1 yr−1 (IQR from 2.1 to 3.1) for a mixed-crop and/or legume feed crop rotation, which were well above the estimates resulting from IPCC tier-I direct-emission factors; IPCC estimated 1.6 kg N2O–N ha−1 yr−1 when applying approximately 160 kg N ha−1 yr−1. The higher N2O emission strength of the modelling is likely to result from emission peaks after irrigation due to low anaerobicity (Grosz et al., 2023; Janz et al., 2022). Cayuela et al. (2017) conducted a meta-analysis of the direct N2O emissions for a number of cropping systems for a Mediterranean climate, where the emission factors (EFs) were altered under different fertilization and irrigation conditions. Higher fertilization rates led to higher EFs (0.82 % less than the 1 % of IPCC). Additionally, irrigated and intensively cultivated crops had higher EFs than rain-fed crops (up to 0.91 % depending on the irrigation method). The relatively high EF of maize in this study could possibly be attributed to the irrigation without the application of water-saving methods and the, on average, higher N application rates .
The LandscapeDNDC validation study of Molina-Herrera et al. (2016) reported for the Italian site Borgo Cioffi (Mediterranean climate; Ranucci et al. (2011)) annual N2O emissions of 2.49 kg N2O–N ha−1 yr−1, while two sites in southern France showed annual N2O emissions from 0.52 to 3.34 kg N2O–N ha−1 yr−1. The N2O emission estimates of our study were higher than the results reported by Haas et al. (2022) using a multi-model ensemble estimating average soil N2O emissions from European (EU-27) cropping systems for the period 1980–1999 (1.46 ± 1.30 kg N2O–N ha−1 yr−1) under conventional (baseline) management and comparably average N input. Klatt et al. (2015) reported for a regional inventory (Saxony, Germany) a mean N2O emission of 1.43 ± 1.25 kg N2O–N ha−1 yr−1.
Overall, the reported N2O flux component of our study compares well to the findings reported in the literature. As criticized by Grosz et al. (2023), many studies only focus on the performance of the models in simulating N2O emissions, and these models were even calibrated for this purpose. Without reporting all the other N fluxes from the models, this focus on and calibration for only one quantity can easily lead to inaccuracies with regard to other components of the N cycle as they may not be checked for consistency (Janz et al., 2022).
Nitrate leaching
This study reported average NO3-leaching fluxes (only nitrate leaching into surface waters) of 14.1 ± 4.5 kg NO3–N ha−1 yr−1. Reported nitrate-leaching observations for the region or Greece generally could not be found in the literature; de Vries et al. (2011) estimated the NO3 leaching with the use of four different models, with varying values from 5 to 40 kg NO3–N ha−1 yr−1 for the area of our study. These high values could be explained by the fact that they correspond to both groundwater and runoff. Molina-Herrera et al. (2016) reported for the LandscapeDNDC validation study cropland nitrate-leaching fluxes of approximately 7 to 88 kg NO3–N ha−1 yr−1. In addition, in the research of Molina-Herrera et al. (2017), the described NO3-leaching results varied from 13 to 8 kg NO3–N ha−1 yr−1, showing higher values with regard to the precipitation and fertigation. The most comparable site, Borgo Cioffi, resulted in a comparable annual NO3-leaching flux of 18.62 kg NO3–N ha−1 yr−1.
Klatt et al. (2015) reported in an uncertainty assessment for a regional inventory (Saxony, Germany) leaching rates of 29.32 ± 9.97 kg NO3–N ha−1 yr−1 for a wheat–barley–rapeseed rotation simulated by the LandscapeDNDC model. The agricultural system and management regime are comparable; higher NO3-leaching rates were most likely due to high N fertilization rates in combination with higher annual precipitation in the region, leading to more intense percolation and therefore to stronger leaching of available NO3, while, in our study, the fertilization regime was more lean, such that soil nutrient competition was higher, and available nitrate was more likely to be immobilized by plant uptake. Myrgiotis et al. (2019) reported in a similar assessment an NO3-leaching factor (LF) mean of 14 % (± 7 %) for their region; in comparison, we report a mean NO3-leaching factor of 7 %.
NO emissions
In the current study, the model-estimated NO emissions were, on average, 3.2 ± 1.5 kg NO–N ha−1 yr−1. Butterbach-Bahl et al. (2009) performed the very first European inventory of soil NO emissions using a modified version of DNDC, reporting low NO emission rates mostly below 2 kg NO–N ha−1 yr−1. Molina-Herrera et al. (2017) recently reported a full NO emission inventory for Saxony, Germany, compiling annual NO emissions from agricultural soils ranging from 0.19 to 6.7 kg NO–N ha−1 yr−1, as simulated by LandscapeDNDC. The study reported the model performance in simulating soil NO emissions at more than 20 different sites. The study of Schroeck et al. (2019) reported for a regional inventory of arable soils in Austria, as simulated by LandscapeDNDC, annual NO emissions of 1.0–1.5 kg NO–N ha−1 (for the year 2000), while empirical approaches such as that of Stehfest and Bouwman (2006) estimated emissions of similar magnitude. Zhang et al. (2015) reported in a model intercomparison and validation study (including three ecosystem models) of NO and N2O fluxes consistent simulation results for the LandscapeDNDC model, with NO emission strengths of cropland soils between 1 and 3 kg NO–N ha−1 yr−1 across the sites.
NH3 emissions
Schroeck et al. (2019) stated that validation studies of NH3 volatilization for any biogeochemical model are very rarely reported in the literature, mainly due to the complexity and a lack of flux observations at high spatial and temporal resolutions.
In our study, we estimate soil NH3 emissions of 34.0 ± 6.7 kg NH3–N ha−1 yr−1. High NH3 volatilization and emission rates can be explained by the predominating neutral to basal soil conditions (pH values of 7 and above) in the study region, favouring the Henry NH4–NH3 equilibrium towards higher NH3 gases and enabling ammonia to diffuse out of the soil into the free atmosphere.
The IPCC emission factor (EF) method for NH3 volatilization reports estimates of 20 % of N input into the soil being volatilized as NH3. For our study, the IPCC methodology for NH3 would lead to 32 kg NH3–N ha−1 yr−1, which is well in line with the simulated result.
Sidiropoulos and Tsilingiridis (2009) estimated a national livestock-originated NH3 emission corresponding to approximately 22 kg ha−1 yr−1 for the region of Thessaly.
There is a number of national NH3 inventories which could be considered to be detailed and well-studied, such as the ones in Denmark, the Netherlands, Europe, the UK and the US. In Denmark, Geels et al. (2012) used the DAMOS model to estimate the Danish NH3 emissions (crop, grass and manure manipulation); in the five regions under study, the values ranged from a very small quantity to 17.4 kg NH3–N ha−1 yr−1.
As discussed by Sutton et al. (2013), the majority of the NH3 emissions come about as a result of agricultural production and are considerably impacted by climate influence. In the case of NH3 volatilization, it could almost double with every 5 °C in temperature given certain complex thermodynamic dissociation and solubility, whilst soil NH3 emission is influenced by the available water quantity, allowing the NHx dissolution and use by microbial organisms, which afterwards leads to decomposition.
4.3 Uncertainty analysis and quantification
Santabárbara (2019) used the MCMC algorithm to estimate the joint parameter distribution of the fundamental bio-geochemical process parameters in LandscapeDNDC when simulating soil C and N fluxes. Propagating these joint parameter distributions through the model (by sampling 500 joint parameter distributions and performing inventory simulations with each parameter set within the model) for estimating the regional C and N fluxes lead to various distributions for any model result on a regional scale. Statistical analysis calculating the mean, median and interquartile range (Q25 to Q75) determines the best estimates and the uncertainty range of any model output on a regional scale, demonstrating the superiority of the method for assessing any ecosystem response by modelling instead of reporting single results. This is a novel approach that, to our knowledge, has not been reported before in the literature for the full carbon and nitrogen balance and has not been applied to regional simulations by any process-based model.
In this study, the estimated UA mean and median of the carbon sequestration of 0.5 ± 0.3 t C ha−1 yr−1 are associated with an uncertainty range from 0.4 to 0.7 t C ha−1 yr−1, which compares well to the spatial uncertainty of C sequestration in the study of Haas et al. (2022). The approach used in this study enabled us to assess the carbon and nitrogen balance of the Bayesian calibration method used by Lehuger et al. (2009b) for the enhancement of the CERES-EGC model parameterization (reduction of the a priori parameter distribution), as well as the quantification of the uncertainty of the simulated N2O emissions at different sites. The estimated fluxes of the different sites resulted in a range between 0.088 to 3.672 kg N2O–N ha−1 yr−1, with values of 0.066 to 0.115 kg N2O–N ha−1 yr−1 and 1.676 to 5.874 kg N2O–N ha−1 yr−1 for the Q05 and Q95 quantiles respectively, with an averaged value of 1.04 kg N2O–N ha−1 yr−1, which is lower than the result of the current study but still of the same order of magnitude.
Klatt et al. (2015) quantified a parameter-induced uncertainty analysis at a regional scale by applying the same process model for simulating N2O emission and NO3-leaching inventories as that in our study. The region was represented by 4000 polygons of arable land (Saxony, Germany) for crop rotations of barley, wheat and rapeseed, with differing climatic conditions. The results of Klatt et al. (2015) display a likelihood range of 50 % (the IQR range between Q25 and Q75) for N2O emissions from 0.46 to 2.05 kg N2O–N ha−1 yr−1, which is in good agreement with our results of 2.1 to 3.1 kg N2O–N ha−1 yr−1. The average N2O emissions are 1.43 kg N2O–N ha−1 yr−1, which is comparable to the result of our study (mean: 2.6 kg N2O–N ha−1 yr−1, median: 2.5 kg N2O–N ha−1 yr−1 across approximately 1000 polygons). As for leached NO3, Klatt et al. (2015) reported mean leaching rates of 29 kg NO3–N ha−1 yr−1 (IQR from 24.5 to 36.0), which is higher compared to the results of our study (mean: 14.1 kg NO3-N ha−1 yr−1, median: 13.6 kg NO3-N ha−1 yr−1) (IQR from 11 to 17). Despite the difference in climatic and soil conditions, both uncertainty analysis studies reported similar regional estimates and uncertainty ranges for N2O emissions and NO3 leaching.
Butterbach-Bahl et al. (2022) reported the influence of management uncertainties on compiling national inventories of CH4 and N2O emissions for various rice cultivation systems in Vietnam. The study applied a sampling technique that varies model input data within a given range and analysed the influence on the assessed CH4 and N2O emission strengths. As the underlying cropland systems were fundamentally different, the assessed uncertainty ranges were comparable, and the study supports our approach of focusing on uncertainty ranges rather than single values.
In this research, we presented, for the first time, a regional inventory of the full carbon and nitrogen balance, including all sub-components of these fluxes simulated by a process-based model. Additionally, the study has fulfilled the demand of always reporting the associated uncertainties for any modelling results being published in literature. This supports the trustworthiness of the reported results for the C and N balances.
Comparing the modelled N balance with a similar approach that models the full N balance with all associated fluxes for a catchment in pre-alpine Austria leads to the conclusion that partitioning the N outflux into the different N flux components is more inherent to the LandscapeDNDC model itself, as used in both studies, than it is induced by the two very different agricultural and climatical systems. Nevertheless, specific N outfluxes between the two studies show large differences (e.g. NH3 volatilization), which is purely caused by model processes due to different soil pH values. Comparing to a less granular and detailed study of the N balance for Switzerland gives a first impression of the differences to be expected in modelling the arable N balance with various different models. The discussion of such results will become more lively and maybe controversial as soon as more comparable studies using different models become available.
In addition, a full uncertainty analysis is presented based on the Metropolis–Hastings algorithm, where a parameter subset and input data perturbation were sampled and simulated, resulting in various probability density functions (PDFs) for each one of the N and C balance fluxes, building a full uncertainty analysis of the modelled results. This helps to build trustworthiness in modelling assessments and estimates of the balances and of the model behaviour.
As demanded by the nitrogen-modelling community, all of the above constitute the novelty of the conducted research that could be seen as a prototype for analysing and reporting N cycling in agro-ecosystems in the future.
The LandscapeDNDC model source code is available in Butterbach-Bahl et al. (2021). All publication results (tables and data for figures) will be made available in the Supplement associated with this paper.
The supplement related to this article is available online at: https://doi.org/10.5194/bg-21-1563-2024-supplement.
OS conceived and designed the analysis and collected the data; he also performed the analysis and wrote the paper. EH conducted the research and wrote the paper. KBB substantially contributed to the research planning and paper writing and editing and also provided funding opportunities. MPP substantially contributed to the research planning and paper writing and editing and provided funding opportunities.
The contact author has declared that none of the authors has any competing interests.
Publisher’s note: Copernicus Publications remains neutral with regard to jurisdictional claims made in the text, published maps, institutional affiliations, or any other geographical representation in this paper. While Copernicus Publications makes every effort to include appropriate place names, the final responsibility lies with the authors.
The author Odysseas Sifounakis received a PhD research scholarship from Alexandros S. Onassis Public Benefit Foundation, Greece, part of which is the research presented in the current publication.
The article processing charges for this open-access publication were covered by the Karlsruhe Institute of Technology (KIT).
This paper was edited by Ivonne Trebs and reviewed by Emanuele Lugato and two anonymous referees.
Barneze, A. S., Whitaker, J., McNamara, N. P., and Ostle, N. J.: Legumes increase grassland productivity with no effect on nitrous oxide emissions, Plant Soil, 446, 163–177, https://doi.org/10.1007/s11104-019-04338-w, 2020.
Butterbach-Bahl, K., Kahl, M., Mykhayliv, L., Werner, C., Kiese, R., and Li, C.: A European-wide inventory of soil NO emissions using the biogeochemical models DNDC/Forest-DNDC, Atmos. Environ., 43, 1392–1402, https://doi.org/10.1016/J.ATMOSENV.2008.02.008, 2009.
Butterbach-Bahl, K., Baggs, E. M., Dannenmann, M., Kiese, R., and Zechmeister-Boltenstern, S.: Nitrous oxide emissions from soils: How well do we understand the processes and their controls?, Philos. T. R. Soc. B, 368, 20130122, https://doi.org/10.1098/rstb.2013.0122, 2013.
Butterbach-Bahl, K., Grote, R., Haas, E., Kiese, R., Klatt, S., and Kraus, D.: LandscapeDNDC (v1.30.4), Karlsruhe Institute of Technology (KIT) [data set], https://doi.org/10.35097/438 (last access: 25 May 2021), 2021.
Butterbach-Bahl, K., Kraus, D., Kiese, R., Mai, V. T., Nguyen, T., Sander, B. O., Wassmann, R., and Werner, C.: Activity data on crop management define uncertainty of CH4 and N2O emission estimates from rice: A case study of Vietnam, J. Plant Nutr. Soil Sci., 185, 793–806, https://doi.org/10.1002/jpln.202200382, 2022.
Camargo, J. A. and Alonso, Á.: Ecological and toxicological effects of inorganic nitrogen pollution in aquatic ecosystems: A global assessment, Environ. Int., 32, 831–849, https://doi.org/10.1016/j.envint.2006.05.002, 2006.
Cameron, D. R., van Oijen, M., Werner, C., Butterbach-Bahl, K., Grote, R., Haas, E., Heuvelink, G. B. M., Kiese, R., Kros, J., Kuhnert, M., Leip, A., Reinds, G. J., Reuter, H. I., Schelhaas, M. J., de Vries, W., and Yeluripati, J.: Environmental change impacts on the C- and N-cycle of European forests: A model comparison study, Biogeosciences, 10, 1751–1773, https://doi.org/10.5194/bg-10-1751-2013, 2013.
Cayuela, M. L., Aguilera, E., Sanz-Cobena, A., Adams, D. C., Abalos, D., Barton, L., Ryals, R., Silver, W. L., Alfaro, M. A., Pappa, V. A., Smith, P., Garnier, J., Billen, G., Bouwman, L., Bondeau, A., and Lassaletta, L.: Direct nitrous oxide emissions in Mediterranean climate cropping systems: Emission factors based on a meta-analysis of available measurement data, Agr. Ecosyst. Environ., 238, 25–35, https://doi.org/10.1016/j.agee.2016.10.006, 2017.
Chirinda, N., Kracher, D., Lægdsmand, M., Porter, J. R., Olesen, J. E., Petersen, B. M., Doltra, J., Kiese, R., and Butterbach-Bahl, K.: Simulating soil N2O emissions and heterotrophic CO2 respiration in arable systems using FASSET and MoBiLE-DNDC, Plant Soil, 343, 139–160, https://doi.org/10.1007/s11104-010-0596-7, 2011.
Ciais, P., Wattenbach, M., Vuichard, N., Smith, P., Piao, S. L., Don, A., Luyssaert, S., Janssens, I. A., Bondeau, A., Dechow, R., Leip, A., Smith, P. C., Beer, C., van der werf, G. R., Gervois, S., van oost, K., Tomelleri, E., Freibauer, A., and Schulze, E. D.: The European carbon balance, Part 2: Croplands, Glob. Change Biol., 16, 1409–1428, https://doi.org/10.1111/j.1365-2486.2009.02055.x, 2010.
Dambreville, C., Morvan, T., and Germon, J. C.: N2O emission in maize-crops fertilized with pig slurry, matured pig manure or ammonium nitrate in Brittany, Agr. Ecosyst. Environ., 123, 201–210, https://doi.org/10.1016/j.agee.2007.06.001, 2008.
Davidson, E. A. and Kanter, D.: Inventories and scenarios of nitrous oxide emissions, Environ. Res. Lett., 9, 105012, https://doi.org/10.1088/1748-9326/9/10/105012, 2014.
del Grosso, S. J., Mosier, A. R., Parton, W. J., and Ojima, D. S.: DAYCENT model analysis of past and contemporary soil N2O and net greenhouse gas flux for major crops in the USA, Soil Till. Res., 83, 9–24, https://doi.org/10.1016/J.STILL.2005.02.007, 2005.
del Grosso, S. J., Ojima, D. S., Parton, W. J., Stehfest, E., Heistemann, M., DeAngelo, B., and Rose, S.: Global scale DAYCENT model analysis of greenhouse gas emissions and mitigation strategies for cropped soils, Glob. Planet Change, 67, 44–50, https://doi.org/10.1016/J.GLOPLACHA.2008.12.006, 2009.
de Vries, W., Leip, A., Reinds, G. J., Kros, J., Lesschen, J. P., and Bouwman, A. F.: Comparison of land nitrogen budgets for European agriculture by various modeling approaches, Environ. Pollut., 159, 3254–3268, https://doi.org/10.1016/j.envpol.2011.03.038, 2011.
European Fertilizer Manufacturers Association (EFMA): Forecast of Food, Farming and Fertilizer Use in the European Union 2008–2018, 15 pp., Eur. Fert. Manuf. Assoc., Brussels, 2009.
Erisman, J. W., Galloway, J., Seitzinger, S., Bleeker, A., and Butterbach-Bahl, K.: Reactive nitrogen in the environment and its effect on climate change, Curr. Opin. Environ. Sustain., 3, 281–290, https://doi.org/10.1016/J.COSUST.2011.08.012, 2011.
ESDB: European Soil Database (ESDB) v2.0 – raster version: https://esdac.jrc.ec.europa.eu/ESDB_Archive/ESDB/ESDB_Data/ESDB_v2_data_smu_1k.html (last access: 13 January 2019), 2004.
EU-Commission: Tracking progress towards Kyoto and 2020 targets in Europe – European Environment Agency: https://www.eea.europa.eu/publications/progress-towards-kyoto, last access: 13 January 2014.
EU-Commission: European Commission-Press release: Nitrates: Commission decides to refer Greece to the Court of Justice and asks for financial sanctions, ISBN: 0080067891, IP/19/1482, https://ec.europa.eu/commission/presscorner/detail/ro/IP_19_14 (last access: 15 February 2020), 2019.
Franke, J. A., Müller, C., Elliott, J., Ruane, A. C., Jägermeyr, J., Balkovic, J., Ciais, P., Dury, M., Falloon, P. D., Folberth, C., François, L., Hank, T., Hoffmann, M., Izaurralde, R. C., Jacquemin, I., Jones, C., Khabarov, N., Koch, M., Li, M., Liu, W., Olin, S., Phillips, M., Pugh, T. A. M., Reddy, A., Wang, X., Williams, K., Zabel, F., and Moyer, E. J.: The GGCMI Phase 2 experiment: global gridded crop model simulations under uniform changes in CO2, temperature, water, and nitrogen levels (protocol version 1.0), Geosci. Model Dev., 13, 2315–2336, https://doi.org/10.5194/gmd-13-2315-2020, 2020.
Fuchs, K., Merbold, L., Buchmann, N., Bretscher, D., Brilli, L., Fitton, N., Topp, C. F. E., Klumpp, K., Lieffering, M., Martin, R., Newton, P. C. D., Rees, R. M., Rolinski, S., Smith, P., and Snow, V.: Multimodel Evaluation of Nitrous Oxide Emissions From an Intensively Managed Grassland, J. Geophys. Res.-Biogeo., 125, e2019JG005261, https://doi.org/10.1029/2019JG005261, 2020.
Gabrielle, B., Laville, P., Hénault, C., Nicoullaud, B., and Germon, J. C.: Simulation of nitrous oxide emissions from wheat-cropped soils using CERES, Nutr. Cycl. Agroecosyst., 74, 133–146, https://doi.org/10.1007/s10705-005-5771-5, 2006.
Galloway, J. N., Leach, A. M., Bleeker, A., and Erisman, J. W.: A chronology of human understanding of the nitrogen cycle, Philos. T. R. Soc. B, 368, 0130120, https://doi.org/10.1098/rstb.2013.0120, 2013.
Garnett, T., Appleby, M. C., Balmford, A., Bateman, I. J., Benton, T. G., Bloomer, P., Burlingame, B., Dawkins, M., Dolan, L., Fraser, D., Herrero, M., Hoffmann, I., Smith, P., Thornton, P. K., Toulmin, C., Vermeulen, S. J., and Godfray, H. C. J.: Sustainable intensification in agriculture: Premises and policies, Science, 341, 33–34, https://doi.org/10.1126/science.1234485, 2013.
Geels, C., Andersen, H. v., Ambelas Skjøth, C., Christensen, J. H., Ellermann, T., Løfstrøm, P., Gyldenkærne, S., Brandt, J., Hansen, K. M., Frohn, L. M., and Hertel, O.: Improved modelling of atmospheric ammonia over Denmark using the coupled modelling system DAMOS, Biogeosciences, 9, 2625–2647, https://doi.org/10.5194/bg-9-2625-2012, 2012.
Godfray, H. C. J., Beddington, J. R., Crute, I. R., Haddad, L., Lawrence, D., Muir, J. F., Pretty, J., Robinson, S., Thomas, S. M., and Toulmin, C.: Food security: The challenge of feeding 9 billion people, Science, 327, 812–818, https://doi.org/10.1126/science.1185383, 2010.
Grosz, B., Matson, A., Butterbach-Bah, K., Clough, T., Davidson, E. A., Dechow, R., Diamantopoulos, E., Dörsch, P., Haas, E., He, H., Henri, C. V, Hui, D., Well, R., Yeluripati, J., Zhang, J., and Scheer, C.: Modeling denitrification: can we report what we don't know?, ESS Open Archive, 4, e2023AV000990, 1–11, https://doi.org/10.22541/essoar.168500283.32887682/v1, 2023.
Grote, R., Lehmann, E., Brümmer, C., Brüggemann, N., Szarzynski, J., and Kunstmann, H.: Modelling and observation of biosphere–atmosphere interactions in natural savannah in Burkina Faso, West Africa, Phys. Chem. Earth Pt. A/B/C, 34, 251–260, https://doi.org/10.1016/J.PCE.2008.05.003, 2009.
Gurung, R. B., Ogle, S. M., Breidt, F. J., Williams, S. A., and Parton, W. J.: Bayesian calibration of the DayCent ecosystem model to simulate soil organic carbon dynamics and reduce model uncertainty, Geoderma, 376, 114529, https://doi.org/10.1016/j.geoderma.2020.114529, 2020.
Haas, E., Klatt, S., Fröhlich, A., Kraft, P., Werner, C., Kiese, R., Grote, R., Breuer, L., and Butterbach-Bahl, K.: LandscapeDNDC: A process model for simulation of biosphere-atmosphere-hydrosphere exchange processes at site and regional scale, Landsc. Ecol., 28, 615–636, https://doi.org/10.1007/s10980-012-9772-x, 2013.
Haas, E., Carozzi, M., Massad, R. S., Butterbach-Bahl, K., and Scheer, C.: Long term impact of residue management on soil organic carbon stocks and nitrous oxide emissions from European croplands, Sci. Total Environ., 836, 154932, https://doi.org/10.1016/J.SCITOTENV.2022.154932, 2022.
He, W., Jiang, R., He, P., Yang, J., Zhou, W., Ma, J., and Liu, Y.: Estimating soil nitrogen balance at regional scale in China's croplands from 1984 to 2014, Agr. Syst., 167, 125–135, https://doi.org/10.1016/J.AGSY.2018.09.002, 2018.
Heinen, M.: Application of a widely used denitrification model to Dutch data sets, Geoderma, 133, 464–473, https://doi.org/10.1016/J.GEODERMA.2005.08.011, 2006.
Hénault, C., Bizouard, F., Laville, P., Gabrielle, B., Nicoullaud, B., Germon, J. C., and Cellier, P.: Predicting in situ soil N2O emission using NOE algorithm and soil database, Glob. Change Biol., 11, 115–127, https://doi.org/10.1111/j.1365-2486.2004.00879.x, 2005.
Holst, J., Grote, R., Offermann, C., Ferrio, J. P., Gessler, A., Mayer, H., and Rennenberg, H.: Water fluxes within beech stands in complex terrain, Int. J. Biometeorol., 54, 23–36, https://doi.org/10.1007/s00484-009-0248-x, 2010.
Houska, T., Kraft, P., Liebermann, R., Klatt, S., Kraus, D., Haas, E., Santabarbara, I., Kiese, R., Butterbach-Bahl, K., Müller, C., and Breuer, L.: Rejecting hydro-biogeochemical model structures by multi-criteria evaluation, Environ. Modell. Softw., 93, 1–12, https://doi.org/10.1016/j.envsoft.2017.03.005, 2017.
IFADATA: International Fertilizer Association database, http://ifadata.fertilizer.org/ucSearch.aspx (last access: 13 January 2019), 2015.
IPCC: Refinement to the 2006 IPCC Guidelines for National Greenhouse Gas Inventories – IPCC, https://www.ipcc-nggip.iges.or.jp/public/2019rf/vol4.html (last access: 12 January 2019), 2019.
Jägermeyr, J., Müller, C., Ruane, A. C., Elliott, J., Balkovic, J., Castillo, O., Faye, B., Foster, I., Folberth, C., Franke, J. A., Fuchs, K., Guarin, J. R., Heinke, J., Hoogenboom, G., Iizumi, T., Jain, A. K., Kelly, D., Khabarov, N., Lange, S., Lin, T. S., Liu, W., Mialyk, O., Minoli, S., Moyer, E. J., Okada, M., Phillips, M., Porter, C., Rabin, S. S., Scheer, C., Schneider, J. M., Schyns, J. F., Skalsky, R., Smerald, A., Stella, T., Stephens, H., Webber, H., Zabel, F., and Rosenzweig, C.: Climate impacts on global agriculture emerge earlier in new generation of climate and crop models, Nat. Food, 2, 873–885, https://doi.org/10.1038/s43016-021-00400-y, 2021.
Janz, B., Havermann, F., Lashermes, G., Zuazo, P., Engelsberger, F., Torabi, S. M., and Butterbach-Bahl, K.: Effects of crop residue incorporation and properties on combined soil gaseous N2O, NO, and NH3 emissions – A laboratory-based measurement approach, Sci. Total Environ., 807, 151051, https://doi.org/10.1016/J.SCITOTENV.2021.151051, 2022.
Jones, C. M., Spor, A., Brennan, F. P., Breuil, M. C., Bru, D., Lemanceau, P., Griffiths, B., Hallin, S., and Philippot, L.: Recently identified microbial guild mediates soil N2O sink capacity, Nat. Clim. Change, 4, 801–805, https://doi.org/10.1038/nclimate2301, 2014.
Kalivas, D., Kollias, V., Kalivas, D. P., and Kollias, V. J.: Effects of soil, climate and cultivation techniques on cotton yield in Central Greece, using different statistical methods, Agronomie, 21, 73–89, https://doi.org/10.1051/agro:2001110, 2001.
Kasper, M., Foldal, C., Kitzler, B., Haas, E., Strauss, P., Eder, A., Zechmeister-Boltenstern, S., and Amon, B.: N2O emissions and NO leaching from two contrasting regions in Austria and influence of soil, crops and climate: a modelling approach, Nutr. Cycl. Agroecosyst., 113, 95–111, https://doi.org/10.1007/s10705-018-9965-z, 2019.
Kim, Y., Seo, Y., Kraus, D., Klatt, S., Haas, E., Tenhunen, J., and Kiese, R.: Estimation and mitigation of N2O emission and nitrate leaching from intensive crop cultivation in the Haean catchment, South Korea, Sci. Total Environ., 529, 40–53, https://doi.org/10.1016/J.SCITOTENV.2015.04.098, 2015.
Klatt, S., Kraus, D., Rahn, K.-H., Werner, C., Kiese, R., Butterbach-Bahl, K., and Haas, E.: Parameter-Induced Uncertainty Quantification of Regional N2O Emissions and NO3 Leaching using the Biogeochemical Model LandscapeDNDC, Adv. Agr. Syst. Model., 6, 149–171, https://doi.org/10.2134/advagricsystmodel6.2013.0001, 2015.
Kraus, D., Weller, S., Klatt, S., Haas, E., Wassmann, R., Kiese, R., and Butterbach-Bahl, K.: A new LandscapeDNDC biogeochemical module to predict CH4 and N2O emissions from lowland rice and upland cropping systems, Plant Soil, 386, 125–149, https://doi.org/10.1007/s11104-014-2255-x, 2014.
Larocque, G. R., Bhatti, J. S., Boutin, R., and Chertov, O.: Uncertainty analysis in carbon cycle models of forest ecosystems: Research needs and development of a theoretical framework to estimate error propagation, Ecol. Modell., 219, 400–412, https://doi.org/10.1016/J.ECOLMODEL.2008.07.024, 2008.
Lee, K. M., Lee, M. H., Lee, J. S., and Lee, J. Y.: Uncertainty analysis of greenhouse gas (GHG) emissions simulated by the parametric Monte Carlo simulation and nonparametric bootstrap method, Energies, 13, 4965, https://doi.org/10.3390/en13184965, 2020.
Lehuger, S., Gabrielle, B., Oijen, M. van, Makowski, D., Germon, J. C., Morvan, T., and Hénault, C.: Bayesian calibration of the nitrous oxide emission module of an agro-ecosystem model, Agr. Ecosyst. Environ., 133, 208–222, https://doi.org/10.1016/j.agee.2009.04.022, 2009a.
Lehuger, S., Gabrielle, B., Oijen, M. van, Makowski, D., Germon, J. C., Morvan, T., and Hénault, C.: Bayesian calibration of the nitrous oxide emission module of an agro-ecosystem model, Agr. Ecosyst. Environ., 133, 208–222, https://doi.org/10.1016/J.AGEE.2009.04.022, 2009b.
Leip, A., Busto, M., Corazza, M., Bergamaschi, P., Koeble, R., Dechow, R., Monni, S., and de Vries, W.: Estimation of N2O fluxes at the regional scale: Data, models, challenges, Curr. Opin. Environ. Sustain., 3, 328–338, https://doi.org/10.1016/j.cosust.2011.07.002, 2011.
Li, C. S.: Modeling trace gas emissions from agricultural ecosystems, Nutr. Cycl. Agroecosyst., 58, 259–276, 2000.
Li, X., Yeluripati, J., Jones, E. O., Uchida, Y., and Hatano, R.: Hierarchical Bayesian calibration of nitrous oxide (N2O) and nitrogen monoxide (NO) flux module of an agro-ecosystem model: ECOSSE, Ecol Modell, 316, 14–27, https://doi.org/10.1016/J.ECOLMODEL.2015.07.020, 2015.
Lu, X.: A meta-analysis of the effects of crop residue return on crop yields and water use efficiency, PLoS One, 15, e0231740, https://doi.org/10.1371/journal.pone.0231740, 2020.
Lugato, E., Bampa, F., Panagos, P., Montanarella, L., and Jones, A.: Potential carbon sequestration of European arable soils estimated by modelling a comprehensive set of management practices, Glob. Change Biol., 20, 3557–3567, https://doi.org/10.1111/gcb.12551, 2014.
Lugato, E., Leip, A., and Jones, A.: Mitigation potential of soil carbon management overestimated by neglecting N2O emissions, Nat. Clim. Change, 8, 219–223, https://doi.org/10.1038/s41558-018-0087-z, 2018.
Lyra, A. and Loukas, A.: Impacts of irrigation and nitrate fertilization scenarios on groundwater resources quantity and quality of the Almyros Basin, Greece, Water Supp., 21, 2748–2759, https://doi.org/10.2166/ws.2021.097, 2021.
Mavromatis, T.: Spatial resolution effects on crop yield forecasts: An application to rainfed wheat yield in north Greece with CERES-Wheat, Agr. Syst., 143, 38–48, https://doi.org/10.1016/j.agsy.2015.12.002, 2016.
Molina-Herrera, S., Grote, R., Santabárbara-Ruiz, I., Kraus, D., Klatt, S., Haas, E., Kiese, R., and Butterbach-Bahl, K.: Simulation of CO2 fluxes in European forest ecosystems with the coupled soil-vegetation process model “LandscapeDNDC”, Forests, 6, 1779–1809, https://doi.org/10.3390/f6061779, 2015.
Molina-Herrera, S., Haas, E., Klatt, S., Kraus, D., Augustin, J., Magliulo, V., Tallec, T., Ceschia, E., Ammann, C., Loubet, B., Skiba, U., Jones, S., Brümmer, C., Butterbach-Bahl, K., and Kiese, R.: A modeling study on mitigation of N2O emissions and NO3 leaching at different agricultural sites across Europe using LandscapeDNDC, Sci. Total Environ., 553, 128–140, https://doi.org/10.1016/j.scitotenv.2015.12.099, 2016.
Molina-Herrera, S., Haas, E., Grote, R., Kiese, R., Klatt, S., Kraus, D., Butterbach-Bahl, K., Kampffmeyer, T., Friedrich, R., Andreae, H., Loubet, B., Ammann, C., Horváth, L., Larsen, K., Gruening, C., Frumau, A., and Butterbach-Bahl, K.: Importance of soil NO emissions for the total atmospheric NOx budget of Saxony, Germany, Atmos. Environ., 152, 61–76, https://doi.org/10.1016/J.ATMOSENV.2016.12.022, 2017.
Morris, M. D.: Factorial Sampling Plans for Preliminary Computational Experiments, Technometrics, 33, 161–174, 1991.
Musacchio, A., Re, V., Mas-Pla, J., and Sacchi, E.: EU Nitrates Directive, from theory to practice: Environmental effectiveness and influence of regional governance on its performance, Ambio, 49, 504–516, https://doi.org/10.1007/s13280-019-01197-8, 2020.
Myrgiotis, V., Rees, R. M., Topp, C. F. E., and Williams, M.: A systematic approach to identifying key parameters and processes in agroecosystem models, Ecol. Modell., 368, 344–356, https://doi.org/10.1016/j.ecolmodel.2017.12.009, 2018a.
Myrgiotis, V., Williams, M., Topp, C. F. E., and Rees, R. M.: Improving model prediction of soil N2O emissions through Bayesian calibration, Sci. Total Environ., 624, 1467–1477, https://doi.org/10.1016/j.scitotenv.2017.12.202, 2018b.
Myrgiotis, V., Williams, M., Rees, R. M., and Topp, C. F. E.: Estimating the soil N2O emission intensity of croplands in northwest Europe, Biogeosciences, 16, 1641–1655, https://doi.org/10.5194/bg-16-1641-2019, 2019.
OECD: Nutrient balance (indicator), https://data.oecd.org/agrland/nutrient-balance.htm (last access: 16 February 2020), 2020
Petersen, K., Kraus, D., Calanca, P., Semenov, M. A., Butterbach-Bahl, K., and Kiese, R.: Dynamic simulation of management events for assessing impacts of climate change on pre-alpine grassland productivity, Europ. J. Agron., 128, 126306, https://doi.org/10.1016/J.EJA.2021.126306, 2021.
Petersen, R. J., Blicher-Mathiesen, G., Rolighed, J., Andersen, H. E., and Kronvang, B.: Three decades of regulation of agricultural nitrogen losses: Experiences from the Danish Agricultural Monitoring Program, Sci. Total Environ., 787, 147619, https://doi.org/10.1016/J.SCITOTENV.2021.147619, 2021.
Portmann, F. T., Siebert, S., and Döll, P.: MIRCA2000-Global monthly irrigated and rainfed crop areas around the year 2000: A new high-resolution data set for agricultural and hydrological modeling, Global Biogeochem. Cy., 24, GB1011, https://doi.org/10.1029/2008gb003435, 2010.
Rahn, K. H., Werner, C., Kiese, R., Haas, E., and Butterbach-Bahl, K.: Parameter-induced uncertainty quantification of soil N2O, NO and CO2 emission from Höglwald spruce forest (Germany) using the LandscapeDNDC model, Biogeosciences, 9, 3983–3998, https://doi.org/10.5194/bg-9-3983-2012, 2012.
Ranucci, S., Bertolini, T., Vitale, L., di Tommasi, P., Ottaiano, L., Oliva, M., Amato, U., Fierro, A., and Magliulo, V.: The influence of management and environmental variables on soil N2O emissions in a crop system in Southern Italy, Plant Soil, 343, 83–96, https://doi.org/10.1007/s11104-010-0674-x, 2011.
Ravishankara, A. R., Daniel, J. S., and Portmann, R. W.: Nitrous oxide (N2O): The dominant ozone-depleting substance emitted in the 21st century, Science, 326, 123–125, https://doi.org/10.1126/science.1176985, 2009.
Refsgaard, J. C., van der Sluijs, J. P., Højberg, A. L., and Vanrolleghem, P. A.: Uncertainty in the environmental modelling process – A framework and guidance, Environ. Modell. Softw., 22, 1543–1556, https://doi.org/10.1016/J.ENVSOFT.2007.02.004, 2007.
Robert, C. and Casella, G.: A short history of Markov Chain Monte Carlo: Subjective recollections from incomplete data, Stat. Sci., 26, 102–115, https://doi.org/10.1214/10-STS351, 2011.
Saltelli, A., Tarantola, S., and Campolongo, F.: Sensitivity Analysis as an Ingredient of Modeling, Stat. Sci., 15, 377–395, 2000.
Santabárbara, I.: Analysis and quantification of parametric and structural uncertainty of the LandscapeDNDC model for simulating biosphere-atmosphere-hydrosphere exchange processes, Ph.D. thesis, Institute of Meteorology and Climate Research – Atmospheric Environmental Research (IMK-IFU), Karlsruhe Institute of Technology (KIT), Freiburg im Breisgau, Germany, 172 pp., 2019.
Schroeck, A. M., Gaube, V., Haas, E., and Winiwarter, W.: Estimating nitrogen flows of agricultural soils at a landscape level – A modelling study of the Upper Enns Valley, a long-term socio-ecological research region in Austria, Sci. Total Environ., 665, 275–289, https://doi.org/10.1016/j.scitotenv.2019.02.071, 2019.
Sidiropoulos, C. and Tsilingiridis, G.: Trends of livestock-related NH3, CH4, N2O and PM emissions in Greece, Water Air Soil Pollut., 199, 277–289, https://doi.org/10.1007/s11270-008-9877-7, 2009.
Smerald, A., Fuchs, K., Kraus, D., Butterbach-Bahl, K., and Scheer, C.: Significant Global Yield-Gap Closing Is Possible Without Increasing the Intensity of Environmentally Harmful Nitrogen Losses, Front Sustain Food Syst, 6, 736394, https://doi.org/10.3389/fsufs.2022.736394, 2022.
Smith, P., Martino, D., Cai, Z., Gwary, D., Janzen, H., Kumar, P., McCarl, B., Ogle, S., O'Mara, F., Rice, C., Scholes, B., Sirotenko, O., Howden, M., McAllister, T., Pan, G., Romanenkov, V., Schneider, U., Towprayoon, S., Wattenbach, M., and Smith, J.: Greenhouse gas mitigation in agriculture, Philos. T. R. Soc. B, 363, 789–813, https://doi.org/10.1098/rstb.2007.2184, 2008.
Stehfest, E. and Bouwman, L.: N2O and NO emission from agricultural fields and soils under natural vegetation: Summarizing available measurement data and modeling of global annual emissions, Nutr. Cycl. Agroecosyst., 74, 207–228, https://doi.org/10.1007/s10705-006-9000-7, 2006.
Sutton, M. A., Reis, S., Riddick, S. N., Dragosits, U., Nemitz, E., Theobald, M. R., Tang, Y. S., Braban, C. F., Vieno, M., Dore, A. J., Mitchell, R. F., Wanless, S., Daunt, F., Fowler, D., Blackall, T. D., Milford, C., Flechard, C. R., Loubet, B., Massad, R., Cellier, P., Personne, E., Coheur, P. F., Clarisse, L., van Damme, M., Ngadi, Y., Clerbaux, C., Skjøth, C. A., Geels, C., Hertel, O., Kruit, R. J. W., Pinder, R. W., Bash, J. O., Walker, J. T., Simpson, D., Horváth, L., Misselbrook, T. H., Bleeker, A., Dentener, F., and de Vries, W.: Towards a climate-dependent paradigm of ammonia emission and deposition, Philos. T. R. Soc. B, 368, 20130166, https://doi.org/10.1098/rstb.2013.0166, 2013.
Thomas, D., Johannes, K., David, K., Rüdiger, G., and Ralf, K.: Impacts of management and climate change on nitrate leaching in a forested karst area, J. Environ. Manag., 165, 243–252, https://doi.org/10.1016/J.JENVMAN.2015.09.039, 2016.
Thompson, R. L., Lassaletta, L., Patra, P. K., Wilson, C., Wells, K. C., Gressent, A., Koffi, E. N., Chipperfield, M. P., Winiwarter, W., Davidson, E. A., Tian, H., and Canadell, J. G.: Acceleration of global N2O emissions seen from two decades of atmospheric inversion, Nat. Clim. Change, 9, 993–998, https://doi.org/10.1038/s41558-019-0613-7, 2019.
Tsakmakis, I. D., Kokkos, N. P., Gikas, G. D., Pisinaras, V., Hatzigiannakis, E., Arampatzis, G., and Sylaios, G. K.: Evaluation of AquaCrop model simulations of cotton growth under deficit irrigation with an emphasis on root growth and water extraction patterns, Agr. Water Manag., 213, 419–432, https://doi.org/10.1016/j.agwat.2018.10.029, 2019.
Velthof, G. L., Oudendag, D., Witzke, H. P., Asman, W. A. H., Klimont, Z., and Oenema, O.: Integrated Assessment of Nitrogen Losses from Agriculture in EU-27 using MITERRA-EUROPE, J. Environ. Qual., 38, 402–417, https://doi.org/10.2134/jeq2008.0108, 2009.
Vogeler, I., Giltrap, D., and Cichota, R.: Comparison of APSIM and DNDC simulations of nitrogen transformations and N2O emissions, Sci. Total Environ., 465, 147–155, https://doi.org/10.1016/j.scitotenv.2012.09.021, 2013.
Voloudakis, D., Karamanos, A., Economou, G., Kalivas, D., Vahamidis, P., Kotoulas, V., Kapsomenakis, J., and Zerefos, C.: Prediction of climate change impacts on cotton yields in Greece under eight climatic models using the AquaCrop crop simulation model and discriminant function analysis, Agr. Water Manag., 147, 116–128, https://doi.org/10.1016/j.agwat.2014.07.028, 2015.
Wang, G. and Chen, S.: A review on parameterization and uncertainty in modeling greenhouse gas emissions from soil, Geoderma, 170, 206–216, https://doi.org/10.1016/J.GEODERMA.2011.11.009, 2012.
Werner, C., Haas, E., Grote, R., Gauder, M., Graeff-Hönninger, S., Claupein, W., and Butterbach-Bahl, K.: Biomass production potential from Populus short rotation systems in Romania, GCB Bioenergy, 4, 642–653, https://doi.org/10.1111/j.1757-1707.2012.01180.x, 2012.
Zhang, W., Liu, C., Zheng, X., Zhou, Z., Cui, F., Zhu, B., Haas, E., Klatt, S., Butterbach-Bahl, K., and Kiese, R.: Comparison of the DNDC, LandscapeDNDC and IAP-N-GAS models for simulating nitrous oxide and nitric oxide emissions from the winter wheat–summer maize rotation system, Agr. Syst., 140, 1–10, https://doi.org/10.1016/J.AGSY.2015.08.003, 2015.
Zistl-Schlingmann, M., Kwatcho Kengdo, S., Kiese, R., and Dannenmann, M.: Management Intensity Controls Nitrogen-Use-Efficiency and Flows in Grasslands – A 15N Tracing Experiment, Agronomy, 10, 1–15, https://doi.org/10.3390/agronomy10040606, 2020.