the Creative Commons Attribution 4.0 License.
the Creative Commons Attribution 4.0 License.
 | 20 Jun 2025
Technical note: Investigating saline water uptake by roots using spectral induced polarization
Solomon Ehosioke
Sarah Garré
Johan Alexander Huisman
Egon Zimmermann
Mathieu Javaux
Frédéric Nguyen
Developments in the methods available for root investigation in recent years have enabled many studies to be carried out on roots, which represent the hidden half of the plant. Despite the increased number of studies on roots, there are still knowledge gaps in our understanding of the electromagnetic properties of plant roots, which will be useful to quantify plant properties and monitor plant physiological responses to dynamic environmental factors amidst climate change. In this study, we evaluated the suitability of spectral induced polarization (SIP) for the noninvasive assessment of root activity. We investigated the electrical properties of the primary roots of Brachypodium distachyon L. and Zea mays L. during the uptake of fresh and saline water using SIP measurements in a frequency range from 1 Hz to 45 kHz. The results show that SIP is able to detect the uptake of water and saline water in both species and that their electrical signatures were influenced by the solute concentration. The resistivity and phase response of both species increased with solute concentration until a certain threshold before it decreased. This concentration threshold was much higher in maize than in Brachypodium, which implies that tolerance to salinity varies with species and that maize is more tolerant to salinity than Brachypodium. We conclude that SIP is a useful tool for monitoring root activity and could be adapted for the early detection of salt stress in plants.
- Article
(3591 KB) - Full-text XML
- BibTeX
- EndNote


Sustainable global crop production is challenged by several unfavorable environmental factors such as drought, extreme temperatures, salinity, nutrient deficiency and soil contamination. For example, more than 800×106 ha of land globally is affected by salinity and excessive sodium content (FAO, 2005; Munns, 2005). High salt concentrations in soils induce plant stress due to low external water potential, oxidative stress by excessive generation of reactive oxygen species, ion toxicity (Na+ and/or Cl−) or nutrient deficiency by interfering with the uptake and transport of various essential nutrients (Munns et al., 2006; Läuchli and Grattan, 2012; Hussain et al., 2013; Negrão et al., 2017; Isayenkov and Maathuis, 2019). The stress magnitude depends on the species, duration of salinity exposure, growth stage and environmental conditions (Munns and Tester, 2008). Accumulation of sodium and chloride ions at toxic levels in plant tissue damages biological membranes and subcellular organelles, reducing plant growth and development (Davenport et al., 2005; Zhao et al., 2010; Farooq et al., 2015; Isayenkov and Maathuis, 2019). Sodium may also displace calcium from the binding site of the cell membrane, which can result in membrane leakiness (Cramer et al., 1988). Geophysical electrical methods have extensively been used to study root water uptake in soils (e.g., Michot et al., 2003; Garré et al., 2011; Beff et al., 2013; Ehosioke et al., 2020) and soil salinity (e.g., Rhoades et al., 1999; Bennett et al., 2000; Doolittle et al., 2001; Ben Hamed et al., 2016; Shahnazaryan et al., 2018). Due to their sensitivity to salinity, they provide a natural means to noninvasively study the impact of salt stress on roots given the analogy between water flow and electrical current flow in roots.
Spectral induced polarization (SIP), also known as electrical impedance spectroscopy (EIS), has been successfully used to study various plant physiological processes, such as growth (Ozier-Lafontaine and Bajazet, 2005; Repo et al., 2005), mycorrhizal colonization (Cseresnyés et al., 2013; Repo et al., 2014), cold acclimation (Repo et al., 2016), nutrient deprivation (Weigand and Kemna, 2017, 2019), effects of salt stress on growth (Ben Hamed et al., 2016) and diurnal cycles in root uptake activity (Cseresnyés et al., 2024). In the interpretation of these SIP measurements, it is assumed that current pathways in the extracellular (apoplast) and intercellular (plasmodesmata and aquaporins) spaces play an important role in electrical charge migration and storage (Kinraide, 2001; Kinraide and Wang, 2010; Weigand and Kemna, 2019; Kessouri et al., 2019; Ehosioke et al., 2020) (Fig. 1). In particular, current conduction is assumed to depend on the electrical properties of the apoplast and the ionic composition of the extracellular fluid (ECF), whereas polarization is assumed to occur at the cell membrane interface because charged particles, such as Na+, Ca2+, K+ and Cl− ions, and amino acids cannot diffuse directly across the cell membrane. Instead, they can only cross the membrane through ion pumps and ion channels, whose opening and closing are regulated by the membrane potential difference. Polarization is also expected to occur at the outer root surface (i.e., the root–soil interface), where the charge distribution that determines polarization depends on the concentration of ions in the external fluid (Weigand and Kemna, 2017, 2019). It is important to note that living tissues are equivalent to parallel resistor and capacitor (RC) circuits, which have a characteristic phase angle that depends on the alternating-current (AC) frequency. Thus, conduction and polarization mechanisms are dependent on frequency (see current pathways in Fig. 1b and c) and can be assessed simultaneously by measuring the frequency-dependent electrical impedance of a biological tissue using SIP. The suitability of this method for investigating root responses to salt stress is not well known and has rarely been studied (Ben Hamed et al., 2016; Cseresnyés et al., 2024).
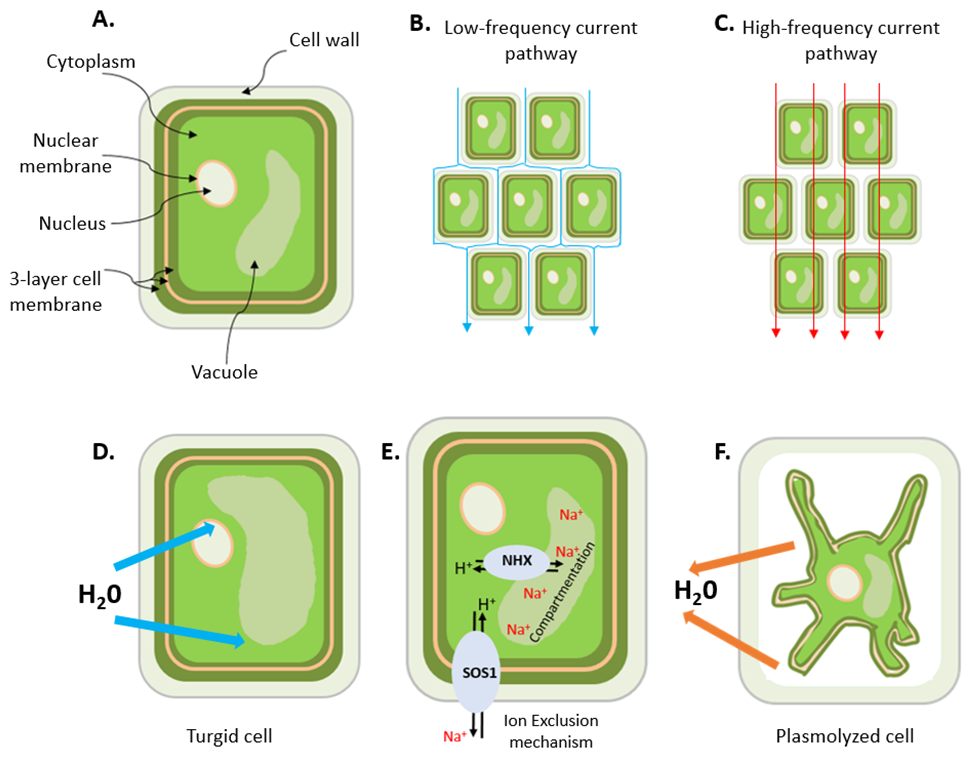
Figure 1Schematic illustration of (a) a plant cell showing some of the organelles (vacuole, nucleus and nuclear membranes), the cell wall and the three-layer (protein–lipid–protein) cell membrane; (b) the low-frequency current pathway; (c) the high-frequency current pathway; (d) a turgid cell resulting from the uptake of water; (e) the early-stage response to salt stress in a plant root cell (adapted from Deinlein et al., 2014), which involves the activation of cellular detoxification mechanisms, including NHX and SOS Na+ transport mechanisms (NHX: exchanger; SOS: salt overly sensitive); and (f) a plasmolyzed cell due to the excessive loss of water. A plasmolyzed cell can occur at a later stage of salt stress: when there are excess ions in the solution because the root cells can no longer exclude or compartment them into the vacuole, water leaves the cell by osmosis leading to plasmolysis.
Plants respond to salt stress by adaptive mechanisms such as root exclusion of excess sodium in the surrounding water or compartmentation, thereby removing toxic ions from the cytoplasm, where sensitive metabolic processes occur (Hasegawa et al., 2000; Munns and Tester, 2008; Zhao et al., 2020), into the vacuole (Neubert et al., 2005; Farooq et al., 2015; Isayenkov and Maathuis, 2019). These two adaptive mechanisms are independent, but their effectiveness varies across species (Grieve et al., 2012; Acosta-Motos et al., 2017). They modify the ionic composition of the extracellular and intracellular fluids (Fig. 1e), which suggests that these adaptive mechanisms can possibly also be detected by SIP. For example, Ben Hamed et al. (2016) investigated the use of EIS to noninvasively assess salt resistance and the signaling and short-term (0–240 min) response of sea rocket (Cakile maritima) to salinity. They found that the frequency-dependent impedance of leaves changed with increasing salinity as well as the duration of stress for plants grown in sand and under hydroponic culture conditions. In particular, it was observed that, for a group of 10 plants exposed to increasing salinity, the electrical resistance of the leaves increased in the presence of 50–100 mM NaCl, but it decreased for salinity above 100 mM NaCl, with the lowest value observed at 400 mM NaCl. For another group of 10 plants exposed to a 400 mM NaCl treatment over 240 min, the electrical resistance increased during the early stages of salt stress, reached a maximum after 180 min and then declined rapidly. The increasing electrical resistance within the tolerable range of salinity for growth (50–100 mM NaCl) was attributed to low salt movement in leaf cells due to the compartmentation of salt ions in the leaf vacuoles, as reported in previous studies (e.g., Debez et al., 2004; Ellouzi et al., 2011), while the decrease in electrical resistance at salinities above 100 mM NaCl was interpreted as an indication of the increased movement of salt ions in the leaf cells, most probably in the apoplastic space. Similarly, Ellouzi et al. (2011) reported rapid accumulation of Na+ in the vacuole and the reestablishment of osmotic homeostasis shortly after salt treatment (400 mM NaCl for 4 h). They also observed a decrease in the electrical resistance of leaves of salt-treated plants, which was closely correlated with the increased accumulation of Na+ in the vacuole. These studies suggest that the electrical resistance of salt-stressed plants varies with the degree of salinity and the duration of salt stress. This implies that the accumulation of Na+ and Cl− ions in the cytoplasm and apoplast will take a long time to reach toxic levels when the salt concentration is low. At very high salt concentrations, it is expected that a toxic level will be attained much faster – this could happen in a couple of minutes (e.g., Ben Hamed et al., 2016).
Despite these interesting studies, the suitability of SIP as a tool to study the plant response to salinity has not been thoroughly investigated, and the few existing studies have focused mainly on plant leaves. However, the root cells are the first target of soil salinity, and more studies are still needed to better understand how roots respond to salt stress. Therefore, the aim of this study is to evaluate the SIP response of Brachypodium and maize primary roots subjected to different levels of salinity and to link the observed changes in electrical properties with the salt adaptation mechanisms of plants to obtain further insights into the ability of SIP to detect salt stress in plant roots.
2.1 Investigated plants and salt solutions
Brachypodium (Brachypodium distachyon L.) and maize (Zea mays L.) were studied under different salinity treatments. Brachypodium distachyon L. is a salt-sensitive plant that can tolerate salt stress below 200 mM NaCl (e.g., Lv et al., 2014; Guo et al., 2022). Zea mays L. is moderately sensitive to salt stress (Kaddah and Ghowail, 1964; Farooq et al., 2015) and can tolerate relatively high salinity levels of up to 400 mM NaCl (e.g., de Azevedo Neto et al., 2004), depending on the genotype. Plants of both species were grown in the laboratory under daylight conditions (without artificial light), at normal humidity and at an average temperature of 23.2 °C. They were grown in plastic tubes (5 × 20 cm) using a mixture of fine and coarse sand with a grain size distribution ranging from 0.1 to 1.0 mm (Ehosioke et al., 2023). The plants were watered with tap water at 2 d intervals and were sampled at 20 d after sowing (DAS). The average diameter of the Brachypodium and maize primary roots were 0.22 and 0.89 mm, respectively. Both plant types were in the three-leaf stage at the time of measurement. Before each SIP measurement, the plant was removed from the growth tube and the sand particles on the roots were gently removed.
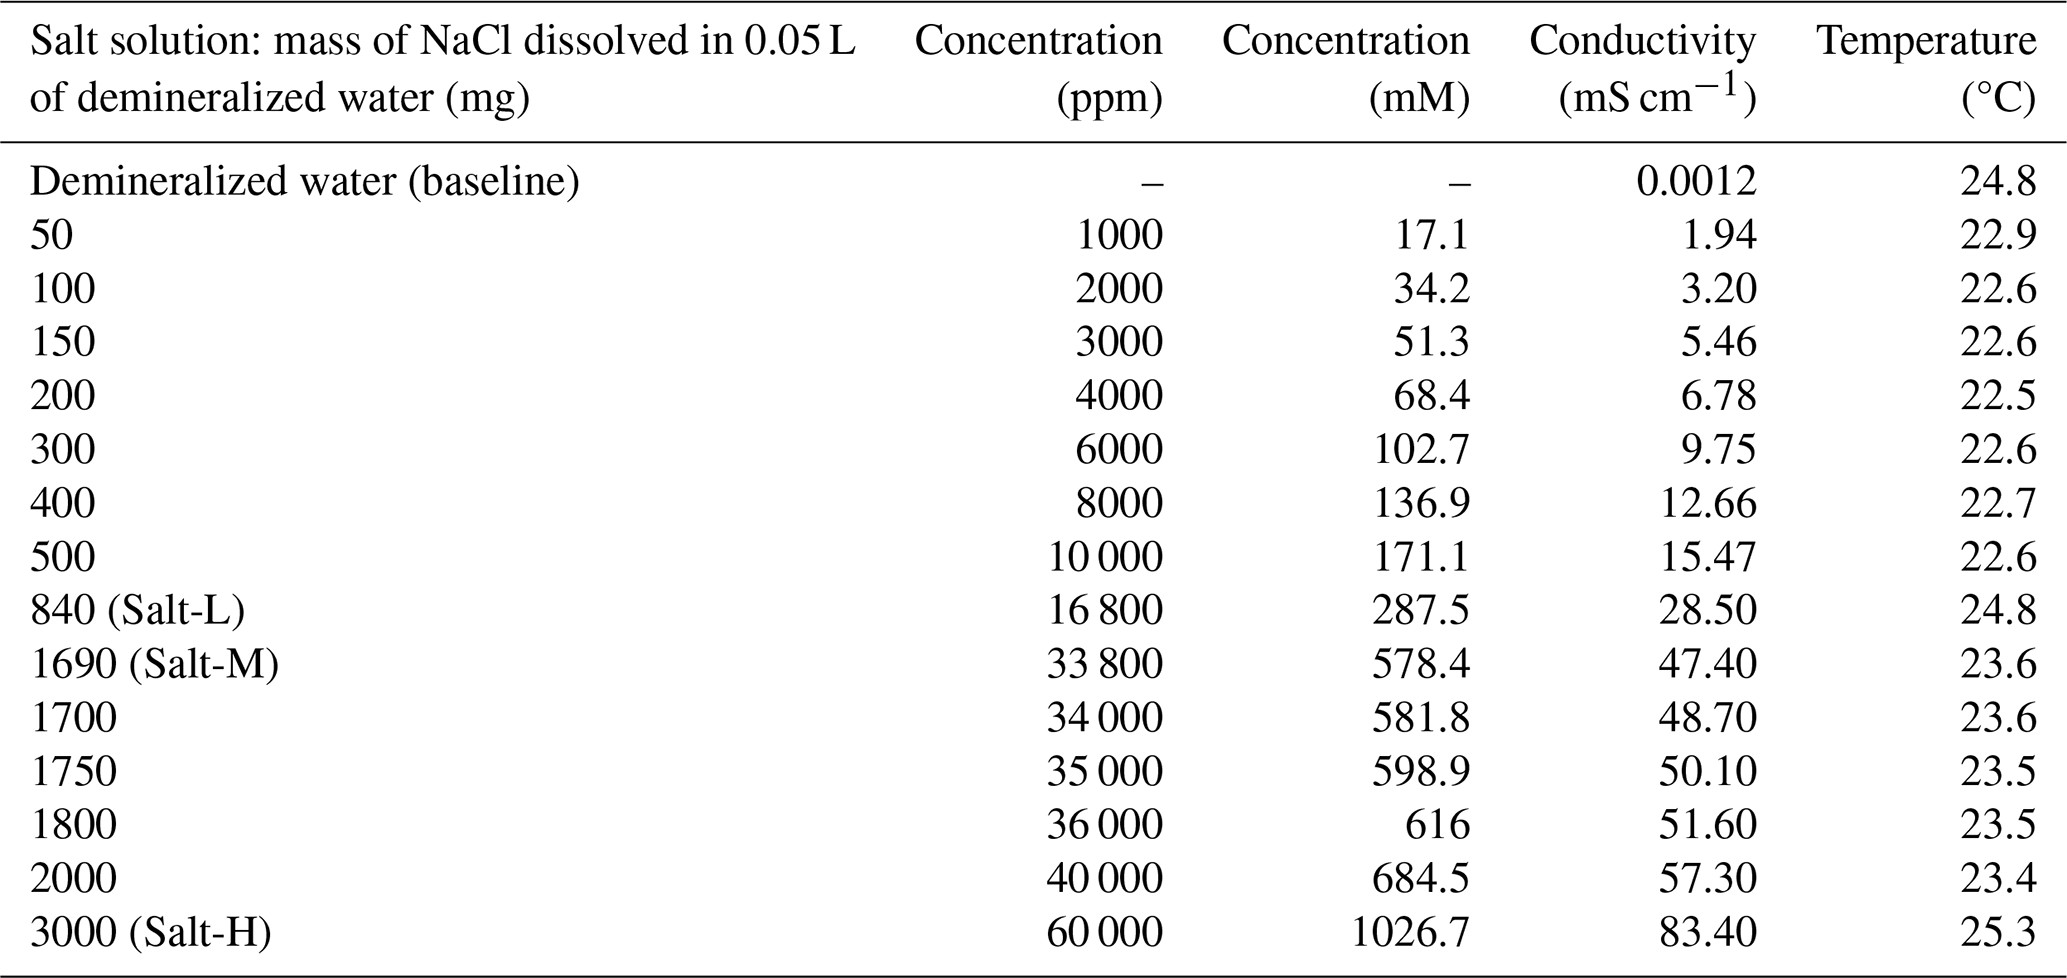
Salt solutions were prepared by dissolving sodium chloride (NaCl) in demineralized water. The electrical conductivity was measured using a conductivity meter (HQ14D, HACH, Mechelen, Belgium). A total of 14 salt solutions with different concentrations were prepared (Table 1). The resulting concentration is presented in parts per million. The nomenclature to describe different types of saline water based on concentration and electrical conductivity is presented in Table A1 in the Appendix.
Table 1Description of salt solutions used during the experiments.
2.2 Measurement setup
The measurement setup consists of a precision balance (2000, Mettler), sampling container, SIP measurement system and a sample holder especially designed for root segments (Fig. 2; Ehosioke et al., 2023). We used the high-precision balance for a precise measurement of the uptake. The SIP measurement system is made up of a data acquisition (DAQ) card (NI USB-4431), an amplifier unit (ZEA-2-SIP04-V05), a function generator (Keysight 33511B), triaxial cables and a computer. A detailed description of the SIP measurement system and the specialized sample holder are provided in Ehosioke et al. (2023).
The SIP measurement is performed by injecting alternating current at different frequencies (1 Hz–45 kHz) and a voltage of 5 V into a sample and measuring the amplitude and phase lag of the resulting voltage, which leads to a frequency-dependent electrical impedance that is expressed as follows:
where is the complex impedance, ω is the angular frequency, Z′ and Z′′ are the respective real and imaginary parts of the complex impedance, and j is the imaginary unit. The complex impedance can be converted into the complex electrical conductivity or electrical resistivity by accounting for the dimension of the sample using a geometric factor (, where d is the root diameter and l is the root length):
where φ is the phase shift and |ρ| is the resistivity magnitude. The relationship between complex conductivity and complex resistivity is expressed as follows:
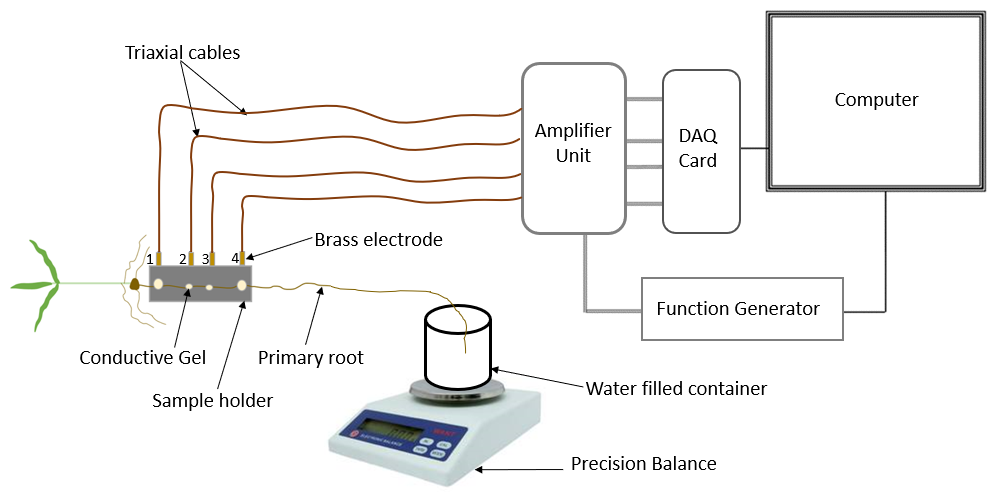
Figure 2Measurement setup for investigating the electrical response of roots during water uptake.
2.3 Measurement protocol
Preliminary SIP measurements were performed on the roots of maize and Brachypodium plants in air in order to investigate the effect of root drying on the SIP response. For this, one plant of each species was sampled. The root was mounted in the sample holder, and SIP measurements were taken at 5 min intervals for a total duration of 20 min with the root in the same position (see Fig. 2).
To investigate the response to water and salt uptake, the root was mounted on the sample holder, and an initial SIP measurement was performed that forms the baseline. After this, the root apex was tipped into 50 mL demineralized water (e.g., Rewald et al., 2011; Li et al., 2016) or saline water of known conductivity in a 60 mL sampling container (Fig. 2). The weight of the water, the container and the root tip was recorded every 5 min for a total duration of 20 min. Temperature and humidity were recorded at the end of the experiment. In the case of water uptake, SIP measurements were acquired on one plant for each species using the same measurement strategy to serve as a reference to help interpret the electrical response of roots to the uptake of salt solutions.
The SIP response of roots in different salt solutions was investigated in two experiments. In a first experiment, we exposed two plants of each species to two different salt solutions, i.e., Salt-L and Salt-H (see Table 1), sampling a total of four plants. The SIP measurements were performed at a 5 min interval over a 20 min duration while the root apex was tipped in salt solution. In the second experiment, the effect of varying salt concentrations on the SIP response of the roots was investigated. To achieve this, the measurement procedure described above was repeated with seven different salt solutions for Brachypodium (1000–10 000 ppm) and another seven different salt solutions for maize (16 800–60 000 ppm) (see Table 1). Thus, a total of 14 plants were sampled in this experiment. To estimate evaporative loss during SIP measurements, an empty sample container with 50 mL of demineralized water was left open on the balance, and the mass of this container was measured every 5 min over a 20 min duration. This procedure was repeated for the salt solutions to estimate the loss of water from the container due to evaporation. The evaporative loss was found to be 40 mg in 20 min for both demineralized and saline water. The temperature and humidity at the time of measurement was also recorded (see Table B1 in Appendix B). The net amount of solution absorbed by the root during each measurement corresponds to the weight difference corrected for the estimated loss by evaporation.
3.1 SIP monitoring of root desiccation
The resistivity magnitude and phase of exposed Brachypodium and maize roots are shown in Fig. 3. We can observe that the resistivity values of root segments of both species increased when the roots were exposed in the air. Water content plays a key role in maintaining the structural properties and physiological processes of the cell membrane (Crowe and Crowe, 1982). Loss of water from roots may lead to a loss of turgor pressure (plasmolysis), which can result in a decrease in cell volume depending on the cell wall hardness (Verslues et al., 2006; Robbins and Dinneny, 2015), a decrease in cell membrane surface area and (in severe cases) cell membrane injury (Lew, 1996; Ando et al., 2014). Wu et al. (2008) reported an increase in total impedance during the dehydration of eggplant pulp. Islam et al. (2019) also observed an increase in the total impedance of onions during drying over a period of 21 d. They concluded that the movement of ions due to dehydration is responsible for the increased impedance. The increase in resistivity observed in our study for maize and Brachypodium roots is due to a loss of water from the root cells (dehydration) due to evaporation. The increase in resistivity is higher for Brachypodium (a 78 Ωm increase in 20 min after the baseline measurement of 68 Ωm) than for maize (a 7 Ωm increase in 20 min after a baseline measurement of 16 Ωm), with respect to both absolute and relative values. This suggests that Brachypodium roots lost water faster than maize in our experiment. We had expected that maize would lose more water because of the larger surface area, but the result suggests that something other than surface area influenced the root dehydration – possibly the degree of saturation. As maize roots were observed to be succulent and white in color, whereas Brachypodium roots were dry and brownish in this study, it should take longer for maize roots to lose sufficient water and become plasmolyzed compared to Brachypodium roots. Shrinkage of Brachypodium roots was clearly visible at the end of the measurement, whereas maize appeared dry on the surface but showed no significant shrinkage. The noisier data observed for Brachypodium are attributed to the high contact impedance of the root induced by the shrinkage of Brachypodium root during drying. Over the exposition time of 20 min, the polarization (phase peak) of Brachypodium decreased from 870 mrad at 6.3 kHz to 570 mrad at 1 kHz, whereas that of maize first increased from 510 mrad at 45 kHz to 560 mrad at 39.8 kHz, followed by a stabilization. In a plasmolyzed cell, cell membranes shrink (see Fig. 1), which is expected to result in a decrease in the phase response. It seems that Brachypodium roots might have become plasmolyzed due to water loss (Lew, 1996; Ando et al., 2014; Robbins and Dinneney, 2015), while maize roots were probably not plasmolyzed but rather experienced osmotic adjustments via the redistribution of water to maintain equilibrium (e.g., Sharp et al., 1990; Ogawa and Yamauchi, 2006; Hajlaoui et al., 2010). This might explain why the phase response of maize did not decrease. It is important to note that the leaves of both plants did not show any sign of wilting during the desiccation test (see Figs. C1a and C2a in Appendix C).
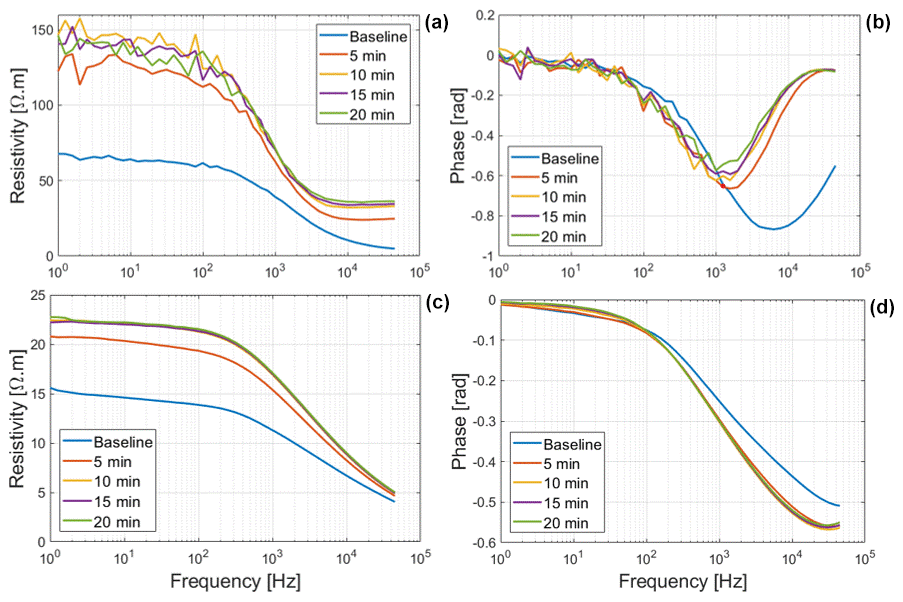
Figure 3Resistivity and phase response of Brachypodium (a–b) and maize (c–d) primary roots to drying.
3.2 SIP monitoring of roots with their tips in demineralized water
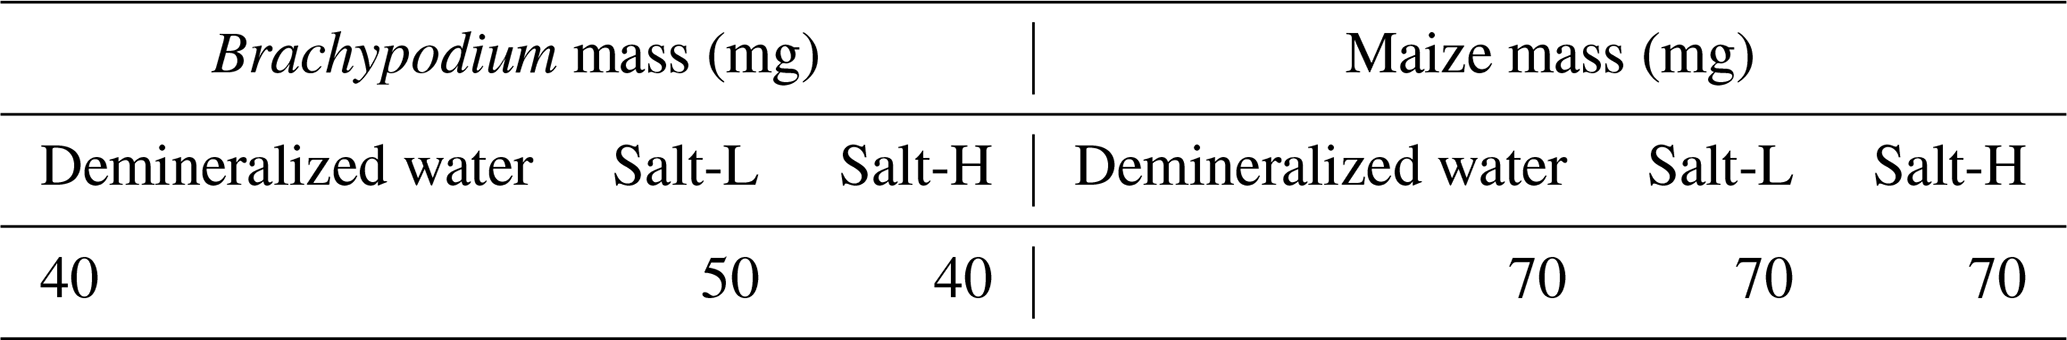
The net mass of water uptake by the roots after correcting for evaporative loss was 40 and 70 mg for Brachypodium and maize root, respectively (see Table 2). The maize absorbed more water compared to Brachypodium because its leaf surface area is larger and, thus, has a larger canopy transpiration.
Table 2Net uptake of demineralized water and saline water by Brachypodium and maize roots in 20 min.
For both species, the resistivity magnitude shows an increase with a greater effect at low frequencies (<1 kHz) and almost no effect at high frequencies (>10 kHz) for maize (Fig. 4). According to the conduction mechanisms illustrated in Fig. 1, this suggests that extracellular fluid is diluted by demineralized water, which results in the observed higher resistivity. The polarization (phase peak) of Brachypodium showed a temporal trend over the measurement duration, whereas that of maize remained mostly constant after an initial increase for a broad range of frequencies (10–10 000 Hz), which is consistent with its resistivity magnitude. Uptake of demineralized water may lead to the dilution of cellular solutes (Schopfer, 2006), which can decrease the water potential gradient across the cell membrane that drives water movement (Robbins and Dinneny, 2015). This adjustment will be reflected in the transmembrane potential leading to the polarization effect, and the phase peak could reflect the water redistribution and equilibrium reached as the cell regains full turgor. The phase response of Brachypodium root might be linked to the adjustment of the transmembrane potential, while the steady increase in phase response of maize suggests that its transmembrane potential might be in equilibrium.
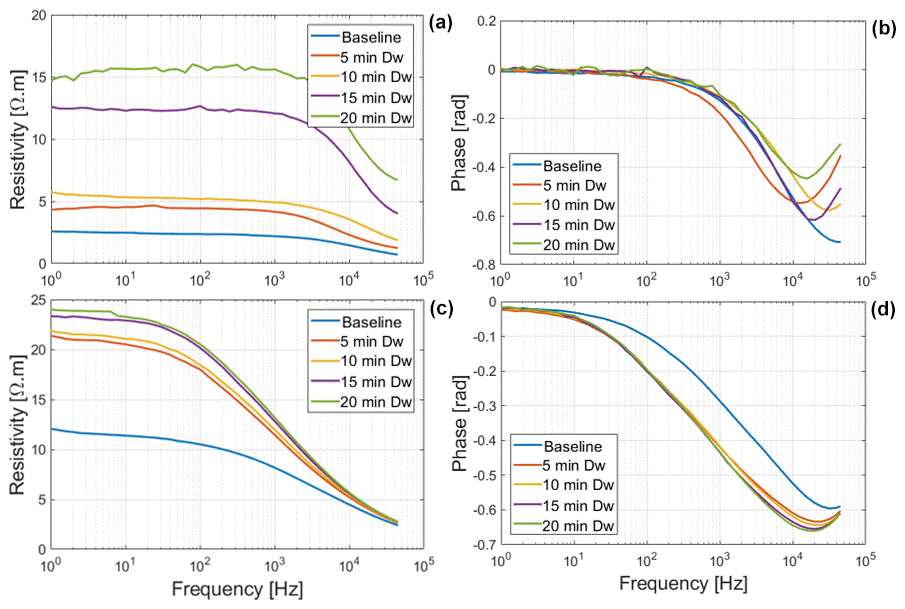
Figure 4Resistivity magnitude and phase spectra of Brachypodium (a–b) and maize (c–d) primary roots during the absorption of demineralized water. The variable temporal development of the resistivity magnitude might be due to the high contact impedance of the Brachypodium root.
3.3 SIP monitoring of roots with their tips in saline water
The net mass of saline water (Salt-LSalt-H) absorbed by the roots was similar with and mg for Brachypodium and maize roots, respectively (Table 2). For the low salt concentration (Salt-L), the SIP response of maize (Fig. 5) showed a similar response to that in the case of demineralized water, with an increasing resistivity magnitude and phase. In contrast, the Brachypodium root segments showed a continuous decrease in resistivity magnitude and phase. This opposite behavior may be explained in terms of salt stress tolerance. Maize is known to be moderately sensitive to salt stress (Farooq et al., 2015). Maize roots are able to take up water while excluding salts, making it more robust to salinity stress (Neubert et al., 2005; Farooq et al., 2015; Munns et al., 2020). This may explain why the SIP response of maize at this salt concentration level is like that of demineralized water. Apparently, the concentration of the Salt-L solution was already too high for Brachypodium to exclude or compartment salt in the vacuole (e.g., Lv et al., 2014), and the excess accumulation of ions in the root cell resulted in the observed decrease in resistivity and polarization (phase peak). Additionally, after 20 min of measurement with the Brachypodium root tip in Salt-L, the Brachypodium leaves showed visible signs of wilting (see Fig. C2b in Appendix C), which is a key sign of salt toxicity in plants (e.g., Ji et al., 2022; Plant Ditech, 2024). Similar signs of leaf wilting was observed in maize leaves after 20 min of measurement with the root tip in 40 000 ppm (684 mM) saline water (see Fig. C1b in Appendix C). Drought is also known to cause the wilting of leaves. However, the absence of wilting when the root tip was not in saline solution for the same duration confirms that the wilting observed in this study is a clear indication that the plants experienced salt toxicity.
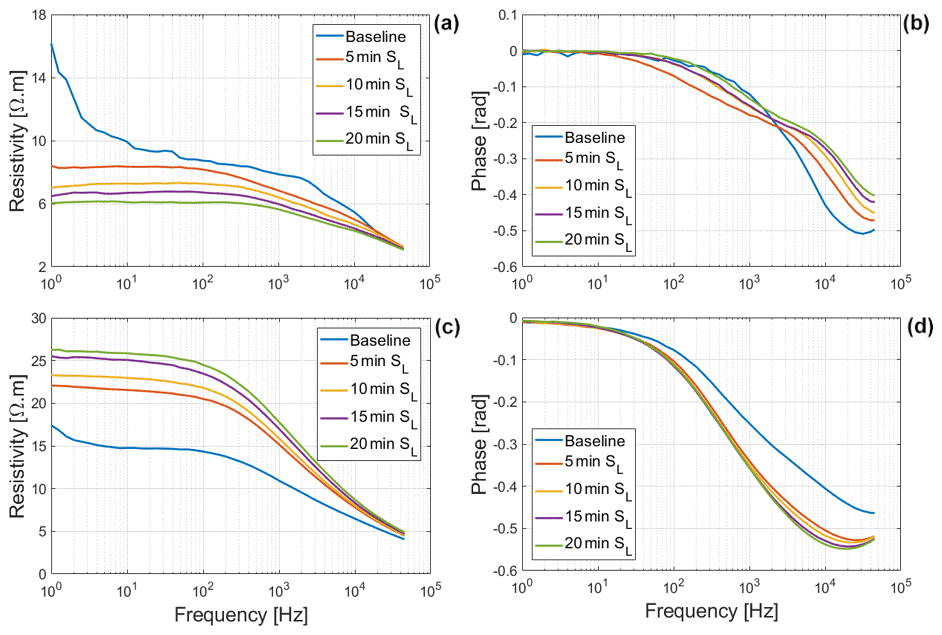
Figure 5Changes in resistivity magnitude and phase spectra of Brachypodium (a–b) and maize (c–d) primary roots during the absorption of saline water (Salt-L).
During the uptake of water with a high salt concentration (Salt-H) (Fig. 6), it is interesting to see that both maize and Brachypodium roots showed similar responses, displaying a consistent decrease in both resistivity magnitude and phase. This consistent decrease for both species suggests the excessive accumulation of ions in the cytoplasm and apoplast, which makes the roots more conductive (Debez et al., 2004; Ellouzi et al., 2011). At this high salt concentration (Salt-H), the plant cells apparently cannot exclude all of the sodium and chloride ions or compartment them in the vacuole. This is probably the beginning of toxicity effects, although it will take time for the damage to be visible. This early detection of ion toxicity is a key advantage of SIP for root salinity studies (Ben Hamed et al., 2016). Additionally, salinity can lead to membrane damage with increased permeability (e.g., Cseresnyés et al., 2018), which might have contributed to the changes observed in this study.
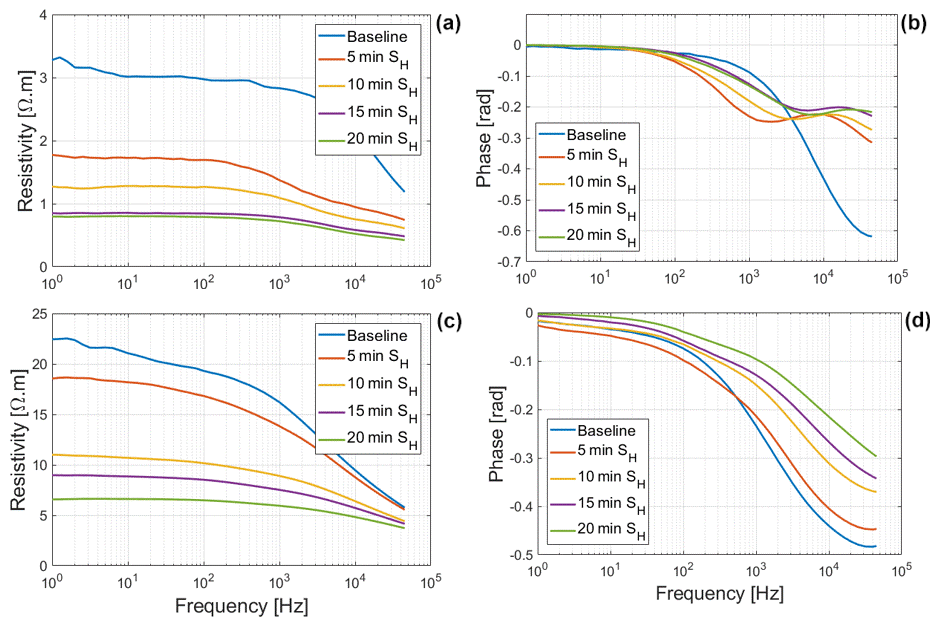
Figure 6Changes in resistivity and phase spectra of Brachypodium (a–b) and maize (c–d) primary roots during the absorption of saline water (Salt-H).
3.4 Replicate measurements on maize and Brachypodium roots
Several replicate measurements on maize and Brachypodium roots were performed prior to the results reported in Figs. 3–6, to ensure the consistency of our observations in both species. The root tips were exposed in the air for 5 min after the baseline measurement (to observe the effect of desiccation) before putting the root tip in demineralized water and saline water. We observed that the responses to desiccation, water and saline water uptake were similar across the replicates (see Figs. D1 and D2 in Appendix D). Saline water (Salt-L) uptake by the maize root was monitored for 60 min, and both resistivity and phase showed a consistent increase (see Fig. D3a–b in Appendix D). A different saline water with a higher concentration of 33 800 ppm (Salt-M) showed an increase in resistivity and phase only in the first 15 min (see Fig. D3c–d in Appendix D). These results confirm the reproducibility of our observations.
3.5 SIP monitoring of roots taking up water of gradually increasing salinity
The SIP response of maize and Brachypodium roots to increasing salinity is presented in Fig. 7. Note that the range of salinity used for both species is different due to their different tolerance to salt stress. In general, a similar resistivity response was observed for both species (Fig. 7a and c), showing either an increase or a decrease in resistivity depending on the solute concentration, although with a different threshold due to their different levels of salt stress tolerance. For maize roots, the phase response is like the resistivity response, showing either an increase or decrease with concentration over time (Fig. 7b) for a concentration threshold between 34 000 and 35 000 ppm. For Brachypodium roots, a decrease in phase is observed at all concentrations after 10 min (Fig. 7d). Only at low concentration (below 4000 ppm) was an initial increase in phase observed in the first 10 min of the experiment. In this experiment, each salinity level was tested on a single root. This experimental design might have limited the statistical robustness; thus, further studies should consider replicate measurement for each salinity level.
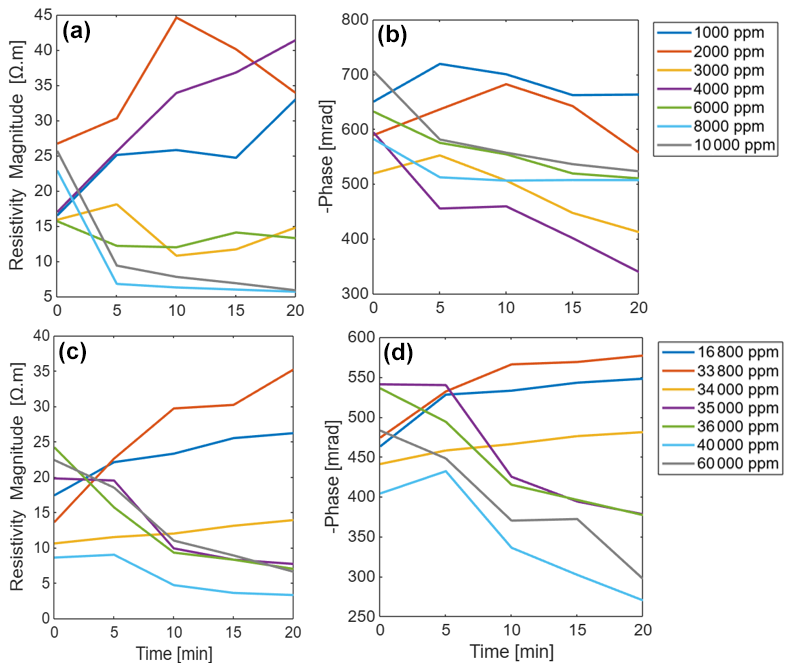
Figure 7Changes in the resistivity magnitude and phase peak of primary roots of Brachypodium (a–b) and maize (c–d) with concentration over time.
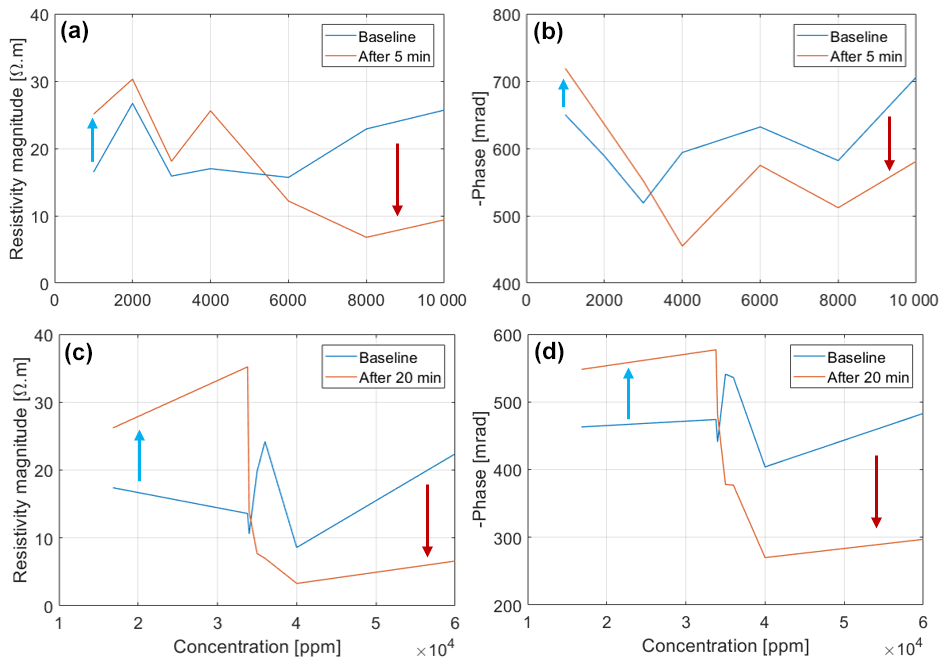
Figure 8Reversal of the resistivity magnitude and phase peak of Brachypodium (a–b) and maize (c–d) primary roots as concentration increases.
The adaptive mechanisms to salt stress may explain why the resistivity and phase response of the roots increased at low salt concentrations and decreased at high salt concentrations (Fig. 8). With increasing salt concentration, excessive sodium accumulation in the cells occurs when the salt resistance threshold of the plant species is exceeded (Cramer et al., 1988; Davenport et al., 2005; Zhao et al., 2010; Farooq et al., 2015; Isayenkov and Maathuis, 2019). Excess ions in the cell will increase the conductivity of the cellular fluid leading to decreased resistivity and phase (e.g., Figs. 7 and 8). The disparity between the phase response of maize root and Brachypodium root with increasing salinity may be related to the salt resistance mechanisms of the species. For example, some maize genotypes can tolerate high salinity levels of up to 400 mM NaCl (e.g., de Azevedo Neto et al., 2004), whereas Brachypodium can tolerate salinity stress below 200 mM NaCl (e.g., Guo et al., 2022). These results seem to confirm that maize is more tolerant to salinity than Brachypodium (see Sect. 2.1), with maize showing an increasing resistivity and phase response up to 34 000 ppm before decreasing (Fig. 8a and b), whereas Brachypodium shows increasing resistivity only up to 5800 ppm before decreasing (Fig. 8c). The reversal of phase response in Brachypodium occurs at 3000 ppm, but it is only visible in the first 5 min (Fig. 8d). The threshold at which the reversal occurs in maize falls within the range of very highly saline water, whereas that of Brachypodium lies in the range of moderately saline water (see Table A1 in the Appendix).
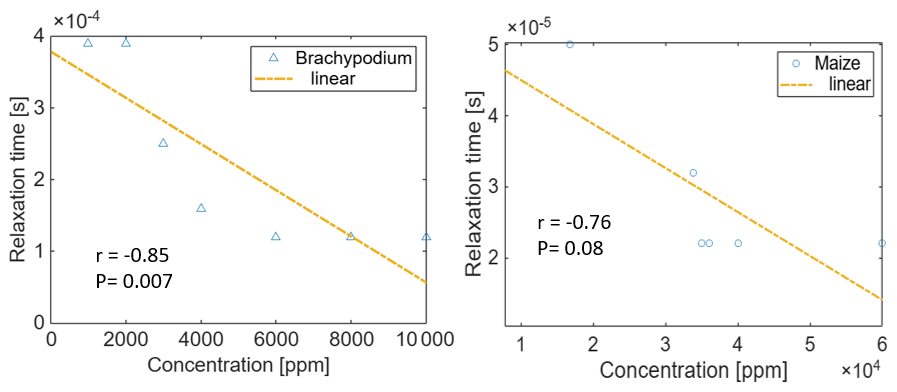
Figure 9Correlation of the relaxation time with the NaCl concentration for Brachypodium and maize primary roots. The relaxation time τmax is expressed as the inverse of ωmax, where ωmax is the angular frequency at which the maximum phase shift occurs.
In Fig. 9, we present a trend analysis of the relaxation time (τmax) and salt concentration during the reversal of the electrical response observed in Brachypodium (5 min) and maize (20 min), as reported in Fig. 8. Hördt et al. (2016) reported that relaxation times are only weakly dependent on salinity in the case of pore radii; however, in this study, we found a significant correlation between relaxation time and NaCl concentration in Brachypodium (Pearson's and p value = 0.007) and maize (Pearson's and p value = 0.08). The difference in slope further suggests that both species respond differently to salt stress based on their salinity tolerance.
Salinity tolerance varies widely across plant species and even across genotypes within a species (Grieve et al., 2012). Thus, salinity tolerance of any plant is indicated by the point or range in the continuum of salt stress where visible or quantitative adverse effects are observed (Läuchli and Grattan, 2012). In this study, the concentration at which the reversal occurs for each species could be an indication of the salt resistance threshold of the species (Grieve et al., 2012). This implies that salt-tolerant species can withstand higher degrees of salinity over a longer period of time.
We showed that SIP is able to detect the uptake of water and saline water in both maize and Brachypodium roots and that the conduction and polarization of maize and Brachypodium roots were influenced by the degree of salinity. Plants respond to salt stress by excluding the ions from entering the cells (ion exclusion) and by removing the sodium and chloride ions from the cytoplasm and accumulating them in the vacuole (ion compartmentation). At relatively low salt concentrations, the plants activate these salt resistance mechanisms, leading to osmotic adjustment, which helps the cells to maintain ionic balance, turgor and volume so that the plant can function optimally, which we observe as increasing resistivity and phase in the SIP signal. At very high salt concentrations, there are more ions in the solution than the plant can exclude or compartment, which leads to excess sodium and chloride ions in the cytoplasm and apoplast (ion toxicity), which we observed as decreasing resistivity and polarization. The duration of salt stress and the salt concentration determine how long it takes for ion accumulation in plants to reach toxic levels. At very low concentrations, it might take days to weeks, whereas at very high concentrations, it only takes minutes.
More studies should focus on testing the use of the SIP method for the early detection of salt stress in field-grown crops. Future studies should be carried out with halophytes with a clear salt tolerance threshold. For example, it would be interesting to know if the reversal of electrical properties at certain salt concentrations would clearly match with the salt tolerance threshold of the plants. In this study, we focused on single root segments (primary roots) in the laboratory. For field measurement, we suggest the use of an electrode setup that can be used to perform SIP measurements directly on the crop stem, which will solve the problem of current leakage through the root–soil interface in the case of stem–soil electrodes set up where the soil is more conductive than the roots (e.g., in a salty soil). As the measurement at the root collar in this study detected uptake of saline water by the root tip, we expect that measurement at the root stem will also detect the uptake of salt by the roots under field conditions.
Table A1Classification of saline water, modified following Rhoades et al. (1992).
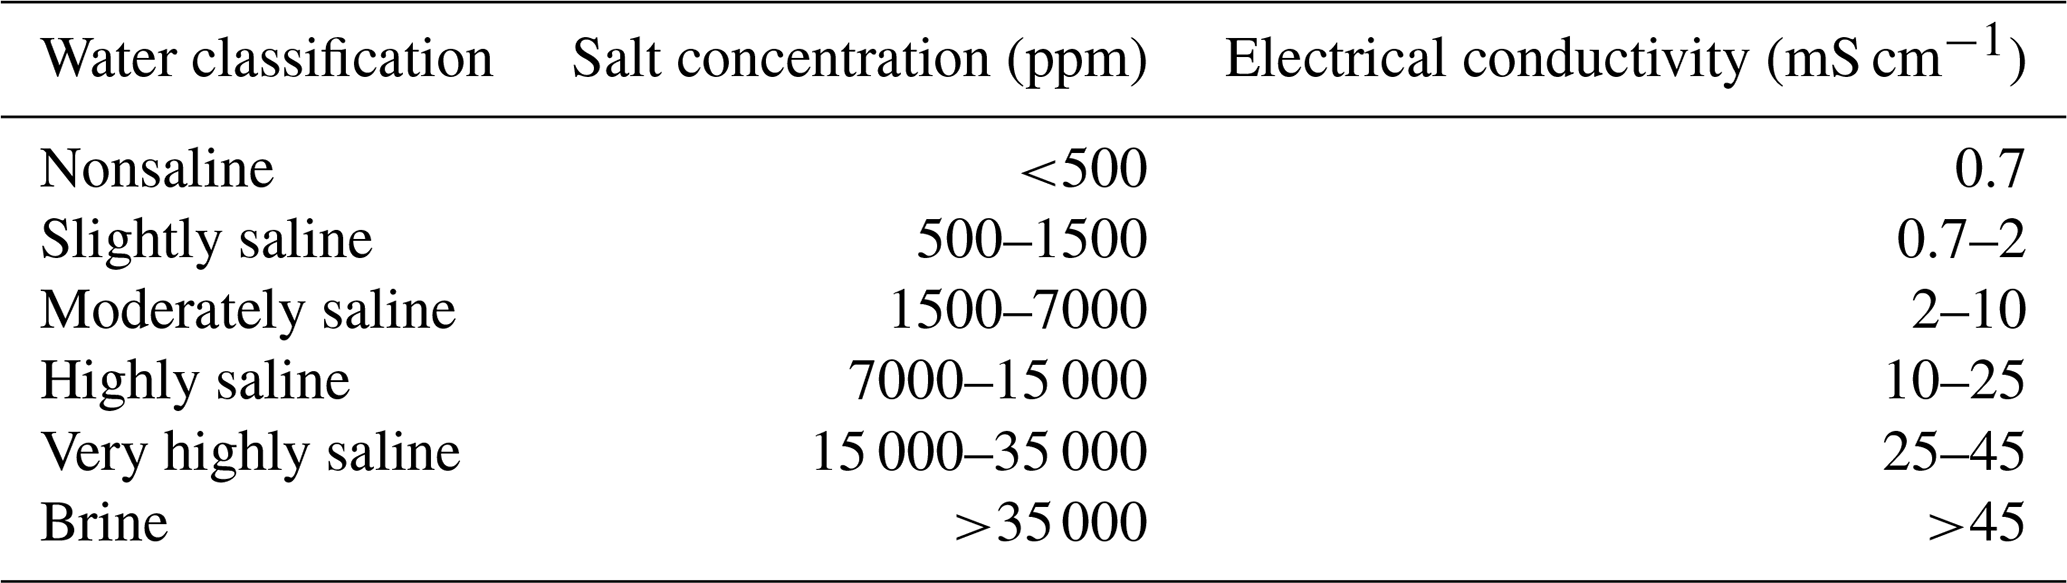
Table B1Changes in the mass of the sample container during evaporation estimation for demineralized water (D. water) and salt solutions (Salt-L and Salt-H).
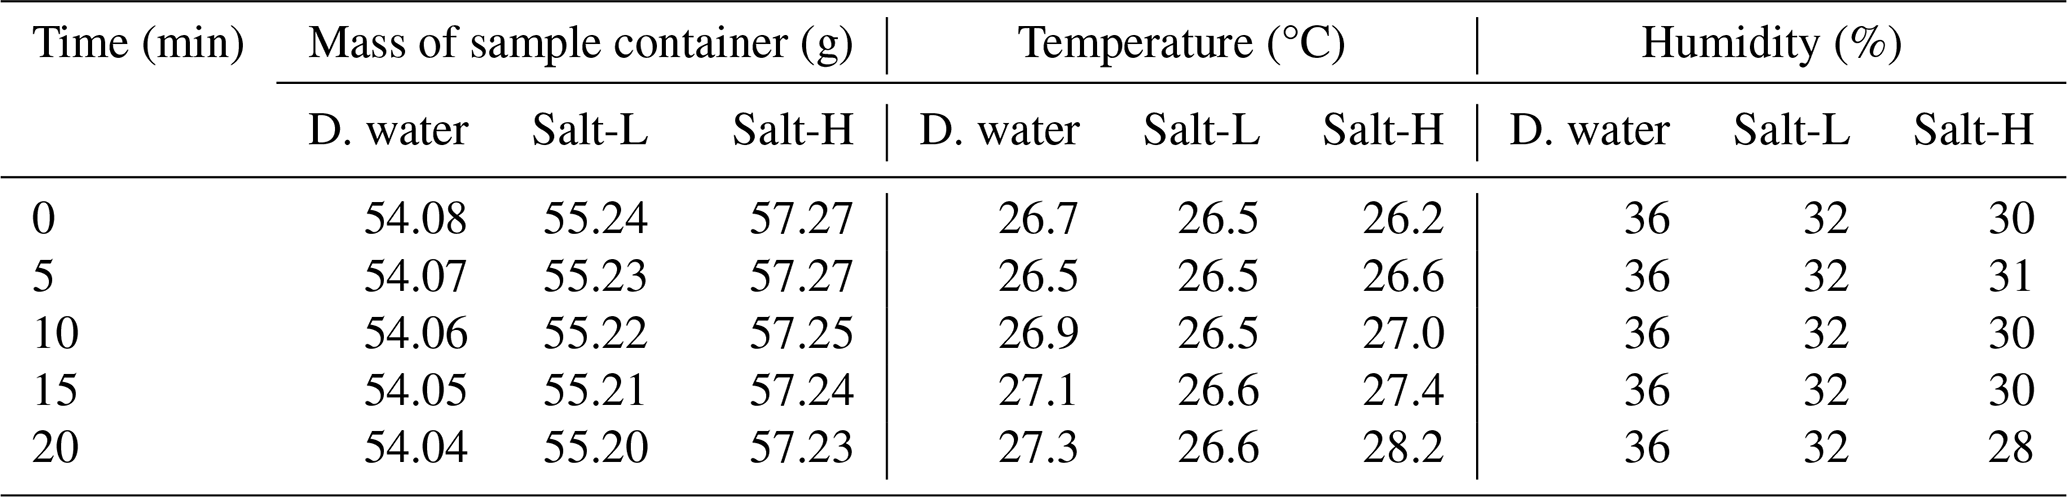
Table B2Demineralized water uptake by maize and Brachypodium in 20 min.
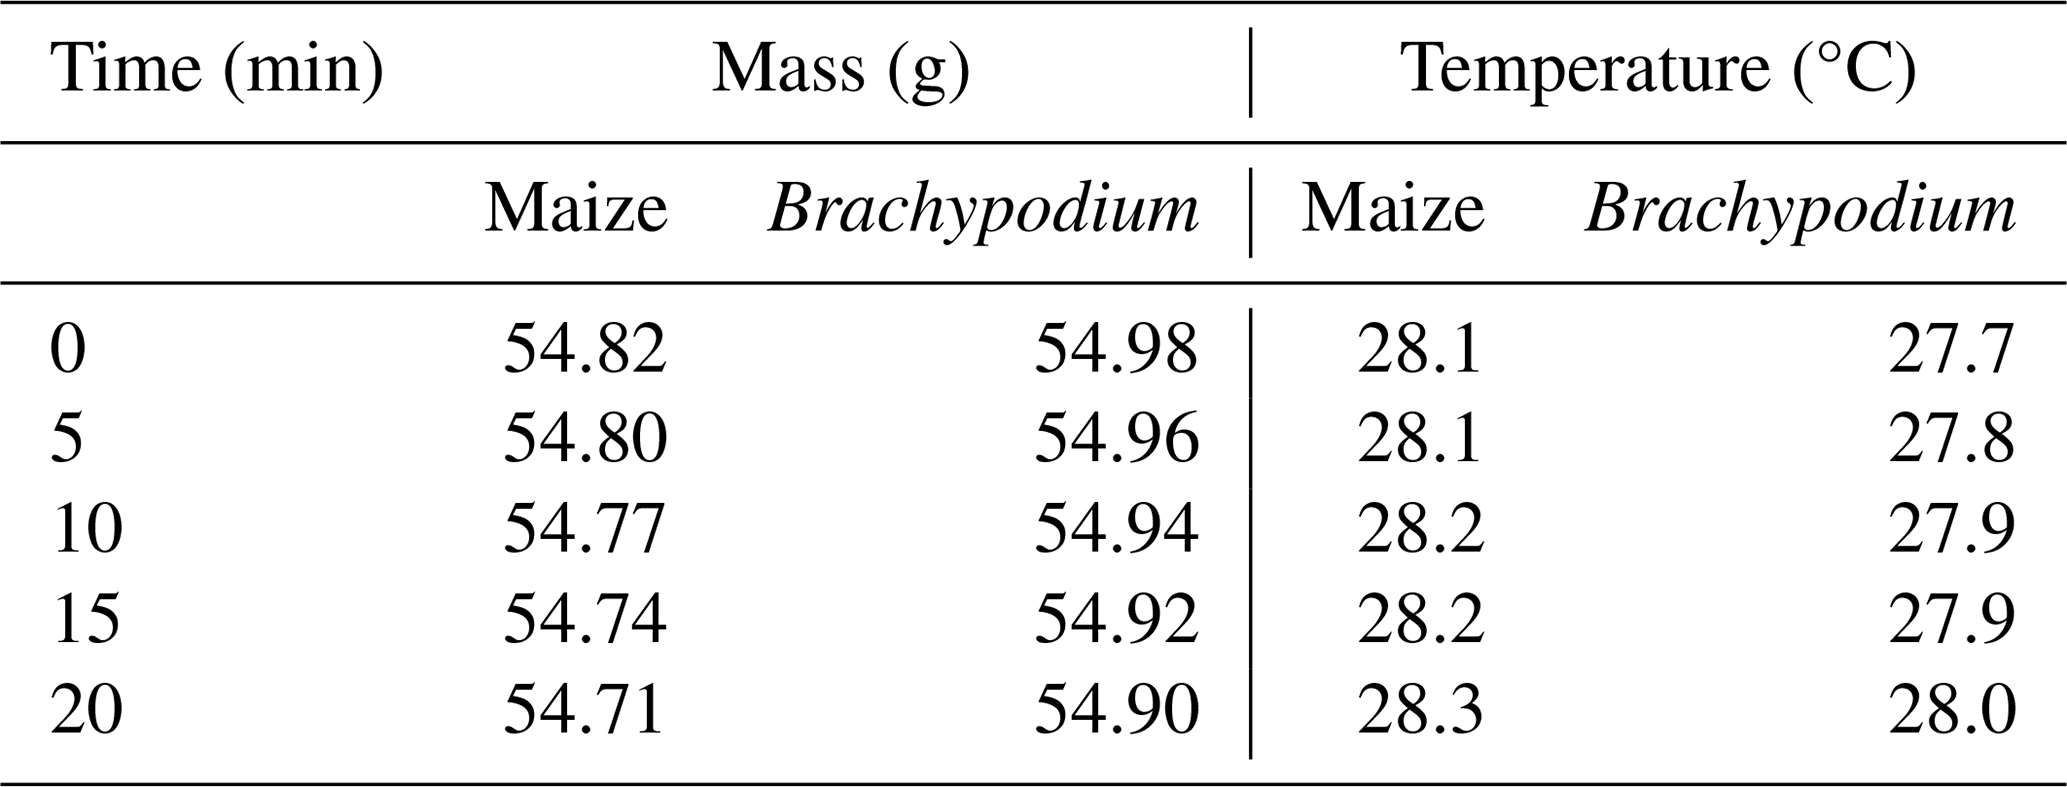
Table B3Saline water uptake by maize and Brachypodium roots in 20 min.
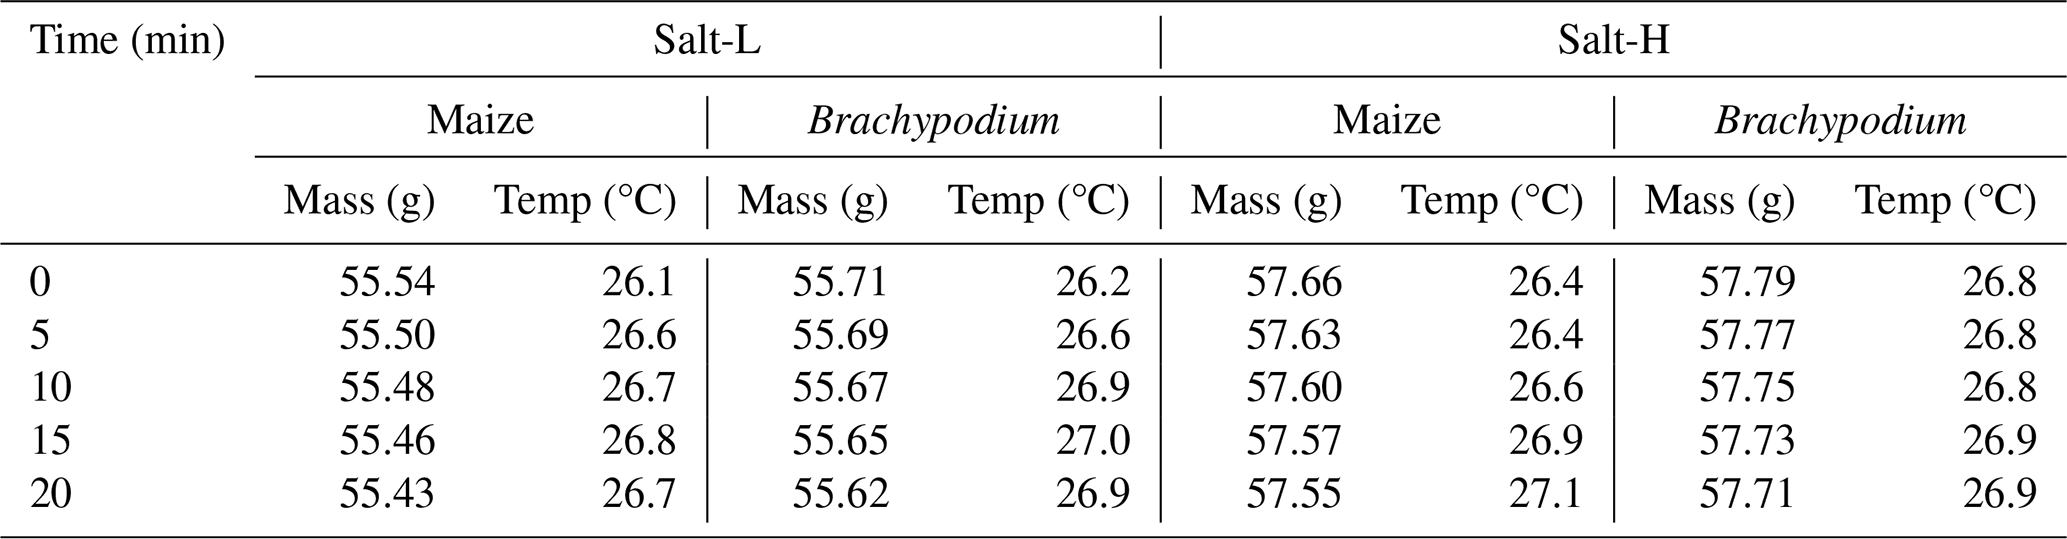
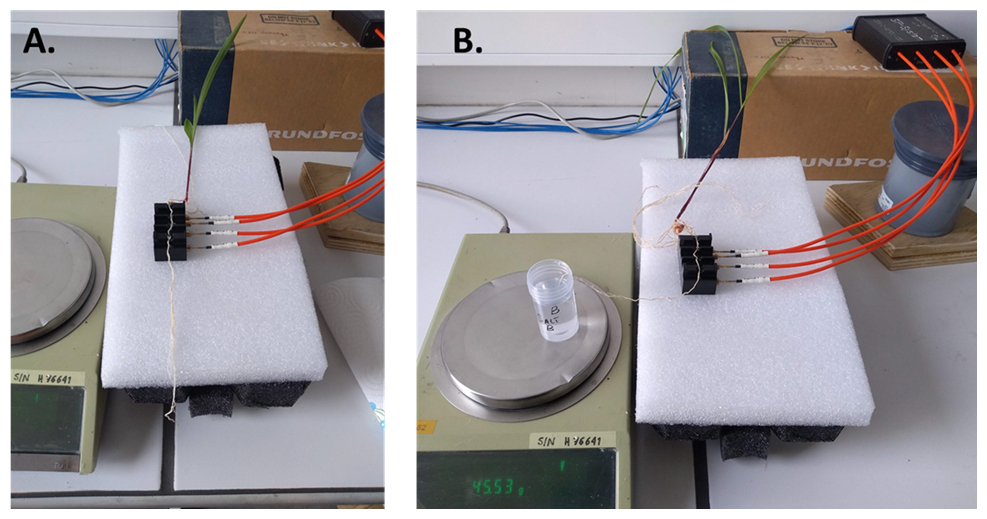
Figure C1(a) Maize roots exposed during desiccation tests over a 20 min duration; the leaves showed no sign of wilting. (b) Maize roots exposed with the primary root tip in saline water of 40 000 ppm (684 mM) concentration; the leaves showed visible signs of wilting after 20 min of measurement.
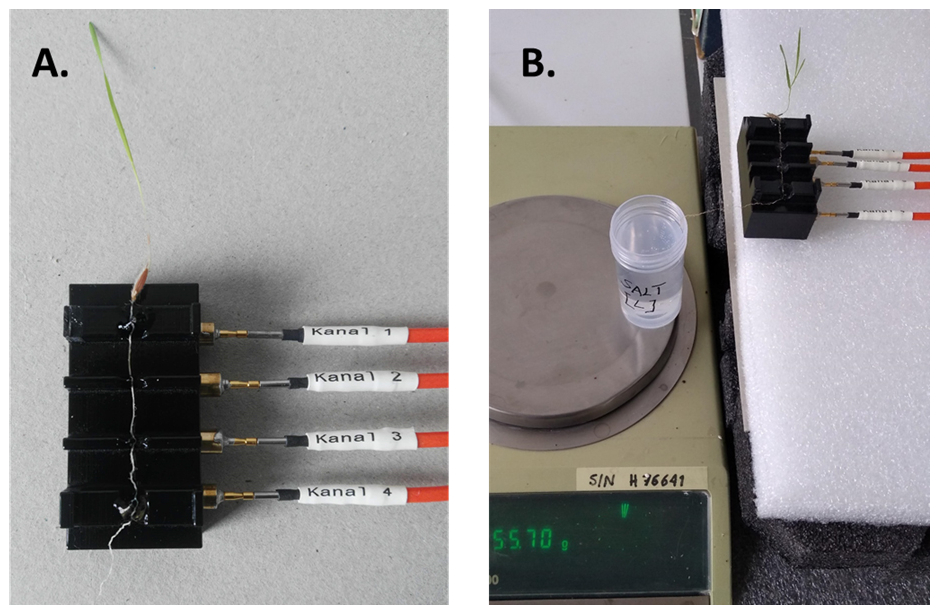
Figure C2(a) Brachypodium root exposed during desiccation tests over a 20 min duration; the leaves showed no sign of wilting. (b) Brachypodium roots exposed with the primary root tip in Salt-L solution of 16 800 ppm (287 mM) concentration; the leaves showed visible signs of wilting after 20 min of measurement.
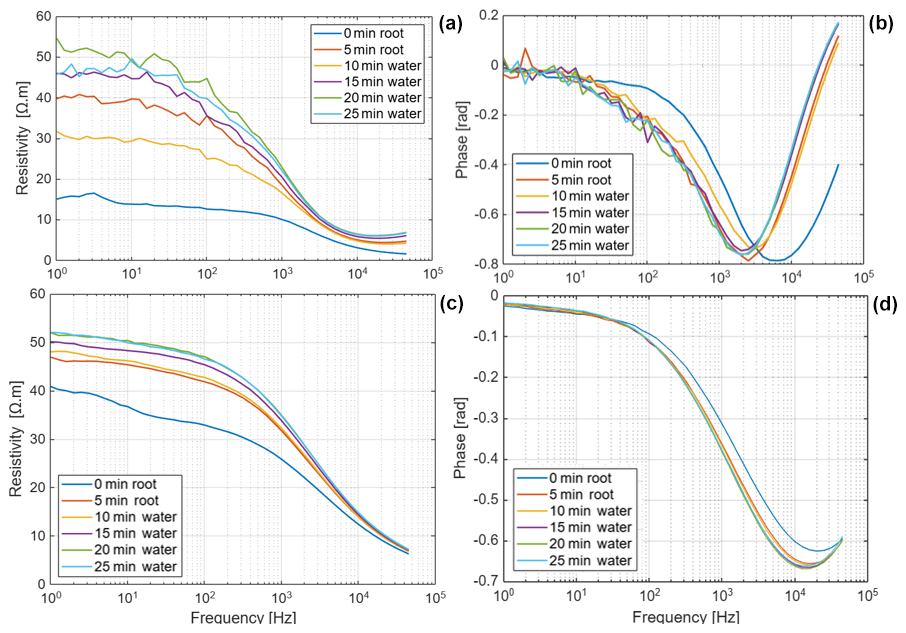
Figure D1Resistivity and phase spectra of Brachypodium (a–b) and maize (c–d) primary roots during demineralized water uptake for 25 min. The measurement at 0 min represents the baseline; measurement was repeated after 5 min (to observe drying effect) before putting the root tip in water at 10, 15, 20 and 25 min.
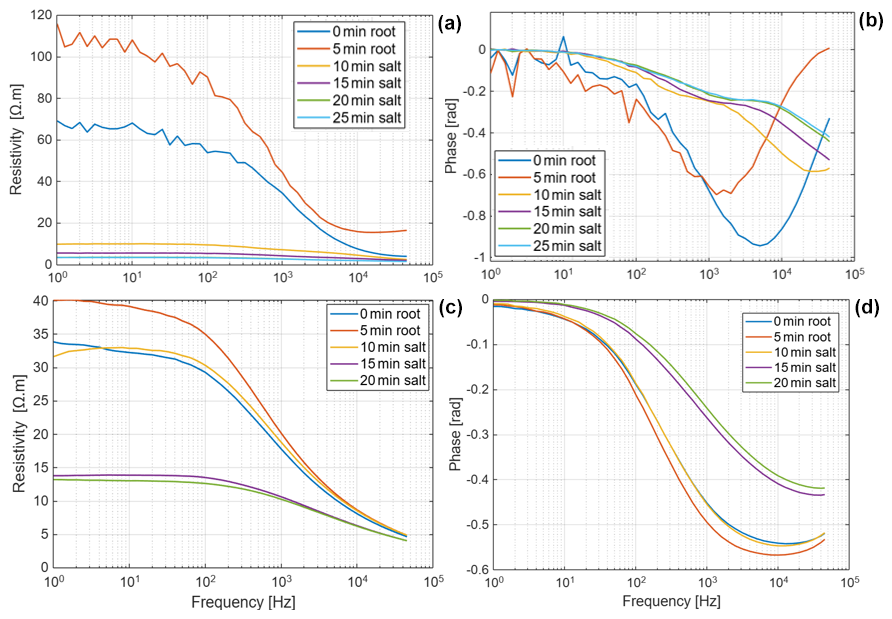
Figure D2Resistivity and phase spectra of Brachypodium (a–b) during the uptake of saline water (Salt-L) for 25 min and (c–d) of maize during the uptake of saline water (Salt-H) for 20 min. The measurement at 0 min represents the baseline; measurement was repeated after 5 min (to observe drying effect) before putting the root tip in saline water at 10, 15, 20 and 25 min.
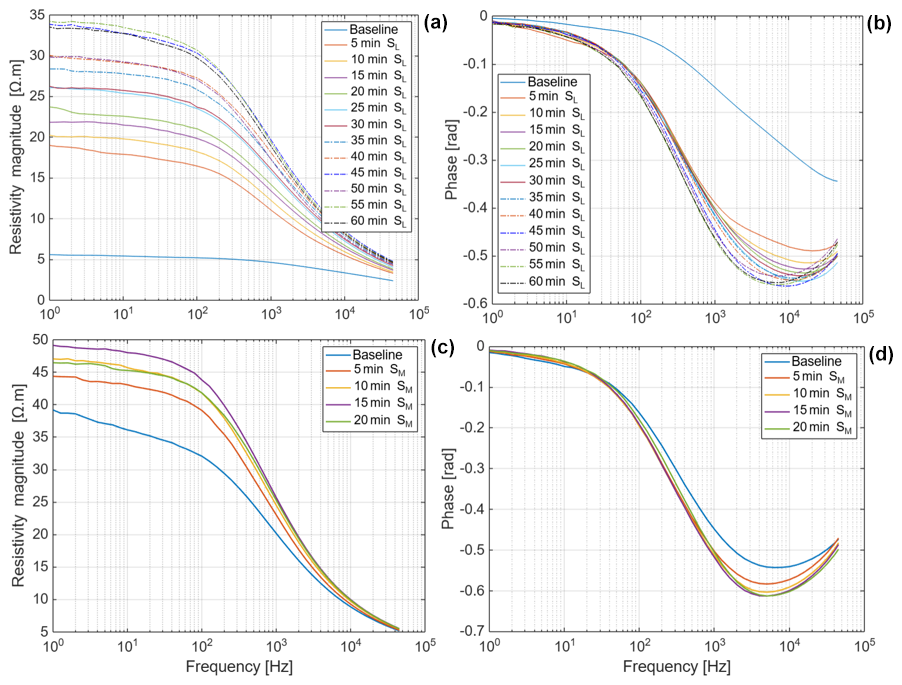
Figure D3Resistivity and phase spectra of maize (a–b) during the uptake of saline water (Salt-L) for 60 min and (c–d) during the uptake of saline water (Salt-M) for 20 min. The measurement at 0 min represents the baseline, before the root tip was put into saline water.
Data associated with this study can be made available from the corresponding author upon request.
SE, FN, SG and MJ: conceptualization. SE, FN, JAH and EZ: methodology. SE, JAH, FN and EZ: data curation, analysis and visualization. SE: original draft. All authors: review and editing. SG, FN and MJ: funding acquisition. SG, FN, MJ, EZ and JAH: supervision.
The contact author has declared that none of the authors has any competing interests.
Publisher's note: Copernicus Publications remains neutral with regard to jurisdictional claims made in the text, published maps, institutional affiliations, or any other geographical representation in this paper. While Copernicus Publications makes every effort to include appropriate place names, the final responsibility lies with the authors.
This research has been supported by the Fonds De La Recherche Scientifique – FNRS (grant no. PDR-23638781).
This paper was edited by Andreas Ibrom and reviewed by Imre Cseresnyes and one anonymous referee.
Acosta-Motos, J. R., Ortuño, M. F., Bernal-Vicente, A., Diaz-Vivancos, P., Sanchez-Blanco, M. J., and Hernandez, J. A.: Plant responses to salt stress: Adaptive mechanisms, Agronomy, 7, 18, https://doi.org/10.3390/agronomy7010018, 2017.
Ando, Y., Mizutani, K., and Wakatsuki, N.: Electrical impedance analysis of potato tissues during drying, J. Food Eng., 121, 24–31, https://doi.org/10.1016/J.JFOODENG.2013.08.008, 2014.
Beff, L., Günther, T., Vandoorne, B., Couvreur, V., and Javaux, M.: Three-dimensional monitoring of soil water content in a maize field using Electrical Resistivity Tomography, Hydrol. Earth Syst. Sci., 17, 595–609, https://doi.org/10.5194/hess-17-595-2013, 2013.
Ben Hamed, K., Zorrig, W., and Hamzaoui, A. H.: Electrical impedance spectroscopy: A tool to investigate the responses of one halophyte to different growth and stress conditions, Comput. Electron. Agr., 123, 376–383, https://doi.org/10.1016/j.compag.2016.03.006, 2016.
Bennett, D. L., George, R. J., and Whitfield, B.: The use of ground EM systems to accurately assess salt store and help define land management options, for salinity management, Explor. Geophys., 31, 249–254, https://doi.org/10.1071/EG00249, 2000.
Cramer, G., Epstein, E., and Lauchli, A.: Kinetics of root elongation of maize in response to short term exposure to NaCl and elevated calcium concentration, J. Exp. Bot., 39, 1513–1522, https://doi.org/10.1093/jxb/39.11.1513, 1988.
Crowe, J. H. and Crowe, L. M.: Induction of anhydrobiosis: Membrane changes during drying, Cryobiology, 19, 317–328, https://doi.org/10.1016/0011-2240(82)90160-2, 1982.
Cseresnyés, I., Takács, T., Végh, K. R., Anton, A., and Rajkai, K.: Electrical impedance and capacitance method: A new approach for detection of functional aspects of arbuscular mycorrhizal colonization in maize, Eur. J. Soil Biol., 54, 25–31, https://doi.org/10.1016/J.EJSOBI.2012.11.001, 2013.
Cseresnyés, I., Rajkai, K., Takács, T., and Vozáry, E.: Electrical impedance phase angle as an indicator of plant root stress, Biosyst. Eng., 169, 226–232, https://doi.org/10.1016/j.biosystemseng.2018.03.004, 2018.
Cseresnyés, I., Füzy, A., Kabos, S., Kelemen, B., Rajkai, K., and Takács, T.: Monitoring of plant water uptake by measuring root dielectric properties on a fine timescale: diurnal changes and response to leaf excision, Plant Methods, 20, 5, https://doi.org/10.1186/s13007-023-01133-8, 2024.
Davenport, R., James, R. A., Zakrisson-Plogander, A., Tester, M., and Munns, R.: Control of sodium transport in durum wheat, Plant Physiol., 137, 807–818, https://doi.org/10.1104/pp.104.057307, 2005.
de Azevedo Neto, A. D., Prisco, J. T., Enéas-Filho, J., de Lacerda, C. F., Silva, J. V., da Costa P. H. A., and Gomes-Filho, E.: Effects ofsalt stress on plant growth, stomatal response and solute accumulation of different maize genotypes, Braz. J. Plant. Physiol., 16, 31–38, 2004.
Debez, A., Ben Hamed, K., Grignon, C., and Abdelly, C.: Salinity effects on germination, growth, and seed production of the halophyte Cakile maritima, Plant Soil, 262, 179–189, https://doi.org/10.1023/B:PLSO.0000037034.47247.67, 2004.
Deinlein, U., Stephan, A. B, Horie, T., Luo, W., Xu, G., and Schroeder, J. I.: Plant salt-tolerance mechanisms, Trends Plant Sci., 19, 371–379, https://doi.org/10.1016/j.tplants.2014.02.001, 2014.
Doolittle, J., Petersen, M., and Wheeler, T.: Comparison of two electromagnetic induction tools in salinity appraisals, J. Soil Water Conserv., 56, 257–262, https://doi.org/10.1080/00224561.2001.12457389, 2001.
Ehosioke, S., Nguyen, F., Rao, S., Kremer, T., Placencia-Gomez, E., Huisman, J. A., Kemna, A., Javaux, M., and Garré, S.: Sensing the electrical properties of roots: a review, Vadose Zone J., 19, e20082, https://doi.org/10.1002/vzj2.20082, 2020.
Ehosioke, S., Garré, S., Huisman, J. A., Zimmerman, E., Placencia-Gomez, E., Javaux, M., and Nguyen, F.: Spectroscopic approach towards unraveling the electrical signature of roots, J. Geophys. Res.-Biogeo., 128, e2022JG007281, https://doi.org/10.1029/2022JG007281, 2023.
Ellouzi, H., Ben Hamed, K., Cela, J., Munné-Bosch, S., and Abdelly, C.: Early effects of salt stress on the physiological and oxidative status of Cakile maritima (halophyte) and Arabidopsis thaliana (glycophyte), Physiol. Plantarum, 142, 128–143, https://doi.org/10.1111/j.1399-3054.2011.01450.x, 2011.
FAO: Global network on integrated soil management for sustainable use of salt-affected soils, FAO Land and Plant Nutrition Management Service, Rome, Italy, https://www.fao.org/fileadmin/user_upload/spush_upload/ABSTRACTS.pdf (last access: 15 February 2025), 2005.
Farooq, M., Hussain, M., Wakeel, A., and Siddique, K. H. M.: Salt stress in maize: effects, resistance mechanisms, and management. A review, Agron. Sustain. Dev., 35, 461–481, https://doi.org/10.1007/s13593-015-0287-0, 2015.
Garré, S., Javaux, M., Vanderborght, J., Pagès, L., and Vereecken, H.: Three-Dimensional Electrical Resistivity Tomography to Monitor Root Zone Water Dynamics, Vadose Zone J., 10, 412, https://doi.org/10.2136/vzj2010.0079, 2011.
Grieve, C. M., Grattan, S. R., and Maas, E. V.: Plant Salt Tolerance, in: Agricultural Salinity Assessment and Management, American Society of Civil Engineers, Reston, VA, 405–459 https://doi.org/10.1061/9780784411698.ch13, 2012.
Guo, J., Liu, H., Dai, K., Yuan, X., Guo, P., Shi, W., and Zhou, M.: Identification of Brachypodium distachyon B3 genes reveals that BdB3-54 regulates primary root growth, Front. Plant Sci., 13, 1050171, https://doi.org/10.3389/fpls.2022.1050171, 2022.
Hajlaoui, H., El Ayeb, N., Garrec, J. P., and Denden, M.: Differential effects of salt stress on osmotic adjustment and solutes allocation on the basis of root and leaf tissue senescence of two silage maize (Zea mays L.) varieties, Ind. Crop. Prod., 31, 122–130, https://doi.org/10.1016/j.indcrop.2009.09.007, 2010.
Hasegawa, P., Bressan, R., Zhu, J., and Bohnert, H.: Plant cellular and molecular response to high salinity, Annu. Rev. Plant Phys., 51, 463–499 https://doi.org/10.1146/annurev.arplant.51.1.463, 2000.
Hördt, A., Bairlein, K., Bielefeld, A., Bücker, M., Kuhn, E., Nordsiek, S., and Stebner, H.: The dependence of induced polarization on fluid salinity and pH, studied with an extended model of membrane polarization, J. Appl. Geophys., 135, 408–417, https://doi.org/10.1016/j.jappgeo.2016.02.007, 2016.
Hussain, M., Park, H. W., Farooq, M., Jabran, K., and Lee, D. J.: Morphological and physiological basis of salt resistance in different rice genotypes Morphological and Physiological Basis of Salt Resistance in Different Rice Genotypes, Int. J. Agric. Biol., 15, 113–118, 2013.
Isayenkov, S. V and Maathuis, F. J.: Plant Salinity Stress: Many Unanswered Questions Remain, Front. Plant Sci., 10, 80, https://doi.org/10.3389/fpls.2019.00080, 2019.
Islam, M., Wahid, K. A., Dinh, A. V., and Bhowmik, P.: Model of dehydration and assessment of moisture content on onion using EIS, J. Food Sci. Tech., 56, 2814–2824, https://doi.org/10.1007/s13197-019-03590-3, 2019.
Ji, X., Tang, J., and Zhang, J.: Effects of Salt Stress on the Morphology, Growth and Physiological Parameters of Juglansmicrocarpa L. Seedlings, Plants, 11, 2381, https://doi.org/10.3390/plants11182381, 2022.
Kaddah, M. T. and Ghowail, S. I.: Salinity Effects on the Growth of Corn at Different Stages of Development, Agron. J., 56, 214–217, https://doi.org/10.2134/agronj1964.00021962005600020028x, 1964.
Kessouri, P., Furman, A., Huisman, J. A., Martin, T., Mellage, A., Ntarlagiannis, D., Bücker, M., Ehosioke, S., Fernandez, P., Flores-Orozco, A., Kemna, A., Nguyen, F., Pilawski, T., Saneiyan, S., Schmutz, M., Schwartz, N., Weigand, M., Wu, Y., Zhang, C., and Placencia-Gomez, E.: Induced polarization applied to biogeophysics: recent advances and future prospects, Near Surf. Geophys., 17, 595–621, https://doi.org/10.1002/nsg.12072, 2019.
Kinraide, T. B.: Ion fluxes considered in terms of membrane-surface electrical potentials, Aust. J. Plant Physiol., 28, 605–616, https://doi.org/10.1071/pp01019, 2001.
Kinraide, T. B. and Wang, P.: The surface charge density of plant cell membranes (σ): An attempt to resolve conflicting values for intrinsic σ, J. Exp. Bot., 61, 2507–2518, https://doi.org/10.1093/jxb/erq082, 2010.
Läuchli, A. and Grattan, S. R.: Plant Responses to Saline and Sodic Conditions, in: Agricultural Salinity Assessment and Management, American Society of Civil Engineers, Reston, VA, 169–205, https://doi.org/10.1061/9780784411698.ch06, 2012.
Lew, R. R.: Pressure regulation of the electrical properties of growing Arabidopsis thaliana L. Root hairs, Plant Physiol., 112, 1089–1100, https://doi.org/10.1104/pp.112.3.1089, 1996.
Li, S., Mou, P., and Hu, F.: Is root nutrient uptake a modular function? A test using Solidago canadensis, J. Forestry Res., 27, 321–328, https://doi.org/10.1007/s11676-015-0151-8, 2016.
Lv, D. W., Subburaj, S., Cao, M., Yan, X., Li, X., Appels, R., Sun, D., Ma, W., and Yan, Y. M.: Proteome and phosphoproteome characterization reveals new response and defense mechanisms of brachypodium distachyon leaves under salt stress, Mol. Cell. Proteomics, 13, 632–652, https://doi.org/10.1074/mcp.M113.030171, 2014.
Michot, D., Benderitter, Y., Dorigny, A., Nicoullaud, B., King, D., and Tabbagh, A.: Spatial and temporal monitoring of soil water content with an irrigated corn crop cover using surface electrical resistivity tomography, Water Resour. Res., 39, 1138, https://doi.org/10.1029/2002WR001581, 2003.
Munns, R.: Genes and salt tolerance: bringing them together, New Phytologist, 167, 645–663, 2005.
Munns, R. and Tester, M.: Mechanisms of Salinity Tolerance, Annu. Rev. Plant Biol., 59, 651–681, https://doi.org/10.1146/annurev.arplant.59.032607.092911, 2008.
Munns, R., James, R. A., and Läuchli, A.: Approaches to increasing the salt tolerance of wheat and other cereals, J. Exp. Bot., 57, 1025–1043, https://doi.org/10.1093/jxb/erj100, 2006.
Munns, R., Passioura, J. B., Colmer, T. D., and Byrt, C. S.: Osmotic adjustment and energy limitations to plant growth in saline soil, New Phytol., 225, 1091–1096, https://doi.org/10.1111/nph.15862, 2020.
Negrão, S., Schmöckel, S. M., and Tester, M.: Evaluating physiological responses of plants to salinity stress, Annals of Botany, 119, 1–11, https://doi.org/10.1093/aob/mcw191, 2017.
Neubert, A. B., Zörb, C., and Schubert, S.: Expression of vacuolar antiporters (ZmNHX) and Na+ exclusion in roots of maize (Zea mays L.) genotypes with improved salt resistance, in: Plant nutrition for food security, human health and environmental protection, edited by: Li, C. J., Zhang, F. S., Dobermann, A., Hinsinger, P., Lambers, H., Li, X. L., Marschner, P., Maene, L., McGrath, S., Oenema, O., Peng, S. B., Rengel, Z., Shen, Q. S., Welch, R., von Wirén, N., Yan, X. L., and Zhu Y. G., Tsinghua University Press, Bejing, China, 544–545, ISBN 7302117861, 2005.
Ogawa, A. and Yamauchi, A.: Root Osmotic Adjustment under Osmotic Stress in Maize Seedlings 1. Transient Change of Growth and Water Relations in Roots in Response to Osmotic Stress, Plant Prod. Sci., 9, 27–38, https://doi.org/10.1626/pps.9.27, 2006.
Ozier-Lafontaine, H. and Bajazet, T.: Analysis of Root Growth by Impedance Spectroscopy (EIS), Plant Soil, 277, 299–313, https://doi.org/10.1007/s11104-005-7531-3, 2005.
Plant Ditech: Salinity Stress in Plants, https://www.plant-ditech.com/salinity-stress-in-plants/ (last access: 18 February 2025), 2024.
Repo, T., Laukkanen, J., and Silvennoinen, R.: Measurement of the Tree Root Growth Using Electrical Impedance Spectro- scopy, Silva Fenn., 39, 159–166, 2005.
Repo, T., Korhonen, A., Laukkanen, M., Lehto, T., and Silvennoinen, R.: Detecting mycorrhizal colonisation in Scots pine roots using electrical impedance spectra, Biosyst. Eng., 121, 139–149, https://doi.org/10.1016/j.biosystemseng.2014.02.014, 2014.
Repo, T., Korhonen, A., Lehto, T., and Silvennoinen, R.: Assessment of frost damage in mycorrhizal and non-mycorrhizal roots of Scots pine seedlings using classification analysis of their electrical impedance spectra, Trees, 30, 483–495, https://doi.org/10.1007/s00468-015-1171-x, 2016.
Rewald, B., Ephrath, J. E., and Rachmilevitch, S.: A root is a root is a root? Water uptake rates of Citrus root orders, Plant Cell Environ., 34, 33–42, https://doi.org/10.1111/j.1365-3040.2010.02223.x, 2011.
Rhoades, J. D., Kandiah, A., and Mashali, A. M.: The use of saline waters for crop production, FAO Irrigation and Drainage Paper #48, Food and Agriculture Organization of the United Nations, Rome, Italy, 1–133, https://www.ars.usda.gov/arsuserfiles/20361500/pdf_pubs/P1313.pdf (last access: 12 February 2025), 1992.
Rhoades, J. D., Chanduvi, F., and Lesch, S.: Soil salinity assessment: Methods and interpretation of electrical conductivity measurements, FAO Irrigation and Drainage Paper #57, Food and Agriculture Organization of the United Nations, Rome, Italy, 1–150, https://www.fao.org/4/x2002e/x2002e.pdf (last access: 18 February 2025), 1999.
Robbins, N. E. and Dinneny, J. R.: The divining root: Moisture-driven responses of roots at the micro- and macro-scale, J. Exp. Bot., Oxford University Press, https://doi.org/10.1093/jxb/eru496, 2015.
Schopfer, P.: Biomechanics of plant growth, Am. J. Bot., 93, 1415–1425, 2006.
Shahnazaryan, E., Lutz, W., Garre, S., Lazarovich, N., and Vanderborght, J.: Monitoring salt accumulation in the root zone by electrical resistivity tomography, Geophysical Research Abstracts, vol. 20, EGU2018-10640, https://meetingorganizer.copernicus.org/EGU2018/EGU2018-10640.pdf (last access: 12 February 2025), 2018.
Sharp, R. E., Hsiao, T. C., and Silk, W. K.: Growth of the Maize Primary Root at Low Water Potentials: II. Role of Growth and Deposition of Hexose and Potassium in Osmotic Adjustment, Plant Physiol., 93, 1337–1346, https://doi.org/10.1104/pp.93.4.1337, 1990.
Verslues, P., Agarwal, M., Katiyar-Agarwal, S., Zhu, J., and Zhu, J. K.: Methods and concepts in quantifying resistance to drought, salt and freezing, abiotic stresses that affect plant water status, Plant J., 45, 523–539, 2006.
Weigand, M. and Kemna, A.: Multi-frequency electrical impedance tomography as a non-invasive tool to characterize and monitor crop root systems, Biogeosciences, 14, 921–939, https://doi.org/10.5194/bg-14-921-2017, 2017.
Weigand, M. and Kemna, A.: Imaging and functional characterization of crop root systems using spectroscopic electrical impedance measurements, Plant Soil, 435, 201–224, https://doi.org/10.1007/s11104-018-3867-3, 2019.
Wu, L., Ogawa, Y., and Tagawa, A.: Electrical impedance spectroscopy analysis of eggplant pulp and effects of drying and freezing–thawing treatments on its impedance characteristics, J. Food Eng., 87, 274–280, https://doi.org/10.1016/j.jfoodeng.2007.12.003, 2008.
Zhao, C., Zhang, H., Song, C., Zhu, J. K., and Shabala, S.: Mechanisms of Plant Responses and Adaptation to Soil Salinity, Innovation, 1, 100017, https://doi.org/10.1016/j.xinn.2020.100017, 2020.
Zhao, K., Song, J., Fan, H., Zhou, S., and Zhao, M.: Growth response to ionic and osmotic stress of NaCl in salt-tolerant and salt-sensitive maize, J. Integr. Plant Biol., 52, 468–475, https://doi.org/10.1111/j.1744-7909.2010.00947.x, 2010.
- Abstract
- Introduction
- Materials and methods
- Results and discussion
- Conclusions
- Appendix A: Saline water classification
- Appendix B: Raw data from experiments
- Appendix C: Visual inspection of plants during the experiments
- Appendix D: Replicate measurement on Brachypodium and maize roots
- Data availability
- Author contributions
- Competing interests
- Disclaimer
- Financial support
- Review statement
- References