the Creative Commons Attribution 4.0 License.
the Creative Commons Attribution 4.0 License.
 | 20 Jun 2025
Organic carbon, mercury, and sediment characteristics along a land–shore transect in Arctic Alaska
Frieda P. Giest
Guido Grosse
Benjamin M. Jones
Kai Mangelsdorf
Torben Windirsch
Climate warming in the Arctic results in thawing permafrost and associated processes like thermokarst, especially in ice-rich permafrost regions. Since permafrost soils are one of the largest organic carbon reservoirs of the world, their thawing leads to the release of greenhouse gases due to increasing microbial activity with rising soil temperature, further exacerbating climate warming. To enhance the predictions of potential future impacts of permafrost thaw, a detailed assessment of changes in soil characteristics in response to thermokarst processes in permafrost landscapes is needed, which we investigated in this study in an Arctic coastal lowland. We analysed six sediment cores from the Arctic Coastal Plain of northern Alaska, each representing a different landscape feature along a gradient from upland to thermokarst lake and drained basin to thermokarst lagoon in various development stages. For the analysis, a multiproxy approach was used, including sedimentological (grain size, bulk density, ice content), biogeochemical (total organic carbon (TOC), TOC density (TOCvol), total nitrogen (TN), stable carbon isotopes (δ13C), TOCTN ratio, mercury (Hg)), and lipid biomarker (n-alkanes, n-alkanols, and their ratios) parameters. We found that a semi-drained state of thermokarst lakes features the lowest OC content, and TOC and TN are generally higher in unfrozen deposits, hinting at a more intact state of organic matter. Indicated by the average chain length (ACL), δ13C, Paq, and Pwax, we found a stronger influence of aquatic organic matter (OM) in the OM composition in the soils covered by water compared to those not covered by water. Moreover, the results of the δ13C, TOCTN ratio, and CPI indicate that the saline deposits contain stronger degraded OM than the deposits not influenced by saltwater. Additionally, we found positive correlations between the TOC and TOCvol and the Hg content in the deposits. The results indicate that thermokarst-influenced deposits tend to accumulate Hg during thawed periods and thus contain more Hg than the upland permafrost deposits that have not been impacted by lake formation. Our findings offer valuable insights into the dynamics of carbon storage and vulnerability to decomposition in coastal permafrost landscapes, reflecting the interplay of environmental factors, landform characteristics, and climate change impacts on Arctic permafrost environments.
- Article
(4420 KB) - Full-text XML
-
Supplement
(1878 KB) - BibTeX
- EndNote


Climate warming represents one of the most pressing global environmental challenges of our time. Arctic regions are currently changing rapidly, since they experience some of the highest rates of impacts from climate change (Intergovernmental Panel on Climate Change (IPCC), 2022, 2023). Surface air temperatures in the Arctic have increased up to 4 times the rate of the global mean air temperature over the last decades, a phenomenon referred to as Arctic amplification (Ballinger et al., 2023; Cohen et al., 2020; Rantanen et al., 2022). The local drivers of this amplification include the decrease in sea ice and snow cover, resulting in decreased albedo and a shift in cloudiness over the Arctic (Ballinger et al., 2023). Moreover, there are remote drivers that contribute to the amplification, including increased total water vapour in the Arctic atmosphere due to increased evapotranspiration and atmospheric moisture transport from the mid-latitudes and tropics and accelerated heat from the atmosphere and the ocean (Cohen et al., 2020). As a result, surface temperatures in the Arctic during the winters in 2016 and 2018 were 6 °C above the average temperatures between 1981 and 2010 (IPCC, 2022).
One impact of this warming is the thaw of permafrost, which underlies large areas of the Arctic (Biskaborn et al., 2019; Smith et al., 2022). In some locations a total increase of 2–3 °C in the last 30 years was found within 10–20 m soil depth (Biskaborn et al., 2019). Permafrost has been identified as a large and vulnerable reservoir of organic carbon (OC) and due to climate change is considered a potential major future carbon source in the earth system (Hugelius et al., 2014; Mishra et al., 2021; Schuur et al., 2022). It is estimated that terrestrial deposits in permafrost regions store approximately 1460–1600 Gt of carbon, which is about twice as much as is currently present in the atmosphere (Schuur and Mack, 2018; Strauss et al., 2025). As permafrost thaws, the soils can turn from a carbon sink into a carbon source (Schuur et al., 2009). Increased temperatures cause an acceleration of microbial activity and thus the increased decomposition of organic carbon in the deposits, leading to the release of greenhouse gases in the form of carbon dioxide and methane, with the potential to further exacerbate climate change (Miner et al., 2022). In order to analyse the quality, hence the degree of decomposition, of organic matter (OM) in the different soils, as well as differences in OM sources, lipid biomarkers can be used. Indices like the average chain length (ACL) of n-alkanes, the carbon preferences index (CPI), and the higher plant index (HPA) can provide information about the source of the OM and the level of degradation (Jongejans et al., 2020, 2021; Strauss et al., 2015).
Another consequence of permafrost thaw is the change of the landscape, for example, due to melting ground ice causing surface subsidence and the development of thermokarst features (Grosse et al., 2013; Kokelj and Jorgenson, 2013). Around 20 % of the permafrost regions are affected by thermokarst processes, including the formation of thermokarst lakes and drained lake basins (Grosse et al., 2013; Jones et al., 2022; Olefeldt et al., 2016). In a coastal environment, increased coastal and riverbank erosion, sea level rise, higher water temperatures, and reduced sea ice cover can lead to the inundation of thermokarst lakes and drained thermokarst lake basins by ocean water and the formation of thermokarst lagoons (Jenrich et al., 2025; Schirrmeister et al., 2018). These features add another complex setting of biogeochemical and hydrochemical processes in the transitional stage between terrestrial and marine environments to the already diverse thermokarst landscapes (Schirrmeister et al., 2018).
In addition to the influence of permafrost thaw and the formation of thermokarst features on organic carbon characteristics in permafrost and thawed soils, changes in other biogeochemical characteristics may also occur, such as the relocation and release of mercury (Hg). It was found that considerable amounts of total Hg have accumulated in the ice-rich permafrost region (Rutkowski et al., 2021). Since permafrost soils sequestered Hg bound in organic matter over centuries, it is estimated that the amount of Hg retained in permafrost regions is twice as high as in all other soils, the atmosphere, and the ocean combined (Schuster et al., 2018). Notably, the form of Hg released can significantly influence its environmental impact, as methylmercury is particularly toxic to humans and wildlife. Additionally, there is often a correlation between total organic carbon (TOC) and total mercury (e.g. Chakraborty et al., 2015), highlighting the interplay between OM and Hg dynamics in permafrost regions. Therefore, Hg remains a notable environmental concern in the Arctic region, as elevated exposure – particularly to methylmercury – can impact human health and have negative effects on ecosystems (Rydberg et al., 2010; Smith-Downey et al., 2010).
In this study, we use a multiproxy approach to characterise OM in the different landscape features of a coastal permafrost lowland along a gradient from upland and thermokarst-affected terrains (lakes and drained basins) to thermokarst lagoons, representing a transition from terrestrial to marine environments, in the Arctic Coastal Plain of northern Alaska. We aim to answer how OC characteristics and correlating biogeochemical parameters change with permafrost degradation and coastal saltwater inundation.
The study area is located in the Arctic Coastal Plain of northern Alaska, north of the Teshekpuk Lake (Fig. 1). The North Slope, an area framed by the Brooks Range in the south and the Beaufort Sea in the north, encompasses a diverse geology, including deposits originating in the North American craton, passive margin sediments, rift sediments, pelagic sediments, volcaniclastics, and deposits from the foreland basin (Jorgenson et al., 2011). Surface deposits in the study area consist of glacio-marine silts, marine sands, alluvial sands, and silts from the Holocene and mid-Quaternary epochs (Jorgenson and Grunblatt, 2013).
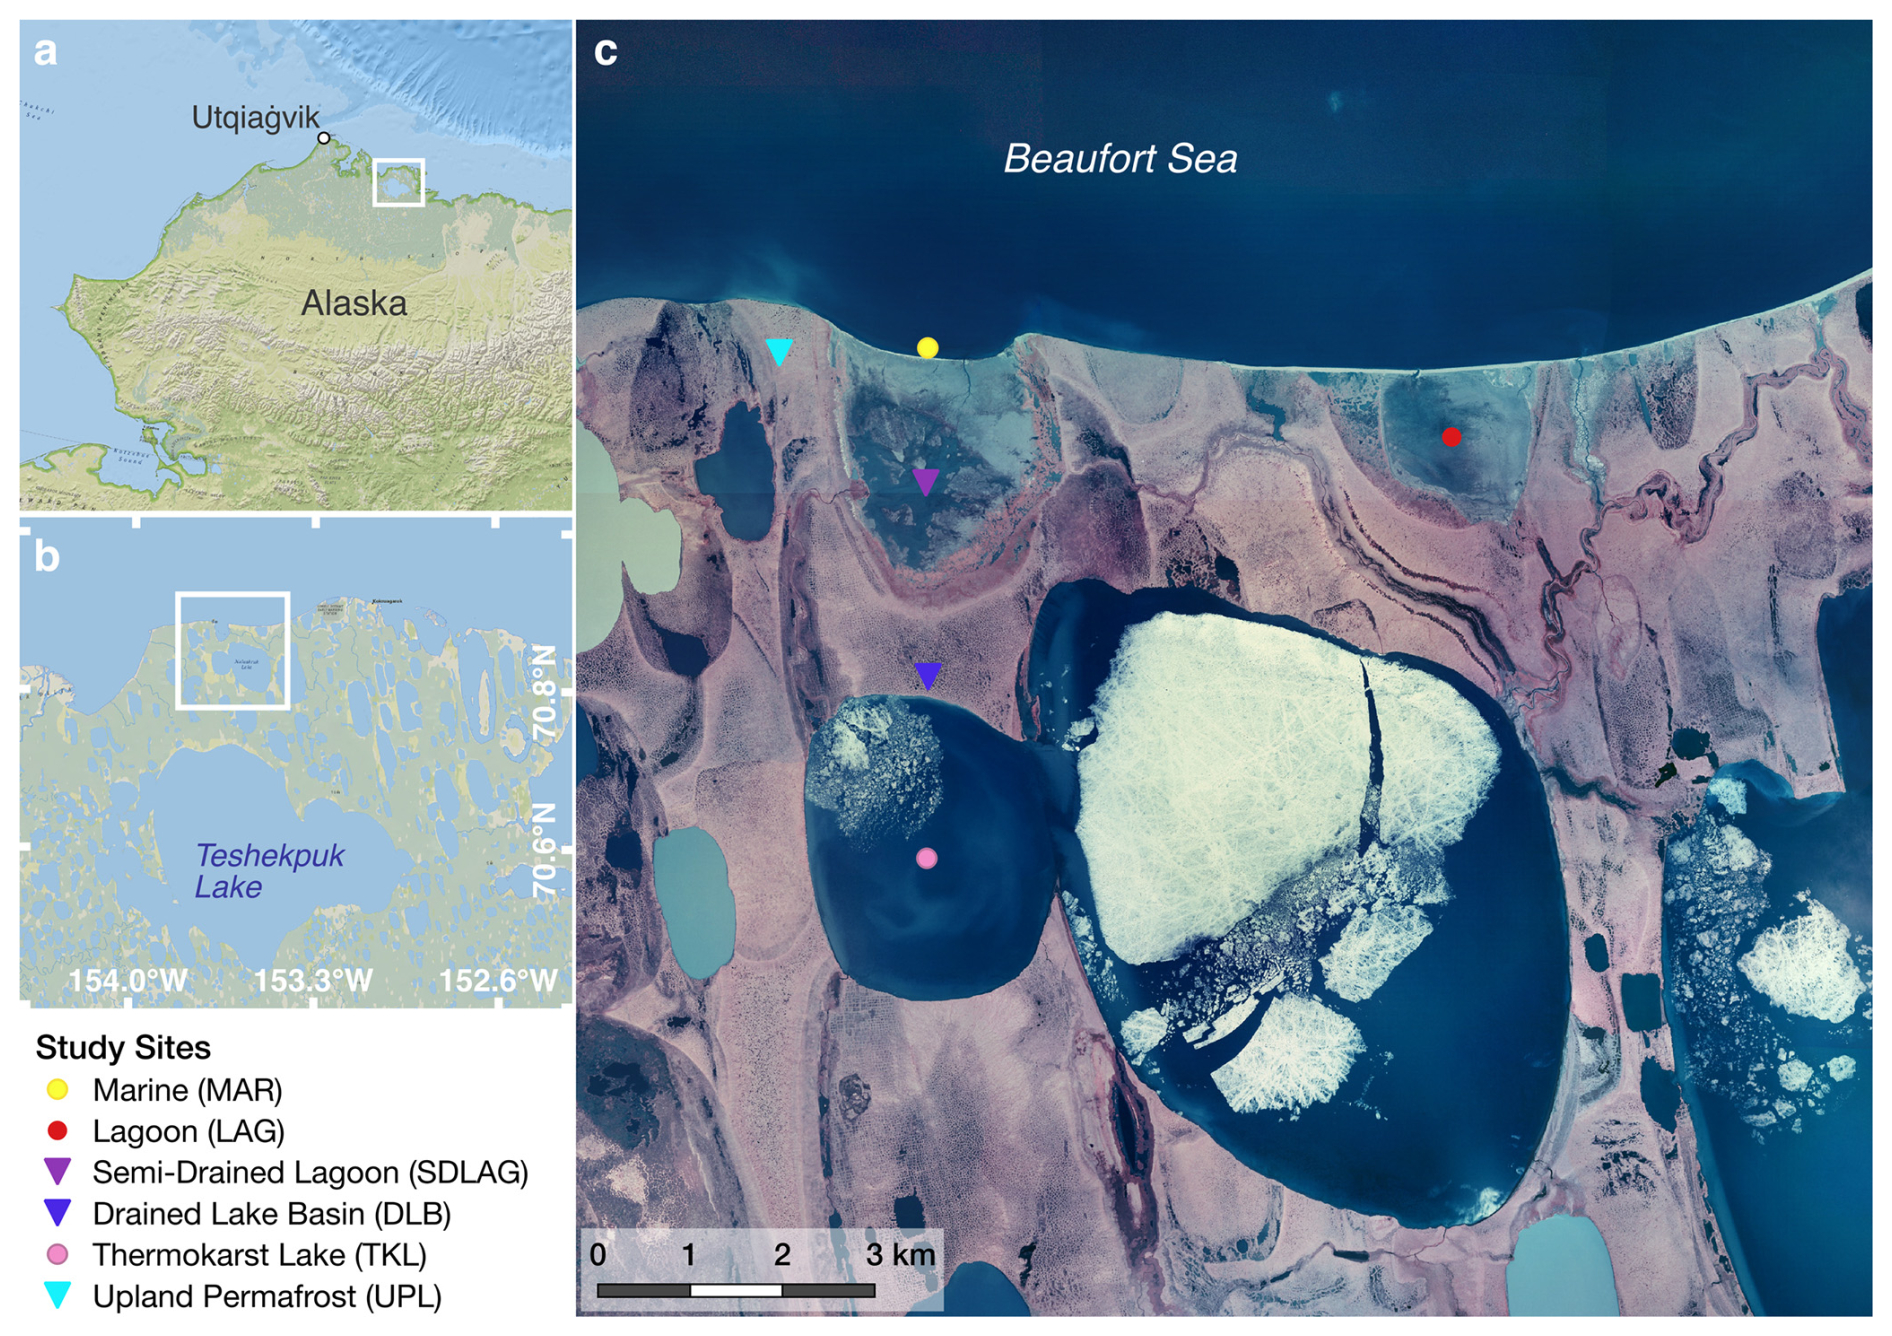
Figure 1Map of the study sites located north of the Teshekpuk Lake in northern Alaska. (a, b) Close-up of the study area, with the coring locations marked as dots (unfrozen deposits) and triangles (frozen deposits) in panel (c). Sources: (a, b) ESRI, (c) colour infrared ortho aerial image (US Geological Survey, 2002). For relative positions of the individual study sites, please refer to Fig. S1.
The climate in the region is cold and arid, with a mean annual temperature of −12 °C and a mean annual precipitation of 115 mm yr−1 (Jorgenson et al., 2011). The soil composition in the area is intrinsically tied to the presence of continuous permafrost, with an interplay of low temperatures, impeded drainage, freeze–thaw dynamics, cryoturbation, and ground ice aggregation collectively shaping its characteristics. The presence of 200 to 400 m thick continuous permafrost also led to the formation and preservation of one of the largest wetland complexes in the Arctic, which, despite the cold and arid climate, also led to the accumulation of high OC contents in the soils (Jorgenson et al., 2011; Wendler et al., 2014). Moreover, the landscape is continuously transformed by thawing permafrost and melting ground ice, leading to ground subsidence and the formation of numerous thermokarst lakes and drained lake basins (Arp et al., 2011; Fuchs et al., 2019; Jones and Arp, 2015; Jorgenson and Shur, 2007; Wolter et al., 2024). Coastal erosion along the Beaufort Sea coast in this area is among the highest observed in the Arctic, resulting in the drainage of lakes and the formation of thermokarst lagoons and embayments and is currently accelerating further (Jones et al., 2009, 2018; Jones and Arp, 2015).
3.1 Fieldwork
The fieldwork was performed during a joint German–US expedition to the Teshekpuk Lake area in Alaska in April 2022. For this study, six soil cores were selected following a transect from inland to the coast, with all core sites being located in close distance to each other (Fig. 1). All sample sites represent different landscape features of a coastal- and thermokarst-affected permafrost landscape, with the chosen transect describing the transformation pathway from a terrestrial permafrost landscape into a coastal marine environment, following thaw and erosion processes (Jenrich et al., 2021). Three of the cores were frozen: from a permafrost upland (UPL; length of 203 cm), a drained thermokarst lake basin (DLB; length of 219 cm), and a semi-drained lagoon (SDLAG; length of 183 cm). Three other cores were unfrozen: from a thermokarst lake (TKL; length of 50 cm), a thermokarst lagoon (LAG; length of 31 cm), and marine deposits (MAR; length of 12 cm) (Fig. S1 in the Supplement). For reference, all subsample depths are given in centimetres below surface level (cm b.s.l.). The unfrozen sediment cores were sampled using a push corer [∅ 6 cm], and the frozen sediment cores were sampled using a SIPRE corer [∅ 7.6 cm]. The frozen sediment cores were kept frozen at −20 °C, while thawed samples were packed and cooled at +4 °C for transport to AWI Potsdam, where all further analyses were conducted.
3.2 Laboratory analysis
The cores were subsampled in intervals of 5 to 10 cm. For the biomarker analysis, three to four samples of the longer, frozen cores and one to two samples of the shorter, unfrozen cores were selected, evenly distributed over the length of the cores. In preparation for further analyses, water for hydrochemical analysis was extracted, and subsequently all samples were freeze-dried, determining their weight before and after this process to calculate water/ice content. A more detailed description of the methods used in the laboratory is given in Sect. S1 in the Supplement.
3.2.1 Sedimentological analysis
The sedimentological analysis was mainly the measurement of grain size distribution (GSD).
These measurements were carried out using a Malvern Mastersizer 3000 with a Malvern Hydro LV wet-sample dispersion unit, measured in the range of 0.01–1000 µm. All grain size statistics were calculated using the software GRADISTAT (Blott and Pye, 2001) (Sect. S1.1 in the Supplement).
3.2.2 Biogeochemical analysis
For the biogeochemical analysis, all samples were homogenised using a planetary mill (FRITSCH Pulverisette 5). The determination of the total organic carbon content (TOC) was carried out using an ELEMENTAR soli TOC cube elemental analyser, measuring TOC and total inorganic carbon (TIC) via pyrolysis and gas analysis. Using a temperature ramping programme to distinguish between TOC and TIC, the device was heated to 400 °C for 230 s (TOC) and subsequently heated to 600 °C for 120 s (TIC). The third heating stage was 900 °C for 150 s to ensure complete combustion of the inorganic carbon compounds.
The carbon density (TOCvol) of each sample was determined using the bulk density and the TOC content. This was calculated using the following equation (Eq. 1) (Strauss et al., 2015).
The total nitrogen (TN) content was measured using an ELEMENTAR rapid MAX N exceed elemental analyser with a peak combustion temperature of 900 °C.
From the measured TOC and TN contents, the TOCTN ratio was calculated. This ratio provides information on the sources and the degradation level of the organic matter (OM) in the sediment, with high values indicating a higher share of terrestrial source material or well-preserved OM and low values indicating a higher share of aquatic sources or a high level of degradation of OM (Andersson et al., 2012; Meyers, 1997).
The measurement of the total mercury (Hg) content of the sediment samples was carried out using a direct mercury analyser DMA-80 EVO.
The measurement of the δ13C signature of bulk organic matter, as a palaeoenvironmental indicator, can also provide information on the sources of OM and its degree of decomposition. This is mainly determined by photosynthetic processes but also by other factors like atmospheric CO2, temperature, and water stress (Andersson et al., 2012). As the first step of the analysis, carbonates were removed from the samples using hydrochloric acid. Subsequently, the measurement was carried out using a ThermoFisher Scientific Delta V Advantage gas mass spectrometer with a FLASH EA 2000 elemental analyser and a ConFlo IV gas mixing system. The isotope ratio was determined in relation to the Vienna Pee Dee Belemnite standard [‰ vs. VPDB], and the instrumental measurement accuracy is ±0.15 ‰.
3.2.3 Lipid biomarker analysis
Extraction, measurement, and analysis
Subsamples for the lipid biomarker analysis were freeze-dried and homogenised. Lipid biomarkers were then extracted from approximately 8 g of the sample material using accelerated solvent extraction (ASE; ThermoFisher Scientific Dionex ASE 350) with dichloromethanemethanol (DCMMeOH 99:1). During extraction, samples were held in a static phase for 20 min at 75.5 °C and 5 MPa. For the subsequent analysis, 5α-androstane as a reference for n-alkanes in the aliphatic fraction and 5a-androstan-17-one as a reference for n-alkanols in the neutral NSO (nitrogen-, sulfur-, and oxygen-containing) fraction were added. Resolved samples were then fractionated into an aliphatic, aromatic, and NSO fraction using a medium pressure liquid chromatography (MPLC) system (Radke et al., 1980). Subsequently, the NSO fraction was separated into an acidic and neutral polar fraction by manual KOH column separation. In preparation for the measurement, the neutral NSO fraction was silylated by adding 50 µL DCM and 50 µL N-Methyl-N-(trimethylsilyl)trifluoroacetamide (MSTFA) and heated at 75 °C for 1 h. The measurement of n-alkanes in the aliphatic fraction and n-alkanols in the neutral NSO fraction was performed using gas chromatography-mass spectrometry (GC-MS; Thermo Scientific ISQ 7000 Single Quadrupole mass spectrometer with a Thermo Scientific Trace 1310 gas chromatograph). The GC-MS system was operated with a transfer line temperature of 320 °C and an ion source temperature of 300 °C. Ionisation was achieved using an ionisation energy of 70 eV at 50 µA. The full scan mass spectra ( 50 to 600 Da, 2.5 scans s−1) was analysed using the software XCalibur. The n-alkanes and n-alkanols were quantified by comparing their peak areas with those of the internal standards.
Biomarker indices
In total, five indices were calculated from the measured lipid biomarker concentrations. Three of these indices, calculated from the n-alkane concentrations, provide information on the respective sources of the OC.
The first index was the average chain length (ACL) of n-alkanes C23−33, calculated following Eq. (2), where i is the carbon number and C is the concentration (Poynter and Eglinton, 1990; Strauss et al., 2015).
A change in the ACL can indicate a change in the OC sources and thus a change in the input vegetation type to the soil profile (Schäfer et al., 2016). The long-chain odd-numbered n-alkanes are mainly produced by terrestrial plants like bryophytes (n-C23 and n-C25) and grasses (n-C31 to n-C33) or originate from terrestrial plant leaf waxes (n-C27 to n-C29) (Haugk et al., 2022; Zech et al., 2010).
The second and third indices are the Paq (ratio of aquatic to terrestrial plant material, Eq. 3) and the Pwax (ratio of terrestrial plant waxes to total hydrocarbons, Eq. 4), two ratios that can be used as proxies for the intensity of aquatic influence on the sediments and to differentiate between aquatic and terrestrial plant input (Thomas et al., 2023; Zheng et al., 2007).
With the Paq, developed by Ficken et al. (2000), it is possible to distinguish between submerged and floating macrophytes, with values between 0.4 and 1; emergent macrophytes, with values between 0.1 and 0.4; and terrestrial plants, with values <0.1, as a source for OC in the soil. Since this index and its thresholds were developed in tropical regions, the Pwax was additionally used in this study, as seen in Jongejans et al. (2020). The Pwax, developed by Zheng et al. (2007), indicates the relative proportion of waxy hydrocarbons from emergent macrophytes and terrestrial plants to total hydrocarbons (Zheng et al., 2007).
The following two indices are used to provide information on the level of degradation of the OC in the soils. The first index is the carbon preference index (CPI) of n-alkanes, introduced by Bray and Evans (1961). As a measure of alteration of OC, the values of the CPI decrease with the degradation of OC in the soil (Marzi et al., 1993; Strauss et al., 2015). The calculation in this study was carried out using the equation introduced by Marzi et al. (1993), with a chain length interval of C23−33 (Eq. 5).
The second index as a measure of the level of degradation of OC, introduced by Poynter (1989), is the higher plant alcohol index (HPA). As a basis of this index, it is assumed that the input ratio of n-alkanols and n-alkanes into a sedimentary environment is constant. Therefore, the ratio should depend on the extent of degradation, and since the n-alkanols are preferentially degraded over the n-alkanes or degraded to n-alkanes due to defunctionalisation, the ratio decreases with ongoing degradation (Poynter and Eglinton, 1990). The index was calculated using the following equation (Eq. 6) (Poynter and Eglinton, 1990).
3.3 Statistical analysis
The statistical analysis of the data included an analysis of central tendencies of the measured parameters across the different cores and the comparison of unfrozen and frozen deposits as well as saltwater-influenced sites and those not influenced by saltwater. A central tendency analysis across the different cores was only applied to the SDLAG, TKL, DLB, and UPL cores, since the LAG and MAR cores had a sample size that was too small. After testing and disproving a normal distribution of the data, the non-parametric Kruskal–Wallis rank sum test was chosen to compare the data of the four different sites. For an additional pair-wise comparison of cores, the Mann–Whitney–Wilcoxon test was used. In addition, it was tested to confirm if there are statistically significant differences between deposits that are influenced by saltwater (MAR, LAG, SDLAG), deposits that are not influenced by saltwater (DLB, TKL, UPL), and frozen (SDLAG, DLB, UPL) and unfrozen (MAR, LAG, TKL) cores, using the Mann–Whitney–Wilcoxon test. All tests of the central tendency analysis were carried out using R (script in Sect. S4.1 and S4.2 in the Supplement).
To test the data for existing correlations between the different measured parameters, a correlation matrix was created in R (script in Sect. S4.3 in the Supplement). The calculation of the correlation was carried out after Pearson. The finished plot of the correlation matrix only shows correlations with a significance of p<0.05.
4.1 Sedimentology
The upland permafrost core (UPL) is generally dominated by silt (Fig. 2), as are the sediment samples of the thermokarst lake (TKL) but with a slightly higher share of silty material. Similar results are present for the drained lake basin core (DLB), with all said cores being homogeneous over the whole length (Figs. 2 and 3). The GSD of the semi-drained lagoon (SDLAG) has a shift from higher shares of coarser grain sizes in the range of fine sand and more silty material found below 100 cm b.s.l., while the upper part reaches towards silty and clayish material. The deposits of the intact lagoon (LAG) are again dominated by silt (Fig. 2). The deposits, namely one sample, of the marine (MAR) core show a bigger sand portion of 58.5 % and represents generally the coarsest grain sizes among the six studied cores (Fig. 3). For more details, please see Fig. S1–S3 in the Supplement as well as the published measurement data (Giest et al., 2024a, b, c).
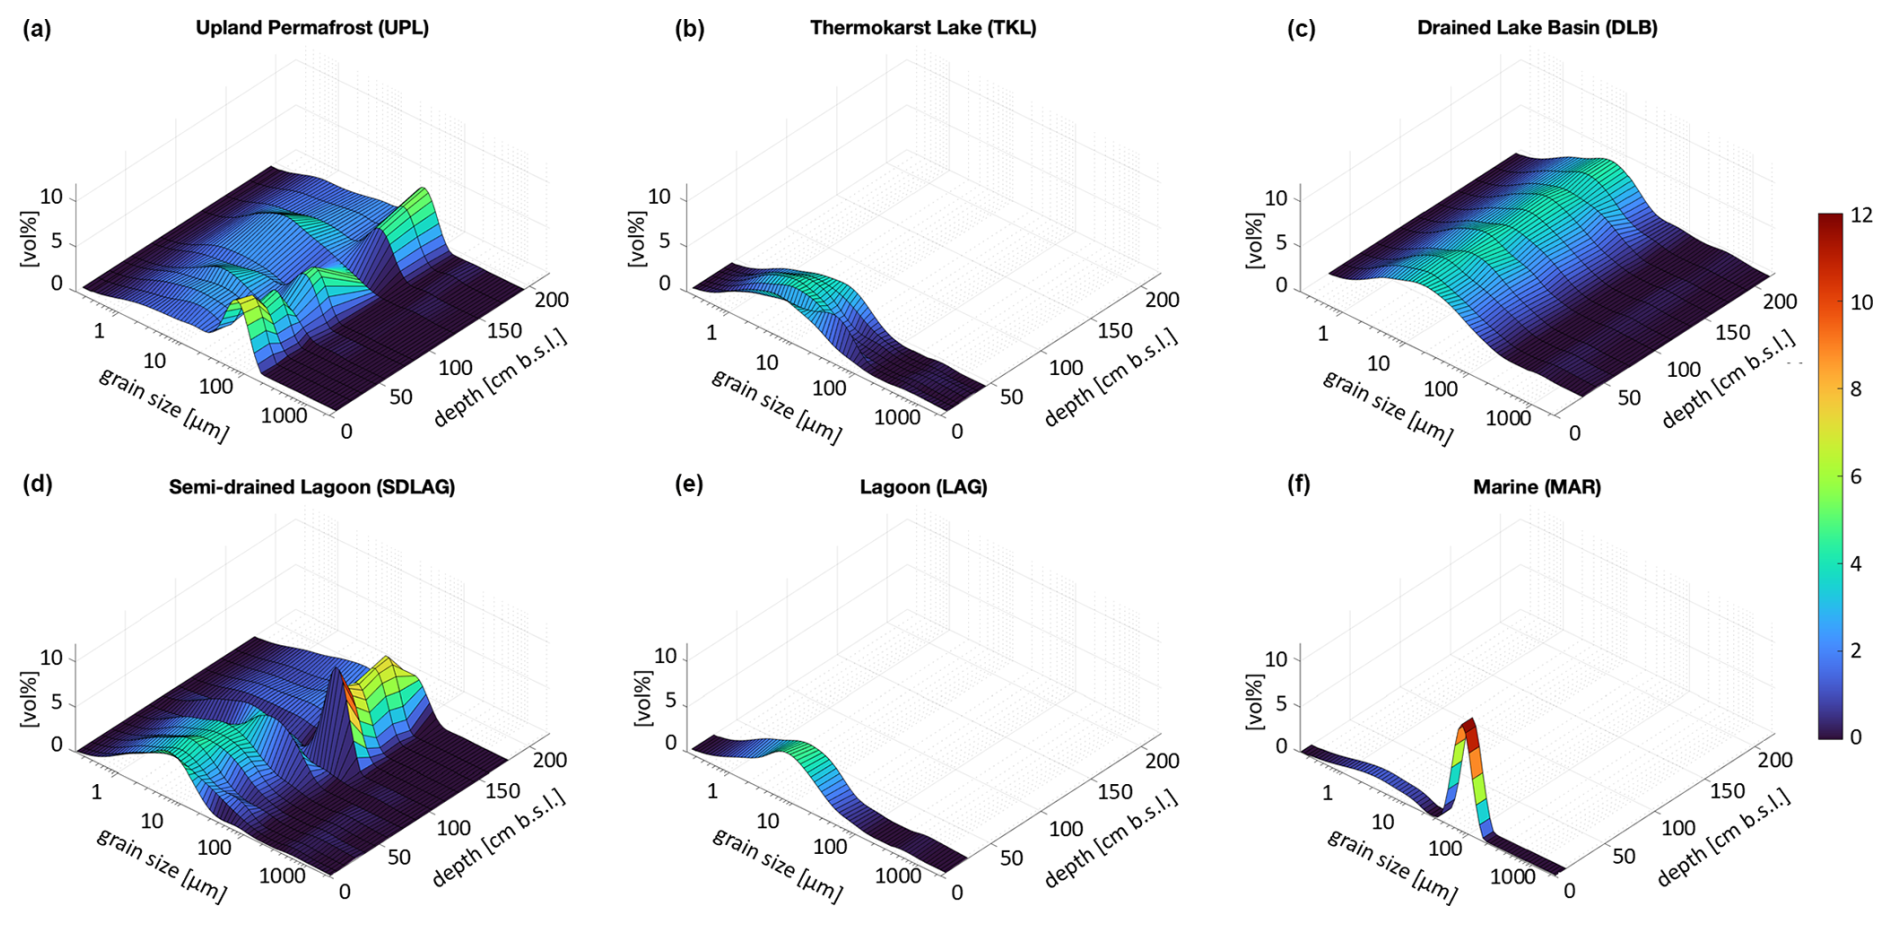
Figure 2Three-dimensional grain size distributions over depth [cm] of a land–sea transect: (a) upland permafrost, (b) thermokarst lake, (c) drained lake basin, (d) semi-drained lagoon, (e) intact lagoon, and (f) marine profiles. The colours represent the share [%] of the grain sizes [µm], with dark blue representing 0 % and red representing 10 %.
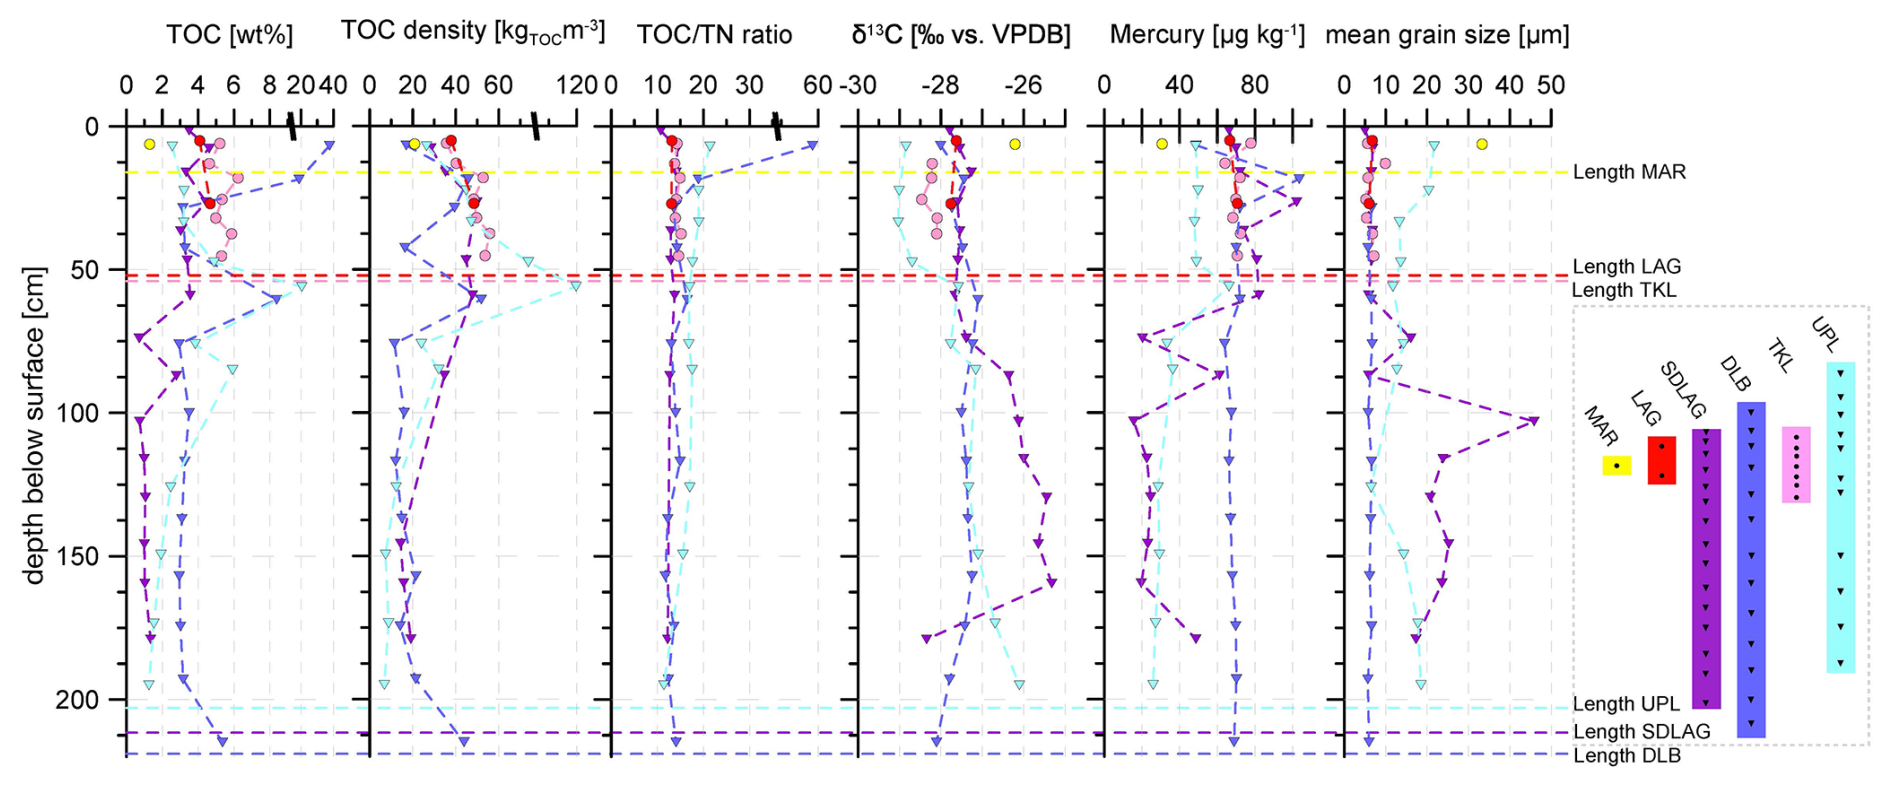
Figure 3Summary of the biogeochemical parameters: total organic carbon (TOC) in weight per cent [wt %], TOC density [kgTOC m−3], total organic carbontotal nitrogen ratio (TOCTN ratio), stable carbon isotope ratio [δ13C] per mil relative to the Vienna Pee Dee Belemnite standard [‰ vs. VPDB], mercury [µg kg−1], and mean grain size [µm] of the UPL, TKL, DLB, SDLAG, LAG, and MAR profiles, with circles for unfrozen sediments and triangles for frozen sediments. Core abbreviations: UPL: upland permafrost; TKL: thermokarst lake; DLB: drained lake basin; SDLAG: semi-drained lagoon; LAG: lagoon; MAR: marine. Split x axis for TOC, TOC density, and TOCTN ratio.
4.2 Biogeochemistry
The DLB core shows the strongest variations in the TOC content, ranging from 2.94 wt % to 37.62 wt %, with a mean of 7.57 wt % (median of 3.26 wt %) (Fig. 3). The UPL core also shows strong variations in the TOC content, peaking at 20.42 wt % at a depth of 56 cm b.s.l., with a mean of 4.66 wt % (Fig. 3). In contrast, the TKL sediment core shows a smaller range in the TOC content of between 4.63 wt % and 6.23 wt % (mean of 5.37 wt %) (Fig. 3). It is significantly higher than the TOC content in the upper part of the UPL deposits. The two samples from the LAG plot are in the lower end of the range of the TKL deposits, with TOC contents of 4.63 wt % and 4.09 wt % (Fig. 3). Above 40 cm, the TOC content of the SDLAG core varies between the content of the UPL and TKL deposits and below it has a consistently lower TOC contents than the other deposits, with a mean of 2.37 wt %, which is significantly lower than in the DLB and TKL samples (Fig. 3). Additionally, the sample of the MAR deposits has a very low TOC content of 1.3 wt % (Fig. 3).
The highest TOCvol was determined in the TKL deposits, with a mean of 48.02 kg m−3 (Fig. S3). It is significantly higher than in the SDLAG deposits (mean of 32.23 kg m−3) and the DLB deposits, with the lowest mean of 25.06 kg m−3, both with strong variations in the TOCvol over depth (Figs. 3 and S3). The strongest variation in the TOCvol is shown by the UPL core, ranging between 6.79 kg m−3 and 119.7 kg m−3 (Fig. 3). The mean TOCvol of the UPL deposits of 36.66 kg m−3 is relatively high (Fig. S3). The TOCvol of the marine sample is again relatively low at 20.86 kg m−3 (Fig. S3).
The TOCTN ratio is highest in the UPL deposits (mean of 17.23), which is significantly higher than in all thermokarst-influenced deposits (Fig. 3). The lowest TOCTN ratios were measured in both lagoonal sites, with a mean of 13.1 in the SDLAG core (Fig. 3). The TOCTN ratios of the SDLAG core are additionally significantly lower than the TOCTN ratios of the TKL deposits, with a mean of 14.39 (Fig. 3). The DLB core shows the highest ratio of 58.46 in the uppermost sample and a strong decrease in the deeper samples, resulting in a mean of 17.5 (median of 13.95) (Figs. 3 and S3). The TN content of the MAR sample below the detection limit resulted in no TOCTN ratio.
The strongest variations in the δ13C ratio were measured in the UPL (−26.1 ‰ to −29 ‰) and SDLAG (−25.3 ‰ to −28.3 ‰) deposits (Fig. 3). It is lowest, at around −29 ‰, in the upper 50 cm of the UPL core and increases in the deeper part of the core (mean of −27.8 ‰) (Fig. 3). Both the DLB (mean of −27.5 ‰) and the SDLAG (mean of −26.9 ‰) deposits have significantly higher δ13C ratios than the TKL deposits, with the lowest mean δ13C ratio of −28.2 ‰ (Fig. S3).
The mercury (Hg) analysis of the different cores shows that the thermokarst-influenced deposits have higher Hg concentrations compared to the UPL deposits. Significant differences in the Hg content were observed between the DLB and UPL deposits as well as between the TKL and UPL deposits, with the UPL samples having significantly lower Hg concentrations (Fig. S3). The median Hg content of the TKL samples (70.63 µg kg−1) is nearly twice as high as the median of the UPL samples (36.34 µg kg−1). Furthermore, the Hg levels of the two samples of the LAG core are in the same range as in the TKL samples (Fig. 3). The SDLAG profile shows the largest variations in the Hg content across the samples and has no significant differences to the other cores (Figs. 3 and S3). For more details, please see the published dataset (Giest et al., 2024a).
4.3 Biomarker
4.3.1 Indices indicating organic carbon sources
The average chain lengths (ACLs) of n-alkanes are highest in the three samples of the UPL core, with the highest value of 28.73 in the sample from the middle part (Fig. 4). The lowest values have been detected for the LAG and the MAR samples, with the lowest from the MAR core (26.2) at a depth of 6.25 cm b.s.l. (Fig. 4). All cores with more than one sample show higher ACL values in the deeper part of the core (Fig. 4).
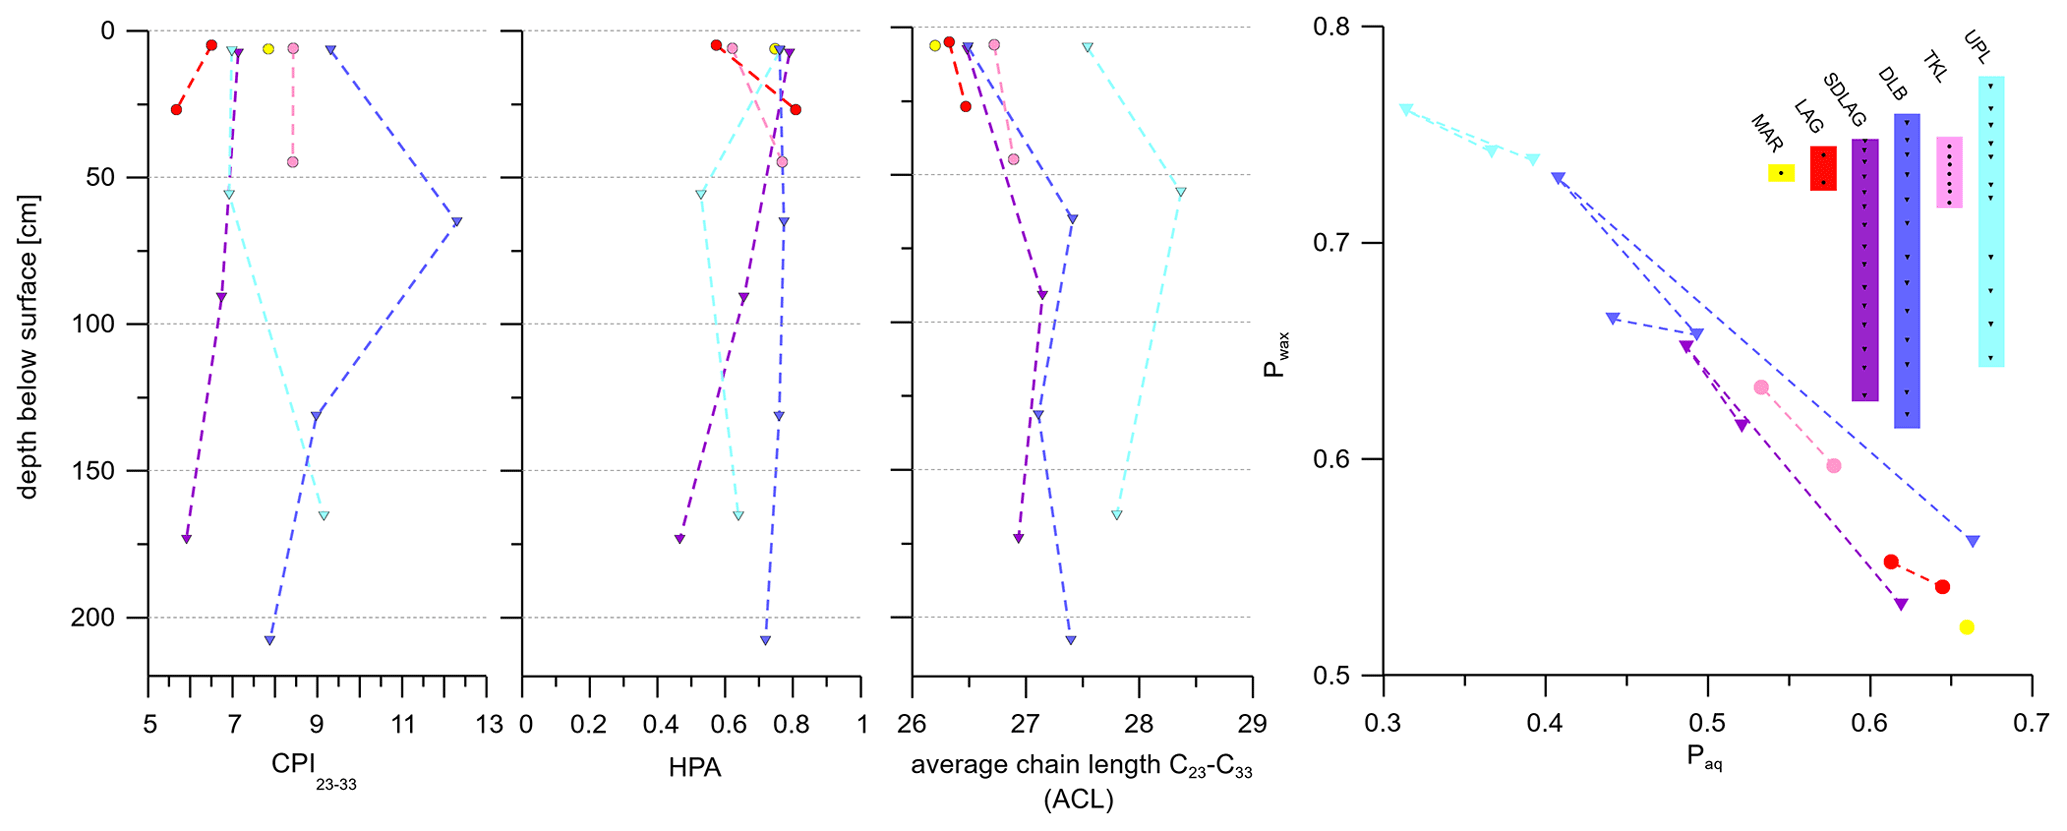
Figure 4Plots of the organic carbon quality and sources using biomarker indices: the carbon preference index (CPI), the higher plant index (HPA), average chain length (ACL), and the proxies Paq for aquatic OM and Pwax for terrestrial OM, with circles representing unfrozen sediments and triangles representing frozen sediments. Core abbreviations are as follows. UPL: upland permafrost; TKL: thermokarst lake; DLB: drained lake basin; SDLAG: semi-drained lagoon; LAG: lagoon; MAR: marine.
As shown in Fig. 4, the highest Paq values were measured in the MAR sample and the uppermost DLB sample, both having a Paq of 0.66. The MAR sample also has the lowest Pwax of 0.52, indicating together with the Paq an aquatic influence on the OM composition (Fig. 4). Also, the uppermost DLB sample shows a relatively low Pwax of 0.56 (Fig. 4). Other samples with high Paq and low Pwax are both LAG samples, with a Paq of between 0.61 and 0.64 and a Pwax of between 0.54 and 0.55. The uppermost SDLAG sample has a Paq of 0.62 and a Pwax of 0.53 (Fig. 4). The highest Pwax values were calculated for all UPL samples, ranging between 0.76 and 0.74 (Fig. 4). At the same time, they show the lowest Paq values, varying between 0.31 and 0.39 (Fig. 4). Another sample with a high Pwax of 0.73 and a low Paq of 0.41 is the DLB sample, with a mean depth of 65.25 cm b.s.l. (Fig. 4). Overall, the data show two end members: the marine sample with the most aquatic OM source and the upland permafrost samples with the most terrestrial OM source, with the samples from the other location distributed between the two.
4.3.2 Indices indicating organic carbon quality
The carbon preference index (CPI) of n-alkanes shows the widest range in the samples of the DLB core, ranging between 7.88 in the deepest sample and the overall highest value of 12.31, calculated for the sample from a depth of 65.25 cm b.s.l. (Fig. 4). The lowest CPI values of 5.67 and 6.51 were measured in the LAG samples (Fig. 4).
The higher plant index (HPA) varies between 0.46 in the deepest SDLAG sample and 0.81 in the deeper LAG sample (Fig. 4). The patterns of the HPA over depths in the UPL, DLB, and SDLAG samples are similar to the pattern of the CPI in terms of values increasing or decreasing over depth within each site (Fig. 4). In contrast, the patterns of the HPA over the depth of TKL and LAG are reversed compared to the CPI, with an increasing value from the deeper sample to the uppermost one (Fig. 4). The dataset is available from Giest et al. (2024b).
5.1 Organic carbon
5.1.1 Carbon stocks under various geomorphological influences
The total range of TOC contents, as well as the TOCvol, of all samples is wide (TOC: 0.72 wt %–37.62 wt %; TOCvol: 6.79–119.7 kg m−3) (Figs. 3 and S3) but comparable to other studies that include permafrost and thermokarst features (TOC: 0.2 wt %–43 wt %; TOCvol: 2.8–93.5 kg m−3) (Strauss et al., 2015; Schirrmeister et al., 2011; Fuchs et al., 2018). A reason for this variability is probably the heterogeneity of the organic source material from the different permafrost and thermokarst landscape features, including well-preserved peat, palaeosoils, and marine-influenced coastal areas. The large range of the TOC content (2.94 wt %–37.62 wt %) in the DLB core is likely caused by such a mixture of permafrost soils and thermokarst lake origin, with different material-type input and decomposition processes. Additionally, post-drainage peat accumulation that caused the high TOC content in the upper soil of the DLB has been previously shown in other studies on drained thermokarst lake basins (Fuchs et al., 2019; Jones et al., 2012; Lenz et al., 2016). The large, often flat-bottomed drained lake basins provide perfect conditions for the formation of wetlands, through which most become vegetated in 5–10 years after the drainage event and accumulate peat 10–20 years after (Bockheim et al., 2004; Jones et al., 2012). Compared to the mean TOCvol of permafrost deposits from the Yedoma region (19 kg m−3) and of thermokarst deposits (33 kg m−3) (Strauss et al., 2013), the mean TOCvol of the cores in this study is relatively high (UPL: 37 kg m−3; TKL: 48 kg m−3; DLB: 25 kg m−3; SDLAG: 32 kg m−3), revealing a large pool of carbon in all deposits studied (Fig. S3). The high TOCvol in the TKL deposits, significantly higher than in the SDLAG and DLB deposits, is likely the result of an interplay of various factors. It might be partially related to the relocation of organic matter (OM), for example, due to erosion, leading to OC accumulation in the basin and thaw subsidence progression due to ground ice loss (Lenz et al., 2016). Additionally, it is likely that there is a higher input of Holocene OC and increased primary productivity in the lake stimulated by nutrient release from thawing permafrost (Strauss et al., 2015, 2024; Wolter et al., 2018). The accumulation of OC might be further accelerated by slow decomposition rates in the cold and anaerobic lake environment (Strauss et al., 2015; Haugk et al., 2022; Jongejans et al., 2018). The lower TOCvol in the refrozen thermokarst features (SDLAG and DLB) might partially be influenced by ground ice accumulation after the drainage of the water bodies. In the case of the SDLAG deposits, the lower TOCvol is combined with a low mean TOC content (2.37 wt %), which might also be influenced by a decrease in primary productivity with the transition from thermokarst lake to lagoon, since strong seasonal fluctuations of the salt content, the lowered, fluctuating water level to almost drainage, and the bedfast ice formation in winter shorten the period of biological production. Moreover, there might have been decomposition of OM in the SDLAG deposits all year round when the lagoon had more water or rather was in the state of a thermokarst lake, which could also have led to decreased TOC content.
5.1.2 Influence of various OM sources
The analysis of the OC and lipid biomarkers in the deposits shows that they contain OM from different sources, likely additionally influenced by parameters such as salinity, temperature, and water availability. This results in two end members for the sample set, MAR and UPL, with the other sites aligning between them. It nicely depicts the transformation processes of soil OM over the course of landscape development from dry terrestrial permafrost to thermokarst lakes, saltwater exposure, and finally a marine state (Jenrich et al., 2021). One indicator for the source of OM is the TOCTN ratio, with lower values indicating a stronger aquatic influence and higher values indicating a stronger terrestrial influence (Meyers, 1997). The highest mean TOCTN ratio was measured in the UPL deposits (17.2), significantly higher than in the three thermokarst landscape features included in the statistical analysis, indicating the strongest terrestrial influence on the OM composition of the UPL core (Figs. 3 and S3). The lowest mean TOCTN ratios, significantly lower than in the UPL and TKL deposits, were measured in the LAG and SDLAG samples (13.1), indicating the strongest aquatic influence on those deposits, for example, from algae and bacteria. The largest variation of the TOCTN ratio is shown in the DLB core (11.7–58.5), indicating different sources of OM during the different stages of the thermokarst lake evolution. Since the TOCTN ratio can also be influenced by other processes like the level of degradation of OM, we also analysed the n-alkane distribution in the samples and calculated the Paq and Pwax as indicators of the source of OM. The results of these parameters also show the two end members (Fig. 4) with the highest ACL values and highest Pwax, thus the strongest terrestrial influence on the OM composition in the UPL deposits and the strongest aquatic influence on the OM composition in the marine sample, with the lowest ACL and a high Paq. It is also shown in Fig. 4 that all thermokarst deposits (LAG, SDLAG, DLB, and TKL) align between the two end members, and thus are more strongly influenced by aquatic OM than the UPL samples. Moreover, Fig. 4 hints at a change in the source of OM in the SDLAG, DLB, and UPL profiles from the upper soil compared to the samples between 50 and 100 cm b.s.l. and between 100 and 200 cm b.s.l. This might not be influenced by the different stages of the thermokarst lake evolution, but rather by changes in hydrological conditions at the time of deposition or by the relocation of OM, for example, due to cryoturbation or roots, since both the terrestrial end-member UPL and the thermokarst features show these changes.
5.1.3 Organic carbon degradation
The decomposition of OM releases carbon as CO2 and CH4 and portions of nitrogen as N2O from the soils to the atmosphere (Schuur et al., 2022; Strauss et al., 2024; Voigt et al., 2020). Deposits containing further degraded OM have lower TOCTN ratios than those containing fresh OM due to a larger share of nitrogen in the soils (Andersson et al., 2012; Weintraub and Schimel, 2005). Thus, in addition to the OM sources, the TOCTN ratios also contain a component dependent on the OM decomposition level. As seen above, the TOCTN ratios in the UPL deposits were significantly higher compared to the thermokarst-influenced deposits (SDLAG, TKL, DLB), which were interpreted as a higher terrestrial character of the OM in the UPL samples. However, these differences are likely also influenced by OM degradation during unfrozen periods of the thermokarst deposits. The mean TOCTN ratio of UPL is lower than in comparable sites (Routh et al., 2014; Fuchs et al., 2019), while TKL and DLB show higher values, indicating a relatively high level of preservation of the accumulated OM, leading to a likely high quality for future degradation and therefore a vulnerability to decomposition after thaw.
The carbon isotopic signal is also influenced by both factors: OM sources and OM degradation. Terrestrial material usually shows lighter and marine OM heavier δ13C signals, and due to the preferred release of 12CO2 during degradation, the residual OM becomes isotopically heavier (Andersson et al., 2012). In the uppermost samples (down to 50 cm), the data resembled the two-end-member model of the OM sources, with the UPL samples showing the lightest δ13C values (stronger terrestrial character) and the MAR sample exhibiting the heaviest signal (marine influenced) (Fig. 3). The other samples show intermediate data resembling a supply of different OM sources and/or different levels of degradation. The deeper part of the picture is less clear. The UPL samples are isotopically heavier, plotting in the range of the DLB data, whose δ13C signal is relatively constant throughout the whole core. This could indicate a higher level of degradation of OM in the deeper UPL deposits. The deeper SDLAG samples are, with the exception of the deepest sample, isotopically significantly heavier, which could indicate a stronger aquatic/marine influence in the lagoon during the time of deposition rather than a stronger degradation of the OM.
Also, the CPI depends on both the source of OM and the level of OM maturation. The original odd-over-even carbon number predominance of the indigenous n-alkanes in a sample is determined by the source material and changes to lower values during OM maturation. Here, the wide range of different CPIs most likely resembles the various mixtures of OM at the different sites. This is supported by the findings of Jongejans et al. (2021), who also reported that the CPI represents the source OM in such relatively young sediments. The HPA shows a very narrow band of values for all samples. In the uppermost sample of the TKL and LAG, samples show a shift to lower values, which could indicate a higher degradation of the OM in the surface sediments. The UPL and SDLAG samples show lower HPA values in the deeper part of the core, which might point to periods of stronger degradation in the past. However, the material shows low variability in the HPA values overall, plotting in the upper scale of the parameter and therefore indicating relatively less degraded OM. Thus, with ongoing climate warming and the thawing of the deeper permafrost layers, the preserved OM of good quality could become available to decomposition, leading to increased emissions of greenhouse gases.
5.2 Effects of OC characteristics on environmental mercury
Processes that have an influence on OC characteristics in soils can also have effects on further parameters, a prominent one being total mercury content (THg). To identify such associations, a correlation matrix was computed, integrating the measured biogeochemical and sedimentological parameters (Fig. 5). TOC content and TOCvol are weakly positively correlated with the Hg content in the samples (correlation factor of 0.34 and 0.42, respectively). In general, sources for Hg accumulating in Arctic soils can be both natural and anthropogenic. Natural sources, contributing to the increase of atmospheric Hg and subsequent deposition into soils, include boreal forest fires and volcanic activity. Anthropogenic input has significantly intensified due to industrialisation and expanding land use (Jonsson et al., 2017). A reason for the positive correlation of the TOCvol with Hg is presumably that approximately 70 % of the Hg in the Arctic tundra is derived from gaseous elemental Hg, which is ubiquitously present in the atmosphere (Obrist et al., 2017). Since the deposition of gaseous elemental Hg is strongly influenced by the Hg uptake of vegetation, sites with a higher input of OM and therefore higher TOCvol also accumulate higher levels of Hg bound in plant matter (Obrist et al., 2017). The Hg content in the deposits is furthermore negatively correlated with the δ13C ratio (−0.42), which we found to be very weak, like for TOC. This correlation indicates that there are higher mercury contents in the deposits with OM from a terrestrial or mixed terrestrial/aquatic source. For example, the marine-influenced MAR sample with the highest δ13C signal shows the lowest Hg content, and the upper UPL samples with the lower δ13C signal shows higher Hg content than the lower UPL samples with the higher δ13C signal (Fig. 3). The same can be observed for the SDLAG samples. Mainly, the Hg content correlates negatively with the mean grain size (−0.77). This is displayed in the mercury contents in the fine-grained freshwater thermokarst features (mean DLB of 69.87 µg kg−1; mean TKL of 70.74 µg kg−1) that are significantly higher than in the UPL deposits (mean UPL of 40.16 µg kg−1). A reason for this could be that the thermokarst processes might affect the distribution and accumulation of Hg due to the release of Hg from previously frozen Hg-containing OM in the soil upon decomposition (Schuster et al., 2018). Additionally, thermokarst, erosion, and an increased soil water movement in a thickening active layer, all triggered by permafrost thaw, can increase the transport of Hg from the soils to Arctic surface waters, resulting in higher Hg concentrations in lacustrine and post-drainage sediments (Rydberg et al., 2010), which is also indicated by the data of this study. Especially in the SDLAG core, the correlation of thermokarst processes with OC and sediment characteristics and the Hg content is visible. The GSD shows a peak at coarser grain sizes, between fine sand and silt, similar to the UPL deposits in the deeper half of the core below 100 cm b.s.l. (Fig. 2). The upper half of the core shows a peak at finer grain sizes, similar to the thermokarst features, indicating lacustrine deposits (Fig. 2). This shift indicates that there is less influence of thermokarst processes in the deeper half of the core. Additionally, there are lower Hg contents in the deeper part (15.57–48.65 µg kg−1), akin to the Hg content in the UPL deposits and accompanied by low TOC contents (0.74–1.35 wt %) (Fig. 3). In contrast, the thermokarst-influenced upper half of the core shows higher Hg concentrations (20.27–102.17 µg kg−1), similar to the Hg concentrations in the other thermokarst features and accompanied by higher TOC contents (0.72–4.65 wt %) (Fig. 3).
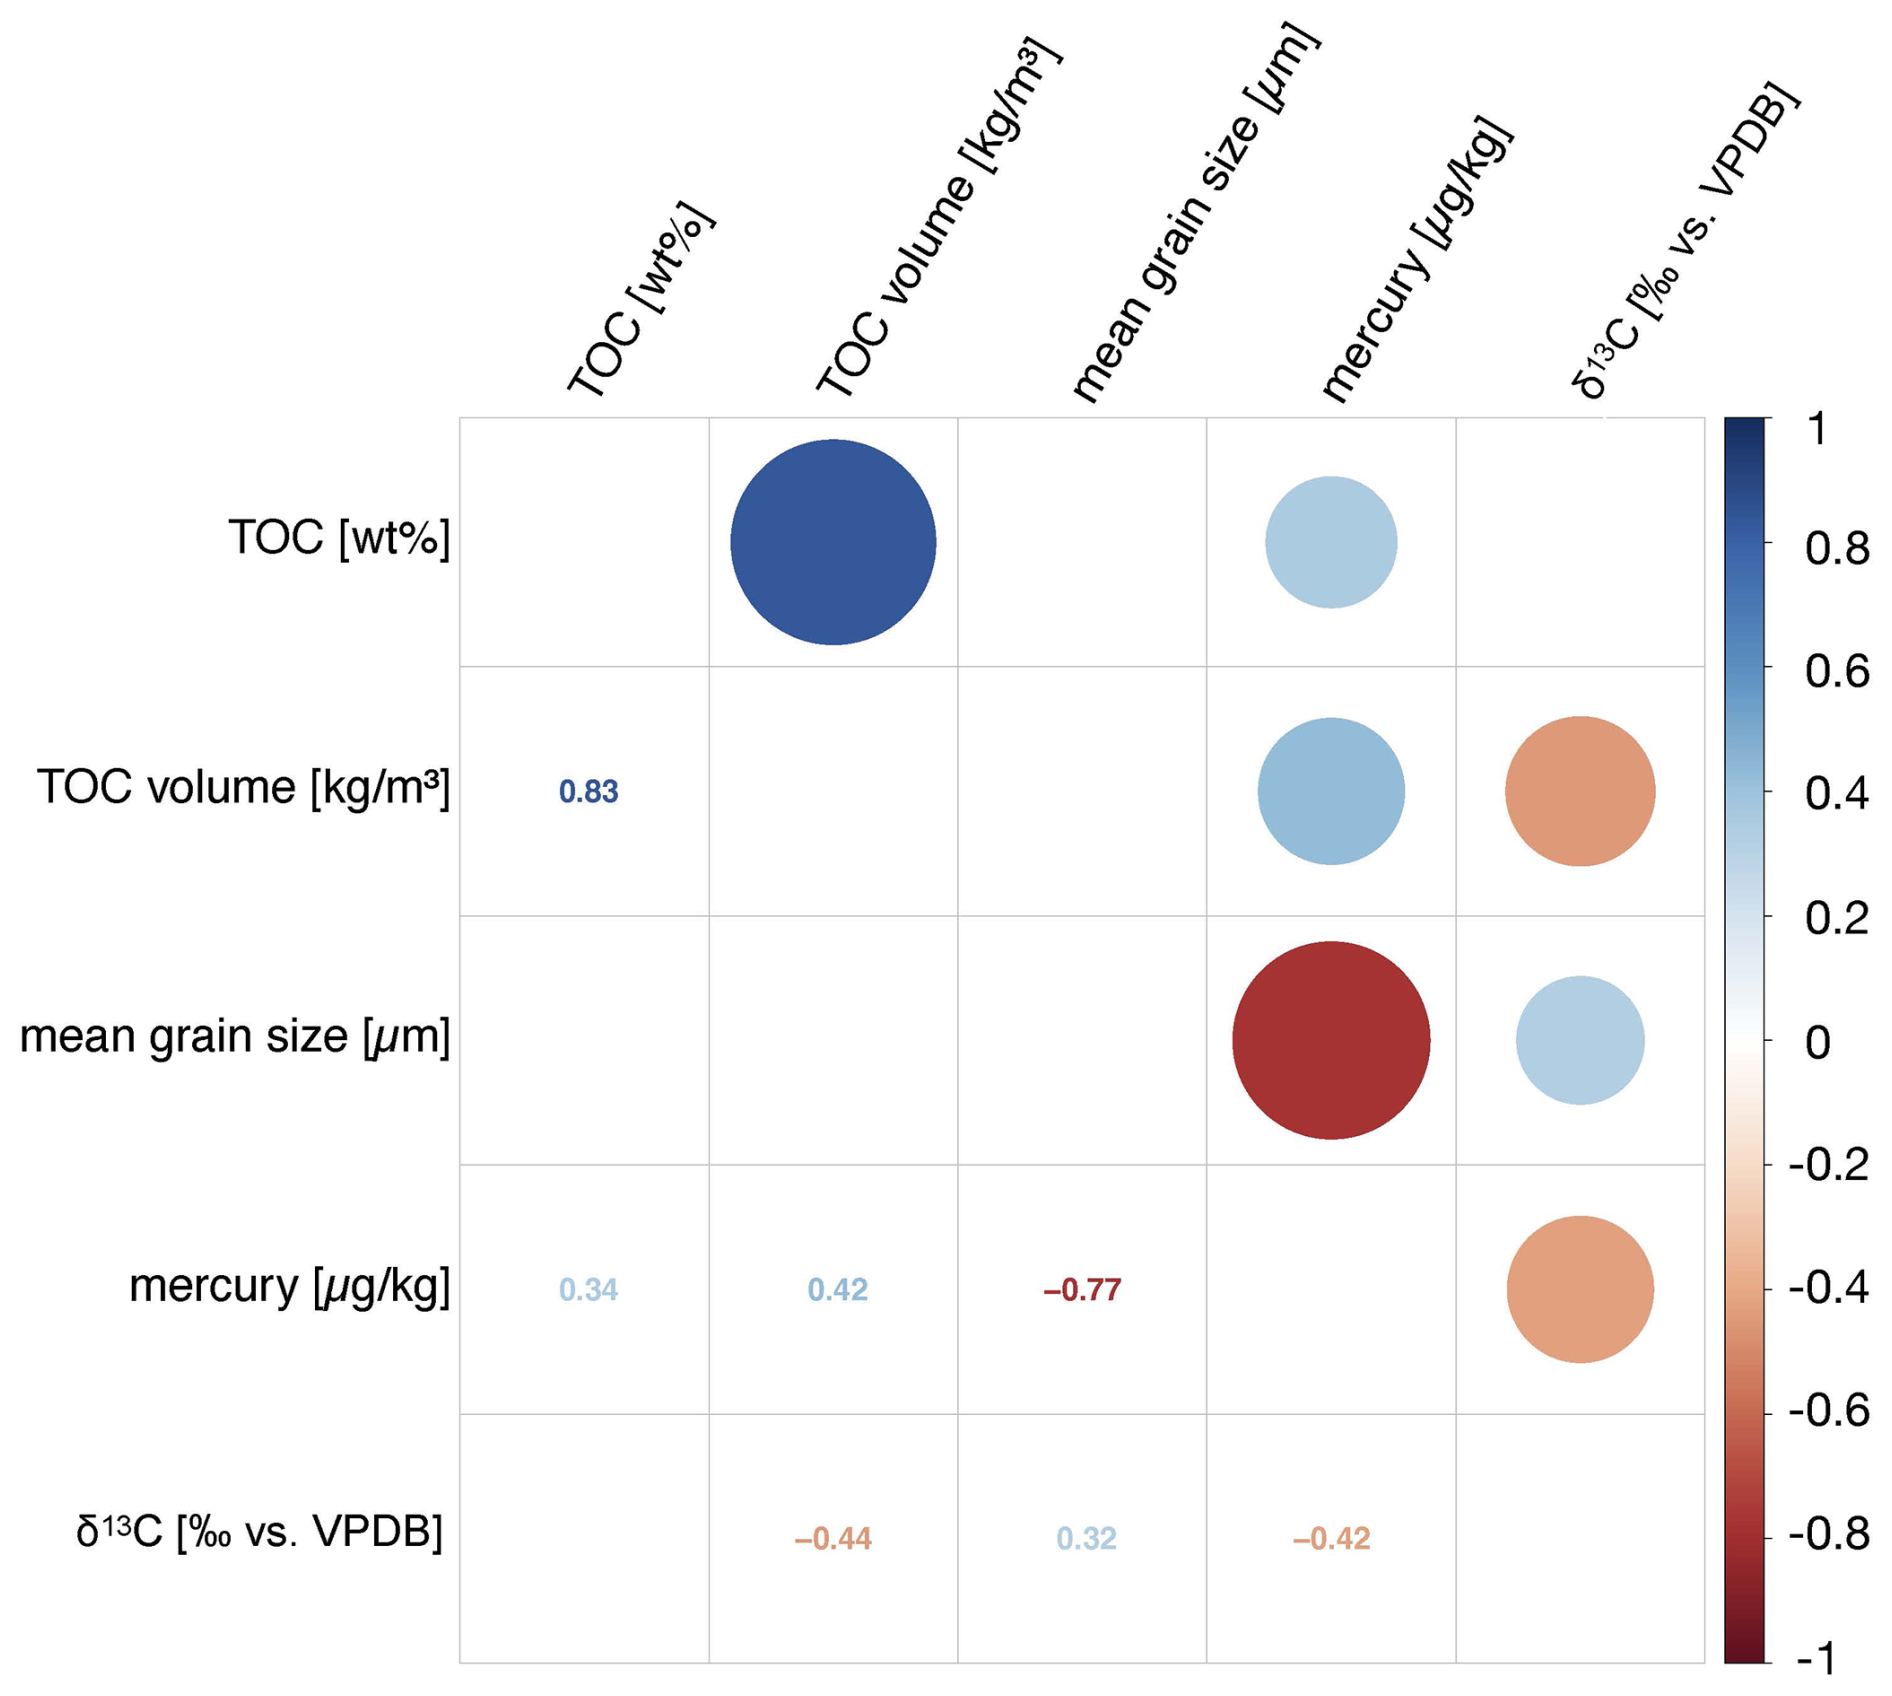
Figure 5Correlation matrix of sedimentological and biogeochemical parameters. Strong positive correlations in dark blue; strong negative correlations in dark red. TOC: total organic carbon content in weight per cent; TOC volume: organic carbon density; δ13C: stable carbon isotope ratio in per mil relative to the Vienna Pee Dee Belemnite standard.
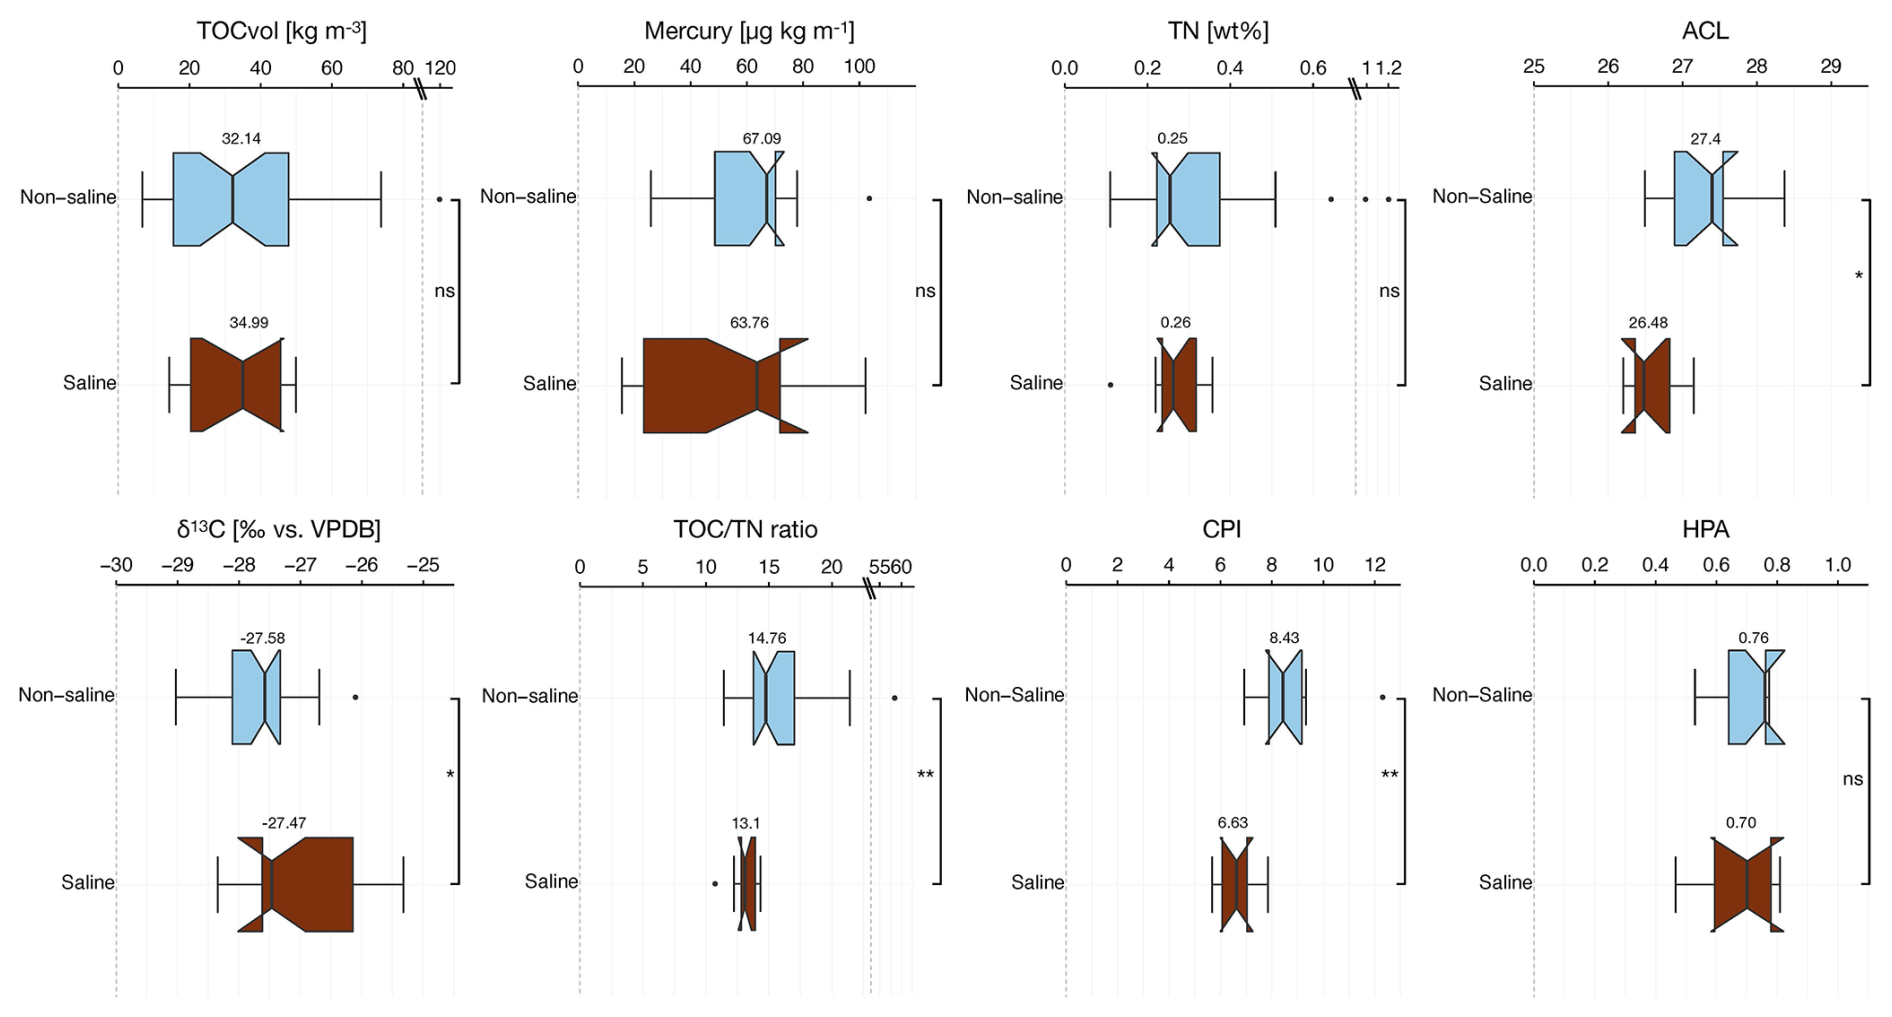
Figure 6Boxplots of the biogeochemical parameters divided into saline and non-saline sediments: total organic carbon density (TOCvol) [kgTOC m−3], mercury [µg kg−1], total nitrogen (TN) in weight per cent [wt %], average chain length (ACL) of n-alkanes, stable carbon isotope ratio [δ13C] per mil relative to the Vienna Pee Dee Belemnite standard [‰ vs. VPDB], total organic carbontotal nitrogen ratio (TOCTN ratio), carbon preference index (CPI), and higher plant alcohol index (HPA) of profiles in non-saline (blue) (including upland permafrost, thermokarst lake sediments, and drained lake basin sediments) and saline (red) (including semi-drained lagoon sediments, lagoon sediments, and marine sediments) soil settings. The whiskers display the data range (outliers as black points), and the boxes show the interquartile range (25 %–75 %). The vertical black line marks the median, and the notches represent the 95 % confidence interval. The bars right of the boxes show the statistical significance of differences between the groups (ns: not significant; ∗: p<0.05; : p<0.01; : p<0.001).
5.3 Influence of salinity and soil condition on the biogeochemical soil characteristics
Looking at the differences in ACL and δ13C, specifically comparing saline, unfrozen deposits with non-saline, frozen deposits, and combining this with the rather low TOCTN ratios in the saline deposits, which is typical for aquatic OM, it is evident that the saline deposits examined in this study showcase a stronger aquatic influence in their OM composition. The CPI values are higher in the non-saline samples (Fig. 6), which could resemble a different odd-over-even carbon number predominance distribution of n-alkanes in the aquatic/marine vs. terrestrial organic biomass. All three parameters, the δ13C, the TOCTN ratio, and the CPI, might additionally indicate more fresh, undegraded OM in the non-saline deposits, which is likely influenced by a decreased input of fresh OM in the saline environments due to decreased primary productivity and increased microbial activity, since the salinity in the soil water leads to a depression of its freezing point, thus a longer unfrozen period and less retention of fresh OM in the coarse marine sediments (Bischoff et al., 2018; Jongejans, 2022).
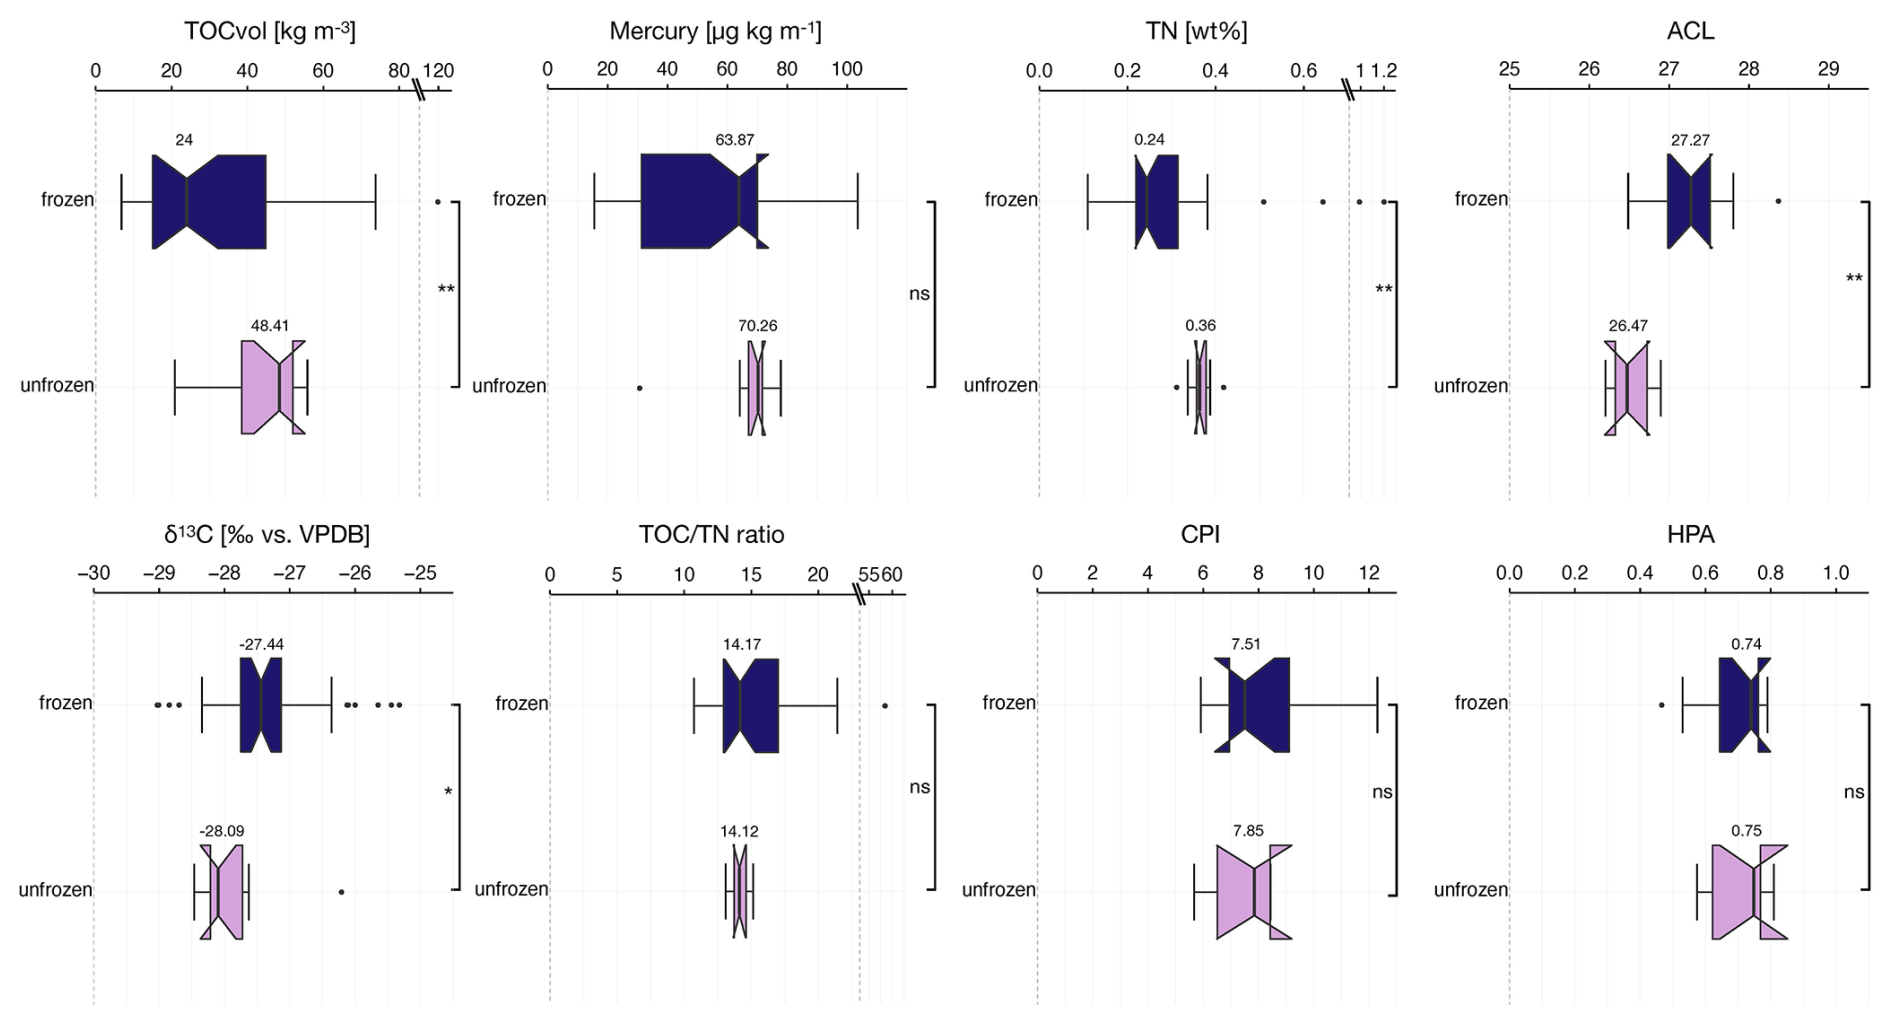
Figure 7Boxplots of the biogeochemical parameters divided into frozen and unfrozen sediments: total organic carbon density (TOCvol) [kgTOC m−3], mercury [µg kg−1], total nitrogen (TN) in weight per cent [wt %], average chain length (ACL) of n-alkanes, stable carbon isotope ratio [δ13C] per mil relative to the Vienna Pee Dee Belemnite standard (‰ vs. VPDB), total organic carbontotal nitrogen ratio (TOCTN ratio), carbon preference index (CPI), and higher plant alcohol index (HPA) of frozen profiles (dark blue) (including upland permafrost, drained lake basin sediments, and semi-drained lagoon sediments) and unfrozen (pink) (including thermokarst lake sediments, lagoon sediments, and marine sediments) soil profiles. The whiskers display the data range (outliers as black points), and the boxes show the interquartile range (25 %–75 %). The vertical black line marks the median, and the notches represent the 95 % confidence interval. The bars right of the boxes show the statistical significance of differences between the groups (ns: not significant; ∗: p<0.05; : p<0.01; : p<0.001).
Moreover, the comparison of the frozen and unfrozen deposits shows significant differences in the TOCvol and the TN content. The frozen deposits have significantly lower TOCvol (median of 24 kg m−3) and TN (median of 0.24 wt %) compared to the unfrozen deposits (median of TOCvol 48.41 kg m−3; median TN of 0.36 wt %) (Fig. 7). The higher TN content in the unfrozen deposits is likely influenced by erosion processes and reactivated soil water movement in thawed permafrost as well as surface runoff from nitrogen-rich upland permafrost and the refrozen thermokarst features, leading to the deposition of nitrogen in the aquatic systems (Strauss et al., 2024). Furthermore, if bioavailable, the increased TN content in thawed permafrost soils could potentially enhance the ecosystem productivity (Strauss et al., 2022), thereby influencing the increased TOCvol in the unfrozen deposits. Also, the significantly lower δ13C values in the unfrozen deposits potentially indicate a higher input of fresh OM to the unfrozen thermokarst environments. Additionally, thaw subsidence progression in the unfrozen deposits and the accumulation of ground ice in the (re)frozen deposits likely have an influence on the TOCvol (Strauss et al., 2015).
The HPA data are quite similar for the frozen/unfrozen and the saline/non-saline sites and plot in the upper range of the parameter scale. This could indicate a comparable level of degradation across all sites and the potential to act as a good substrate for greenhouse gas production when actively metabolised. No significant differences were additionally identified for the Hg content. This might be influenced by the way Hg accumulates in sedimentary deposits. We see evidence that thawing permafrost initiates the reactivation and accumulation of Hg in thermokarst-affected deposits. Unlike other measured parameters, these processes are not necessarily reversed upon the refreezing of the deposits but instead tend to pause until the repeated thawing of the soils. Consequently, the amount of Hg in the soils is likely to increase with every thermokarst lake and thawing cycle the deposits undergo, without the current soil condition and other properties, such as salinity, having a major influencing accumulative effect.
The analysis of the six sediment cores from a thermokarst-affected coastal lowland in northern Alaska showed that the OC characteristics in deposits of the different landscape features are diverse. The highest TOC contents were measured in the drained lake basin and thermokarst lake deposits, likely caused by increased primary productivity and Holocene OC input. This is also reflected by the analysis of the quality of OC, with high CPI values indicating fresh, undegraded OM in both profiles. The deposits of a semi-drained thermokarst lagoon had significantly lower TOC contents than the freshwater-influenced thermokarst deposits. Additionally, there were significant differences in the CPI, δ13C, and TOCTN ratio between saline and non-saline deposits indicating a domination of aquatic OM in the saline deposits and, moreover, likely indicating a higher level of fresh, undegraded OM in the non-saline deposits. The intrusion of saltwater into the deposits seems to lead to a lower quality of OM in the soils, likely influenced by a lower input of fresh OM due to decreased primary productivity and potentially enhanced by degradational processes. Indicated by the ACL, Paq, and Pwax, all thermokarst-influenced deposits showed a stronger aquatic influence on the OM composition than the upland permafrost deposits. Besides the differences in the source of OM, the comparison of unfrozen and frozen deposits showed higher TOCvol and TN contents in the unfrozen deposits. This is also likely influenced by differences in the level of primary productivity and the depositional and degradational processes. Concerning mercury, this study demonstrates that the characteristics of carbon in Arctic soils significantly influence the distribution and accumulation of mercury, with variations likely driven by natural sources as well as sedimentological and thermokarst processes. Weak positive correlations between TOC content and Hg suggest a link between organic matter inputs and Hg deposition, while strong negative correlations with grain size highlight the enrichment of Hg in fine-grained deposits associated with thermokarst dynamics. Thus, our findings provide valuable insights into the dynamics of carbon storage and a vulnerability to decomposition in response to environmental changes in a coastal permafrost landscape, since they reflect the complex interplay of environmental factors, landform characteristics, and the impacts of climate change on these dynamic Arctic landscapes. The integration of carbon dioxide and methane emission measurements in further studies could complement the findings and provide an even more comprehensive picture of carbon fluxes across the geomorphologically, hydrologically, and ecologically diverse landscapes of the Arctic coastal lowlands and the influence of permafrost thaw and saltwater intrusion on the deposits.
The data used in this paper are available online: Biomarkers of sediment cores from a land–shore transect in the Teshekpuk Lake Region in Arctic Alaska, 2022 (Giest et al., 2024b, https://doi.org/10.1594/PANGAEA.971595); Sedimentological characteristics of sediment cores from a land–shore transect in the Teshekpuk Lake Region in Arctic Alaska, 2022 (Giest et al., 2024c, https://doi.org/10.1594/PANGAEA.971244); and Biogeochemical characteristics of sediment cores from a land–shore transect in the Teshekpuk Lake Region in Arctic Alaska, 2022 (Giest et al., 2024a, https://doi.org/10.1594/PANGAEA.971246).
The supplement related to this article is available online at https://doi.org/10.5194/bg-22-2871-2025-supplement.
JS, MJ, and FPG designed this study. JS, GG, and MJ developed the overall coring plans for the Perma-X Lagoons field campaign and conducted the fieldwork in 2022. BMJ provided guidance on site selection, field assistance, and logistical support for the expedition. JS, MJ, and FPG did the subsampling for all cores. FPG carried out the laboratory analyses. KM supported the biomarker interpretation. FPG wrote the first draft of the manuscript. All co-authors contributed according to their specific expertise to data interpretation and article writing.
The contact author has declared that none of the authors has any competing interests.
Publisher's note: Copernicus Publications remains neutral with regard to jurisdictional claims made in the text, published maps, institutional affiliations, or any other geographical representation in this paper. While Copernicus Publications makes every effort to include appropriate place names, the final responsibility lies with the authors.
We acknowledge support from the Deutsche Bundesstiftung Umwelt to Maren Jenrich. Benjamin M. Jones was supported by the US National Science Foundation awards OPP-1806213 and OPP-2336164. We thank Justin Lindemann, Jonas Sernau, Antje Eulenburg, and Mikaela Weiner for their support and assistance in the lab. AWI base funds were used for facilitating the expedition and laboratory analyses. The Teshekpuk Lake Observatory, managed by Benjamin M. Jones, was used as a base during the expedition. We thank the Ukpeaġvik Iñupiat Corporation for the logistical support, especially for the fixing of snow machines in remote areas. We further thank the Iñupiat community for allowing us to do work on their land.
This research has been supported by the Deutsche Bundesstiftung Umwelt (PhD stipend to Maren Jenrich) and the National Science Foundation (grant nos. OPP-1806213 and OPP-2336164).
The article processing charges for this open-access publication were covered by the Alfred-Wegener-Institut Helmholtz-Zentrum für Polar- und Meeresforschung.
This paper was edited by Sebastian Naeher and reviewed by two anonymous referees.
Andersson, R. A., Meyers, P., Hornibrook, E., Kuhry, P., and Mörth, C.: Elemental and isotopic carbon and nitrogen records of organic matter accumulation in a Holocene permafrost peat sequence in the East European Russian Arctic, J. Quaternary Sci., 27, 545–552, https://doi.org/10.1002/jqs.2541, 2012.
Arp, C. D., Jones, B. M., Urban, F. E., and Grosse, G.: Hydrogeomorphic processes of thermokarst lakes with grounded-ice and floating-ice regimes on the Arctic coastal plain, Alaska, Hydrol. Process., 25, 2422–2438, https://doi.org/10.1002/hyp.8019, 2011.
Ballinger, T. J., Bigaalke, S., Walsh, J. E., Brettschneider, B., Thoman, R. L., Bhatt, U. S., Hanna, E., Hanssen-Bauer, I., Kim, S.-J., Overland, J. E., and Wang, M.: NOAA Arctic Report Card 2023: Surface Air Temperature, https://doi.org/10.25923/X3TA-6E63, 2023.
Bischoff, N., Mikutta, R., Shibistova, O., Dohrmann, R., Herdtle, D., Gerhard, L., Fritzsche, F., Puzanov, A., Silanteva, M., Grebennikova, A., and Guggenberger, G.: Organic matter dynamics along a salinity gradient in Siberian steppe soils, Biogeosciences, 15, 13–29, https://doi.org/10.5194/bg-15-13-2018, 2018.
Biskaborn, B. K., Smith, S. L., Noetzli, J., Matthes, H., Vieira, G., Streletskiy, D. A., Schoeneich, P., Romanovsky, V. E., Lewkowicz, A. G., Abramov, A., Allard, M., Boike, J., Cable, W. L., Christiansen, H. H., Delaloye, R., Diekmann, B., Drozdov, D., Etzelmüller, B., Grosse, G., Guglielmin, M., Ingeman-Nielsen, T., Isaksen, K., Ishikawa, M., Johansson, M., Johannsson, H., Joo, A., Kaverin, D., Kholodov, A., Konstantinov, P., Kröger, T., Lambiel, C., Lanckman, J.-P., Luo, D., Malkova, G., Meiklejohn, I., Moskalenko, N., Oliva, M., Phillips, M., Ramos, M., Sannel, A. B. K., Sergeev, D., Seybold, C., Skryabin, P., Vasiliev, A., Wu, Q., Yoshikawa, K., Zheleznyak, M., and Lantuit, H.: Permafrost is warming at a global scale, Nat. Commun., 10, 264, https://doi.org/10.1038/s41467-018-08240-4, 2019.
Blott, S. J. and Pye, K.: GRADISTAT: a grain size distribution and statistics package for the analysis of unconsolidated sediments, Earth Surf. Proc. Land., 26, 1237–1248, https://doi.org/10.1002/esp.261, 2001.
Bockheim, J. G., Hinkel, K. M., Eisner, W. R., and Dai, X. Y.: Carbon Pools and Accumulation Rates in an Age-Series of Soils in Drained Thaw-Lake Basins, Arctic Alaska, Soil Sci. Soc. Am. J., 68, 697–704, https://doi.org/10.2136/sssaj2004.6970, 2004.
Bray, E. E. and Evans, E. D.: Distribution of n-paraffins as a clue to recognition of source beds, Geochim. Cosmochim. Ac., 22, 2–15, https://doi.org/10.1016/0016-7037(61)90069-2, 1961.
Chakraborty, P., Sarkar, A., Vudamala, K., Naik, R., and Nath, B. N.: Organic matter – A key factor in controlling mercury distribution in estuarine sediment, Mar. Chem., 173, 302–309, https://doi.org/10.1016/j.marchem.2014.10.005, 2015.
Cohen, J., Zhang, X., Francis, J., Jung, T., Kwok, R., Overland, J., Ballinger, T. J., Bhatt, U. S., Chen, H. W., Coumou, D., Feldstein, S., Gu, H., Handorf, D., Henderson, G., Ionita, M., Kretschmer, M., Laliberte, F., Lee, S., Linderholm, H. W., Maslowski, W., Peings, Y., Pfeiffer, K., Rigor, I., Semmler, T., Stroeve, J., Taylor, P. C., Vavrus, S., Vihma, T., Wang, S., Wendisch, M., Wu, Y., and Yoon, J.: Divergent consensuses on Arctic amplification influence on midlatitude severe winter weather, Nat. Clim. Change, 10, 20–29, https://doi.org/10.1038/s41558-019-0662-y, 2020.
Ficken, K. J., Li, B., Swain, D. L., and Eglinton, G.: An n-alkane proxy for the sedimentary input of submerged/floating freshwater aquatic macrophytes, Org. Geochem., 31, 745–749, https://doi.org/10.1016/S0146-6380(00)00081-4, 2000.
Fuchs, M., Grosse, G., Strauss, J., Günther, F., Grigoriev, M., Maximov, G. M., and Hugelius, G.: Carbon and nitrogen pools in thermokarst-affected permafrost landscapes in Arctic Siberia, Biogeosciences, 15, 953–971, https://doi.org/10.5194/bg-15-953-2018, 2018.
Fuchs, M., Lenz, J., Jock, S., Nitze, I., Jones, B. M., Strauss, J., Günther, F., and Grosse, G.: Organic Carbon and Nitrogen Stocks Along a Thermokarst Lake Sequence in Arctic Alaska, J. Geophys. Res.-Biogeo., 124, 1230–1247, https://doi.org/10.1029/2018JG004591, 2019.
Giest, F., Jenrich, M., Grosse, G., Jones, B., Mangelsdorf, K., Windirsch, T., and Strauss, J.: Biogeochemical characteristics of sediment cores from a land – shore transect in the Teshekpuk Lake Region in Arctic Alaska, 2022, PANGAEA [data set], https://doi.org/10.1594/PANGAEA.971246, 2024a.
Giest, F., Jenrich, M., Grosse, G., Jones, B., Mangelsdorf, K., Windirsch, T., and Strauss, J.: Biomarkers of sediment cores from a land – shore transect in the Teshekpuk Lake Region in Arctic Alaska, 2022, PANGAEA [data set], https://doi.org/10.1594/PANGAEA.971595, 2024b.
Giest, F., Jenrich, M., Grosse, G., Jones, B., Mangelsdorf, K., Windirsch, T., and Strauss, J.: Sedimentological characteristics of sediment cores from a land – shore transect in the Teshekpuk Lake Region in Arctic Alaska, 2022, PANGAEA [data set], https://doi.org/10.1594/PANGAEA.971244, 2024c.
Grosse, G., Jones, B., and Arp, C.: 8.21 Thermokarst Lakes, Drainage, and Drained Basins, in: Treatise on Geomorphology, edited by: Shroder, J. F., Elsevier, 325–353, https://doi.org/10.1016/B978-0-12-374739-6.00216-5, 2013.
Haugk, C., Jongejans, L. L., Mangelsdorf, K., Fuchs, M., Ogneva, O., Palmtag, J., Mollenhauer, G., Mann, P. J., Overduin, P. P., Grosse, G., Sanders, T., Tuerena, R. E., Schirrmeister, L., Wetterich, S., Kizyakov, A., Karger, C., and Strauss, J.: Organic matter characteristics of a rapidly eroding permafrost cliff in NE Siberia (Lena Delta, Laptev Sea region), Biogeosciences, 19, 2079–2094, https://doi.org/10.5194/bg-19-2079-2022, 2022.
Hugelius, G., Strauss, J., Zubrzycki, S., Harden, J. W., Schuur, E. A. G., Ping, C.-L., Schirrmeister, L., Grosse, G., Michaelson, G. J., Koven, C. D., O'Donnell, J. A., Elberling, B., Mishra, U., Camill, P., Yu, Z., Palmtag, J., and Kuhry, P.: Estimated stocks of circumpolar permafrost carbon with quantified uncertainty ranges and identified data gaps, Biogeosciences, 11, 6573–6593, https://doi.org/10.5194/bg-11-6573-2014, 2014.
Intergovernmental Panel on Climate Change (IPCC): The Ocean and Cryosphere in a Changing Climate: Special Report of the Intergovernmental Panel on Climate Change, 1st edn., Cambridge University Press, https://doi.org/10.1017/9781009157964, 2022.
Intergovernmental Panel on Climate Change (IPCC): Climate Change 2022 – Impacts, Adaptation and Vulnerability: Working Group II Contribution to the Sixth Assessment Report of the Intergovernmental Panel on Climate Change, 1st edn., Cambridge University Press, https://doi.org/10.1017/9781009325844, 2023.
Jenrich, M., Angelopoulos, M., Grosse, G., Overduin, P. P., Schirrmeister, L., Nitze, I., Biskaborn, B. K., Liebner, S., Grigoriev, M., Murray, A., Jongejans, L. L., and Strauss, J.: Thermokarst Lagoons: A Core-Based Assessment of Depositional Characteristics and an Estimate of Carbon Pools on the Bykovsky Peninsula, Front. Earth Sci., 9, 637899, https://doi.org/10.3389/feart.2021.637899, 2021.
Jenrich, M., Prodinger, M., Nitze, I., Grosse, G., and Strauss, J.: Thermokarst lagoons: Distribution, classification, and dynamics in permafrost-to-marine transition, Permafrost Periglac. Process., PPP70001, https://doi.org/10.1002/ppp.70001, 2025.
Jones, B. M. and Arp, C. D.: Observing a Catastrophic Thermokarst Lake Drainage in Northern Alaska, Permafrost Periglac., 26, 119–128, https://doi.org/10.1002/ppp.1842, 2015.
Jones, B. M., Arp, C. D., Jorgenson, M. T., Hinkel, K. M., Schmutz, J. A., and Flint, P. L.: Increase in the rate and uniformity of coastline erosion in Arctic Alaska, Geophys. Res. Lett., 36, 2008GL036205, https://doi.org/10.1029/2008GL036205, 2009.
Jones, B. M., Farquharson, L. M., Baughman, C. A., Buzard, R. M., Arp, C. D., Grosse, G., Bull, D. L., Günther, F., Nitze, I., Urban, F., Kasper, J. L., Frederick, J. M., Thomas, M., Jones, C., Mota, A., Dallimore, S., Tweedie, C., Maio, C., Mann, D. H., Richmond, B., Gibbs, A., Xiao, M., Sachs, T., Iwahana, G., Kanevskiy, M., and Romanovsky, V. E.: A decade of remotely sensed observations highlight complex processes linked to coastal permafrost bluff erosion in the Arctic, Environ. Res. Lett., 13, 115001, https://doi.org/10.1088/1748-9326/aae471, 2018.
Jones, B. M., Grosse, G., Farquharson, L. M., Roy-Léveillée, P., Veremeeva, A., Kanevskiy, M. Z., Gaglioti, B. V., Breen, A. L., Parsekian, A. D., Ulrich, M., and Hinkel, K. M.: Lake and drained lake basin systems in lowland permafrost regions, Nat. Rev. Earth Environ., 3, 85–98, https://doi.org/10.1038/s43017-021-00238-9, 2022.
Jones, M. C., Grosse, G., Jones, B. M., and Walter Anthony, K.: Peat accumulation in drained thermokarst lake basins in continuous, ice-rich permafrost, northern Seward Peninsula, Alaska, J. Geophys. Res., 117, 2011JG001766, https://doi.org/10.1029/2011JG001766, 2012.
Jongejans, L. L.: Organic matter stored in ice-rich permafrost: future permafrost thaw and greenhouse gas release, Universität Potsdam, https://doi.org/10.25932/PUBLISHUP-56491, 2022.
Jongejans, L. L., Strauss, J., Lenz, J., Peterse, F., Mangelsdorf, K., Fuchs, M., and Grosse, G.: Organic matter characteristics in yedoma and thermokarst deposits on Baldwin Peninsula, west Alaska, Biogeosciences, 15, 6033–6048, https://doi.org/10.5194/bg-15-6033-2018, 2018.
Jongejans, L. L., Mangelsdorf, K., Schirrmeister, L., Grigoriev, M. N., Maksimov, G. M., Biskaborn, B. K., Grosse, G., and Strauss, J.: n-Alkane Characteristics of Thawed Permafrost Deposits Below a Thermokarst Lake on Bykovsky Peninsula, Northeastern Siberia, Front. Environ. Sci., 8, 118, https://doi.org/10.3389/fenvs.2020.00118, 2020.
Jongejans, L. L., Liebner, S., Knoblauch, C., Mangelsdorf, K., Ulrich, M., Grosse, G., Tanski, G., Fedorov, A. N., Konstantinov, P. Ya., Windirsch, T., Wiedmann, J., and Strauss, J.: Greenhouse gas production and lipid biomarker distribution in Yedoma and Alas thermokarst lake sediments in Eastern Siberia, Global Change Biol., 27, 2822–2839, https://doi.org/10.1111/gcb.15566, 2021.
Jonsson, S., Andersson, A., Nilsson, M. B., Skyllberg, U., Lundberg, E., Schaefer, J. K., Åkerblom, S., and Björn, E.: Terrestrial discharges mediate trophic shifts and enhance methylmercury accumulation in estuarine biota, Sci. Adv., 3, e1601239, https://doi.org/10.1126/sciadv.1601239, 2017.
Jorgenson, M. T. and Grunblatt, J.: Landscape-Level Ecological Mapping of northern Alaska and Field Site Photography, Arctic Landscape Conservation Cooperative, U. S. Fish and Wildlife Service, Fairbanks, Alaska, 2013.
Jorgenson, M. T. and Shur, Y.: Evolution of lakes and basins in northern Alaska and discussion of the thaw lake cycle, J. Geophys. Res., 112, 2006JF000531, https://doi.org/10.1029/2006JF000531, 2007.
Jorgenson, M. T., Shur, Y., Osterkamp, T., Ping, C.-L., and Kanevskiy, M.: Part 1: Environment of the Beaufort Coastal Plain, in: Coastal Region of Northern Alaska – Guidebook to Permafrost and related features, Guidebook 10-1, edited by: Jorgenson, M. T., Division of Geological & Geophysical Surveys, 1–39, 2011.
Kokelj, S. V. and Jorgenson, M. T.: Advances in Thermokarst Research, Permafrost Periglac., 24, 108–119, https://doi.org/10.1002/ppp.1779, 2013.
Lenz, J., Jones, B. M., Wetterich, S., Tjallingii, R., Fritz, M., Arp, C. D., Rudaya, N., and Grosse, G.: Impacts of shore expansion and catchment characteristics on lacustrine thermokarst records in permafrost lowlands, Alaska Arctic Coastal Plain, Arktos, 2, 25, https://doi.org/10.1007/s41063-016-0025-0, 2016.
Marzi, R., Torkelson, B. E., and Olson, R. K.: A revised carbon preference index, Org. Geochem., 20, 1303–1306, https://doi.org/10.1016/0146-6380(93)90016-5, 1993.
Meyers, P. A.: Organic geochemical proxies of paleoceanographic, paleolimnologic, and paleoclimatic processes, Org. Geochem., 27, 213–250, https://doi.org/10.1016/S0146-6380(97)00049-1, 1997.
Miner, K. R., Turetsky, M. R., Malina, E., Bartsch, A., Tamminen, J., McGuire, A. D., Fix, A., Sweeney, C., Elder, C. D., and Miller, C. E.: Permafrost carbon emissions in a changing Arctic, Nat. Rev. Earth Environ., 3, 55–67, https://doi.org/10.1038/s43017-021-00230-3, 2022.
Mishra, U., Hugelius, G., Shelef, E., Yang, Y., Strauss, J., Lupachev, A., Harden, J. W., Jastrow, J. D., Ping, C.-L., Riley, W. J., Schuur, E. A. G., Matamala, R., Siewert, M., Nave, L. E., Koven, C. D., Fuchs, M., Palmtag, J., Kuhry, P., Treat, C. C., Zubrzycki, S., Hoffman, F. M., Elberling, B., Camill, P., Veremeeva, A., and Orr, A.: Spatial heterogeneity and environmental predictors of permafrost region soil organic carbon stocks, Sci. Adv., 7, eaaz5236, https://doi.org/10.1126/sciadv.aaz5236, 2021.
Obrist, D., Agnan, Y., Jiskra, M., Olson, C. L., Colegrove, D. P., Hueber, J., Moore, C. W., Sonke, J. E., and Helmig, D.: Tundra uptake of atmospheric elemental mercury drives Arctic mercury pollution, Nature, 547, 201–204, https://doi.org/10.1038/nature22997, 2017.
Olefeldt, D., Goswami, S., Grosse, G., Hayes, D., Hugelius, G., Kuhry, P., McGuire, A. D., Romanovsky, V. E., Sannel, A. B. K., Schuur, E. A. G., and Turetsky, M. R.: Circumpolar distribution and carbon storage of thermokarst landscapes, Nat. Commun., 7, 13043, https://doi.org/10.1038/ncomms13043, 2016.
Poynter, J.: Molecular stratigraphy: The recognition of paleo-climate signals in organic geochemical data, School of Chemistry, University of Bristol, Bristol, 324 pp., 1989.
Poynter, J. and Eglinton, G.: 14. Molecular Composition of three Sediments from Hole 717C: The Bengal Fan, Proceedings of the Ocean Drilling Program, Scientific Results, 116, 155–161, 1990.
Radke, M., Willsch, H., and Welte, D. H.: Preparative hydrocarbon group type determination by automated medium pressure liquid chromatography, Anal. Chem., 52, 406–411, https://doi.org/10.1021/ac50053a009, 1980.
Rantanen, M., Karpechko, A. Yu., Lipponen, A., Nordling, K., Hyvärinen, O., Ruosteenoja, K., Vihma, T., and Laaksonen, A.: The Arctic has warmed nearly four times faster than the globe since 1979, Commun. Earth Environ., 3, 10, https://doi.org/10.1038/s43247-022-00498-3, 2022.
Routh, J., Hugelius, G., Kuhry, P., Filley, T., Tillman, P. K., Becher, M., and Crill, P.: Multi-proxy study of soil organic matter dynamics in permafrost peat deposits reveal vulnerability to climate change in the European Russian Arctic, Chem. Geol., 368, 104–117, https://doi.org/10.1016/j.chemgeo.2013.12.022, 2014.
Rutkowski, C., Lenz, J., Lang, A., Wolter, J., Mothes, S., Reemtsma, T., Grosse, G., Ulrich, M., Fuchs, M., Schirrmeister, L., Fedorov, A., Grigoriev, M., Lantuit, H., and Strauss, J.: Mercury in Sediment Core Samples From Deep Siberian Ice-Rich Permafrost, Front. Earth Sci., 9, 718153, https://doi.org/10.3389/feart.2021.718153, 2021.
Rydberg, J., Klaminder, J., Rosén, P., and Bindler, R.: Climate driven release of carbon and mercury from permafrost mires increases mercury loading to sub-arctic lakes, Sci. Total Environ., 408, 4778–4783, https://doi.org/10.1016/j.scitotenv.2010.06.056, 2010.
Schäfer, I. K., Lanny, V., Franke, J., Eglinton, T. I., Zech, M., Vysloužilová, B., and Zech, R.: Leaf waxes in litter and topsoils along a European transect, SOIL, 2, 551–564, https://doi.org/10.5194/soil-2-551-2016, 2016.
Schirrmeister, L., Grosse, G., Wetterich, S., Overduin, P. P., Strauss, J., Schuur, E. A. G., and Hubberten, H.-W.: Fossil organic matter characteristics in permafrost deposits of the northeast Siberian Arctic, J. Geophys. Res.-Biogeo., 116, G00M02, https://doi.org/10.1029/2011jg001647, 2011.
Schirrmeister, L., Grigoriev, M. N., Strauss, J., Grosse, G., Overduin, P. P., Kholodov, A., Guenther, F., and Hubberten, H.-W.: Sediment characteristics of a thermokarst lagoon in the northeastern Siberian Arctic (Ivashkina Lagoon, Bykovsky Peninsula), Arktos, 4, 1–16, https://doi.org/10.1007/s41063-018-0049-8, 2018.
Schuster, P. F., Schaefer, K. M., Aiken, G. R., Antweiler, R. C., Dewild, J. F., Gryziec, J. D., Gusmeroli, A., Hugelius, G., Jafarov, E., Krabbenhoft, D. P., Liu, L., Herman-Mercer, N., Mu, C., Roth, D. A., Schaefer, T., Striegl, R. G., Wickland, K. P., and Zhang, T.: Permafrost Stores a Globally Significant Amount of Mercury, Geophys. Res. Lett., 45, 1463–1471, https://doi.org/10.1002/2017GL075571, 2018.
Schuur, E. A. G. and Mack, M. C.: Ecological Response to Permafrost Thaw and Consequences for Local and Global Ecosystem Services, Annu. Rev. Ecol. Evol. S., 49, 279–301, https://doi.org/10.1146/annurev-ecolsys-121415-032349, 2018.
Schuur, E. A. G., Vogel, J. G., Crummer, K. G., Lee, H., Sickman, J. O., and Osterkamp, T. E.: The effect of permafrost thaw on old carbon release and net carbon exchange from tundra, Nature, 459, 556–559, https://doi.org/10.1038/nature08031, 2009.
Schuur, E. A. G., Abbott, B. W., Commane, R., Ernakovich, J., Euskirchen, E., Hugelius, G., Grosse, G., Jones, M., Koven, C., Leshyk, V., Lawrence, D., Loranty, M. M., Mauritz, M., Olefeldt, D., Natali, S., Rodenhizer, H., Salmon, V., Schädel, C., Strauss, J., Treat, C., and Turetsky, M.: Permafrost and Climate Change: Carbon Cycle Feedbacks From the Warming Arctic, Annu. Rev. Env. Resour., 47, 343–371, https://doi.org/10.1146/annurev-environ-012220-011847, 2022.
Smith, S. L., O'Neill, H. B., Isaksen, K., Noetzli, J., and Romanovsky, V. E.: The changing thermal state of permafrost, Nat. Rev. Earth Environ., 3, 10–23, https://doi.org/10.1038/s43017-021-00240-1, 2022.
Smith-Downey, N. V., Sunderland, E. M., and Jacob, D. J.: Anthropogenic impacts on global storage and emissions of mercury from terrestrial soils: Insights from a new global model, J. Geophys. Res., 115, 2009JG001124, https://doi.org/10.1029/2009JG001124, 2010.
Strauss, J., Schirrmeister, L., Grosse, G., Wetterich, S., Ulrich, M., Herzschuh, U., and Hubberten, H.: The deep permafrost carbon pool of the Yedoma region in Siberia and Alaska, Geophys. Res. Lett., 40, 6165–6170, https://doi.org/10.1002/2013GL058088, 2013.
Strauss, J., Schirrmeister, L., Mangelsdorf, K., Eichhorn, L., Wetterich, S., and Herzschuh, U.: Organic-matter quality of deep permafrost carbon – a study from Arctic Siberia, Biogeosciences, 12, 2227–2245, https://doi.org/10.5194/bg-12-2227-2015, 2015.
Strauss, J., Biasi, C., Sanders, T., Abbott, B. W., von Deimling, T. S., Voigt, C., Winkel, M., Marushchak, M. E., Kou, D., Fuchs, M., Horn, M. A., Jongejans, L. L., Liebner, S., Nitzbon, J., Schirrmeister, L., Walter Anthony, K., Yang, Y., Zubrzycki, S., Laboor, S., Treat, C., and Grosse, G.: A globally relevant stock of soil nitrogen in the Yedoma permafrost domain, Nat. Commun., 13, 6074, https://doi.org/10.1038/s41467-022-33794-9, 2022.
Strauss, J., Marushchak, M. E., Van Delden, L., Sanders, T., Biasi, C., Voigt, C., Jongejans, L. L., and Treat, C.: Potential nitrogen mobilisation from the Yedoma permafrost domain, Environ. Res. Lett., 19, 043002, https://doi.org/10.1088/1748-9326/ad3167, 2024.
Strauss, J., Fuchs, M., Hugelius, G., Miesner, F., Nitze, I., Opfergelt, S., Schuur, E., Treat, C., Turetsky, M., Yang, Y., and Grosse, G.: Organic matter storage and vulnerability in the permafrost domain, Encyclopedia of Quaternary Science, 3rd edn., Elsevier, https://doi.org/10.1016/B978-0-323-99931-1.00164-1, 2025.
Thomas, C. L., Jansen, B., Czerwiński, S., Gałka, M., Knorr, K.-H., van Loon, E. E., Egli, M., and Wiesenberg, G. L. B.: Comparison of paleobotanical and biomarker records of mountain peatland and forest ecosystem dynamics over the last 2600 years in central Germany, Biogeosciences, 20, 4893–4914, https://doi.org/10.5194/bg-20-4893-2023, 2023.
US Geological Survey: EarthExplorer, satellite image acquired in 2002, https://earthexplorer.usgs.gov/, last access: 1 November 2024.
Voigt, C., Marushchak, M. E., Abbott, B. W., Biasi, C., Elberling, B., Siciliano, S. D., Sonnentag, O., Stewart, K. J., Yang, Y., and Martikainen, P. J.: Nitrous oxide emissions from permafrost-affected soils, Nat. Rev. Earth Environ., 1, 420–434, https://doi.org/10.1038/s43017-020-0063-9, 2020.
Weintraub, M. N. and Schimel, J. P.: Nitrogen Cycling and the Spread of Shrubs Control Changes in the Carbon Balance of Arctic Tundra Ecosystems, BioScience, 55, 408, https://doi.org/10.1641/0006-3568(2005)055[0408:NCATSO]2.0.CO;2, 2005.
Wendler, G., Moore, B., and Galloway, K.: Strong Temperature Increase and Shrinking Sea Ice in Arctic Alaska, TOASCJ, 8, 7–15, https://doi.org/10.2174/1874282301408010007, 2014.
Wolter, J., Lantuit, H., Wetterich, S., Rethemeyer, J., and Fritz, M.: Climatic, geomorphologic and hydrologic perturbations as drivers for mid- to late Holocene development of ice-wedge polygons in the western Canadian Arctic, Permafrost Periglac., 29, 164–181, https://doi.org/10.1002/ppp.1977, 2018.
Wolter, J., Jones, B. M., Fuchs, M., Breen, A., Bussmann, I., Koch, B., Lenz, J., Myers-Smith, I. H., Sachs, T., Strauss, J., Nitze, I., and Grosse, G.: Post-drainage vegetation, microtopography and organic matter in Arctic drained lake basins, Environ. Res. Lett., 19, 045001, https://doi.org/10.1088/1748-9326/ad2eeb, 2024.
Zech, M., Buggle, B., Leiber, K., Marković, S., Glaser, B., Hambach, U., Huwe, B., Stevens, T., Sümegi, P., Wiesenberg, G., and Zöller, L.: Reconstructing Quaternary vegetation history in the Carpathian Basin, SE-Europe, using n-alkane biomarkers as molecular fossils: Problems and possible solutions, potential and limitations, E&G Quaternary Sci. J., 58, 148–155, https://doi.org/10.3285/eg.58.2.03, 2010.
Zheng, Y., Zhou, W., Meyers, P. A., and Xie, S.: Lipid biomarkers in the Zoigê-Hongyuan peat deposit: Indicators of Holocene climate changes in West China, Org. Geochem., 38, 1927–1940, https://doi.org/10.1016/j.orggeochem.2007.06.012, 2007.