the Creative Commons Attribution 4.0 License.
the Creative Commons Attribution 4.0 License.
 | 03 Jul 2025
Acidification, warming, and nutrient management are projected to cause reductions in shell and tissue weights of oysters in a coastal plain estuary
Catherine R. Czajka
Marjorie A. M. Friedrichs
Emily B. Rivest
Pierre St-Laurent
Mark J. Brush
Coastal acidification, warming, and nutrient management actions all alter water quality conditions that marine species experience, with potential impacts to their physiological processes. Decreases in calcite saturation state (ΩCa) and food availability, combined with warming water temperatures, pose a threat to calcifying organisms; however, the magnitude of future changes in estuarine systems is challenging to predict and is not well known. This study aims to determine how and where oysters will be affected by future acidification, warming, and nutrient reductions, and the relative effects of these stressors. To address these goals, an oyster growth model for Eastern oysters (Crassostrea virginica) was embedded in a 3-D coupled hydrodynamic-biogeochemistry model implemented for two tributaries in the lower Chesapeake Bay. Model simulations were forced with projected future conditions (mid-21st century atmospheric CO2 and atmospheric temperature under Representative Concentration Pathway (RCP) 8.5, as well as managed nutrient reductions) and compared with a realistic present-day reference run. Together, all three stressors are projected to reduce ΩCa and growth of oyster shell and tissue. Increased atmospheric CO2 is projected to cause widespread reductions in ΩCa. The resulting reductions in oyster shell and tissue growth will be most severe along the tributary shoals. Future warming during peak oyster growing seasons is projected to have the strongest negative influence on tissue and shell growth, due to summer water temperatures reducing filtration rates, enhancing shell dissolution and oyster respiration rates, and increasing organic matter remineralization rates, thus reducing food availability. Nutrient reductions will exacerbate deficits in oyster food availability, contributing to further reductions in growth. Quantifying the effects of these stressors provides insight on the areas in the lower bay where oysters will be most vulnerable to mid 21st-century conditions.
- Article
(11613 KB) - Full-text XML
-
Supplement
(1919 KB) - BibTeX
- EndNote


Anthropogenic climate change and its associated impacts on water quality may threaten marine organisms and economic systems reliant on them. Oceanic uptake of increasing anthropogenic atmospheric carbon dioxide (CO2) causes a decrease in seawater pH and saturation states of calcium carbonate (e.g., ΩCa), a phenomenon known as ocean acidification (Caldeira and Wickett, 2003; Doney et al., 2009). Globally, the ocean has absorbed about 30 % of anthropogenic atmospheric CO2 since pre-industrial times (Gruber et al., 2019), and open-ocean surface pH is anticipated to decrease by 0.3 units on average relative to the 2010s by the end of the century under “business-as-usual” conditions (Riahi et al., 2011; IPCC, 2019). The percent volume of ocean water undersaturated with calcite (ΩCa < 1), a condition associated with elevated energetic costs of shell-building for calcifying organisms, is predicted to expand to 91 % by 2100 from 76 % in the 1990s (Caldeira and Wicket, 2005; Gattuso et al., 2015). Concurrently, the global ocean has absorbed approximately 93 % of the atmospheric heat produced by anthropogenic activity, leading to a global sea surface temperature increase of 0.7 °C since 1900 (Jewett and Romanou, 2017). Ocean warming is expected to continue, with global averages increasing by 2.7 °C by 2100 and greater increases expected in shallow coastal regions (Jewett and Romanou, 2017).
Since estuaries have lower and more variable pH than the open-ocean, the effects of increased CO2 and warming on estuarine water quality and biota are often amplified. In coastal and estuarine systems, acidification may be exacerbated by local-level processes, such as the inflow of acidic freshwater and the runoff of nutrients from precipitation, a process termed coastal acidification (Salisbury et al., 2008; Wallace et al., 2014; Carstensen and Duarte, 2019). Coastal acidification may accelerate as warming of coastal waters increases rates of biogeochemical processes; increased respiration rates may drive larger diel variations in pH, dissolved oxygen, and associated water quality (Du et al., 2018; Tian et al., 2022). Freshwater has relatively low total alkalinity (TA), or buffering capacity, so estuarine areas with greater relative freshwater influence cannot resist changes to pH as easily as more saline or open-ocean waters (Hasler et al., 2018; Pacella et al., 2024). Eutrophication, the increased rate of organic matter input to a system (Nixon, 1995), may also drive large variations in local pH and overall water quality. Elevated nutrient inputs cause pH to increase in surface waters due to higher primary productivity, which will reduce surface acidification; however, pH will decrease in deeper bottom waters as the additional organic matter sinks and is remineralized (Cai et al., 2020). Management actions to reduce eutrophication and improve water quality in bottom waters have been successful but may also enhance acidification in shallow surface waters by lowering primary productivity (Borges and Gypens, 2010; Da et al., 2021). The overall effect of future changes in nutrient inputs on coastal biogeochemistry is thus unclear, particularly in the presence of warming and acidification.
Characterizing spatiotemporal patterns of acidification in estuarine waters is important, as negative impacts of acidification on the biology of marine organisms may be substantial. Acidification disrupts the formation of calcium carbonate (CaCO3) during shell-building, i.e., biocalcification, which is a vital process for growth and survival of many aquatic invertebrate species (e.g., Orr et al., 2005; Gazeau et al., 2007; Dong et al., 2023). Under acidified conditions, water concentrations of CO2 and H+ increase, and concentrations of carbonate ions ([CO]) decrease. A low ambient [CO] inhibits calcifying organisms from forming CaCO3 for their shells, as more energy is required to precipitate CO from acidified waters (e.g., Guinotte and Fabry, 2008; Lutier et al., 2022; Matoo et al., 2021; Medeiros and Souza, 2023). Low ΩCa may also lead to net dissolution of CaCO3, leading to weaker shells and greater juvenile susceptibility to predation (e.g., Waldbusser et al., 2011; Amaral et al., 2012; Barclay et al., 2020). Acidification may further reduce shell growth through adverse physiological effects that limit energy availability for calcification. Because acidification is often more extreme in estuaries, coastal bivalve species experience stronger effects of climate change than organisms living in open-ocean environments (Poach et al., 2019; Melzner et al., 2020; Cai et al., 2021). Oysters in particular are of high management and research interest due to their commercial value in the United States (USDA, 2023). Prior experiments have revealed negative effects of acidification, warming, and nutrient reductions on oyster biocalcification and growth (Beniash et al., 2010; Waldbusser et al., 2011; Gobler and Talmage, 2014), but it is yet to be determined how the impacts of these stressors on oyster shell and tissue growth will vary spatially in highly dynamic systems.
The Chesapeake Bay is an excellent study system for examining the interacting influences of acidification, warming, and nutrient reductions (hereafter referred to collectively as “future stressors”) on estuarine biogeochemistry and the organisms living there. The bay exhibits high temporal and spatial variability in pH due to seasonal phytoplankton blooms, eutrophication, and acidic freshwater input (Da et al., 2021; St-Laurent et al., 2020; Kemp et al., 2005; Cai et al., 2021). From the mid-1980s to mid-2010s, surface waters in the upper bay experienced pH increases between +0.2 and +0.4 pH units in early spring and fall due to increased riverine TA from reduced acid mine drainage and lowered nitrate inputs, while surface waters in the nitrogen-limited middle bay decreased up to −0.24 pH units during late spring and summer as a result of decreased primary production (Da et al., 2021). Over the same time period, the bay warmed by 0.24 ± 0.15 °C per decade (Hinson et al., 2022), more than double the average rate of warming for the upper 75 m of the global ocean (IPCC, 2013). Warming has also led to more severe hypoxia (Irby et al., 2018; Ni et al., 2020; Frankel et al., 2022; Hinson et al., 2023; Hinson et al., 2024). In 2010, the Environmental Protection Agency mandated a total maximum daily load (TMDL) of pollutants from point and non-point sources to be achieved by 2025 (EPA, 2010). As nutrient reductions negatively affect pH in surface waters of the bay (Shen et al., 2020; Da et al., 2021), achieving the TMDLs may actually worsen acidification in shallow and near-shore regions. Much of the research effort devoted to characterizing present-day carbonate chemistry and its historical trends has focused on the mainstem and upper Chesapeake Bay (Cai et al., 2017; Shen et al., 2020; Su et al., 2020), and less is known about these conditions throughout the tributaries of the lower bay (Shadwick et al., 2019).
The combined effects of future stressors will impact calcifying organisms in the lower Chesapeake Bay as well as the economic systems reliant upon them. The Eastern oyster Crassostrea virginica (Gmelin, 1791) is a foundation species native to the bay (Dayton, 1972). Eastern oyster aquaculture in this region has grown rapidly in the past few decades, with Virginia becoming the third most productive oyster fishery in 2018 (Hudson, 2019), largely a result of the development of disease-resistant oyster strains (Frank-Lawale et al., 2014). Negative impacts of acidification on aquaculture practices in other parts of the world (Barton et al., 2015) have already stirred concern over the vulnerability of oysters in the Chesapeake Bay. For example, in the Pacific Northwest, major larval mortality occurred at a shellfish hatchery following an upwelling event that lowered pH and Ω of aragonite, which had cascading impacts on the oyster industry all along the West Coast (Barton et al., 2015). While most effects of acidification on aquaculture have been observed in oyster larvae in hatcheries, fewer studies have examined acidification's influence on adult oysters when deployed in the field. Water quality conditions within oyster farms can be highly spatially variable, so the impacts of acidification may vary with growing conditions (Saavedra et al., 2024; Simpson et al., 2024). To support the future of the oyster aquaculture industry in Chesapeake Bay, it is critical to identify which areas in the bay will be most vulnerable to acidification at mid-century and how each driver of change contributes to acidification and its impacts on growth.
This study addresses the following primary research question: How and where will carbonate chemistry and Eastern oyster growth in the lower Chesapeake Bay change in the future and which future stressors will drive these changes? A three-dimensional hydrodynamic-biogeochemical model is coupled with an oyster growth model and is applied to two major Virginia tributaries of the Chesapeake Bay. The model provides detailed information on present-day environmental conditions and, when combined with climate projections from Earth System Models, allows for simulations of the independent and interacting influences of future environmental change on carbonate chemistry and Eastern oysters. This study provides insight into which areas are most vulnerable to mid 21st-century acidification and how acidification, warming, and nutrient loading may each impact oyster growth in isolation as well as via simultaneous co-stressors.
2.1 Model description
2.1.1 Hydrodynamic model
This study uses the three-dimensional hydrodynamic Regional Ocean Modeling System (ROMS; Shchepetkin and McWilliams, 2005), implemented similarly to St-Laurent and Friedrichs (2024) but on a higher resolution grid focused on two of the lower Virginia Chesapeake Bay tributaries (Fig. 1). The model domain (Da et al., 2024) includes the York and Rappahannock Rivers, as well as a portion of the mainstem shoal north of the Rappahannock. The model grid consists of 620×740 horizontal grid cells with a horizontal resolution of 120 m, allowing for greater resolution of coastlines than many other Chesapeake Bay model grids (Irby et al., 2016). The hydrodynamic model includes 20 terrain-following vertical levels and two primary state variables: practical salinity and potential temperature. A wetting and drying scheme has been implemented to represent water levels and currents in coastal grid cells (Warner et al., 2013; St-Laurent and Friedrichs, 2024).
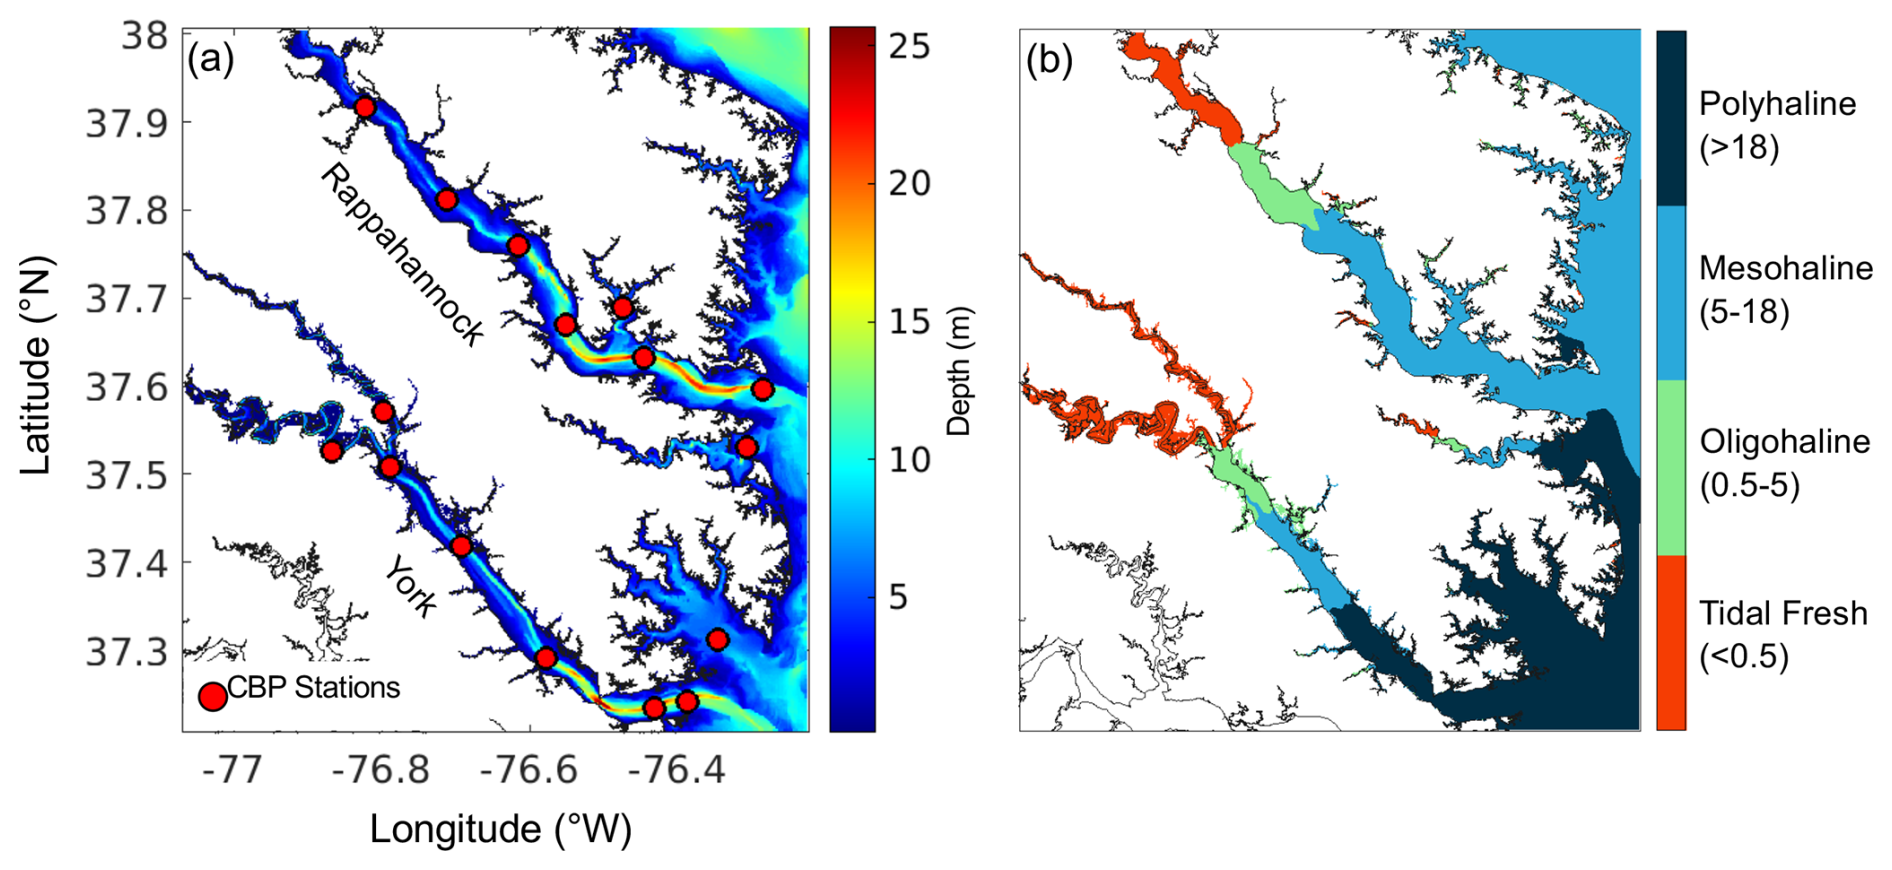
Figure 1ROMS-ECBO model domain of Chesapeake Bay tributaries illustrating (a) bathymetry in meters and locations of Chesapeake Bay Program (CBP) water quality monitoring stations (red circles) and (b) bottom salinity zones.
2.1.2 Carbon and biogeochemistry model
The Estuarine-Carbon-Biogeochemistry model (ECB) embedded in ROMS and used in this study has previously been implemented in the Chesapeake Bay (Feng et al., 2015; St-Laurent et al., 2020; Frankel et al., 2022; Hinson et al., 2023) as well as in the lower Virginia tributaries (Da et al., 2024). ECB simulates full carbon and nitrogen cycles of the lower trophic levels, represented by the following state variables: nitrate, ammonium, phytoplankton and zooplankton nitrogen, small and large detrital nitrogen and carbon, semi-labile and refractory dissolved organic nitrogen and carbon, DIC, TA, and dissolved oxygen (O2). Phytoplankton and zooplankton carbon are calculated from fixed C : N ratios (Redfield, 1934; Hopkinson et al., 1998). C : N ratios for dissolved organic matter in the estuary are allowed to freely evolve with time. Biogeochemical processes include primary production, aggregation, sinking, basal metabolism, exudation, sloppy feeding, excretion, metabolism, nitrification/denitrification, remineralization, grazing, and mortality. Biogeochemical sources and sinks are included in the bottom vertical level (e.g., burial, resuspension, nitrification/denitrification, remineralization, sediment O2 and CO2 exchange). Light attenuation throughout the water column is based on the diffuse attenuation coefficient (Kd), which is parameterized as a function of surface total suspended solids (TSS; including inorganic and organic components) and salinity as a proxy for colored dissolved organic matter (Feng et al., 2015; Turner et al., 2021). TSS is calculated within the model as the sum of the four inorganic suspended sediment size classes and particulate organic matter. Particulate organic carbon (POC) is calculated as the sum of phytoplankton carbon, zooplankton carbon, and small and large detrital carbon. The sediment transport module within ECB accounts for sediment–water exchange processes, such as deposition and resuspension of inorganic sediment and particulate organic matter, and is comprised of two vertical seabed layers that simulate four suspended sediment size classes (Turner et al., 2021).
The inorganic carbon module within ECB has been fine-tuned in this implementation of the model, allowing for improved performance in carbonate system simulations (Da et al., 2024). The model grid includes tidal wetlands along the York River based on estimated wetland areas (Mitchell et al., 2017), which further contribute to TA fluxes through sulfate reduction in sediments (Raymond et al., 2000; Najjar et al., 2020). ΩCa is calculated from DIC, TA, temperature, and salinity using CO2SYS (Lewis and Wallace, 1998) and using the equilibrium constants of Cai and Wang (1998) as they are suitable for both fresh and estuarine waters (Dinauer and Mucci, 2017; Herrmann et al., 2020). Although submerged aquatic vegetation is a possible source of CaCO3 (Mazarrasa et al., 2015; Su et al., 2020), CaCO3 precipitation and dissolution are not simulated in ECB due to both insufficient observations and low submerged aquatic vegetation presence throughout the model domain (Orth et al., 1998; Moore et al., 2009).
Several additional updates have been made in this implementation of ROMS-ECB to better represent oxygen and primary production dynamics in the lower Virginia tributaries. The maximum phytoplankton growth rate has been increased to 2.15 d−1, and the growth rate is limited in the fresh portion of the tributaries using a Michaelis–Menten function of salinity and a half-saturation of 1.5 (Da et al., 2024). The sediment bed climatology from Moriarty et al. (2021) has been adjusted to better represent the sand class distributions published in Nichols et al. (1991) and observations taken by the USGS (Reid et al., 2005). Specifically, the changes include a greater percentage of small clay-rich flocs throughout the main stem of the York River as well as more sand and large silt-rich flocs in the Rappahannock River. Previously, the sediment module assumed the same critical shear stress for large silt-rich flocs, small clay-rich flocs, and unaggregated mud; here, the critical shear stress of smaller particles is lower than larger particles, meaning smaller particles resuspend more easily. The updated critical shear stress coefficient for erosion and deposition is 0.5 Pa for large silt-rich flocs and 0.4 Pa for both small clay-rich flocs and unaggregated mud, which represent a small portion of the sediment bed. The ballasting formulation of Turner et al. (2021) has also been added to simulate the increase in particle sinking rates due to the aggregation of particles in turbid waters.
2.1.3 Oyster growth model
As part of this study, the oyster growth model EcoOyster (Brush and Kellogg, 2018; Kellogg et al., 2018) has been one-way coupled to ROMS-ECB in the deepest (bottom) level (see Supplement Tables S1–4 for EcoOyster equations). The one-way coupling means that environmental conditions from ROMS-ECB influence oyster growth in EcoOyster, but the oysters do not influence water quality conditions in ROMS-ECB. This allows the focus of our analysis to be on the effect of future climate change on oyster growth, rather than the effect of oyster growth on water quality, which has been previously studied in the Chesapeake Bay (e.g., Gawde et al., 2024). By focusing on the deepest vertical level of the model, the assumption is that oysters are growing on the bottom and not inside floating cages. This is representative of conditions similar to on-bottom or bottom cage aquaculture methods that are common in Virginia. The coupled model, referred to hereafter as ROMS-ECBO, simulates daily somatic tissue dry weight, gonadal tissue dry weight, shell dry weight, and shell height of diploid and triploid oysters as a function of filtration, respiration, egestion, allocation to reproduction, calcification, and dissolution (Brush and Kellogg, 2018; Kellogg et al., 2018; Rivest et al., 2020). For the purpose of this study, only diploid oysters were included, as model equations were developed from a study on diploid oysters (Rivest et al., 2020), and triploid allometric equations are not as well constrained. Tissue growth rates depend on individual weight together with temperature, salinity, O2, TSS, and POC from ROMS-ECB. Chl a is required for the filtration function and is calculated from ROMS-ECB phytoplankton carbon and Kd, in combination with seasonal carbon : Chl a ratios that are computed using equations from Cerco and Noel (2004). The calcification function includes a threshold value of ΩCa=0.93, determined through laboratory experiments with Eastern oysters (Rivest et al., 2020).
The EcoOyster equations were developed from a meta-analysis of existing oyster growth models and laboratory experiments with diploid oysters (Brush and Kellogg, 2018; Kellogg et al., 2018; Rivest et al., 2020). Allometric relationships between shell dry weight, tissue dry weight, and shell height used for initial conditions were derived from observational data in the Chesapeake Bay (VOSARA, 2024). Total dry tissue weight is calculated as the sum of somatic tissue weight and gonadal weight. Reproduction is simulated through gonadal weight, a function of growth of gonadal tissue, resorption of gonadal tissue, and spawning (Hofmann and Hand, 1994). Somatic tissue weight is a function of assimilation, respiration, growth of gonadal tissue, and resorption of gonadal tissue. Assimilation is a function of filtration and POC. Filtration is a function of a maximum filtration rate based on tissue weight, limited by sub-optimal temperature, salinity, TSS, O2, and Chl a (Cerco and Noel, 2005; Fulford et al., 2007; Ehrich and Harris, 2015). The optimal temperature for oyster filtration (Topt) is set to 27 °C (Jordan, 1987). Filtration is also multiplied by p, a tunable factor representing the proportion of computed filtration actually performed by oysters, which accounts for processes excluded from the model such as time spent filtering and is constrained by published growth rates. Respiration is a function of tissue weight, temperature, and assimilation. While filtration has a temperature limitation, respiration increases exponentially with temperature (Fig. S1). Tissue growth functions are not affected by carbonate chemistry variables, as experimental studies have found that neither filtration (Lemasson et al., 2018) nor respiration (Beniash et al., 2010; Matoo et al., 2013) of oysters are affected by pH changes; however, weight-specific net calcification is a function of ΩCa and temperature (Rivest et al., 2020). Shell growth is a function of both total tissue weight and net calcification.
2.2 Present-day reference simulation
A realistic reference simulation was generated to represent 2017 conditions. The year 2017 was chosen for atmospheric, terrestrial, and open-ocean boundary conditions as this represents a relatively typical hydrological year. Atmospheric forcings (air temperature, long- and short-wave radiation, precipitation, winds, dew point temperature, and air pressure) are obtained from the ERA5 atmospheric reanalysis (Copernicus Climate Change Service, 2017; Hersbach et al., 2020). Surface atmospheric variables are available at 3-hourly intervals with a 0.25° resolution and are interpolated to a 0.2° grid. Terrestrial inputs of freshwater, nitrogen, carbon, and sediment are derived from the Phase 6 CBP Watershed Model (CBPWM; Bhatt et al., 2023) and USGS data. Daily estimates of freshwater discharge, water temperature, and loadings of nitrate, ammonium, organic nitrogen, and four classes of sediment from the CBPWM were concatenated to 74 locations throughout the model domain. To compute carbon loadings, constant carbon-to-nitrogen ratios are used, specifically 10:1 for dissolved organic matter (Hopkinson et al., 1998) and 6.625:1 for particulate organic matter (Redfield, 1934). Riverine TA concentrations are computed as in Da et al. (2024), using monthly-varying linear relationships between historical USGS observations of discharge and USGS TA estimates determined using the weighted regression on time, discharge, and season (WRTDS; Hirsch et al., 2010) approach. Riverine DIC is calculated from daily riverine TA and daily DIC : TA ratios, linearly interpolated from the monthly climatology of USGS WRTDS DIC : TA in each tributary. Open boundary conditions are derived from a recent 600 m resolution whole-bay implementation of ROMS (St-Laurent and Friedrichs, 2024). Initial conditions for the six month spin-up were derived from Da et al. (2024).
Since spring-spawned oysters are typically deployed in late spring through summer on oyster farms, the reference run was started on 1 July and spanned 1 full year, ending 30 June of the following year. Oyster sizes were initialized based on shell height approximations of a typical spring-spawned oyster at deployment in July (i.e., a few months old). Starting dry tissue weight was assumed to be 0.001 g for all oysters, back-calculated from the approximate height of an oyster at the time of deployment. Starting shell dry weights and heights were calculated from allometric relationships to be 0.144 g and 11.6 mm, respectively.
2.3 Comparison of reference simulation to in situ observations
In situ water quality monitoring observations are available since 1984 throughout the Chesapeake Bay. Specifically, the Chesapeake Bay Program's Water Quality Monitoring Program (CBP WQMP) conducts cruises in the Bay and its tributaries. On average, stations are sampled once monthly, with the exception of June through August in the mainstem, when sampling occurs twice. In this study, measurements of water temperature, salinity, O2, pH (NBS scale), TSS, and POC are used from 16 CBP stations throughout the model domain, with depths ranging from 5 to 16 m (Fig. 1a; CBP, 2024). For all variables except TSS and POC, measurements are taken in situ using a YSI or Hydrolab® sonde roughly every 1–2 m of the water column. TSS and POC are obtained from bottle samples at the surface, bottom, and at deeper stations, with two additional depths above and below the pycnocline. TSS is determined by filtering a known volume of water through a pre-weighted filter and then re-weighing the filter after filtration and drying. POC is determined through combustion of a filter using an elemental analyzer (Olson, 2012).
Model skill was evaluated by comparing results from the reference simulation to the CBP WQMP observations described above. Hourly outputs from the four closest grid cells to each CBP station were spatially interpolated to obtain results at each respective station. Multiple variables in ECB at the bottom level of the model, including temperature, salinity, O2, pH, TSS, and POC, were compared with observations from the same station and time, within the bottom 10 % of the water column (Table 1). Model bias and root-mean squared difference (RMSD) were computed for all aforementioned variables. Seasonal skill was also evaluated by comparing the 2017 reference run to CBP decadal averages. Decadal means were used for these comparisons as once monthly or once seasonally sampling dates in 2017 bias outputs toward conditions on the time of the month when the measurements were taken in 2017; the purpose of the comparison was to examine how the model reproduces average seasonal variability.
Table 1Experimental design for future simulations conducted for comparison to reference run. Model forcings include a combination of 2017 (reference) and 2067 (future) inputs of atmospheric CO2, atmospheric temperature, and terrestrial nutrient loadings.
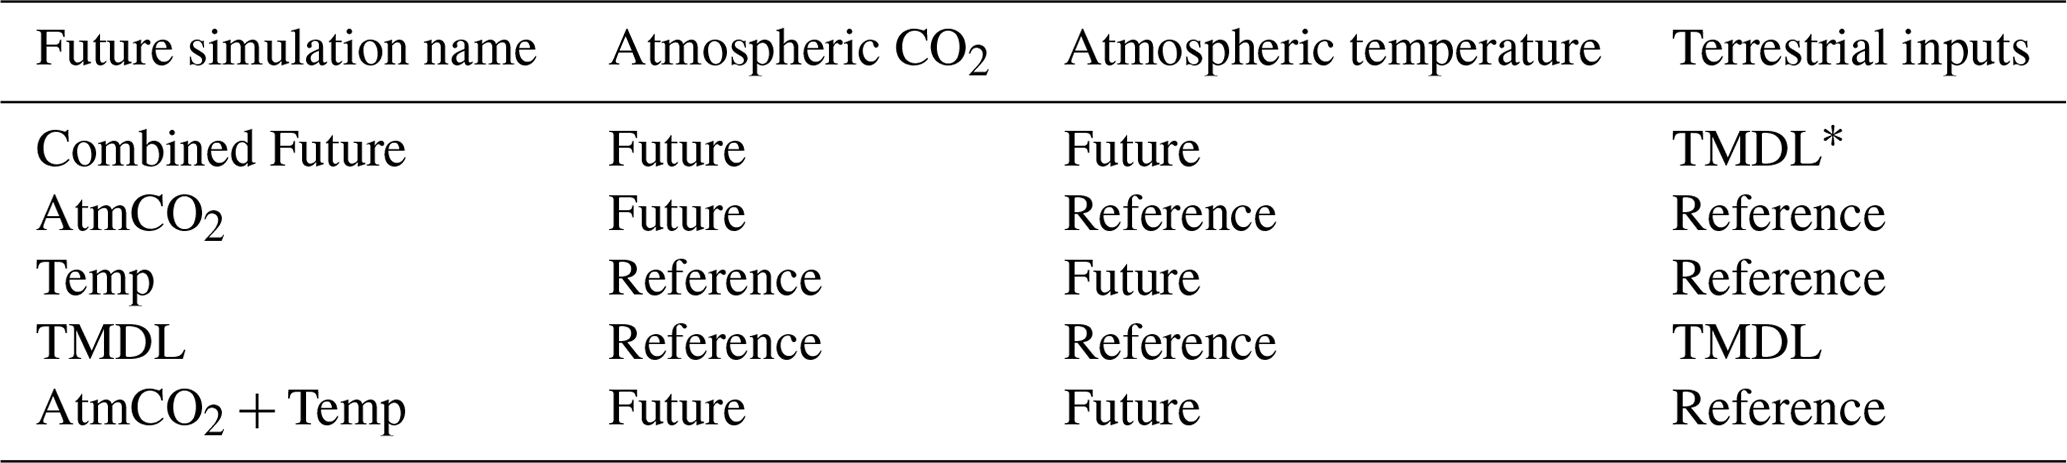
* TMDL (total maximum daily load) forcing includes inputs of nitrate, ammonium, dissolved organic matter, and particulate organic matter under the assumption that the nutrient reduction goals (EPA, 2010) are met.
2.4 Future simulations
In addition to the reference run, this study generated five future simulations (Table 1) to investigate the change in carbonate chemistry conditions and oyster growth resulting from three drivers of future change in the bay: increased atmospheric CO2 (AtmCO2), atmospheric warming (Temp), and reduced nutrient loading (TMDL). Model forcings were modified for each simulation to represent mid-century conditions. A Combined Future simulation was run including forcings of all future stressors, in addition to three sensitivity simulations to isolate the impacts of each stressor on oyster growth. Atmospheric CO2 concentration for the AtmCO2 and Combined Future simulations was set to 655 ppm, which was derived from the Coupled Model Intercomparison Project Phase 5 report RCP8.5 (business-as-usual) scenario projected for 50 years in the future relative to the reference run (Meinshausen et al., 2011). While it is reasonable to assume that warming temperatures will always accompany increases in atmospheric CO2, separate experiments for each stressor were conducted. Isolating the physiological effects of each stressor helps us understand the mechanisms effecting the change in oyster growth and furthermore indicates the degree to which management strategies for offsetting acidification can reduce the effects of climate change on oysters. Future atmospheric temperature for the Temp and Combined Future simulations was obtained from the IPSL-CM5B-LR Earth System Model (Dufresne et al., 2013), statistically downscaled with the Multivariate Adaptive Constructed Analogs method (Abatzoglou and Brown, 2012). IPSL-CM5B-LR was selected as in Hinson et al. (2024), since it was deemed the most representative downscaled ESM of the 20 available (Hinson et al., 2023). As in Hinson et al. (2024), the delta method was used to calculate the daily average change in atmospheric temperatures between present-day and future conditions. To calculate this change, two 30-year climatologies, centered on 2000 and 2050 respectively, were computed and daily averaged 50-year differences between the two climatologies (Fig. 2) were added to the atmospheric temperatures used in the reference run. Future watershed inputs for the TMDL and Combined Future simulations included a climatology of nitrate, ammonium, dissolved organic matter, and particulate organic matter concentrations, derived from a Phase 6 CBPWM 1991–2000 run using reduced nutrient concentrations assuming the TMDLs had been successfully achieved (approximately a 20 %–25 % mean reduction in total nutrient loading; Bhatt et al., 2023). Freshwater discharge in this run was set to be identical to the reference run to isolate the effects of lowered nutrient concentrations on water chemistry and oyster growth. Since future climate change is expected to impact terrestrial inputs much less than future management actions (Hinson et al., 2023), the direct impact of climate change on the watershed is not considered in this analysis. A fifth simulation (AtmCO2 + Temp) was run to compare the influences of local management actions to the combined drivers of climate change, which includes both future atmospheric CO2 concentration and atmospheric temperature. Preliminary investigations revealed a minimal impact of sea level rise on ΩCa in the bay; therefore, it was not included in the simulated climate change variables.
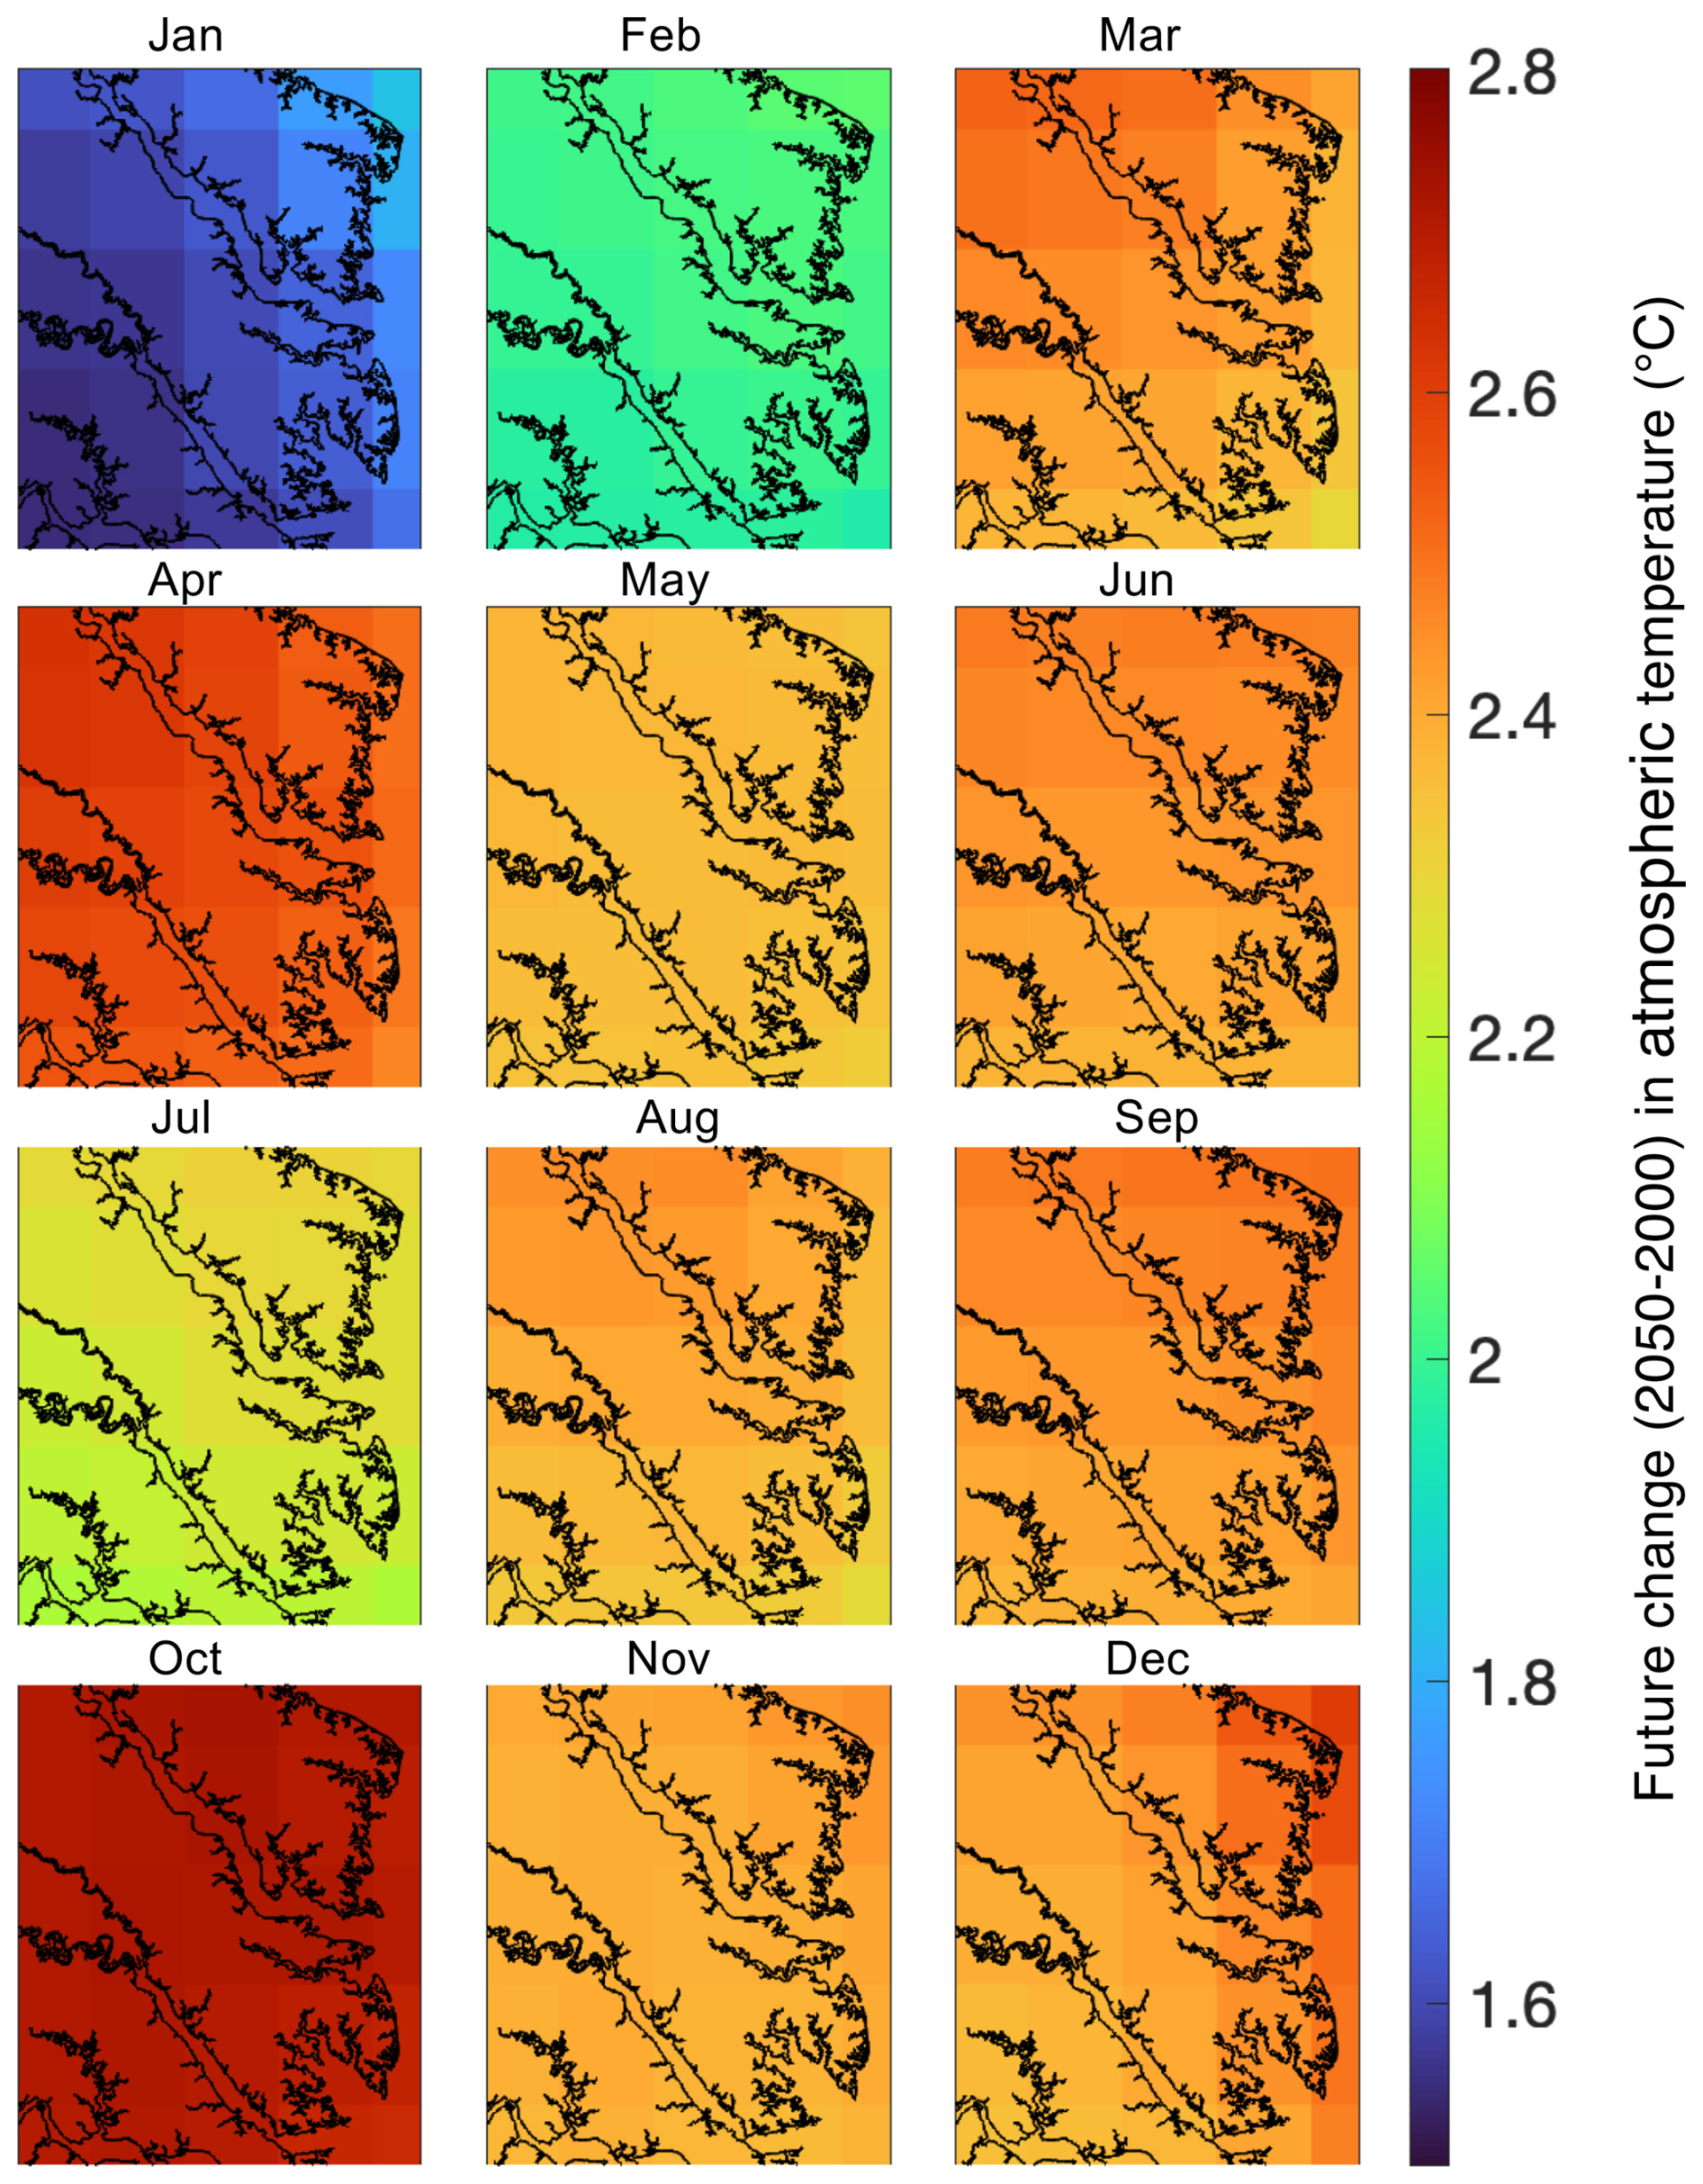
Figure 2Monthly-averaged 50-year atmospheric temperature differences over the ROMS-ECBO model domain calculated as projections from 2050 minus those from 2000.
To generate open boundary conditions for each future simulation, a full bay model (St-Laurent and Friedrichs, 2024) was run with the same atmospheric and river forcings as in this 120 m model implementation. As in the reference run, all future simulations were spun up for 6 months (1 January–30 June) before beginning on 1 July, but represent 50 years in the future from the reference simulation (i.e., 1 July 2067). Initial conditions for all spin-ups are identical to the reference simulation. Analysis confirmed the effects of initial conditions are negligible by 1 July. To examine results most relevant to oysters, model output was extracted at locations that support oyster production, defined as all grid cells in which tissue weight exceeded 1 g at the end of the reference run (i.e., 1 year of growth; Fig. S2), which is inclusive of locations of active oyster farms. All results shown are from the bottom level of the model, representing conditions similar to on-bottom or bottom cage aquaculture methods that are common in Virginia. Spatial variation in model outputs across grid cells in the model domain is reported using standard deviation.
3.1 Model Skill Assessment
When compared to 2017 WQMP observations and seasonal decadal averages, model skill of ROMS-ECB is reasonably high (Table 2, Figs. 3, 4) and similar to other model implementations of the Chesapeake Bay (Irby et al., 2016). Temperature and salinity are reproduced relatively well year-round (Fig. 3a, b), with annual biases of only 0.2 °C and −1.5, respectively (Table 2). Bottom O2 and pH are slightly overestimated, exhibiting the greatest model–data misfit in the spring and summer months in the tributary channels (Fig. 3c, d). pH is overestimated by 0.2 units, which is within the accuracy of the electrode measurements. Observed POC concentrations in the York and upper Rappahannock are higher than simulated in the model and exhibit very high spatial variability (Fig. 4a). Despite the high spatial variability of the TSS observations (Fig. 4b), mean TSS (45 ± 54 mg L−1) is captured within 1.1 mg L−1 by the model.
Table 2Model skill statistics (mean ± standard deviation) comparing bottom grid cells from the reference run to Chesapeake Bay Program observations from the same station location and time, within the bottom 10 % of the water column.
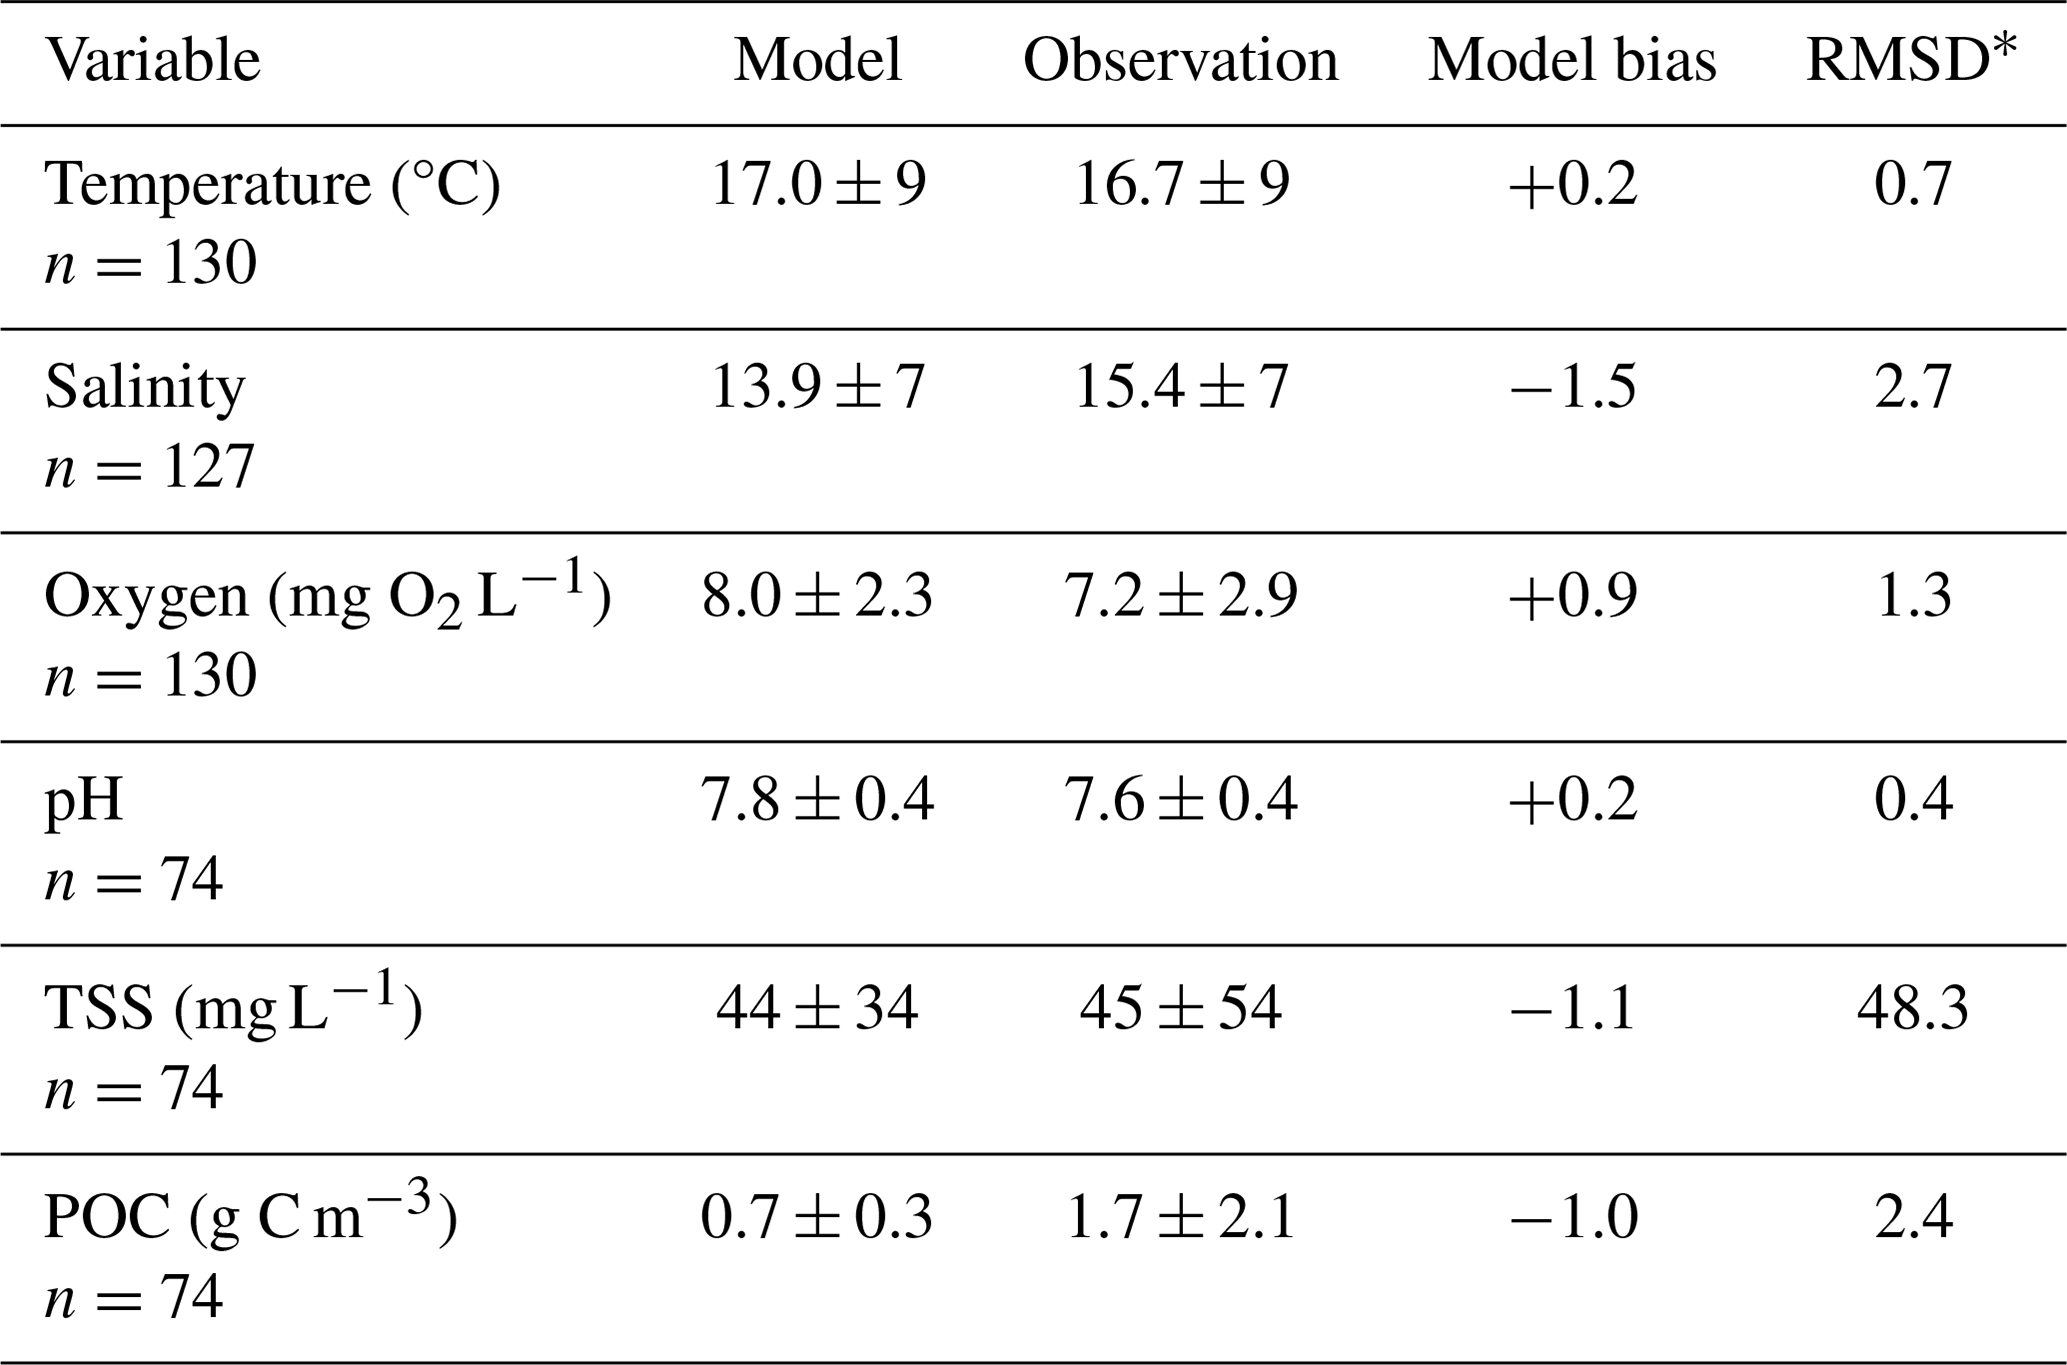
* RMSD = root mean squared difference.
Growth rates determined using the EcoOyster equations and environmental outputs from ROMS-ECB were compared with oyster data collected in the York River (Paynter et al., 2008; Liddel, 2008; Kingsley-Smith et al., 2009; Dégremont et al., 2012; Callam et al., 2016). Specifically, the tunable parameter (p) that limits oyster filtration was adjusted to provide a best match between the modeled oyster growth rates and the published rates. Multiple p-values were tested, and a value of p=0.15 resulted in modeled oyster growth that best matched published growth rates. The resulting shell growth predicted by the model was found to be close to the in situ data (52.0 ± 1.1 and 51.3 ± 2.9 mm yr−1 for the model and observation means and standard deviations, respectively).
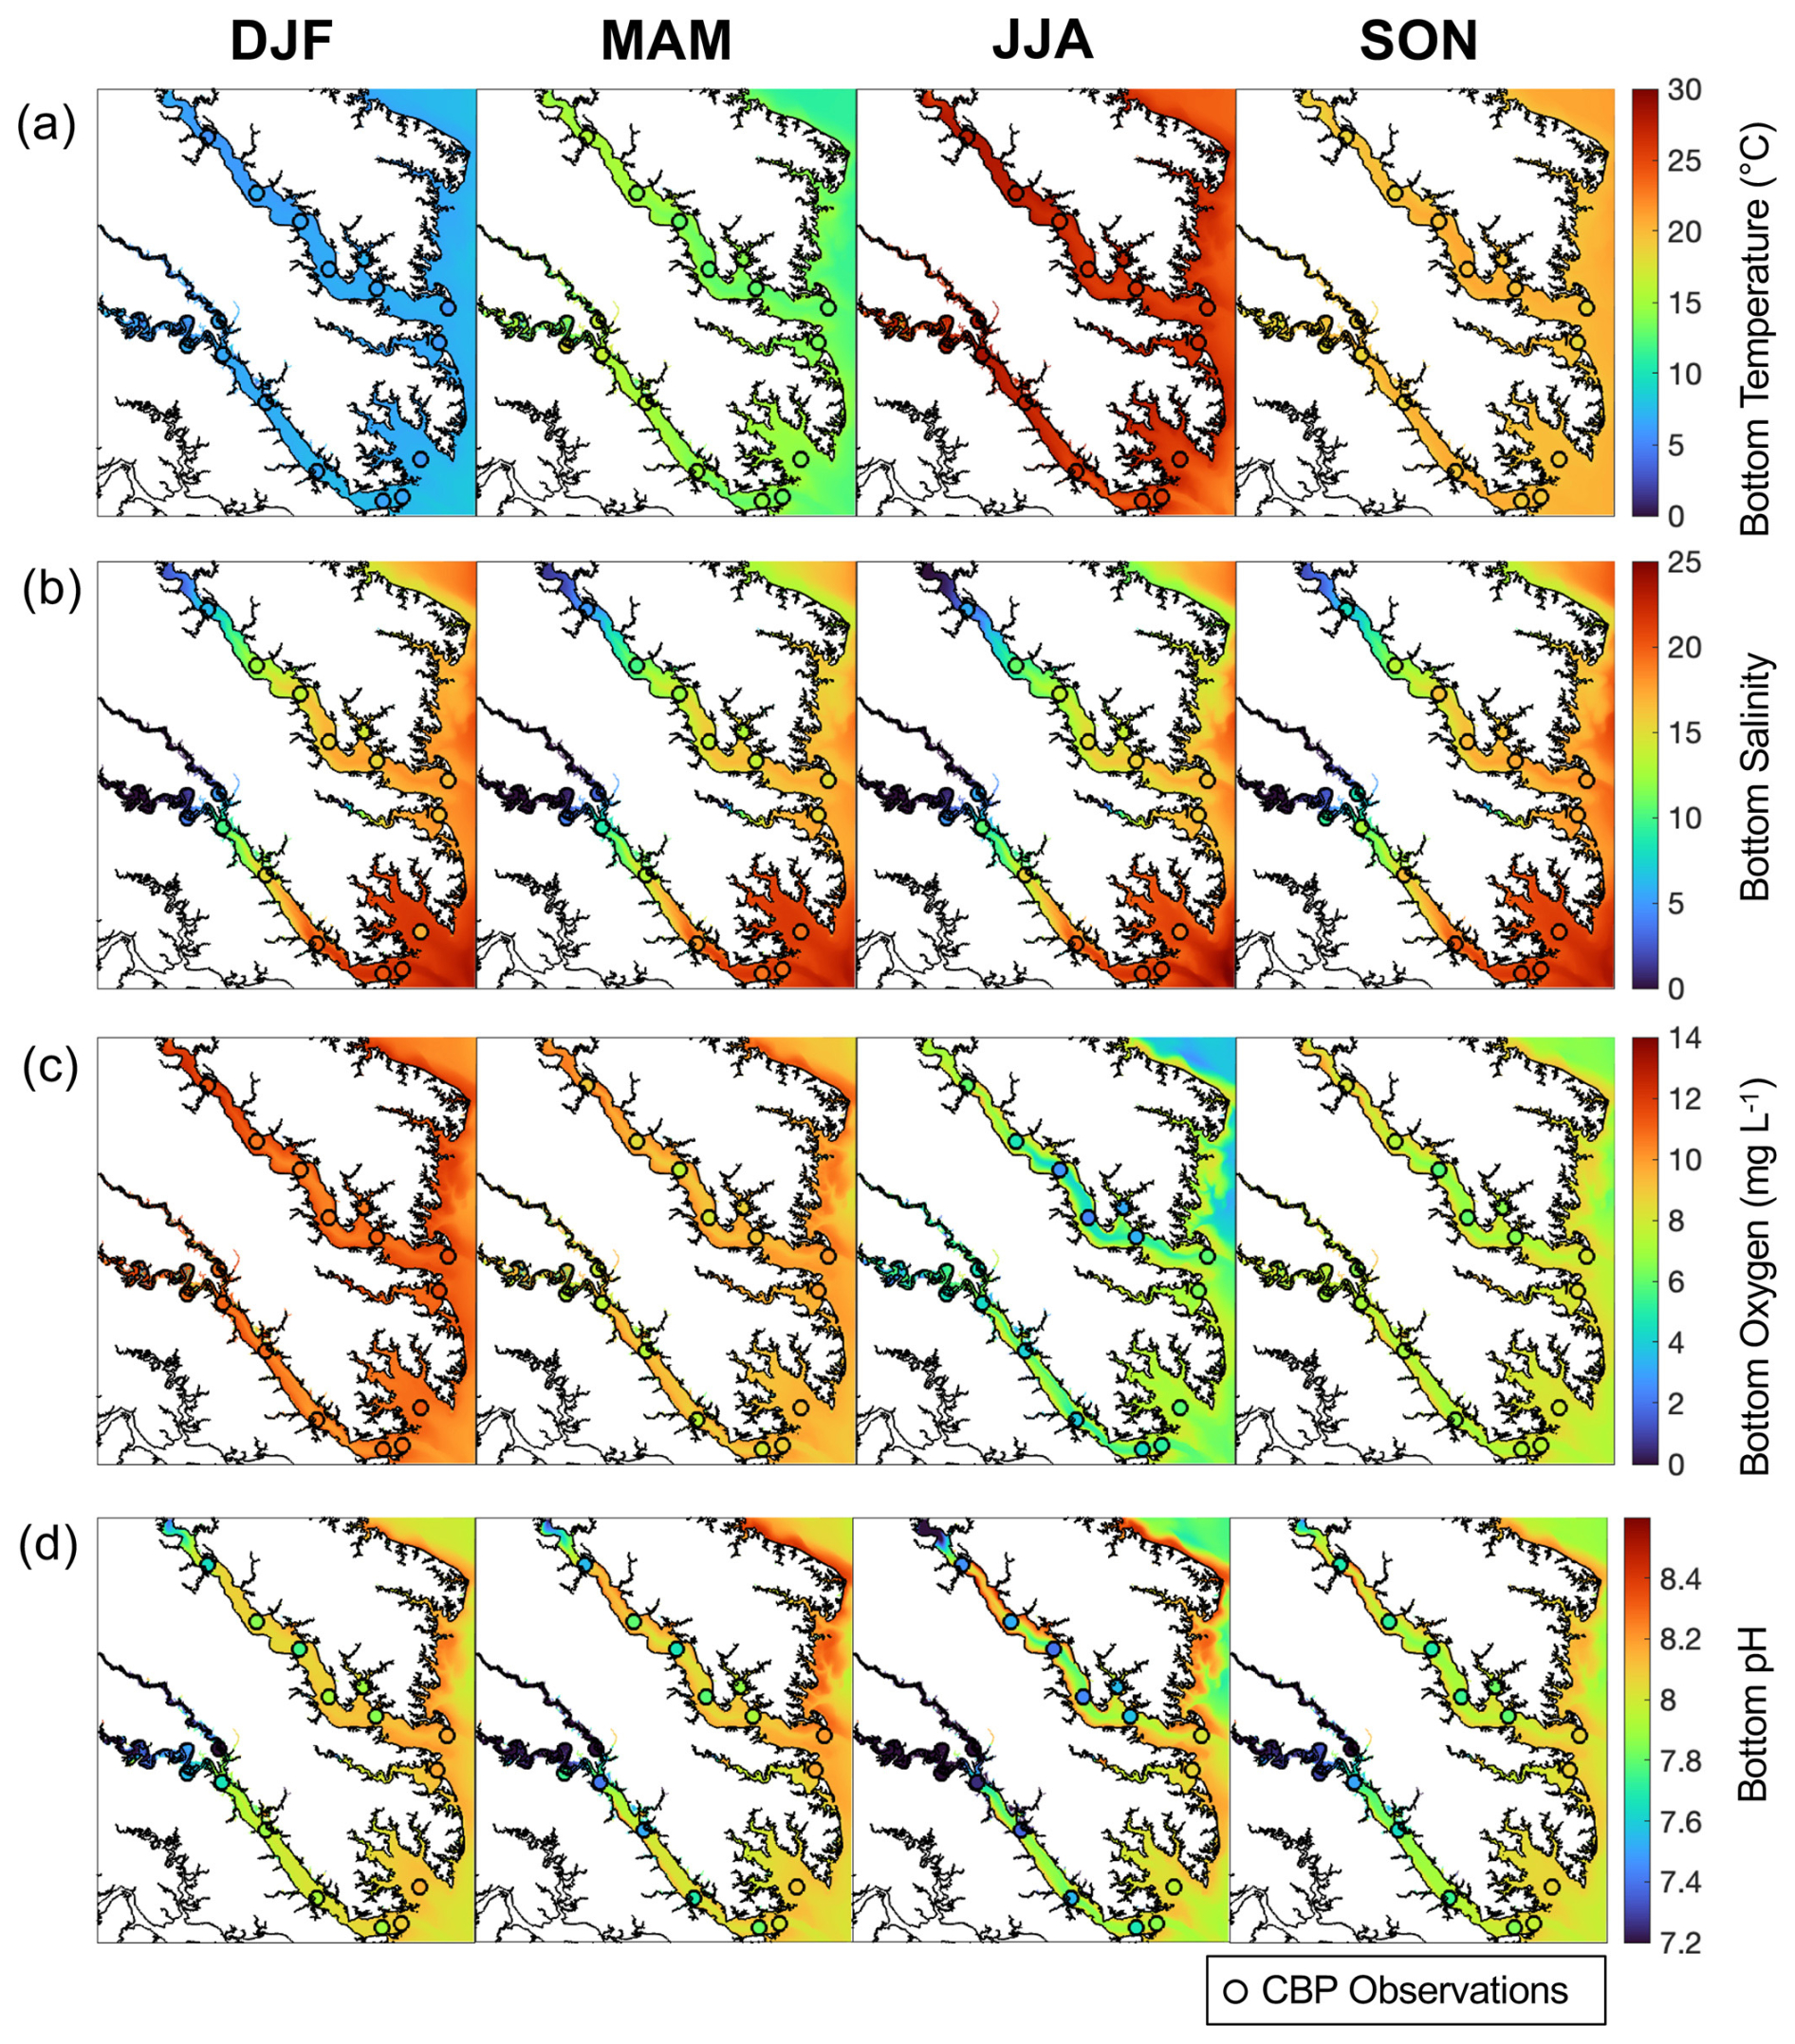
Figure 3Seasonally-averaged bottom (a) temperature, (b) salinity, (c) dissolved oxygen, and (d) pH from the reference run. Circles represent seasonal decadal-averaged in situ observations at Chesapeake Bay Program stations (2010–2020) (DJF = winter, MAM = spring, JJA = summer, and SON = fall).
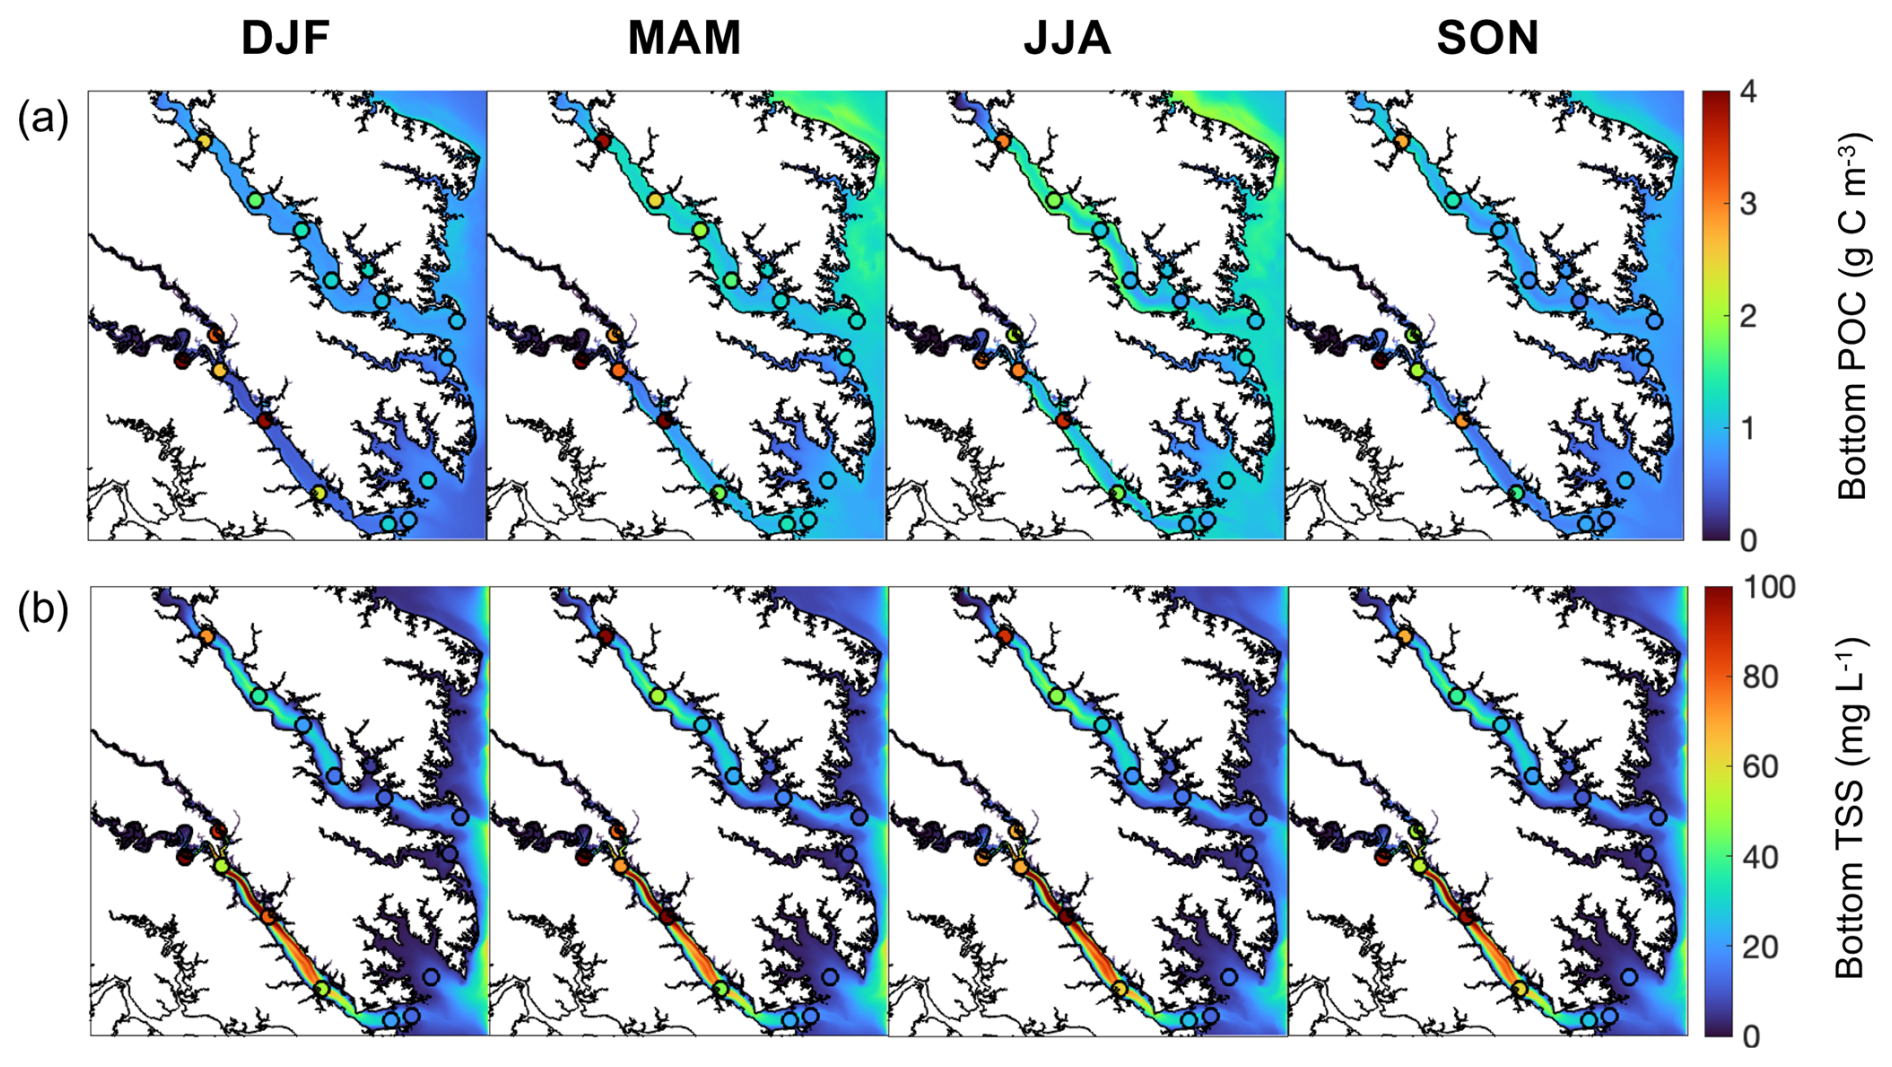
Figure 4Seasonally-averaged bottom (a) POC and (b) TSS from output of the reference run of the ROMS-ECBO model. Circles represent seasonal decadal-averaged bottom measurements at Chesapeake Bay Program stations (2010–2020) (DJF = winter, MAM = spring, JJA = summer, and SON = fall).
3.2 Reference run results
In the present-day reference run, the environmental variables used as inputs to the oyster parameterizations exhibit substantial seasonal (Fig. 5a–f) and spatial (Figs. 6, S3) variability. As expected, bottom temperature is highest in summer, reaching an average of 29.3 °C in July when averaged across grid cells that support oyster growth (Fig. 5a). Temperature is higher in the shallower parts of the tributaries compared to the channels (Fig. S3a). Bottom salinity exhibits higher values in the fall and winter, reaching a maximum average of 17.7 in October, and drops in the spring and summer to reach a minimum average of 12.3 in June (Fig. 5b). Annual average bottom salinity ranges from 0 to 26 throughout the model domain (Fig. S3b), with the highest values in the southern areas in closest proximity to the open-ocean. The seasonal cycle for bottom POC is similar to that of temperature, peaking at 1.7 g C m−3 in June and dropping to 0.57 g C m−3 in January (Fig. 5c). Bottom POC also varies widely throughout the model domain (Fig. 6a), with relatively higher values in the Rappahannock compared to the York River, along the shoals of the tributaries, and along the western shoals of the mainstem Bay north of the Rappahannock. ΩCa exhibits an annual cycle similar to that of temperature and POC, reaching a maximum average of 3.2 in August and a minimum average of 1.1 in January (Fig. 5d). Annual mean bottom ΩCa also varies widely throughout the model domain (Fig. 6d). Generally, bottom ΩCa increases with salinity, with low to zero values in the tidal fresh portions of the upper tributaries and higher values along the western shoals of the mainstem Chesapeake Bay. The opposite temporal pattern is seen in bottom O2, which peaks at 12.3 mg L−1 in February and drops to an average of 6.3 mg L−1 in August (Fig. 5e). O2 concentrations are highest along the shoals and lowest in the deep channels (Fig. S3c). Bottom TSS concentrations exhibit tidal variability throughout the year and are highest in the York River with much lower concentrations observed in the other portions of the model domain (Fig. S3d).
Tissue and shell weights increase modestly from July through April, with the highest rates of increase seen in May and June near the end of the 1-year reference run (Fig. 5g, h). At the end of the reference run, the spatial patterns of shell and tissue weight are nearly identical (Fig. 7), as tissue growth largely drives shell growth (Table S4). Both shell and tissue weights are highest along the shoals of the York and Rappahannock Rivers (Fig. 7a, d) and lowest in the deeper waters where TSS concentrations are high (Fig. S3d). A wider region of high shell and tissue weight appears in the Rappahannock, while the highest weights in the York are confined to a very narrow and shallow strip along the coastline. Shell and tissue weights are higher along the southwestern than the northeastern coastlines of the tributaries, where the shoals are wider in both tributaries (Fig. 1a).
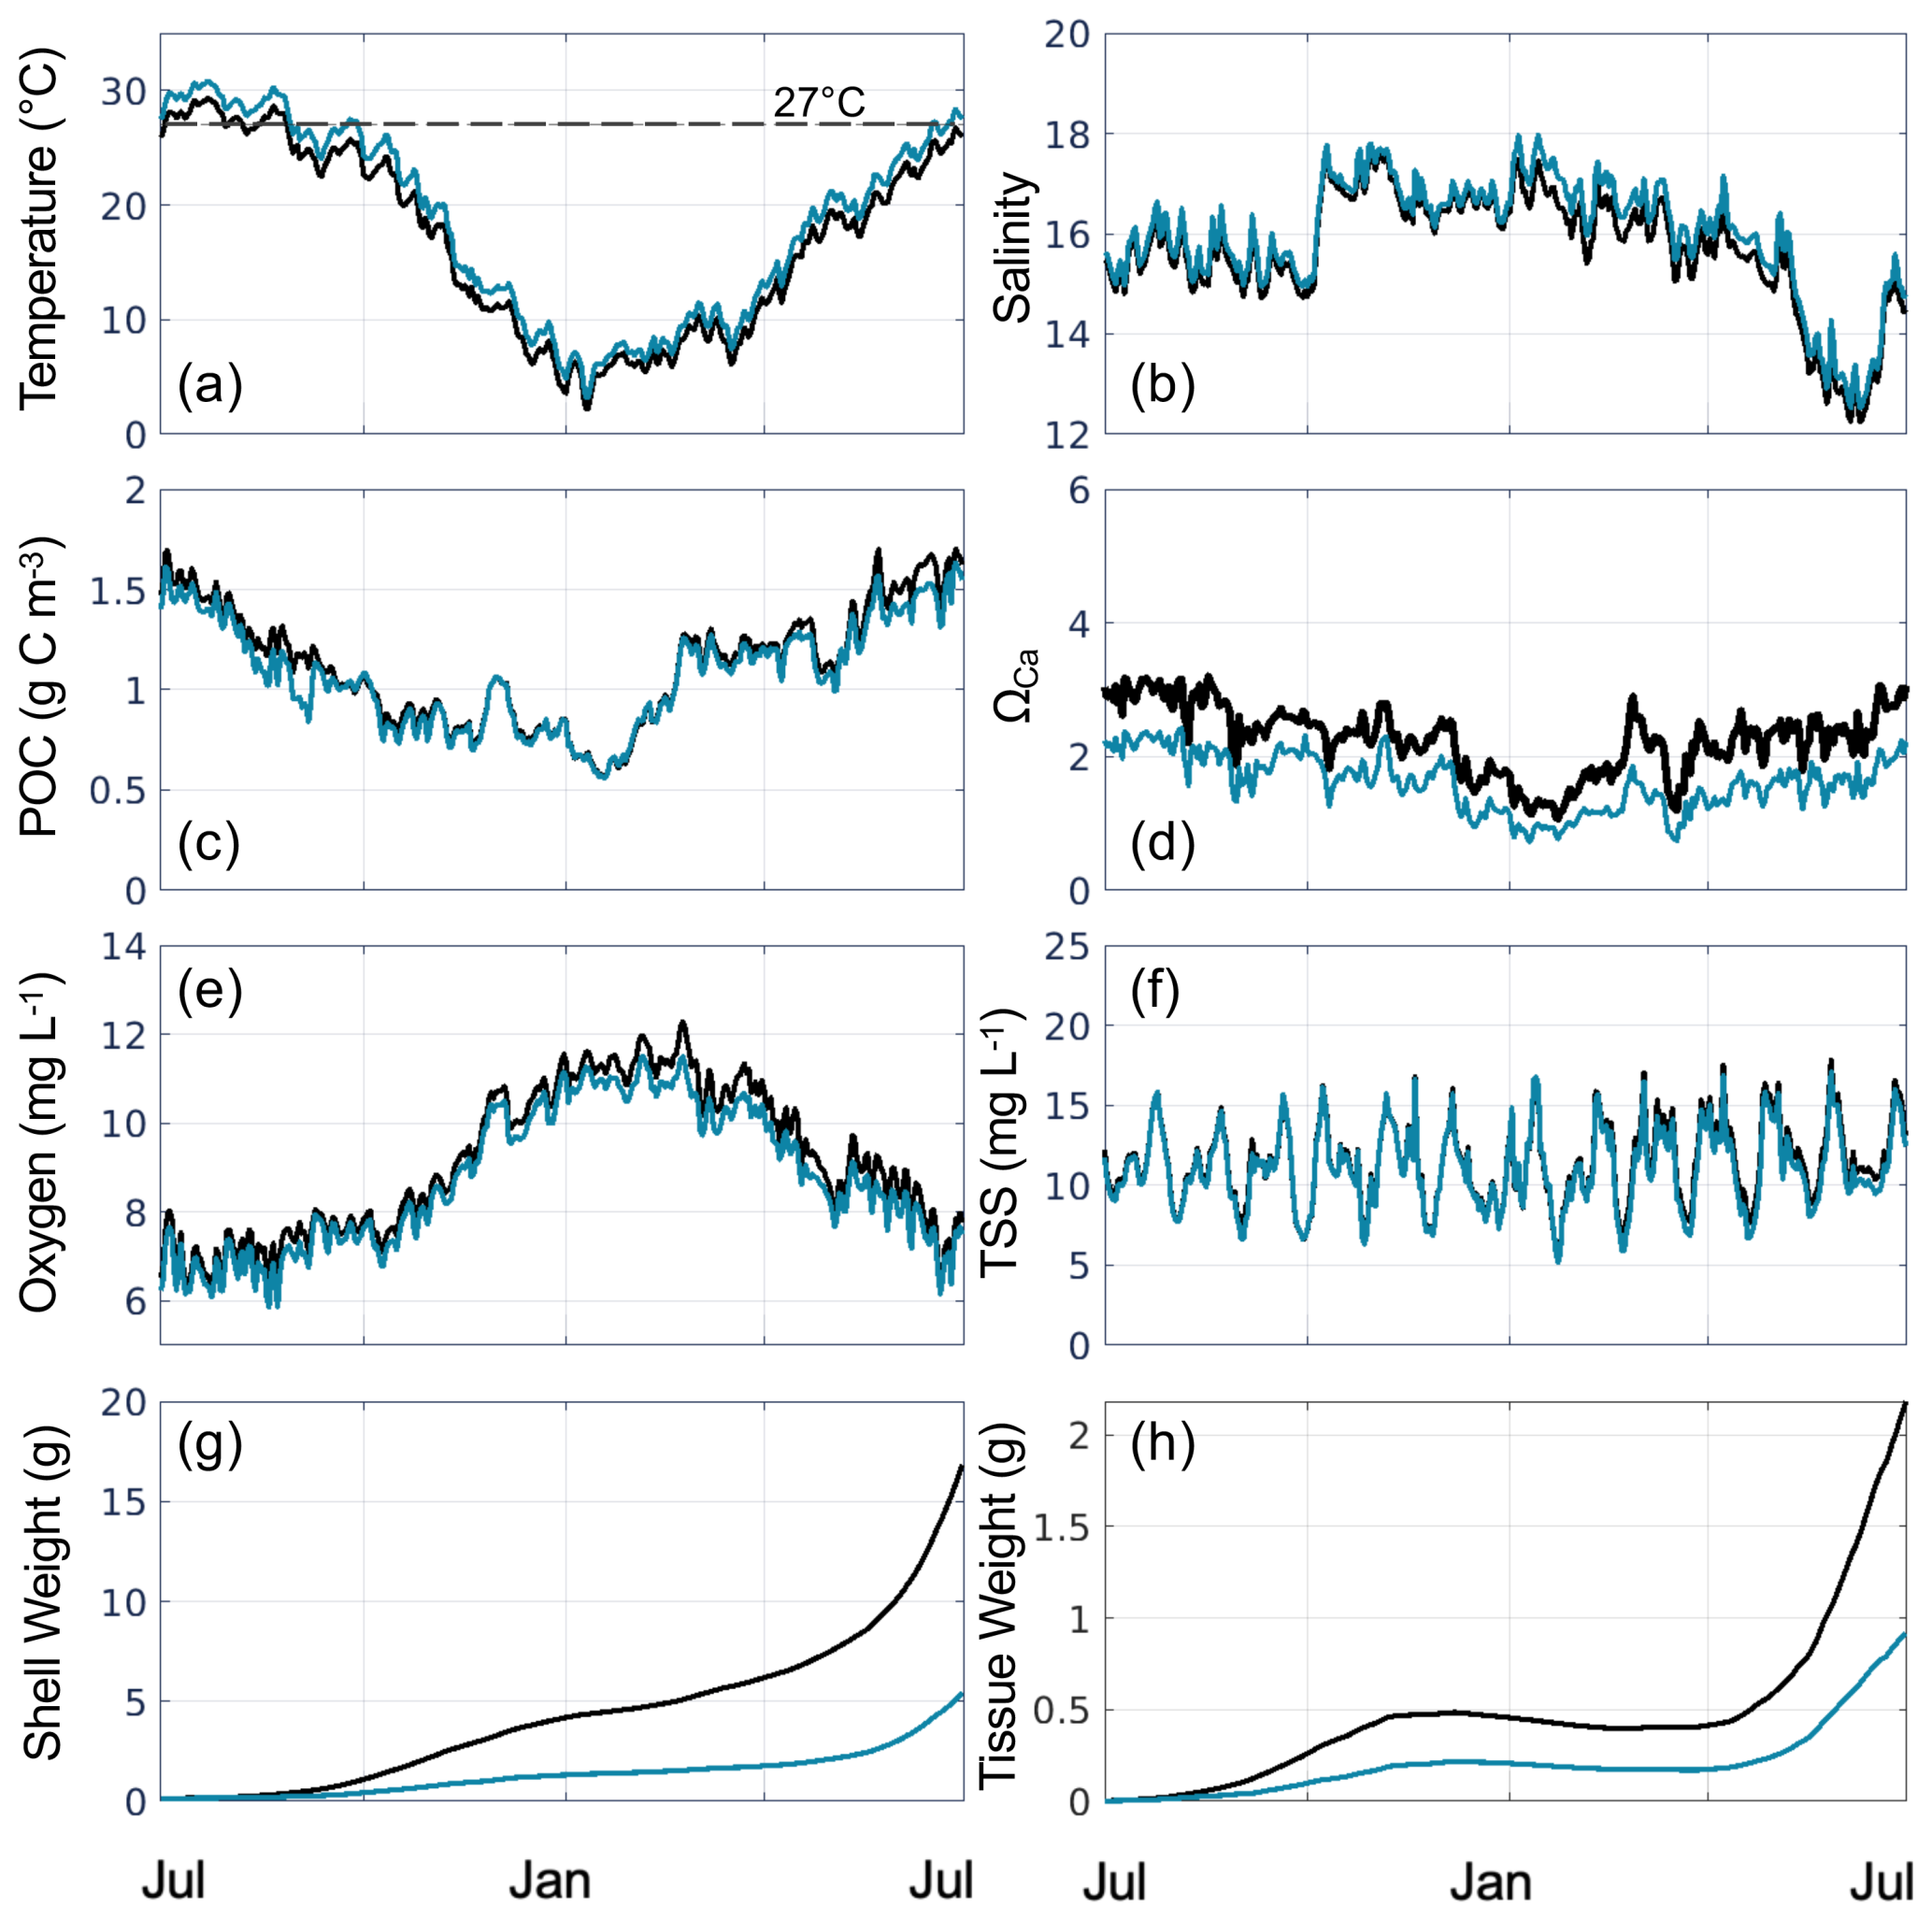
Figure 5Time series of daily bottom (a) temperature, (b) salinity, (c) POC, (d) ΩCa, (e) oxygen, (f) TSS, (g) shell weight, and (h) tissue weight, averaged over grid cells that support oyster growth in the reference run, for the present-day reference run (black line) and Combined Future simulation (blue line). The horizontal dashed line in (a) represents the optimal filtration temperature in EcoOyster (27 °C).
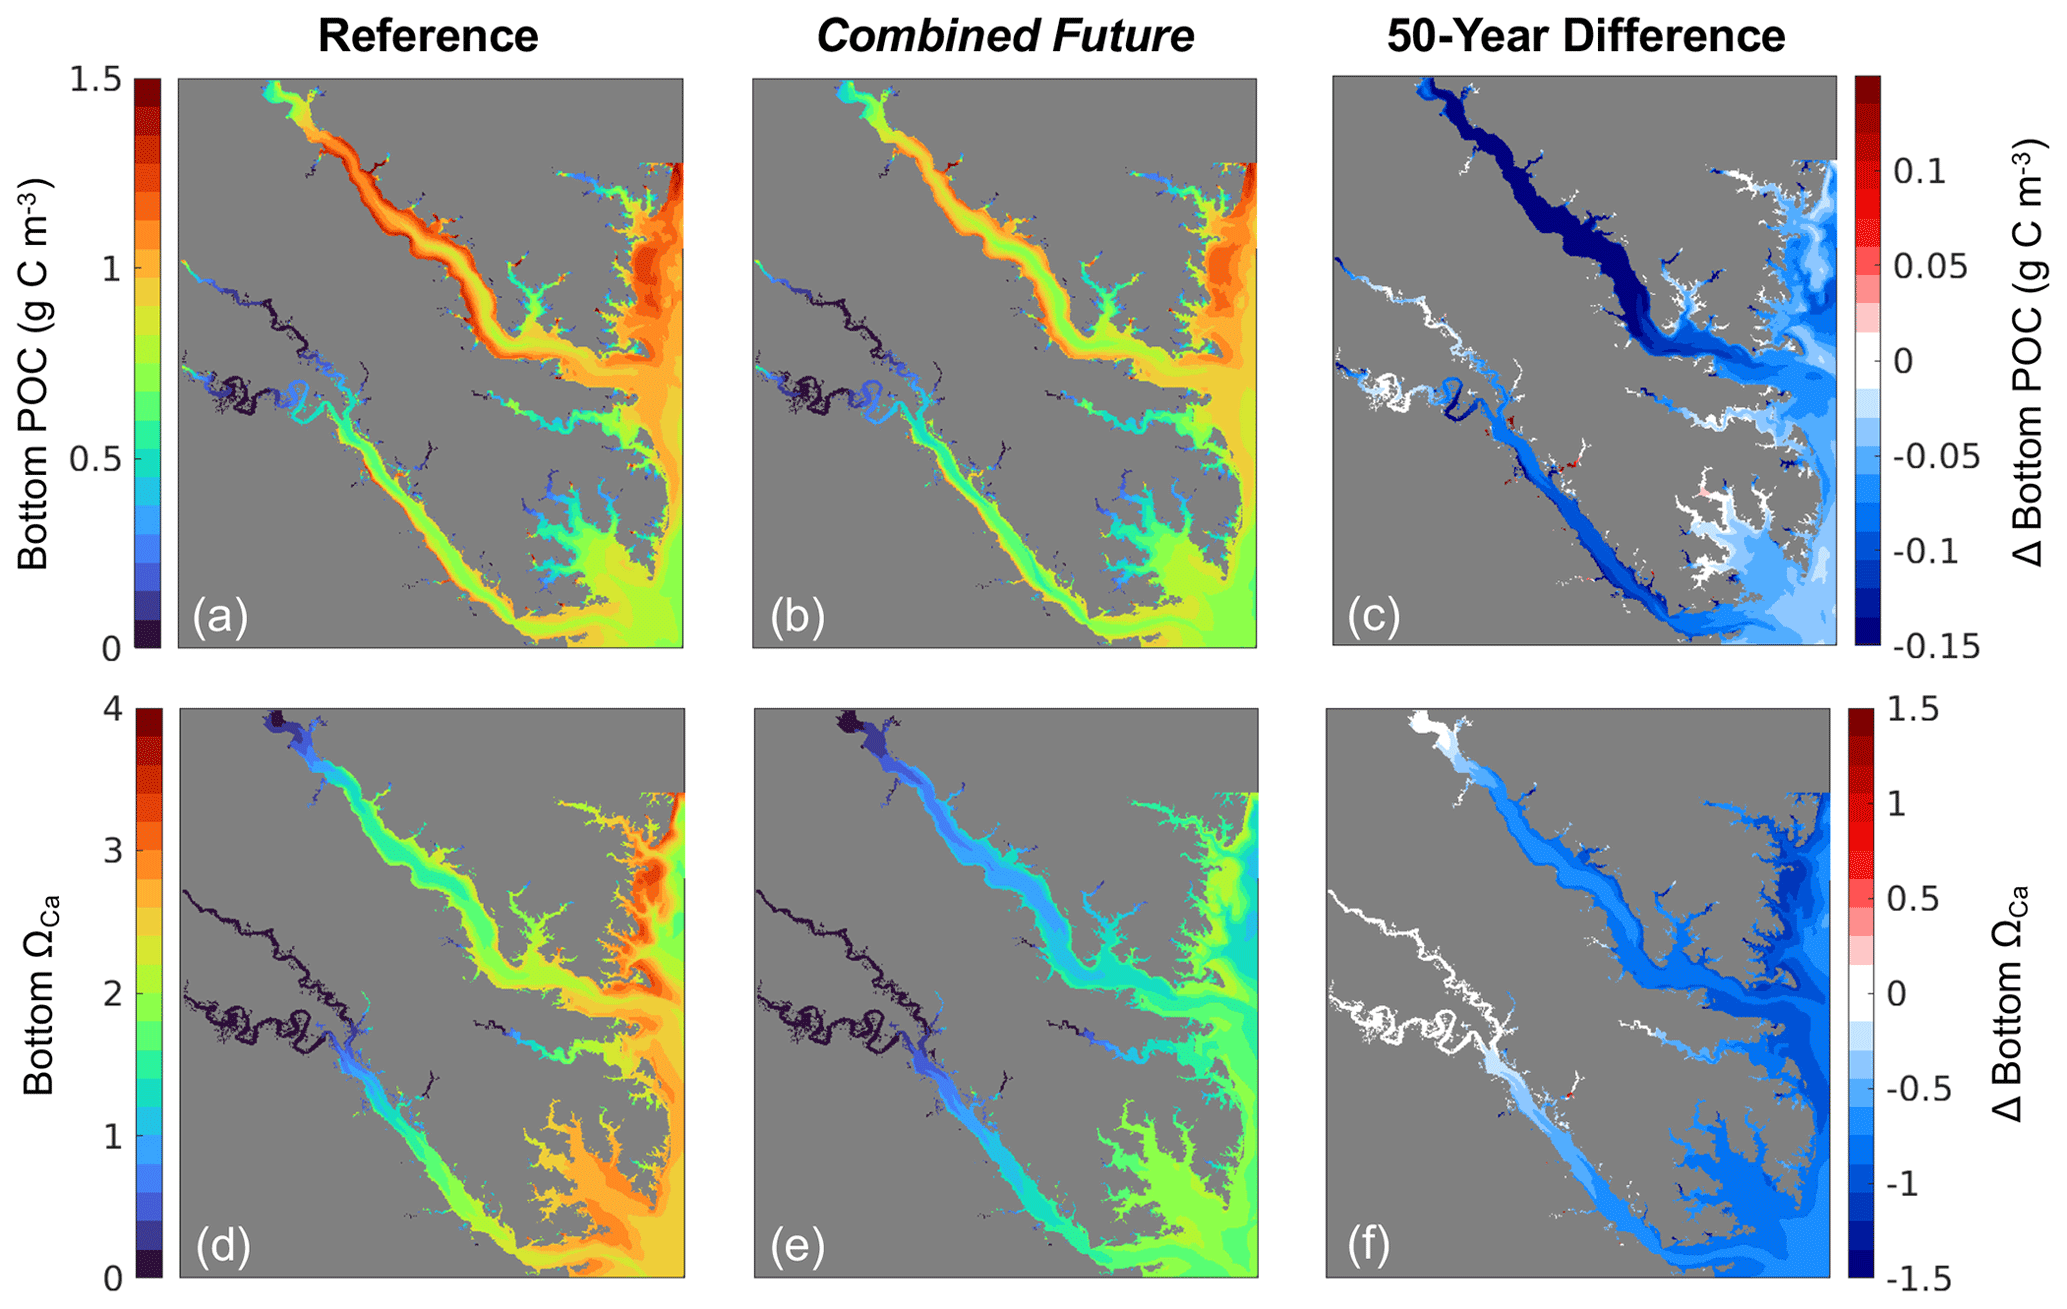
Figure 6Annual mean bottom (a–c) POC and (d–f) ΩCa from (a, d) the present-day reference run, (b, e) the Combined Future simulation, and (c, f) the difference between (a) and (b), i.e., Combined Future minus reference.
3.3 Results of Combined Future simulation
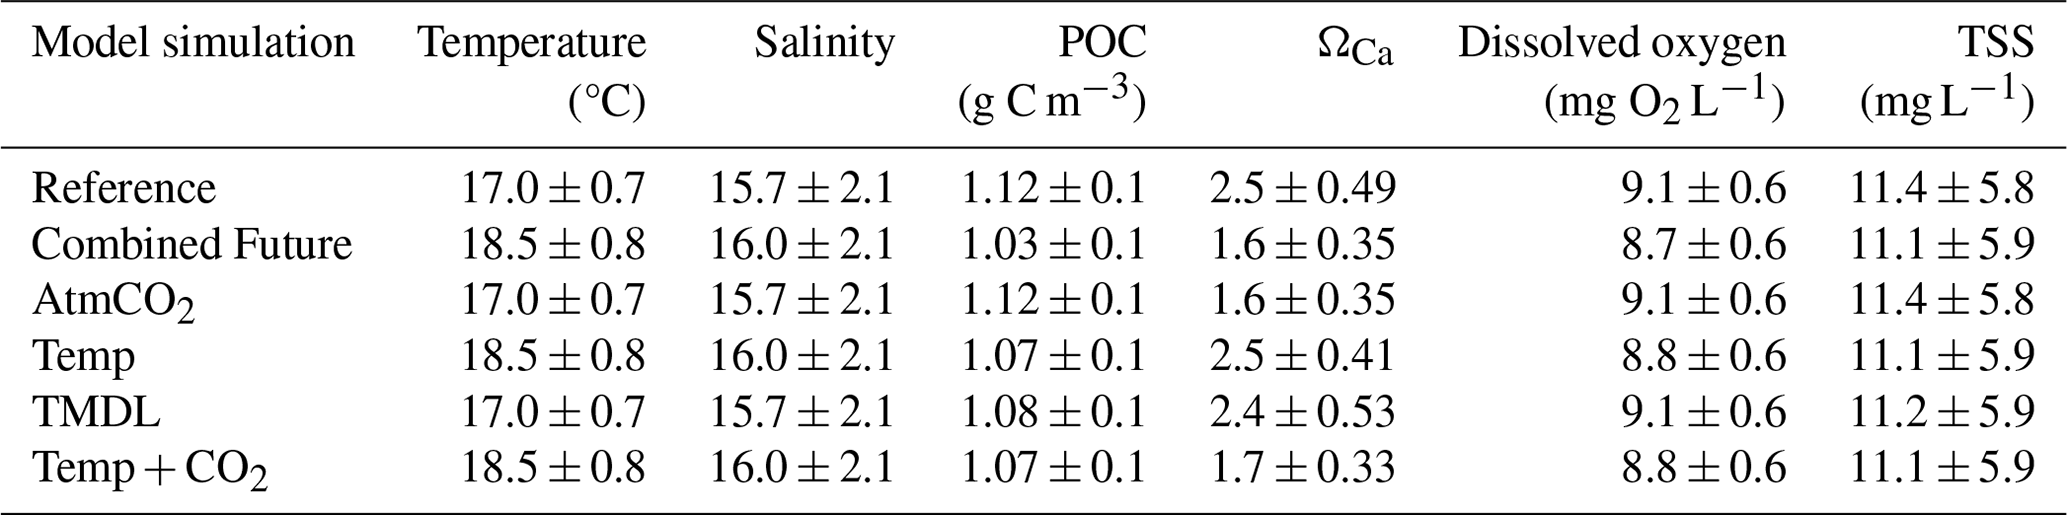
All environmental variables examined exhibit change from the reference run in the Combined Future simulation. Temperature and salinity are projected to increase across the entire model domain (Fig. S3a, b). When averaged over the model domain, temperature is projected to increase by 1.5 ± 0.26 °C, and salinity is projected to increase by 0.21 ± 0.11 (Table S5). Bottom POC is projected to decrease by 0.07 ± 0.05 g C m3 (Table S5), with POC reductions predicted to be most pronounced in the mid- to upper tributaries (Fig. 6c). Mid-century bottom ΩCa is projected to be lower throughout most of the region (Fig. 6f), with an average reduction of 0.8 ± 0.19 over the whole model domain (Table S5). The spatial distribution of future ΩCa is generally consistent with present-day ΩCa patterns, and the greatest decreases are projected to occur in regions with the highest present-day ΩCa (Fig. 6 d, e, f). An average reduction in O2 of 0.3 ± 0.08 mg L−1 is predicted across the model domain (Table S5), which will be mostly spatially uniform (Fig. S3c). TSS is projected to be reduced by 0.20 ± 0.25 mg L−1 with high spatial variability in the projected change (Table S5; Fig. S3d).
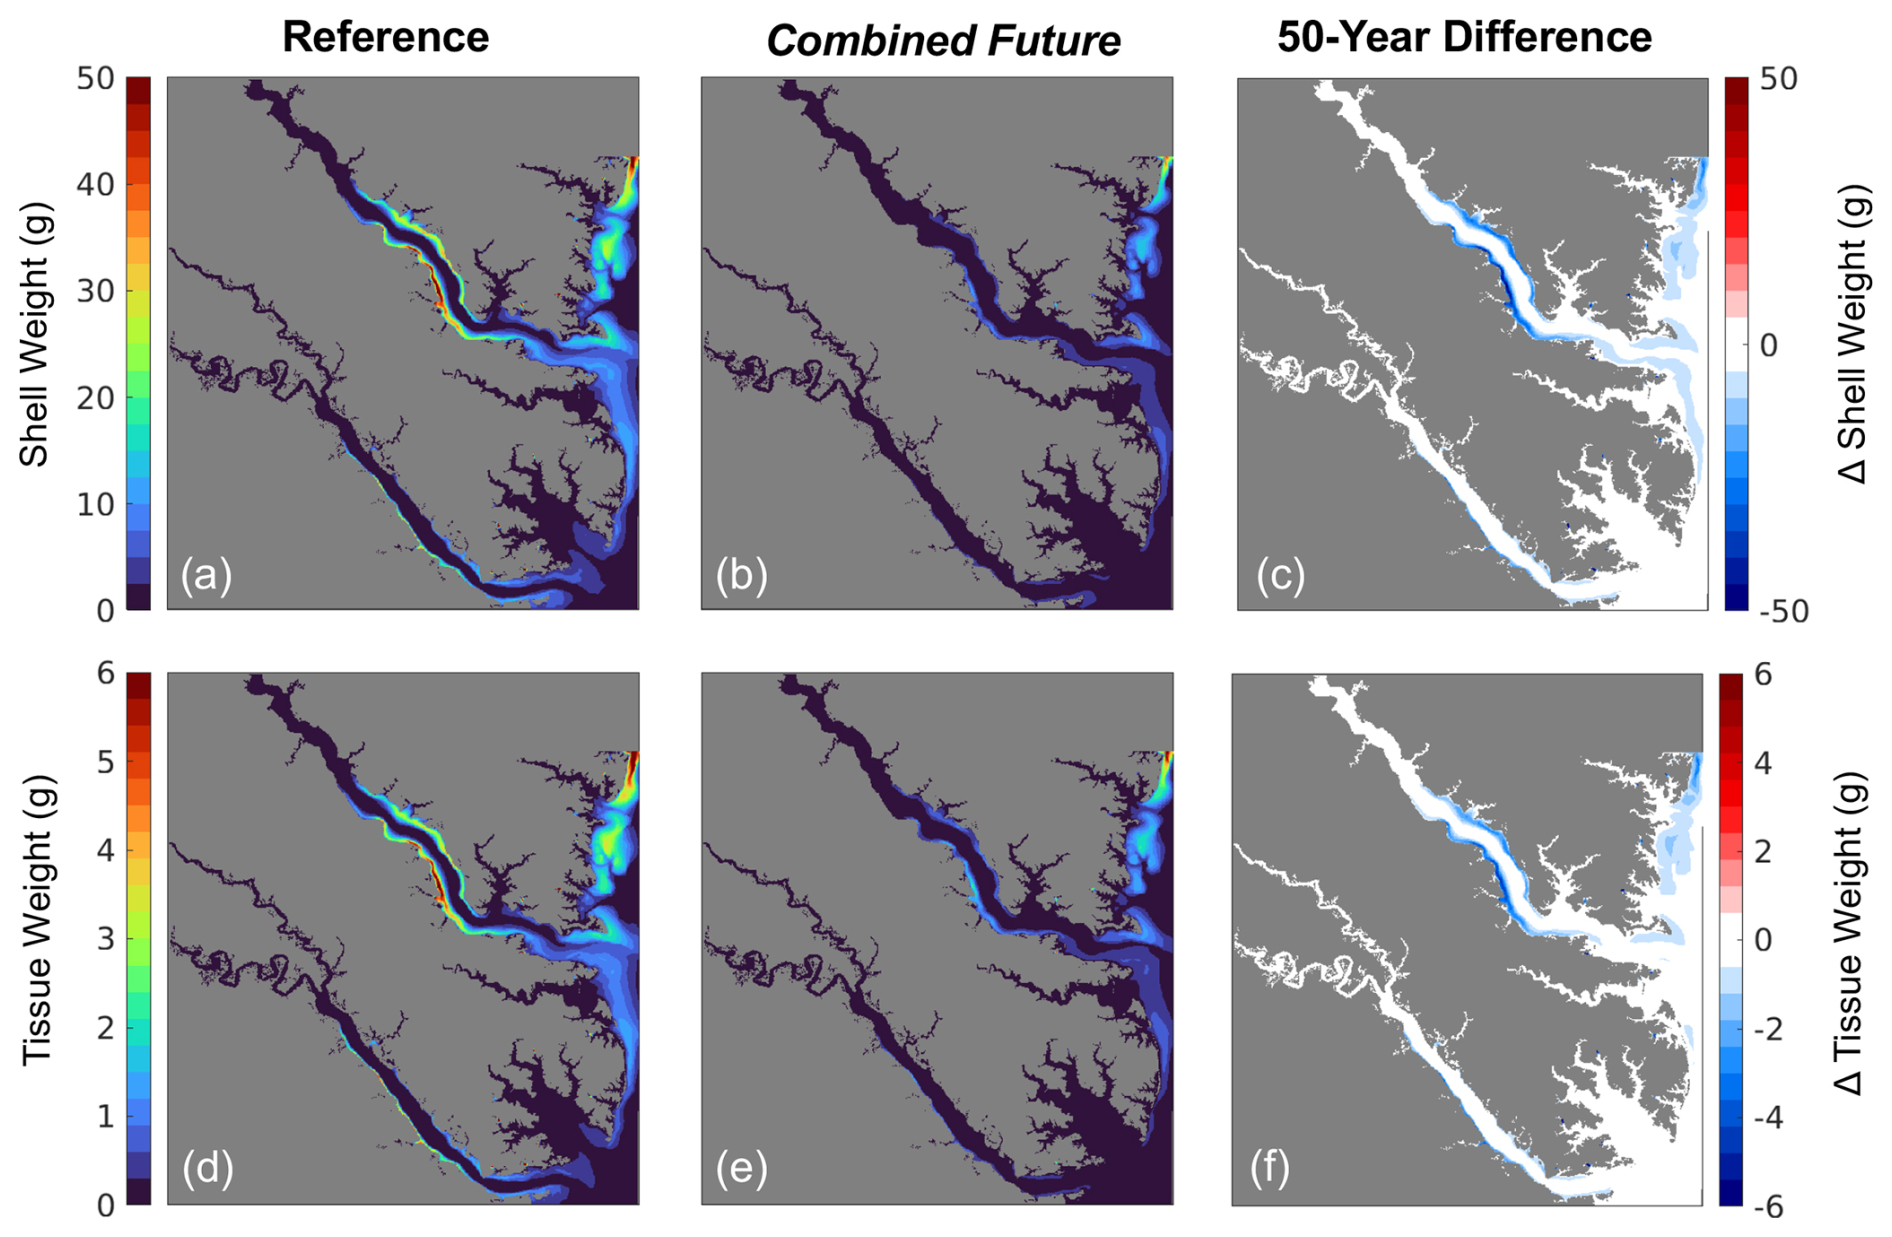
Figure 7(a–c) Shell weight and (d–f) tissue weight at the end of the 1-year simulation from (a, d) the present-day reference run, (b, e) the Combined Future run, and (c, f) their difference, i.e., Combined Future minus reference.
Changes in environmental conditions do not occur uniformly throughout the year. Temporal changes in environmental conditions averaged across grid cells that support oyster growth are provided in Fig. 5. Annually averaged increases in temperature and salinity are the same when averaged over only grid cells that support oyster growth as they are when averaged across the entire model domain (Tables 3, S5). The greatest temperature increases are projected to occur in the warmer months, with an average increase of 1.6 °C predicted for June through August and an average increase of 1.2 °C predicted for December through February. Bottom temperatures are projected to surpass the optimal temperature for oyster filtration (27 °C) primarily in July and August (Fig. 5a). Salinity increases are projected to be greatest at the beginning of the year, with an average increase of 0.44 between January and March and an average increase of 0.20 for the remainder of the year (Fig. 5b). Bottom POC at grid cells that support oyster growth is expected to decrease slightly less than the average for the entire region (Tables 3, S5), by an annual average of 0.09 g C m−3, with the greatest reductions in the spring and summer and little to no change in the winter (Fig. 5c). For ΩCa, O2, and TSS, projected reductions are slightly greater at oyster growth sites than for the entire domain. ΩCa is projected to decrease by 0.9, with the greatest reductions expected to occur the warmer months (Fig. 5d). O2 is projected to decrease year-round, though with slightly greater reductions in the winter (Fig. 5e) and an annual average reduction of 0.4 mg O2 L−1 (Table 3). TSS is projected to decrease annually by 0.3 mg L−1 (Table 3), mostly in the spring, due to lowered POC (Fig. 5f).
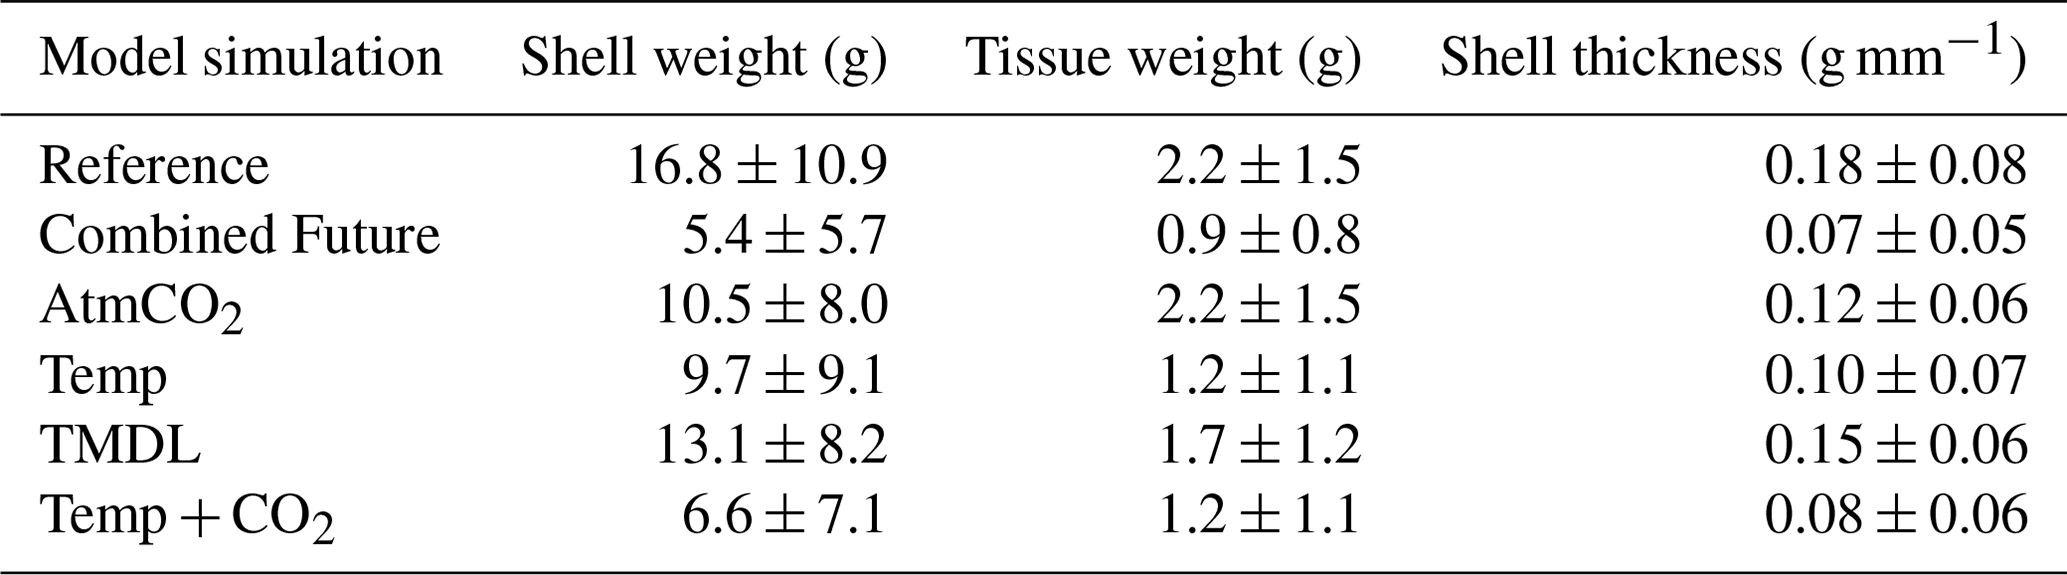
Table 3Bottom environmental variables for each model simulation (annual mean ± standard deviation) for grid cells that support oyster growth in the reference run (defined as those with greater than 1g dry tissue weight after 1 year of growth; Fig. S2). Analogous results averaged over all model grid cells are shown in Table S5.
Modeled shell and tissue weights after 1 year of growth are projected to decline in all regions that exhibit present-day growth, with the most severe reductions (up to 100 %) occurring along the York and Rappahannock River shoals (Figs. 7c, f, 8). The 1-year tissue weight will be reduced by 1.3 g, on average, representing a 60 % reduction across grid cells that support oyster growth (Table 4). Shell weight, which is largely driven by changes in tissue weight, is projected to be reduced by 11.4 g on average after 1 year of growth, representing a 68 % reduction in average shell weight in regions that support oyster growth (Table 4). The greatest reduction in shell and tissue growth rates will occur in the warmer months near the end of the 1-year simulation (−0.1 g d−1 from May through June), whereas the smallest change will occur in the winter months (−0.02 g d−1 from December through February), as the least growth occurs during that time (Fig. 5g, h). Shell thickness, calculated as the ratio of shell weight to shell height, will be reduced by 61 % on average (0.11 g mm−1; Table 4).
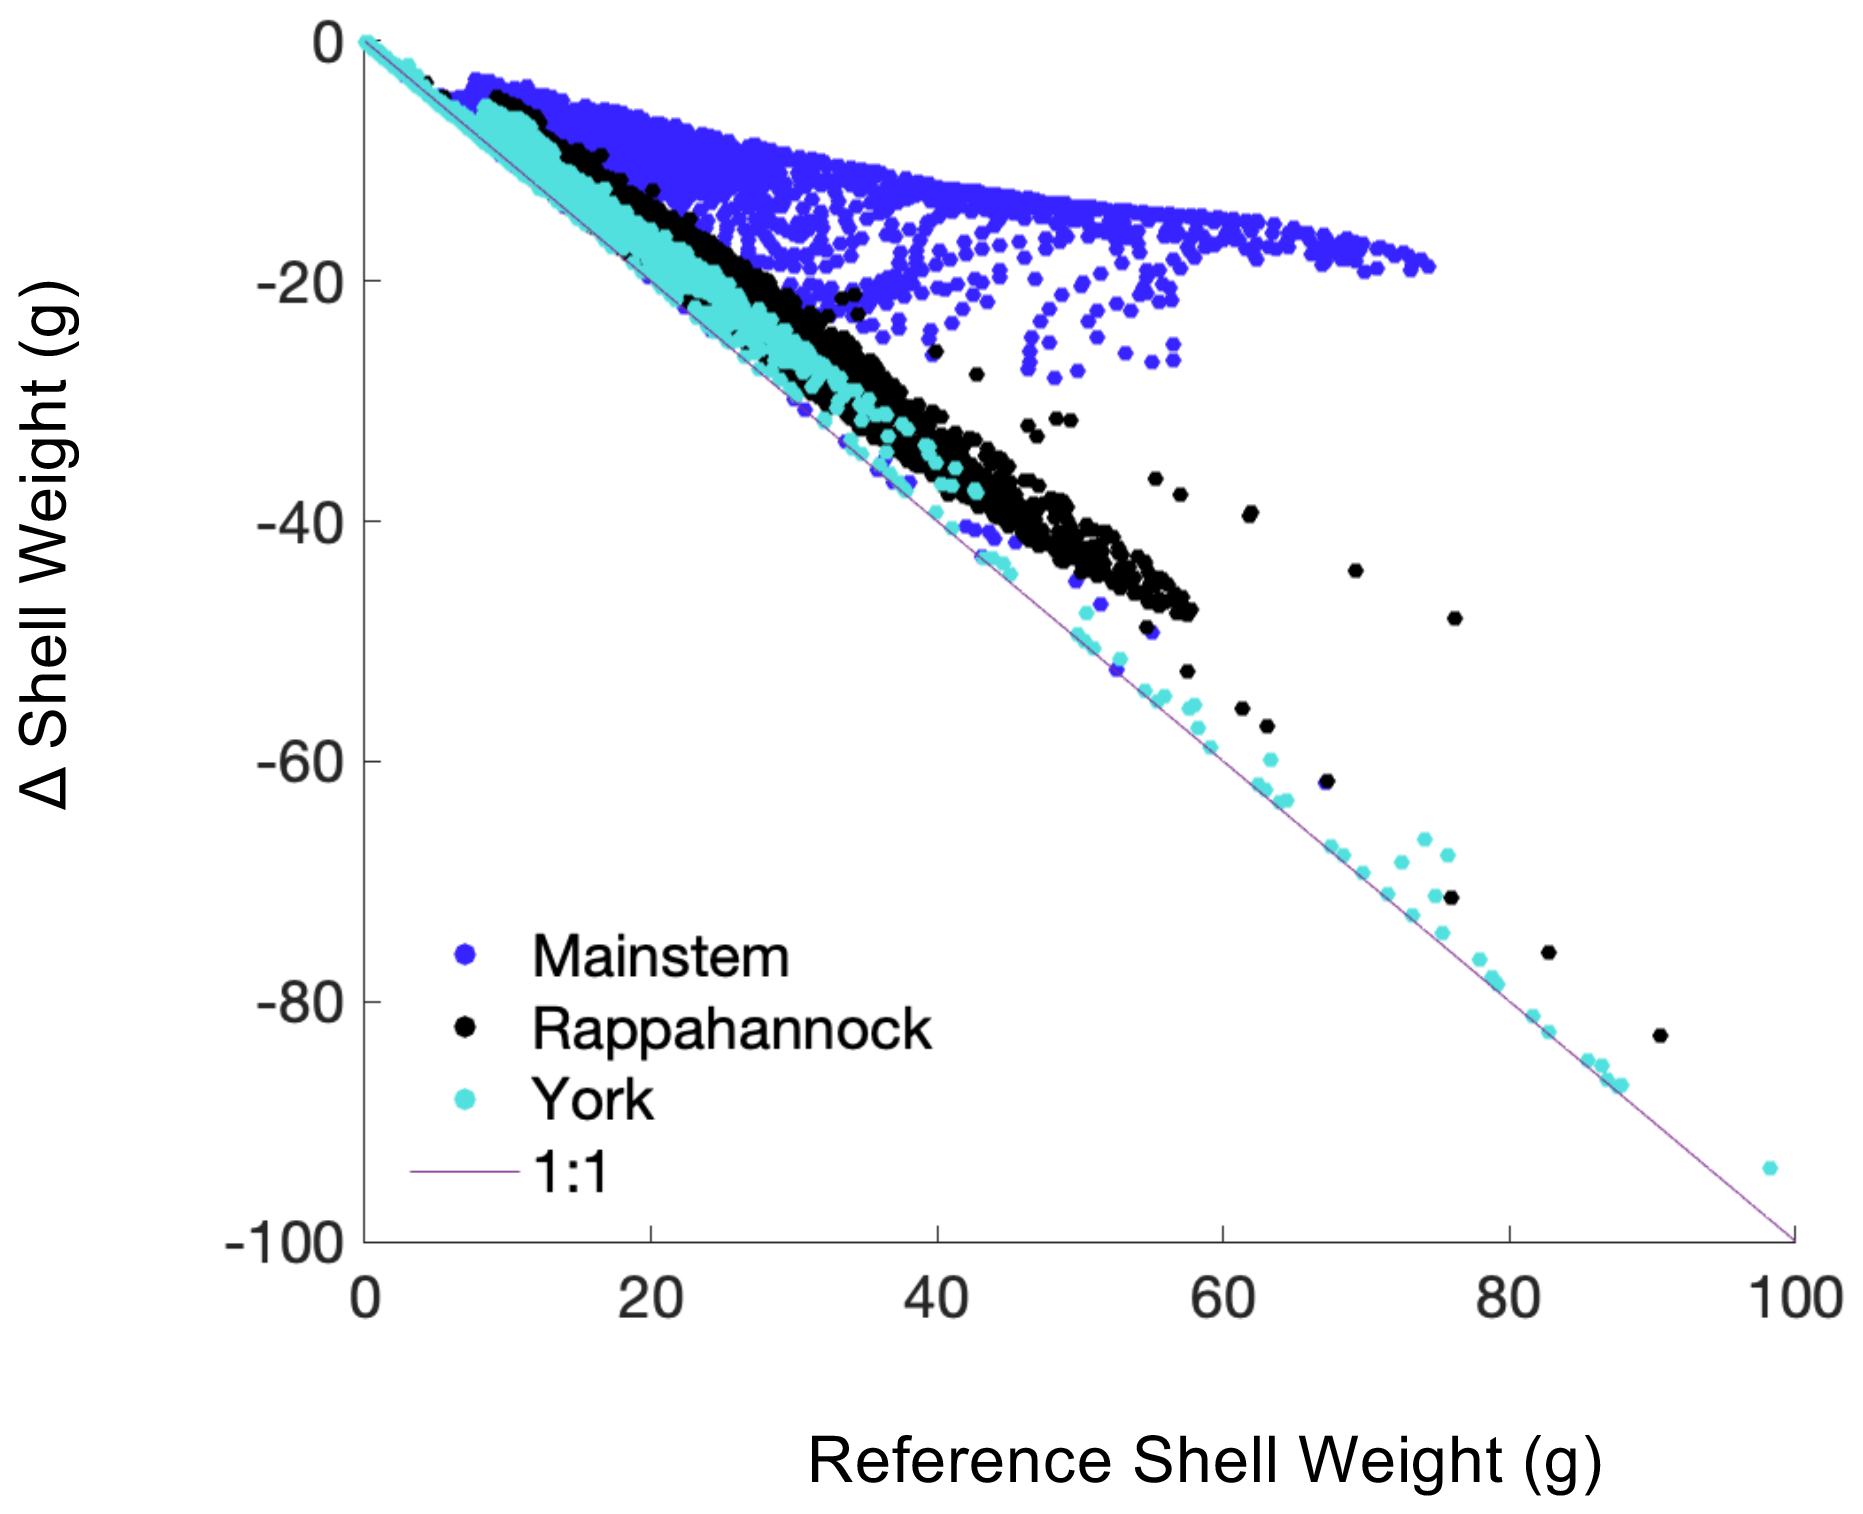
Figure 8Difference in shell weight at the end of the 1-year simulation between the Combined Future run and the reference run, i.e., Combined Future minus reference, colored by region. Each point represents a grid cell where oyster growth occurs in the reference run.
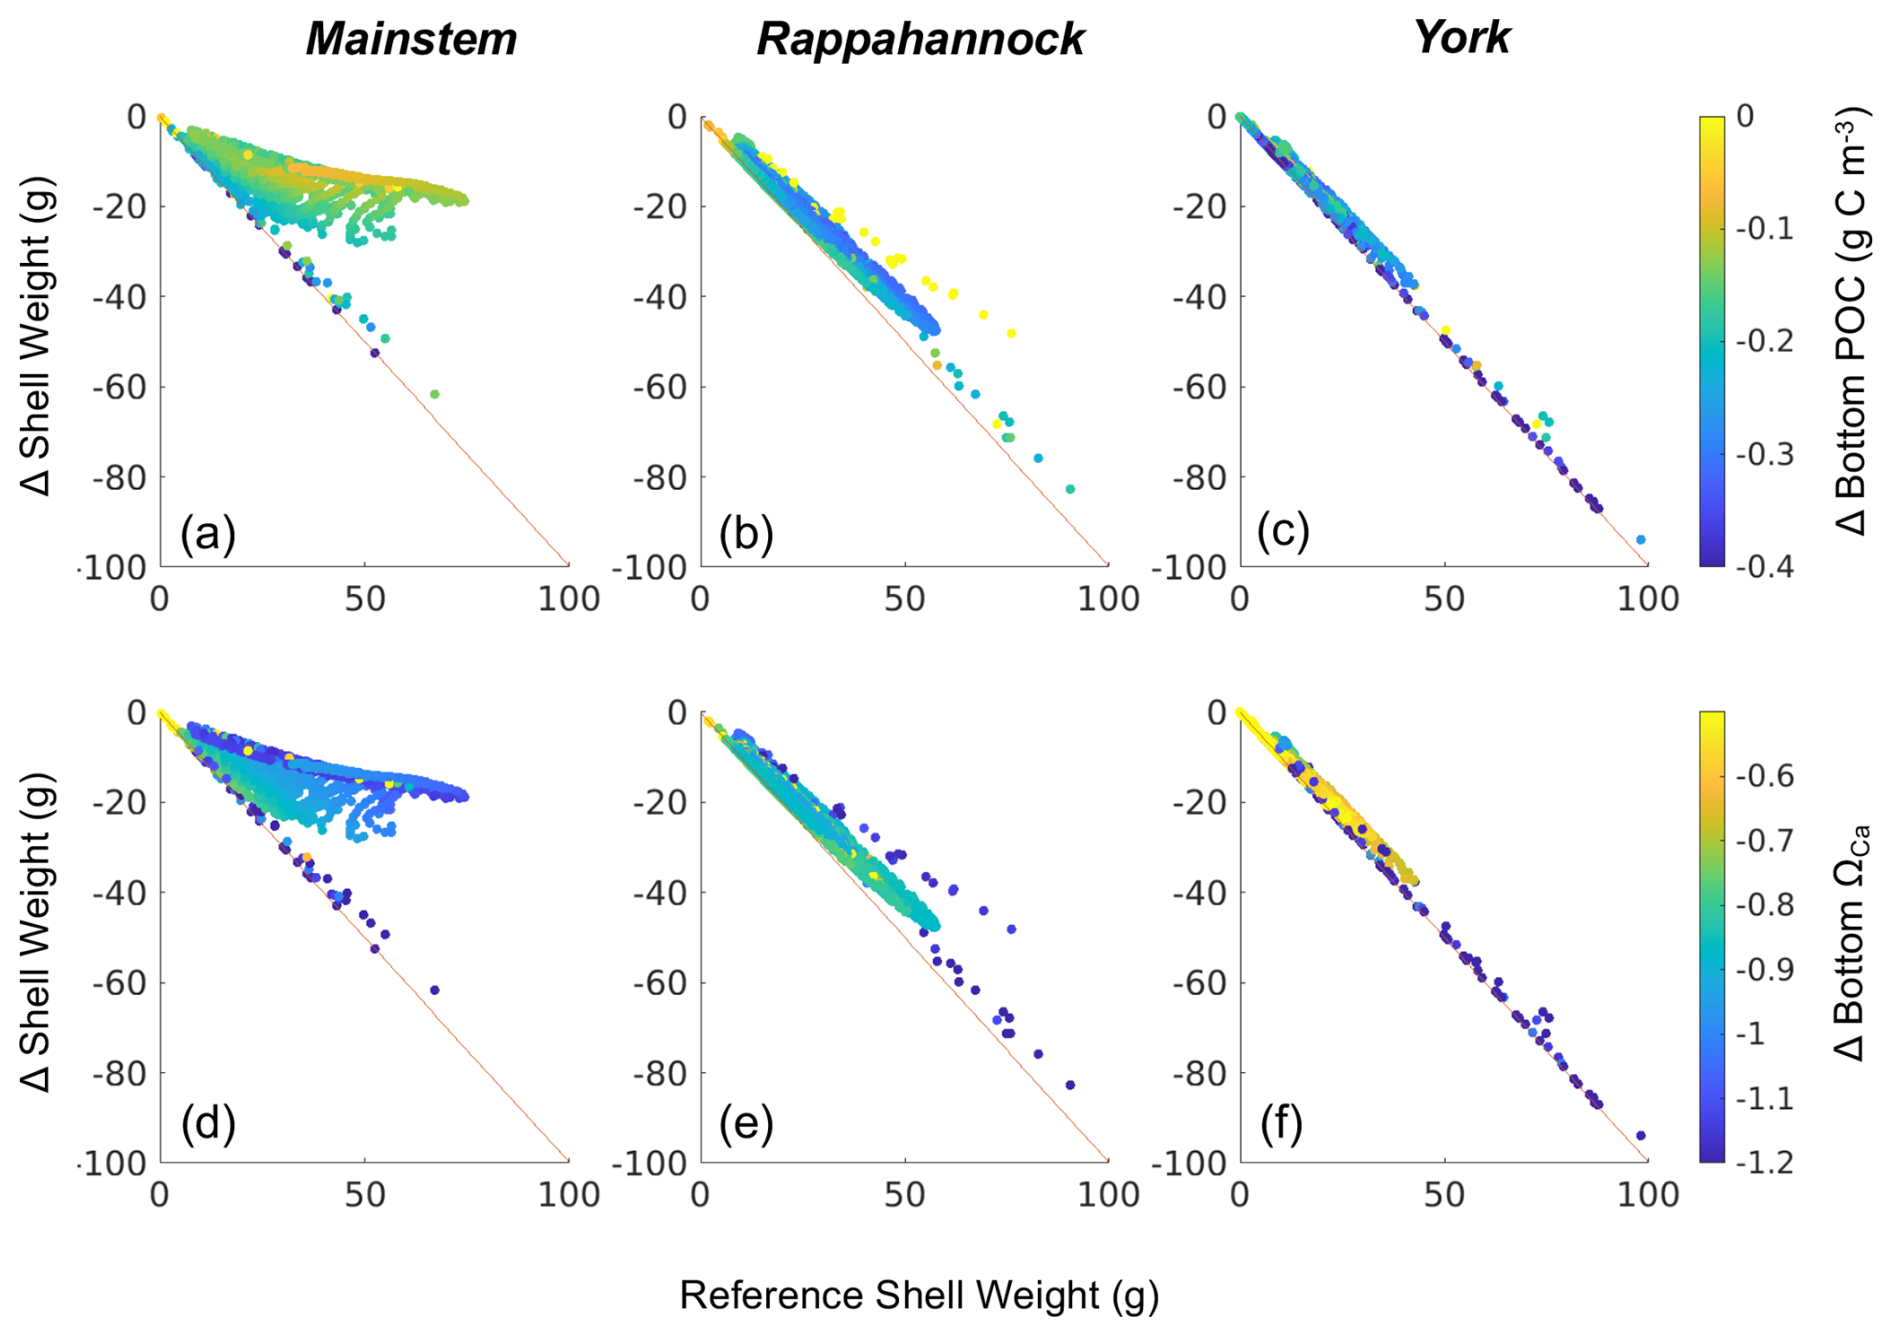
Figure 9Difference in shell weight at the end of the 1-year simulation between the Combined Future run and the reference run colored by (a–c) change in bottom POC and (d–f) change in bottom ΩCa (i.e., Combined Future minus reference) for grid cells that support oyster growth. Results are presented for (a, d) the mainstem shoal only, (b, e) the Rappahannock River only, and (c, f) the York River only.
Declines in year 1 shell weight will vary throughout the model domain (Fig. 8), following relative changes in bottom POC and ΩCa (Fig. 9). The mainstem has the most moderate reduction in shell weight relative to reference shell weight, with an average reduction of 31 %, indicated by the slope of the scatterplot. Shell weights in the Rappahannock and York face the steepest reductions relative to reference, with average reductions of 86 % and 96 %, respectively, and a large portion of York oysters facing complete depletion of oyster tissue and shell in these locations (Fig. 9; indicated by proximity to 1:1 line). Proportional shell weight reductions in the mainstem are projected to correlate with POC reductions (Fig. 9a). For ΩCa in the mainstem, a group of sites face the greatest proportional reductions when ΩCa reductions are the greatest. However, for sites with lower proportional shell loss, the opposite trend is observed (Fig. 9d). In the Rappahannock, higher POC reductions coincide with slightly lower proportional shell loss (Fig. 9b). Sites with the largest reductions in POC primarily occur in the York (Fig. 9c; see dark blue symbols on the 1:1 line) and the greatest proportional shell weight reductions coincide with the greatest POC and ΩCa reductions (Fig. 9c, f). Similar results are found for tissue weight (not shown).
Table 4Modeled oyster characteristics from the end of each simulation (mean ± standard deviation) over grid cells that support oyster growth in the reference run (defined as those with greater than 1g dry tissue weight after 1 year of growth; Fig. S2).
3.4 Results of individual future sensitivity simulations
Four individual future sensitivity simulations were conducted to isolate the specific mechanisms (increased atmospheric CO2, increased atmospheric temperature, and/or nutrient reductions) causing the projected changes described above in the Combined Future simulation. The AtmCO2 sensitivity simulation produces substantial reductions in average bottom ΩCa (Fig. 10d) and, as expected, is not projected to substantially impact bottom temperature, salinity, POC, O2, or TSS (Table 3; Figs. 10a, S4).The projected reduction in ΩCa is 0.9 when averaged over oyster growth sites (Table 3), 0.1 greater in magnitude than the average reduction for the entire model domain (Table S5) as greater reductions are expected along the shoals of the Rappahannock and mainstem shoal than the York and upper section of the Rappahannock (Fig. 10d). In this AtmCO2 simulation, shell weight is predicted to be most steeply reduced in the Rappahannock, with less impact in the York and mainstem regions (Fig. 11a). At grid cells with oyster growth, AtmCO2 produces a shell weight reduction of 6.3 g and a shell thickness reduction of 0.06 g mm−1 in comparison to the reference simulation, but no change in tissue weight (Table 4).
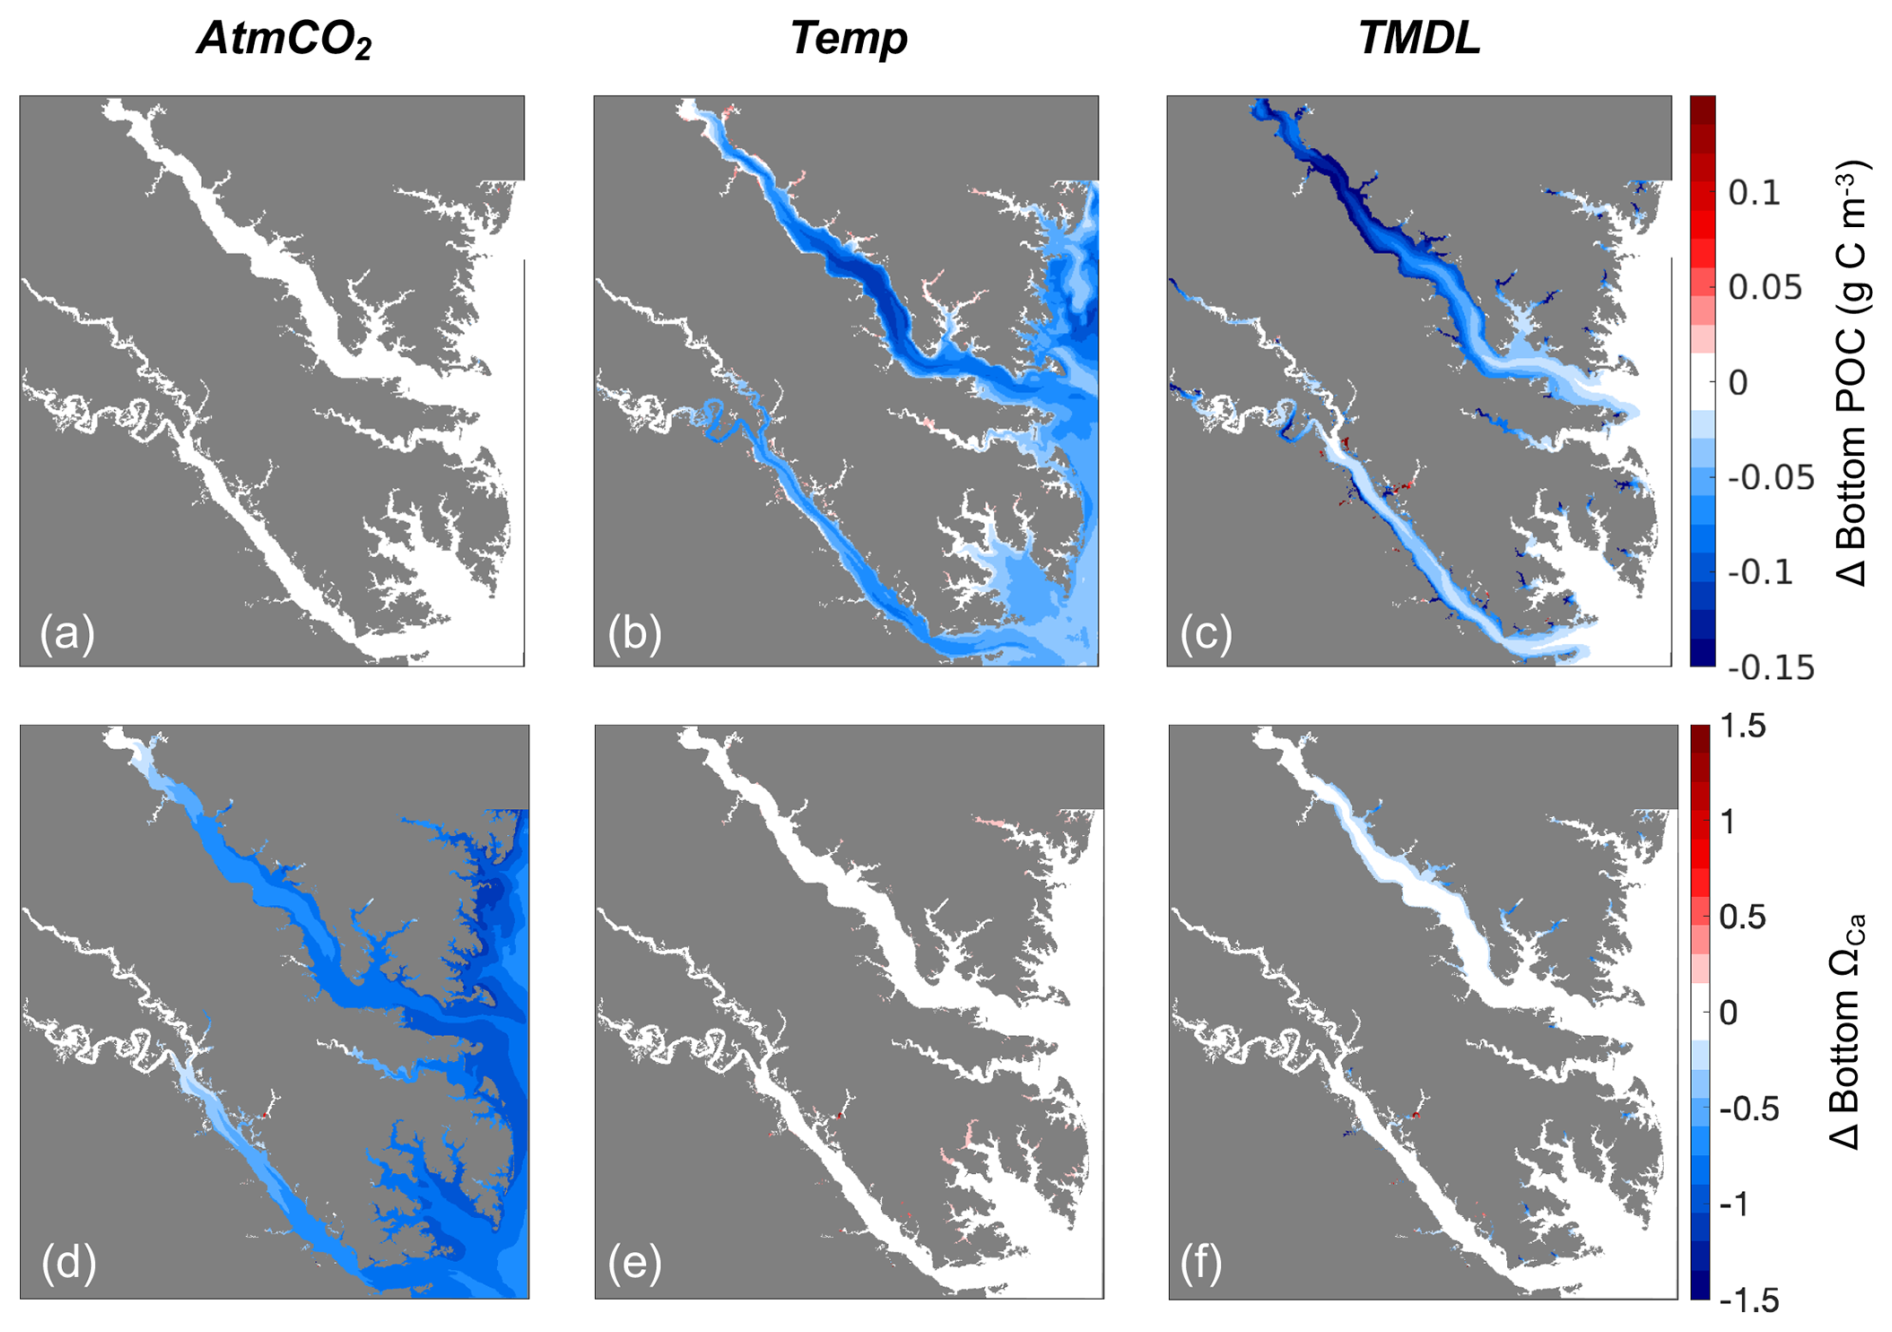
Figure 10Differences in annual averaged (a–c) bottom POC and (d–f) bottom ΩCa (d–f) for three sensitivity experiments: (a, d) AtmCO2, (b, e) Temp, and (c, f) TMDL. Differences represent future results minus those from the present-day reference run.
The Temp sensitivity simulation produces changes in all environmental variables impacting oyster growth, with the exception of ΩCa (Tables 3, S5). Average changes in temperature, salinity, and TSS will be identical to those from the Combined Future simulation (Tables 3, S5). Predicted reductions in POC and O2 will be smaller in magnitude than in Combined Future, though more severe than any other single sensitivity experiment (Tables 3, S5). Temperature and salinity will increase across the entire model domain, with a greater salinity increase occurring in the Rappahannock and along the mainstem shoal (Fig. S4a–c). TSS will decrease primarily in the channels of the lower York and Rappahannock and on the mainstem shoal (Fig. S4d). POC reductions are expected to cover the majority of the model domain, with larger reductions in the upper Rappahannock (Fig. 10b). Slight increases in ΩCa are observed in shallow tidal creeks (Fig. 10e); however, no substantial change in average ΩCa is predicted (Tables 3, S5). O2 at oyster grid cells will exhibit a similar but slightly smaller average reduction compared to Combined Future (Table 3). Patterns of change in shell weight in the Temp sensitivity simulation resemble those in the AtmCO2simulation (Figs. 7c, 11b), with additional reductions along the mainstem shoal and a greater predicted mean reduction of 7.1 g, a 42 % decrease at grid cells with oyster growth (Table 4). Unlike AtmCO2, tissue weight will decrease in Temp by an average of 1 g, which is a 46 % reduction (Table 4).
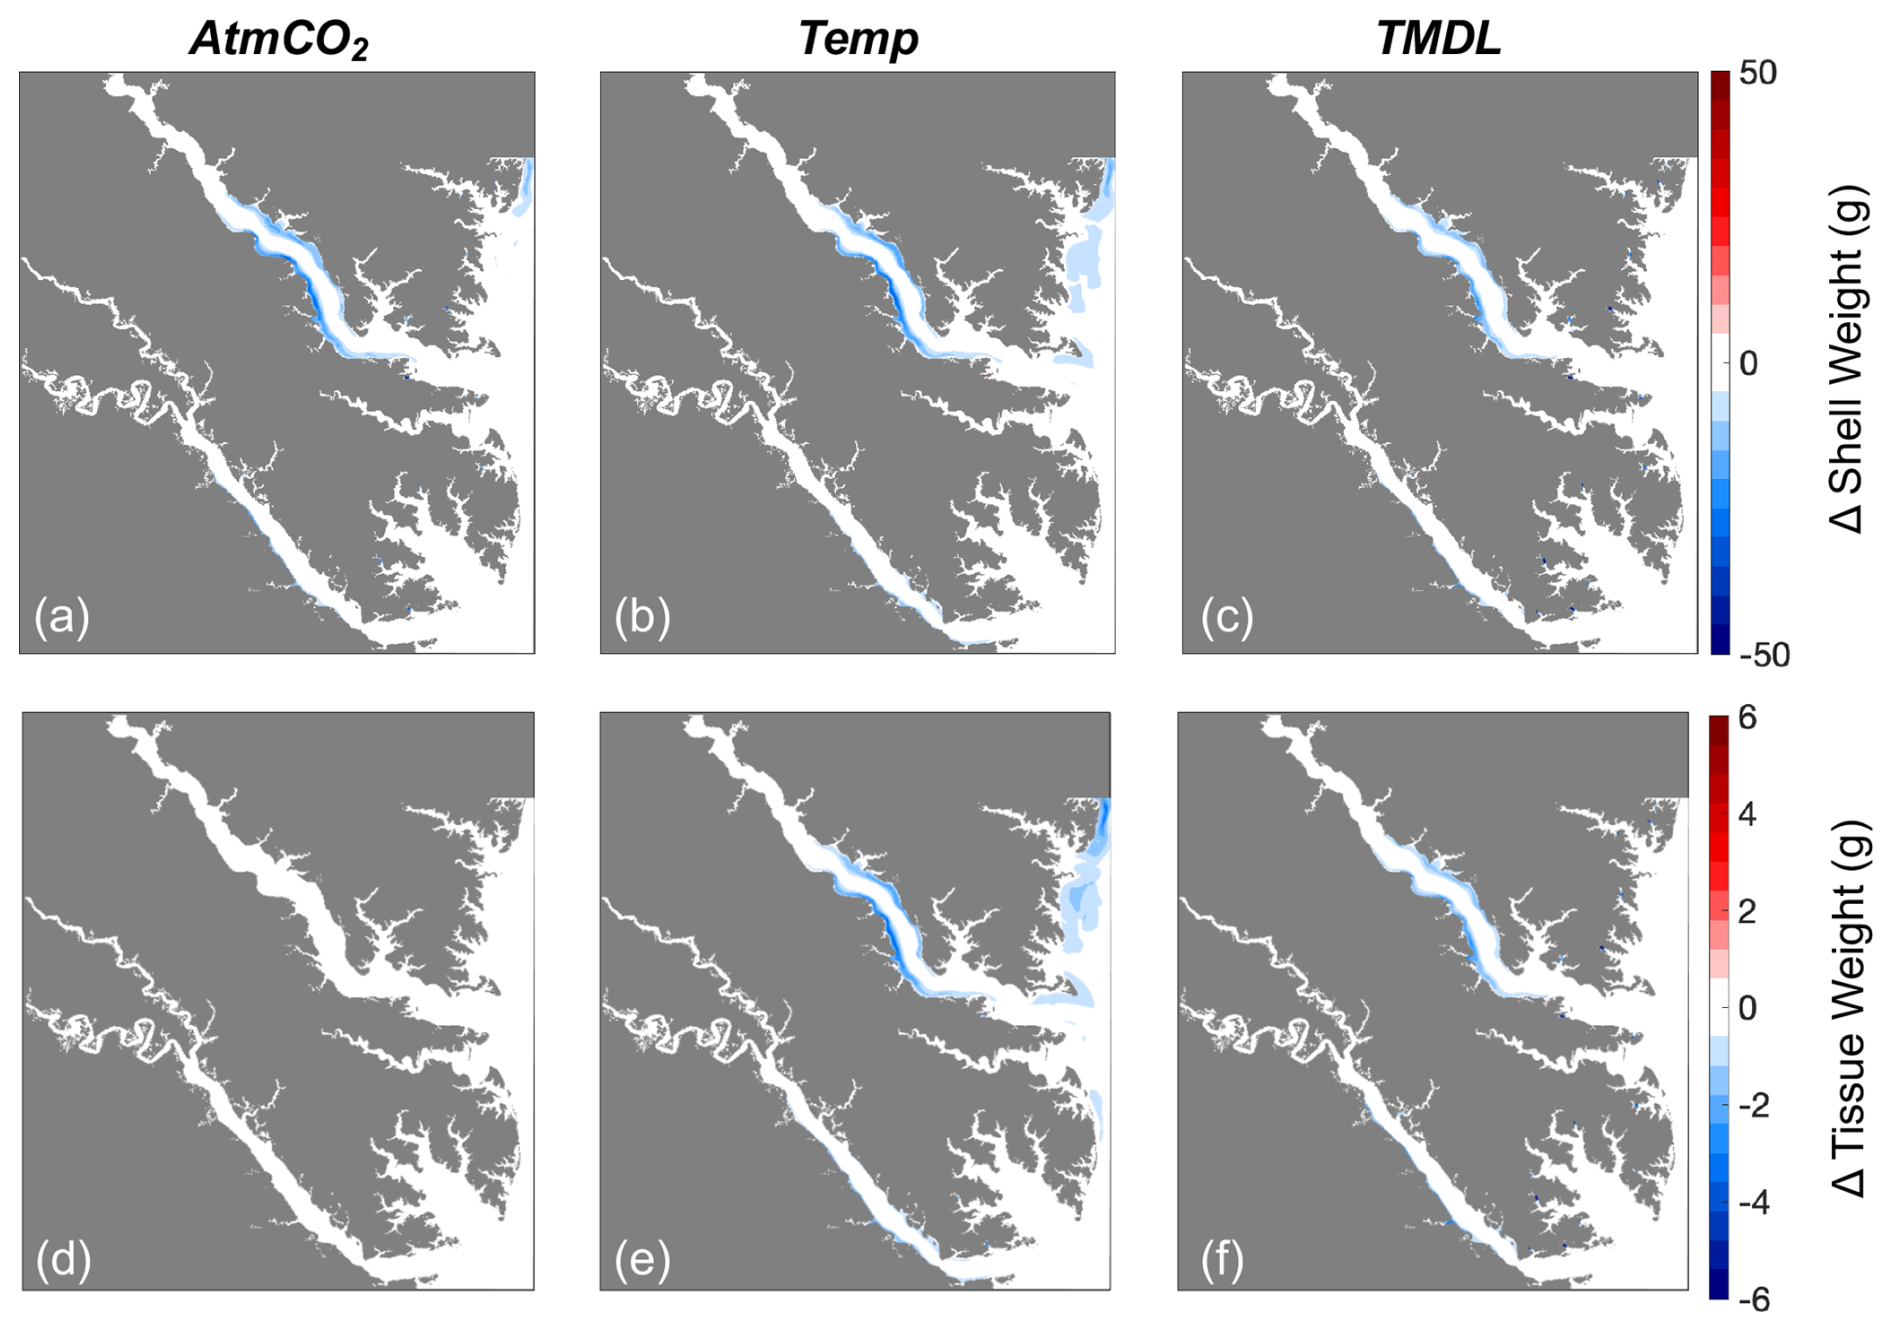
Figure 11Differences in (a–c) shell weight and (d–f) tissue weight at the end of the 1-year simulation for three sensitivity experiments: (a, d) AtmCO2, (b, e) Temp, and (c, f) TMDL. Differences represent future results minus those from the present-day reference run.
The TMDL sensitivity simulation produces a much smaller average change in environmental conditions than the AtmCO2 or Temp simulations (Tables 3, S5). TMDL does not substantially influence temperature, salinity, or O2 (Tables 3, S4, S5), but produces POC and TSS reductions close to the averages for Temp (Tables 3, S5). While POC change in the Temp simulation is concentrated in the deeper portions of the tributaries (Fig. 10b), the POC reductions in the TMDL simulation are concentrated along the shoals of the tributaries, with the greatest reductions in the upper Rappahannock (Fig. 10c). TSS changes in TMDL are limited to the tributaries, occurring along the shoals of the Rappahannock and in patches throughout the York (Fig. S4d). Future change in ΩCa in this simulation is less than for AtmCO2 and is largely confined to the upper Rappahannock shoals and in shallow tidal creeks throughout the study region (Fig. 10d, f). Patterns of change in shell weight will resemble AtmCO2 and Temp in the tributaries, but no change is predicted along the mainstem shoal (Fig. 11a–c). The TMDL simulation produces reduced shell (3.7 g) and tissue (0.5 g) weights, with a smaller negative influence on shell and tissue weight than Temp (Table 4; Fig. 11b–f).
Environmental conditions in the AtmCO2+ Temp simulation are nearly identical to those in the Temp simulation (Tables 3, S5), with the exception of ΩCa, which is lower due to the influence of heightened atmospheric CO2. As tissue growth is unaffected by ΩCa, tissue weight in this simulation is identical to that of the Temp simulation (Table 4). Average shell weight reduction in AtmCO2 + Temp is 10.2 g, greater than that from AtmCO2alone, due to the combined influences of lowered tissue growth and lower ΩCa (Table 4).
This study provides high-resolution projections for oyster growing conditions and corresponding oyster growth in the Chesapeake Bay, with a specific focus on two Virginia tributaries. A high-resolution hydrodynamic-biogeochemical model was coupled with an Eastern oyster growth model and forced with future projections for atmospheric CO2, temperature, and nutrient management. Overall reductions in ΩCa and oyster growth are predicted by mid-century throughout the study region under the combined effects of all three future stressors. Specifically, the greatest reductions in oyster growth are projected to occur in the York and Rappahannock Rivers, where unfavorable conditions for calcification will expand in the future and where food availability will be strongly impacted by warming and nutrient reductions. Bottom conditions in the York and Rappahannock rivers, particularly in the upper portions, will likely be unsuitable for aquaculture at mid-century on average, indicating climate change preparedness is critical for the oyster aquaculture industry.
4.1 Future projections of ΩCa
The magnitude of future change in ΩCa varies with present-day ΩCa conditions (Fig. 6d–f). Regions with high present-day ΩCa, primarily the mainstem shoals, are projected to experience the greatest reductions because of their low partial pressure of CO2 (pCO2) relative to fresher waters. Biologically driven low pCO2 water on mainstem shoals has a greater capacity for CO2 uptake from the atmosphere than high pCO2 water, which is causing the fresher tributaries to experience smaller increases in DIC and smaller reductions in ΩCa (Fig. 6f). Acidic freshwater input often causes pCO2 in the upper tributaries to exceed atmospheric pCO2, causing outgassing (Cai et al., 2017; Shen et al., 2019b; St-Laurent et al., 2020; Cai et al., 2021). Despite the lower Rappahannock having a lower salinity than the lower York, it also has a lower DIC to TA ratio, so the rate at which the lower Rappahannock absorbs pCO2 is higher (Da et al., 2021). Total alkalinity, or buffering capacity, is also lower in the lower Rappahannock than the lower York (Da et al., 2021), so the lower Rappahannock cannot resist changes in carbonate chemistry to the same degree as the York. As a result, we observe the Rappahannock changing faster than the York (Figs. 6f, 9). Since higher ΩCa regions will experience greater reductions than lower ΩCa regions (Fig. 6d–f), the overall spatial variability of ΩCa will be reduced by mid-century, and more areas will experience conditions that are unfavorable for oyster shell-building (Fig. 5).
Although future atmospheric CO2 and reduced nutrient loading will both contribute to ΩCa reductions, the modeling experiments conducted here highlight that increasing atmospheric CO2 is the largest contributor to decreases in ΩCa throughout the study region. Increased atmospheric CO2 will cause reductions in ΩCa across the model domain, while nutrient reductions are expected to mainly influence ΩCa in shallow and fresh coastal areas, with little influence in oyster growing regions. The effects of warming on ΩCa may slightly offset the influence of atmospheric CO2 in certain areas, but this will likely only occur in fresh tidal creeks where oysters do not currently reside (Fig. 10e). Given the importance of atmospheric CO2 in shaping future ΩCa conditions in the lower bay, reductions in anthropogenic carbon emissions will be necessary to lessen the projected impacts on carbonate chemistry in the Chesapeake Bay and globally.
Comparing our results to other studies examining the effects of acidification reveals that the Chesapeake Bay will likely acidify faster than the US West Coast. Siedlecki et al. (2021a) projected a decrease of 0.8–1.0 in ΩCa in the Northern California Current System between 2000 and 2100 under the same future emissions scenario used in our study, i.e., RCP8.5. Projections from the present work indicate a similar magnitude of reduction in the lower Chesapeake Bay over a shorter time period (50 years), suggesting a faster rate of acidification in the lower bay. Feely et al. (2009) also reported that projections for ΩCa reductions are slightly greater in the Atlantic than in the Pacific. The relative differences in rates of acidification should be considered, however, in the context of present-day ΩCa. The Pacific Ocean has a higher ratio of DIC : TA than the Atlantic, so present-day Pacific ΩCa is lower (Feely et al., 2004; Dunne et al., 2012). Therefore, while the Chesapeake Bay is acidifying faster, coastal Pacific waters may become undersaturated with calcite and aragonite sooner than in Chesapeake Bay. US West Coast shellfish mortality events associated with acidification or other climate change stressors may place increased pressure on US Atlantic fisheries to provide shellfish to the nation, highlighting the importance of climate change preparedness and resilience in the Chesapeake Bay region.
While atmospheric CO2 is primarily responsible for changes in ΩCa, nutrient reductions are also projected to worsen carbonate chemistry conditions. Although eutrophication can suppress acidification in surface waters by increasing primary production (Borges and Gypens, 2010; Shen et al., 2019a; Da et al., 2021), when simulating a reduction in eutrophication via nutrient management in our modeling study, the countering effect occurred. While the reduction in ΩCa from nutrient management is minor compared to the projected impacts of CO2-driven acidification, its small contribution may shift ΩCa conditions from favoring net calcification to favoring net dissolution, demonstrating the importance of considering multiple drivers when predicting exposure to ecologically relevant conditions of coastal acidification.
4.2 Future projections of oyster growth
Acidification, warming, and nutrient reductions are projected to affect shell and tissue growth of oysters in different ways. Here, increased atmospheric CO2 caused reductions in shell growth of Eastern oysters due to its negative effect on ΩCa and thus calcification rates, which is consistent with experimental studies (Waldbusser et al., 2011; Gobler and Talmage, 2014; Himes et al., 2024). Shell weight reductions from increased atmospheric CO2 were driven by changes in calcification rate alone, as tissue weight in EcoOyster is unaffected by ΩCa (Fig. 11d; Rivest et al., 2020). Experimental studies have identified indirect physiological impacts of elevated CO2 on juvenile/adult oyster metabolism, growth, and reproduction (Beniash et al., 2010; Dickinson et al., 2011), suggesting that increased atmospheric CO2 can sometimes influence tissue growth. Further investigation is necessary in order to include the relationship between atmospheric CO2 and oyster tissue growth in EcoOyster. Biological and chemical reactions occur faster at higher temperatures, meaning calcification rates may be higher under future warming conditions (Waldbusser et al., 2011), as long as ΩCa is still high enough to support calcification. Conversely, under conditions of extreme low ΩCa, warming may exacerbate dissolution rates and shell weight reductions. Our results also show that nutrient reductions will lead to reductions in shell weight, largely driven by a reduction in tissue weight resulting from lower food availability (POC), rather than lower ΩCa.
While nutrient reductions are projected to have little influence on ΩCa in this study, their negative influence on food availability may be detrimental to tissue growth in certain parts of the study region, particularly the York River. Our model projections suggest that nutrient reductions may in some cases produce conditions that do not support any oyster growth along the shoals of the York (Fig. 9c, f), a result of reductions in food availability that are predicted to be more substantial in the tributaries than the mainstem region (Fig. 10c). Multiple studies have demonstrated that Eastern oysters and other calcifying organisms perform better under acidification when they have sufficient food availability, as they are better able to keep up with the energetic demands of environmental stress (Thomsen et al., 2015; Ramajo et al., 2016; Schwaner et al., 2023, Caillon et al., 2025). Therefore, nutrient reductions will likely influence oyster growth under acidification stress by different magnitudes in each tributary. When comparing the effects of local management actions to reduce nutrient runoff to the effects of climate change (increased atmospheric CO2 and warming), it is evident that, on average, climate change will have a much greater negative influence on oyster growth (Table 4). However, the strong localized impacts of nutrient reductions in the York highlight the importance of examining the spatial variability of future changes in oyster growth. It is important for managers to consider local conditions when assessing the effects of nutrient reductions on oyster production.
Increased water temperatures are projected to slow oyster growth in the future. Specifically, large reductions in tissue weight are underpinned by three primary mechanisms: limitations on filtration at high temperatures (Loosanoff, 1958), increased respiration rates (Dame, 1972), and reduced food availability. In EcoOyster, the optimal temperature for Eastern oyster filtration is 27 °C (Cerco and Noel, 2005; Jordan, 1987), and under warming, the frequency at which ambient summer temperatures will surpass this optimal temperature will be higher (Fig. 5a), therefore causing more frequent declines in filtration rate (Cerco and Noel, 2005; Fulford et al., 2007). There is no clear optimal temperature for oyster respiration, and therefore it is assumed to increase exponentially with temperature (Hochachka and Somero, 2002). Thus, as oyster filtration rates begin to decline at high temperatures, respiration rates will continue to rise and decrease the potential for tissue accumulation (Fig. S1). Previous studies on juvenile Eastern oysters do not support a consensus on the relationship between warming and tissue growth. Some report that growth is inhibited at higher temperatures (31 °C, Stevens and Gobler, 2018; 30 °C, Speights et al., 2017). In contrast, Talmage and Gobler (2011) found no significant influence of high temperature (28 °C) alone on tissue growth. The optimal temperature for oyster filtration may also vary among oysters, based on observations of maximum filtration rates of adult Eastern oysters occurring between 28.1–32 °C (Loosanoff, 1958). Variation in experimental design may have contributed to the contrast in results summarized here, in addition to the influence of local adaptation (Burford et al., 2014). Other studies that incorporate higher temperature thresholds into their models predict increases in oyster biomass under warming in Chesapeake Bay (Allen et al., 2023), underscoring the importance of properly parameterizing growth models. Additional modeling studies should be conducted to test the sensitivity of oyster growth changes to optimal temperature parameterizations. Due to a lack of consensus on temperature limits of Eastern oyster filtration, further research is also needed to more robustly represent oyster filtration in bioenergetics models and improve predictions of impacts of warming on oysters and their ecosystem services in the region.
Warming will likely have a negative effect on food availability for oysters. Compared to the effects of nutrient reductions, warming will have a much more widespread influence on POC, causing reductions throughout the model domain (Fig. 10b, c). Despite warming increasing rates of POC production via increased phytoplankton growth rates, factors such as nutrient limitation and increased respiration rates will result in a net decrease in POC availability. In the tributaries, reductions in food availability will be most widespread due to warming, but less extreme than those from nutrient reductions in the shallow parts of the tributaries where oysters are affected. Remineralization of organic carbon in marine systems is temperature-dependent (López-Urrutia et al., 2006), and as warming occurs, remineralization of detrital carbon to DIC in bottom waters will occur at higher rates. As much of the lower bay is nutrient-limited (Zhang et al., 2021), phytoplankton growth rates will not increase much from warming alone; therefore, increased remineralization will likely reduce the overall amount of food available to oysters. Despite a similar average reduction in food availability being predicted for the future warming simulation and managed nutrient reductions simulation, the influence of warmer temperatures will amplify the negative effects of reduced food availability on growth. In this study, the critical temperature at which respiration rates exceed assimilation rates is dependent on filtration. When food availability limits filtration, this critical temperature lowers, and the temperature threshold for tissue loss is lowered. Experimental studies have demonstrated how organic carbon may be influenced by both warming and acidification (Simone et al., 2021), but as these dynamics can differ based on nutrient availability, it is important to consider how climate change will influence food webs and nutrient dynamics.
The projected mid-century reductions in oyster growth obtained from this analysis are consistent with the results of other studies that examine oyster growth under similar projected climate change conditions. A study modeling oyster responses to warming and low salinity co-stressors in Barataria Bay, LA, for example, predicts that under a warming and high flow scenario (though without the effects of future nutrient reductions or atmospheric CO2), oysters will experience widespread mortality in fresher parts of the bay by the end of the century (Lavaud et al., 2021). Experimental studies have shown similar negative effects of acidification, warming, lower food availability, and increased freshwater flow on oyster survival (La Peyre et al., 2013; Rybovich et al., 2016; Lowe et al., 2019; Jones et al., 2019). Da (2023) found that the reductions in salinity and ΩCa that result from high discharge events in the York River will increase in extent as climate change progresses and increasingly threaten aquaculture production. In the Chesapeake Bay, extreme precipitation events are predicted to occur more frequently with future climate change, however an overall decline in annual average freshwater discharge is also predicted (Hinson et al., 2024). As a result, the overall impact of freshwater from the land is not projected to change significantly in the future (Hinson et al., 2023). Changes in precipitation were thus not simulated in this study, but future work could examine the dynamics of climate change, salinity, ΩCa, and oyster growth in a year with more heavy rainfall events but lower annual rainfall.
4.3 Influence of future changes in oyster growth on aquaculture
Understanding the relative impacts of global climate change and local nutrient management actions on oyster growth and survival will allow aquaculture producers to anticipate how their oyster stock may respond to these anthropogenic changes. As the effects of climate change are subject to natural interannual variability, the magnitude of acidification and warming in a given year will likely differ (Cai et al., 2021; Moore-Maley et al., 2016; Li et al., 2016), influencing oyster growth through differing mechanisms. Smaller oysters resulting from slower growing times in a particularly warm year may present a different challenge to growers than weak-shelled oysters in a year with lower ΩCa and average temperatures. Mortality may also become a more urgent challenge as summer temperatures warm. A previous study examining commercial performance of Pacific oysters in Brazil found that interannual variability in temperature, Chl a abundance, and climate events influenced survival and growth phase timing (Mizuta et al., 2012). High temperatures inhibited survival of oyster seed in that study, which frequently occurs in Pacific oysters (Crassostrea gigas) during the summer months in Europe and California (Goulletquer et al., 1998; Burge et al., 2007; Malhan et al., 2009). A similar phenomenon has been observed in Eastern oysters; however, mortality events in this species have not been conclusively linked to warmer water temperatures (Guévélou et al., 2019; Brianik and Allam, 2023). The cause is yet to be resolved for either species and remains an area of active research. Nonetheless, the increasing occurrence of spring/summer mortality in Eastern oysters suggests that shifting the time of planting oysters on leases to later in the year may help mitigate the risk of widespread mortality, although the economic tradeoffs involved in shifting the growing season for oysters should be taken into account.
Future climate change and nutrient management are projected to worsen conditions for oyster growth, and the spatial variation in these changes may unevenly influence aquaculture production. While reductions in shell and tissue growth are predicted for nearly all regions where oysters grow, these changes will likely differ based on present-day environmental conditions. Under present-day conditions, the most oyster growth is projected to occur in regions with some of the highest present-day ΩCa and the greatest projected ΩCa reductions, i.e., in the Rappahannock River and mainstem shoals. Some of the most dramatic tissue and shell reductions are projected to occur in the York and upper Rappahannock, where reduced food availability and low ΩCa will limit oyster filtration and shell growth. Oysters in parts of both the Rappahannock and York Rivers will likely face mortality (represented by near complete depletion of oyster shell and tissue) by mid-century (Figs. 8, 9). However, these reductions will not be spatially uniform, underscoring the importance of oyster farm site selection within a tributary. In contrast, oysters grown outside the tributaries are projected to exhibit a smaller decline in growth, indicating greater future opportunity for oyster farming in these locations. Under the business-as-usual climate change trajectory analyzed here, bottom conditions in the tributaries will be less suitable for oyster aquaculture by mid-century, and producers might consider alternate farm locations or shifting production methods toward floating culture to avoid exposure to low ΩCa conditions and access greater food availability.
Beyond reduced oyster growth, aquaculture operations may also be affected in the future by temporal changes in optimal growing conditions. Due to the input of freshwater that lowers DIC and TA and increases pCO2 (Cai et al., 2017, 2021; Da et al., 2024), the greatest magnitude of ΩCa reductions occurs in spring. The majority of oyster growth is projected to occur in the spring and summer (Fig. 5), so changes to growing conditions may be most consequential during these warmer months. Deployment of oyster seed generally begins in the spring and continues into the summer, so it is important for producers to be aware of ambient conditions being experienced by their newly deployed oysters. As spring temperatures warm, phytoplankton blooms will likely occur earlier in the year, shifting the time when food availability is highest (Da et al., 2021). Oysters deployed earlier in the year may benefit from greater food availability and perform better than oysters deployed in July or August when waters are warmest. However, they may also face the challenge of spring/summer mortality events, revealing the complexity of timing oyster deployment under worsening climate change conditions. For oyster farms closer to freshwater sources, the combined effects of low ΩCa, low salinity, and high summer temperatures may severely inhibit growth and extend time-to-market. This study focused on diploid oysters, since the laboratory experiments used to develop the EcoOyster model parameterizations were conducted on diploids. Future laboratory experiments with triploids would enhance our modeling efforts for triploid oysters, which are commonly used in aquaculture in the Chesapeake Bay region.
4.4 Future work
Providing the aquaculture industry with the best existing estimates of climate change impacts to their operations will allow them to make more informed decisions about their future practices. This study used a 120 m horizontal resolution model grid to examine near-lease-level effects of climate change and management actions on oyster growth in a section of the lower Chesapeake Bay. Similar studies with high resolution model grids in other systems will strengthen our understanding of how regional anthropogenic effects will influence the oyster aquaculture sector and could be used to identify areas of opportunity for new aquaculture practices (Swam et al., 2022; Palmer et al., 2021; Lavaud et al., 2024). The present study incorporated one Earth System Model and one emissions scenario; future work should quantify how these choices impact estimates of future ΩCa and oyster growth (e.g., Hinson et al., 2023). Future modeling studies should also incorporate other climate change impacts, such as sea level rise and increased storminess, which are projected to influence conditions for oyster growth in the Chesapeake Bay region (Seneviratne et al., 2012; Lowe et al., 2019; Rybovich et al., 2016; Jones et al., 2019).
To improve estimates of shell and tissue growth of oysters under climate change, additional experimental studies should be conducted to reduce the data gaps that currently limit model formulations. Uncertainties in the functional relationships and rate parameters used in these models may lead to an inaccurate influence of some environmental variables on oyster growth. For example, results in this study may be particularly sensitive to the optimum temperature for filtration rate. Reductions in tissue weight are particularly dramatic when average temperature conditions at oyster lease sites remain above this optimal temperature from mid-June through late August, a vital time for oyster growth. Many physiological studies of temperature impacts on oyster filtration date back to the mid-to-late-20th century, and present-day seasonal extremes that coastal organisms experience may routinely exceed the maximum temperatures used in many of these earlier experimental designs. For example, Jordan (1987) used a maximum temperature of 27 °C, which was the ambient temperature when samples were collected in July from the Choptank River, MD. Between 1985 and 2014, bottom waters of the north mesohaline Bay main stem (closest to the Choptank) warmed 1.01 ± 0.13 °C during May to October (Hinson et al., 2022), and the present study predicts a 1.5 ± 0.26 °C increase across the entire model domain between 2017 and mid-century. To build stronger models of future climate impacts, and to expand scientific understanding of physiological limits of the Eastern oyster, future studies should re-examine temperature limitations on oyster filtration and respiration by using higher experimental temperatures.
As oyster growth is highly sensitive to food availability, improved measurements of particulate organic carbon in the region would fortify projections of oyster production under future climate change and nutrient management. Here, it is assumed that oysters feed on POC, a combination of plankton and detritus. However, average POC concentrations are highly spatiotemporally variable in the Chesapeake Bay due to eutrophication and algal blooms. In this study, POC was underestimated in the tributary channels; however, it is unclear how well POC was estimated in oyster growing areas, as in situ measurements are currently limited to stations in the channels during monthly or semi-monthly sampling cruises. More routine POC measurements, as well as measurements of POC in regions where oyster farming operations occur, are needed to verify the spatiotemporal dynamics of food availability. Improved measurements of oyster food availability would allow for stronger model skill assessment and improved projections of oyster production.
This study predicts widespread reductions in ΩCa in the lower Virginia tributaries of the Chesapeake Bay by mid-century, highlighting the use of high-resolution model projections to better understand present-day carbonate chemistry conditions and to predict the effects of climate change on a region of high interest for aquaculture production. While similar modeling studies have projected acidification conditions in coastal regions with 3D coupled models (Siedlecki et al., 2021a, b; Fujii et al., 2023) or modeled oyster growth with remote-sensing data and dynamic energy budget models (Palmer et al., 2020; Palmer et al., 2021; Bertolini et al., 2021), the present study projects both carbonate chemistry conditions and oyster growth in the Chesapeake Bay with the highest resolution thus far. Specifically, widespread reductions in ΩCa will negatively impact oyster growth, with implications for aquaculture operations and local and regional economies. As bottom conditions worsen, altered site-selection for oyster farms or other adaptive measures will become imperative to sustain production and reduce the impacts of low ΩCa on farmed oysters.
Increased atmospheric CO2 and nutrient reductions are projected to inhibit oyster calcification, while warming and nutrient reductions will reduce oyster tissue and shell growth due to limitations on filtration and lowered food availability. While the effects of global climate change on oyster growth are projected to be much stronger overall than the effects of local nutrient management, lowered food availability from nutrient reductions may have a strong influence on oyster growth in certain parts of the study region. As a result, all areas will not be equally vulnerable to future changes in the atmosphere and watershed. Understanding how individual drivers influence oyster growth is important for predicting effects on aquaculture production in the context of interannual variability of climate change and nutrient management outcomes. While the negative effects of temperature on growth were strong in this study, additional studies on Eastern oyster temperature limits are needed to improve projections, particularly as summer mortality of oysters is already common. Increased in situ measurements of biogeochemical variables and experimental studies on oyster physiology and bioenergetics will allow for improved projections of mid-century conditions and their potential impacts on oyster growth and the aquaculture industry.
Model code will be available upon request.
Model output are available with a DOI on William & Mary ScholarWorks (https://doi.org/10.25773/e4kz-d686, Czajka et al., 2025).
The supplement related to this article is available online at https://doi.org/10.5194/bg-22-3181-2025-supplement.
MAMF, EBR, MJB, and PSL wrote the proposal and acquired the funding for the project; MAMF, PSL, and FD developed the ROMS-ECB code; MJB developed the EcoOyster code; CRC, MAMF, and EBR designed the experiment; CRC ran model simulations, analyzed the output, created the figures, and wrote the manuscript draft; MAMF, EBR, MJB, PSL, and FD reviewed and edited the manuscript.
The contact author has declared that none of the authors has any competing interests.
Publisher's note: Copernicus Publications remains neutral with regard to jurisdictional claims made in the text, published maps, institutional affiliations, or any other geographical representation in this paper. While Copernicus Publications makes every effort to include appropriate place names, the final responsibility lies with the authors.
We would like to thank the VIMS and William & Mary (W&M) high performance computing group for their technical support and computing resources. We also thank the NOAA Chesapeake Bay Program for providing us with watershed inputs from their Phase 6 Watershed Model. This work was largely made possible by Sara Blachman's hard work on the EcoOyster model. We thank Bill Walton for his aquaculture expertise and support throughout the project. The model results used for this paper are available at W&M Scholarworks.
This research has been supported by the Ocean Acidification Program (grant no. NA18OAR0170430).
This paper was edited by Liuqian Yu and reviewed by two anonymous referees.
Abatzoglou, J. T. and Brown, T. J.: A comparison of statistical downscaling methods suited for wildfire applications, Int. J. Clim., 32, 772–780, https://doi.org/10.1002/joc.2312, 2012.
Allen, K. L., Ihde, T., Knoche, S., Townsend, H., and Lewis, K. A.: Simulated climate change impacts on striped bass, blue crab and Eastern oyster in oyster sanctuary habitats of Chesapeake Bay, Estuar. Coast. Shelf Sci., 292, 108465, https://doi.org/10.1016/j.ecss.2023.108465, 2023.
Amaral, V., Cabral, H. N., and Bishop, M. J.: Effects of estuarine acidification on predator–prey interactions, Mar. Ecol. Prog. Ser., 445, 117–127, https://doi.org/10.3354/meps09487, 2012.
Barclay, K. M., Gingras, M. K., Packer, S. T., and Leighton, L. R.: The role of gastropod shell composition and microstructure in resisting dissolution caused by ocean acidification, Mar. Environ. Res., 162, 105105, https://doi.org/10.1016/j.marenvres.2020.105105, 2020.
Barton, A., Waldbusser, G. G., Feely, R. A., Weisberg, S. B., Newton, J. A., Hales, B., Cudd, S., Eudeline, B., Langdon, C. J., Jefferds, I., King, T., Suhrbier, A., and McLaughlin, K.: Impacts of Coastal Acidification on the Pacific Northwest Shellfish Industry and Adaptation Strategies Implemented in Response, Oceanography, 28, 146–159, http://www.jstor.org/stable/24861877, 2015.
Beniash, E., Ivanina, A., Lieb, N., Kurochkin, I., and Sokolova, I.: Elevated level of carbon dioxide affects metabolism and shell formation in oysters Crassostrea virginica (Gmelin), Mar. Ecol. Prog. Ser., 419, 95–108, https://doi.org/10.3354/meps08841, 2010.
Bertolini, C., Brigolin, D., Porporato, E. M. D., Hattab, J., Pastres, R., and Tiscar, P. G.: Testing a Model of Pacific Oysters' (Crassostrea gigas) Growth in the Adriatic Sea: Implications for Aquaculture Spatial Planning, Sustainability, 13, 3309, https://doi.org/10.3390/su13063309, 2021.
Bhatt, G., Linker, L., Shenk, G., Bertani, I., Tian, R., Rigelman, J., Hinson, K., and Claggett, P.: Water quality impacts of climate change, land use, and population growth in the Chesapeake Bay watershed, J. Am. Water Resour. Assoc., 59, 1313–1341, https://doi.org/10.1111/1752-1688.13144, 2023.
Borges, A. V. and Gypens, N.: Carbonate chemistry in the coastal zone responds more strongly to eutrophication than to ocean acidification, Limnol. Oceanogr., 55, 346–353, https://doi.org/10.4319/lo.2010.55.1.0346, 2010.
Brianik, C. J. and Allam, B.: The need for more information on the resistance to biological and environmental stressors in triploid oysters, Aquaculture, 577, 739913, https://doi.org/10.1016/j.aquaculture.2023.739913, 2023.
Brush, M. J. and Kellogg, M. L.: Harris Creek Oyster Restoration Model v2, Virginia Institute of Marine Science, Gloucester Point, VA, https://exchange.iseesystems.com/public/markbrush/harris-creek-model-v2/index.html (last access: 28 January 2024), 2018.
Burford, M., Scarpa, J., Cook, B., and Hare, M.: Local adaptation of a marine invertebrate with a high dispersal potential: evidence from a reciprocal transplant experiment of the eastern oyster Crassostrea virginica, Mar. Ecol. Prog. Ser., 505, 161–175, https://doi.org/10.3354/meps10796, 2014.
Burge, C. A., Judah, L. R., Conquest, L. L., Griffin, F. J., Cheney, D. P., Suhrbier, A., Vadopalas, B., Olin, P. G., Renault, T., and Friedman, C. S.: Summer seed mortality of the pacific oyster, Crassostrea gigas (Thunberg) grown in Tomales Bay, California, USA: the influence of oyster stock, planting time, pathogens, and environmental stressors, J. Shellfish Res, 26, 163–172, 2007.
Cai, W. J. and Wang, Y.: The chemistry, fluxes, and sources of carbon dioxide in the estuarine waters of the Satilla and Altamaha Rivers, Georgia. Limnol. Oceanogr., 43, 657-668, https://doi.org/10.4319/lo.1998.43.4.0657, 1998.
Cai, W., Feely, R. A., Testa, J. M., Li, M., Evans, W., Alin, S. R., Xu, Y.-Y., Pelletier, G., Ahmed, A., Greeley, D. J., Newton, J. A., and Bednaršek, N.: Natural and Anthropogenic Drivers of Acidification in Large Estuaries, Annu. Rev. Mar. Sci., 13, 23–55, https://doi.org/10.1146/annurev-marine-010419-011004, 2021.
Cai, W. J., Huang, W.-J., Luther, G. W., Pierrot, D., Li, M., Testa, J., Xue, M., Joesoef, A., Mann, R., Brodeur, J., Xu, Y.-Y., Chen, B., Hussain, N., Waldbusser, G. G., Cornwell, J., and Kemp, W. M.: Redox reactions and weak buffering capacity lead to acidification in the Chesapeake Bay, Nat. Commun., 8, 369, https://doi.org/10.1038/s41467-017-00417-7, 2017.
Cai, W. J., Xu, Y.-Y., Feely, R. A., Wanninkhof, R., Jönsson, B., Alin, S. R., Barbero, L., Cross, J. N., Azetsu-Scott, K., Fassbender, A. J., Carter, B. R., Jiang, L.-Q., Pepin, P., Chen, B., Hussain, N., Reimer, J. J., Xue, L., Salisbury, J. E., Hernández-Ayón, J. M., Langdon, C., Li, Q., Sutton, A. J., Chen, C.-T. A., and Gledhill, D. K.: Controls on surface water carbonate chemistry along North American ocean margins, Nat. Commun., 11, 2691, https://doi.org/10.1038/s41467-020-16530-z, 2021.
Caldeira, K. and Wickett, M. E.: Anthropogenic carbon and ocean pH, Nature, 425, 365–365, https://doi.org/10.1038/425365a, 2003.
Caillon, C., Fleury, E., Di Poi, C., Gazeau, F., and Pernet, F.: Food availability, but not tidal emersion, influences the combined effects of ocean acidification and warming on oyster physiological performance, Aquaculture, 742459, https://doi.org/10.1016/j.aquaculture.2025.742459, 2025.
Caldeira, K. and Wickett, M. E.: Ocean model predictions of chemistry changes from carbon dioxide emissions to the atmosphere and ocean, J. Geophys. Res.-Ocean., 110, C09S04, https://doi.org/10.1029/2004jc002671, 2005.
Callam, B. R., Allen, S. K., and Frank-Lawale, A.: Genetic and environmental influence on triploid Crassostrea virginica grown in Chesapeake Bay: Growth, Aquaculture, 452, 97–106, https://doi.org/10.1016/j.aquaculture.2015.10.027, 2016.
Carstensen, J. and Duarte, C. M.: Drivers of pH Variability in Coastal Ecosystems, Environ. Sci. Technol., 53, 4020–4029, https://doi.org/10.1021/acs.est.8b03655, 2019.
Cerco, C. and Noel, M.: Process-based primary production modeling in Chesapeake Bay, Mar. Ecol. Prog. Ser., 282, 45–58, https://doi.org/10.3354/meps282045, 2004.
Cerco, C.F and Noel, M. R.: Evaluating ecosystem effects of oyster restoration in Chesapeake Bay, Report of US Army Engineer Research and Development Center, https://www.chesapeakebay.net/what/publications/ (last access: 28 January 2024), 2005.
CBP (Chesapeake Bay Program): CBP Water Quality Database (1984-present), https://www.chesapeakebay.net/what/downloads/cbp-water-quality-database-1984-present, last access: 28 January 2024.
Copernicus Climate Change Service: ERA5: Fifth Generation of ECMWF Atmospheric Reanalyses of the Global Climate, Copernicus Climate Change Service Climate Data Store (CDS), https://cds.climate.copernicus.eu/datasets (last access: 28 January 2024), 2017.
Czajka, C. R., Friedrichs, M. A. M., Rivest, E. B., St-Laurent, P., Brush, M. J., and Da, F.: Dataset: Acidification, warming, and nutrient management are projected to cause reductions in shell and tissue weights of oysters in a coastal plain estuary, William and Mary ScholarWorks [data set], https://doi.org/10.25773/e4kz-d686, 2025.
Da, F.: Chesapeake Bay Carbon Cycle: Past, Present, Future, PhD. Dissertation, Virginia Institute of Marine Science, William & Mary, Virginia, USA, https://doi.org/10.25773/v5-46f7-e286, 2023.
Da, F., Friedrichs, M. A. M., St-Laurent, P., Shadwick, E. H., Najjar, R. G., and Hinson, K. E.: Mechanisms Driving Decadal Changes in the Carbonate System of a Coastal Plain Estuary, J. Geophys. Res.-Ocean., 126, e2021JC017239, https://doi.org/10.1029/2021jc017239, 2021.
Da, F., Friedrichs, M. A. M., St-Laurent, P., Najjar, R. G., Shadwick, E. H., and Stets, E. G.: Influence of Rivers, Tides, and Tidal Wetlands on Estuarine Carbonate System Dynamics, Estuar. Coast., 47, 2283–2305, https://doi.org/10.1007/s12237-024-01421-z, 2024.
Dame, R. F.: The ecological energies of growth, respiration and assimilation in the intertidal American oyster Crassostrea virginica, Mar. Biol., 17, 43–250, 1972.
Dayton, P. K.: Toward an understanding of community resilience and the potential effects of enrichments to the benthos at McMurdo Sound, Antarctica, Proceedings of the colloquium on conservation problems in Antarctica, 81–96, 1972.
Dégremont, L., Garcia, C., Frank-Lawale, A., and Allen, S. K.: Triploid Oysters in the Chesapeake Bay: Comparison of Diploid and Triploid Crassostrea virginica, J. Shellfish Res., 31, 21–31, https://doi.org/10.2983/035.031.0103, 2012.
Dickinson, G. H., Ivanina, A. V., Matoo, O. B., Pörtner, H. O., Lannig, G., Bock, C., Beniash, E., and Sokolova, I. M.: Interactive effects of salinity and elevated CO2 levels on juvenile eastern oysters, Crassostrea virginica, J. Exp. Biol., 215, 29–43, https://doi.org/10.1242/jeb.061481, 2011.
Dinauer, A. and Mucci, A.: Spatial variability in surface-water pCO2 and gas exchange in the world's largest semi-enclosed estuarine system: St. Lawrence Estuary (Canada), Biogeosciences, 14, 3221–3237, https://doi.org/10.5194/bg-14-3221-2017, 2017.
Doney, S. C., Fabry, V. J., Feely, R. A., and Kleypas, J. A.: Ocean acidification: the other CO2 problem., Annu. Rev. Mar. Sci., 1, 169–92, https://doi.org/10.1146/annurev.marine.010908.163834, 2009.
Dong, S., Lei, Y., Li, T., Cao, Y., and Xu, K.: Biocalcification crisis in the continental shelf under ocean acidification. Geosci. Front., 14, 101622, https://doi.org/10.1016/j.gsf.2023.101622, 2023.
Du, J., Shen, J., Park, K., Wang, Y. P., and Yu, X.: Worsened physical condition due to climate change contributes to the increasing hypoxia in Chesapeake Bay, Sci. Total Environ., 630, 707–717, https://doi.org/10.1016/j.scitotenv.2018.02.265, 2018.
Dufresne, J.-L., Foujols, M.-A., Denvil, S., Caubel, A., Marti, O., Aumont, O., Balkanski, Y., Bekki, S., Bellenger, H., Benshila, R., Bony, S., Bopp, L., Braconnot, P., Brockmann, P., Cadule, P., Cheruy, F., Codron, F., Cozic, A., Cugnet, D., Noblet, N. de, Duvel, J.-P., Ethé, C., Fairhead, L., Fichefet, T., Flavoni, S., Friedlingstein, P., Grandpeix, J.-Y., Guez, L., Guilyardi, E., Hauglustaine, D., Hourdin, F., Idelkadi, A., Ghattas, J., Joussaume, S., Kageyama, M., Krinner, G., Labetoulle, S., Lahellec, A., Lefebvre, M.-P., Lefevre, F., Levy, C., Li, Z. X., Lloyd, J., Lott, F., Madec, G., Mancip, M., Marchand, M., Masson, S., Meurdesoif, Y., Mignot, J., Musat, I., Parouty, S., Polcher, J., Rio, C., Schulz, M., Swingedouw, D., Szopa, S., Talandier, C., Terray, P., Viovy, N., and Vuichard, N.: Climate change projections using the IPSL-CM5 Earth System Model: from CMIP3 to CMIP5, Clim. Dynam., 40, 2123–2165, https://doi.org/10.1007/s00382-012-1636-1, 2013.
Dunne, J. P., John, J. G., Adcroft, A. J., Griffies, S. M., Hallberg, R. W., Shevliakova, E., Stouffer, R. J., Cooke, W., Dunne, K. A., Harrison, M. J., Krasting, J. P., Malyshev, S. L., Milly, P. C. D., Phillipps, P. J., Sentman, L. T., Samuels, B. L., Spelman, M. J., Winton, M., Wittenberg, A. T., and Zadeh, N.: GFDL's ESM2 Global Coupled Climate–Carbon Earth System Models. Part I: Physical Formulation and Baseline Simulation Characteristics, J. Clim., 25, 6646–6665, https://doi.org/10.1175/jcli-d-11-00560.1, 2012.
EPA: Chesapeake Bay Total Maximum Daily Load for Nitrogen, Phosphorus, and Sediment, United States Environmental Protection Agency, 2010.
Ehrich, M. K. and Harris, L. A.: A review of existing eastern oyster filtration rate models, Ecol. Model., 297, 201–212, https://doi.org/10.1016/j.ecolmodel.2014.11.023, 2015.
Feely, R. A., Sabine, C. L., Lee, K., Berelson, W., Kleypas, J., Fabry, V. J., and Millero, F. J.: Impact of Anthropogenic CO2 on the CaCO3 System in the Oceans, Science, 305, 362–366, https://doi.org/10.1126/science.1097329, 2004.
Feely, R. A., Doney, S. C., and Cooley, S. R.: Ocean Acidification: Present Conditions and Future Changes in a High-CO2 World, Oceanography, 22, 36–47, https://doi.org/10.5670/oceanog.2009.95, 2009.
Feng, Y., Friedrichs, M. A. M., Wilkin, J., Tian, H., Yang, Q., Hofmann, E. E., Wiggert, J. D., and Hood, R. R.: Chesapeake Bay nitrogen fluxes derived from a land-estuarine ocean biogeochemical modeling system: Model description, evaluation, and nitrogen budgets, J. Geophys. Res.-Biogeo., 120, 1666–1695, https://doi.org/10.1002/2015jg002931, 2015.
Frankel, L. T., Friedrichs, M. A. M., St-Laurent, P., Bever, A. J., Lipcius, R. N., Bhatt, G., and Shenk, G. W.: Nitrogen reductions have decreased hypoxia in the Chesapeake Bay: Evidence from empirical and numerical modeling, Sci. Total Environ., 814, 152722, https://doi.org/10.1016/j.scitotenv.2021.152722, 2022.
Frank-Lawale, A., Allen, S. K., and Dgremont, L.: Breeding and Domestication of Eastern Oyster (Crassostrea virginica) Lines for Culture in the Mid-Atlantic, Usa: Line Development and Mass Selection for Disease Resistance, J. Shellfish Res., 33, 153–165, https://doi.org/10.2983/035.033.0115, 2014.
Fujii, M., Hamanoue, R., Bernardo, L. P. C., Ono, T., Dazai, A., Oomoto, S., Wakita, M., and Tanaka, T.: Assessing impacts of coastal warming, acidification, and deoxygenation on Pacific oyster (Crassostrea gigas) farming: a case study in the Hinase area, Okayama Prefecture, and Shizugawa Bay, Miyagi Prefecture, Japan, Biogeosciences, 20, 4527–4549, https://doi.org/10.5194/bg-20-4527-2023, 2023.
Fulford, R., Breitburg, D., Newell, R., Kemp, W., and Luckenbach, M.: Effects of oyster population restoration strategies on phytoplankton biomass in Chesapeake Bay: a flexible modeling approach, Mar. Ecol. Prog. Ser., 336, 43–61, https://doi.org/10.3354/meps336043, 2007.
Gattuso, J. P., Magnan, A., Billé, R., Cheung, W. W., Howes, E. L., Joos, F., Allemand, D., Bopp, L., Cooley, S. R., Eakin, C. M., Hoegh-Guldberg, O., Kelly, R. P., Pörtner, H.-O., Rogers, A. D., Baxter, J. M., Laffoley, D., Osborn, D., Rankovic, A., Rochette, J., Sumaila, U. R., Treyer, S., and Turley, C.: Contrasting futures for ocean and society from different anthropogenic CO2 emissions scenarios, Science, 349, 6243, https://doi.org/10.1126/science.aac4722, 2015.
Gawde, R. K., North, E. W., Hood, R. R., Long, W., Wang, H., and Wilberg, M. J.: A high resolution hydrodynamic-biogeochemical-oyster-filtration model predicts that the presence of oysters (Crassostrea virginica) can improve, or reduce, water quality depending upon oyster abundance and location, Ecol. Model., 496, 110833, https://doi.org/10.1016/j.ecolmodel.2024.110833, 2024.
Gazeau, F., Quiblier, C., Jansen, J. M., Gattuso, J. P., Middelburg, J. J., and Heip, C. H.: Impact of elevated CO2 on shellfish calcification. Geophys. Res. Lett., 34, L07603, https://doi.org/10.1029/2006GL028554, 2007.
Gobler, C. J. and Talmage, S. C.: Physiological response and resilience of early life-stage Eastern oysters (Crassostrea virginica) to past, present and future ocean acidification, Conserv. Physiol., 2, cou004, https://doi.org/10.1093/conphys/cou004, 2014.
Goulletquer, P., Soletchnik, P., Le Moine, O., Razet, D., Geairon, P., and Faury, N.: Summer mortality of the Pacific cupped oyster Crassostrea gigas in the Bay of Marennes-Oléron (France), Counc. Meet. of the Int. Counc. for the Exploration of the Sea, Cascais, Portugal, 16–19 September 1998, https://archimer.ifremer.fr/doc/00000/3093/ (last access: 28 January 2024), 1998.
Gmelin, J. F.: Caroli a Linnaei Systema Naturae per Regna Tria Naturae, Systema Naturae, Linneaeus, 13, 3021–3910, 1791.
Gruber, N., Clement, D., Carter, B. R., Feely, R. A., Heuven, S. van, Hoppema, M., Ishii, M., Key, R. M., Kozyr, A., Lauvset, S. K., Monaco, C. L., Mathis, J. T., Murata, A., Olsen, A., Perez, F. F., Sabine, C. L., Tanhua, T., and Wanninkhof, R.: The oceanic sink for anthropogenic CO2 from 1994 to 2007, Science, 363, 1193–1199, https://doi.org/10.1126/science.aau5153, 2019.
Guévélou, E., Carnegie, R. B., Small, J. M., Hudso n, K., Reece, K. S., and Rybovich, M. M.: Tracking Triploid Mortalities of Eastern Oysters Crassostrea virginica in the Virginia Portion of the Chesapeake Bay, J. Shellfish Res., 38, 101–113, https://doi.org/10.2983/035.038.0110, 2019.
Guinotte, J. M. and Fabry, V. J.: Ocean Acidification and Its Potential Effects on Marine Ecosystems, Ann. N. York Acad. Sci., 1134, 320–342, https://doi.org/10.1196/annals.1439.013, 2008.
Hasler, C. T., Jeffrey, J. D., Schneider, E. V. C., Hannan, K. D., Tix, J. A., and Suski, C. D.: Biological consequences of weak acidification caused by elevated carbon dioxide in freshwater ecosystems, Hydrobiologia, 806, 1–12, https://doi.org/10.1007/s10750-017-3332-y, 2018.
Herrmann, M., Najjar, R. G., Da, F., Friedman, J. R., Friedrichs, M. A. M., Goldberger, S., Menendez, A., Shadwick, E. H., Stets, E. G., and St-Laurent, P.: Challenges in Quantifying Air-Water Carbon Dioxide Flux Using Estuarine Water Quality Data: Case Study for Chesapeake Bay, J. Geophys. Res.-Ocean., 125, e2019JC015610, https://doi.org/10.1029/2019jc015610, 2020.
Hersbach, H., Bell, B., Berrisford, P., Hirahara, S., Horányi, A., Muñoz-Sabater, J., Nicolas, J., Peubey, C., Radu, R., Schepers, D., Simmons, A., Soci, C., Abdalla, S., Abellan, X., Balsamo, G., Bechtold, P., Biavati, G., Bidlot, J., Bonavita, M., Chiara, G., Dahlgren, P., Dee, D., Diamantakis, M., Dragani, R., Flemming, J., Forbes, R., Fuentes, M., Geer, A., Haimberger, L., Healy, S., Hogan, R. J., Hólm, E., Janisková, M., Keeley, S., Laloyaux, P., Lopez, P., Lupu, C., Radnoti, G., Rosnay, P., Rozum, I., Vamborg, F., Villaume, S., and Thépaut, J.: The ERA5 global reanalysis, Q. J. R. Meteorol. Soc., 146, 1999–2049, https://doi.org/10.1002/qj.3803, 2020.
Hinson, K. E., Friedrichs, M. A. M., St-Laurent, P., Da, F., and Najjar, R. G.: Extent and Causes of Chesapeake Bay Warming, J. Am. Water Resour. Assoc., 58, 805–825, https://doi.org/10.1111/1752-1688.12916, 2022.
Hinson, K. E., Friedrichs, M. A. M., Najjar, R. G., Herrmann, M., Bian, Z., Bhatt, G., St-Laurent, P., Tian, H., and Shenk, G.: Impacts and uncertainties of climate-induced changes in watershed inputs on estuarine hypoxia, Biogeosciences, 20, 1937–1961, https://doi.org/10.5194/bg-20-1937-2023, 2023.
Hinson, K.E., Friedrichs, M. A. M., Najjar, R. G., Bian, Z., Herrmann, M., and St-Laurent, P.: Response of hypoxia to future climate change is sensitive to methodological assumptions, Sci. Rep., 14, 17544, https://doi.org/10.1038/s41598-024-68329-3, 2024.
Himes, A. R., Schatz, A.m and Rivest, E. B.: Differences in larval acidification tolerance among populations of the eastern oyster, Crassostrea virginica, J. Exp. Mar. Biol. Ecol., 577, 152023, https://doi.org/10.1016/j.jembe.2024.152023, 2024.
Hirsch, R. M., Moyer, D. L., and Archfield, S. A.: Weighted regressions on time, discharge, and season (WRTDS), with an application to Chesapeake Bay river inputs, JAWRA J. Am. Water Res. Assoc., 46, 857–880, https://doi.org/10.1111/j.1752-1688.2010.00482.x, 2010.
Hochachka, P. W. and Somero, G. N.: Biochemical Adaptation: Mechanism and Processing Physiological Evolution, Oxford University Press, ISBN 0195117034, 2002.
Hofmann, G. E. and Hand, S. C.: Global arrest of translation during invertebrate quiescence, P. Natl. Acad. Sci. USA, 91, 8492–8496, https://doi.org/10.1073/pnas.91.18.8492, 1994.
Hopkinson, C. S., Buffam, I., Hobbie, J., Vallino, J., Perdue, M., Eversmeyer, B., Prahl, F., Covert, J., Hodson, R., Moran, M. A., Smith, E., Baross, J., Crump, B., Findlay, S., and Foreman, K.: Terrestrial inputs of organic matter to coastal ecosystems: An intercomparison of chemical characteristics and bioavailability, Biogeochemistry, 43, 211–234, https://doi.org/10.1023/a:1006016030299, 1998.
Hudson, K.: Virginia Shellfish Aquaculture Situation and Outlook Report: Results of the 2018 Virginia Shellfish Aquaculture Crop Reporting Survey, https://doi.org/10.21220/V51K6T, 2019.
IPCC (Intergovernmental Panel on Climate Change): Climate Change 2013: The Physical Science Basis, edited by: Stocker, T.F., D. Qin, G.-K. Plattner, M. Tignor, S.K. Allen, J. Boschung, A. Nauels, Y. Xia, V. Bex and P.M. Midgley, Cambridge University Press, Cambridge, UK and New York, NY, USA, 1535 pp., https://www.ipcc.ch/site/assets/uploads/2018/02/WG1AR5_all_final.pdf (last access: 28 January 2024), 2013.
IPCC (Intergovernmental Panel on Climate Change): IPCC Special Report on the Ocean and Cryosphere in a Changing Climate, edited by: Pörtner, H.-O., Roberts, D. C., Masson-Delmotte, V., Zhai, P., Tignor, M., Poloczanska, E., Mintenbeck, K., Alegriìa, A., Nicolai, M., Okem, A., Petzold, J., Rama, B., and Weyer, N. M., Cambridge University Press, Cambridge, UK and New York, NY, USA, 755 pp., https://doi.org/10.1017/9781009157964, 2019.
IPCC (Intergovernmental Panel on Climate Change): Climate Change 2021: The Physical Science Basis, edited by: Masson-Delmotte, V., Zhai, P., Pirani, A., Connors, S. L., Péan, C., Berger, S., Caud, N., Chen, Y., Goldfarb, L., Gomis, M. I., Huang, M., Leitzell, K., Lonnoy, E., Matthews, J. B. R., Maycock, T. K., Waterfield, T., Yelekçi, O., Yu, R., and Zhou, B., Cambridge University Press, Cambridge, UK and New York, NY, USA, https://doi.org/10.1017/9781009157896, 2021.
Irby, I. D., Friedrichs, M. A. M., Friedrichs, C. T., Bever, A. J., Hood, R. R., Lanerolle, L. W. J., Li, M., Linker, L., Scully, M. E., Sellner, K., Shen, J., Testa, J., Wang, H., Wang, P., and Xia, M.: Challenges associated with modeling low-oxygen waters in Chesapeake Bay: a multiple model comparison, Biogeosciences, 13, 2011–2028, https://doi.org/10.5194/bg-13-2011-2016, 2016.
Irby, I. D., Friedrichs, M. A. M., Da, F., and Hinson, K. E.: The competing impacts of climate change and nutrient reductions on dissolved oxygen in Chesapeake Bay, Biogeosciences, 15, 2649–2668, https://doi.org/10.5194/bg-15-2649-2018, 2018.
Jewett, L. and Romanou, A: Ocean acidification and other ocean changes, in: Climate Science Special Report: Fourth National Climate Assessment, Volume I, edited by: Wuebbles, D. J., Fahey, D. W., Hibbard, K. A., Dokken, D. J., Stewart, B. C., and Maycock, T. K., U.S. Global Change Research Program, Washington, DC, USA, 364–392, https://doi.org/10.7930/J0QV3JQB, 2017.
Jones, H. R., Johnson, K. M., and Kelly, M. W.: Synergistic Effects of Temperature and Salinity on the Gene Expression and Physiology of Crassostrea virginica, Integr. Comp. Biol., 59, 306–319, https://doi.org/10.1093/icb/icz035, 2019.
Jordan, S. J.: Sedimentation and remineralization associated with biodeposition by the American oyster Crassostrea virginica (Gmelin), University of Maryland, College Park, ProQuest Dissertations Publishing, ISBN 979-8-206-77634-8, 1987.
Kellogg, M. L., Brush, M., and Cornwell, J. C.: An updated model for estimating the TMDL – related benefits of oyster reef restoration, A final report to The Nature Conservancy and Oyster Recovery Partnership, https://doi.org/10.25773/7a75-ds48, 2018.
Kemp, W., Boynton, W., Adolf, J., Boesch, D., Boicourt, W., Brush, G., Cornwell, J., Fisher, T., Glibert, P., Hagy, J., Harding, L., Houde, E., Kimmel, D., Miller, W., Newell, R., Roman, M., Smith, E., and Stevenson, J.: Eutrophication of Chesapeake Bay: historical trends and ecological interactions, Mar. Ecol. Prog. Ser., 303, 1–29, https://doi.org/10.3354/meps303001, 2005.
Kingsley-Smith, P. R., Harwell, H. D., Kellogg, M. L., Allen, S. M., Allen, S. K., Meritt, D. W., Paynter, K. T., and Luckenbach, M. W.: Survival and Growth of Triploid Crassostrea virginica (Gmelin, 1791) and C. ariakensis (Fujita, 1913) in Bottom Environments of Chesapeake Bay: Implications for an Introduction, J. Shellfish Res., 28, 169–184, https://doi.org/10.2983/035.028.0201, 2009.
La Peyre, M. K., Eberline, B. S., Soniat, T. M. and La Peyre, J. F.: Differences in extreme low salinity timing and duration differentially affect eastern oyster (Crassostrea virginica) size class growth and mortality in Breton Sound, LA, Estuar. Coast. Shelf Sci., 135, 146–157, 2013.
Lavaud, R., Peyre, M. K. L., Justic, D., and Peyre, J. F. L.: Dynamic Energy Budget modelling to predict eastern oyster growth, reproduction, and mortality under river management and climate change scenarios, Estuar. Coast. Shelf Sci., 251, 107188, https://doi.org/10.1016/j.ecss.2021.107188, 2021.
Lavaud, R., Peyre, M. K. L., Couvillion, B., Pollack, J. B., Brown, V., Palmer, T. A., and Keim, B.: Predicting restoration and aquaculture potential of eastern oysters through an eco-physiological mechanistic model, Ecol. Model., 489, 110603, https://doi.org/10.1016/j.ecolmodel.2023.110603, 2024.
Lemasson, A. J., Hall-Spencer, J. M., Fletcher, S., Provstgaard-Morys, S., and Knights, A. M.: Indications of future performance of native and non-native adult oysters under acidification and warming, Mar. Environ. Res., 142, 178–189, https://doi.org/10.1016/j.marenvres.2018.10.003, 2018.
Li, M., Lee, Y. J., Testa, J. M., Li, Y., Ni, W., Kemp, W. M., and Toro, D. M. D.: What drives interannual variability of hypoxia in Chesapeake Bay: Climate forcing versus nutrient loading?, Geophys. Res. Lett., 43, 2127–2134, https://doi.org/10.1002/2015gl067334, 2016.
Liddel, M. K.: A von Bertalanffy based model for the estimation of oyster (Crassostrea virginica) growth on restored oyster reefs in Chesapeake Bay, Digital Repository at the University of Maryland, College Park, MD, http://hdl.handle.net/1903/8041 (last access: 28 January 2024), 2008.
Loosanoff, V. L.: Some aspects of behavior of oysters at different temperatures, Biol. Bull., 114, 57–70, https://doi.org/10.2307/1538965, 1958.
López-Urrutia, Á., Martin, E. S., Harris, R. P., and Irigoien, X.: Scaling the metabolic balance of the oceans, P. Natl. Acad. Sci. USA, 103, 8739–8744, https://doi.org/10.1073/pnas.0601137103, 2006.
Lowe, A. T., Kobelt, J., Horwith, M., and Ruesink, J.: Ability of Eelgrass to Alter Oyster Growth and Physiology Is Spatially Limited and Offset by Increasing Predation Risk, Estuar. Coast., 42, 743–754, https://doi.org/10.1007/s12237-018-00488-9, 2019.
Lutier, M., Di Poi, C., Gazeau, F., Appolis, A., Le Luyer, J., and Pernet, F.: Revisiting tolerance to ocean acidification: insights from a new framework combining physiological and molecular tipping points of Pacific oyster, Glob. Change Biol., 28, 3333–3348, https://doi.org/10.1111/gcb.16101, 2022.
Malham, S. K., Cotter, E., O'Keeffe, S., Lynch, S., Culloty, S. C., King, J. W., Latchford, J. W., and Beaumont, A. R.: Summer mortality of the Pacific oyster, Crassostrea gigas, in the Irish Sea: the influence of temperature and nutrients on health and survival, Aquaculture, 287, 128–138, https://doi.org/10.1016/j.aquaculture.2008.10.006, 2009.
Matoo, O. B., Ivanina, A. V., Ullstad, C., Beniash, E., and Sokolova, I. M.: Interactive effects of elevated temperature and CO2 levels on metabolism and oxidative stress in two common marine bivalves (Crassostrea virginica and Mercenaria mercenaria), Comp. Biochem. Physiol. Pt. A, 164, 545–553, https://doi.org/10.1016/j.cbpa.2012.12.025, 2013.
Matoo, O. B., Lannig, G., Bock, C., and Sokolova, I. M.: Temperature but not ocean acidification affects energy metabolism and enzyme activities in the blue mussel, Mytilus edulis, Ecol. Evol., 11, 3366–3379, https://doi.org/10.1002/ece3.7289, 2021.
Mazarrasa, I., Marbà, N., Lovelock, C. E., Serrano, O., Lavery, P. S., Fourqurean, J. W., Kennedy, H., Mateo, M. A., Krause-Jensen, D., Steven, A. D. L., and Duarte, C. M.: Seagrass meadows as a globally significant carbonate reservoir, Biogeosciences, 12, 4993–5003, https://doi.org/10.5194/bg-12-4993-2015, 2015.
Medeiros, I. P. M. and Souza, M. M.: Acid times in physiology: a systematic review of the effects of ocean acidification on calcifying invertebrates, Environ. Res., 231, 116019, https://doi.org/10.1016/j.envres.2023.116019, 2023
Meinshausen, M., Smith, S. J., Calvin, K., Daniel, J. S., Kainuma, M. L. T., Lamargue, J.-F., Matsumoto, L., Montzka, S. A., Raper, S. C. B., Riahi, K., Thomson, A., Velders, G. J. M., and van Vuuren, D. P. P.: The RCP greenhouse gas concentrations and their extensions from 1765 to 2300, Climatic Change, 109, 213, https://doi.org/10.1007/s10584-011-0156-z, 2011.
Melzner, F., Mark, F. C., Seibel, B. A., and Tomanek, L.: Ocean acidification and coastal marine invertebrates: tracking CO2 effects from seawater to the cell, Annu. Rev. Mar. Sci., 12, 499–523, https://doi.org/10.1146/annurev-marine-010419-010658, 2020.
Mitchell, M., Herman, J., Bilkovic, D. M., and Hershner, C.: Marsh persistence under sea-level rise is controlled by multiple, geologically variable stressors, Ecosyst. Heal. Sustain., 3, 1379888, https://doi.org/10.1080/20964129.2017.1396009, 2017.
Mizuta, D. D., Silveira, N., Fischer, C. E., and Lemos, D.: Interannual variation in commercial oyster (Crassostrea gigas) farming in the sea (Florianópolis, Brazil, 27°44′ S; 48°33′ W) in relation to temperature, chlorophyll a and associated oceanographic conditions, Aquaculture, 366, 105–114, https://doi.org/10.1016/j.aquaculture.2012.09.011, 2012.
Moore, K. A., Orth, R. J., and Wilcox, D. J.: Assessment of the Abundance of Submersed Aquatic Vegetation (SAV) Communities in the Chesapeake Bay and its Use in SAV Management, in: Remote Sensing and Geospatial Technologies for Coastal Ecosystem Assessment and Management, Springer, Berlin, Heidelberg, 233–257, https://doi.org/10.1007/978-3-540-88183-4, 2009.
Moore-Maley, B. L., Allen, S. E., and Ianson, D.: Locally driven interannual variability of near-surface pH and ΩA in the Strait of Georgia, J. Geophys. Res.-Ocean., 121, 1600–1625, https://doi.org/10.1002/2015jc011118, 2016.
Moriarty, J. M., Friedrichs, M. A. M., and Harris, C. K.: Seabed Resuspension in the Chesapeake Bay: Implications for Biogeochemical Cycling and Hypoxia, Estuar. Coast., 44, 103–122, https://doi.org/10.1007/s12237-020-00763-8, 2021.
Najjar, R. G., Herrmann, M., Valle, S. M. C. D., Friedman, J. R., Friedrichs, M. A. M., Harris, L. A., Shadwick, E. H., Stets, E. G., and Woodland, R. J.: Alkalinity in Tidal Tributaries of the Chesapeake Bay, J. Geophys. Res.-Ocean., 125, e2019JC015597, https://doi.org/10.1029/2019jc015597, 2020.
Ni, W., Li, M., and Testa, J. M.: Discerning effects of warming, sea level rise and nutrient management on long-term hypoxia trends in Chesapeake Bay, Sci. Total Environ., 737, 139717, https://doi.org/10.1016/j.scitotenv.2020.139717, 2020.
Nixon, S. W.: Coastal marine eutrophication: A definition, social causes, and future concerns, Ophelia, 41, 199–219, https://doi.org/10.1080/00785236.1995.10422044, 1995.
Nichols, M. M., Kim, S. C., and Brouwer, C. M.: Sediment Characterization of Chesaapeake Bay and Its Tributaries, https://doi.org/10.21220/V5BQ60, 1991.
Olson, M.: Guide to Using Chesapeake Bay Program Water Quality Monitoring Data, Chesapeake Bay Program, Annapolis, MD, 2012.
Orr, J. C., Fabry, V. J., Aumont, O., Bopp, L., Doney, S. C., Feely, R. A., Gnanadesikan, A., Gruber, N., Ishida, A., Joos, F., and Key, R. M.: Anthropogenic ocean acidification over the twenty-first century and its impact on calcifying organisms, Nature, 437, 681–686, https://doi.org/10.1038/nature04095, 2005.
Orth, R. J., Nowak, J. F., Wilcox, D. J., Whiting, J. R., and Nagey, L. S.: Distribution of Submerged Aquatic Vegetation in the Chesapeake Bay and Tributaries and the Coastal Bays, Am. Zool., 3, 315–317, https://doi.org/10.1093/icb/3.3.315, 1998.
Pacella, S. R., Brown, C. A., Kaldy, J. E., Labiosa, R. G., Hales, B., Mochon Collura, T. C., and Waldbusser, G. G.: Quantifying the combined impacts of anthropogenic CO2 emissions and watershed alteration on estuary acidification at biologically-relevant time scales: a case study from Tillamook Bay, OR, USA, Front. Mar. Sci., 11, 1293955, https://doi.org/10.3389/fmars.2024.1293955, 2024.
Palmer, S. C. J., Gernez, P. M., Thomas, Y., Simis, S., Miller, P. I., Glize, P., and Barillé, L.: Remote Sensing-Driven Pacific Oyster (Crassostrea gigas) Growth Modeling to Inform Offshore Aquaculture Site Selection, Front. Mar. Sci., 6, 802, https://doi.org/10.3389/fmars.2019.00802, 2020.
Palmer, S. C. J., Barillé, L., Kay, S., Ciavatta, S., Buck, B., and Gernez, P.: Pacific oyster (Crassostrea gigas) growth modelling and indicators for offshore aquaculture in Europe under climate change uncertainty, Aquaculture, 532, 736116, https://doi.org/10.1016/j.aquaculture.2020.736116, 2021.
Paynter, K. T., Goodwin, J. D., Chen, M. E., Ward, N. J., Sherman, M. W., Meritt, D. W., and Allen, S. K.: Crassostrea ariakensis in Chesapeake Bay: Growth, Disease and Mortality in Shallow Subtidal Environments, J. Shellfish Res., 27, 509–515, https://doi.org/10.2983/0730-8000(2008)27[509:caicbg]2.0.co;2, 2008.
Poach, M., Munroe, D., Vasslides, J., Abrahamsen, I., and Coffey, N.: Monitoring coastal acidification along the US East coast: concerns for shellfish production, Bull. Jap. Fish. Res. Edu. Agen. No, 49, 53–64, 2019.
Ramajo, L., Pérez-León, E., Hendriks, I. E., Marbà, N., Krause-Jensen, D., Sejr, M. K., Blicher, M. E., Lagos, N. A., Olsen, Y. S., and Duarte, C. M.: Food supply confers calcifiers resistance to ocean acidification, Sci. Rep., 6, 19374, https://doi.org/10.1038/srep19374, 2016.
Raymond, P. A., Bauer, J. E., and Cole, J. J.: Atmospheric CO2 evasion, dissolved inorganic carbon production, and net heterotrophy in the York River estuary, Limnol. Oceanogr., 45, 1707–1717, https://doi.org/10.4319/lo.2000.45.8.1707, 2000.
Riahi, K., Rao, S., Krey, V., Cho, C., Chirkov, V., Fischer, G., Kindermann, G., Nakicenovic, N., and Rafaj, P.: RCP8.5 – A scenario of comparatively high greenhouse gas emissions, Climatic Change, 109, 33, https://doi.org/10.1007/s10584-011-0149-y, 2011.
Redfield, A. C.: On the proportions of organic derivatives in sea water and their relation to the composition of plankton, University Press of Liverpool, Liverpool, UK, 1934.
Reid, J. M., Reid, J. A., Jenkins, C. J., Hastings, M. E., Williams, S. J., and Poppe, L. J.: usSEABED: Atlantic coast offshore surficial sediment data release, US Geological Survey Data Series, 118, https://doi.org/10.3133/ds118, 2005.
Rivest, E. B., Brush, M. J., Zimmerman, R. C., Hill, V. J., Widrick, A., Blachman, S., and Sisti, A.: Ocean acidification thresholds for eastern oysters, in: Proceedings of the ASLO/AGU/TOS Ocean Sciences Meeting, San Diego, CA, 16–21 February, 2020.
Rybovich, M., Peyre, M. K. L., Hall, S. G., and Peyre, J. F. L.: Increased Temperatures Combined with Lowered Salinities Differentially Impact Oyster Size Class Growth and Mortality, J. Shellfish Res., 35, 101–113, https://doi.org/10.2983/035.035.0112, 2016.
Saavedra, L., Bastías, M., Mendoza, P., Lagos, N. A., García-Herrera, C., Ponce, V., Alvarez, F., and Llanos-Rivera, A.: Environmental correlates of oyster farming in an upwelling system: Implication upon growth, biomass production, shell strength and organic composition, Mar. Environ. Res., 198, 106489, https://doi.org/10.1016/j.marenvres.2024.106489, 2024.
Salisbury, J., Green, M., Hunt, C., and Campbell, J.: Coastal Acidification by Rivers: A Threat to Shellfish?, Eos, Trans. Am. Geophys. Union, 89, 513–513, https://doi.org/10.1029/2008eo500001, 2008.
Schwaner, C., Barbosa, M., Schwemmer, T. G., Espinosa, E. P., and Allam, B.: Increased Food Resources Help Eastern Oyster Mitigate the Negative Impacts of Coastal Acidification, Animals, 13, 1161, https://doi.org/10.3390/ani13071161, 2023.
Seneviratne, S. I., Nicholls, N., Easterling, D., Goodess, C. M., Kanae, S., Kossin, J., Luo, Y., Marengo, J., McInnes, K., Rahimi, M., Reichstein, M., Sorteberg, A., Vera, C., Zhang, X., Rusticucci, M., Semenov, V., Alexander, L. V., Allen, S., Benito, G., Cavazos, T., Clague, J., Conway, D., Della-Marta, P. M., Gerber, M., Gong, S., Goswami, B. N., Hemer, M., Huggel, C., van den Hurk, B., Kharin, V. V., Kitoh, A., Klein Tank, A. M. G., Li, G., Mason, S., McGuire, W., van Oldenborgh, G. J., Orlowsky, B., Smith, S., Thiaw, W., Velegrakis, A., Yiou, P., Zhang, T., Zhou, T., and Zwiers, F. W.: Changes in climate extremes and their impacts on the natural physical environment, in: Managing the Risks of Extreme Events and Disasters to Advance Climate Change Adaptation (SREX), edited by: Field, C. B., Barros, V., Stocker, T. F., and Dahe, Q., Cambridge University Press, Cambridge, UK and New York, NY, USA, 109–230, https://doi.org/10.1017/CBO9781139177245.006, 2012.
Simone, M. N., Schulz, K. G., Oakes, J. M., and Eyre, B. D.: Warming and ocean acidification may decrease estuarine dissolved organic carbon export to the ocean, Biogeosciences, 18, 1823–1838, https://doi.org/10.5194/bg-18-1823-2021, 2021.
Shadwick, E. H., Friedrichs, M. A. M., Najjar, R. G., Meo, O. A. D., Friedman, J. R., Da, F., and Reay, W. G.: High-Frequency CO2 System Variability Over the Winter-to-Spring Transition in a Coastal Plain Estuary, J. Geophys. Res.-Ocean., 124, 7626–7642, https://doi.org/10.1029/2019jc015246, 2019.
Shchepetkin, A. F. and McWilliams, J. C.: The regional oceanic modeling system (ROMS): a split-explicit, free-surface, topography-following-coordinate oceanic model, Ocean Model., 9, 347–404, https://doi.org/10.1016/j.ocemod.2004.08.002, 2005.
Shen, C., Testa, J. M., Li, M., Cai, W., Waldbusser, G. G., Ni, W., Kemp, W. M., Cornwell, J., Chen, B., Brodeur, J., and Su, J.: Controls on Carbonate System Dynamics in a Coastal Plain Estuary: A Modeling Study, J. Geophys. Res.-Biogeo., 124, 61–78, https://doi.org/10.1029/2018jg004802, 2019a.
Shen, C., Testa, J. M., Ni, W., Cai, W., Li, M., and Kemp, W. M.: Ecosystem Metabolism and Carbon Balance in Chesapeake Bay: A 30-Year Analysis Using a Coupled Hydrodynamic-Biogeochemical Model, J. Geophys. Res.-Ocean., 124, 6141–6153, https://doi.org/10.1029/2019jc015296, 2019b.
Shen, C., Testa, J. M., Li, M., and Cai, W.: Understanding Anthropogenic Impacts on pH and Aragonite Saturation State in Chesapeake Bay: Insights From a 30-Year Model Study, J. Geophys. Res.-Biogeo., 125, e2019JG005620, https://doi.org/10.1029/2019jg005620, 2020.
Siedlecki, S. A., Pilcher, D., Howard, E. M., Deutsch, C., MacCready, P., Norton, E. L., Frenzel, H., Newton, J., Feely, R. A., Alin, S. R., and Klinger, T.: Coastal processes modify projections of some climate-driven stressors in the California Current System, Biogeosciences, 18, 2871–2890, https://doi.org/10.5194/bg-18-2871-2021, 2021a.
Siedlecki, S., Salisbury, J., Gledhill, D., Bastidas, C., Meseck, S., McGarry, K., Hunt, C., Alexander, M., Lavoie, D., Wang, Z., Scott, J., Brady, D., Mlsna, I., Azetsu-Scott, K., Liberti, C., Melrose, D., White, M., Pershing, A., Vandemark, D., Townsend, D., Chen, C., Mook, W., and Morrison, R.: Projecting ocean acidification impacts for the Gulf of Maine to 2050, Elem.-Sci. Anthr., 9, 62, https://doi.org/10.1525/elementa.2020.00062, 2021b.
Speights, C. J., Silliman, B. R., and McCoy, M. W.: The effects of elevated temperature and dissolved ρCO2 on a marine foundation species, Ecol. Evol., 7, 3808–3814, https://doi.org/10.1002/ece3.2969, 2017.
Simpson, E., Ianson, D., Kohfeld, K. E., Franco, A. C., Covert, P. A., Davelaar, M., and Perreault, Y.: Variability and drivers of carbonate chemistry at shellfish aquaculture sites in the Salish Sea, British Columbia, Biogeosciences, 21, 1323–1353, https://doi.org/10.5194/bg-21-1323-2024, 2024.
Stevens, A. and Gobler, C.: Interactive effects of acidification, hypoxia, and thermal stress on growth, respiration, and survival of four North Atlantic bivalves, Mar. Ecol. Prog. Ser., 604, 143–161, https://doi.org/10.3354/meps12725, 2018.
St-Laurent, P. and Friedrichs, M. A. M.: On the Sensitivity of Coastal Hypoxia to Its External Physical Forcings, J. Adv. Model. Earth Syst., 16, e2023MS003845, https://doi.org/10.1029/2023ms003845, 2024.
St-Laurent, P., Friedrichs, M. A. M., Najjar, R. G., Shadwick, E. H., Tian, H., and Yao, Y.: Relative impacts of global changes and regional watershed changes on the inorganic carbon balance of the Chesapeake Bay, Biogeosciences, 17, 3779–3796, https://doi.org/10.5194/bg-17-3779-2020, 2020.
Su, J., Cai, W.-J., Brodeur, J., Chen, B., Hussain, N., Yao, Y., Ni, C., Testa, J. M., Li, M., Xie, X., Ni, W., Scaboo, K. M., Xu, Y., Cornwell, J., Gurbisz, C., Owens, M. S., Waldbusser, G. G., Dai, M., and Kemp, W. M.: Chesapeake Bay acidification buffered by spatially decoupled carbonate mineral cycling, Nat. Geosci., 13, 441–447, https://doi.org/10.1038/s41561-020-0584-3, 2020.
Swam, L. M., Couvillion, B., Callam, B., Peyre, J. F. L., and Peyre, M. K. L.: Defining oyster resource zones across coastal Louisiana for restoration and aquaculture, Ocean Coast. Manag., 225, 106178, https://doi.org/10.1016/j.ocecoaman.2022.106178, 2022.
Talmage, S. C. and Gobler, C. J.: Effects of Elevated Temperature and Carbon Dioxide on the Growth and Survival of Larvae and Juveniles of Three Species of Northwest Atlantic Bivalves, PLoS ONE, 6, e26941, https://doi.org/10.1371/journal.pone.0026941, 2011.
Tian, R., Cerco, C. F., Bhatt, G., Linker, L. C., and Shenk, G. W.: Mechanisms Controlling Climate Warming Impact on the Occurrence of Hypoxia in Chesapeake Bay, J. Am. Water Resour. Assoc., 58, 855–875, https://doi.org/10.1111/1752-1688.12907, 2022.
Thomsen, J., Haynert, K., Wegner, K. M., and Melzner, F.: Impact of seawater carbonate chemistry on the calcification of marine bivalves, Biogeosciences, 12, 4209–4220, https://doi.org/10.5194/bg-12-4209-2015, 2015.
Turner, J. S., St-Laurent, P., Friedrichs, M. A. M., and Friedrichs, C. T.: Effects of reduced shoreline erosion on Chesapeake Bay water clarity, Sci. Total Environ., 769, 145157, https://doi.org/10.1016/j.scitotenv.2021.145157, 2021.
USDA: National Agricultural Statistics Service, 2023 Census of Aquaculture, https://www.nass.usda.gov/Publications/AgCensus/2022/Online_Resources/Aquaculture/index.php (last access: 28 January 2024), 2023.
Lewis, E. and Wallace, D. W. R.: Program Developed for CO2 System Calculations, ORNL/CDIAC-105, Carbon Dioxide Inf. Anal. Cent., Oak Ridge Natl. Lab., Oak Ridge, TN, 38 pp., https://salish-sea.pnnl.gov/media/ORNL-CDIAC-105.pdf (last access: 28 January 2024), 1998.
VOSARA: https://cmap22.vims.edu/VOSARA/, last access: 28 January 2024.
Waldbusser, G. G., Voigt, E. P., Bergschneider, H., Green, M. A., and Newell, R. I. E.: Biocalcification in the Eastern Oyster (Crassostrea virginica) in Relation to Long-term Trends in Chesapeake Bay pH, Estuar. Coast., 34, 221–231, https://doi.org/10.1007/s12237-010-9307-0, 2011.
Wallace, R. B., Baumann, H., Grear, J. S., Aller, R. C., and Gobler, C. J.: Coastal ocean acidification: The other eutrophication problem, Estuar., Coast. Shelf Sci., 148, 1–13, https://doi.org/10.1016/j.ecss.2014.05.027, 2014.
Warner, J. C., Defne, Z., Haas, K., and Arango, H. G.: A wetting and drying scheme for ROMS, Comput. Geosci., 58, 54–61, https://doi.org/10.1016/j.cageo.2013.05.004, 2013.
Zhang, Q., Fisher, T. R., Trentacoste, E. M., Buchanan, C., Gustafson, A. B., Karrh, R., Murphy, R. R., Keisman, J., Wu, C., Tian, R., Testa, J. M., and Tango, P. J.: Nutrient limitation of phytoplankton in Chesapeake Bay: Development of an empirical approach for water-quality management, Water Res., 188, 116407, https://doi.org/10.1016/j.watres.2020.116407, 2021.