the Creative Commons Attribution 4.0 License.
the Creative Commons Attribution 4.0 License.
 | 22 Aug 2025
Decreasing foraminiferal flux in response to ongoing climate change in the Santa Barbara Basin, California
Katherine Cherry
Claudia Benitez-Nelson
Eric Tappa
Catherine V. Davis
The rapid response of foraminiferal assemblages to changing climate makes their shells an invaluable geological record of the past. However, the time frame over which foraminifera respond to climatic signals and the specific drivers influencing assemblage composition and abundance remain obscure. We focus on the impact of ongoing, anthropogenic climate change on planktic foraminifera in the California Current ecosystem, which would appear as a nearly instantaneous event in the sediment record. The Santa Barbara Basin sediment trap, located off the coast of California, USA since 1993, provides a record of more than 30 years of particulate and foraminiferal flux in the basin. The sediment trap captures the superposition of the annual cycle of seasonal upwelling, Pacific multiannual El Niño–Southern Oscillation-driven temperature changes, and anthropogenically forced climate change. We present data on planktic foraminiferal flux collected between 2014–2021, at two-week intervals (164 samples, 60 006 individuals) and compare results to previously published data from 1993–1998. Consistent with previous studies, the most abundant species from 2014–2021 were Globigerina bulloides, Neogloboquadrina incompta, and Turborotalita quinqueloba, with peak fluxes occurring in the spring and summer. Lower fluxes and an increase in the abundance of N. incompta and subtropical species characterize the winter season. We find a 37.9 % decrease in total foraminiferal flux relative to the 1990s, primarily driven by a decrease in G. bulloides abundance. This decrease is accompanied by a 21.0 % overall reduction in calcium carbonate flux. We also find a decrease in the relative abundance of subtropical species (Globigerinoides ruber, Orbulina universa, and Neogloboquadrina dutertrei) and their fluxes compared to the 1990s, opposite expectations if assemblages and fluxes were to follow anthropogenic warming signals. We hypothesize that the observed decrease in subtropical species abundance and flux is likely related to an increase in acidification and in the timing and magnitude of upwelling along the California coast. The extremely rapid responses of foraminifera to ongoing changes in carbonate chemistry and temperature suggest that climate change is already having a meaningful impact on coastal carbon cycling. The observed decrease in particulate inorganic carbon (PIC) flux relative to particulate organic carbon (POC) flux may facilitate increased oceanic uptake of atmospheric CO2.
- Article
(7843 KB) - Full-text XML
-
Supplement
(303 KB) - BibTeX
- EndNote


Over the last three decades, the annual mean atmospheric CO2 concentration has increased by ∼64 ppm, driving higher sea surface temperatures (SSTs) and acidifying the ocean, negatively impacting marine ecosystems (Keeling et al., 2001; Nagelkerken and Connell, 2015; Lan and Keeling, 2024). Foraminifera are protists that form a calcium carbonate shell and are frequently preserved in marine sediments (Hendy et al., 2004; Field et al., 2006; Kucera, 2007; White et al., 2013; Schiebel and Hemleben, 2017). On geological time (>1000 years) and global spatial scales, foraminiferal communities respond rapidly to climate change (Kucera et al., 2005; Morey et al., 2005; Field et al., 2006; Jonkers et al., 2019). As a result they have been used to study oceanographic and climatic change throughout the Phanerozoic and have greatly contributed to the understanding of major climatic events through analysis of their shell chemistry and species distributions (Lisiecki and Raymo, 2005; Kucera, 2007; Schiebel and Hemleben, 2017; Jonkers et al., 2019) including climate change associated with rapid carbon release and warming such as the Paleocene–Eocene Thermal Maximum (∼56 Ma) (Thomas and Shackleton, 1996; Zachos et al., 2003; McInerney and Wing, 2011). Moreover, marine calcifiers such as foraminifera and coccolithophorids are an important part of the marine carbon cycle and comprise 20 %–80 % of calcite flux to the deep ocean (Schiebel, 2002; Schiebel et al., 2007). Understanding how foraminifera respond to geologically rapid environmental change therefore has important implications for the future carbon cycle, while also providing context for reconstructions of past climate that rely on geochemical and assemblage records of foraminifera.
Foraminiferal assemblages have already shifted in response to local temperature change, such that an assemblage found in the tropics during pre-industrial times now exists at higher latitudes in the late 20th century (Jonkers et al., 2019), a trend also observed in other types of organisms such as tropical corals (Yamano et al., 2011) and barnacles (Crickenberger and Wethey, 2018). Foraminiferal assemblage records from Santa Barbara Basin (SBB) sediments exhibit an increase in the abundance of tropical and subtropical species and a decrease in temperate and subpolar species throughout the warming 20th century (Field et al., 2006). However, temperature is not the sole driver of ecological changes. Rather, foraminifera are impacted by a wide range of factors that vary on multiple timescales. Changes in pH, stratification, temperature, upwelling, nutrient availability, and phytoplankton abundance all have potential influences on the population of planktic foraminifera. They occupy a range of trophic modes, operating as either functional mixotrophs, or exclusive heterotrophs, preying on phytoplankton, zooplankton, and detritus (Lipps and Valentine, 1970; Bé et al., 1977; Schiebel and Hemleben, 2017; Stoecker et al., 2017; Fehrenbacher et al., 2018). The seasonal and interannual variability of foraminiferal abundance is especially important to consider for applications in the paleontological record. For example, if a species is most abundant in the spring upwelling season, then geochemical records of that species will be skewed towards the spring rather than representing an annual average. To most effectively use foraminifera as proxies for past environmental conditions, it is necessary to consider and understand their modern, highly variable habitat at multiple sub-geologic timescales.
Ocean acidification resulting from anthropogenic CO2 emissions is especially relevant in upwelling regions like the SBB (Gruber, 2011; Gruber et al., 2012; Hauri et al., 2009, 2013). Vertical water transport rates during the upwelling season have increased between the late 20th and early 21st centuries near SBB (García-Reyes and Largier, 2010; Jacox et al., 2018). Increased upwelling brings higher salinity, lower temperature, lower pH, and lower dissolved oxygen waters with more nutrients to the surface and tends to promote primary production. However, decreases in the pH of surface water impacts carbonate chemistry, potentially harming calcifying organisms that are sensitive to acidification, including pteropods and foraminifera. In addition to a variety of other environmental parameters such as salinity, oxygen, and temperature, pteropods are impacted by changes in carbonate chemistry (Bednaršek et al., 2019; Johnson et al., 2023; Mekkes et al., 2021). Modern (2016) pteropods, for example, produce thinner aragonite shells in the more acidic, nearshore upwelling zones of the California coast compared to offshore, due to a decrease in calcification (Mekkes et al., 2021). Foraminifera also calcify thinner shells in response to ocean acidification (De Moel et al., 2009; Moy et al., 2009; Osborne et al., 2016; Pallacks et al., 2023).
The SBB sediment trap, located off the coast of California, USA, has provided a nearly continuous, high-resolution record of foraminifera shell and particle flux to the seafloor since 1993. Previous studies have analyzed the flux and species contributions of foraminifera to the sediment trap between 1993 and 1998 (Kincaid et al., 2000; Black et al., 2001), but this has not been revisited over the subsequent decades of rapid climate change. Paired with contemporaneous environmental data, we investigate the drivers of foraminiferal flux and species abundance in samples collected at biweekly intervals between 2014 and 2021 and compare our results to observations between 1993 and 1998 at the same site. Spanning over 30 years of rapid climate change, the SBB sediment trap series provides a unique opportunity to assess rates of change and add nuance to the underlying drivers of species composition and flux. In doing so we will be better able to place modern climate change in the context of past climate history.
Setting: Santa Barbara Basin, California
The SBB sediment trap is located approximately 32 km off the coast of Santa Barbara, California (Fig. 1). Due to the sedimentology of the basin, SBB is the location of several important climate archives (Kennett and Ingram, 1995; Behl and Kennett, 1996; Hendy and Kennett, 2000; Hendy et al., 2004; Field et al., 2006; White et al., 2013). On the floor of the basin, dark, lithogenic (mostly clay) layers are formed throughout the fall and winter. A light layer composed of biogenic silica (mostly diatoms) is deposited during the productive spring season (Thunell et al., 1995). The finely laminated sediment preserved in low-oxygen conditions provides an optimal location for paleoceanographic studies.
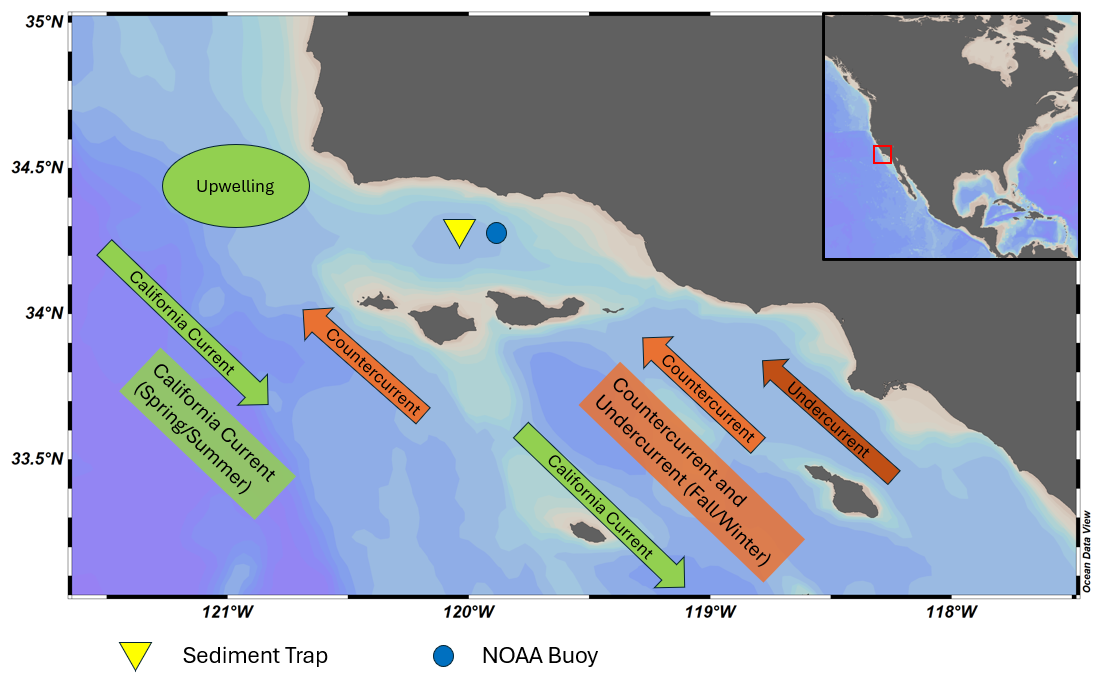
Figure 1Map of Santa Barbara Basin. Major seasonal current directions are shown for spring/summer (green) and fall/winter (orange). The sediment trap and NOAA buoy 46 053 are represented by the yellow triangle and blue circle, respectively. Reiner Schlitzer, Ocean Data View, https://odv.awi.de (last access: August 2024), 2018.
Changing winds and ocean currents create strong seasonal cycles in SBB (Thunell, 1998). The California Current is the dominant source of water, transporting cold, nutrient and oxygen-rich water equatorward from the North Pacific (Bograd et al., 2001). The main current is located 500–800 km offshore (Auad et al., 2011). In the spring and summer, winds blowing southward along the coast promote upwelling off Point Conception, to the west of the basin (Thunell, 1998; Fiedler and Talley, 2006; Catlett et al., 2021). Near-surface oxygen, nitrate and chlorophyll concentrations are highest in the spring when upwelling occurs and stratification is low (Bograd et al., 2001; Black et al., 2011; Catlett et al., 2021; Simons and Catlett, 2023). Diatoms are the most abundant phytoplankton during the spring upwelling season, while picophytoplankton are more abundant in the summer (Catlett et al., 2021). In the fall, winds relax and change direction, reducing upwelling. Stratification increases and nutrient transport to the surface decreases (Bograd et al., 2001; Black et al., 2011; Catlett et al., 2021; Simons and Catlett, 2023). Eastern Tropical North Pacific water is transported to the basin via the inshore Counter Current and California Undercurrent (Fiedler and Talley, 2006; Auad et al., 2011; Davis et al., 2019; Alfken et al., 2021). The California Undercurrent brings warmer, saline, low-oxygen water to the region during the fall and winter (Bograd et al., 2001). Near-surface temperatures are coolest between April–May and warmest in September–October (Pak et al., 2004; SCB Marine Biodiversity Observation Network et al., 2023).
In addition to seasonal upwelling, conditions in SBB are impacted by Pacific multi-annual El Niño–Southern Oscillation (ENSO)-driven changes, the North Pacific Gyre Oscillation (NPGO), the Pacific Decadal Oscillation (PDO), and anthropogenically forced climate change (Black et al., 2001; Pak et al., 2004; Field et al., 2006). Peaks in dinoflagellate abundance are associated with increased poleward flow, reduced upwelling, and the warm phase of the NPGO (Catlett et al., 2021). The warm phase of the PDO is also associated with reduced upwelling and increased poleward flow in SBB (Catlett et al., 2021). The northward advection of relatively warm water during the winter is amplified during some El Niño events (Lynn and Bograd, 2002; McClatchie et al., 2016). From 1993–2021, two strong El Niño events occurred in 1997/1998 and 2015/2016 with weak El Niño conditions occurring in 1993/1994 and 2019 (Trenberth et al., 2024). The 1997/1998 and 2015/2016 El Niño events both exhibited low phytoplankton biomass compared to other years (Catlett et al., 2021). Kincaid et al. (2000) found lower foraminiferal flux during the weak El Niño conditions of 1993/1994. Conversely, Black et al. (2001) reported foraminiferal flux values that were four times higher during the upwelling season in 1997 compared to 1996, with an increase in the relative abundance and flux of G. bulloides during the El Niño year 1997.
2.1 Sample collection, wet picking, and assemblages
Samples were collected at 10–14 d intervals over ∼6 month intervals using a moored McLane Parflux 78H sediment trap deployed at depths >400 m in the central SBB, CA since 1993 (34°14′42.14′′ N, 120°03′33.45′′ W, water column depth of ∼589 m; Eichhubl et al., 2001). Sediment trap particles were preserved in a borate-buffered formalin solution (pH>8) in the sediment trap, minimizing interaction with the surrounding seawater. After trap recovery, samples were split, with a 116th split used for foraminiferal flux and species counts, excluding July–October 2015 and May–November 2020.
Each sample was wet picked for foraminifera following the procedure outlined in Kincaid et al. (2000). The formalin solution was removed using a tap water rinse and samples sieved using a 125 µm sieve, consistent with previous SBB assemblage studies (Kincaid et al., 2000; Black et al., 2001). All foraminifera present in the sample were separated from other sediment trap material using a fine paintbrush and allowed to air dry. Following wet picking, foraminifera were sorted by species and counted to determine foraminiferal flux and relative abundance.
Foraminiferal flux was calculated from the species counts (116th splits) to determine the for each full sample. This method is consistent with the flux calculations used in Kincaid et al. (2000) and Black et al. (2001) for the same sediment trap with an area of 0.5 m2. Possible sources of error include variability associated with creating a 116th split with a wheel splitting device, the potential for missing foraminifera during wet picking, and infrequent breakage of foraminiferal tests, the latter two sources resulting in possible under-counting of foraminifera. The error in foraminiferal flux data from this study is likely similar to that of Kincaid et al. (2000) and Black et al. (2001), as both the methods and sediment trap are consistent.
2.2 Additional datasets
Environmental data were collected from a variety of additional datasets. A description of each dataset and the data obtained from each source is provided in Table A1. All environmental data apart from CTD casts are surface measurements (<5 m), and data were filtered to include only measurements from SBB between 2014 and 2021. Some environmental data from 1993–1998 in SBB were either non-existent or available at a temporal resolution too low to yield meaningful comparisons to the 2014–2021 environmental data. We thus discuss long-term trends only in the available datasets of the Coastal Upwelling Transport Index (CUTI), foraminiferal flux, carbonate flux, and organic carbon flux.
2.3 Statistical methods
We used a correlation matrix to initially investigate relationships between every species and environmental variable. The matrix uses Pearson correlation and the Benjamini and Hochberg (1995) false discovery rate (FDR) p-value correction for multiple-hypothesis significance testing (p<0.05) and was carried out in MATLAB using the “fdr_bh” function (Groppe, 2024). Thermocline characteristics were calculated from Plumes and Blooms and CalCOFI CTD data using MATLAB (See Table A1). The downcast portions of the CTD files were binned in 1 m intervals, and the depth of the mixed layer, thermocline depth, bottom of the thermocline, and thermocline slope were calculated. The thermocline depth was calculated as the depth over which the temperature change was the greatest. Thermocline slope was calculated as the average slope of the thermocline between the bottom of the mixed layer and bottom of the thermocline. Canonical correlation analysis (CCA) provided further analysis of the relationships between species and environmental data and was conducted using the “vegan” package in RStudio (Oksanen et al., 2024; Posit Team, 2024). CCA loadings are the correlations between the canonical variables and environmental or species variables. For example, if a variable has a positive loading, it has a positive correlation with the canonical variable (CCA1 or CCA2) and is positively associated with other variables that have positive loadings on the same canonical variable. We used a periodic regression model to determine the multi-year seasonal distribution for each species in our dataset and performed the same periodic regression analysis on species data from Kincaid et al. (2000) and Black et al. (2001) to provide a comparison between 1993–1998 and 2014–2021. The model uses the log 10 of foraminiferal flux and the periodic date transformation outlined in Jonkers and Kucera (2015), where the transformed date for each sample is equal to day of the year divided by 365.25 and multiplied by 2π. Data visualization for the periodic regression was carried out with the “ggplot2” package in RStudio (Wickham, 2009; Posit Team, 2024). Periodic regressions for each time series and species are shown, e.g., the log of species flux is plotted against day of the year. To compare the seasonal distribution of each species between 1993–1998 and 2014–2021, species fluxes were binned by month for the duration of each time series, and the average flux values were calculated for each month. A first order polynomial linear regression (in MATLAB) was used to assess rates of change in foraminiferal flux between the two sample sets. A date transformation was applied to each sample such that the new date is equal to years elapsed since the collection of the first sediment trap sample in 1993. This date transformation results in a best fit line with a slope in units of foraminiferal flux per year. Two-sided Wilcoxon rank sum tests were used to test the significance of changes in median foraminiferal flux. An unequal variance t test was used to assess the significance of changes in mean PIC/POC.
3.1 The Santa Barbara Basin sediment trap: 2014–2021
This study presents results from 164 sediment trap samples, collected between 24 May 2014 and 11 November 2021. The total number of 60 006 individual foraminifera includes 25 morphospecies (Tables 1 and A2). Images of the 10 most abundant morphospecies are presented in Fig. A1. The most abundant species are G. bulloides, T. quinqueloba, and N. incompta (Table 1). Globigerina bulloides is consistently abundant throughout the year, with some slight seasonal peaks in the spring and summer (Figs. 2–4). Turborotalita quinqueloba is present year-round, but most abundant during the spring and summer when upwelling is active (Figs. 2–4). Neogloboquadrina incompta increases in abundance during the fall and winter months (Figs. 2–4). Globoturborotalita rubescens and Globigerinoides ruber are the most abundant subtropical species, followed by Orbulina universa and Neogloboquadrina dutertrei (Table 1). Some rare species (defined here as species contributing less than 0.7 % of the total assemblage) were also found, including Globorotalia truncatulinoides and the tropical Trilobatus sacculifer (Table 1). Benthic foraminifera contributed less than 0.5 % of the total assemblage and there was no evidence of major resuspension events or landslides throughout the study period.
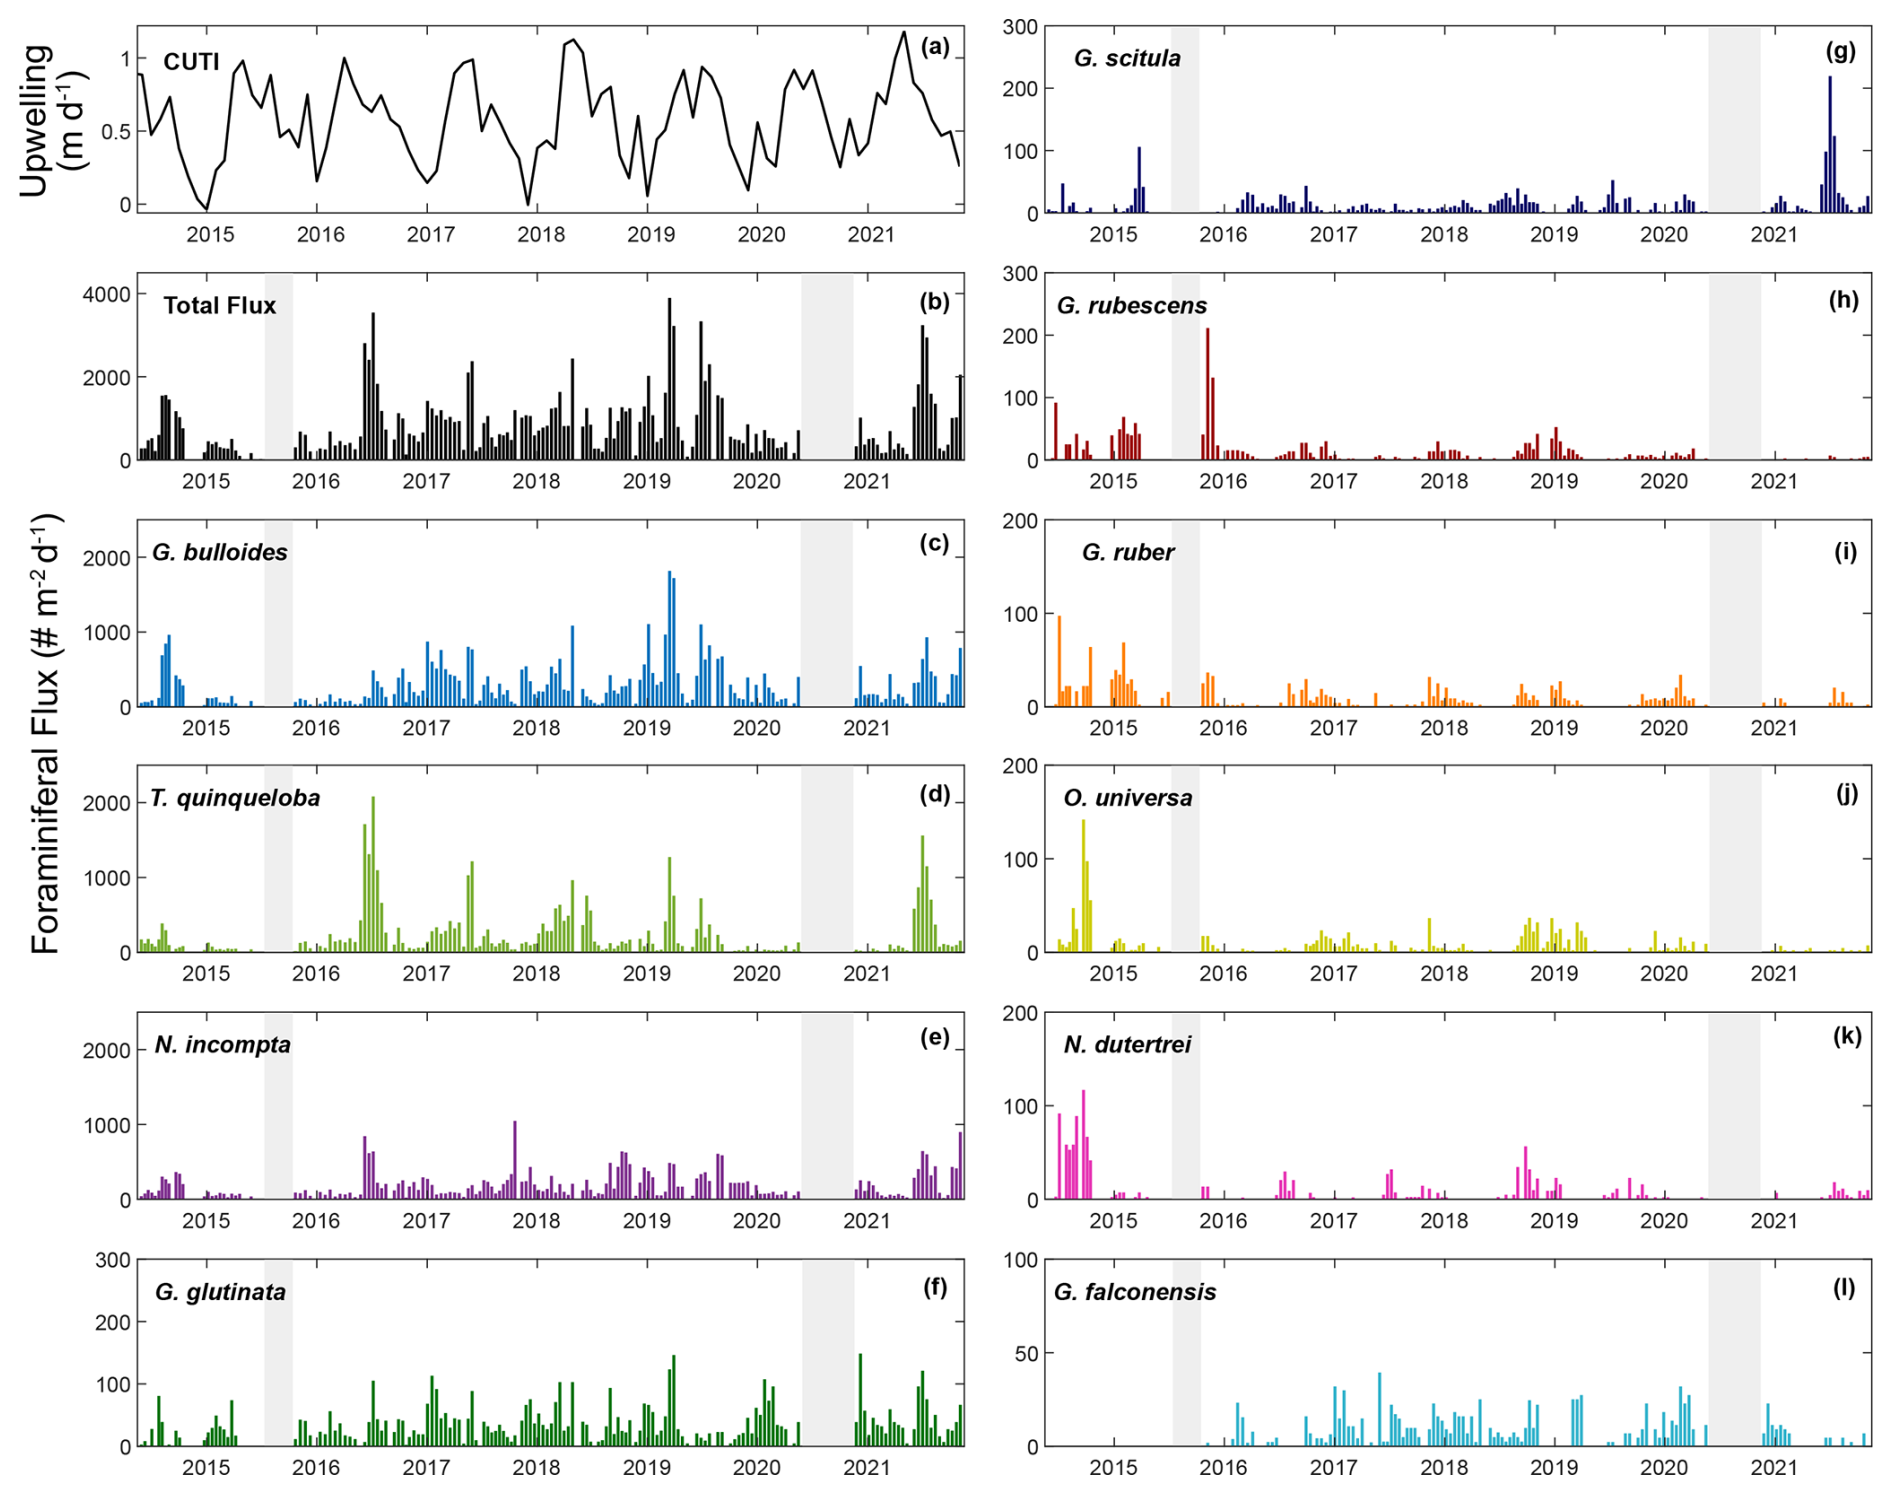
Figure 2Time series of upwelling (CUTI), total foraminiferal flux, and the 10 most abundant species presented in order of abundance. Transitional to subpolar species (c–g, l) are represented in cool colors, and subtropical species (h–k) are represented in warm colors. Gray bars indicate periods without sample collection.
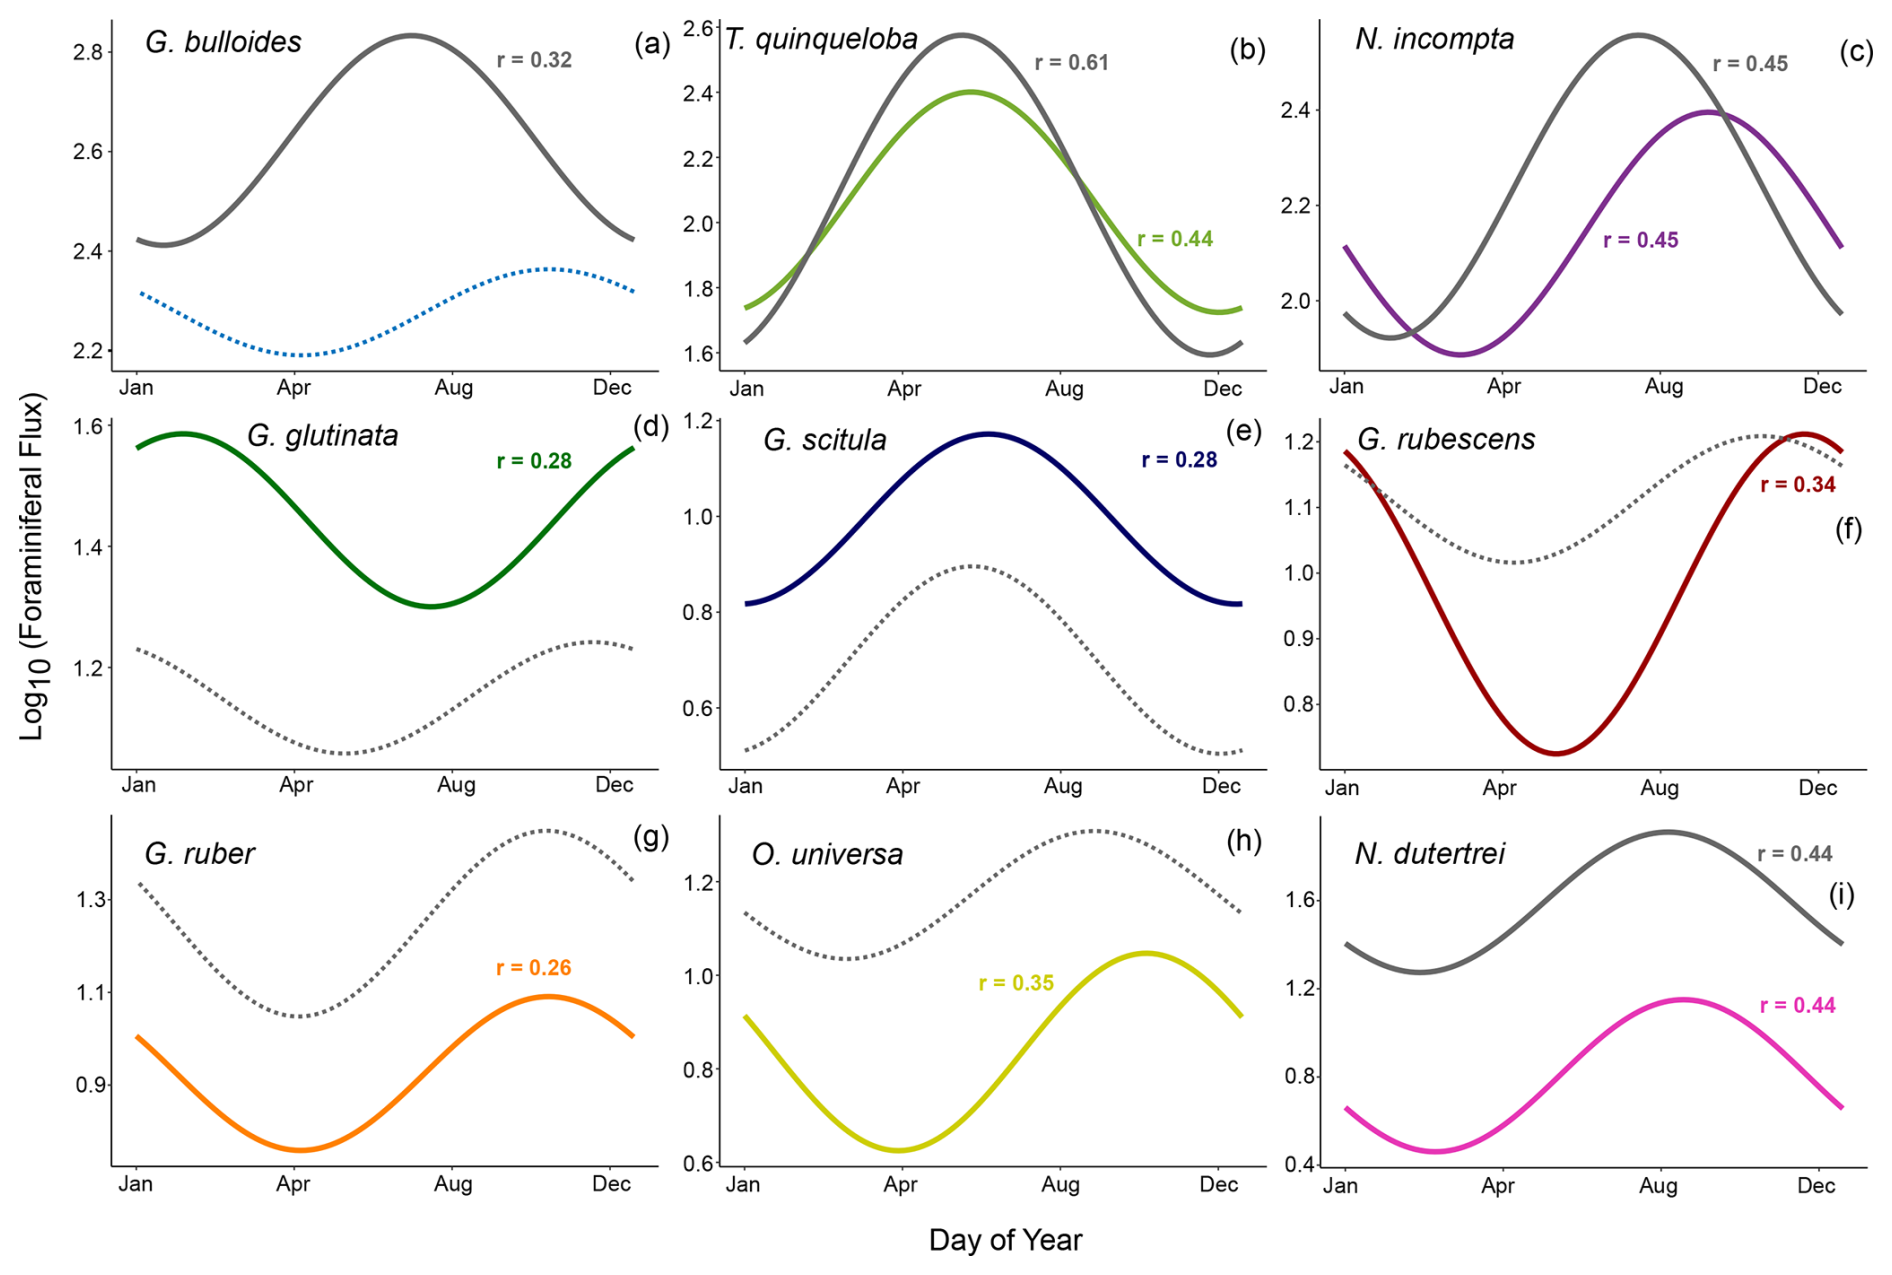
Figure 3Periodic regression of the nine most abundant species presented in order of abundance. Model fits from 1993–1998 are shown in gray (data from Kincaid et al., 2000, and Black et al., 2001) and fits from 2014–2021 are shown in color. Solid lines show significant models where p<0.05. Non-significant models (p>0.05) are dotted.
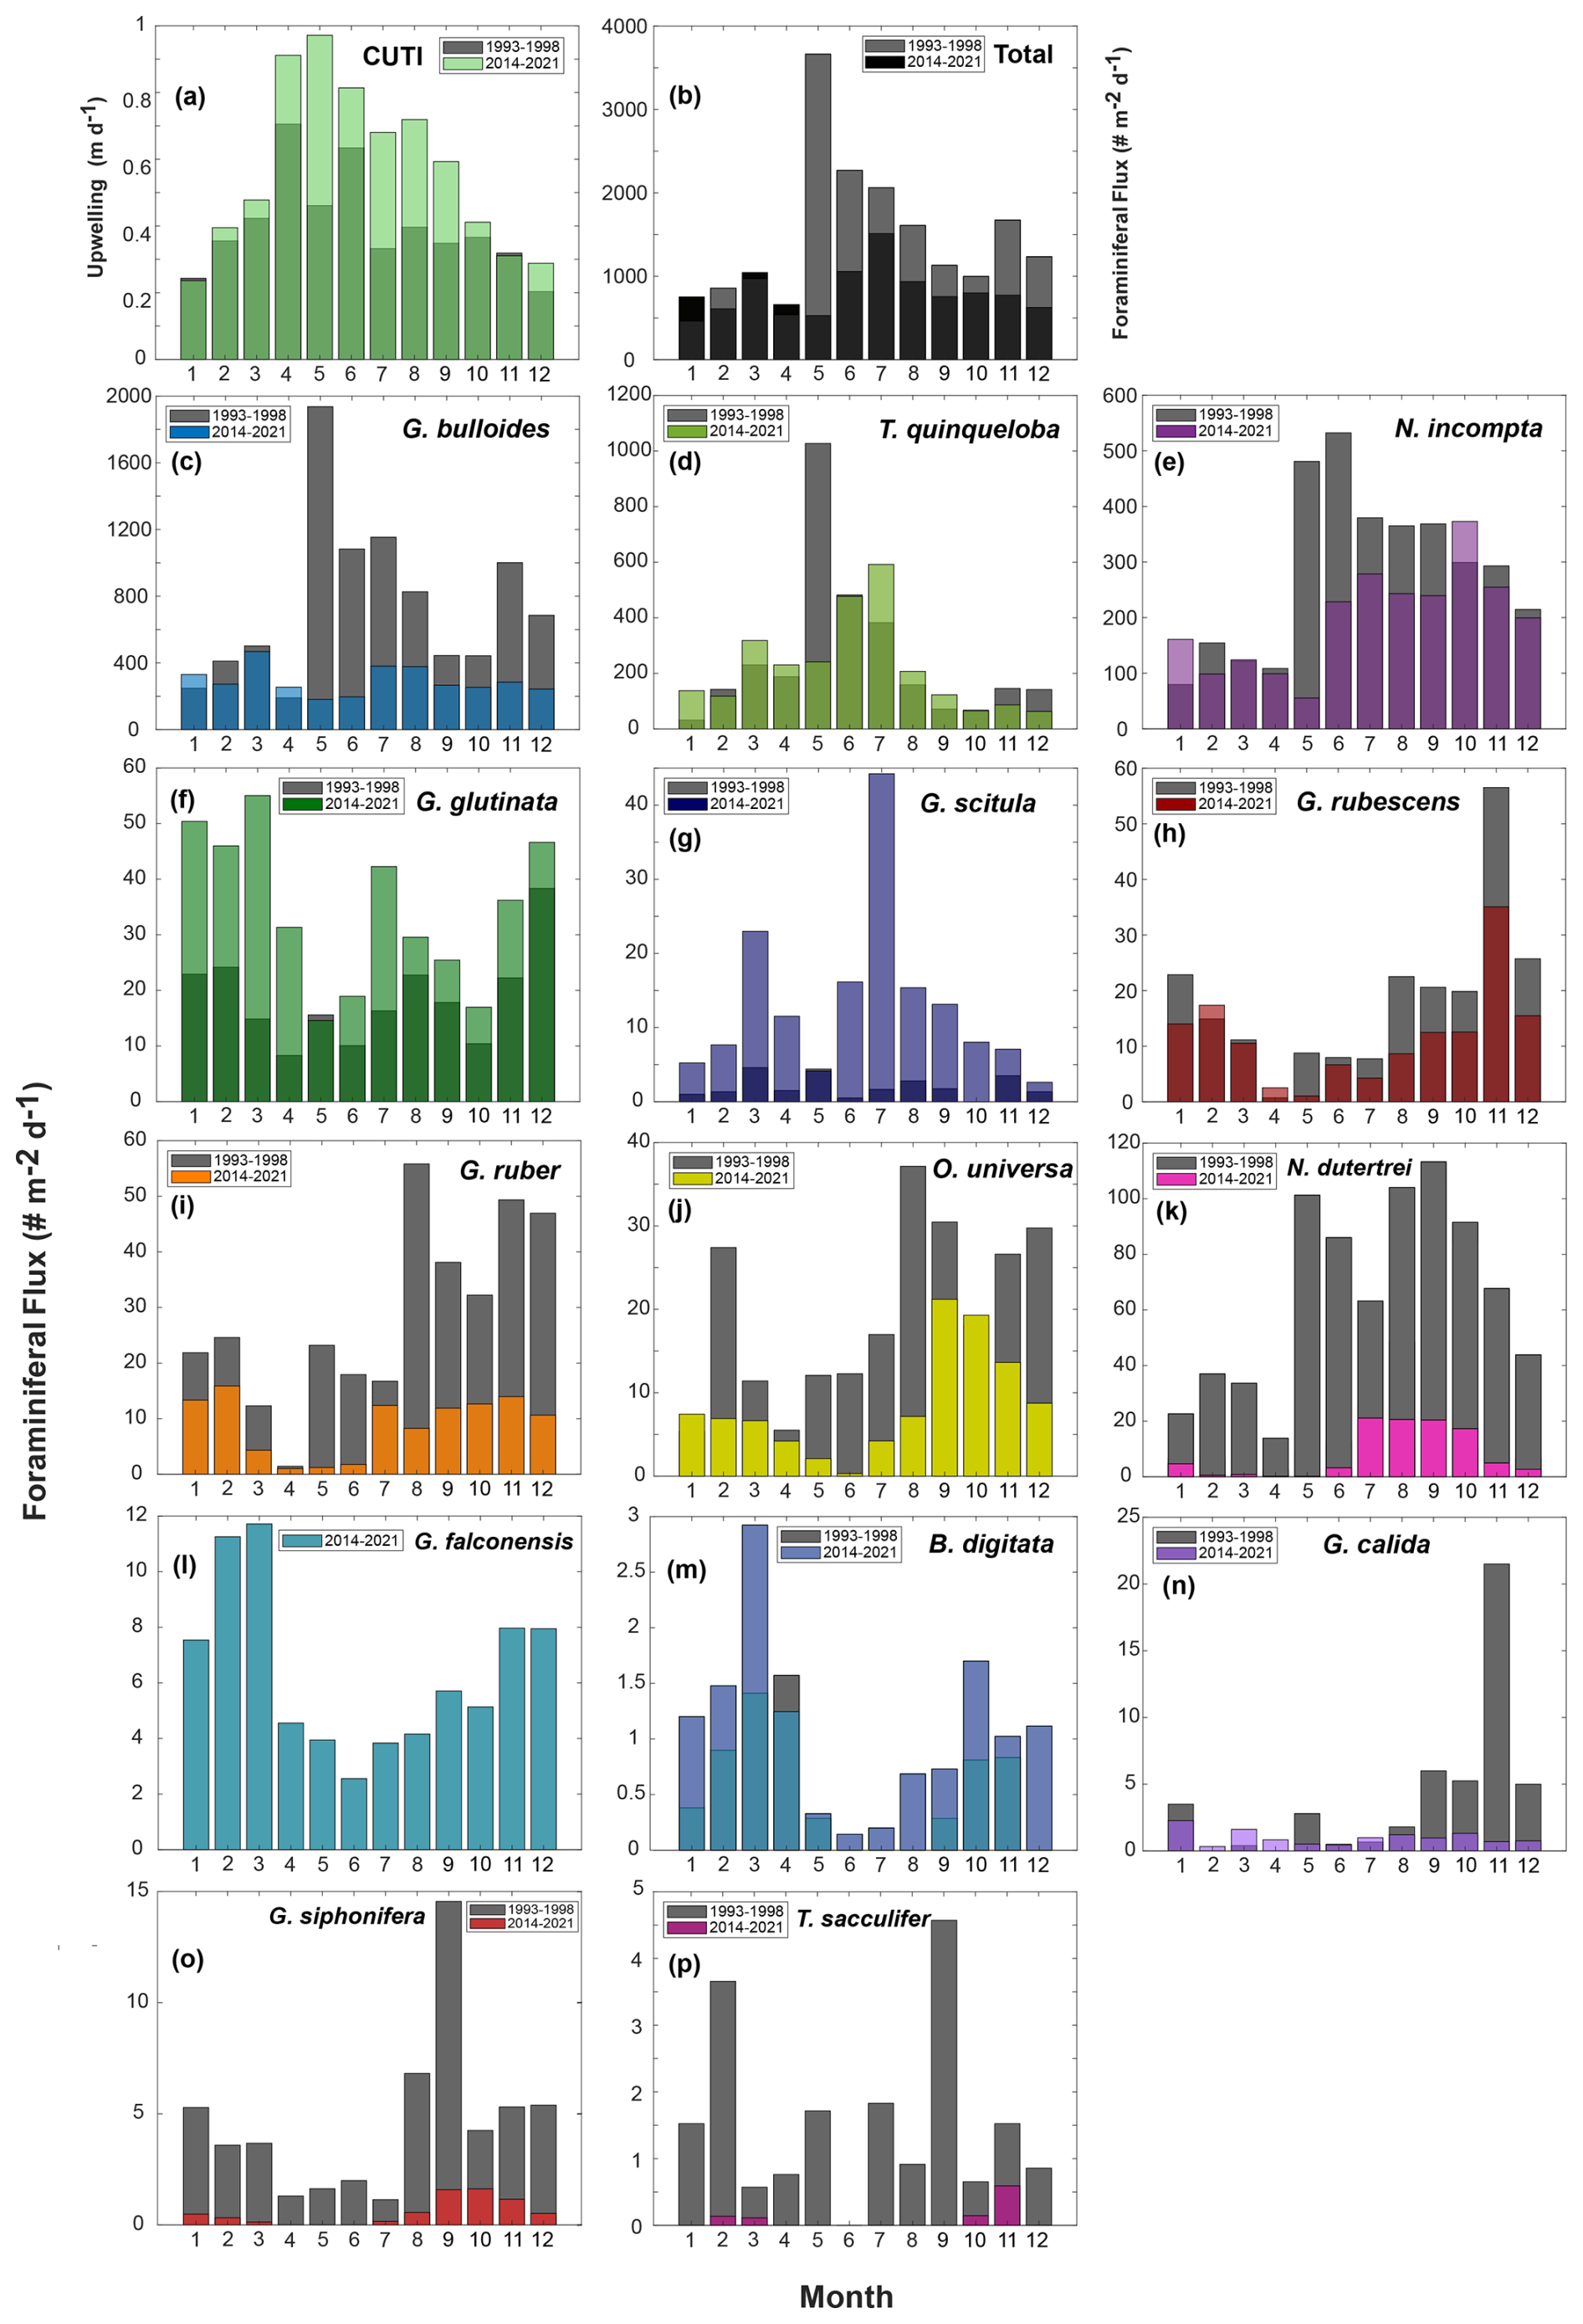
Figure 4Seasonal species plots from 1993–1998 (gray) (data from Kincaid et al., 2000, and Black et al., 2001) and 2014–2021 (this paper) (colors are overlain). CUTI (a) is shown following the same binning and averaging method as species data, along with total foraminiferal flux (b). Species chosen include the most abundant species (c–l) and rare species (m–p) that were consistently speciated throughout both time periods (B. digitata, G. calida, G. siphonifera, and T. sacculifer), presented in order of abundance.
Table 1All species counts (from 116th splits) in order of abundance.
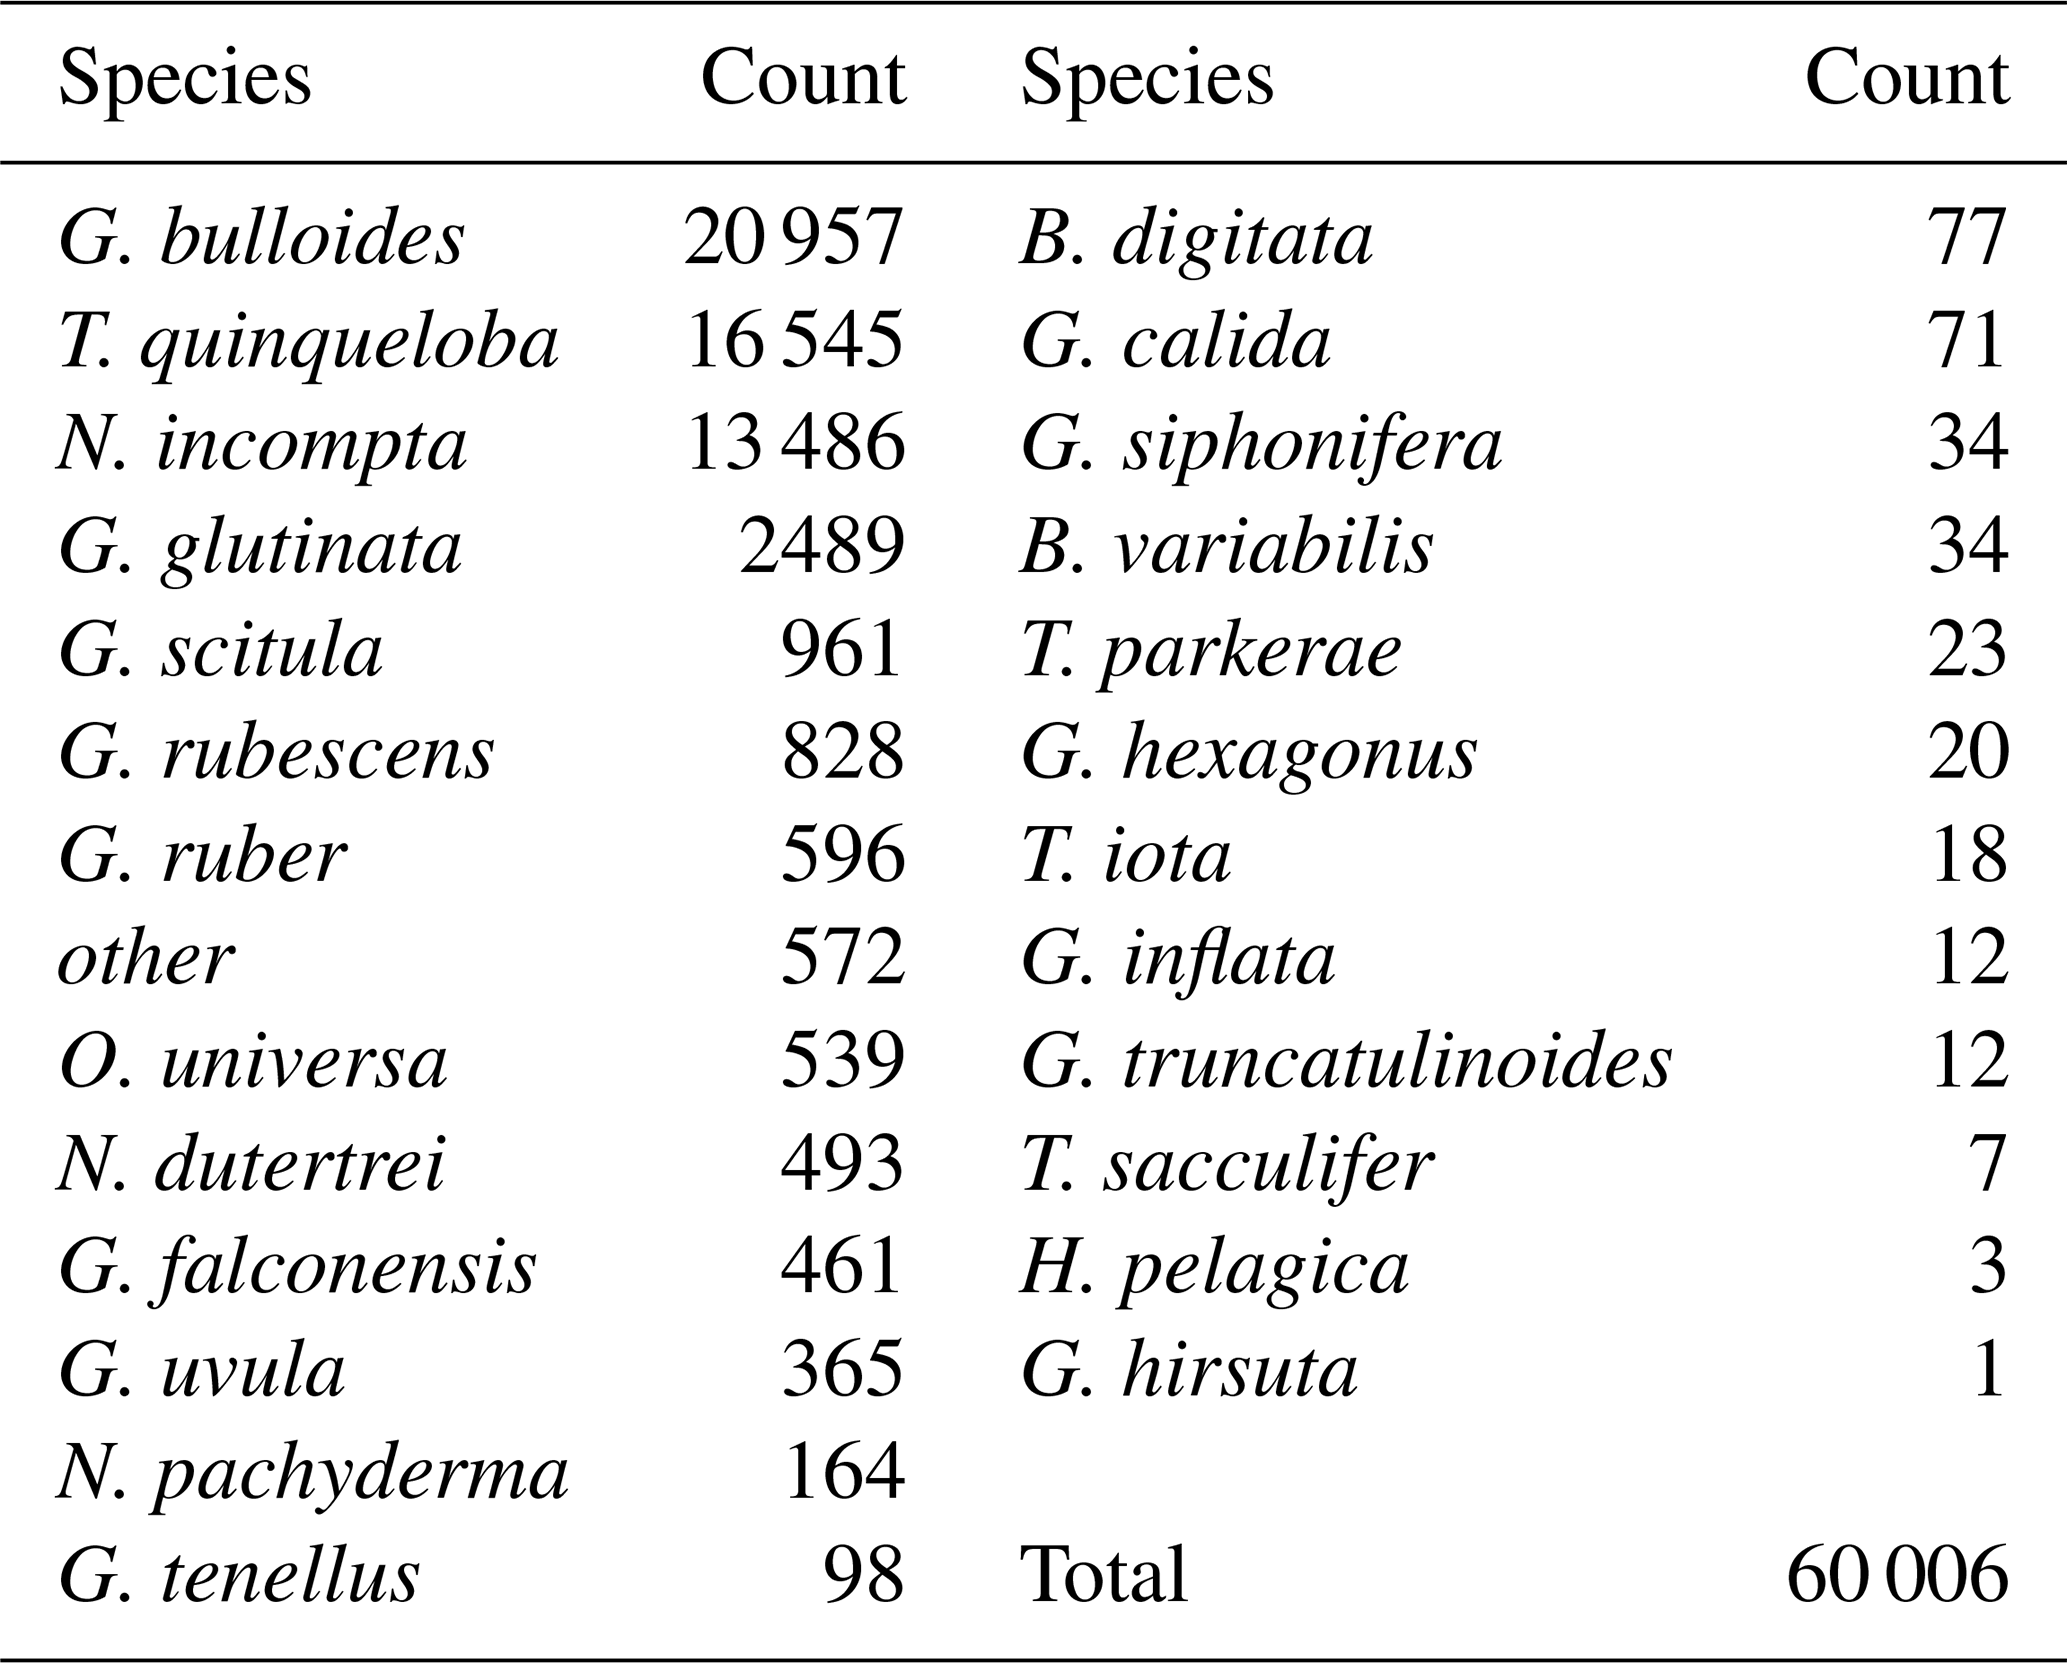
Foraminiferal flux averages 850 throughout the study period. The maximum total flux of 3895 occurs in March 2019 (Fig. 2). Foraminiferal species G. bulloides and T. quinqueloba dominate total fluxes depending on the sample and season (Fig. 2). Neogloboquadrina incompta comprises a greater proportion of total flux when the abundances of G. bulloides and T. quinqueloba are low, most commonly in the fall months (Fig. 2). Globigerinita glutinata and G. scitula are present throughout the year with lower fluxes than the three major species (Table 1 and Fig. 2). Subtropical species (G. ruber, G. rubescens, O. universa, and N. dutertrei) have relatively low fluxes that peak in the fall and winter when upwelling is reduced (Figs. 2–4). During the upwelling season, the flux of subtropical species is near zero (Figs. 2–4). Exceptions to this general pattern occur in late summer/early fall of 2014, when fluxes are especially high (Fig. 2). The flux of G. rubescens is also high in the late fall of 2015 (Fig. 2).
Correlations (r) between each species and environmental variable are shown in Fig. 5. Surface measurements are presented with a 14 d lag to account for the growth and life cycle of foraminifera in response to water-column environmental conditions. Once foraminifera die, they sink to the depth of the sediment trap in 1–4 d (Takahashi and Be, 1984). Variables from the SBB sediment trap are not lagged.
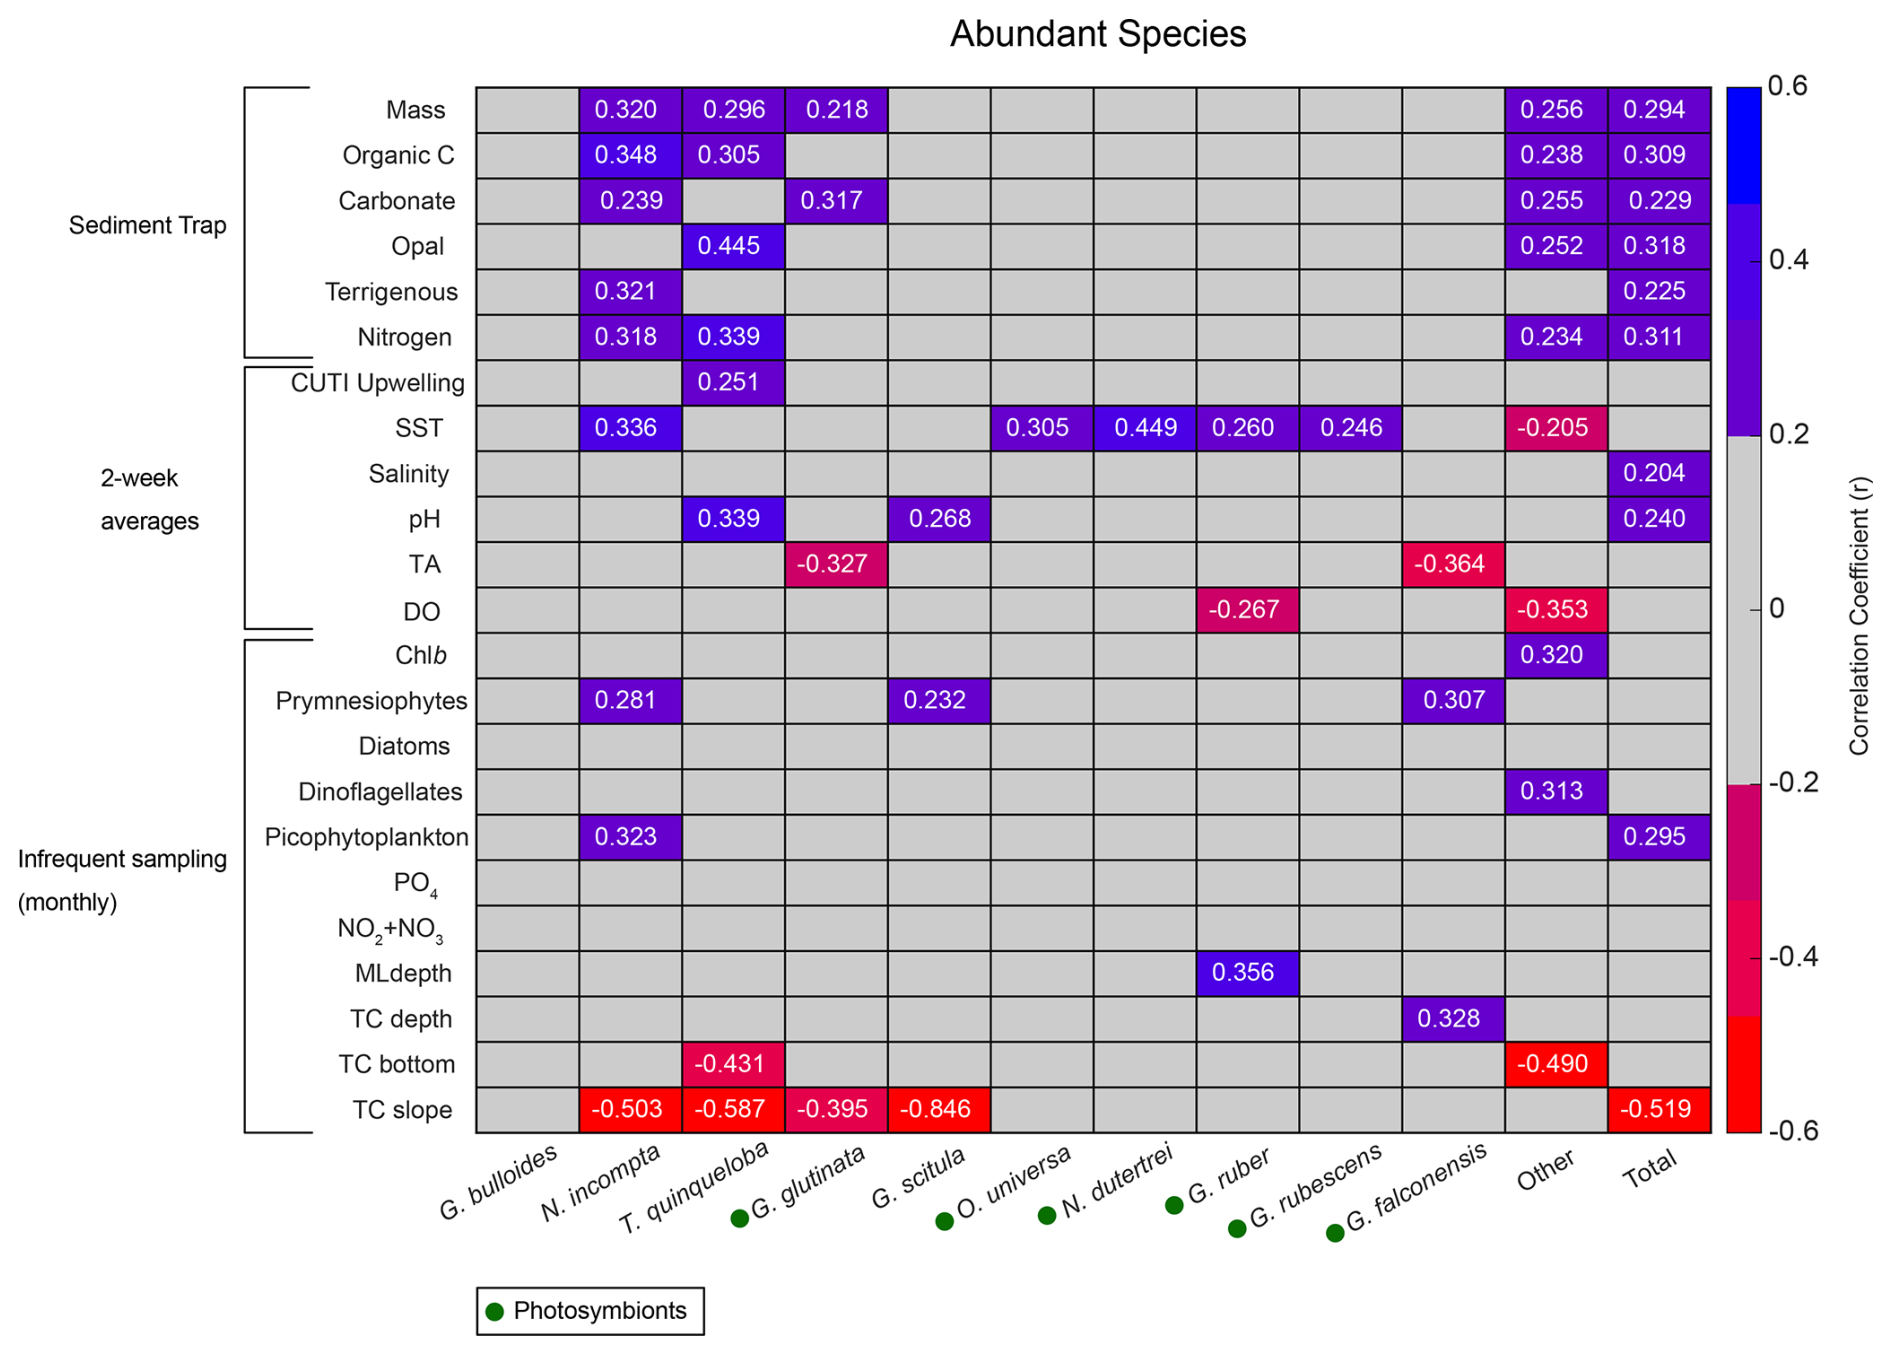
Figure 5Correlation matrix of abundant species flux (x axis) with environmental parameters (y axis). Pearson correlation coefficients (r) for statistically significant correlations (p<0.05) are listed as numbers. Blue shades represent positive correlations, and red shades represent negative correlations. Gray represents correlation coefficients<0.2. Presence of photosymbionts based on Takagi et al. (2019), Schiebel and Hemleben (2017), and Meilland et al. (2022) is represented by green circles.
Total foraminiferal flux is positively correlated with sample mass and other parameters from the sediment trap, with larger samples containing both more foraminifera and more particle flux overall (Fig. 5). Neogloboquadrina incompta and T. quinqueloba are generally positively correlated with sediment trap parameters as well (Fig. 5). The most abundant species, G. bulloides, present in high abundance in SBB throughout every season and every year, has no significant correlations with environmental parameters (Figs. 2, 4, and 5). Turborotalita quinqueloba has the strongest correlation with upwelling (r=0.251, p<0.05) and sediment trap opal (r=0.445, p<0.05) out of every species (Fig. 5). Neogloboquadrina incompta correlates positively with SST (r=0.336, p<0.05), picophytoplankton (r=0.323, p<0.05), and prymnesiophytes (r=0.281, p<0.05) (Fig. 5). This is consistent with N. incompta's seasonal pattern, peaking in late September with generally higher abundance in the latter half of the year (Figs. 3–5). Globorotalia scitula has similarities to T. quinqueloba, with an especially strong negative correlation (, p<0.05) to the thermocline slope (Fig. 5). Turborotalita quinqueloba has a negative correlation to the depth of the bottom of the thermocline as well (, p<0.05) with abundances higher when the thermocline is shallower (Fig. 5). These species seem to prefer the steep, shallow thermocline characteristic of the upwelling season. The subtropical species show an opposite trend, where G. ruber is positively correlated with a deeper mixed layer (r=0.356, p<0.05) (Fig. 5). When the mixed layer is deeper, the thermocline is more gently sloping and extends deeper. This condition correlates significantly with G. falconensis (r=0.328, p<0.05) (Fig. 5). Other subtropical species, O. universa and N. dutertrei, are significantly correlated to SST (r=0.350, p<0.05 and r=0.449, p<0.05, respectively) rather than thermocline characteristics, preferring warmer water (Fig. 5).
Correlations for rare species contributing less than 0.7 % of the total assemblage were run separately from the more abundant species due to less overlap between species occurrence and environmental data. Species that contribute less than 0.002 % of the total assemblage were excluded. Rare species have fewer significant correlations with environmental parameters compared to the abundant species (Fig. A2). There are no significant correlations (p<0.05) with sample mass and rare species (Fig. A2). Much like N. incompta, N. pachyderma has a positive correlation with picophytoplankton (r=0.472, p<0.05) (Fig. A2). Globigerinella siphonifera, a subtropical species, has a positive correlation with SST (r=0.346, p<0.05) (Fig. A2). Globorotaloides hexagonus has a negative correlation with thermocline slope (, p<0.05), consistent with T. quinqueloba and G. scitula (Fig. A2).
Canonical correlation analysis
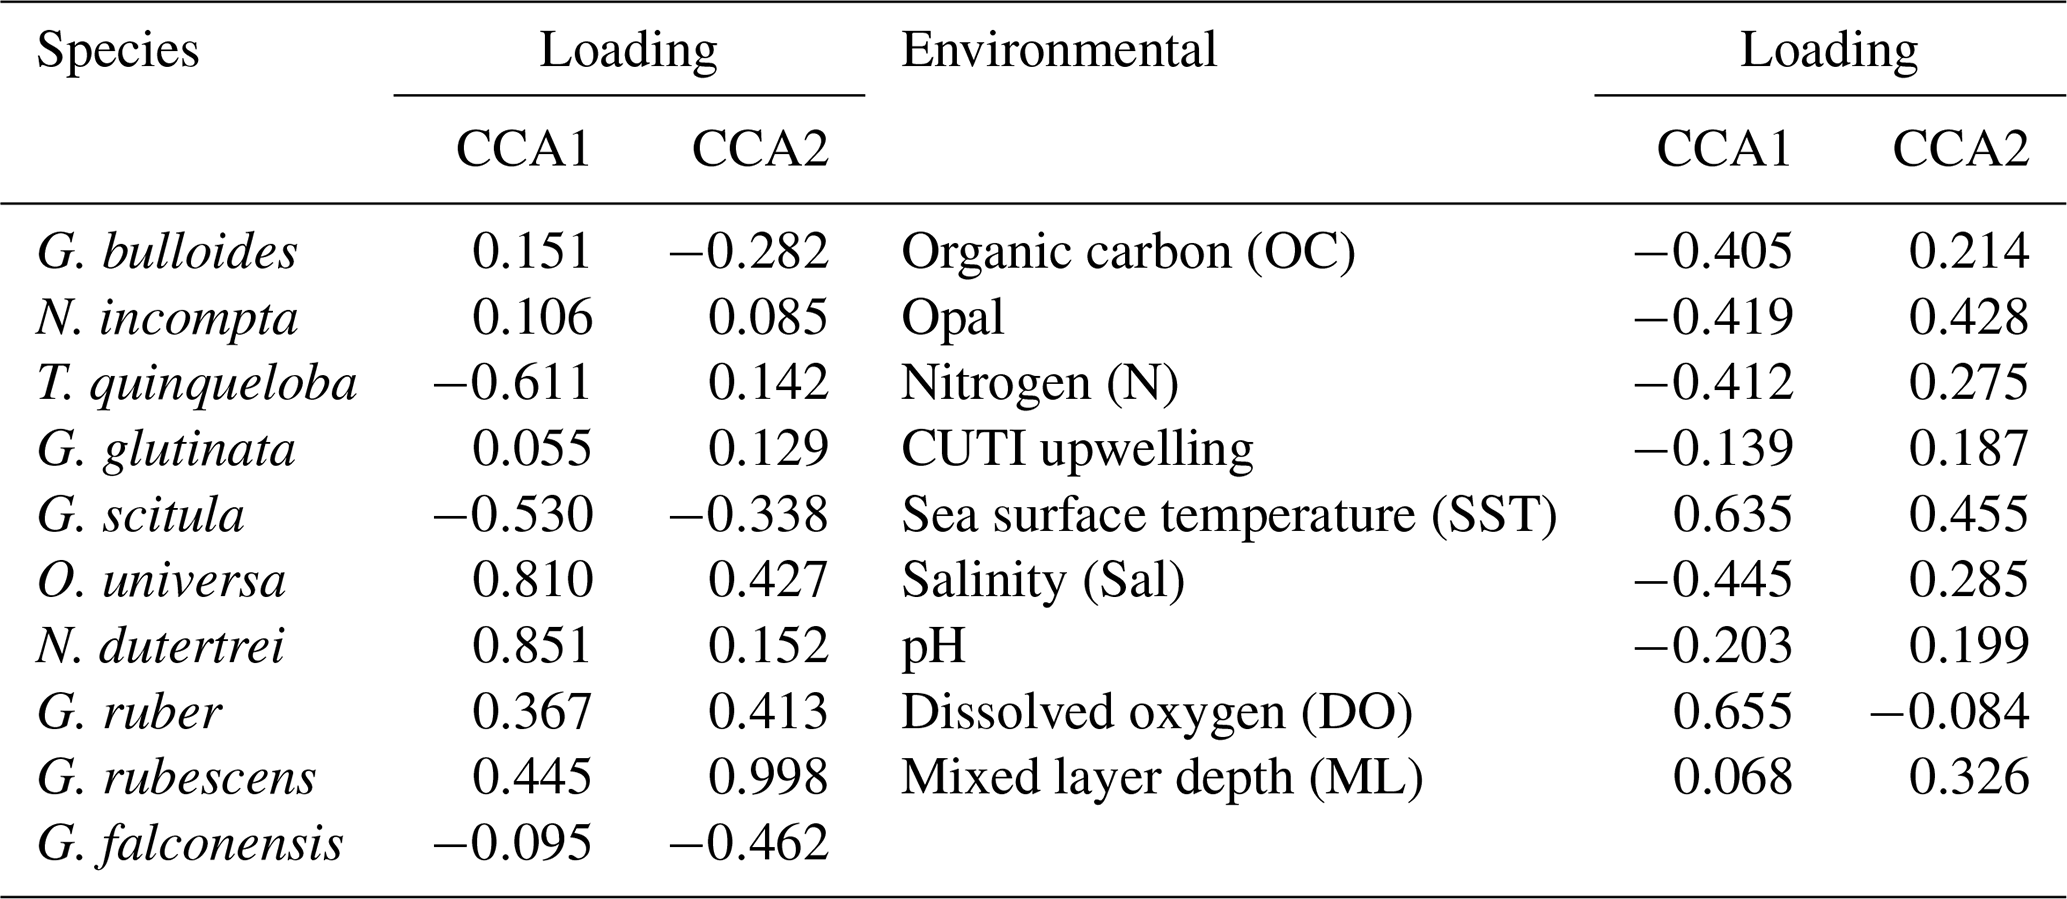
CCA1 constrains 21.7 % of variability and is primarily driven by SST and surface dissolved oxygen in the positive direction. Salinity, pH, and CUTI drive CCA1 in the negative direction, along with fluxes of nitrogen, opal, and organic carbon from the sediment trap (Fig. 6 and Table 2). Turborotalita quinqueloba is most closely associated with variables negatively loaded on CCA1 compared to other species (Fig. 6 and Table 2). Globorotalia scitula is also negatively loaded to CCA1. Globigerina bulloides has a positive loading on CCA1 and trends in the opposite direction from upwelling related variables and T. quinqueloba (Fig. 6 and Table 2). CCA2 constrains 15.0 % of variability. SST and mixed layer depth are positively loaded on CCA2, along with the variables in the northwest quadrant (CUTI, pH, opal, nitrogen, salinity, organic carbon) (Fig. 6). The species most associated with SST are O. universa, G. ruber, N. dutertrei, and G. rubescens (Fig. 6). Globoturborotalita rubescens has the strongest positive loading on CCA2, positively associated with SST and mixed layer depth and negatively with surface dissolved oxygen (Fig. 6 and Table 2). Loadings for each species and environmental variable are listed in Table 2.
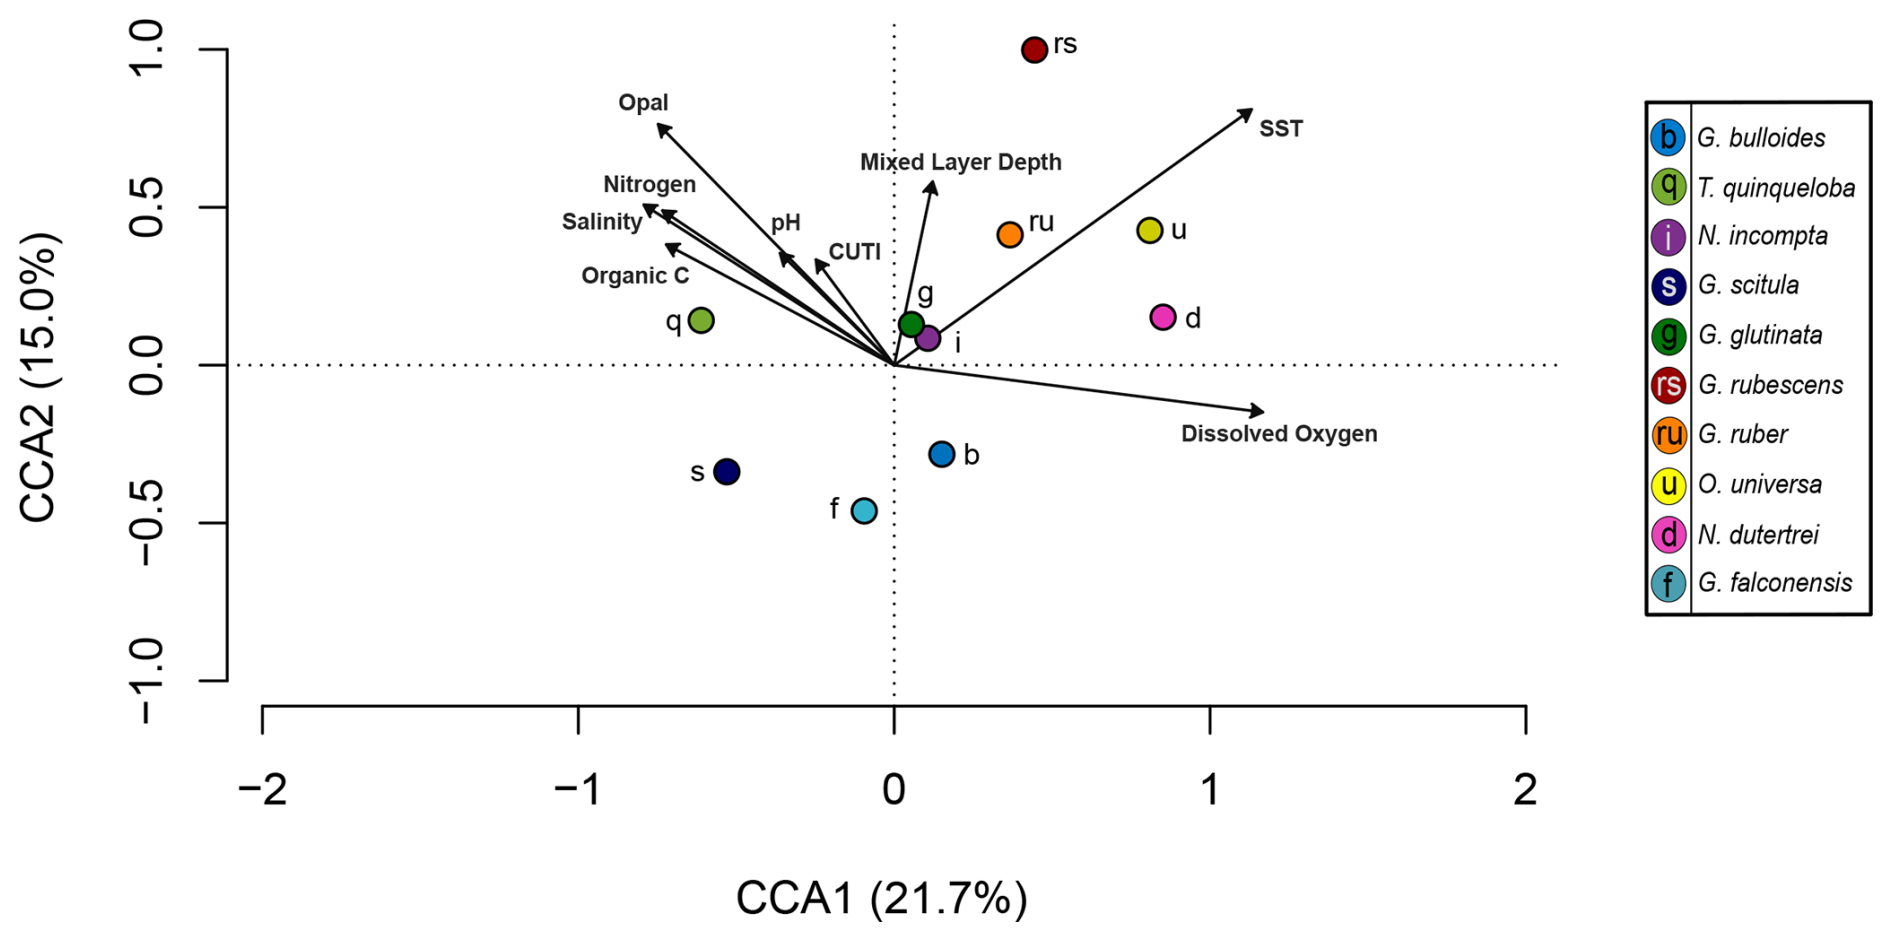
Figure 6Canonical correlation analysis of 10 most abundant species (points) and environmental variables (arrows). Environmental variables include sediment trap parameters (organic carbon, nitrogen, opal) and water column parameters (salinity, surface pH, Coastal Upwelling Transport Index (CUTI), mixed layer depth, sea surface temperature, surface dissolved oxygen). The full model constrains 54.7 % of variability, with CCA1 and CCA2 accounting for a combined 36.7 %. Adjusted R2=0.22 and p=0.016.
Table 2Loadings for species and environmental variables on CCA1 and CCA2.
3.2 Seasonal patterns in foraminiferal flux and comparison to 1993–1998
Total foraminiferal flux between 2014–2021 has decreased relative to 1993–1998. The median of the total flux, a metric chosen to avoid biasing by the single-sample 1997 peak in flux, decreased by 372.5 , or 37.9 % (). Median G. bulloides flux decreased by 267.7 (−58.8 %, ), and N. incompta flux decreased by 84.3 (−40.5 %, p=0.003). The largest contributor to the decrease in total foraminiferal flux is G. bulloides, followed by N. incompta. Turborotalita quinqueloba flux remained unchanged relative to 1993–1998 (p=0.74) (Fig. 7). Note that all changes in median foraminiferal flux remain significant at the p<0.05 level even after the removal of the peak flux that occurred in 1997. Given the decrease in total flux, a potential decrease in foraminiferal size over time is important to consider. Between 1993–1998 and 2014–2021, the fluxes of the two smallest and most abundant species, T. quinqueloba and G. glutinata, remained consistent or increased slightly. Therefore, we conclude that a decrease in shell size to below the 125 µm sieve size is not a major contributing factor for the observed decrease in total foraminiferal flux.
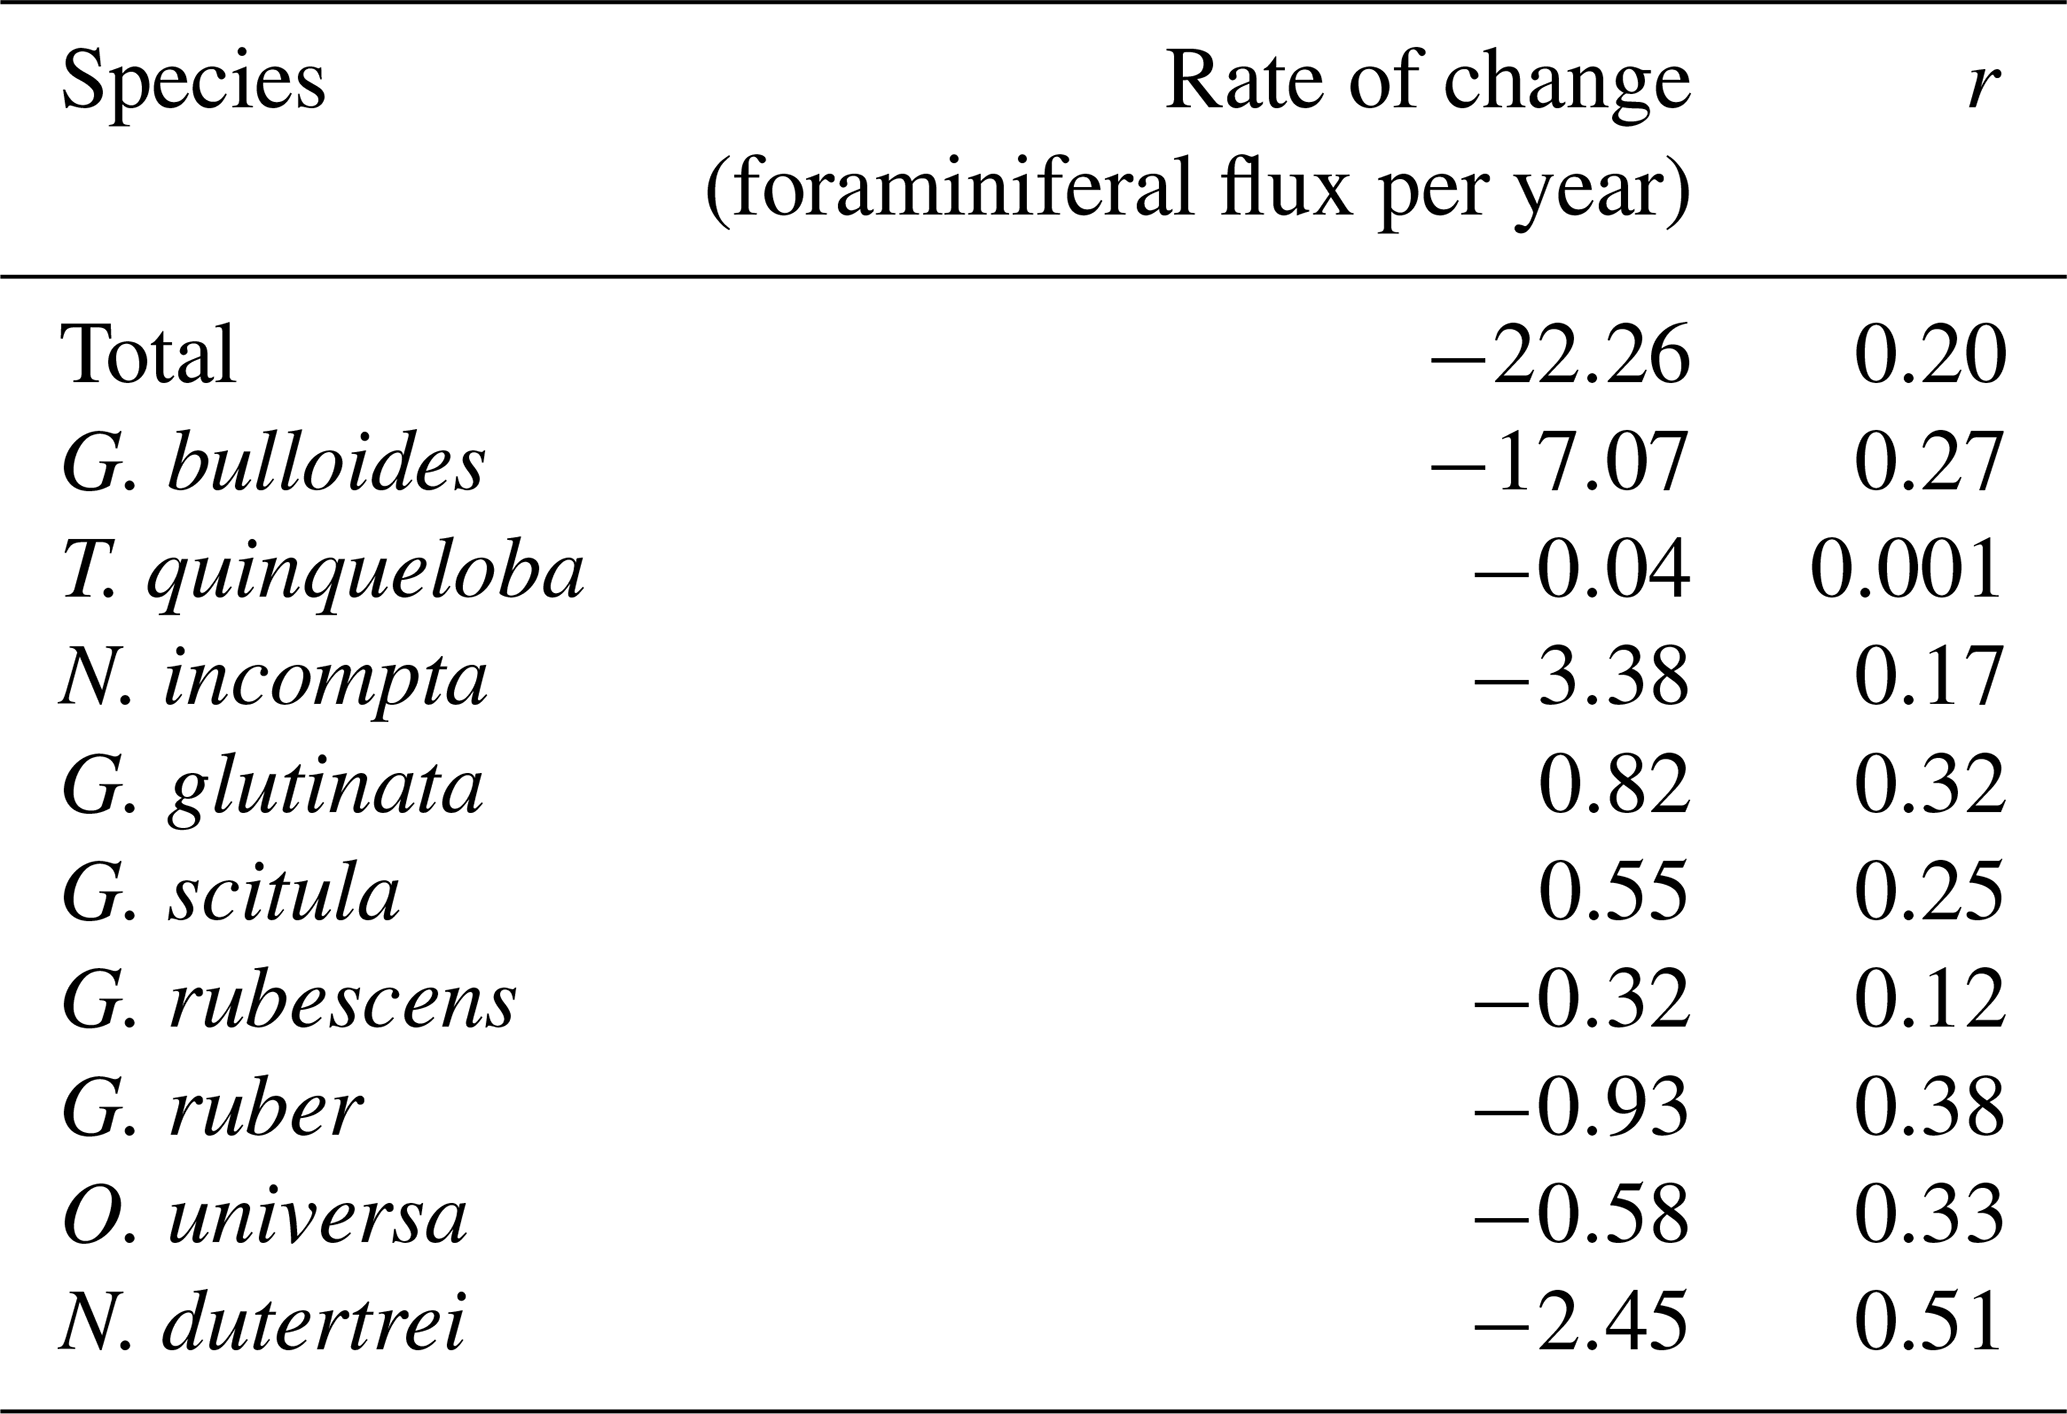
The rates of change of foraminiferal flux for all comparable and abundant species are based on bi-weekly fluxes from 1993–2021 and are presented in Table 3, where negative values indicate a decrease in flux between 1993 and 2021 (Tables 3 and A3, Fig. A3). An additional table of rates of change with the peak flux point in 1997 removed is presented in Table A3. Between 1993 and 2021, the change in total foraminiferal flux per year was −22.26 (Table 3). Globigerina bulloides had the highest rate of change, with foraminiferal flux decreasing by 17.07 yr−1 (Table 3 and Fig. A3). Subtropical species flux decreased over time, with changes between −2.45 (N. dutertrei) and −0.32 (G. rubescens) foraminiferal flux per year. However, the median flux of G. rubescens did not change significantly from 1993–2021 Only two species, G. glutinata and G. scitula, exhibited positive rates of change (Table 3).
Table 3Rates of change from 1993–2021 presented as foraminiferal flux per year (2nd column) and correlation coefficients (r) of the linear regression for each species (3rd column).
This time series contains two strong El Niño events. There was a large total flux peak in the summer of 1997, during the 1997/1998 El Niño (Fig. 7; Black et al., 2001), where the three most common species reached their maximum flux values. Globigerina bulloides contributed most to total foraminiferal flux, followed by T. quinqueloba (Fig. 7; Black et al., 2001). The 2015/2016 El Niño does not exhibit the same pattern. Globigerina bulloides abundance is extremely low throughout the event, while T. quinqueloba and N. incompta abundance increase during the summer of 2016, with fluxes that surpass the summer peaks of every other year from 2014–2021 (Fig. 7). Subtropical species flux increased during both strong El Niño events (Fig. 7; Black et al., 2001). Fluxes of G. ruber and N. dutertrei are consistently lower from 2014–2021 compared to 1993–1998 (Fig. 7; Kincaid et al., 2000; Black et al., 2001). Orbulina universa flux is high in 2014, but it is much lower than it was in the 1990s in every subsequent year (Fig. 7). From 1993–1997, G. rubescens flux was very low, but increased to reach its peak value during the 1997/1998 El Niño (Fig. 7; Black et al., 2001). From 2014–2019, G. rubescens flux is higher than it was from 1993–1997 and decreases from 2020–2021 (Fig. 7).
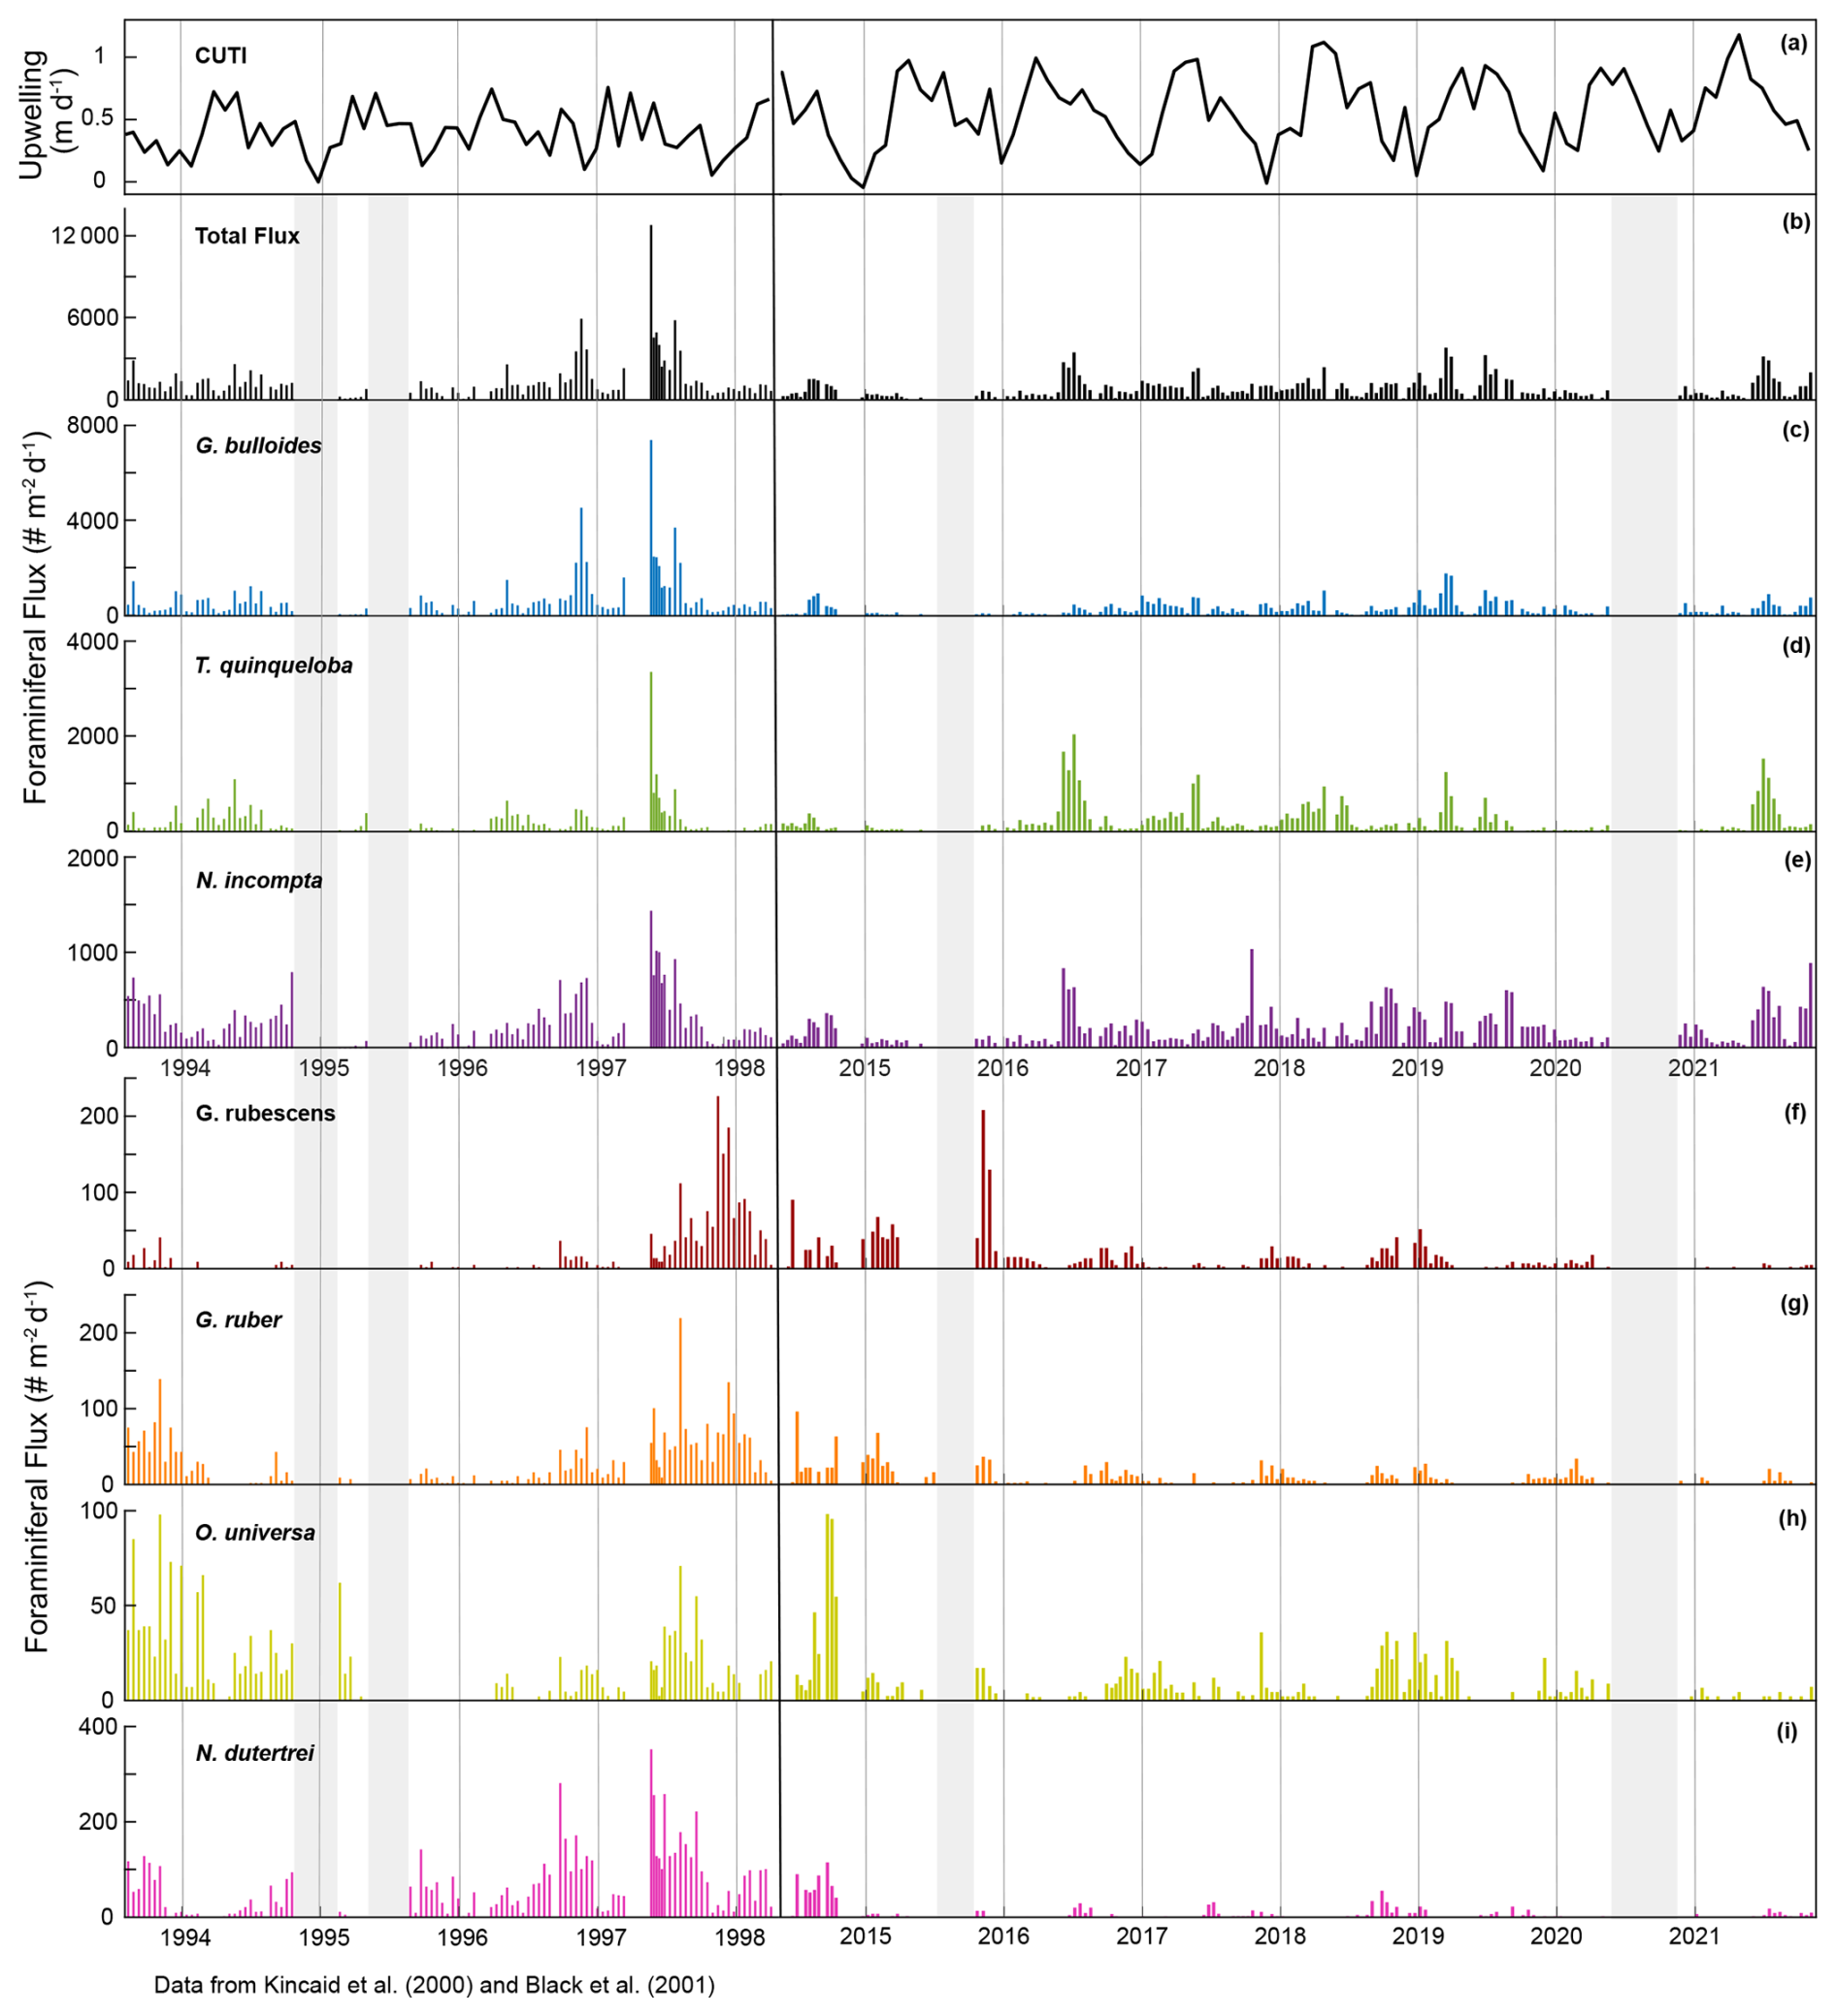
Figure 7Time series of CUTI (a) and SBB sediment trap foraminiferal flux from Kincaid et al. (2000) and Black et al. (2001) (left) and this study (right). Total flux (b) and the three most abundant species, G. bulloides (c), T. quinqueloba (d), and N. incompta (e). Major subtropical species are shown in warm colors: G. rubescens (f), G. ruber (g), O. universa (h), and N. dutertrei (i). Gray shading indicates periods without sample collection.
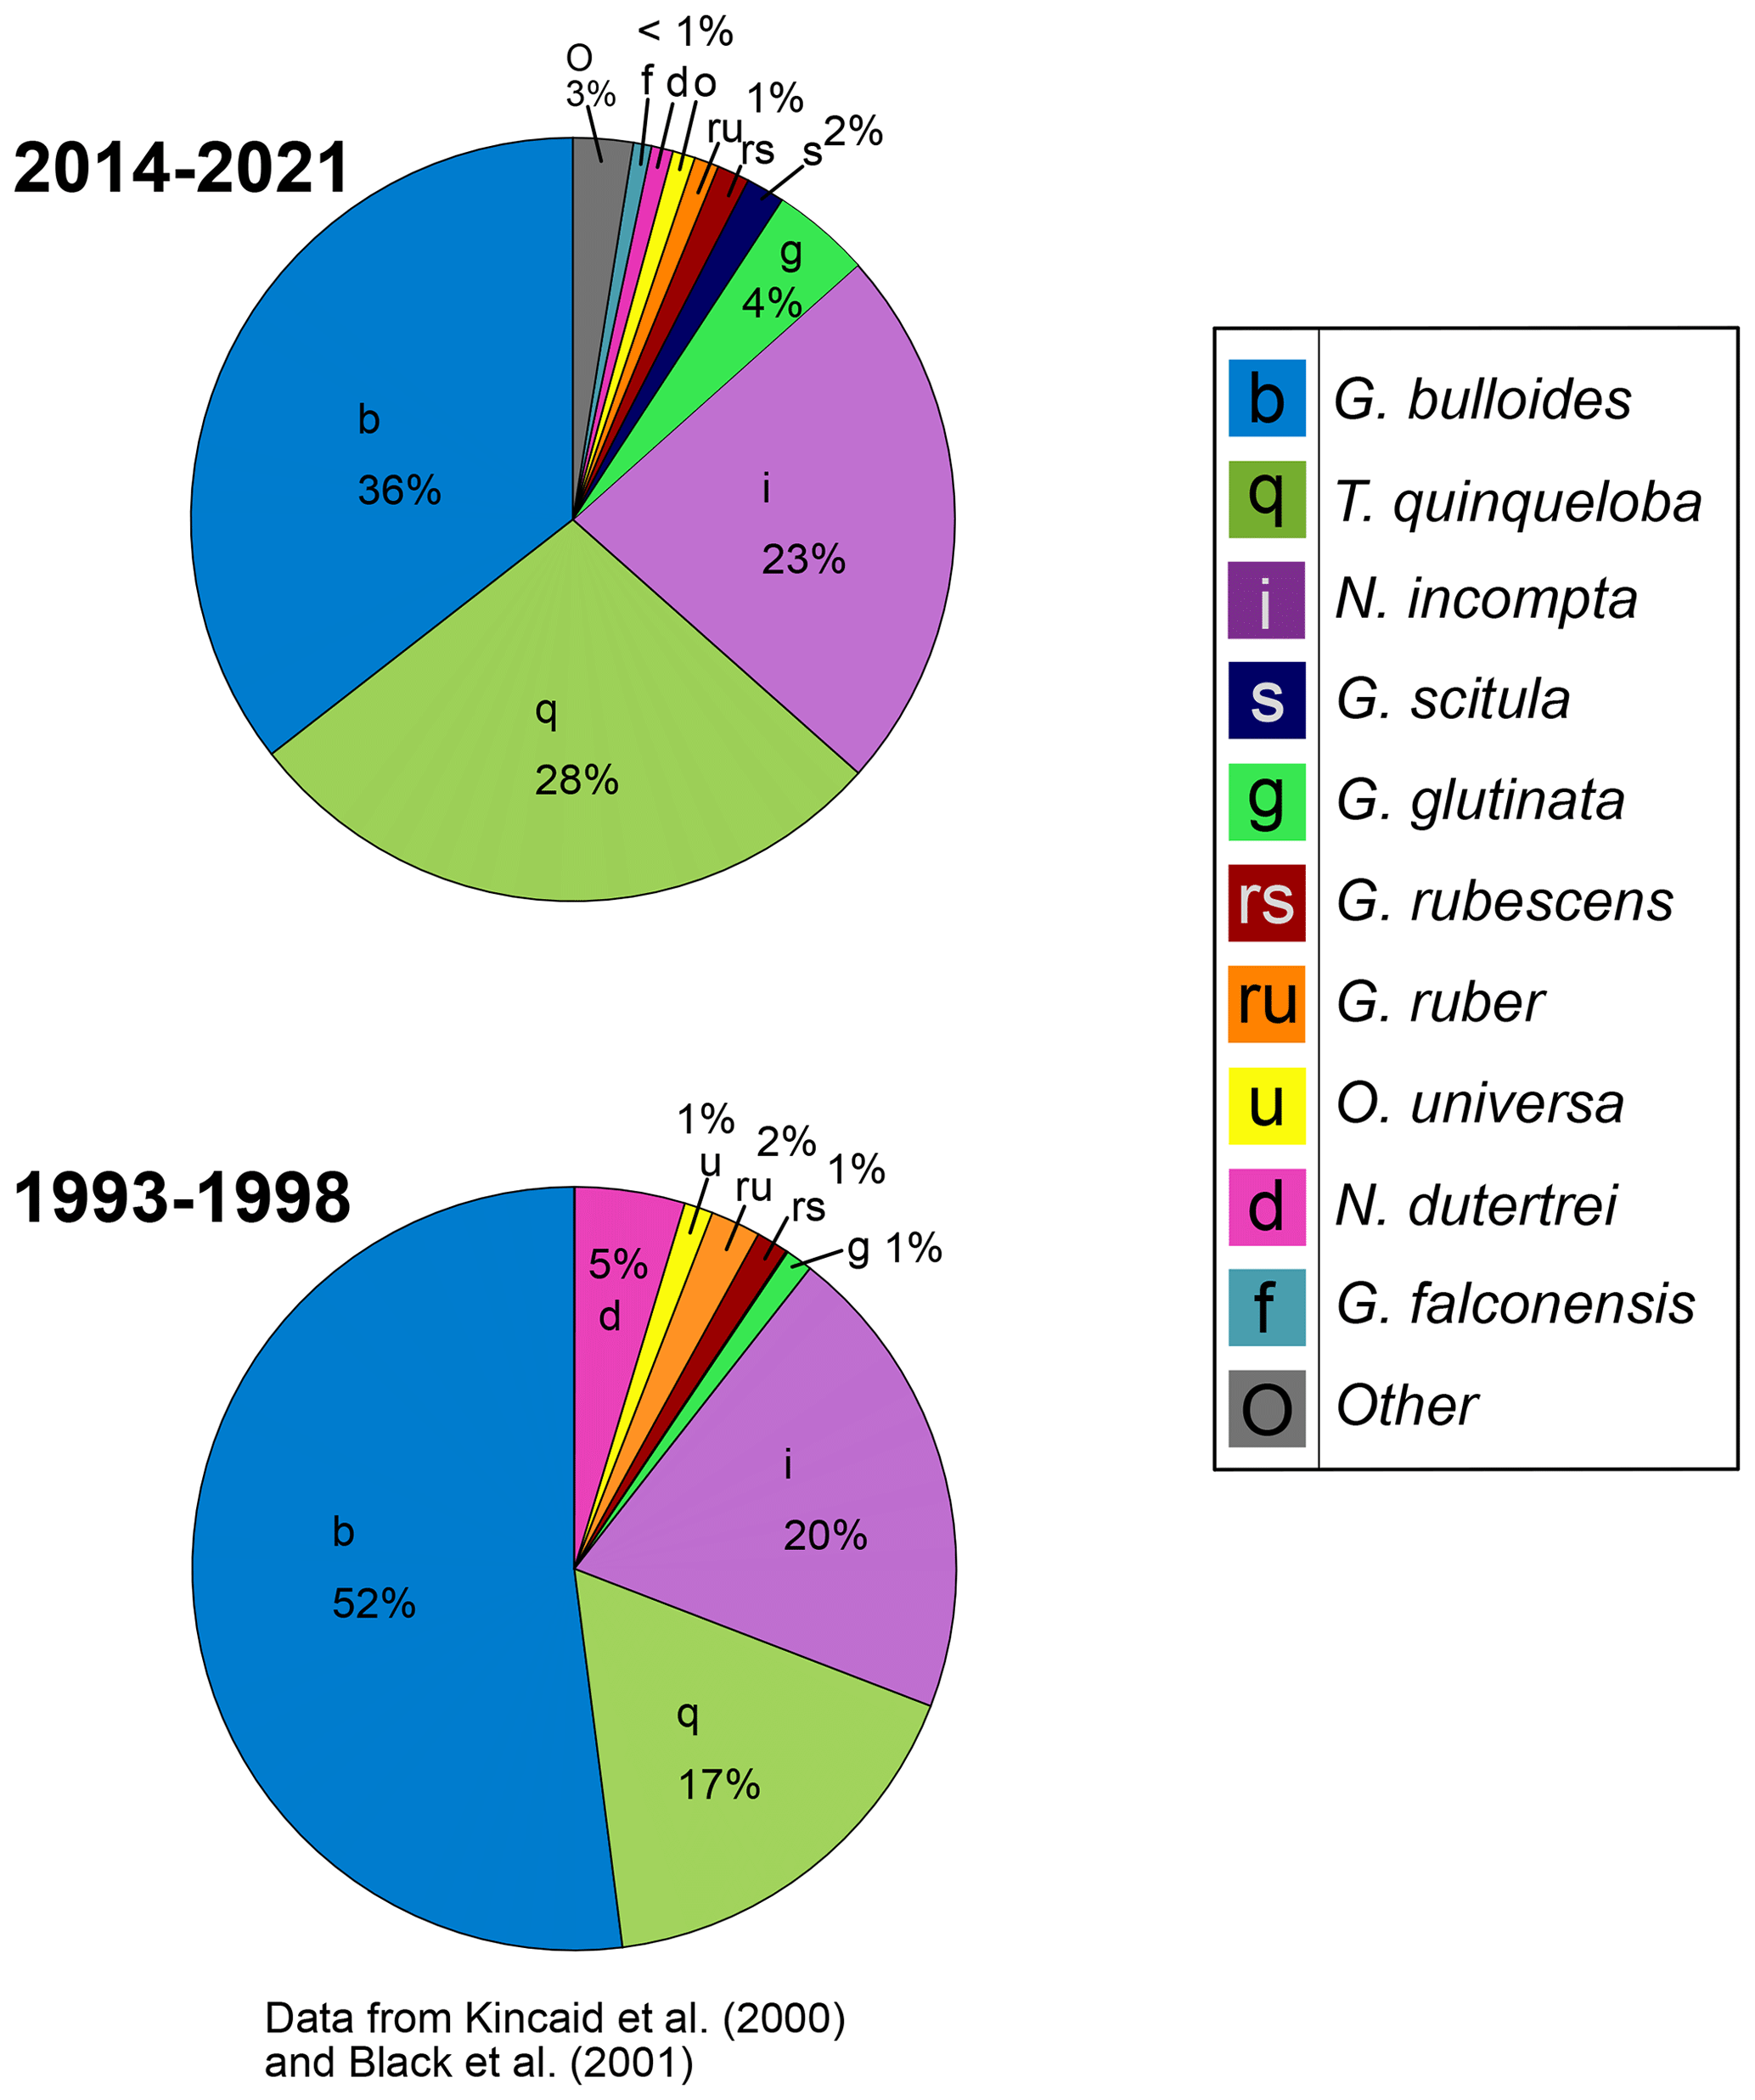
Figure 8Relative abundance of foraminiferal species from 1993–1998 (data from Kincaid et al., 2000, and Black et al., 2001) and 2014–2021.
In a single year, G. bulloides flux fluctuates noticeably and exhibits high interannual variability (Fig. 2). However, the 2014–2021 monthly averages show no clear seasonal peak, and the periodic regression of G. bulloides is not significant (p>0.05) (Figs. 3 and 4). There is a significant periodic regression for G. bulloides from 1993–1998, that shows higher flux in May and a peak in late July, likely influenced by a single high-flux sample during the 1997 El Niño in May and an inshore meander of the California Current during November of 1996 (Black et al., 2001; Fig. 3).
The median flux of T. quinqueloba has remained consistent (+1 %) since the 1990s. From 2014–2021, there is a seasonal peak in June and July, consistent with the upwelling season (Fig. 4). The highest flux occurred in May from 1993–1998, about one month earlier (Fig. 4). This shift in timing is less evident in the periodic regression of T. quinqueloba, where the timing of peak flux has remained similar (Fig. 3).
The flux of N. incompta has decreased since the 1990s (Figs. 2–4). The species is most abundant from June to December, with peak flux in the fall (Figs. 3, 4, and 9). The largest decrease in flux occurred between May and September (Fig. 4). The seasonal distribution pattern looks quite similar, but the seasonal pattern has shifted by 52 d later compared to the 1990s, with peak flux occurring in late September instead of early August (Fig. 3).
Three species, G. glutinata, G. scitula, and B. digitata, have consistently increased in flux since the 1990s (Fig. 4). Much like T. quinqueloba, G. scitula is most abundant in July, but it is less abundant throughout the rest of the year (Fig. 4). Globorotalia scitula has a more distinct seasonal pattern than G. glutinata, as it is present in highest abundance during the upwelling season (Figs. 3 and 4). The seasonal patterns of G. glutinata and G. falconensis are similar, with highest fluxes from January to March and lower abundances during the upwelling season (Fig. 4). The species counts from 1993–1998 do not include G. falconensis, so there is no comparison to the 1990s.
The flux of subtropical species, G. ruber, O. universa, and N. dutertrei, have greatly decreased over time, with changes in median flux by 12.1, 11.5, and 45.7 , respectively (all p<0.05) (Figs. 4 and 7). Their seasonal distributions have remained similar (Fig. 4). They are most abundant during non-upwelling in the winter and fall (Figs. 4 and 9). Unlike the other subtropical species, the median flux of G. rubescens has not decreased significantly (p>0.05). Neogloboquadrina dutertrei shows a seasonal pattern similar to N. incompta, where flux is low from January to April and increases in May (Figs. 3 and 4). This seasonal pattern is distinct between 1993–1998, but less so from 2014–2021 due to a significant decrease in flux (Figs. 3 and 4). The median fluxes of subtropical and tropical species, G. siphonifera, G. calida, and T. sacculifer have decreased since the 1990s (all p<0.05), such that only 34, 71, and 12 individuals, respectively, were counted from 2014–2021 (Table 1 and Fig. 2).
3.3 Relative abundance
Moving from the 1990s–2010s, the relative abundance of G. bulloides has decreased by 16 % and T. quinqueloba has increased by 11 % (Fig. 8). The relative abundance of N. incompta has increased slightly (3 %) (Fig. 8). Subtropical species have decreased by 6 %, contributing only 3 % of the total assemblage from 2014–2021 (Fig. 8). This decrease has been countered by an increase in other species categories (G. glutinata, G. scitula, G. falconensis, “other”) (Fig. 8). The relative abundance of each species varies seasonally (Fig. 9). Globigerina bulloides is most abundant in the winter (43 %) and spring (41 %), with moderate relative abundance in the summer (28 %) and fall (35 %) (Fig. 9). Turborotalita quinqueloba is most abundant in the spring (35 %) and summer (39 %), with especially low abundance in the fall (11 %) and winter (16 %) (Fig. 9). Neogloboquadrina incompta is most abundant in the fall (38 %), with moderate abundance in the winter (23 %) and summer (23 %), and low abundance in the spring (12 %) (Fig. 9).
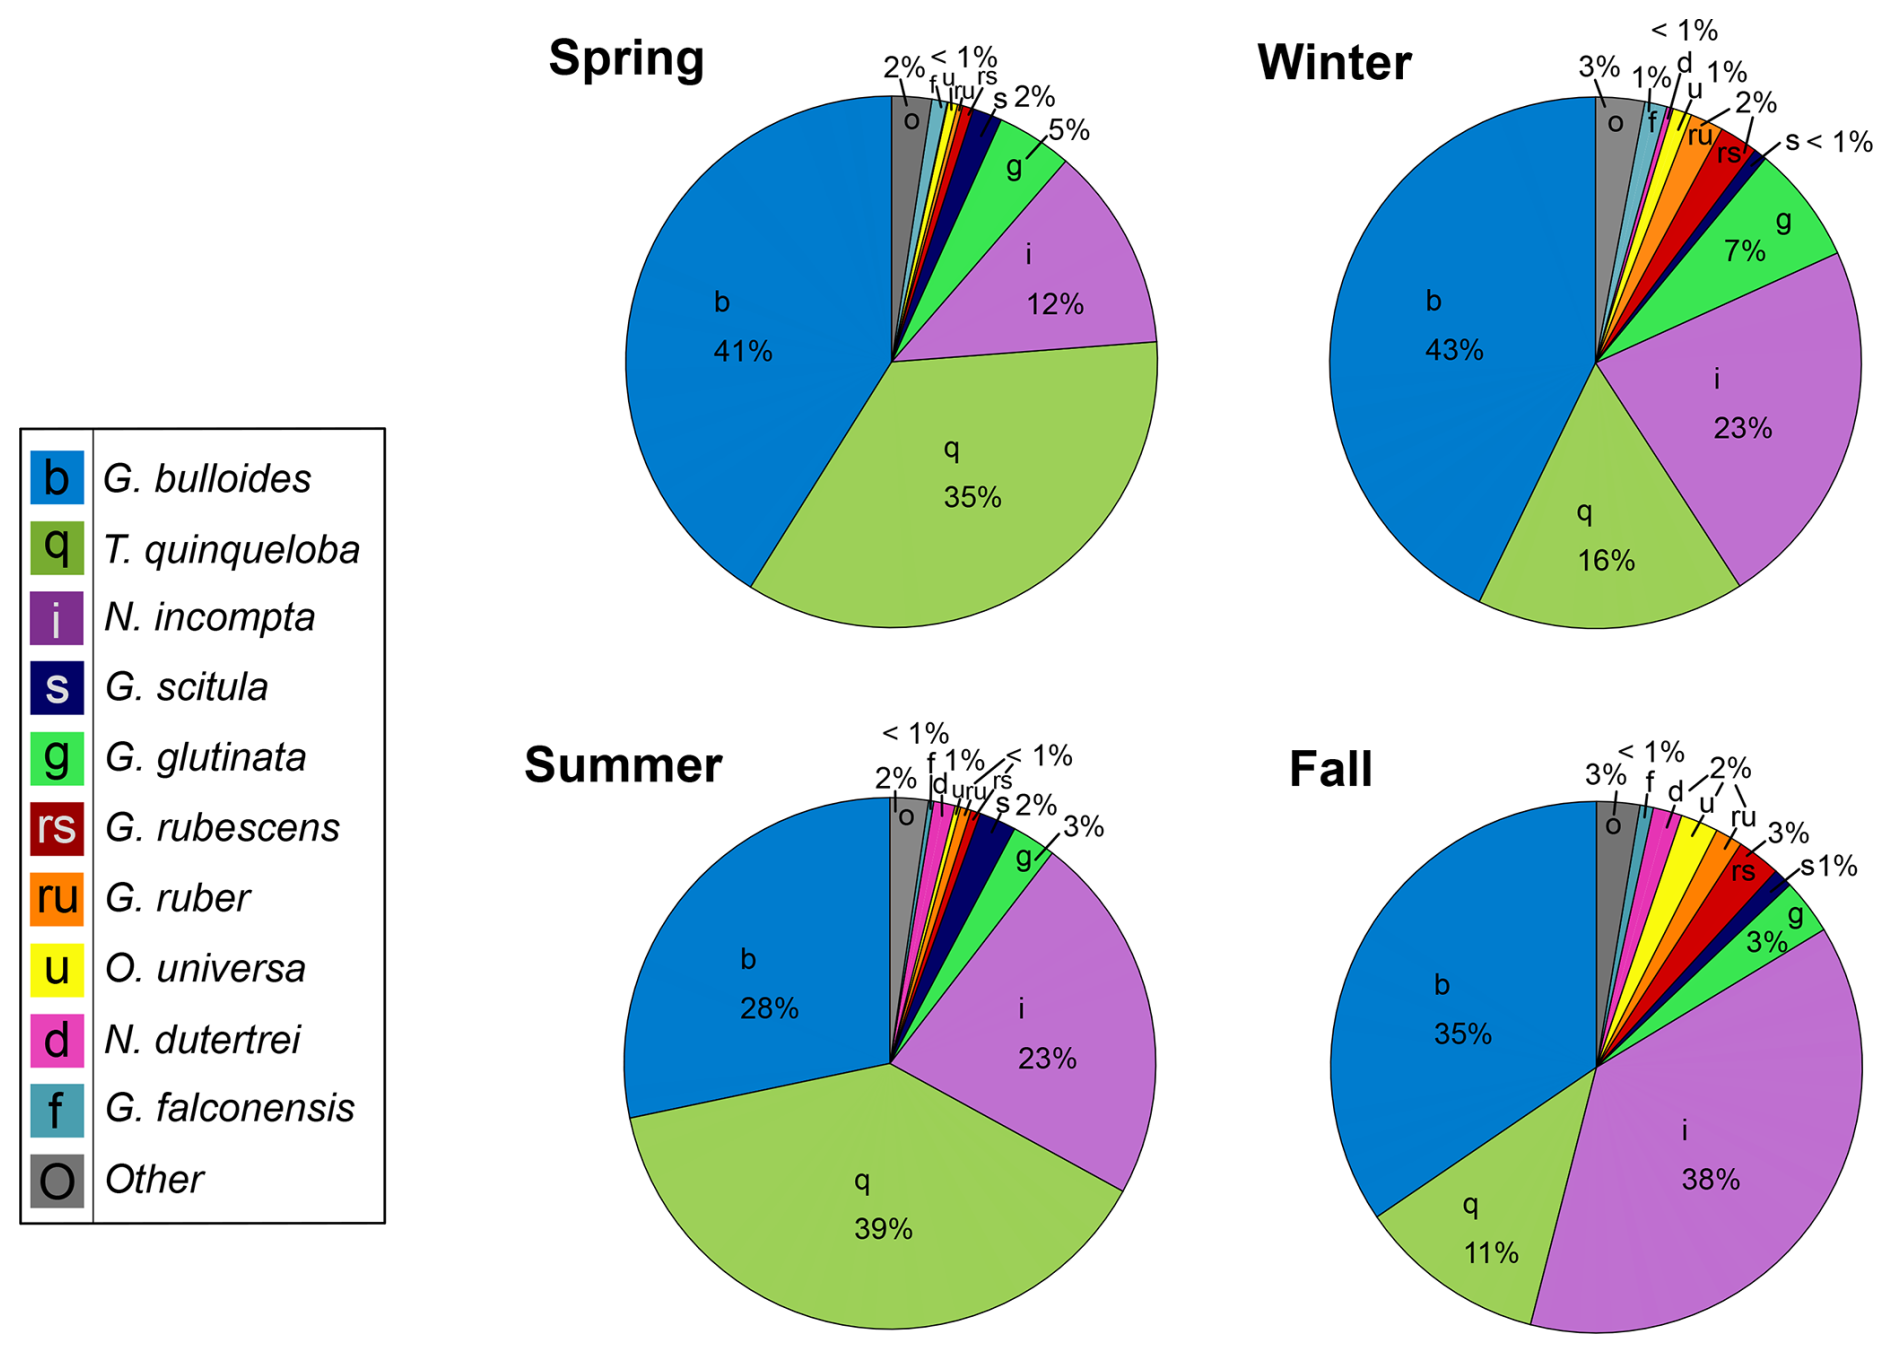
Figure 9Seasonal relative abundance of planktic foraminifera from 2014–2021. Winter (December, January, February), spring (March, April, May), summer (June, July, August), and fall (September, October, November).
4.1 Ocean acidification as a driver of long-term G. bulloides flux decrease
The decrease in the median flux of G. bulloides (−58.8 %) between 1993–1998 and 2014–2021 is the biggest contributor to the decline in total foraminiferal flux (−37.9 %) (Fig. 7). Despite their decrease in numbers, G. bulloides has remained relatively abundant, inhabiting SBB year-round with a high degree of interannual variability, showing a lack of seasonal peaks when averaged over multiple years (Kincaid et al., 2000; Black et al., 2001; Figs. 2–4). During 2014–2021, the species is positively associated with surface dissolved oxygen, which has many possible drivers, including primary productivity, the properties of upwelled waters, and seasonal currents (Fig. 6). Interestingly, G. bulloides is negatively associated with environmental variables that are positively associated with upwelling (CUTI), including pH, organic carbon, nitrogen, and opal flux (Fig. 6).
Few environmental datasets span the full 1993–2021 time period in SBB. However, available, nearby records of carbonate chemistry and temperature combined with particle and foraminiferal flux data from the SBB sediment trap allow us to make some reasonable inferences of possible drivers of the decrease in foraminiferal flux. Ocean acidification, due to oceanic uptake of anthropogenic CO2, is a global issue, and the impacts are exacerbated within eastern boundary upwelling systems such as the California Current system (Feely et al., 2008; Gruber, 2011; Gruber et al., 2012; Hauri et al., 2013; Bograd et al., 2023). Carbonate ion concentrations and pH within the California eastern boundary upwelling system are decreasing, and corrosive water (aragonite saturation<1, ) has been recorded as shallow as 40–120 m depth along the California coast (Feely et al., 2008; Gruber et al., 2012; Bograd et al., 2023). The saturation horizon is projected to continue to shoal (Gruber et al., 2012). At CalCOFI station 90.90, located on the western edge of the southern California Current, carbonate chemistry has been measured since 1983 (Wolfe et al., 2023). The measurements show a trend of decreasing pH by 0.0015 yr−1 and decreasing carbonate ion concentration by 0.41 (Wolfe et al., 2023). Based on the CUTI, upwelling near SBB increased in both duration and magnitude in 2014–2021 relative to 1993–1998 (Jacox et al., 2018; Figs. 4 and 7). This is consistent with the overall trend of increased upwelling along the California coast from 1982–2008 (García-Reyes and Largier, 2010). Average monthly vertical water transport rates only reached 0.6 m d−1 or above in April and June from 1993–1998 (Jacox et al., 2018; Fig. 4). In contrast, between 2014 and 2021, average monthly vertical water transport rates consistently reached 0.6 m d−1 or above from April through September (Jacox et al., 2018; Fig. 4). This extends the exposure time of foraminifera to low pH upwelled waters by two to three months. In contrast to changing carbonate chemistry, daily SST measurements taken in the Santa Barbara harbor show little change between 1993 and 2021. The mean SST from 1993–1998 was 16.3 °C, while the mean SST from 2014–2021 was 16.8 °C, with no apparent trend (Carter et al., 2022). Nor is warming evident at CalCOFI station 90.90 (Wolfe et al., 2023).
Globigerina bulloides inhabits upwelling regions globally and is the most abundant species of planktic foraminifera in SBB. However, it is also sensitive to ocean acidification in ways that affect shell thickness, survival, and reproduction (Davis et al., 2017; Osborne et al., 2020). Osborne et al. (2020) showed that area normalized shell weights of G. bulloides from the SBB sediment record have decreased throughout the 20th century in response to global ocean acidification and are modulated by changes in upwelling strength associated with the PDO (Osborne et al., 2020). In addition to calcification, the oxygen utilization and spine repair of G. bulloides decrease with decreasing pH in culture (Davis et al., 2017), which may impact the ability of G. bulloides to survive and reproduce. Environmental drivers such as acidification could also impact the broader ecosystem including prey species. However, G. bulloides is an opportunistic feeder (Schiebel and Hemleben, 2017), an inference which is further supported in SBB by its year-round presence despite differing availability of prey species (Catlett et al., 2021). Thus, while a change in prey availability between the 1990s and 2020s cannot be entirely ruled out as a factor in assemblage composition, it is unlikely to be a primary driver of the decrease in foraminiferal flux. We hypothesize that both the negative association of G. bulloides with active upwelling indicators on short times scales as well as the long-term decrease in observed flux reflect the growing challenges of ocean acidification in this environment. Given the documented association between low pH and reduced calcification and stress in G. bulloides (Davis et al., 2017; Osborne et al., 2020), it may be that conditions within SBB are more frequently moving beyond the optimal range for this species. Under a business-as-usual emissions scenario, ocean acidification will intensify, possibly further reducing foraminifera presence and subsequent inorganic carbon flux to the seafloor (Orr et al., 2005; Hofmann and Schellnhuber, 2009; Beaufort et al., 2011; Meyer and Riebesell, 2015; Kiss et al., 2021).
4.2 Decrease in total foraminiferal flux
Our record shows a 37.9 % decrease in median total foraminiferal flux over a period of 28 years. Marine calcifiers such as planktic foraminifera and coccolithophorids comprise a significant proportion of calcium carbonate flux to the seafloor (Schiebel, 2002; Baumann et al., 2004; Langer, 2008; Tanhua et al., 2013). Their calcification and subsequent inorganic carbon burial are important components of the marine carbon cycle (Zondervan et al., 2001; Schiebel, 2002; Langer, 2008; Tanhua et al., 2013). Calcification removes carbonate ions, thereby reducing alkalinity and leading to a decrease in the pH of seawater and the ability of the surface ocean to uptake atmospheric CO2 (Frankignoulle et al., 1994). Thus, a decrease in calcification from planktic foraminifera has the potential to actually increase the ability of the ocean to sequester CO2 and act as a negative feedback to anthropogenic CO2 inputs (Zondervan et al., 2001; Hofmann and Schellnhuber, 2009; Tanhua et al., 2013; Meyer and Riebesell, 2015).
Between 1993–1998 and 2014–2021, median total carbonate flux to the sediment trap decreased by 21.0 %, reflecting the combined influence of changes in particle abundance and size, while median organic carbon flux remained relatively stable (+3.7 %) (Figs. 2 and 10). In essence, the removal of alkalinity from the surface ocean through calcification has been reduced while drawdown of CO2 by phytoplankton through photosynthesis continues (Frankignoulle et al., 1994; Tanhua et al., 2013; Zondervan et al., 2001). This results in a reduction of the ratio of the flux of particulate inorganic carbon (PIC) to particulate organic carbon (POC) in the SBB sediment trap by 23.7 % (), indicating a strengthening of the biological carbon pump and increasing the potential for CO2 sequestration in the deep ocean (Zondervan et al., 2001; Tanhua et al., 2013; Fig. 10). Although a decrease in calcification has negative consequences for calcifying organisms, a medium to long-term impact of a continued decrease in the observed carbonate flux may be an increase in the buffer capacity of the surface ocean, which may already be providing a stabilizing feedback to atmospheric CO2 inputs.
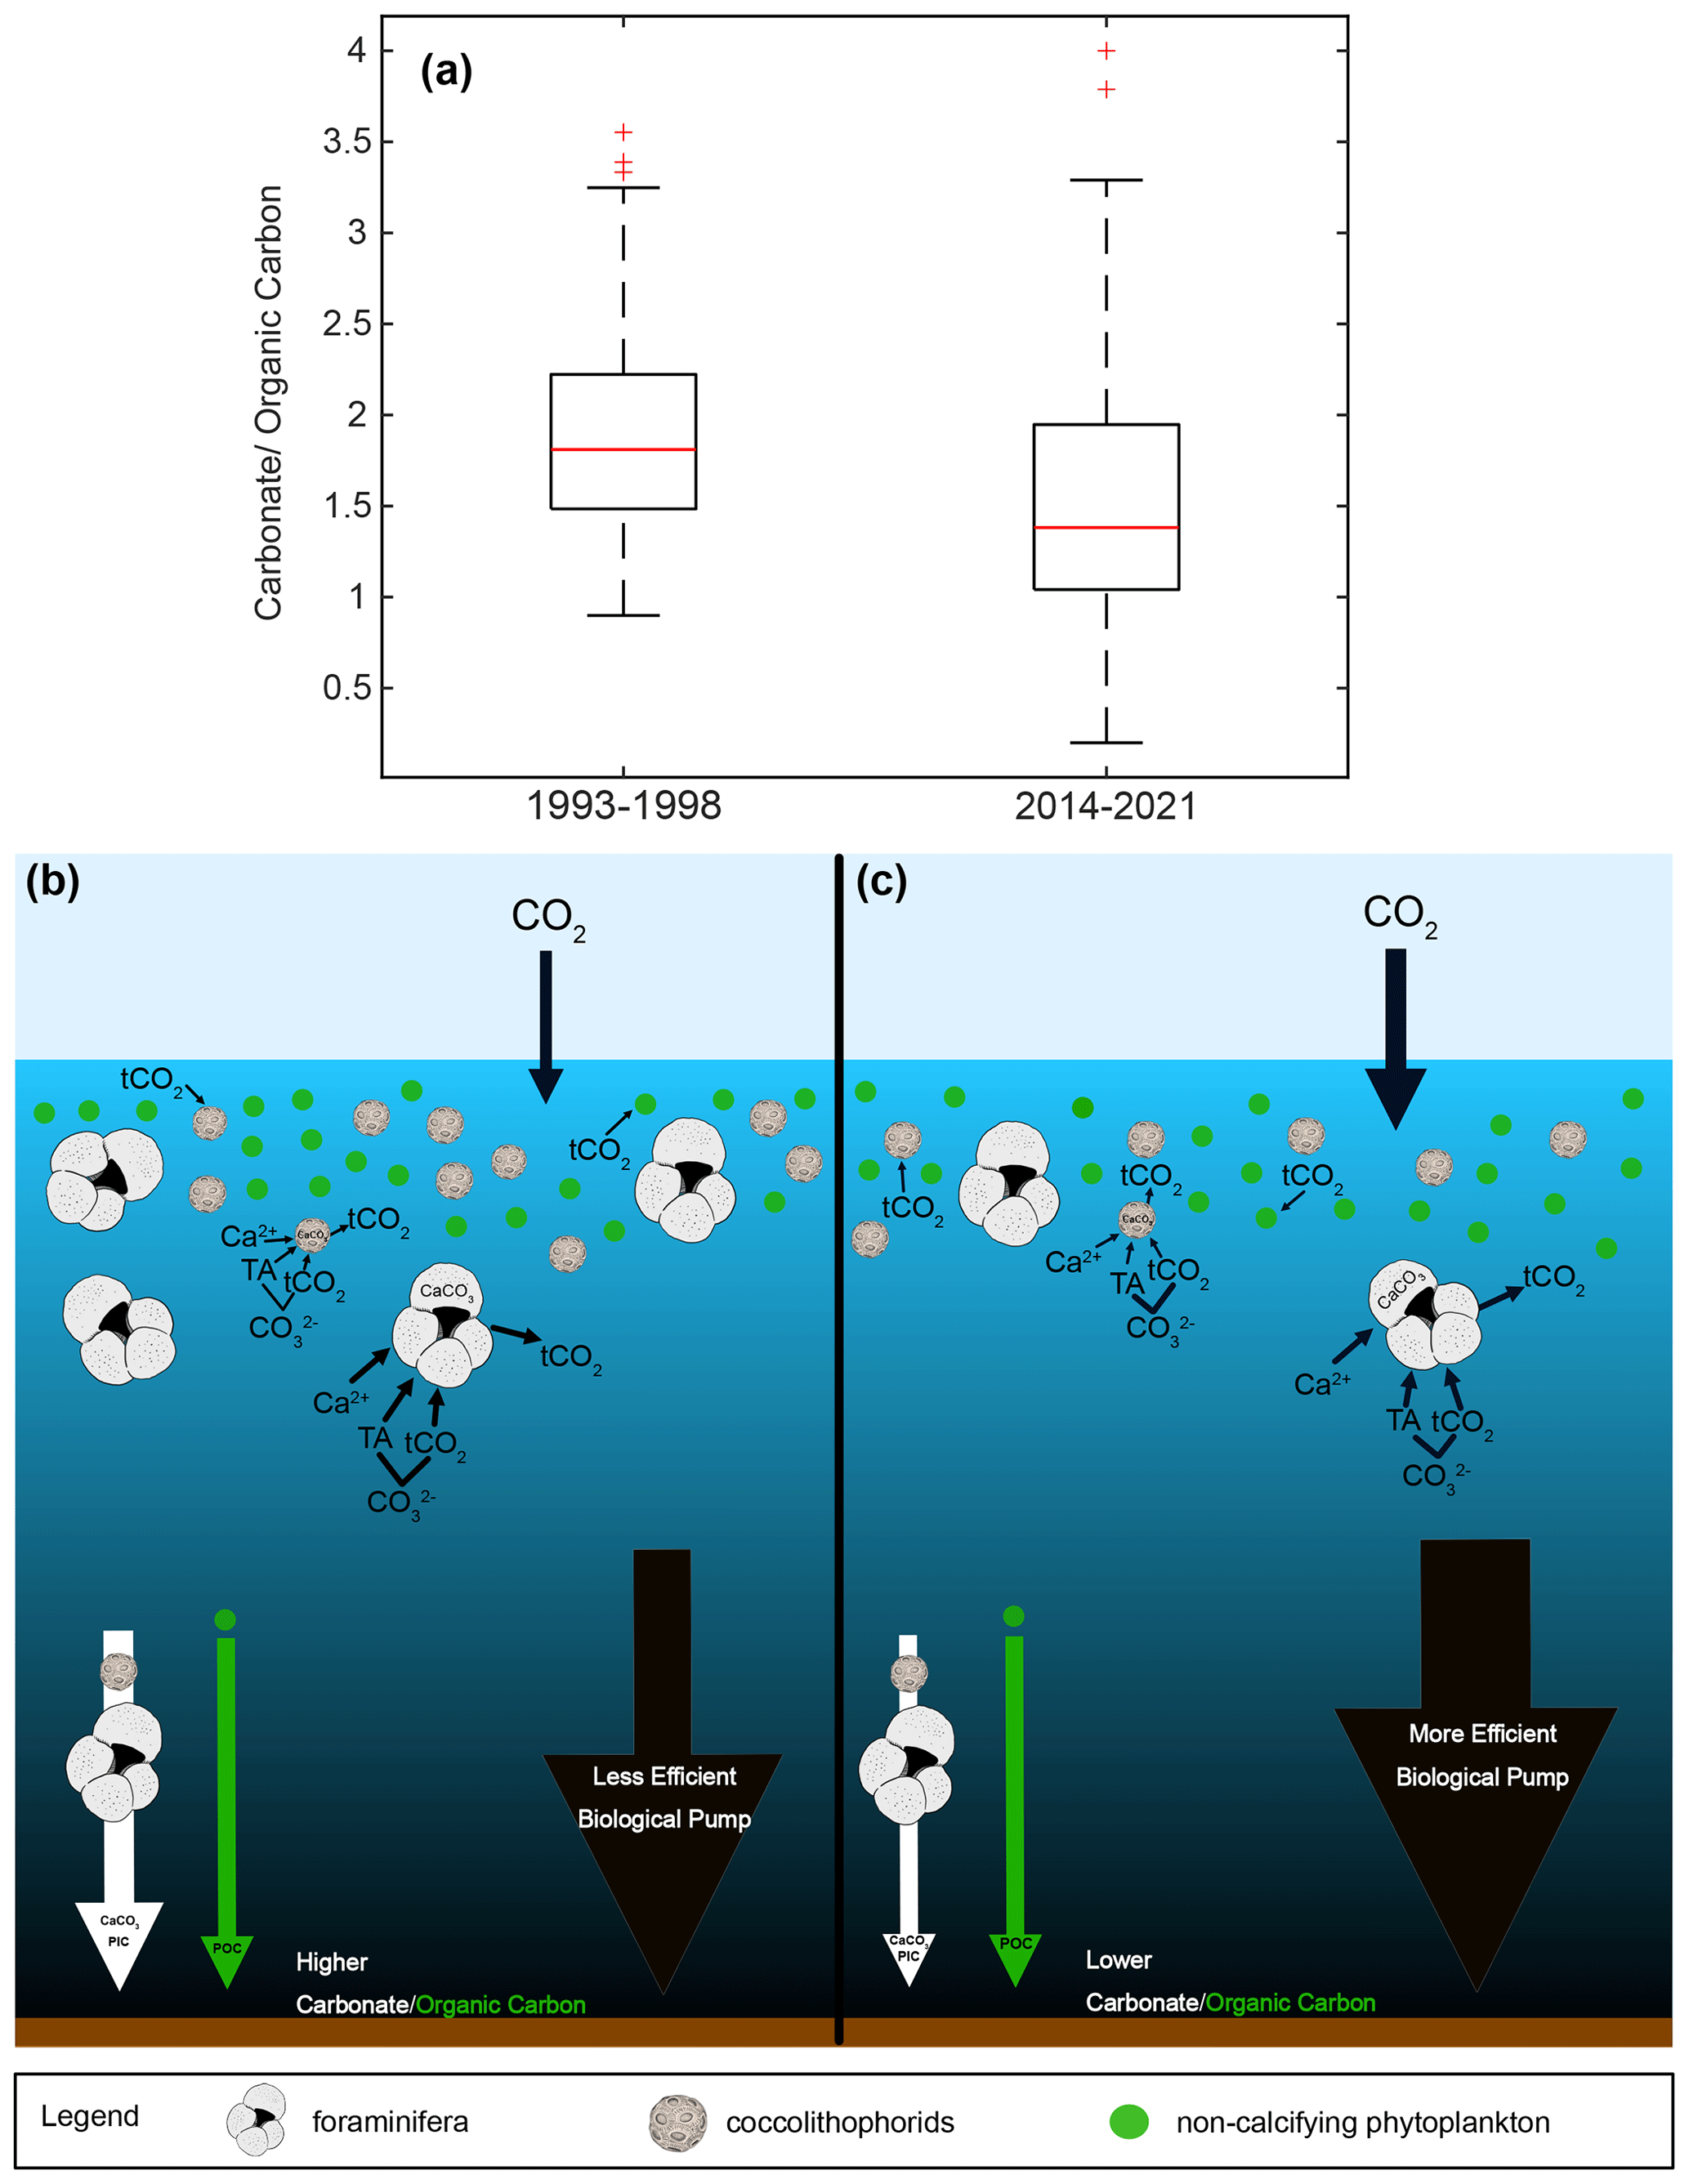
Figure 10Boxplot of PIC/POC as carbonate/organic carbon for two time periods, 1993–1998 and 2014–2021, (a). Schematic of a high PIC/POC scenario (b), similar to the 1993–1998 median, with high calcification and a less efficient biological pump, resulting in less oceanic uptake of atmospheric CO2. Schematic of a low PIC/POC scenario (c), similar to the 2014–2021 median, with less calcification and a more efficient biological pump, resulting in more oceanic uptake of atmospheric CO2.
4.3 Decrease in subtropical species flux and relative abundance
Subtropical species have decreased in both flux and relative abundance since the 1990s (Figs. 4, 7, and 8). In the context of a 0.38 °C global SST increase between 1993 and 2021 due to anthropogenically-forced warming (NOAA, 2024), this is an unexpected finding. Globally, foraminiferal assemblages are shifting poleward in response to warming ocean temperatures (Jonkers et al., 2019), and the flux of subtropical species has increased throughout the warming 20th century in the SBB sediment record (Field et al., 2006). Although the California upwelling system is warming over time, it is doing so more slowly than non-upwelling coastal zones, with the slowest warming rate closest to shore (Seabra et al., 2019; Bograd et al., 2023). While much of the coastal ocean warms and stratifies, the California system remains relatively cool with active and increasing upwelling (García-Reyes and Largier, 2010; Seabra et al., 2019). The flux of subtropical species is highest in the fall and winter, when stratification is high and upwelling relaxes (Figs. 4, 7, and 8). This is consistent with previous studies from the SBB sediment trap (Kincaid et al., 2000). The most abundant subtropical species (G. rubescens, G. ruber, O. universa, and N. dutertrei) are mixotrophs that rely on photosynthetic symbionts (Takagi et al., 2019). These species are adapted to succeed in oligotrophic conditions but are also found in more productive regions (Schiebel and Hemleben, 2017; Ward, 2019). In the California Current system, the subtropical species are less abundant where light is limited close to shore due to high turbidity associated with primary productivity (Ortiz et al., 1995). We show that subtropical species, G. rubescens, G. ruber, O. universa, and N. dutertrei, are significantly correlated with SST in SBB (Fig. 5). Additionally, G. ruber is positively correlated with a deeper mixed layer, which is characteristic of the non-upwelling season when the water column is more stratified and the thermocline is gently sloping, extending deeper into the water column (Fig. 5). Globigerinoides ruber also has a positive loading on CCA1, where upwelling related variables have negative loadings (Fig. 6 and Table 3).
We hypothesize that the extension of the upwelling season has negatively impacted the abundance of subtropical species in SBB. As upwelling extends through the late summer or early fall, the optimal, warm season for subtropical species is shortened, increasing the amount of time where SBB conditions are unfavorable. This is supported by our observation of a shift in the seasonality for some subtropical species (Fig. 4). From 1993–1998, the average fluxes of G. ruber and N. dutertrei increase in May (Kincaid et al., 2000; Black et al., 2001; Fig. 4). This seasonal increase shifts to July in the samples from 2014–2021, which corresponds to an expansion of the upwelling season (Fig. 4).
4.4 Impacts of El Niño
There is no consistent response in the magnitude of foraminiferal flux in relation to El Niño events in SBB. The most consistent similarity across El Niño events is the increase in subtropical species flux. In SBB, El Niño events modify the structure of the water column by increasing SST and stratification (Lynn and Bograd, 2002). More southern-sourced waters enter the basin via the countercurrent and undercurrent, bringing warmer, saline, lower oxygen, nutrient-poor water (Bograd et al., 2001; Lynn and Bograd, 2002; Fiedler and Talley, 2006; McClatchie et al., 2016). Surface productivity in SBB decreases during El Niño events, but the response of foraminifera to these conditions is variable (Kincaid et al., 2000; Black et al., 2001; Catlett et al., 2021). The periods 1993–1998 and 2014–2021 contain two strong and two weak El Niños (Trenberth et al., 2024). Foraminiferal flux was exceptionally high during the 1996/1997 El Niño (Fig. 7) (Black et al., 2001). During the weak El Niño of 1993/1994, foraminiferal flux was low (Kincaid et al., 2000). The 2015/2016 El Niño resulted in low foraminiferal flux, much like the 1993/1994 event (Kincaid et al., 2000; Figs. 2 and 7). However, the time series has a gap between July and October 2015, limiting the interpretation of the 2015/2016 El Niño. During the weak El Niño in 2019, foraminiferal flux was not particularly high or low (Figs. 2 and 7).
Subtropical species increased in abundance during El Niño events, consistent with the warming of the Eastern Tropical North Pacific and advection of warmer waters into SBB via the enhanced inshore countercurrent and undercurrent (Kincaid et al., 2000; Black et al., 2001; Lynn and Bograd, 2002; Fig. 2). The increase in stratification and SST during these years likely provided favorable conditions for the subtropical species (Schiebel and Hemleben, 2017). The high spring foraminiferal flux in May 1997 is interpreted by Black et al. (2001) as the result of a period of greatly reduced upwelling, where foraminifera may have experienced less predation or competition for food. Interestingly, the heterotrophic G. bulloides followed similar trends, with high flux during the 1997/1998 El Niño and increasing flux across the 20th century in association with warming and stratification (Black et al., 2001; Field et al., 2006; Takagi et al., 2019).
4.5 Upwelling indicator species
Certain species of foraminifera, including G. bulloides, T. quinqueloba and G. glutinata, are known to inhabit modern upwelling environments and have been used as upwelling indicators in paleoceanographic reconstructions, providing insight into changes in productivity (Black et al., 2001; Kincaid et al., 2000; Kucera, 2007; Sautter and Sancetta, 1992; Schiebel and Hemleben, 2017; Souto et al., 2011). Productivity is an important component of past environmental conditions and has implications for marine carbon export and the entire marine food web (Capone and Hutchins, 2013). A good upwelling indicator should be most abundant during the upwelling season and have positive correlations with upwelling-associated environmental parameters. An upwelling indicator that is applicable to the paleo record should further respond to long-term changes in upwelling in addition to seasonal variation. Historically, G. bulloides has been used as an upwelling indicator, especially in the Arabian Sea where its abundance changes in accordance with the monsoon and changing wind direction (Naidu and Malmgren, 1995; Gupta et al., 2003; Kucera, 2007). However, in the SBB record, G. bulloides flux is neither positively correlated with upwelling season nor upwelling-associated parameters (Figs. 2–5) and has decreased while both the magnitude and duration of upwelling have increased (Jacox et al., 2018, Fig. 4).
A more promising upwelling indicator in SBB is T. quinqueloba. Consistent with Kincaid et al. (2000) and Black et al. (2001), T. quinqueloba responds more directly to upwelling than G. bulloides in our 2014–2021 time series (Figs. 2–5). It is most abundant during the upwelling season, with peak abundance occurring later in 2014–2021 compared to 1993–1998, likely in accordance with the expansion of the upwelling season (Fig. 4). This species is significantly (p<0.05) correlated with opal, nitrogen, sample mass, organic carbon, pH, CUTI, and a shallow, steep thermocline that indicates the transport of cool water to the surface (Fig. 5). Turborotalita quinqueloba has a negative loading on CCA1, falling closest to organic carbon, opal, nitrogen, pH, and CUTI (Fig. 6). The median flux of T. quinqueloba has not changed significantly since the 1990s while most other species have decreased (Fig. 7). These changes drive the relative abundance increase in T. quinqueloba over the 28-year period, which is consistent with the increase in upwelling over the same period (Figs. 7 and 8).
4.6 The value of long time series
Comparing new data to historical baselines is a useful way to monitor the progression of climate change and its impact on marine ecosystems (Barry et al., 1995; Jonkers et al., 2019). The long-standing SBB sediment trap time series collection since 1993 provides an opportunity to track changes in the foraminiferal population over time, as both global and local conditions vary. Our multi-year record also allows for a robust analysis of seasonal patterns beyond the scope of a single year, as it takes interannual variability into account (Figs. 2–4). For example, flux of G. bulloides appears seasonal in 1993–1998, but this is driven largely by a single El Niño event. A longer time series clarifies that G. bulloides is abundant year-round with variable timing in flux (Figs. 2 and 4). Thus, G. bulloides likely reflects annual average conditions in the sediment record.
Species with distinct average seasonal patterns will be skewed in the sediment record towards the season during which they are most abundant (fall/winter for subtropical species and N. incompta, spring/summer for T. quinqueloba) (Figs. 4 and 9). Long time series are needed to investigate the impacts of decadal variability and ongoing anthropogenic climate change on coastal ecosystems. This study focuses on rapid climate change over the past 28 years, but modes of decadal variability in the region (ENSO, PDO, NPGO) remain important for foraminifera and phytoplankton (Field et al., 2006; Osborne et al., 2020; Catlett et al., 2021). The combination of these modes of variability can act alongside anthropogenic climate change, intensifying or dampening various impacts (Osborne et al., 2020; Dalsin et al., 2023) and may require even longer time series for their influence to be resolved.
4.7 Implications for the paleontological record
Due to their global distribution and regular contribution to the fossil record, foraminifera provide valuable information about climate change throughout geologic history (Lisiecki and Raymo, 2005; Kucera, 2007; Hönisch et al., 2012; Schiebel and Hemleben, 2017). As calcifiers, they are part of the marine carbon cycle and sensitive to ocean acidification (Schiebel, 2002; Langer, 2008; De Moel et al., 2009; Moy et al., 2009; Davis et al., 2017; Osborne et al., 2016, 2020; Pallacks et al., 2023). This record of planktic foraminifera, bracketing 28 years of climate change within a productive, coastal region is ideal for considering how rapid climate change events, such as those driven over the past century by anthropogenic CO2 emissions, appear in the sediment record.
A decrease in foraminiferal flux (37.9 %) and carbonate flux (21.0 %) should be evident in the sediment record, given the sediment accumulation rate in SBB of 120 cm kyr−1 (Behl, 1995). Depending on the sampling resolution, this would also bias climate records based on foraminiferal shells towards times when foraminifera were more abundant. Periods with lower foraminiferal flux due to ocean acidification, for example, would contribute fewer foraminifera to the sediment record, biasing a record that contains an acidification event towards the pre-acidification period.
In the geologic record, relative abundance is a common tool used to assess changes in the foraminiferal population over time, aiding interpretations of paleo-environmental and climatic conditions (Kennett and Ingram, 1995; Hendy and Kennett, 2000; Hendy et al., 2004; White et al., 2013). Between 1993–1998 and 2014–2021, the relative abundance of G. bulloides and subtropical species decreased, while relative abundance of T. quinqueloba and other non-subtropical species increased (Fig. 8). This is contrary to the warming trend found in SBB through the 20th century (Field et al., 2006), indicating a shift in the major drivers of foraminiferal abundance from temperature to ocean acidification between the 20th and 21st centuries. Based on assemblage data alone, the decrease in subtropical species abundance from 1993–2021 might be interpreted as cooling in the sediment record, which would be an incomplete picture given the influence of ocean acidification and expansion of the upwelling season in SBB in the context of global warming (Fig. 8). This study, which analyzes foraminiferal species flux data alongside environmental conditions, highlights the value of including multiple proxies when interpreting records of warming or cooling. The interplay of circulation changes, ocean acidification, and warming continue (Gruber, 2011), but ocean acidification and the increase in regional upwelling seem to be the main drivers over the course of our study. As the California upwelling system is warming more slowly and acidifying faster than other marine regions (Feely et al., 2008; Hauri et al., 2009; Gruber et al., 2012; Seabra et al., 2019), the 28-year record may reflect a larger influence of ocean acidification compared to temperature on recent decadal scales in SBB, with pH levels falling below the tolerance of many species.
Our 7-year sediment trap record of planktic foraminiferal flux in SBB from 2014–2021 provides an update to previously published records from 1993–1998 (Kincaid et al., 2000; Black et al., 2001). Over a period of 28 years, total foraminiferal flux and carbonate flux have dramatically decreased. We hypothesize that this decrease in foraminiferal flux is driven by an increase in upwelling and the acidification of the California coastal upwelling system. The decrease in carbonate export relative to organic carbon provides a negative feedback to atmospheric CO2 and a strengthening of the biological pump. This time series has also allowed for multi-year analysis of seasonal patterns of major species, revealing T. quinqueloba as the most promising upwelling indicator in SBB. Additionally, the flux of subtropical species has decreased relative to 1993–1998. Although warming continues, the intensification and expansion of upwelling in SBB and associated acidification have had a negative impact on subtropical species, counter to what would be predicted from continued warming alone in SBB.
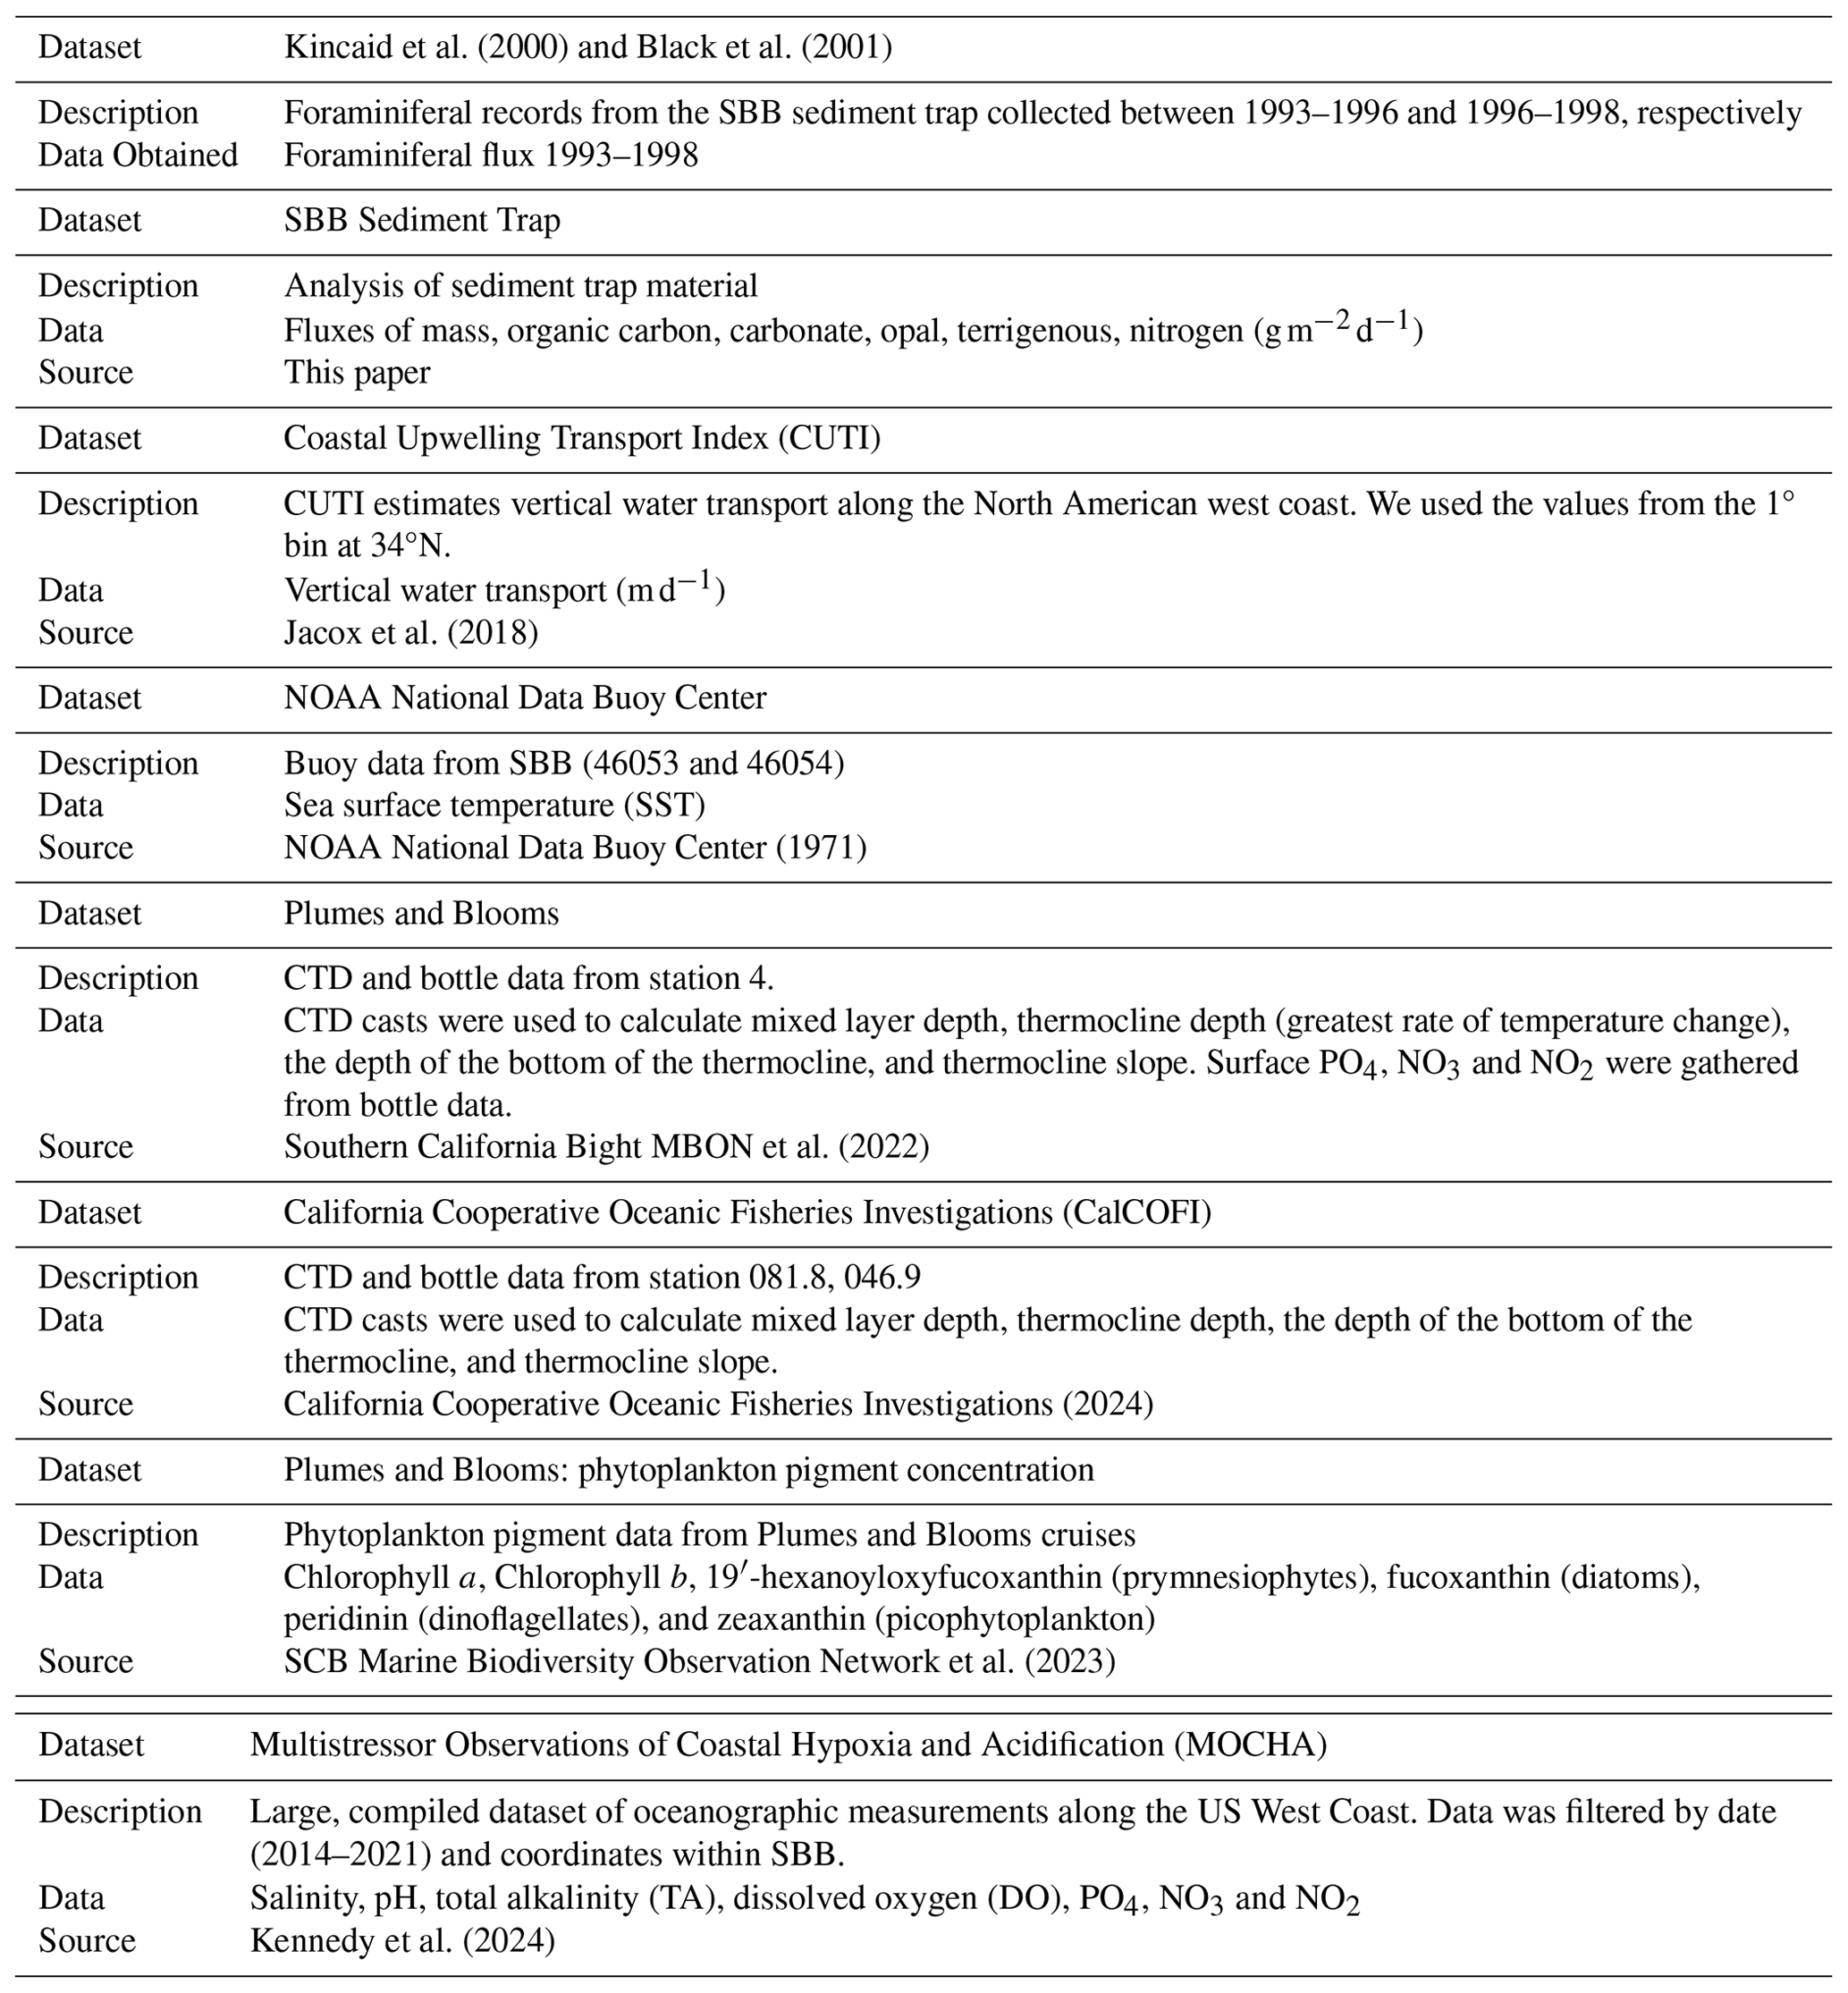
Table A2Full names and associated original description citations for all species found in SBB from 2014–2021.
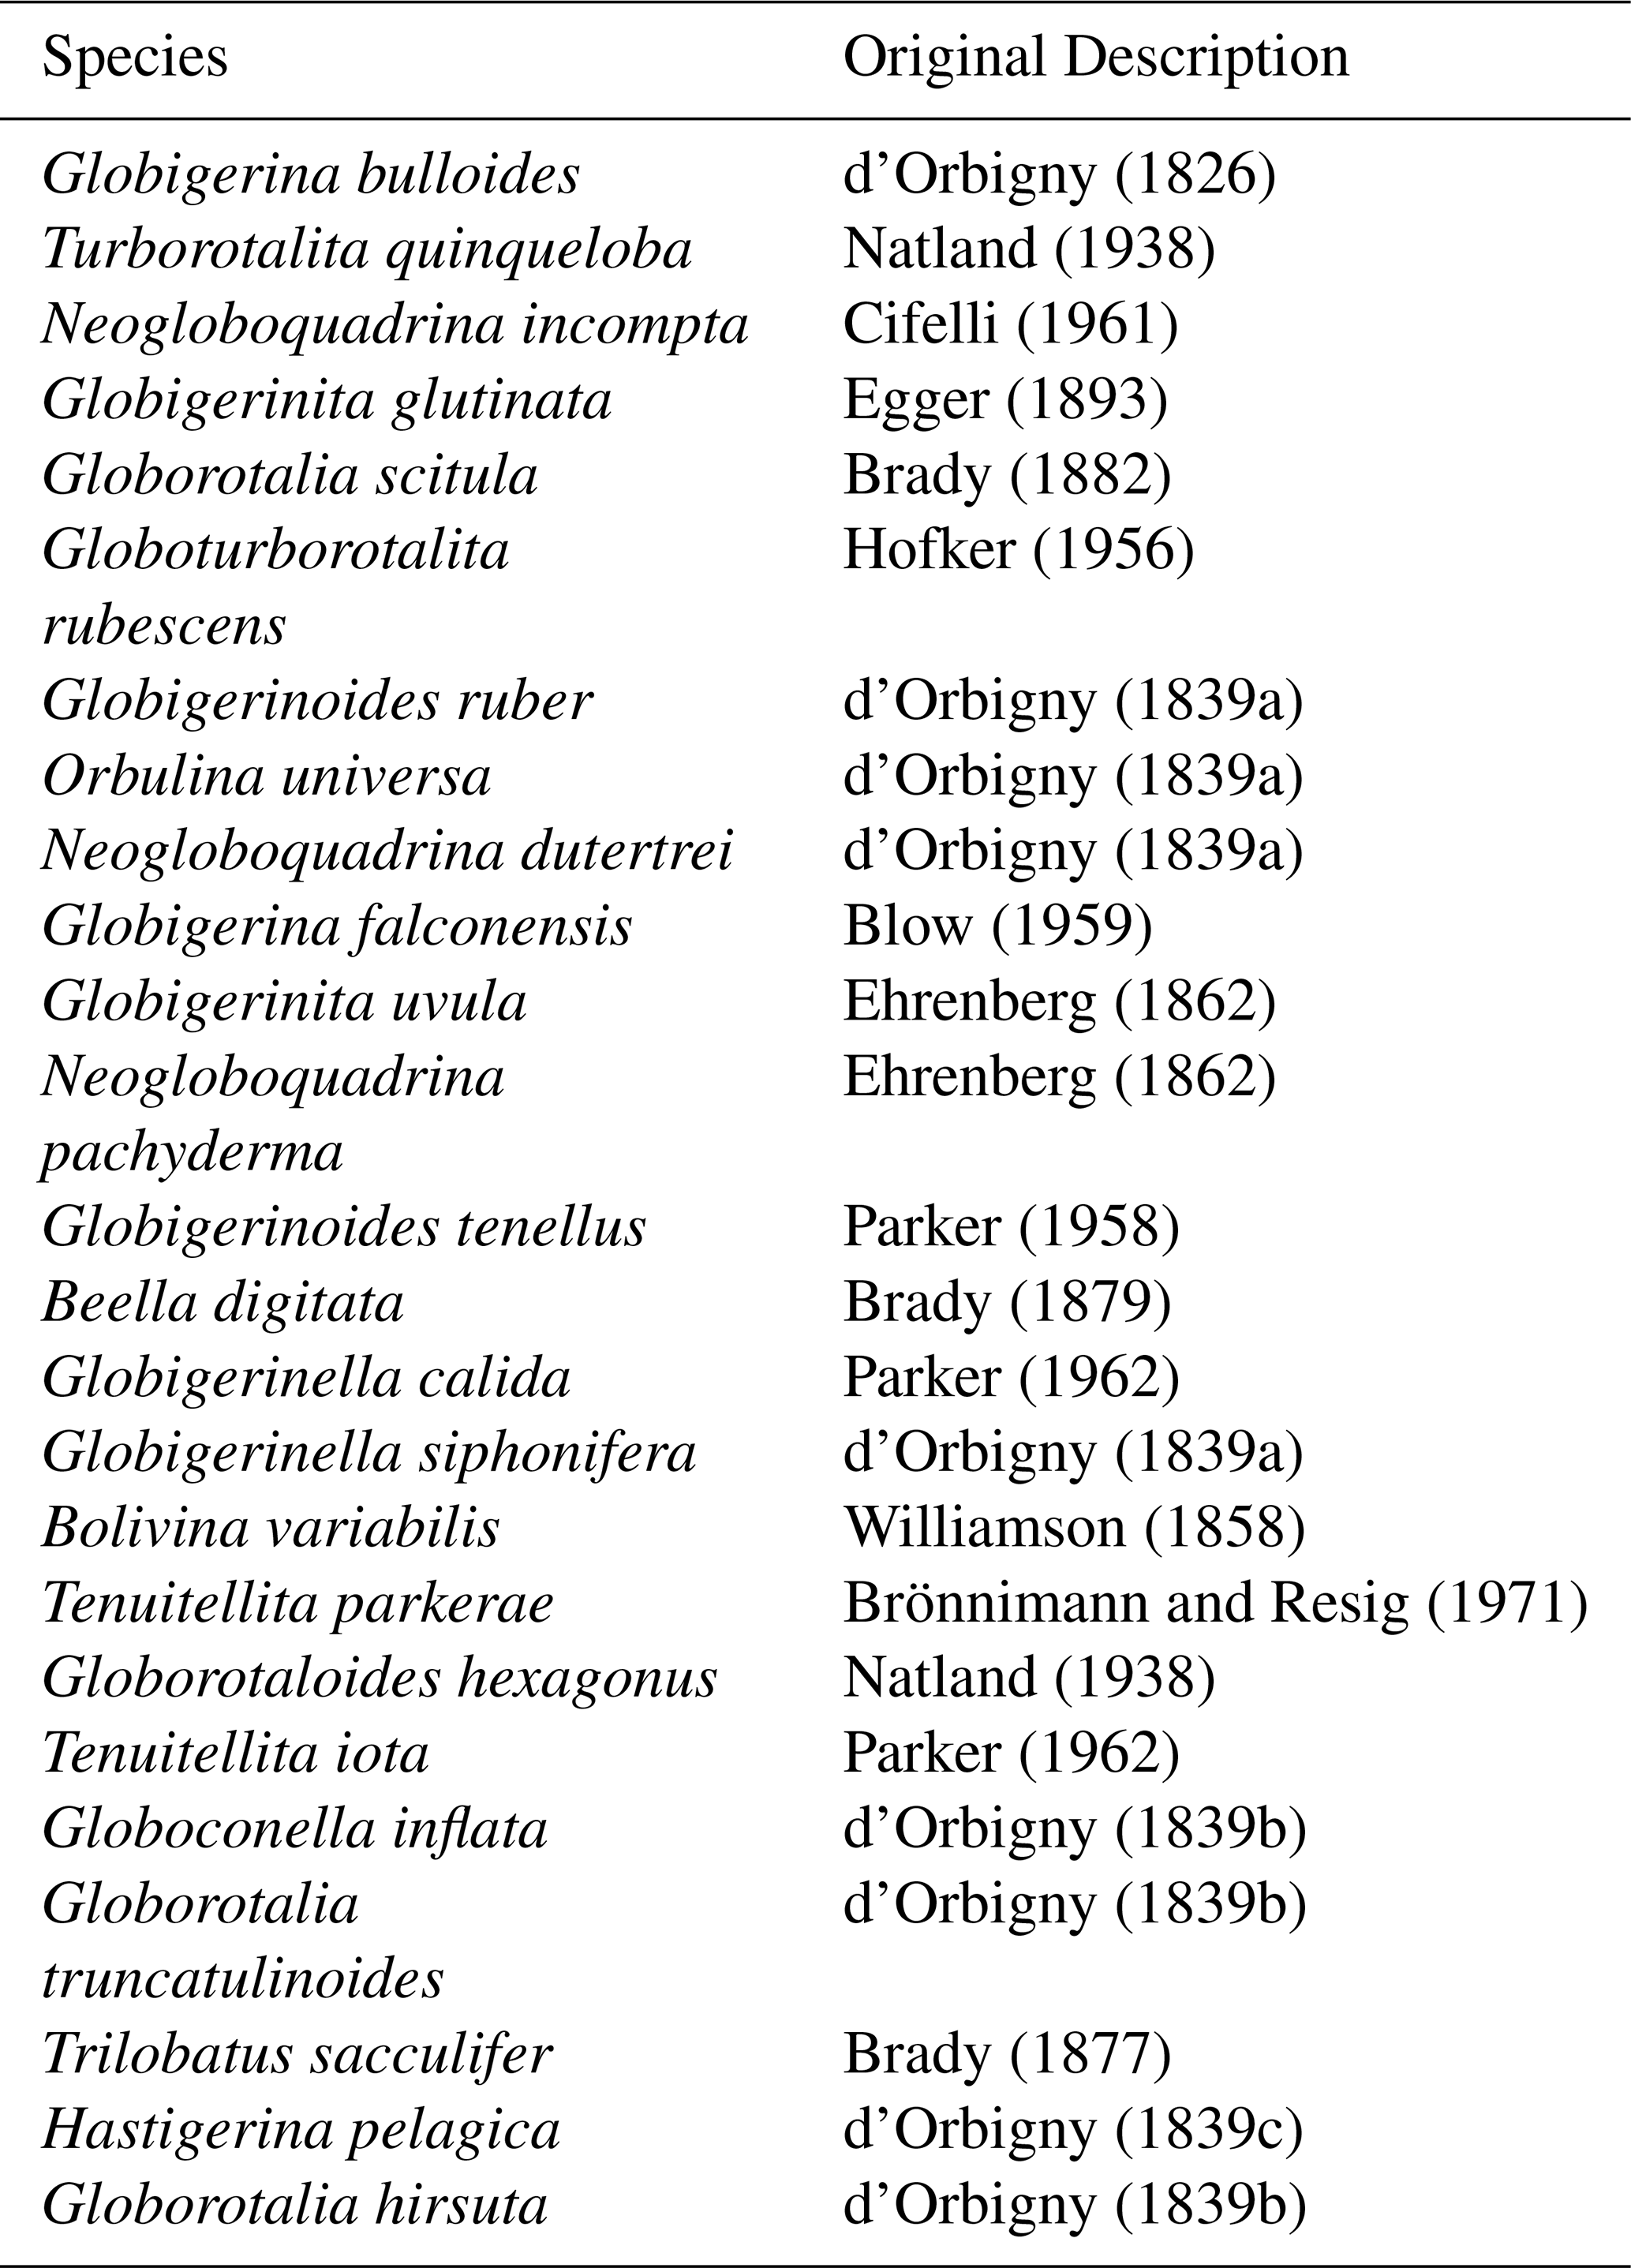
Table A3Rates of change from 1993–2021 presented as foraminiferal flux per year (2nd column) and correlation coefficients (r) of the linear regression for each species (3rd column) with a single peak flux point from May 1997 removed.
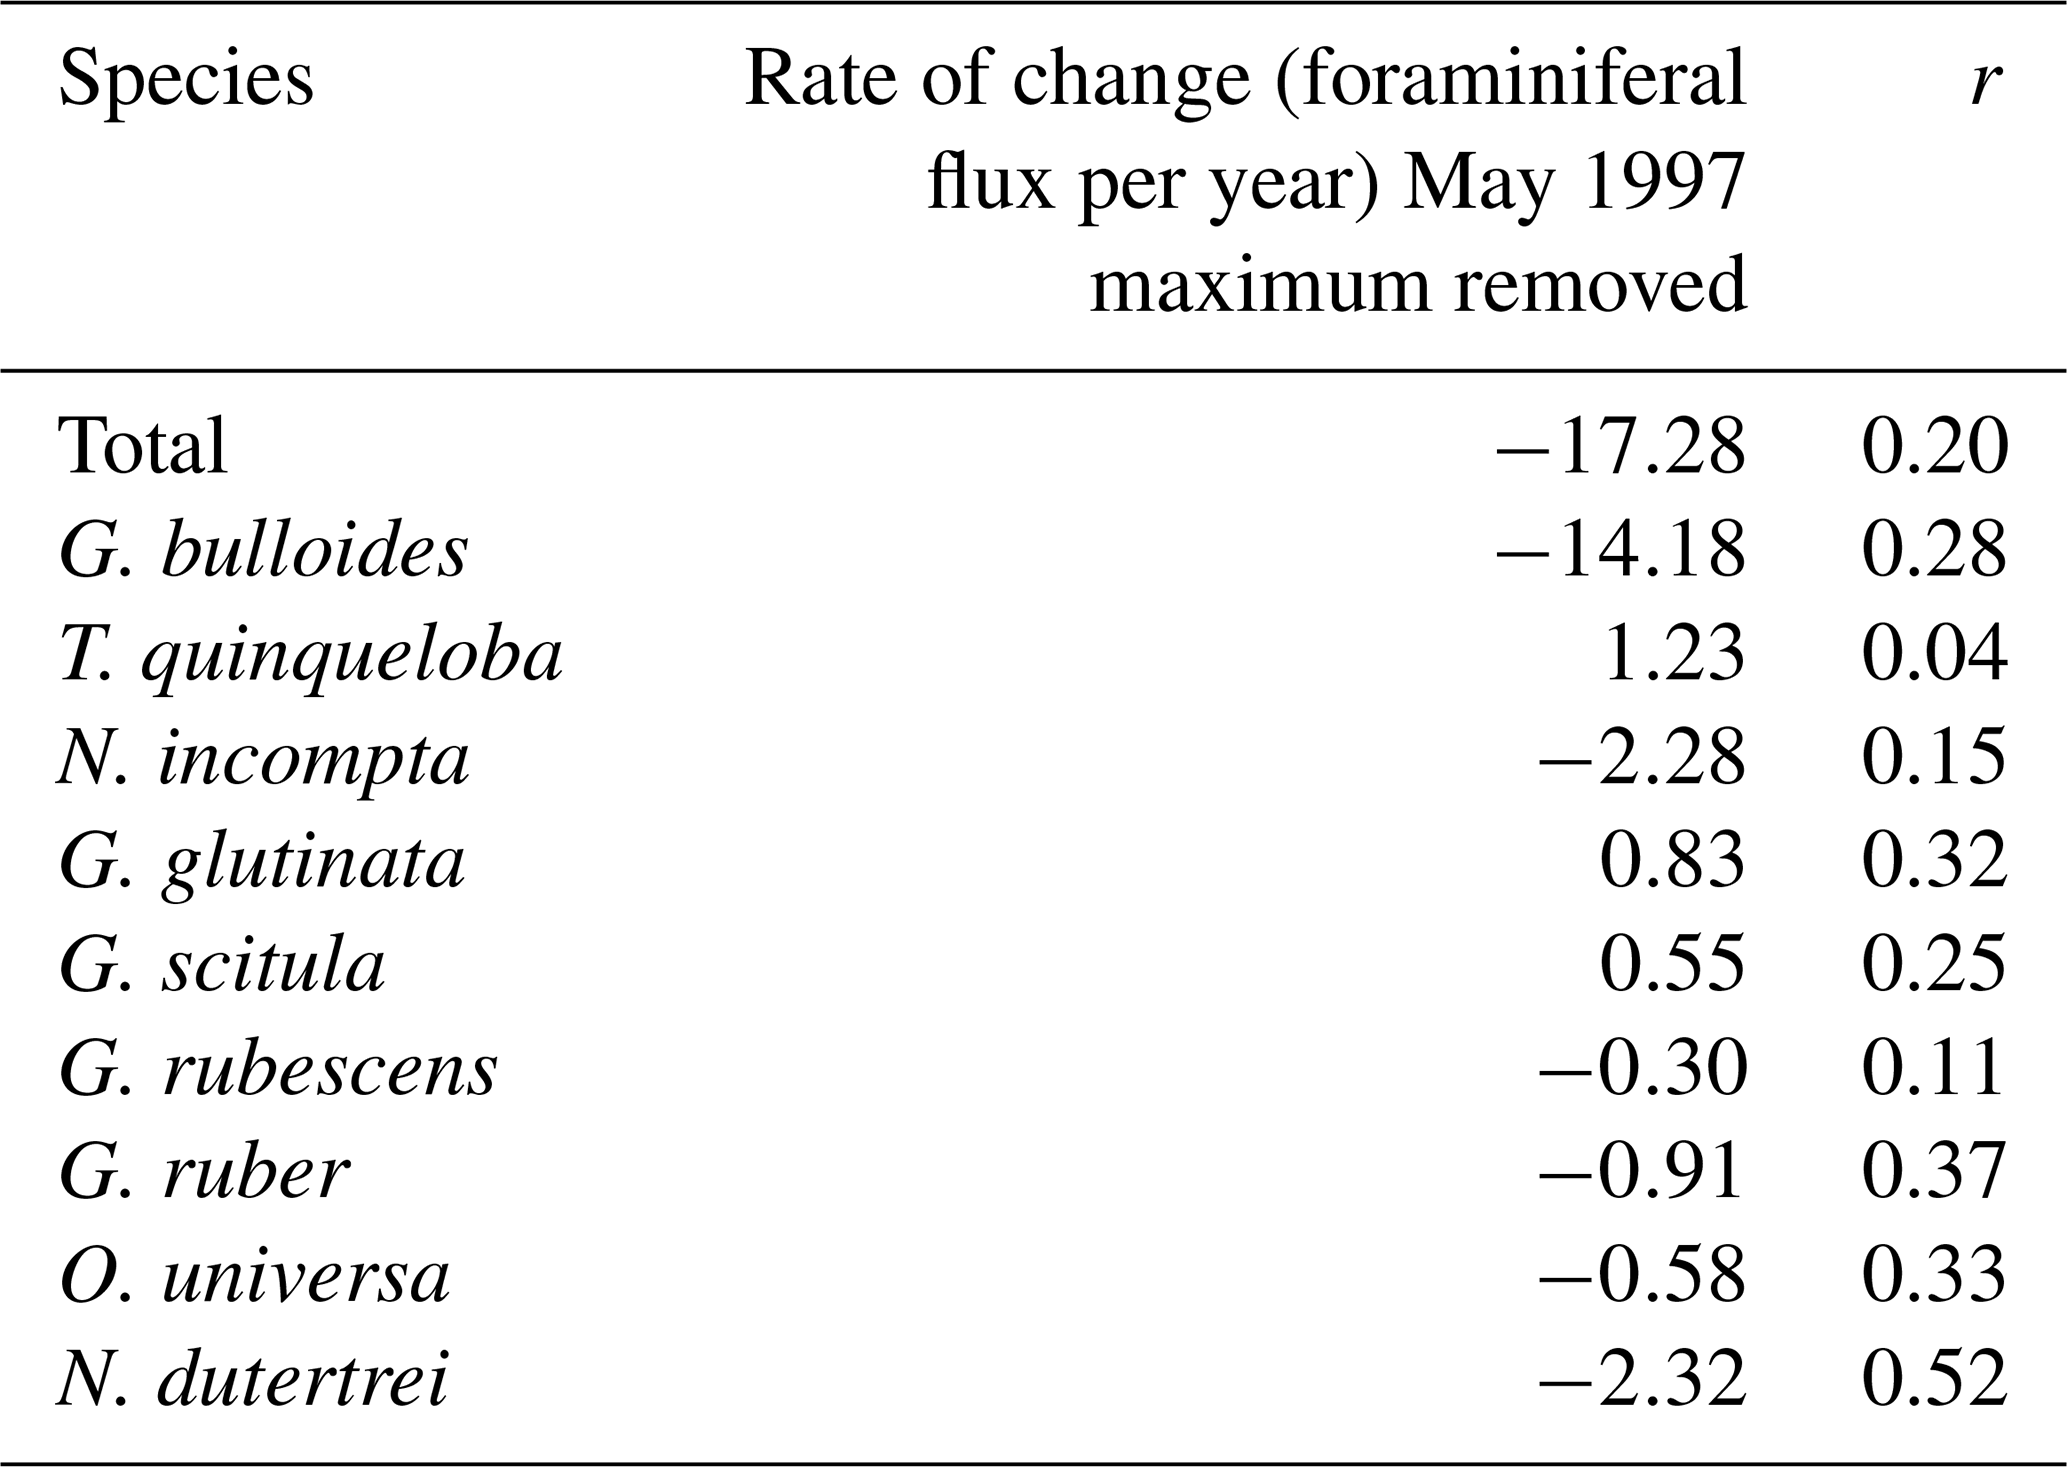
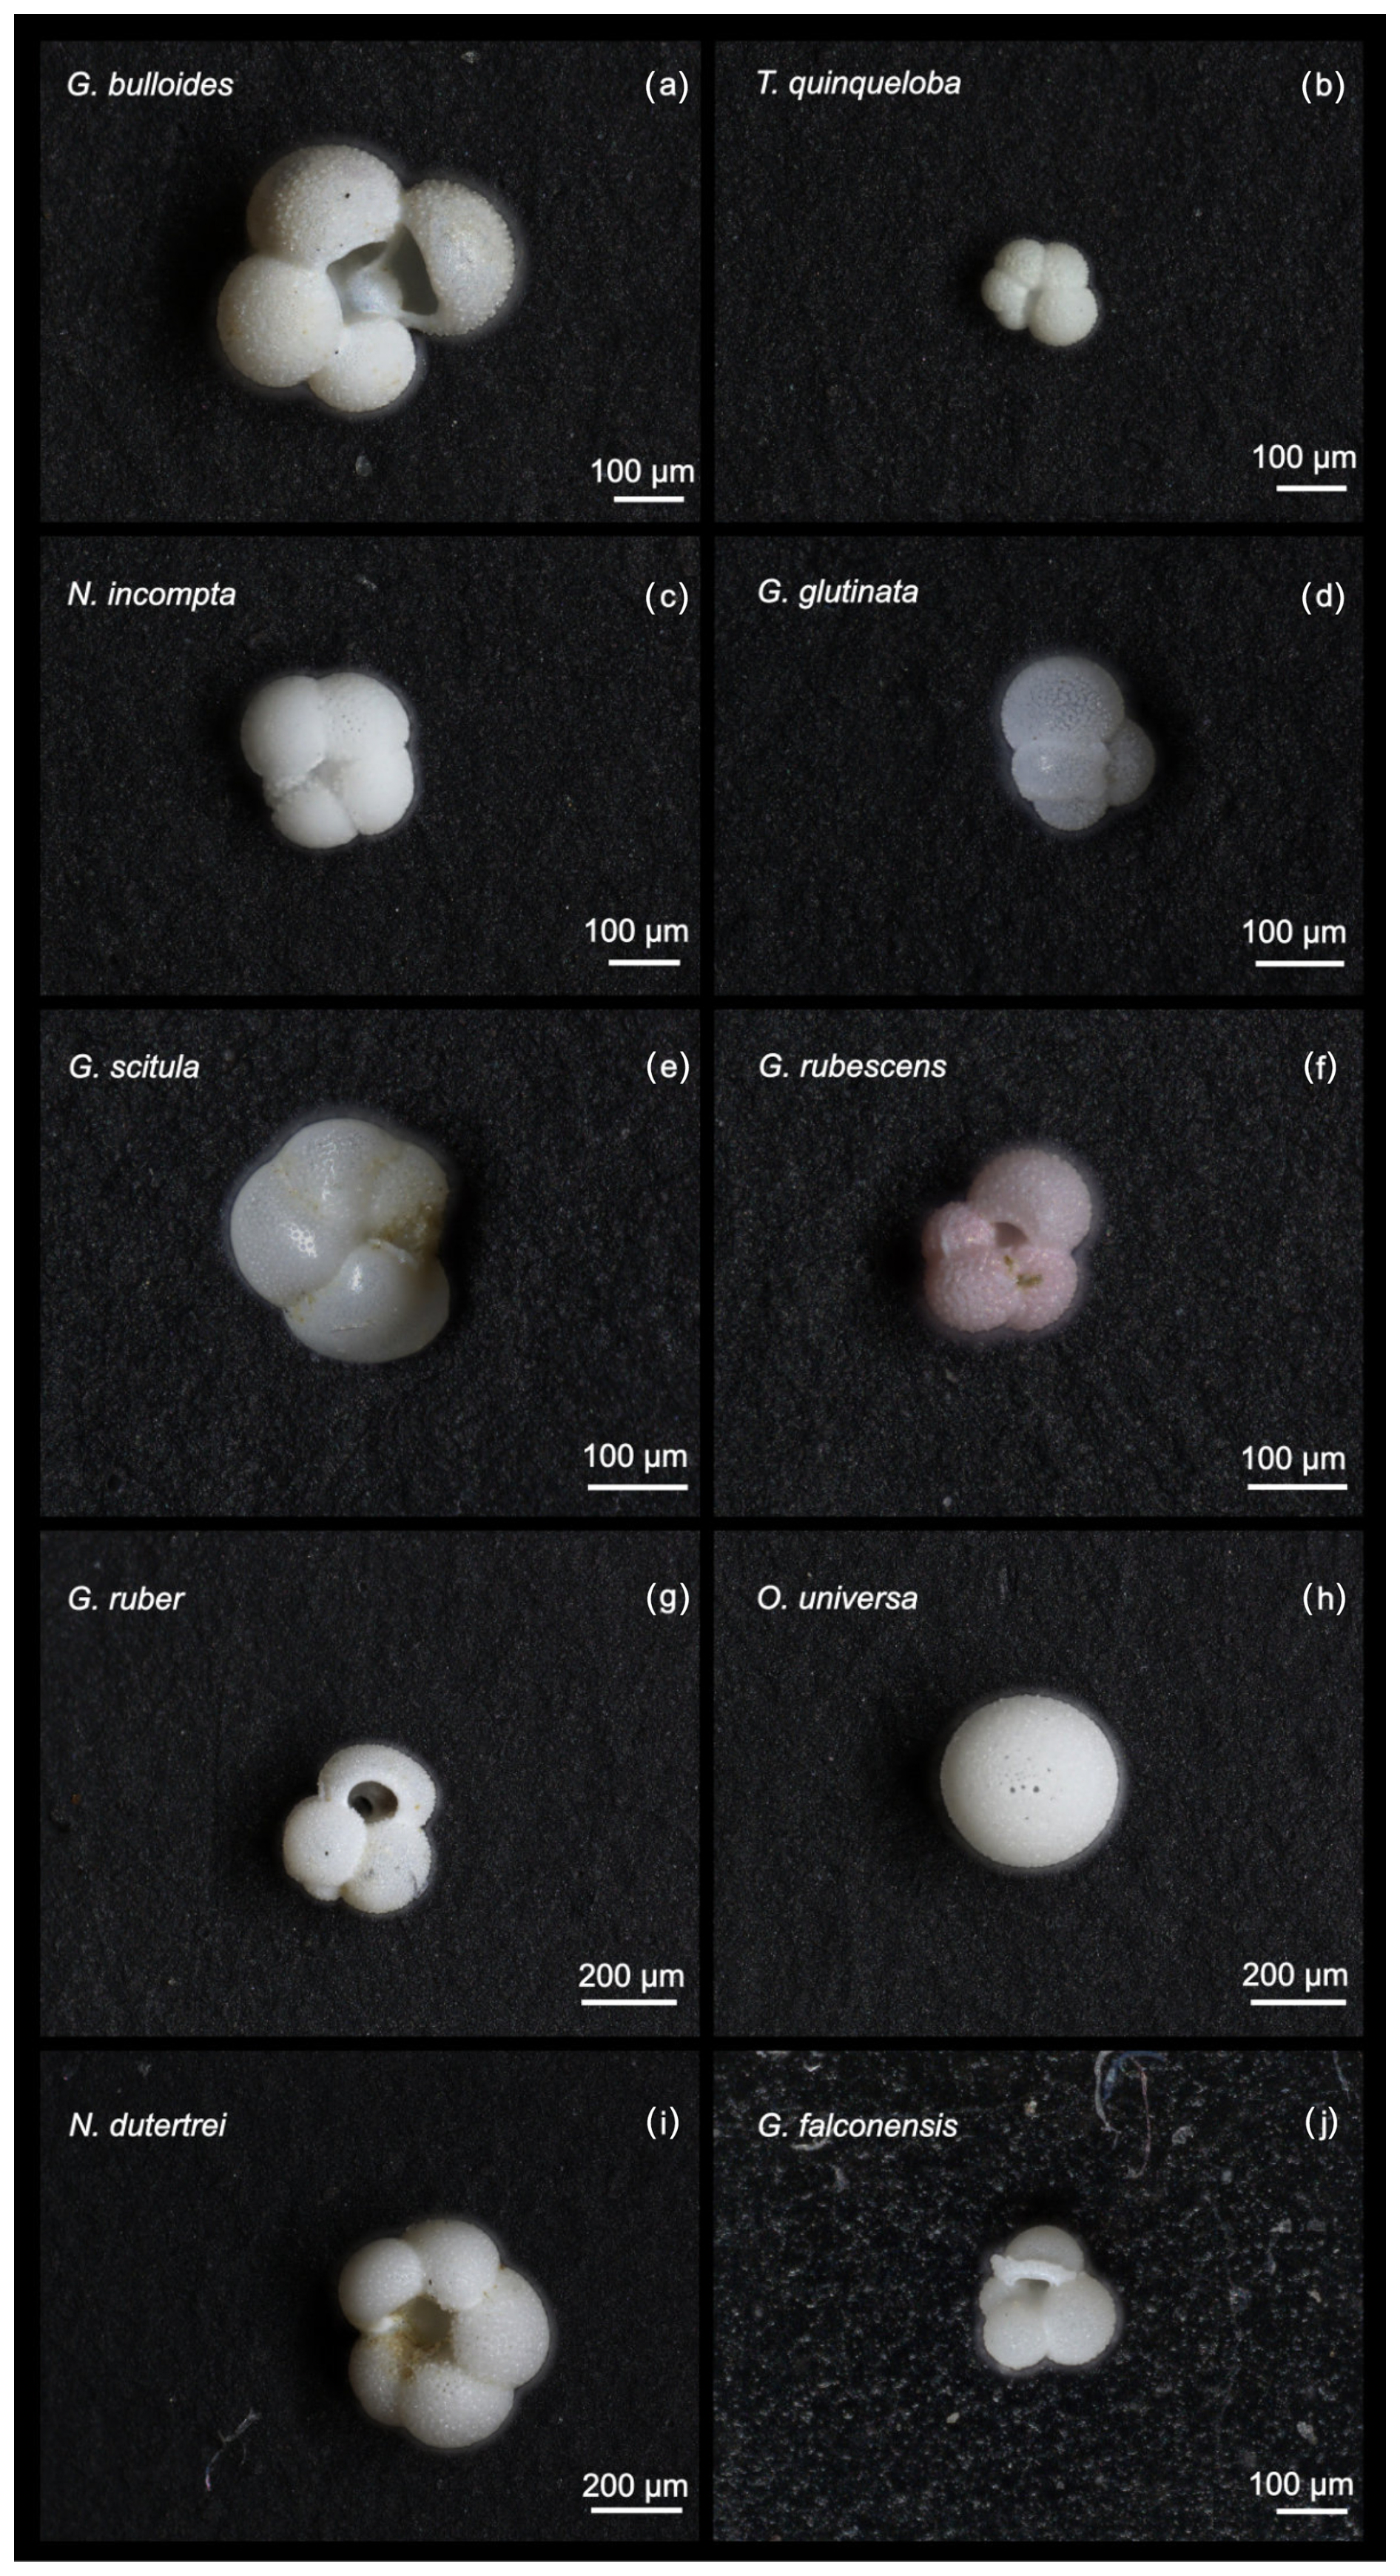
Figure A1Images of the 10 most abundant planktic foraminiferal species in SBB from 2014–2021.
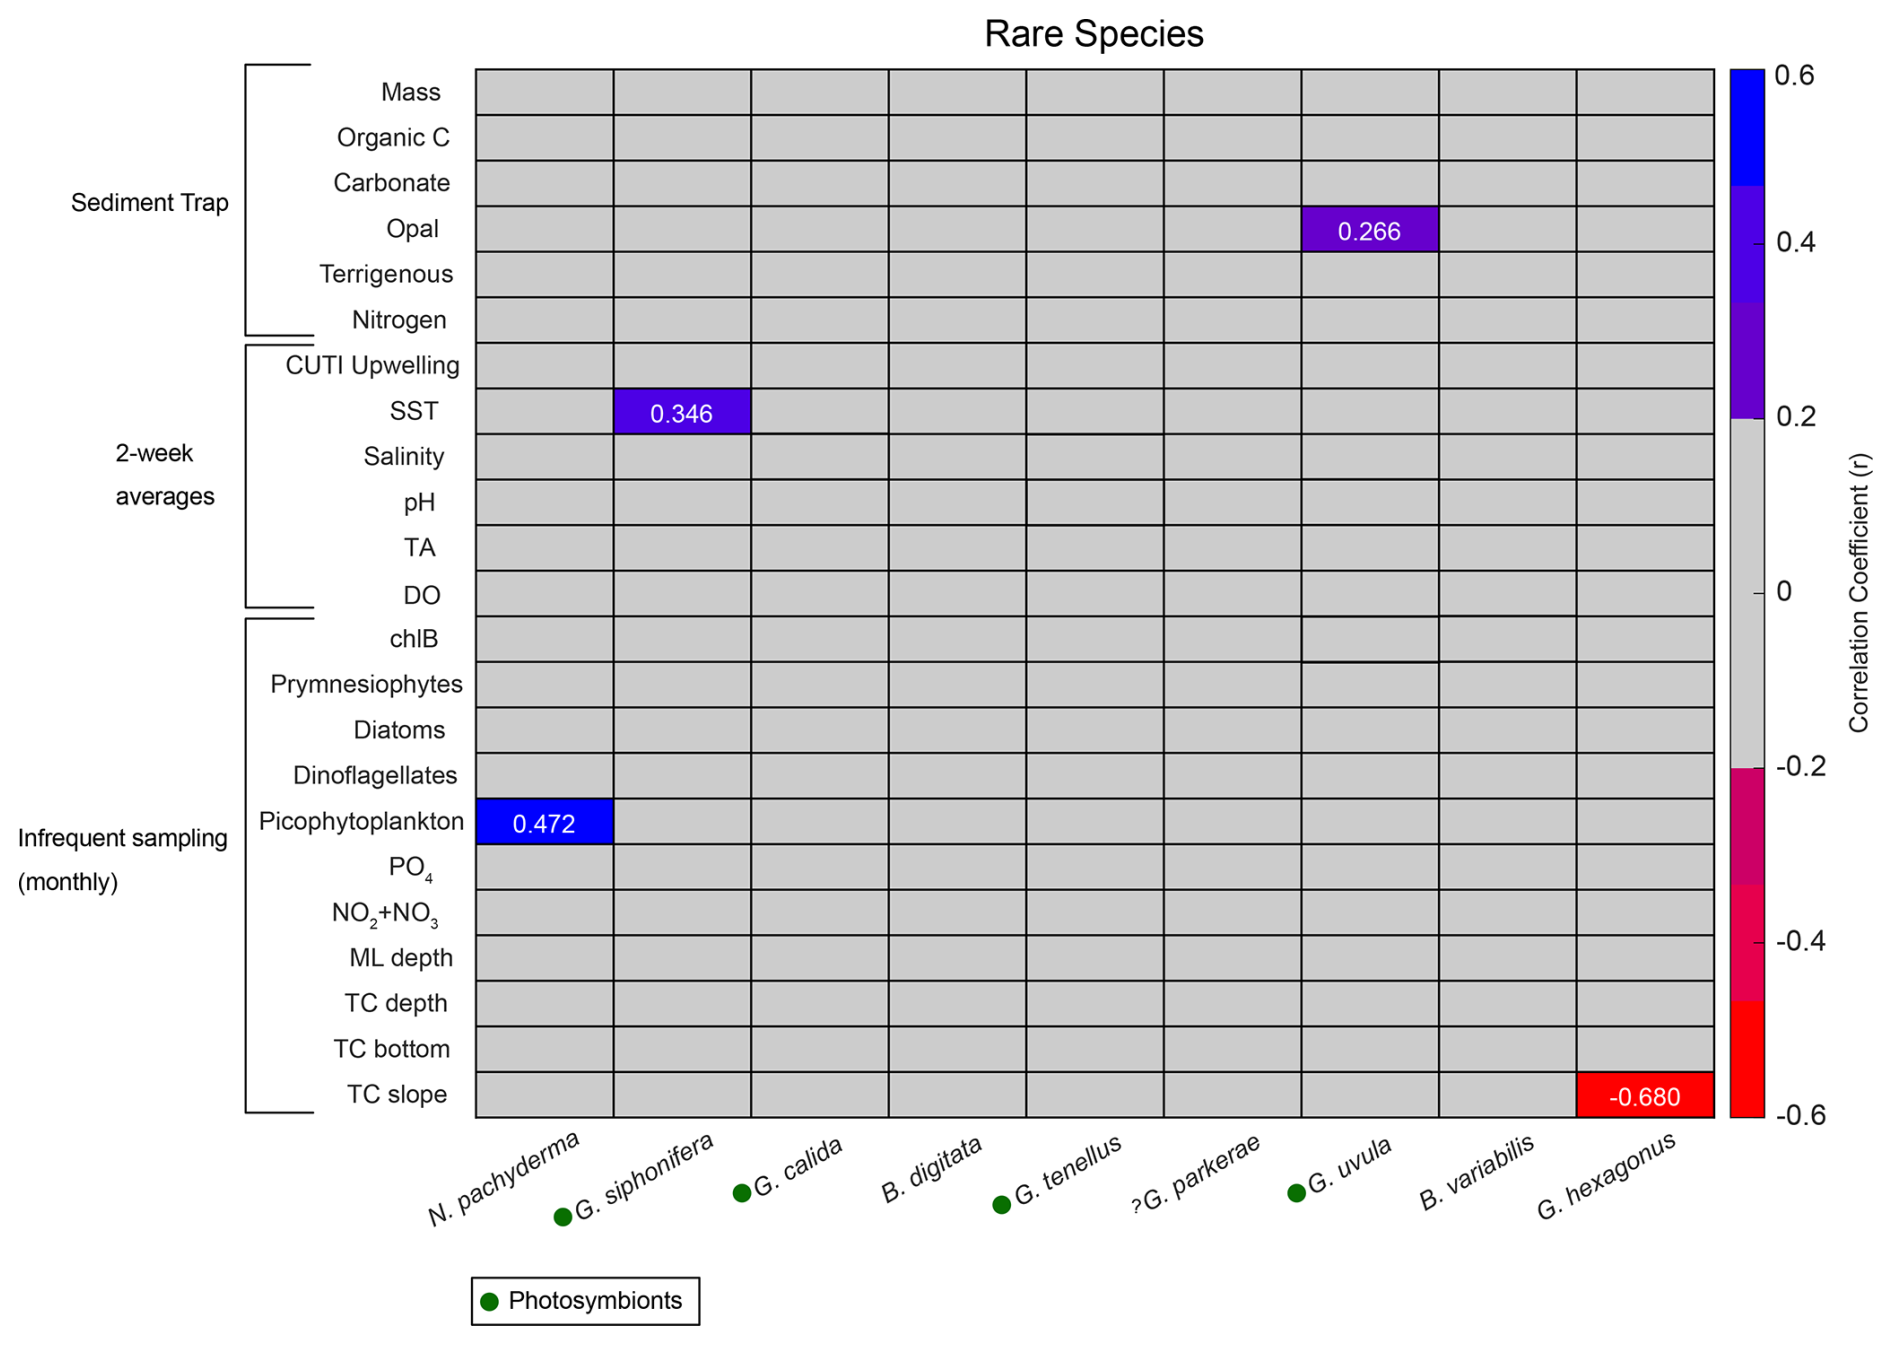
Figure A2Correlation matrix of rare species flux (x axis) with environmental parameters (y axis). Pearson correlation coefficients (r) for statistically significant correlations (p<0.05) are listed as numbers. Blue shades represent positive correlations, and red shades represent negative correlations. Gray represents correlation coefficients<0.2. Presence of photosymbionts based on Takagi et al. (2019), Schiebel and Hemleben (2017), and Meilland et al. (2022) is represented by green circles.
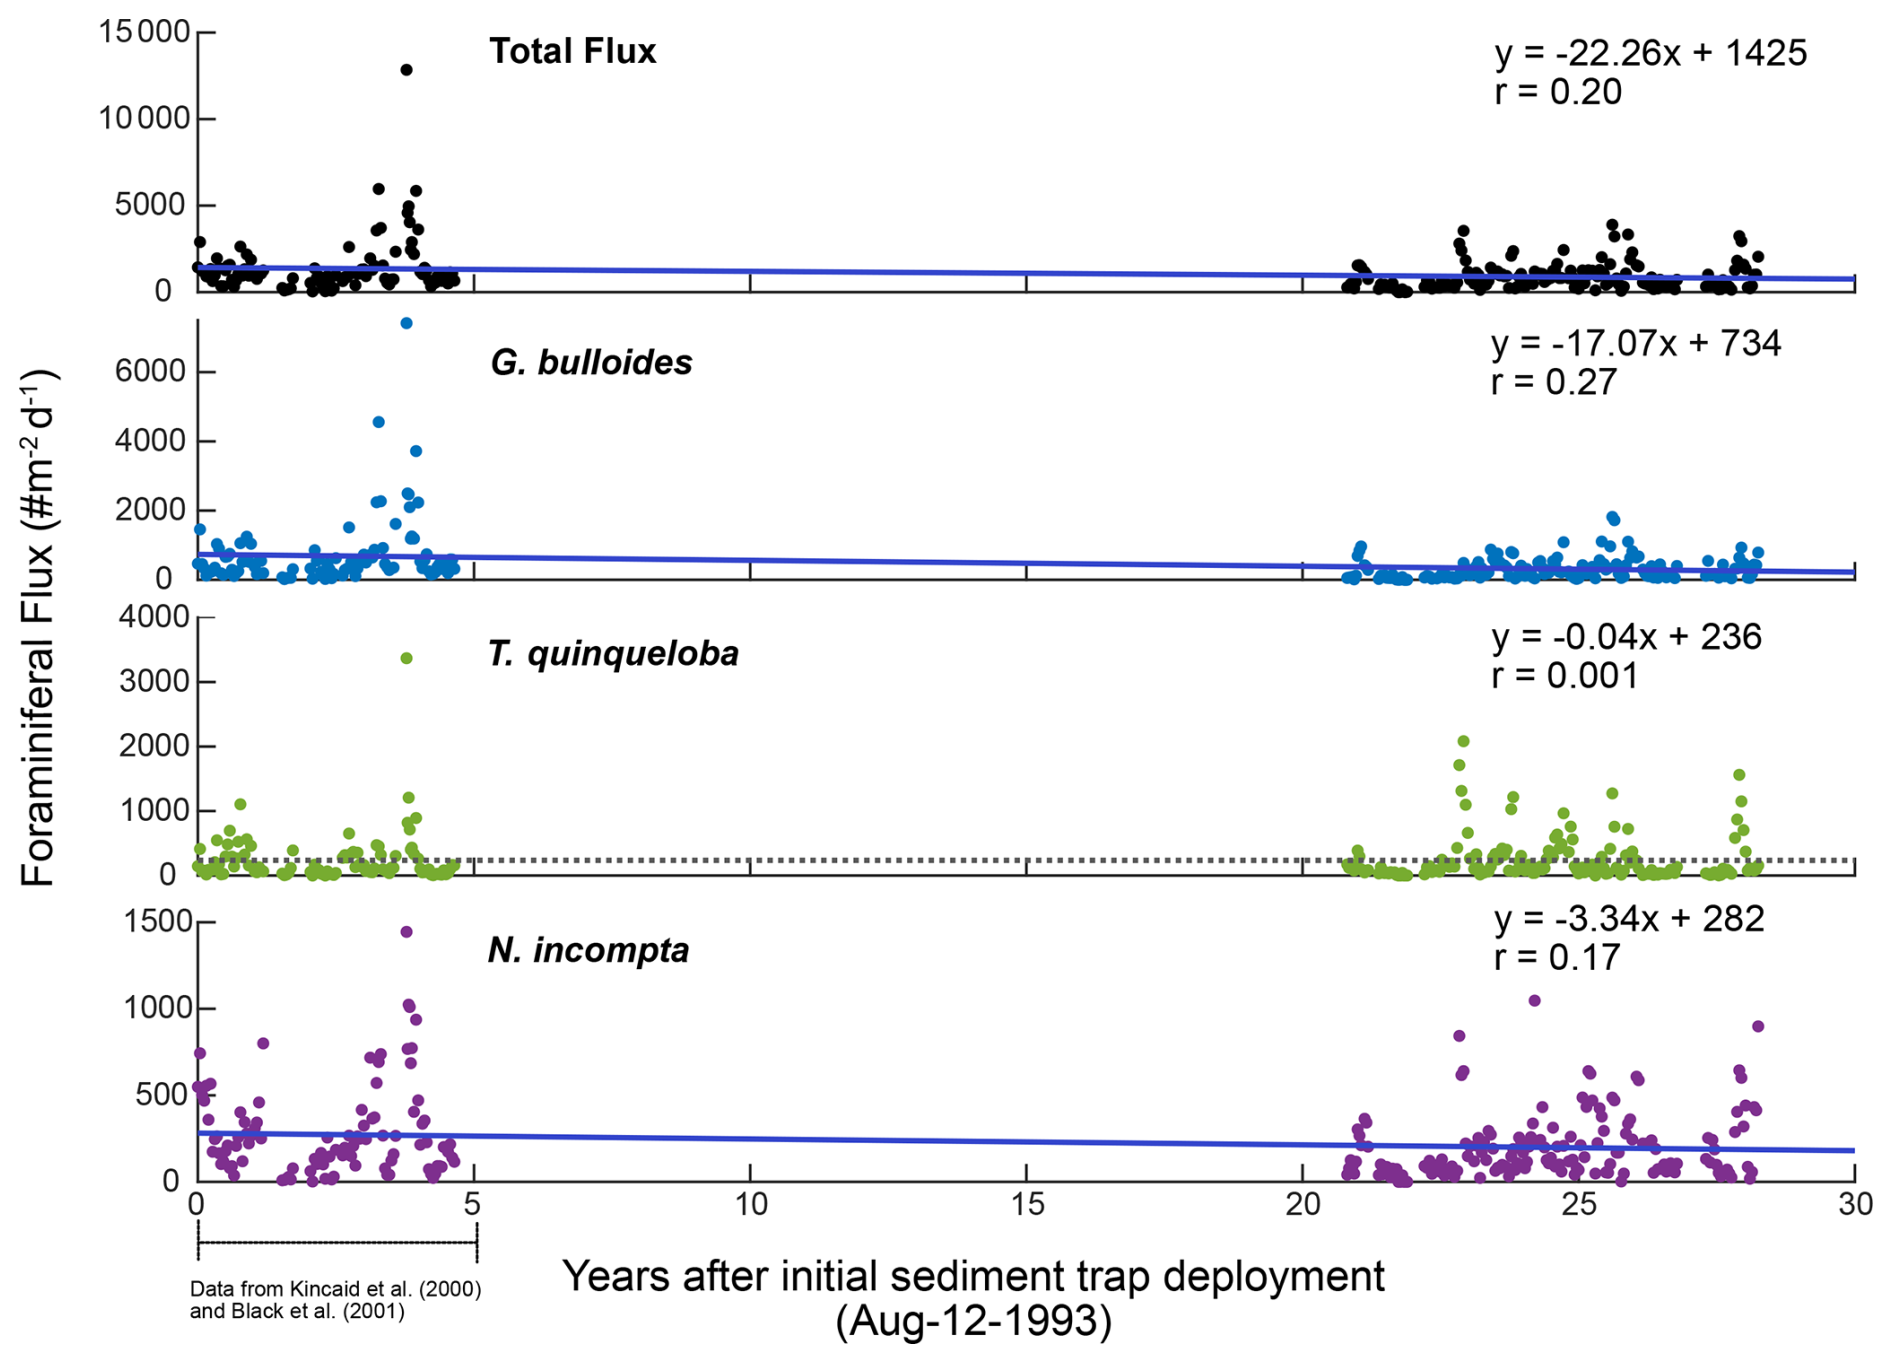
Figure A3Linear regression from 1993–2021 for total foraminiferal flux and the three most abundant species in SBB. Best fit lines represent rate of change of foraminiferal flux in units of foraminiferal flux per year.
Code used to generate figures is available upon request.
Foraminiferal flux data are publicly available from https://doi.org/10.26008/1912/bco-dmo.936276.1 (Havard et al., 2024). Sediment trap particle flux data are provided in the Supplement. Information about publicly available datasets used for statistical analyses is provided in Table A1. Additional cited datasets, including Santa Barbara harbor SST data (Carter et al., 2022), atmospheric CO2 concentration data (Keeling et al., 2001), and Southern Oscillation Index data (Trenberth et al., 2024), is listed in the references.
Foraminiferal samples are archived at North Carolina State University. All other sediment trap material is archived at the University of South Carolina.
The supplement related to this article is available online at https://doi.org/10.5194/bg-22-4035-2025-supplement.
CVD and CBN acquired funding and conceived the study. EH and KC conducted data collection. Data analysis and visualization was conducted by EH. Resources and samples were provided by ET. EH wrote the original manuscript draft. CVD, CBN, ET, and KC reviewed and edited the manuscript.
The contact author has declared that none of the authors has any competing interests.
Publisher's note: Copernicus Publications remains neutral with regard to jurisdictional claims made in the text, published maps, institutional affiliations, or any other geographical representation in this paper. While Copernicus Publications makes every effort to include appropriate place names, the final responsibility lies with the authors.
We would like to thank Peyton Fitts and Sara Wall for their roles in sample processing and Rachel Alcorn for providing foraminifera and coccolithophore graphics. We also want to thank Ethan Hyland and Astrid Schnetzer for their input and assistance. Thanks go to the captain and crew of the R/V Shearwater and everyone who helped with sediment trap maintenance and sample collection.
This research has been supported by the Division of Ocean Sciences (grant no. 2223074).
This paper was edited by Yuan Shen and reviewed by three anonymous referees.
Alfken, S., Wörmer, L., Lipp, J. S., Napier, T., Elvert, M., Wendt, J., Schimmelmann, A., and Hinrichs, K. U.: Disrupted Coherence Between Upwelling Strength and Redox Conditions Reflects Source Water Change in Santa Barbara Basin During the 20th Century, Paleoceanogr. Paleoclimatol., 36,e2021PA004354 https://doi.org/10.1029/2021PA004354, 2021.
Auad, G., Roemmich, D., and Gilson, J.: The California Current System in relation to the Northeast Pacific Ocean circulation, Prog. Oceanogr., 91, 576–592, https://doi.org/10.1016/j.pocean.2011.09.004, 2011.
Barry, J. P., Baxter, C. H., Sagarin, R. D., and Gliman, S. E.: Climate-Related, Long-Term Faunal Changes in a California Rocky Intertidal Community, Science, 267, 672–675, https://doi.org/10.1126/science.267.5198.672, 1995.
Baumann, K. H., Böckel, B., and Frenz, M.: Coccolith contribution to South Atlantic carbonate sedimentation, in: Coccolithophores, edited by: Thierstein, H. R. and Young, J. R., Springer, Berlin, Heidelberg, Germany, 367–402pp., https://doi.org/10.1007/978-3-662-06278-4_14, 2004.
Bé, A. W. H., Hemleben, C., Anderson, O. R., Spindler, M., Hacunda, J., and Tuntivate-Choy, S.: Laboratory and Field Observations of Living Planktonic Foraminifera, Micropaleontology, 23, 155–179, https://doi.org/10.2307/1485330, 1977.
Beaufort, L., Probert, I., De Garidel-Thoron, T., Bendif, E. M., Ruiz-Pino, D., Metzl, N., Goyet, C., Buchet, N., Coupel, P., Grelaud, M., Rost, B., Rickaby, R. E. M., and De Vargas, C.: Sensitivity of coccolithophores to carbonate chemistry and ocean acidification, Nature, 476, 80–83, https://doi.org/10.1038/nature10295, 2011.
Bednaršek, N., Feely, R. A., Howes, E. L., Hunt, B. P. V., Kessouri, F., León, P., Lischka, S., Maas, A. E., McLaughlin, K., Nezlin, N. P., Sutula, M., and Weisberg, S. B.: Systematic review and meta-analysis toward synthesis of thresholds of ocean acidification impacts on calcifying pteropods and interactions with warming, Front. Mar. Sci., 6, 227, https://doi.org/10.3389/fmars.2019.00227, 2019.
Behl, R. J.: Sedimentary Facies and Sedimentology of the Late Quaternary Santa Barbara Basin, Site 893, Proceedings of the Ocean Drilling Program, Sci. Res., 146, 295–308 1995.
Behl, R. J. and Kennett, J. P.: Brief interstadial events in the Santa Barbara basin, NE Pacific, during the past 60 kyr, Nature, 379, 243–246, 1996.
Benjamini, Y. and Hochberg, Y.: Controlling the false discovery rate: a practical and powerful approach to multiple testing, J. Roy. Stat. Soc. B Met., 57, 289–300, https://doi.org/10.1111/j.2517-6161.1995.tb02031.x, 1995.
Black, B. A., Schroeder, I. D., Sydeman, W. J., Bograd, S. J., Wells, B. K., and Schwing, F. B.: Winter and summer upwelling modes and their biological importance in the California Current Ecosystem, Glob. Change Biol., 17, 2536–2545, https://doi.org/10.1111/j.1365-2486.2011.02422.x, 2011.
Black, D. E., Thunell, R. C., and Tappa, E. J.: Planktonic foraminiferal response to the 1997–1998 El Niño: A sediment-trap record from the Santa Barbara Basin, Geology, 29, 1075–1078, https://doi.org/10.1130/0091-7613(2001)029<1075:PFRTTE>2.0.CO;2, 2001.
Blow, W. H.: Age, correlation, and biostratigraphy of the upper Tocuyo (San Lorenzo) and Pozon Formations, eastern Falcon, Venezuela, B. Am. Paleontol., 39, 67–251, 1959.
Bograd, S. J., Chereskin, T. K., and Roemmich, D.: Transport of mass, heat, salt, and nutrients in the southern California Current System: Annual cycle and interannual variability, J. Geophys. Res.-Oceans, 106, 9255–9275, https://doi.org/10.1029/1999jc000165, 2001.
Bograd, S. J., Jacox, M. G., Hazen, E. L., Lovecchio, E., Montes, I., Buil, M. P., Shannon, L. J., Sydeman, W. J., and Rykaczewski, R. R.: Climate Change Impacts on Eastern Boundary Upwelling Systems, 15, 303–328, https://doi.org/10.1146/annurev-marine-032122-021945, 2023.
Brady, H. B.: Supplementary note on the foraminifera of the Chalk (?) of the New Britain group, Geol. Mag., 4, 534–536, https://doi.org/10.1017/S0016756800150137, 1877.
Brady, H. B.: Notes on some of the reticularian Rhizopoda of the “Challenger” expedition I. – On new or little known arenaceous types, Q. J. Micros. Sci., 19, 20–63, 1879.
Brady, H. B.: Report on the Foraminifera, in: Tizard and Murray, Exploration of the Faroe Channel, during the summer of 1880, in H. M. S. “Knight Errant”, with subsidiary reports, Proceedings of the Royal Society of Edinburgh, XI, 708–717 pp., 1882.
Brönnimann, P. and Resig, J.: A Neogene globigerinacean biochronologic time-scale of the southwestern Pacific, Initial Rep. Deep Sea, 7, 1235–1469, 1971.
California Cooperative Oceanic Fisheries Investigations: Oceanographic Data: bottle and CTD cast files, CalCOFI [data set], https://calcofi.org/ (last access: August 2024), 2024.
Capone, D. G. and Hutchins, D. A.: Microbial biogeochemistry of coastal upwelling regimes in a changing ocean, Nat. Geosci., 6, 711–717 https://doi.org/10.1038/ngeo1916, 2013.
Carter, M. L., Flick, R. E., Terrill, E., Beckhaus, E. C., Martin, K., Fey, C. L., Walker, P. W., Largier, J. L., and McGowan, J. A.: Shore Stations Program, Santa Barbara (Santa Barbara Archive, 2025-03-14). In Shore Stations Program Data Archive: Current and Historical Coastal Ocean Temperature and Salinity Measurements from California Stations [data set], https://doi.org/10.6075/J03N236M, 2022.
Catlett, D., Siegel, D. A., Simons, R. D., Guillocheau, N., Henderikx-Freitas, F., and Thomas, C. S.: Diagnosing seasonal to multi-decadal phytoplankton group dynamics in a highly productive coastal ecosystem, Prog. Oceanogr., 197, 102637, https://doi.org/10.1016/J.POCEAN.2021.102637, 2021.
Cifelli, R.: Globigerina incompta, a new species of pelagic foraminifera from the North Atlantic, Cushman Found. Foram. Res. Contr., 12, 83–86, 1961.
Crickenberger, S. and Wethey, D. S.: Annual temperature variation as a time machine to understand the effects of long-term climate change on a poleward range shift, Glob. Change Biol., 24, 3804–3819, https://doi.org/10.1111/gcb.14300, 2018.
Dalsin, M., Walter, R. K., and Mazzini, P. L. F.: Effects of basin-scale climate modes and upwelling on nearshore marine heatwaves and cold spells in the California Current, Sci. Rep.-UK, 13, 12389, https://doi.org/10.1038/s41598-023-39193-4, 2023.
Davis, C. V., Rivest, E. B., Hill, T. M., Gaylord, B., Russell, A. D., and Sanford, E.: Ocean acidification compromises a planktic calcifier with implications for global carbon cycling, Sci. Rep.-UK, 7, 2225, https://doi.org/10.1038/s41598-017-01530-9, 2017.
Davis, C. V., Ontiveros-Cuadras, J. F., Benitez-Nelson, C., Schmittner, A., Tappa, E. J., Osborne, E., and Thunell, R. C.: Ongoing Increase in Eastern Tropical North Pacific Denitrification as Interpreted Through the Santa Barbara Basin Sedimentary δ15N Record, Paleoceanogr. Paleoclimatol., 34, 1554–1567, https://doi.org/10.1029/2019PA003578, 2019.
de Moel, H., Ganssen, G. M., Peeters, F. J. C., Jung, S. J. A., Kroon, D., Brummer, G. J. A., and Zeebe, R. E.: Planktic foraminiferal shell thinning in the Arabian Sea due to anthropogenic ocean acidification?, Biogeosciences, 6, 1917–1925, https://doi.org/10.5194/bg-6-1917-2009, 2009.
d'Orbigny, A. D.: Tableau methodique de la classe des Cephalopodes, Ann. Sci. Nat., 1, 245–314, 1826.
d'Orbigny, A. D.: Foraminiferes, in: Histoire physique et naturelle de l'Ile de Cuba, edited by: de la Sagra, R. and Bertrand, A., Libraire de la Société de géographique et de la Société royale des antiquaires du nord, Paris, 1–224, https://doi.org/10.5962/bhl.title.51128, 1839a.
d'Orbigny, A. D.: Foraminifères des Iles Canaries, in: Histoire naturelle des Iles Canaries, edited by: Barker-Webb, P. and Berthelot, S., Sabin Bèthune, https://doi.org/10.5962/bhl.title.60795, 120–146, 1839b.
d'Orbigny, A. D.: Voyage dans l'Amérique Méridionale, Foraminifères, 5, 1–86, 1839c.
Egger, J. G.: Foraminiferen aus Meeresgrundproben, gelothet von 1874 bis 1876 von S. M. Sch. Gazelle, Abh. K. Bayer. Akad. Wiss., Cl. II, 18, 195–457, 1893.
Ehrenberg, C. G.: Elemente des tiefen Meeresgrundes in Mexikanischen Golfstrome bei Florida; Über die TiefgrundVerhältnisse des Oceans am Eingange der Davisstrasse und bei Island, K. Preuss. Akad. Wiss. Berlin, 1861, 275–315, 1862.
Eichhubl, P., Gary Greene, H., and Maher, N.: Physiography of an active transpressive margin basin: high-resolution bathymetry of the Santa Barbara basin, Southern California continental borderland, 2001.
Feely, R. A., Sabine, C. L., Hernandez-Ayon, M., Lanson, D., and Hales, B.: Evidence for Upwelling of Corrosive “Acidified” Water onto the Continental Shelf, Science, 320, 1490–1492, https://doi.org/10.1029/2004GB002295, 2008.
Fehrenbacher, J. S., Russell, A. D., Davis, C. V., Spero, H. J., Chu, E., and Hönisch, B.: BaCa ratios in the non-spinose planktic foraminifer Neogloboquadrina dutertrei: Evidence for an organic aggregate microhabitat, Geochim. Cosmochim. Ac., 236, 361–372, https://doi.org/10.1016/J.GCA.2018.03.008, 2018.
Fiedler, P. C. and Talley, L. D.: Hydrography of the eastern tropical Pacific: A review, Prog. Oceanogr., 69, 143–180, https://doi.org/10.1016/j.pocean.2006.03.008, 2006.
Field, D. B., Baumgartner, T. R., Charles, C. D., Ferreira-Bartrina, V., and Ohman, M. D.: Planktonic Foraminifera of the California Current Reflect 20th-Century Warming, Science, 311, 63–66, https://doi.org/10.1021/jp053848o, 2006.
Frankignoulle, M., Canon, C., and Gattuso, J.-P: Marine calcification as a source of carbon dioxide: Positive feedback of increasing atmospheric CO2, Limnology and Oceanography,39,458–462, https://doi.org/10.4319/lo.1994.39.2.0458, 1994.
García-Reyes, M. and Largier, J.: Observations of increased wind-driven coastal upwelling off Central California, J. Geophys. Res.-Oceans, 115,C04011, https://doi.org/10.1029/2009JC005576, 2010.
Groppe, D.: fdr_bh, MATLAB Central File Exchange [code], https://www.mathworks.com/matlabcentral/fileexchange/27418-fdr_bh (last access: 7 April 2024), 2024.
Gruber, N.: Warming up, turning sour, losing breath: Ocean biogeochemistry under global change,Philosophical Transactions of the Royal Society A: Mathematical, Physical and Engineering Sciences, 369, 1980-1996, https://doi.org/10.1098/rsta.2011.0003, 2011.
Gruber, N., Hauri, C., Lachkar, Z., Loher, D., Frölicher, T. L., and Plattner, G.-K.: Rapid Progression of Ocean Acidification in the California Current System, 2012.Science, 337,https://doi.org/10.1016/j.rsma.2025.1043,6, 220-223.
Gupta, A. K., Anderson, D. M., and Overpeck, J. T.: Abrupt changes in the Asian southwest monsoon during the holocene and their links to the North Alantic Ocean, Nature, 421, 354–357, https://doi.org/10.1038/nature01340, 2003.
Hauri, C., Gruber, N., Plattner, G.-K., Alin, S., Feely, R. A., Hales, B., and Wheeler, P. A.: Ocean acidification in the california current system, Oceanography, 22, 60–71, 2009.
Hauri, C., Gruber, N., Vogt, M., Doney, S. C., Feely, R. A., Lachkar, Z., Leinweber, A., McDonnell, A. M. P., Munnich, M., and Plattner, G.-K.: Spatiotemporal variability and long-term trends of ocean acidification in the California Current System, Biogeosciences, 10, 193–216, https://doi.org/10.5194/bg-10-193-2013, 2013.
Havard, E., Cherry, K., Benitez-Nelson, C. R., Tappa, E., and Davis, C.: Formaminiferal Flux acquired by the Santa Barbara Basin Sediment Trap Mooring between 2014 and 2021, Biological and Chemical Oceanography Data (Version 1) Version Date 2024-10-08, Management Office (BCO-DMO) [data set], https://doi.org/10.26008/1912/bco-dmo.936276.1, 2024.
Hendy, I. L. and Kennett, J. P.: Dansgaard-Oeschger cycles and the California Current System: Planktonic foraminiferal response to rapid climate change in Santa Barbara Basin, Ocean Drilling Program hole 893A, Paleoceanography, 15, 30–42, https://doi.org/10.1029/1999PA000413, 2000.
Hendy, I. L., Pedersen, T. F., Kennett, J. P., and Tada, R.: Intermittent existence of a southern Californian upwelling cell during submillennial climate change of the last 60 kyr, Paleoceanography, 19,PA3007, https://doi.org/10.1029/2003PA000965, 2004.
Hofker, J.: Foraminifera Dentata, foraminifera of Santa Cruz and Thatch Island, Virgin Archipelago, West Indies, Spolia Zool. Mus. Kobenhaven, 15, 1–237, 1956.
Hofmann, M. and Schellnhuber, H.-J.: Oceanic acidification affects marine carbon pump and triggers extended marine oxygen holes.Proceedings of the National Academy of Sciences, 106, 3017–3022, https://doi.org/10.1073/pnas.0813384106,2009.
Hönisch, B., Ridgwell, A., Schmidt, D. N., Thomas, E., Gibbs, S. J., Sluijs, A., and Williams, B.: The geological record of ocean acidification, Science, 335, 1058-1063, https://doi.org/10.1126/science.1208277, 2012.
Jacox, M. G., Edwards, C. A., Hazen, E. L, and Bograd, S. J.: Coastal upwelling revisited: Ekman, Bakun, and improved upwelling indices for the U. S. west coast, J. Geophys. Res., 123, 7332–7350, https://doi.org/10.1029/2018JC014187, 2018.
Johnson, R., Manno, C., and Ziveri, P.: Shelled pteropod abundance and distribution across the Mediterranean Sea during spring, Prog. Oceanogr., 210, 102390, https://doi.org/10.1016/j.pocean.2022.102930, 2023.
Jonkers, L. and Kučera, M.: Global analysis of seasonality in the shell flux of extant planktonic Foraminifera, Biogeosciences, 12, 2207–2226, https://doi.org/10.5194/bg-12-2207-2015, 2015.
Jonkers, L., Hillebrand, H., and Kucera, M.: Global change drives modern plankton communities away from the pre-industrial state, Nature, 570, 372–375, https://doi.org/10.1038/s41586-019-1230-3, 2019.
Keeling, C. D., Piper, S. C., Bacastow, R. B., Wahlen, M., Whorf, T. P., Heimann, M., and Meijer, H. A.: Exchanges of atmospheric CO2 and 13CO2 with the terrestrial biosphere and oceans from 1978 to 2000, I. Global aspects, SIO Reference Series, No. 01–06, Scripps Institution of Oceanography, San Diego [data set], 88 p., http://escholarship.org/uc/item/09v319r9, 2001.
Kennedy, E. G., Zulian, M., Hamilton, S. L., Hill, T. M., Delgado, M., Fish, C. R., Gaylord, B., Kroeker, K. J., Palmer, H. M., Ricart, A. M., Sanford, E., Spalding, A. K., Ward, M., Carrasco, G., Elliott, M., Grisby, G. V., Harris, E., Jahncke, J., Rocheleau, C. N., Westerink, S., and Wilmot, M. I.: A high-resolution synthesis dataset for multistressor analyses along the US West Coast, Earth Syst. Sci. Data, 16, 219–243, https://doi.org/10.5194/essd-16-219-2024, 2024.
Kennett, J. P. and Ingram, L. B.: A 20 000 year record of ocean circulation and climate change from the Santa Barbara basin, Nature, 377, 510–514, https://doi.org/10.1038/377510a0, 1995.
Kincaid, E., Thunell, R. C., Le, J., Lange, C. B., Weinheimer, A. L., and Reid, F. M. H.: Planktonic foraminiferal fluxes in the Santa Barbara Basin: response to seasonal and interannual hydrographic changes, Deep-Sea Res. Pt. II, 47, 1157–1176, 2000.
Kiss, P., Jonkers, L., Hudáčková, N., Reuter, R. T., Donner, B., Fischer, G., and Kucera, M.: Determinants of Planktonic Foraminifera Calcite Flux: Implications for the Prediction of Intra- and Inter-Annual Pelagic Carbonate Budgets, Global Biogeochem. Cy., 35,e2020GB006748, https://doi.org/10.1029/2020GB006748, 2021.
Kucera, M.: Chapter Six Planktonic Foraminifera as Tracers of Past Oceanic Environments,in: Proxies in Late Cenozoic Paleoceanography, Developments in marine geology, 1, 213-262 https://doi.org/10.1016/S1572-5480(07)01011-1, 2007.
Kucera, M., Weinelt, M., Kiefer, T., Pflaumann, U., Hayes, A., Weinelt, M., Chen, M. Te, Mix, A. C., Barrows, T. T., Cortijo, E., Duprat, J., Juggins, S., and Waelbroeck, C.: Reconstruction of sea-surface temperatures from assemblages of planktonic foraminifera: multi-technique approach based on geographically constrained calibration data sets and its application to glacial Atlantic and Pacific Oceans, Quaternary Sci. Rev., 24, 951–998, https://doi.org/10.1016/J.QUASCIREV.2004.07.014, 2005.
Lan, X. and Keeling, R.: NOAA/GML and Scripps Institution of Oceanography, http://gml.noaa.gov/ccgg/trends/ (last access: 16 October 2024), http://scrippsco2.ucsd.edu/ (last access: 16 October 2024), 2024.
Langer, M. R.: Assessing the contribution of foraminiferan protists to global ocean carbonate production, J. Eukaryot. Microbiol.,55, 163–169, https://doi.org/10.1111/j.1550-7408.2008.00321.x, 2008.
Lipps, J. H. and Valentine, J. W.: The role of foraminifera in the trophic structure of marine communities, Lethaia, 3, 279–286, https://doi.org/10.1111/j.1502-3931.1970.tb01271.x, 1970.
Lisiecki, L. E. and Raymo, M. E.: A Pliocene-Pleistocene stack of 57 globally distributed benthic δ18O records, Paleoceanography, 20, 1–17, https://doi.org/10.1029/2004PA001071, 2005.
Lynn, R. J. and Bograd, S. J.: Dynamic evolution of the 1997–1999 El Niño-La Niña cycle, Prog. Oceanogr.,54, 59–75, 2002.
McClatchie, S., Goericke, R., Leising, A., Auth, T., Bjorkstedt, E., Robertson, R., Brodeur, R. D., Du, X., Daly, E., Morgan, C. A., Chavez, F., Debich, A. J., Hidebrand, J., Field, J., Sakuma, K., Jacox, M. G., Kahru, M., Kudela, R., Anderson, C., Lavaniegos, B. E., Gomez-Valdes, J., Jimenez-Rosenberg, S. P. A., McCabe, R., Melin, S. R., Ohman, M. D., Sala, L. M., Peterson, B., Fisher, J., Schroeder, I. D., Bograd, S. J., Hazen, E. L., Schneider, S. R., Golightly, R. T., Suryan, R. M., Gladics, A. J., Loredo, S., Porquez, J. M., Thompson, A. R., Weber, E. D., Watson, W., Trainer, V., Warzybok, P., Bradley, R., and Jahncke, J.: STATE OF THE CALIFORNIA CURRENT 2015-16: COMPARISONS WITH THE 1997-98 EL NINO, UC Santa Cruz, https://escholarship.org/uc/item/730558jh (last access: May 2024), 2016.
McInerney, F. A. and Wing, S. L.: The paleocene-eocene thermal maximum: A perturbation of carbon cycle, climate, and biosphere with implications for the future, Annu Rev Earth Planet Sci, 39, 489–516, https://doi.org/10.1146/annurev-earth-040610-133431, 2011.
Meilland, J., Cornuault, P., Morard, R., Brummer, G.-J. A., Kucera, M., and Andersens, H. C.: ICES identification leaflets for plankton, Identification guide to extant planktonic foraminifera. Part 1: Family Candeinidae and genera Berggrenia, Bolivina, Dentigloborotalia, and Neogallitellia, International Council for the Exploration of the Sea Conseil International pour l'Exploration de la Mer, https://doi.org/10.17895/ices.pub.7643, 2022.
Mekkes, L., Renema, W., Bednaršek, N., Alin, S. R., Feely, R. A., Huisman, J., Roessingh, P., and Peijnenburg, K. T. C. A.: Pteropods make thinner shells in the upwelling region of the California Current Ecosystem, Sci. Rep.-UK, 11,1731, https://doi.org/10.1038/s41598-021-81131-9, 2021.
Meyer, J. and Riebesell, U.: Reviews and Syntheses: Responses of coccolithophores to ocean acidification: a meta-analysis, Biogeosciences, 12, 1671–1682, https://doi.org/10.5194/bg-12-1671-2015, 2015.
Morey, A. E., Mix, A. C., and Pisias, N. G.: Planktonic foraminiferal assemblages preserved in surface sediments correspond to multiple environment variables, Quaternary Sci. Rev., 24, 925–950, https://doi.org/10.1016/J.QUASCIREV.2003.09.011, 2005.
Moy, A. D., Howard, W. R., Bray, S. G., and Trull, T. W.: Reduced calcification in modern Southern Ocean planktonic foraminifera, Nat. Geosci., 2, 276–280, https://doi.org/10.1038/ngeo460, 2009.
Nagelkerken, I. and Connell, S. D.: Global alteration of ocean ecosystem functioning due to increasing human CO2 emissions, P. Natl. Acad. Sci. USA, 112, 13272–13277, https://doi.org/10.1073/pnas.1510856112, 2015.
Naidu, P. D. and Malmgren, B. A.: Monsoon upwelling effects on test size of some planktonic foraminiferal species from the Oman Margin, Arabian Sea, Paleoceanography, 10, 117–122, https://doi.org/10.1029/94PA02682, 1995.
Natland, M. L.: New Species of Foraminifera from off the West Coast of North America and from the Later Tertiary of the Los Angeles Basin, B. Scripps Inst. Oceanogr., Tech. Ser., 4, 137–164, 1938.
NOAA National Data Buoy Center: Meteorological and oceanographic data collected from the National Data Buoy Center Coastal-Marine Automated Network (C-MAN) and moored (weather) buoys [46053 and 46054], NOAA National Centers for Environmental Information [data set], https://www.ncei.noaa.gov/archive/accession/NDBC-CMANWx (last access: November 2023), 1971.
NOAA National Centers for Environmental information, Climate at a Glance: National Time Series, published May 2024 [data set], https://www.ncei.noaa.gov/access/monitoring/climate-at-a-glance/national/time-series, last access: 5 May 2024.
Oksanen, J., Simpson, G., Blanchet, F., Kindt, R., Legendre, P., Minchin, P., O'Hara, R., Solymos, P., Stevens, M., Szoecs, E., Wagner, H., Barbour, M., Bedward, M., Bolker, B., Borcard, D., Carvalho, G., Chirico, M., De Caceres, M., Durand, S., Evangelista, H., FitzJohn, R., Friendly, M., Furneaux, B., Hannigan, G., Hill, M., Lahti, L., McGlinn, D., Ouellette, M., Ribeiro Cunha, E., Smith, T., Stier, A., Ter Braak, C., and Weedon, J. (2024). vegan: Community Ecology Package. R package version 2.6-6.1 [code], https://github.com/vegandevs/vegan,last access: September 2024.
Orr, J. C., Fabry, V. J., Aumont, O., Bopp, L., Doney, S. C., Feely, R. A., Gnanadesikan, A., Gruber, N., Ishida, A., Joos, F., Key, R. M., Lindsay, K., Maier-Reimer, E., Matear, R., Monfray, P., Mouchet, A., Najjar, R. G., Plattner, G. K., Rodgers, K. B., Sabine, C. L., Sarmiento, J. L., Schlitzer, R., Slater, R. D., Totterdell, I. J., Weirig, M. F., Yamanaka, Y., and Yool, A.: Anthropogenic ocean acidification over the twenty-first century and its impact on calcifying organisms, Nature, 437, 681–686, https://doi.org/10.1038/nature04095, 2005.
Ortiz, J. D., Mix, A. C., and Collier, R. W.: Environmental control of living symbiotic and asymbiotic foraminifera of the California Current, Paleoceanography, 10, 987–1009, https://doi.org/10.1029/95PA02088, 1995.
Osborne, E. B., Thunell, R. C., Marshall, B. J., Holm, J. A., Tappa, E. J., Benitez-Nelson, C., Cai, W. J., and Chen, B.: Calcification of the planktonic foraminifera Globigerina bulloides and carbonate ion concentration: Results from the Santa Barbara Basin, Paleoceanography, 31, 1083–1102, https://doi.org/10.1002/2016PA002933, 2016.
Osborne, E. B., Thunell, R. C., Gruber, N., Feely, R. A., and Benitez-Nelson, C. R.: Decadal variability in twentieth-century ocean acidification in the California Current Ecosystem, Nat. Geosci., 13, 43–49, https://doi.org/10.1038/s41561-019-0499-z, 2020.
Pak, D. K., Lea, D. W., and Kennett, J. P.: Seasonal and interannual variation in Santa Barbara Basin water temperatures observed in sediment trap foraminiferal MgCa, Geochem. Geophy. Geosy., 5, https://doi.org/10.1029/2004GC000760, 2004.
Pallacks, S., Ziveri, P., Schiebel, R., Vonhof, H., Rae, J. W. B., Littley, E., Garcia-Orellana, J., Langer, G., Grelaud, M., and Martrat, B.: Anthropogenic acidification of surface waters drives decreased biogenic calcification in the Mediterranean Sea, Commun. Earth Environ., 4,301, https://doi.org/10.1038/s43247-023-00947-7, 2023.
Parker, F. L.: Eastern Mediterranean foraminifera, Reports of the Swedish Deep Sea Expedition 1947–1948, 8, 217–283, 1958.
Parker, F. L.: Planktonic foraminifera species in Pacific sediments, Micropaleontology, 8, 219–254, 1962.
Posit team, RStudio: Integrated Development Environment for R, Posit Software, PBC [code], Boston, Ma, http://www.posit.co/,October 2024, 2024.
Sautter, L. R. and Sancetta, C.: Seasonal associations of phytoplankton and planktic foraminifera in an upwelling region and their contribution to the seafloor, Marine Micropaleontology, 18, 263–278, https://doi.org/10.1016/0377-8398(92)90043-J, 1992.
Schiebel, R.: Planktic foraminiferal sedimentation and the marine calcite budget, Global Biogeochem. Cy., 16, 3-1–3-21, https://doi.org/10.1029/2001gb001459, 2002.
SCB Marine Biodiversity Observation Network, Catlett, D., Siegel, D., Guillocheau, N., and Kui, L.: Plumes and Blooms: phytoplankton pigment concentration ver 3, Environmental Data Initiative [data set], https://doi.org/10.6073/pasta/c6bbdf72bee131d00ad1bd24f5f74c87, 2023.
Schiebel, R. and Hemleben, C.: Planktic Foraminifers in the Modern Ocean,Springer, Berlin, Germany, https://doi.org/10.1007/978-3-662-50297-6, 2017.
Schiebel, R., Barker, S., Lendt, R., Thomas, H., and Bollmann, J.: Planktic foraminiferal dissolution in the twilight zone, Deep-Sea Res. Pt. II, 54, 676–686, https://doi.org/10.1016/J.DSR2.2007.01.009, 2007.
Schlitzer, R.: Ocean Data View, https://odv.awi.de,last access: August 2024,2018.
Seabra, R., Varela, R., Santos, A. M., Gómez-Gesteira, M., Meneghesso, C., Wethey, D. S., and Lima, F. P.: Reduced nearshore warming associated with eastern boundary upwelling systems, Front. Mar. Sci., 6,104, https://doi.org/10.3389/fmars.2019.00104, 2019.
Simons, R. D. and Catlett, D.: Regulation of a surface chlorophyll hotspot by wind-driven upwelling and eddy circulation in the Santa Barbara Channel, Southern California, Prog. Oceanogr., 217,103096, https://doi.org/10.1016/j.pocean.2023.103096, 2023.
Southern California Bight MBON, Catlett, D., Siegel, D., and Guillocheau, N.: Plumes and Blooms: Curated oceanographic and phytoplankton pigment observations ver 3, Environmental Data Initiative [data set], https://doi.org/10.6073/pasta/29d4ef7976c19d6958e618d1548dcd72, 2022.
Souto, D. D., de Oliveira Lessa, D. V., Albuquerque, A. L. S., Sifeddine, A., Turcq, B. J., and Barbosa, C. F.: Marine sediments from southeastern Brazilian continental shelf: A 1200 year record of upwelling productivity, Palaeogeogr. Palaeoclimatol. Palaeoecol., 299, 49–55, https://doi.org/10.1016/j.palaeo.2010.10.032, 2011.
Stoecker, D. K., Hansen, P. J., Caron, D. A., and Mitra, A.: Mixotrophy in the Marine Plankton, Ann. Rev. Mar. Sci., 9, 311–335, https://doi.org/10.1146/annurev-marine-010816-060617, 2017.
Takagi, H., Kimoto, K., Fujiki, T., Saito, H., Schmidt, C., Kucera, M., and Moriya, K.: Characterizing photosymbiosis in modern planktonic foraminifera, Biogeosciences, 16, 3377–3396, https://doi.org/10.5194/bg-16-3377-2019, 2019.
Takahashi, K. and Be, A. W. H.: Planktonic foraminifera: factors controlling sinking speeds, Deep-Sea Res., 31, 1477–1500, https://doi.org/10.1016/0198-0149(84)90083-9, 1984.
Tanhua, T., Bates, N. R., and Körtzinger, A.: The marine carbon cycle and ocean carbon inventories, in: International Geophysics, Vol. 103, edited by: Siedler, G., Griffies, S. M., Gould, J., and Church, J. A., Academic Press, 787–815, https://doi.org/10.1016/B978-0-12-391851-2.00030-1, 2013.
Thomas, E. and Shackleton, N. J.: The Paleocene–Eocene benthic foraminiferal extinction and stable isotope anomalies, Geol. Soc. Spec. Publ., 101, 401–441, https://doi.org/10.1144/GSL.SP.1996.101.01.20, 1996.
Thunell, R. C.: Particle fluxes in a coastal upwelling zone: sediment trap results from Santa Barbara Basin, California, Deep-Sea Res. Pt. II, 45, 1863–1884, 1998.
Thunell, R. C., Tappa, E., and Anderson, D. M.: Sediment fluxes and varve formation in Santa Barbara Basin, offshore California, Geology, 23, 1083–1086, https://doi.org/10.1130/0091-7613(1995)023<1083:SFAVFI>2.3.CO;2, 1995.
Trenberth, K. and National Center for Atmospheric Research Staff (Eds.): “The Climate Data Guide: Southern Oscillation Indices: Signal, Noise and Tahiti/Darwin SLP (SOI)” [data set], https://climatedataguide.ucar.edu/climate-data/southern-oscillation-indices-signal-noise-and-tahitidarwin-slp-soi, last access: 24 May 2024.
Ward, B. A.: Mixotroph ecology: More than the sum of its parts,Proceedings of the Nayional Acadmey of Aciences 116,5846–5848, https://doi.org/10.1073/pnas.1902106116, 2019.
White, S. M., Hill, T. M., Kennett, J. P., Behl, R. J., and Nicholson, C.: Millennial-scale variability to 735 ka: High-resolution climate records from Santa Barbara Basin, CA, Paleoceanography, 28, 213–226, https://doi.org/10.1002/palo.20022, 2013.
Wickham, H.: ggplot2: Elegant Graphics for Data Analysis, Springer-Verlag, New York,ISBN 978-3-319-24277-4, 2016.
Williamson, W. C.: On the recent Foraminifera of Great Britain, The Ray Society, London, 1–107, https://doi.org/10.5962/bhl.title.139719, 1858.
Wolfe, W. H., Martz, T. R., Dickson, A. G., Goericke, R., and Ohman, M. D.: A 37 year record of ocean acidification in the Southern California current. Communications Earth and Environment, 4, 406, https://doi.org/10.1038/s43247-023-01065-0, 2023.
Yamano, H., Sugihara, K., and Nomura, K.: Rapid poleward range expansion of tropical reef corals in response to rising sea surface temperatures, Geophys. Res. Lett., 38,L04601, https://doi.org/10.1029/2010GL046474, 2011.
Zachos, J. C., Wara, M. W., Bohaty, S., Delaney, M. L., Petrizzo, M. R., Brill, A., Bralower, T. J., and Premoli-Silva, I.: A Transient Rise in Tropical Sea Surface Temperature During the Paleocene–Eocene Thermal Maximum, Science, 302,1551–1554,https://doi.org/10.1029/2002GL015886, 2003.
Zondervan, I., Zeebe, R. E., Rost, B., and Riebesell, U.: Decreasing marine biogenic calcification: A negative feedback on rising atmospheric pCO2, Global Biogeochem. Cy., 15, 507–516, https://doi.org/10.1029/2000GB001321, 2001.