the Creative Commons Attribution 4.0 License.
the Creative Commons Attribution 4.0 License.
 | 25 Aug 2025
Sedimentary organic carbon dynamics in a glaciated Arctic fjord: tracing contributions of terrestrial and marine sources in the context of Atlantification over recent centuries
Dahae Kim
Youngkyu Ahn
Matthias Forwick
Seung-Il Nam
In this study, we investigated sedimentary organic carbon (OC) dynamics in Kongsfjorden, Svalbard, using three multicores collected during the HH22 and HH23 cruises aboard the RV Helmer Hanssen in 2022 and 2023. We assessed the relative contributions of petrogenic, soil-derived, plant-derived, and marine OC by applying a four-source apportionment approach based on Δ14Corg, δ13Corg, and lignin parameters, including the (Ad Al)v ratio and lignin phenol concentrations, with Monte Carlo (MC) analysis. Age–depth models based on 210Pb and 226Ra data were used to evaluate temporal variations in the accumulation rates (ARs) of sedimentary OC. Our results revealed a marked increase in marine OC ARs over the past decades, closely linked to enhanced Atlantic Water (AW) inflow. The increasing AW influence in Arctic fjords observed in our record points to the potential for continued Atlantification under Arctic warming, as retreating sea ice and glaciers lower barriers to AW intrusion, enabling deeper and more persistent inflow. By putting this recent AW trend into historical context, our study provides valuable insights into the biogeochemical consequences of ongoing and future climate change in Arctic fjord systems.
- Article
(2736 KB) - Full-text XML
-
Supplement
(1871 KB) - BibTeX
- EndNote


The Arctic region is currently experiencing rapid climate change, with surface air temperatures rising nearly 4 times faster than the global average since 1979 (Rantanen et al., 2022). This accelerated warming has profound implications for Arctic ecosystems and carbon dynamics (Dahlke et al., 2020; Friedlingstein et al., 2020). Arctic fjords, in particular, are recognized for their high sediment accumulation rates, receiving substantial terrestrial input from glacial meltwater and erosion (Winkelmann and Knies, 2005). As a result, they function as critical hotspots for global organic carbon (OC) burial and serve as high-resolution archives of environmental change (Smith et al., 2015; Bianchi et al., 2020). Given the extreme rates of warming, Arctic fjords are increasingly vulnerable to climate-driven transformations that reflect broader shifts occurring across the Arctic system. While modern observational records provide valuable but temporally constrained insights, sediment cores and other paleoenvironmental archives are essential for reconstructing long-term trends in OC dynamics over the past centuries (Ingrosso et al., 2025).
The high Arctic Svalbard archipelago, a key transitional zone between the North Atlantic and Arctic oceans, is characterized by widespread glaciation, with approximately 57 % of its landmass covered by glaciers (Nuth et al., 2013). A major driver of recent environmental change in this region is the enhanced inflow of warm, saline Atlantic Water (AW) via the West Spitsbergen Current (WSC), which strongly influences the western coast of Spitsbergen, the largest island in the archipelago (De Rovere et al., 2022). This process, termed Atlantification, has intensified over recent decades, accelerating the decline of summer sea ice extent, enhancing tidewater glacier melt, and increasing freshwater discharge into fjords (e.g., Jernas et al., 2018; Krajewska et al., 2020; Skogseth et al., 2020). Kongsfjorden, located on the western coast of Spitsbergen, has emerged as a key site for investigating the impacts of recent Arctic warming due to its dynamic oceanographic regime and sensitivity to AW inflow (e.g., Tesi et al., 2021). Although previous studies have characterized the spatial variability of sedimentary OC in Kongsfjorden using bulk elemental and isotopic parameters (e.g., Winkelmann and Knies, 2005; Kuliński et al., 2014; Kumar et al., 2016), molecular-level assessments of sedimentary OC sources, especially over the past centuries, remain limited.
A recent study by Kim et al. (2023) began addressing this gap by analyzing the sources and composition of surface sedimentary OC across eight Svalbard fjords, including Kongsfjorden. Their findings provided valuable insights into the spatial patterns of contemporary OC dynamics. However, the study did not address the progressive shifts in OC dynamics linked to Atlantification since the mid-1990s, an era marked by intensified AW intrusion and ecosystem change. These longer-term oceanographic transformations have been well-documented (e.g., Årthun et al., 2012; Polyakov et al., 2017; Lind et al., 2018; Tesi et al., 2021) but are not yet fully integrated into our understanding of sedimentary OC in Svalbard fjords. The lack of long-term observational and historical data on AW inflow in this region highlights the urgent need for sedimentary records to establish baselines and quantify rates of environmental change (e.g., Cottier et al., 2007; Tesi et al., 2021; Jordà-Molina et al., 2023). Such records are invaluable for distinguishing between natural variability and human-induced changes, providing insights into the mechanisms driving environmental changes in Arctic fjords.
Building on the findings of Kim et al. (2023), this study aimed to generate longer-term reconstructed records to fill the current gap in long-term observational and historical data on AW inflow in this region, through the analysis of three multicores collected along a transect from the inner to the outer Kongsfjorden. The primary objectives were to (1) characterize spatial patterns of sedimentary OC, (2) estimate temporal variations in the relative contributions of sedimentary OC sources over the past centuries, and (3) assess the impact of human-induced climate variability on environmental conditions. To achieve these aims, we applied a multi-proxy approach that integrates bulk geochemical parameters (carbon and nitrogen contents, stable carbon and radiocarbon isotopes), molecular biomarkers (lignin phenols), and sedimentological measurements (bulk dry density, grain size, and surface area). This integrative framework provides critical insights into the coupling between terrestrial and marine systems and highlights the sensitivity of Arctic fjord environments to both past and ongoing climate change.
Kongsfjorden and Krossfjorden form the Kongsfjorden–Krossfjorden fjord system, which opens westward into the Kongsfjordrenna, a submarine glacial trough that incises the continental shelf off northwestern Spitsbergen (Fig. 1; Svendsen et al., 2002). This high-latitude fjord complex spans 78°50′ to 79°30′ N and 11° to 13° E. Kongsfjorden, the southern branch (∼ 20 km long, 4–10 km wide, up to 394 m deep), holds ∼ 29.4 km3 of water, while Krossfjorden, the northern branch (∼ 30 km long, 3–6 km wide, max depth 374 m), contains ∼ 25 km3 (Ito and Kudoh, 1997; Svendsen et al., 2002). Kongsfjorden's drainage basin (∼ 1440 km2) is ∼ 80 % glaciated (Pramanik et al., 2020), receiving substantial freshwater and sediment from five tidewater glaciers (Kongsvegen, Kronebreen, Kongsbreen, Conwaybreen, and Blomstrandbreen) and the Bayelva River (Zhu et al., 2016; McGovern et al., 2022).
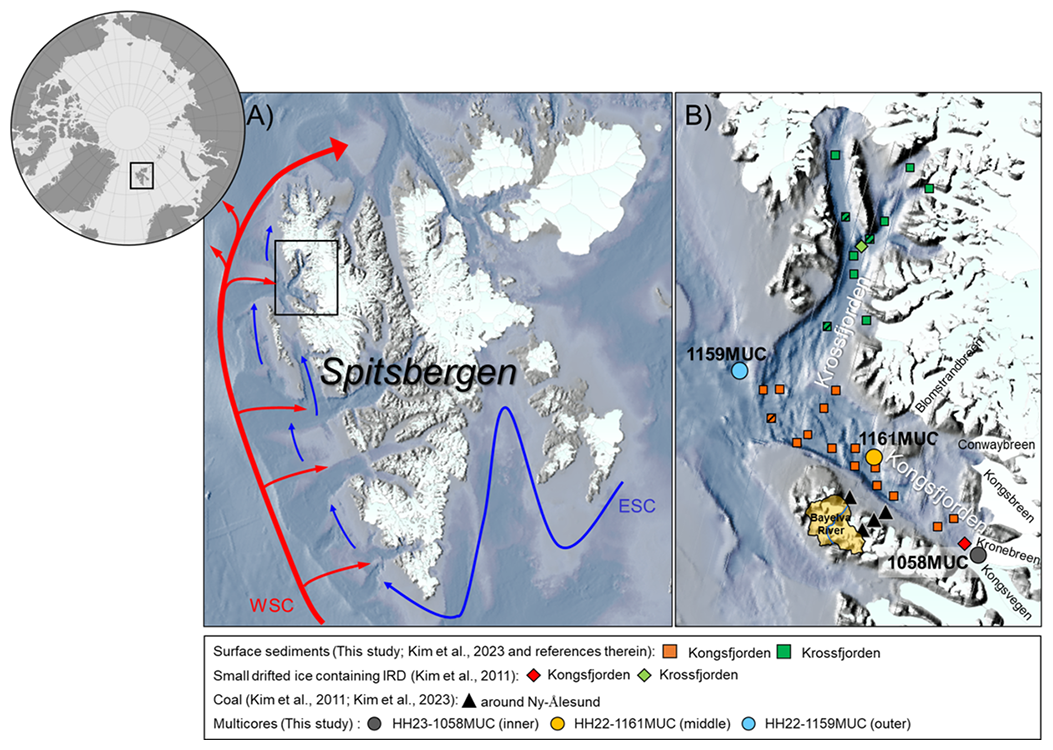
Figure 1Map of the study area showing (a) the Svalbard archipelago and (b) the sampling sites in Kongsfjorden and Krossfjorden considered in this study. White land areas indicate present-day glacier coverage. Red and blue arrows indicate the main Atlantic (West Spitsbergen Current, WSC) and Arctic (East Spitsbergen Current, ESC) water currents, respectively. Filled circles represent multicore sampling sites, while filled square, diamond, and triangle symbols indicate surface sediment, small drifted ice containing IRD, and coal sampling sites in Kongsfjorden and Krossfjorden. It should be noted that the surface sediment samples newly analyzed in this study are denoted by hashed square symbols. The map was generated using QGIS v3.14 (https://qgis.org/en/site/forusers/visualchangelog314/, last access: 28 Januar 2025) based on IBCAOv4 (https://www.ngdc.noaa.gov/mgg/bathymetry/arctic/, last access: 5 December 2024).
The absence of a sill at the mouth of Kongsfjorden allows intrusions of warm (∼ 6 °C), saline, nutrient-rich AW (Svendsen et al., 2002; Cantoni et al., 2020). These intrusions, driven by variability in the WSC and wind-induced shelf processes, typically enter at intermediate depths (∼ 100–200 m), increasing subsurface temperatures and salinities and altering hydrographic structure (Svendsen et al., 2002; Tverberg et al., 2019; De Rovere et al., 2022). This weakens stratification, enhances vertical mixing, and impacts sea ice dynamics, glacier melting, and biogeochemical cycles. When occurring during the productive season, AW intrusions can also stimulate primary productivity by delivering nutrients to the euphotic zone. During periods of weak AW advection, colder, fresher Arctic Water from the East Spitsbergen Current (ESC) dominates, strengthening stratification and promoting a more Arctic-like regime.
In addition to oceanic forcing, glacial meltwater strongly influences fjord hydrography and ecology. Meltwater from tidewater glaciers transports large sediment loads, generating turbid plumes that reduce light penetration and suppress primary productivity, particularly near glacier fronts (Ito and Kudoh, 1997; Svendsen et al., 2002). These inputs also deliver terrestrial organic carbon (OC), including petrogenic OC from eroded bedrock and aged OC from soils. Surface runoff from glacial forefields and surrounding catchments further contributes to sediment and OC input. These effects are sustained by the fjord's long water residence time and limited exchange with the open ocean, which support internal circulation and persistent stratification (Svendsen et al., 2002; Cottier et al., 2007; Tverberg et al., 2019).
3.1 Sample collection
Four surface sediment samples were collected from Kongsfjorden and Krossfjorden during the RV Helmer Hanssen cruise (HH23) in 2023 (Fig. 1). Three multicores were recovered from Kongsfjorden, Svalbard, at water depths of 81 m (core HH23-1058MUC, hereafter 1058MUC; 45 cm long), 339 m (core HH22-1161MUC, hereafter 1161MUC; 44 cm long), and 323 m (core HH22-1159MUC, hereafter 1159MUC; 40 cm long) during the RV Helmer Hanssen cruises (HH22 and HH23) in 2022 and 2023 (Fig. 1). The cores were retrieved using a multi-corer (KC Denmark model 72.000, with 6 core liners; 11 cm outer diameter; 10.5 cm inner diameter, and 0.8 m length each). The multicores were sectioned on board at 0.5 cm intervals down to 2 cm depth and at 1 cm intervals thereafter and stored at −20 °C. Subsequently, the samples were freeze-dried for further analysis.
3.2 Sedimentological analysis
To characterize sedimentary properties associated with OC transport and deposition, we analyzed water content, dry bulk density, grain size distribution, and specific surface area. Water content was calculated by determining the weight loss of wet bulk samples after freeze-drying. The dry bulk density of homogenized subsamples was measured using an AccuPyc II 1345 pycnometer (Micromeritics, Georgia, USA) at the Korea Polar Research Institute (KOPRI). The average of three measurements was used for grain density calculations to ensure precision, with an analytical error of less than 0.0032 cm3 observed when employing the 1 cm3 chamber. Grain size distribution followed the methodology outlined by Ahn et al. (2024). Approximately 130 mg of freeze-dried, unground subsamples was treated with 5 mL of 35 % H2O2 to oxidize organic matter. A Mastersizer 3000 laser particle size analyzer (Malvern Panalytical B.V., UK) was used for grain size analysis of bulk sediments at KOPRI. Analytical precision was determined as follows: D(10) as 37.5 ± 0.3 µm, D(50) as 71.4 ± 0.2 µm, and D(90) as 104.0 ± 0.0 µm. Specific surface area (SA) measurements were conducted following the method described by Kim et al. (2022). Freeze-dried, unground subsamples were first heated at 350 °C to remove organic matter and then cooled gradually over 12 h to room temperature. Prior to analysis, the samples were degassed at 200 °C for 2 h under a constant flow of N2 gas using a Micromeritics FlowPrep 060 Sample Degas System at the Korea Basic Science Institute (KBSI, Jeonju Center). Specific SA was measured with N2 gas as the adsorbate in a He atmosphere, with an analytical precision within ±9 %. Instrument performance was verified using carbon black (21.0 ± 0.75 m2 g−1; ISO 9277:2010, 2010), a certified reference material provided by Micromeritics.
3.3 Radioisotope analysis
To establish sediment chronology and determine sedimentation rates, freeze-dried and ground subsamples (∼ 5 g) were analyzed for 210Pb and 226Ra activities using gamma spectrometry with a well-type high-purity germanium (HPGe) detector at KBSI. The analytical uncertainties averaged 9.6 ± 2.0 mBq g−1 for 210Pb and 2.7 ± 4.1 mBq g−1 for 226Ra. Excess 210Pb (210Pbex) activities were calculated by subtracting the 226Ra activity from the total 210Pb (210Pbtot) activity, following the approach described by Appleby (1998). The apparent sedimentation rate (cm yr−1) was calculated from 210Pbex with the constant rate of supply (CRS) model (cf. Appleby and Oldfield, 1978) with the following equation:
where λ is the radioisotope decay constant for 210Pb (0.03114 per year), and b is the slope of the regression line.
3.4 Bulk elemental and carbon isotope analysis
To determine the content and isotopic composition of OC and to infer its sources, we conducted bulk elemental and carbon isotope analyses, including δ13Corg and Δ14Corg. The bulk elemental and carbon isotopic composition were determined using the procedure based on Kim et al. (2023). In brief, total nitrogen (Ntot) and total organic carbon (TOC) contents, as well as carbon isotopic compositions (δ13Corg), were analyzed using an elemental analyzer (Thermo Electron Corporation Flash EA 2000, Thermo Fisher Scientific, Germany) connected to an isotope ratio mass spectrometer (Finnigan Delta Plus, Thermo Fisher Scientific, Germany). TOC and δ13Corg were measured on decalcified samples using 1 M HCl for 24 h. The δ13Corg values were expressed in delta notation (‰) relative to the Vienna Pee Dee Belemnite (VPDB) standard. The analytical precision was within 0.5 wt % for carbon, 0.5 wt % for nitrogen, and 0.5 ‰ for δ13Corg.
Sediment samples were pretreated with HCl and NaOH to remove carbonates and humic acids, followed by drying at 60 °C. The alkali-insoluble fraction was combusted at 900 °C in sealed ampoules with CuO to produce CO2, which was then purified and converted to graphite following the method of Vogel et al. (1984). Radiocarbon (14C 13C) measurements were performed using accelerator mass spectrometry (AMS) at the Center for Applied Isotope Studies (CAIS), University of Georgia, USA. The radiocarbon results were presented in delta notation (Δ14Corg, ‰), as defined by Stuiver and Polach (1977).
3.5 Lignin phenol analysis
To trace terrestrial OC inputs, particularly those derived from vascular plants, we analyzed lignin phenols using CuO oxidation followed by gas chromatography mass spectrometry. CuO oxidation and subsequent analyses were performed following the procedure described by Kim et al. (2023). In brief, homogenized subsamples (∼ 400 mg) were subjected to alkaline CuO oxidation in the presence of cupric oxide and ammonium iron (II) sulfate hexahydrate. This process was conducted using a Microwave Digestion System (MARS 6 microwave, CEM Corporation, USA) at 150∘C for 1.5 h after adding a N2-purged NaOH solution. After oxidation, a known amount of internal standard (ethyl vanillin) was added to the CuO oxidation products. The resulting products were analyzed at KOPRI using an Agilent 7890B gas chromatograph (GC) coupled to a 5977B Series Mass Selective Detector (MSD) (Agilent Technologies, Santa Clara, CA, USA). Analyses were conducted in single ion monitoring (SIM) mode with a DB1-MS capillary column (30 m × 0.25 mm, 0.25 µm, Agilent J&W). The analytical uncertainty for lignin phenols concentrations, determined through replicate measurements of the same sediment samples, was typically less than 10 %. Calibration was performed using commercially available standards.
3.6 Accumulation rates
The accumulation rates (ARs) of each OC source in the sediment cores were calculated to investigate OC fluxes over recent timescales. Wet bulk density (WBD) and porosity (PO) were determined using the water content and dry bulk density of the samples, as described by Hamilton (1971). The AR was calculated based on the sedimentation rate (SR), WBD, and PO of each sample, as follows (cf. Gealy, 1971):
As the next step, the ARs of bulk OC were calculated using Eq. (2), as follows (cf. Nam, 1997):
The ARs of petrogenic, soil-derived, plant-derived, and marine OC were calculated from bulk OC AR using Eq. (3), as follows:
4.1 Sediment properties
The depth profiles of water content, dry bulk density, grain size distribution, mean grain size, and specific surface area (SA) for the three cores are shown in Fig. 2. Water content displayed distinct trends across the cores. The highest water content was observed at the outermost site (core 1159MUC), ranging from 30.3 % to 47.5 %, with an average of 38.5 ± 3.2 %. At the middle site (core 1161MUC), water content ranged from 31.7 % to 42.2 %, with an average of 35.3 ± 2.2 %. The innermost site (core 1058MUC) exhibited the lowest range, from 19.7 % to 32.6 %, with an average of 27.9 ± 2.3 %.
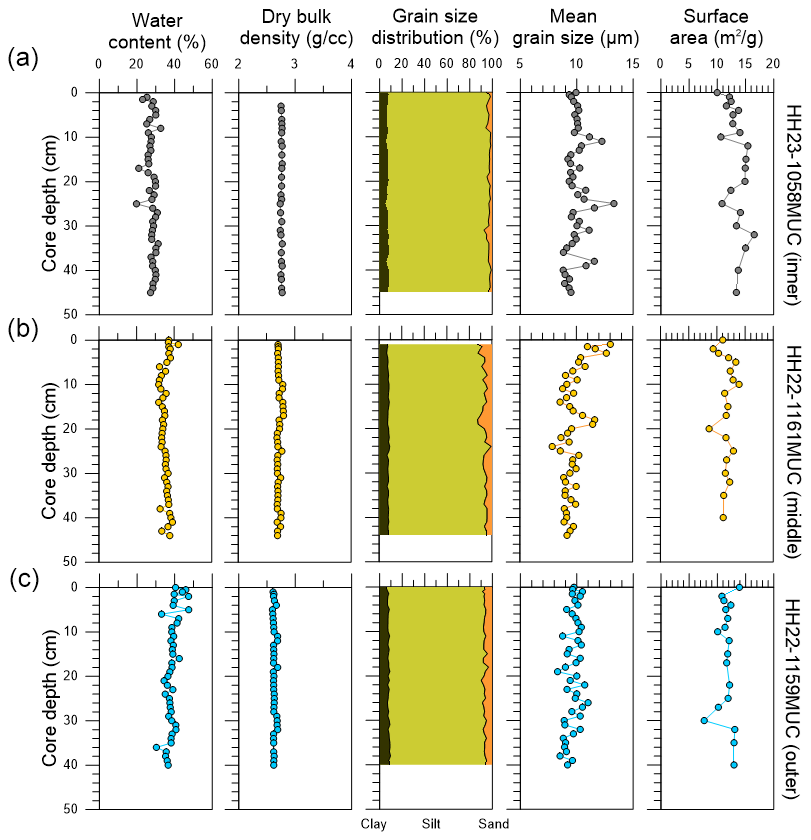
Figure 2Depth profiles of water content (%), dry bulk density (g cm3), grain size distribution (%), mean grain size (µm), and surface area (m2 g−1) for the cores (a) HH23-1058MUC, (b) HH22-1161MUC, and (c) HH22-1159MUC.
Dry bulk density measurements showed a decreasing trend from the innermost to the outermost core. Core 1058MUC had a dry bulk density ranging from 2.74 to 2.77 g cm3; for core 1161MUC, the range was 2.68 to 2.80 g cm3. For core 1159MUC, the range was 2.60 to 2.69 g cm3.
In general, silt content was predominant in all three cores, with the highest average observed at the innermost site (core 1058MUC), where it reached 90 ± 2 %. Mean grain sizes varied across the sites, with the innermost site (core 1058MUC) showing the largest grain sizes, ranging from 8.8 to 13.3 µm. The middle site (core 1161MUC) exhibited a slightly smaller range, from 7.9 to 13.0 µm, while the outermost site (core 1159MUC) ranged from 8.3 to 11.0 µm.
Mineral-specific surface area (SA) values decreased with distance from the inner fjord site. Core 1058MUC showed values between 10.0 and 16.5 m2 g−1, core 1161MUC ranged from 8.6 to 13.9 m2 g−1, and core 1159MUC exhibited the lowest range, from 8.3 to 11.0 m2 g−1.
4.2 210Pb geochronology
The depth profiles of total 210Pb (210Pbtot) and excess 210Pb (210Pbex) activities for the two cores are displayed in Fig. 3. A sediment core collected in 2000 by Zaborska et al. (2006) from inner Kongsfjorden, near the core 1058MUC site, showed a sedimentation rate (SR) of ∼ 0.15 cm yr−1 based on 210Pb dating. However, core 1058MUC was excluded from 210Pb analysis due to the potential for high sedimentation rates and intense sediment mixing near glacier fronts, which can disrupt sediment stratigraphy and reduce the reliability of age–depth models (e.g., Aquino-López et al., 2020; Schirone et al., 2022). Core 1161MUC exhibited 210Pbtot values ranging from 89.3 to 233.0 mBq g−1, while core 1159MUC showed a broader range from 22.1 to 246.6 mBq g−1. For 210Pbex, core 1161MUC had values between 59.6 and 207.2 mBq g−1, while core 1159MUC displayed a range from 9.3 to 216.0 mBq g−1. Based on these profiles, the sedimentation rate (SR) was calculated as 0.36 cm yr−1 at the middle site (core 1161MUC) and 0.12 cm yr−1 at the outermost site (core 1159MUC).
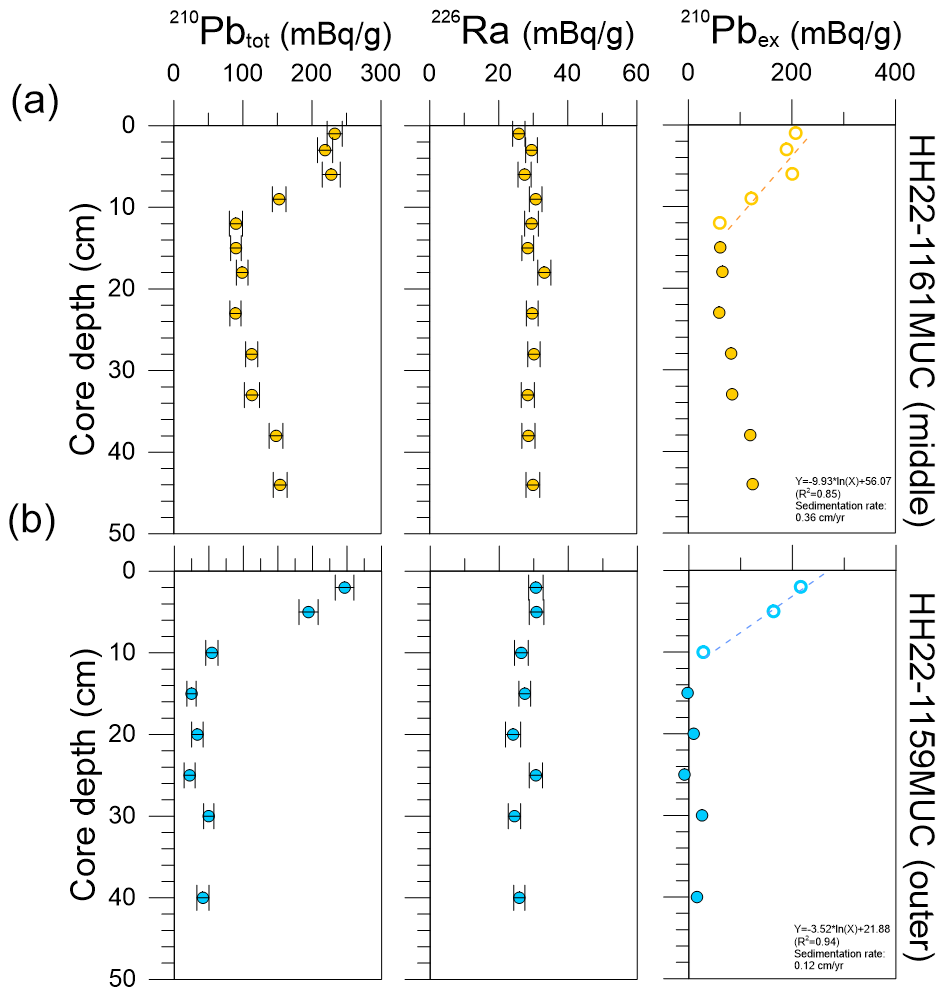
Figure 3Depth profiles of 210Pbtot (mBq g−1), 226Ra (mBq g−1), and 210Pbex (mBq g−1) for the cores (a) HH22-1161MUC and (b) HH22-1159MUC. Open circles indicate the data points used in the linear regressions (yellow and blue dotted lines) of the natural log-transformed 210Pbex versus depth, which were applied to estimate sedimentation rates.
4.3 Bulk elemental and carbon isotopic compositions
The depth profiles of bulk elemental and carbon isotope parameters for the three sediment cores are shown in Fig. 4. The TOC content showed clear trends depending on the core location. Core 1058MUC had values ranging from 0.2 wt % to 0.4 wt % (average 0.3 ± 0.0 wt %), while core 1161MUC ranged from 0.9 wt % to 1.5 wt % (average 1.2 ± 0.1 wt %), and core 1159MUC exhibited the highest values, ranging from 1.9 wt % to 2.5 wt % (average 2.2 ± 0.2 wt %). A similar pattern was observed for total nitrogen (Ntot) content: core 1058MUC ranged from 0.01 to 0.05 wt %, core 1161MUC ranged from 0.08 wt % to 0.13 wt %, and core 1159MUC exhibited values from 0.22 wt % to 0.26 wt %. Previous studies conducted in various Svalbard fjords showed that surface sediments contained a substantial proportion of inorganic nitrogen, up to 70 % of the Ntot content (Supplement Fig. S1a), with a significant correlation between inorganic nitrogen and clay mineral content (Schubert and Calvert, 2001; Winkelmann and Knies, 2005; Knies et al., 2007; Knies and Martinez, 2009; Kumar et al., 2016; Kim et al., 2023). Consistent with the strong linear relationship (R2= 0.89, Fig. S1a) between Ntot and organic nitrogen (Norg) reported in surface sediments from multiple Svalbard fjords (Kim et al., 2023), our subdataset from Kongsfjorden and Krossfjorden showed an even stronger correlation (R2= 0.96, Fig. S1b). This high degree of correlation allowed us to estimate Norg from Ntot using the derived regression equation: Norg= 0.7863 × Ntot − 0.0096. Based on this method, the estimated Norg content ranged from 0.01 to 0.03 wt % (average 0.01 ± 0.00 wt %) for core 1058MUC, from 0.05 wt % to 0.09 wt % (average 0.07 ± 0.01 wt %) for core 1161MUC, and from 0.14 wt % to 0.17 wt % (average 0.15 ± 0.01 wt %) for core 1159MUC. However, it is important to consider that inorganic nitrogen content can vary with sediment type and depth, which may influence the accuracy of the estimated Norg. Therefore, although this regression-based method provided a practical approximation, caution was warranted when interpreting the estimated Norg values, particularly in sediments with heterogeneous stratigraphy or mineral composition.
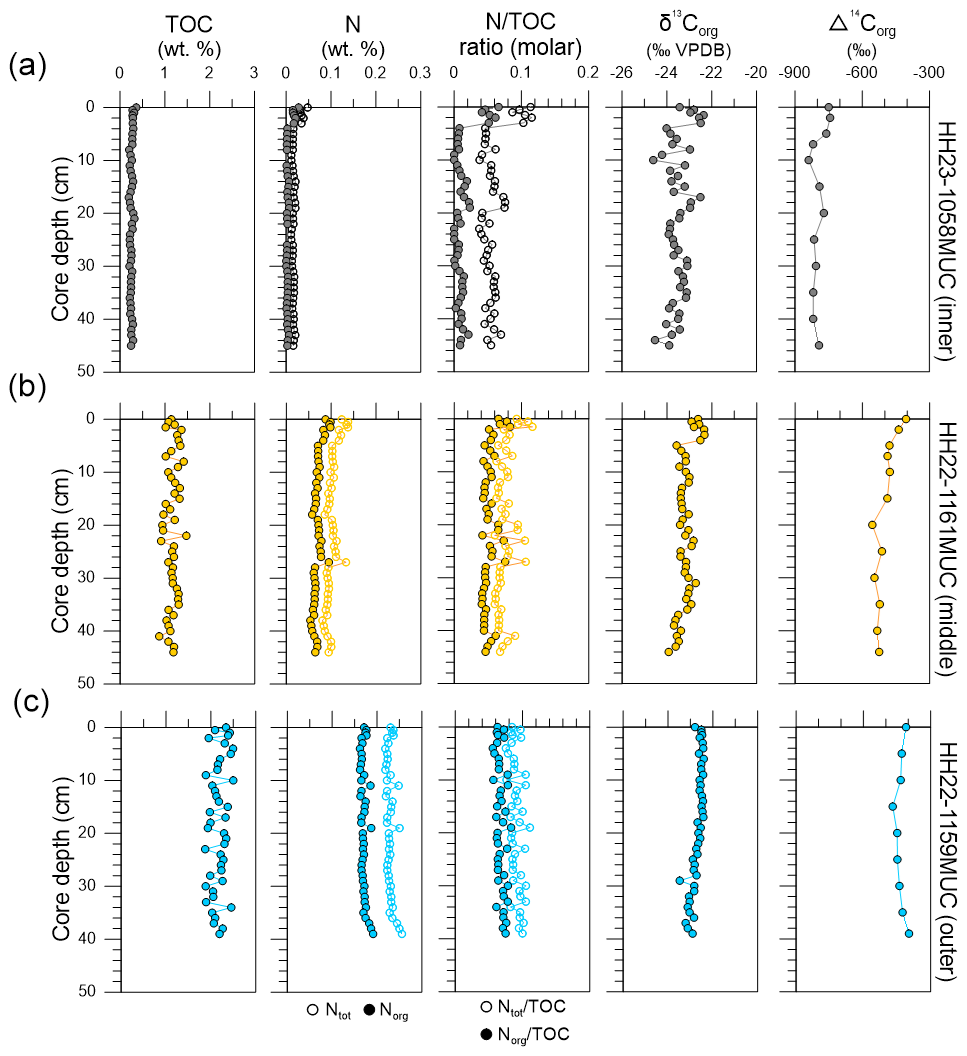
Figure 4Depth profiles of TOC (wt %), N (wt %), N TOC ratios (molar), δ13Corg (‰ VPDB), and Δ14Corg (‰) for the cores (a) HH23-1058MUC, (b) HH22-1161MUC, and (c) HH22-1159MUC.
The molar Ntot TOC ratios were lowest in core 1058MUC, varying from 0.04 to 0.12 (average 0.06 ± 0.02), followed by core1161MUC, ranging from 0.06 to 0.11 (average 0.07 ± 0.01), and core 1159MUC with values between 0.08 and 0.11 (average 0.09 ± 0.01). The Norg TOC ratios showed a similar pattern, being lower than the corresponding Ntot TOC ratios, with core 1058MUC ranging from 0.03 to 0.08, core 1161MUC ranging from 0.04 to 0.07, and core1159MUC ranging from 0.05 to 0.07.
The δ13Corg values exhibited a distinct offshore-increasing trend. Core 1058MUC displayed values ranging from −24.6 ‰ to −22.5 ‰ (average −23.5 ± 0.5 ‰). Core 1161MUC values ranged from −23.9 ‰ to −22.3 ‰ (average −23.2 ± 0.3 ‰), while core 1159MUC showed the most enriched values, ranging from −23.5 ‰ to −22.4 ‰ (average −22.7 ± 0.3 ‰). A similar pattern was observed for Δ14Corg values, which increased from the innermost to the outermost site. Core 1058MUC ranged from −839.2 ‰ to −743.5 ‰ (average –793.9 ± 31.1 ‰). Core 1161MUC exhibited values from −555.9 ‰ to −405.7 ‰ (average –504.9 ± 44.0 ‰), and core 1159MUC showed values between −469.3 ‰ and −396.7 ‰ (average −433.5 ± 21.7 ‰).
4.4 Lignin phenol compositions
The depth profiles of the products of alkaline CuO oxidation for the three sediment cores are presented in Fig. 5. Total lignin phenol concentrations, which represent the sum of eight lignin-derived monomeric phenols (vanillyl (V), syringyl (S), and cinnamyl (C) units), normalized to TOC, showed clear variation with depth and location. Core 1058MUC had the highest total lignin phenol concentrations, ranging from 0.24 to 0.66 mg gOC−1 (average 0.40 ± 0.12 mg gOC−1). Cores 1161MUC and 1159MUC showed similar concentrations, with overlapping ranges and comparable average values. Specifically, core 1161MUC ranged from 0.07 to 0.19 mg gOC−1 (average 0.14 ± 0.04 mg gOC−1), and core 1159MUC ranged from 0.06 to 0.22 mg gOC−1 (average 0.12 ± 0.04 mg gOC−1), indicating no significant difference between the two sites.
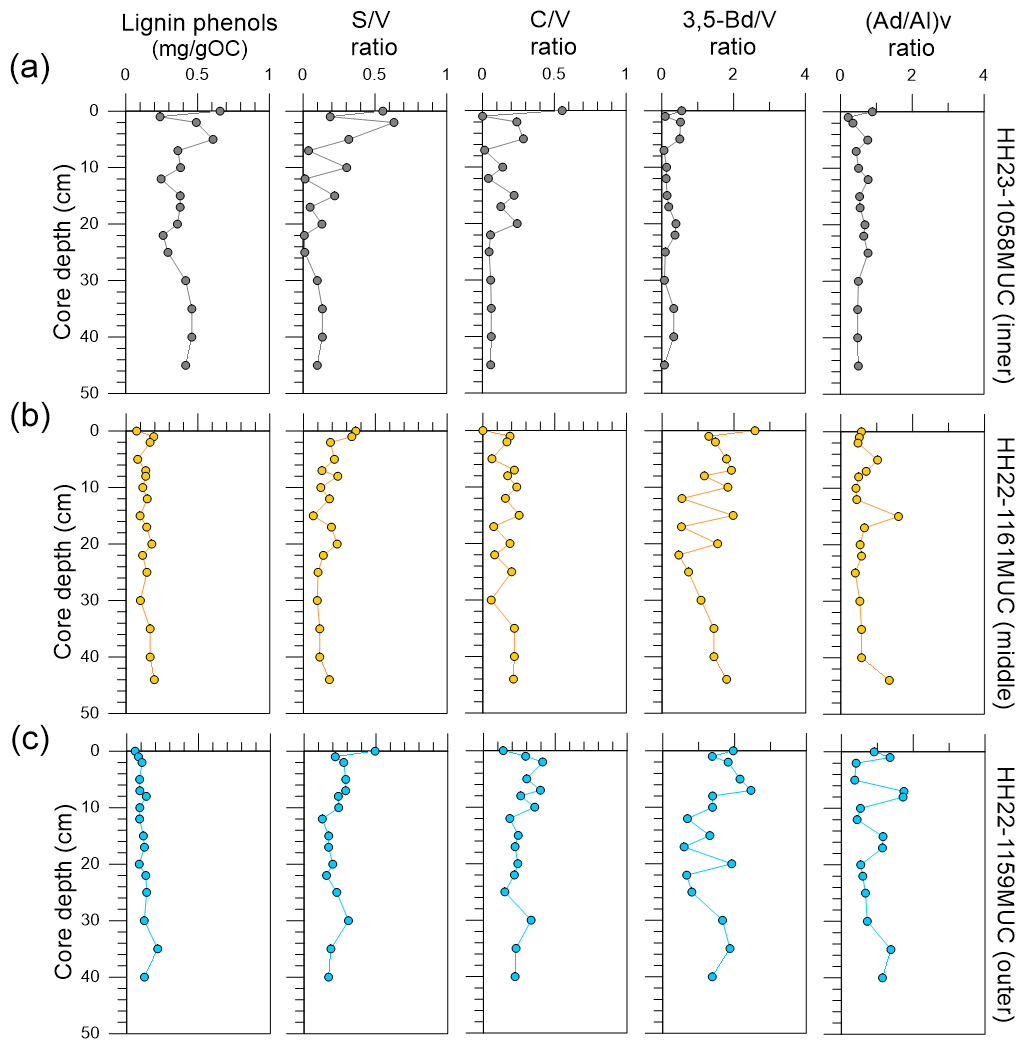
Figure 5Depth profiles of lignin phenol concentrations (mg gOC−1) and S V, C V, 3,5-Bd V, and (Ad Al)v ratios for the cores (a) HH23-1058MUC, (b) HH22-1161MUC, and (c) HH22-1159MUC.
The S V and C V ratios, which reflect the type of organic material derived from vascular plants, followed a consistent pattern, with higher values at the innermost site. For core 1058MUC, the S V ratio ranged from 0.01 to 0.63, and the C V ratio ranged from 0.00 to 0.55. At the middle site (core 1161MUC), the S V ratio ranged from 0.07 to 0.36 and the C V ratio from 0.00 to 0.25, both decreasing relative to the inner site. Core 1159MUC showed S V values between 0.13 and 0.49 and C V values from 0.14 to 0.41, which were higher than those at the middle site but still lower than those at the innermost site.
The 3,5-Bd V ratios, indicative of the extent of lignin degradation, varied significantly among the sites. Core 1058MUC showed values from 0.06 to 0.55, while core 1161MUC exhibited a broader range from 0.47 to 2.59. Core 1159MUC had the highest 3,5-Bd V ratios, ranging from 0.59 to 2.46, indicating more extensive oxidation of lignin-derived compounds at the outer site. Similarly, the (Ad Al)v ratios, which represent the degree of oxidative alteration of lignin side chains, exhibited a comparable trend. Core 1058MUC showed values between 0.22 and 0.89, while core 1161MUC ranged from 0.40 to 1.60. The highest values were observed in core 1159MUC, ranging from 0.37 to 1.74, further supporting the trend of increased lignin degradation in sediments toward the outer fjord.
5.1 Grain size end-member modeling
Grain-size end-member (EM) modeling identifies representative patterns within a sediment's grain-size distribution, allowing for inferences about the influence of depositional processes based on variations in the relative abundances of each EM (van Hateren et al., 2018). Following the approach used by Ahn et al. (2024) in Wijdefjorden, northern Svalbard, grain-size EM modeling was performed to analyze variations in the grain-size distribution of the three cores investigated in this study. Two candidate Q values were identified (Fig. S2), with R2 values exceeding 0.6 for each core (Fig. S3). The optimal Q value was selected by comparing the extracted EMs with the analyzed grain-size distribution curves (Fig. S4). From the three cores, a total of eight EMs were extracted (Fig. S5) and subsequently classified into four primary EM groups (Fig. 6a). EM1 primarily consisted of fine-grained sediment (very fine to medium silt, 2–16 µm), with EM1b having a relatively coarser-dominant mode (primary mode: 9.3–15.5µm, very fine to medium silt: 54.3 %–59.7 %) compared to EM1a (primary mode: 8.2–9.3 µm, very fine to medium silt: 62.2 %–66.8 %). In contrast, EM2 was dominated by coarser grains (medium to very coarse silt, 8–63 µm, 66.4 %), with a coarse primary mode of 29.3 µm. Notably, EM3 exhibited a wide range of grain sizes, including both fine and coarse particles, with modes at 9.3 and 81.2 µm.
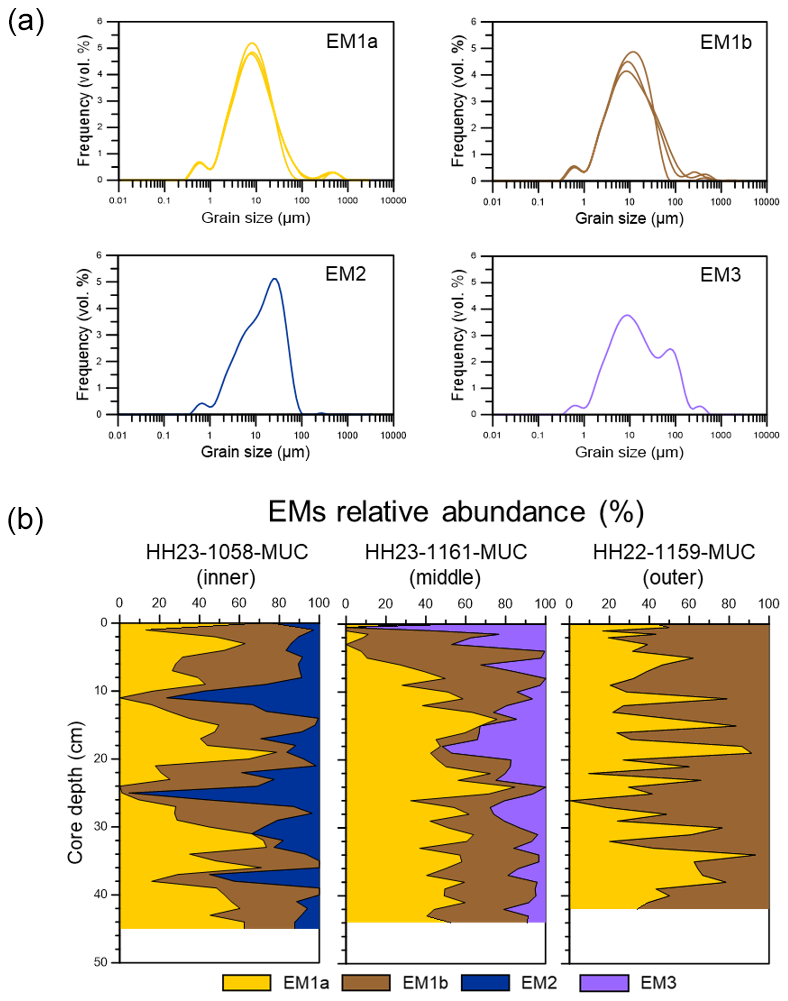
Figure 6(a) Classified grain-size end-member distribution curves from three cores and (b) depth profiles showing the variation in the relative abundances of grain-size end-members (EM1a, EM1b, EM2, and EM3) in the three cores analyzed in this study.
The EM results revealed that EM1a and EM1b, primarily consisting of the finest grains, were present in all three sediment cores (Fig. 6b). These fine-grained sediments are generally deposited through size-dependent settling of suspended particles from meltwater and/or glaciofluvial discharge (Ó Cofaigh and Dowdeswell, 2001; Forwick and Vorren, 2009; Elverhøi et al., 1980). The flocculation in seawater further promotes their settling (Meslard et al., 2018), facilitating the transport of both EM1a and EM1b from the inner to the outer fjord. The distinction between EM1a and EM1b deposition is influenced by the strength of meltwater discharge, with stronger discharge suspending and transporting relatively coarser particles found in EM1b (Ahn et al., 2024). In contrast, coarse-grained sediments, primarily represented by EM2, were observed only at the innermost site (core 1058MUC), situated closest to the glacier front (Fig. 6b). This area is likely influenced by bottom currents driven by subglacial meltwater outflow (Meslard et al., 2018; Torsvik et al., 2019). The scarcity of fine particles in EM2 reflects the winnowing effect of these currents, which preferentially remove finer material and leave behind coarser sediments (Vorren et al., 1984). Such glacially influenced environments are typically characterized by poorly sorted sediments (Hass, 2002) and strong bottom currents (Ahn et al., 2024) that promote coarse-grained deposition near glacier fronts. On the other hand, EM3 contains both fine and coarse particles, with a coarse mode reaching 81.2 µm, significantly larger than the principal mode of EM2. EM3 was found exclusively in the middle core (1161MUC), located at the central site of Kongsfjorden. This distribution corresponds to the presence of multiple sediment sources in the mid-fjord region, where fluvial inputs from land-terminating glaciers, such as the Bayelva River near Ny-Ålesund, deliver mixed sediments and terrestrial OC (D'Angelo et al., 2018; Husum et al., 2019).
5.2 Source of sedimentary organic carbon: bulk parameters
The TOC values of the three sediment cores varied significantly along Kongsfjorden, with the innermost core (1058MUC) having the lowest TOC (average 0.3 ± 0.0 wt %) and the outermost core (1159MUC) the highest (average 2.2 ± 0.2 wt %) (Fig. 4). This variation was also reflected in the TOC / SA ratio (Fig. 7a–b), which indicates OC loading and serves as a measure of OC preservation efficiency (Keil et al., 1994; Mayer, 1994; Stein and MacDonald, 2004; Zonneveld et al., 1997). Values between 0.4 and 1.0 suggest a balance between OC supply and degradation (Keil et al., 1997). However, values below 0.4 are observed in the innermost core. In Kongsfjorden, D'Angelo et al. (2018) reported that lithogenic material accounted for the dominant sediment fraction (64 %–78 %), and Svendsen et al. (2002) highlighted significant deposition of mineral material in the inner fjord. Therefore, the lower OC loading in the innermost core (1058MUC) is likely attributed to the deposition of coarse-grained terrestrial minerals (see Fig. 6b) that dilute the OC content. In contrast, higher OC loading in the middle and outer cores, with values greater than 1.0, suggests enhanced OC preservation efficiency, likely due to adsorption onto fine-grained minerals (see Fig. 6b) that reduce degradation (Keil et al., 1994; Mayer, 1994; Blair and Aller, 2012).
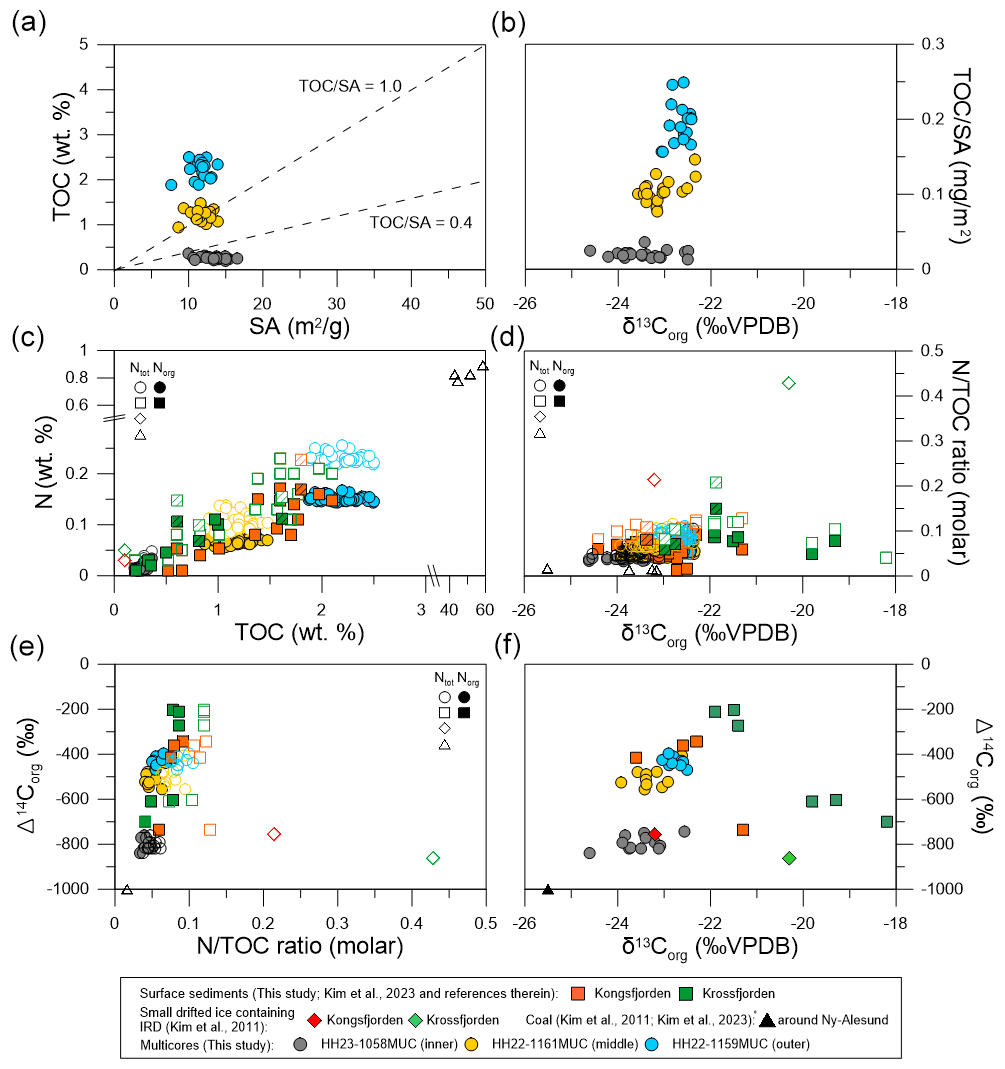
Figure 7Scatter plots of (a) SA (m2 g−1) versus TOC (wt %), (b) δ13Corg (‰ VPDB) versus TOC SA (mg m−2), (c) TOC (wt %) versus Ntot or Norg (wt %), (d) δ13Corg (‰ VPDB) versus Ntot TOC (molar) ratios or Norg TOC (molar) ratios, (e) Ntot TOC (molar) ratios or Norg TOC (molar) ratios versus Δ14Corg (‰), and (f) δ13Corg (‰ VPDB) versus Δ14Corg (‰) for the three cores, compared with data from small drifted ice containing IRD (Kim et al., 2011), coals (Kim et al., 2011; Kim et al., 2023), and surface sediments (Kim et al., 2023, and this study). Note that the surface sediment samples newly analyzed in this study are denoted by hashed square symbols.
Similar to TOC, both Ntot and Norg values were highest in the outermost core (1159MUC) compared to the middle (1161MUC) and innermost (1058MUC) cores (Fig. 7c; see also Fig. 4). TOC and N (both Ntot and Norg) contents in all three cores largely overlapped with those reported for surface sediments from Kongsfjorden and Krossfjorden (Kim et al., 2023, and references therein). In contrast, small drifted ice samples containing ice-rafted debris (IRD) from the fjords had lower TOC (0.1 ± 0.0 wt %) and Ntot (0.04 ± 0.01 wt %) contents, whereas coal samples from Kongsfjorden exhibited significantly higher values (TOC: 50.8 ± 11.1 wt %; Ntot: 0.86 ± 0.04 wt %). The Ntot TOC and Norg TOC ratios were also highest in the outermost core (Fig. 7d; see also Fig. 4). Additionally, the δ13Corg values were more enriched in the outermost core (Fig. 7d; see also Fig. 4), suggesting an increased contribution of marine OC to sedimentary OC toward the outer fjord. Notably, the δ13Corg values from all three cores fell within the range observed in the small drifted ice containing IRD samples (−21.8 ± 2.1 ‰), coal samples (−24.4 ± 1.6 ‰), and surface sediments from Kongsfjorden (−23.0 ± 0.7 ‰). However, the δ13Corg values of most surface sediments and small drifted ice containing IRD samples from Krossfjorden were higher than those from Kongsfjorden, generally falling outside the range observed in all three cores. This difference may be associated with the Quaternary marine deposits exposed in Krossfjorden (Fig. S6; Dallmann and Elvevold, 2015), which could supply older, 13C-enriched marine-derived OC. These observations suggest that the contribution of Krossfjorden to sedimentary OC in all three cores was minimal. The Δ14Corg values of the innermost core (1058MUC) were more depleted than those of the other two cores (Fig. 7e–f). Similarly, small drifted ice containing IRD and surface sediment samples collected near the marine-terminating glacier front in Kongsfjorden exhibited similarly depleted values. Notably, the Δ14Corg values of the other two cores fell between those of the glacier-front samples and those from the outer fjord. These results align with Kim et al. (2023), who suggested that the significant depletion of Δ14Corg in the surface sediments of Svalbard fjords indicates that recently fixed terrestrial and marine OC alone cannot account for the sedimentary OC. Instead, a substantial amount of old OC, likely from petrogenic and soil-derived sources, contributes to the sedimentary OC in Kongsfjorden.
The relationship between TOC and mean grain size showed no clear correlation, with the sediments predominantly consisting of silt fractions (Fig. S7a). Similarly, TOC content did not exhibit a distinct relationship with sediment sorting values (Fig. S7b). The sediments were generally poorly sorted, with high silt content, a characteristic feature of glacial environments, where deposits are typically incompletely sorted due to the non-selective nature of glacial transport (Singh et al., 2019). The consistently poor sorting observed across all morphological zones, along with the absence of correlation between TOC and mean grain size, suggests a glacier-fed depositional system influenced by variable hydrodynamic conditions driven by meltwater discharge. At the middle site, the presence of EM3 indicates a contribution of terrestrial material via fluvial processes. However, the proportion of EM3 was relatively low (18.2 ± 14.9 %) compared to EM1a and EM1b (81.8 ± 14.9 %; Fig. 6), suggesting that glacial meltwater remains the dominant sediment delivery mechanism at this site, with only a minor influence from surface runoff processes. Overall, the sedimentary characteristics of Kongsfjorden indicate a fjord environment significantly influenced by glacial input. The repeated cycles of glacial advance and retreat have resulted in the accumulation of sediments with varied grain sizes and sorting patterns, reflecting the dynamic and complex interplay between terrestrial and marine OC processes within this glaciated fjord system.
5.3 Source of sedimentary organic carbon: lignin phenol parameters
In a previous study conducted in Svalbard fjords, Kim et al. (2023) defined two OC components (petrogenic OC and biogenic OC) to identify the source of 14C-depleted OC in sedimentary OC. To further investigate the contributions of biogenic OC sources to Kongsfjorden, we analyzed lignin phenols obtained through alkaline CuO oxidation. Lignin phenols serve as valuable terrestrial biomarkers because they are exclusively synthesized by terrestrial higher plants (Hedges and Mann, 1979; Goñi et al., 2005). The ratios of S V and C V are used to evaluate the relative contributions of four components: non-woody angiosperms, woody angiosperms, non-woody gymnosperms, and woody gymnosperms (Hedges and Mann, 1979; Goñi and Hedges, 1995). In the three Kongsfjorden cores, lignin phenols primarily consisted of a mixture of non-woody gymnosperm OC with inputs from gymnosperm wood-derived tissues, along with some contributions from non-woody angiosperms, consistent with previous studies (Fig. 8a). The strong gymnosperm signal observed in both surface and downcore sediments, despite the current dominance of angiosperm vegetation in the Svalbard archipelago, suggests a substantial contribution of OC from older terrestrial sources, such as permafrost-stored material. This implies that the terrestrial OC preserved in these sediments likely reflects inputs from past vegetation communities, rather than representing solely contemporary plant cover. Lignin phenol concentrations were highest in the innermost core (1058MUC) compared to the other two cores (Fig. 8b; see also Fig. 5) and fell within the range observed in surface sediments from Svalbard fjords, including Kongsfjorden and Krossfjorden (Figs. S8a and S9a).
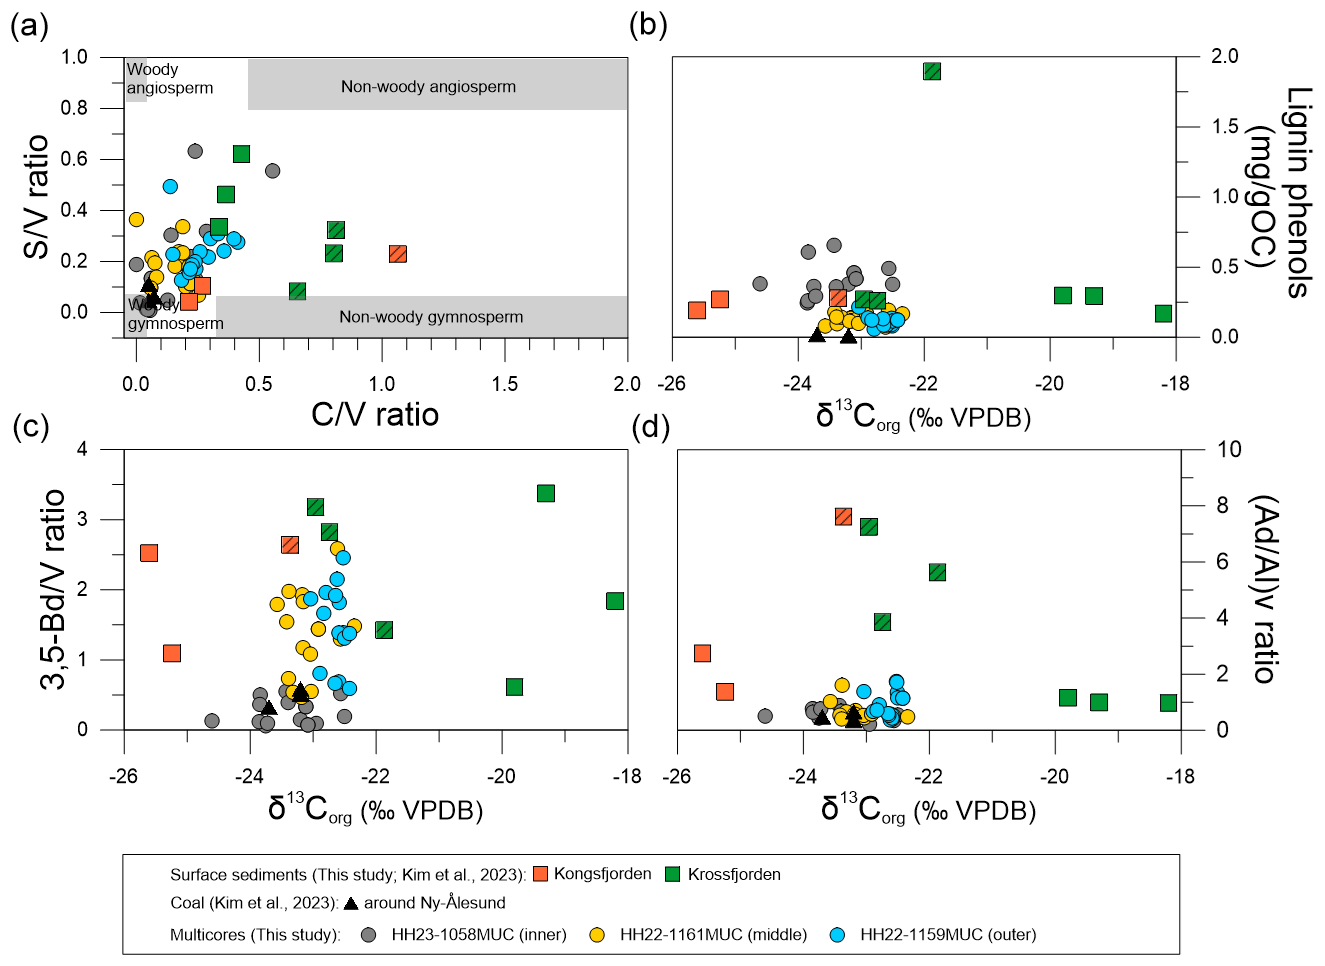
Figure 8Scatter plots of (a) C V ratio versus S V ratio, including the end-members for different vascular plant tissues (cf. Goñi et al., 2000), (b) δ13Corg (‰ VPDB) versus lignin phenols (mg gOC−1), (c) δ13Corg (‰ VPDB) versus 3,5-Bd V ratio, and (d) δ13Corg (‰ VPDB) versus (Ad Al)v ratio for the three cores, compared with data from coals (Kim et al., 2023) and surface sediments (Kim et al., 2023, and this study). Note that the surface sediment samples newly analyzed in this study are indicated by hashed square symbols.
3,5-Bd is primarily produced during soil degradation processes, leading to its enrichment in soils (e.g., Prahl et al., 1994; Goñi et al., 2000; Houel et al., 2006; Otto and Simpson, 2006). As a result, the 3,5-Bd V ratio is widely used to assess the extent of lignin degradation and to trace inputs of soil-derived OC to aquatic systems (e.g., Prahl et al., 1994; Goñi et al., 2000; Houel et al., 2006; Otto and Simpson, 2006). Similarly, the (Ad Al)v ratio reflects lignin oxidation, as the conversion of aldehyde functional groups into acidic phenols through propyl side-chain modification serves as a key indicator of lignin degradation in sedimentary organic matter (e.g., Hedges and Ertel, 1982; Goñi and Hedges, 1992; Otto and Simpson, 2006). (Ad Al)v ratios below 0.3 typically indicate relatively fresh vascular plant detritus, whereas values exceeding 0.5 are generally associated with extensively altered soils with significantly depleted 14C signatures (e.g., Hedges and Ertel, 1982; Goñi and Hedges, 1992; Otto and Simpson, 2006). Among the three cores, both 3,5-Bd V and (Ad Al)v ratios were lowest in the innermost core (1058MUC) (Fig. 8c and d; see also Fig. 5). Notably, coal samples also exhibited relatively low values, averaging 0.48 for the 3,5-Bd V ratio and 0.49 for the (Ad Al)v ratio, similar to those of the innermost core (1058MUC). Both the 3,5-Bd V and (Ad Al)v ratios were higher in the outermost core (1159MUC) compared to the middle (1161MUC) and innermost (1058MUC) cores, indicating a higher degree of lignin degradation toward the outer fjord. This trend likely reflects cumulative degradation processes occurring during offshore transport rather than differences in terrestrial OC sources alone. Notably, the inter-site variation was more pronounced for the 3,5-Bd V ratio than for the (Ad Al)v ratio.
Previously, Kim et al. (2023) suggested that biogenic OC includes not only recently fixed terrestrial and marine biomass but also pre-aged OC from soils, which can be transported to fjords through glacial erosion and surface runoff. Therefore, we examined the lignin phenol concentrations and (Ad Al)v ratios of these biogenic OC sources – plant-derived, soil-derived, and marine OC (Fig. S8). Most core sediments exhibited lower lignin phenol concentrations and (Ad Al)v ratios compared to the average values of soils collected in the Ny-Ålesund and Longyearbyen regions. Thus, the soil values encompass the range observed in all three cores and most surface sediments collected in Svalbard fjords. However, surface sediments from Krossfjorden exhibited distinct (Ad Al)v ratios and δ13Corg values, which fell outside the soil range. This difference may result from the complex bedrock types present in Svalbard fjords (Fig. S6), which can influence OC characteristics (Kim et al., 2023). These findings suggest that the contribution of Krossfjorden to the sedimentary OC in all three cores was limited.
5.4 Four OC source apportionments
In this study, we adopted the OC source classification concept from the surface sediment study in Svalbard fjords (Kim et al., 2023) and defined four distinct sedimentary OC sources: petrogenic, soil-derived, plant-derived, and marine OC. To estimate the relative proportions of these OC sources, we applied a four-source apportionment approach based on Δ14Corg, δ13Corg, and lignin parameters such as the (Ad Al)v ratio and lignin phenol concentrations, using a Monte Carlo (MC) analysis. End-member values for each OC source, as reported in Kim et al. (2023; Table S1 in the Supplement), were used in the analysis.
Firstly, similar to the previous study by Kim et al. (2023), the relative proportions of the four OC sources were calculated using Method 1, based on Δ14Corg, δ13Corg, and the (Ad Al)v ratio (Fig. 9). The petrogenic OC fraction was highest in core 1058MUC, located at the innermost site, with an average of 79.2 ± 3.4 %. This was followed by core 1161MUC (average 44.7 ± 5.7 %) and core 1159MUC (average 37.8 ± 5.0 %). In contrast, marine OC fractions were highest in core 1159MUC at the outermost site (average 44.0 ± 5.2 %), followed by core 1161MUC (average 38.4 ± 7.8 %) and core 1058MUC (average 19.0 ± 3.9 %).
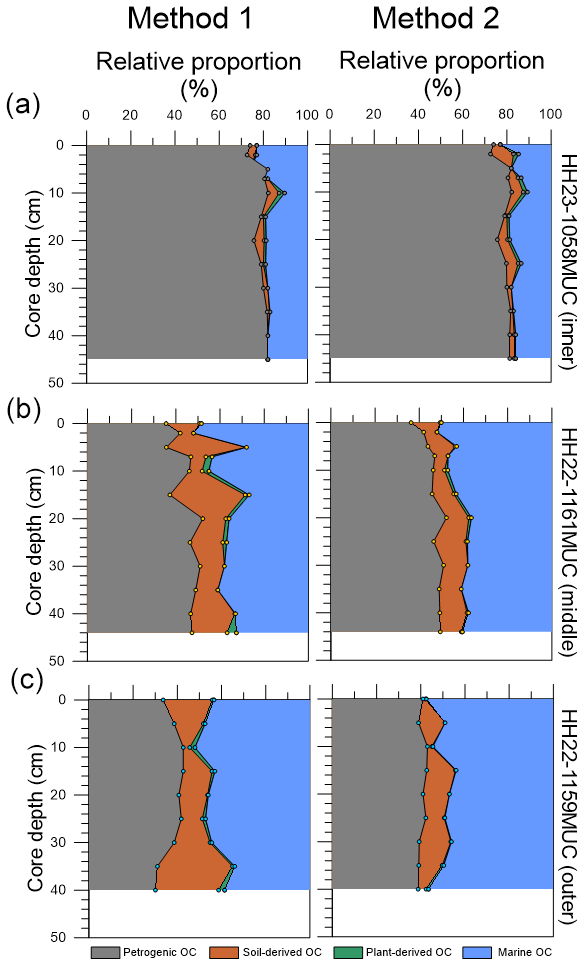
Figure 9Depth profiles showing the relative proportions of petrogenic, soil-derived, plant-derived, and marine OC, as determined using Method 1 (based on δ13Corg (‰ VPDB), Δ14Corg (‰), and (Ad Al)v ratio) and Method 2 (based on δ13Corg (‰ VPDB), Δ14Corg (‰), and lignin phenols (mg gOC−1)), for the cores (a) HH23-1058MUC, (b) HH22-1161MUC, and (c) HH22-1159MUC.
Secondly, we calculated the relative proportions of the four OC sources using Method 2, which is based on Δ14Corg, δ13Corg, and lignin phenol concentrations. This method was chosen because previous studies used lignin phenol concentrations for source mixing models, assuming a value of 0 for marine phytoplankton (Tesi et al., 2016; Pempkowiak, 2020). To validate this approach, we first applied Method 2 to surface sediments previously investigated by Kim et al. (2023). Overall, the estimated relative contributions of the four OC sources were within a similar range to those reported in the earlier study, and the spatial distribution pattern exhibited similar trends between both approaches (Fig. S10). For the three sediment cores in this study, the results from Method 2 were also consistent with those from Method 1. Petrogenic OC fractions were highest in core 1058MUC, located at the innermost site (average 79.2 ± 3.3 %), followed by cores 1161MUC (average 46.6 ± 4.4 %) and 1159MUC (average 40.7 ± 1.7 %) (Fig. 9). In contrast, marine OC fractions were greatest in core 1159MUC at the outermost site (average 50.4 ± 4.7 %), followed by core 1161MUC (average 42.9 ± 5.2 %) and core 1058MUC (average 16.5 ± 3.2 %). These findings suggest that Method 2 did not significantly alter the trends observed from Method 1. However, it is important to note that some surface sediments from Kongsfjorden and Krossfjorden exhibited (Ad Al)v ratios outside the range of soil values (Fig. S9b). In contrast, the lignin phenol concentration data were well within the expected range for soils (Fig. S9a). Given this, Method 2 appears to be a more appropriate approach than Method 1 for assessing the relative proportions of the four OC sources in the Svalbard fjords.
Nonetheless, both methods showed that the plant-derived OC fraction contributed minimally compared to dominant sources such as petrogenic and marine OC. However, soil-derived OC contributions were higher in the middle (1161MUC) and outer (1159MUC) cores than in the innermost core (1058MUC), suggesting an additional input likely associated with surface runoff. This is supported by the presence of EM3 in core 1161MUC (Fig. 6b), indicative of significant input of both fine and coarse particles, a feature not observed in the other two cores. Given that core 1161MUC is situated closer to the Bayelva River (Fig. 1), the occurrence of EM3 at this site likely reflects the localized influence of surface runoff. This runoff facilitates the transport of terrestrial material, especially soil-derived OC, into the fjord via riverine discharge from the adjacent catchment. This mechanism is consistent with previous studies, which have shown that surface runoff significantly influences the biogeochemical composition of particulate and dissolved matter in Kongsfjorden (e.g., Hop et al., 2002; Svendsen et al., 2002). These inputs are known to deliver high loads of suspended sediments, nutrients, and terrigenous OC, especially during the melt season when hydrological connectivity between the land and fjord is enhanced. The proximity of core 1161MUC to the Bayelva River mouth therefore increases its susceptibility to these runoff-derived materials, which can be subsequently advected toward the outer fjord.
5.5 Potential future implications on carbon dynamics
The bulk OC AR was 0.47 ± 0.06 g cm−2 yr−1 at the middle site (core 1161MUC), higher than the outermost site (core 1159MUC), which had a value of 0.26 ± 0.03 g cm−2 yr−1 (data not shown). The ARs of the four OC sources, determined by both Methods 1 and 2, are presented in Fig. 10. For core 1161MUC, petrogenic OC ARs were similar between Method 1 (0.18 ± 0.03 g cm−2 yr−1) and Method 2 (0.18 ± 0.02 g cm−2 yr−1). Among biogenic sources, marine OC had the highest ARs (0.15 ± 0.03 g cm−2 yr−1 for Method 1; 0.17 ± 0.03 g cm−2 yr−1 for Method 2), 2–4 times higher than soil-derived OC and 20–70 times higher than plant-derived OC. Similarly, for core 1159MUC, petrogenic OC ARs were consistent across both methods (0.05 ± 0.01 g cm−2 yr−1), with marine OC showing the highest biogenic ARs (0.05 ± 0.01 g cm−2 yr−1 for Method 1; 0.06 ± 0.01 g cm−2 yr−1 for Method 2), exceeding those of soil-derived and plant-derived OC.
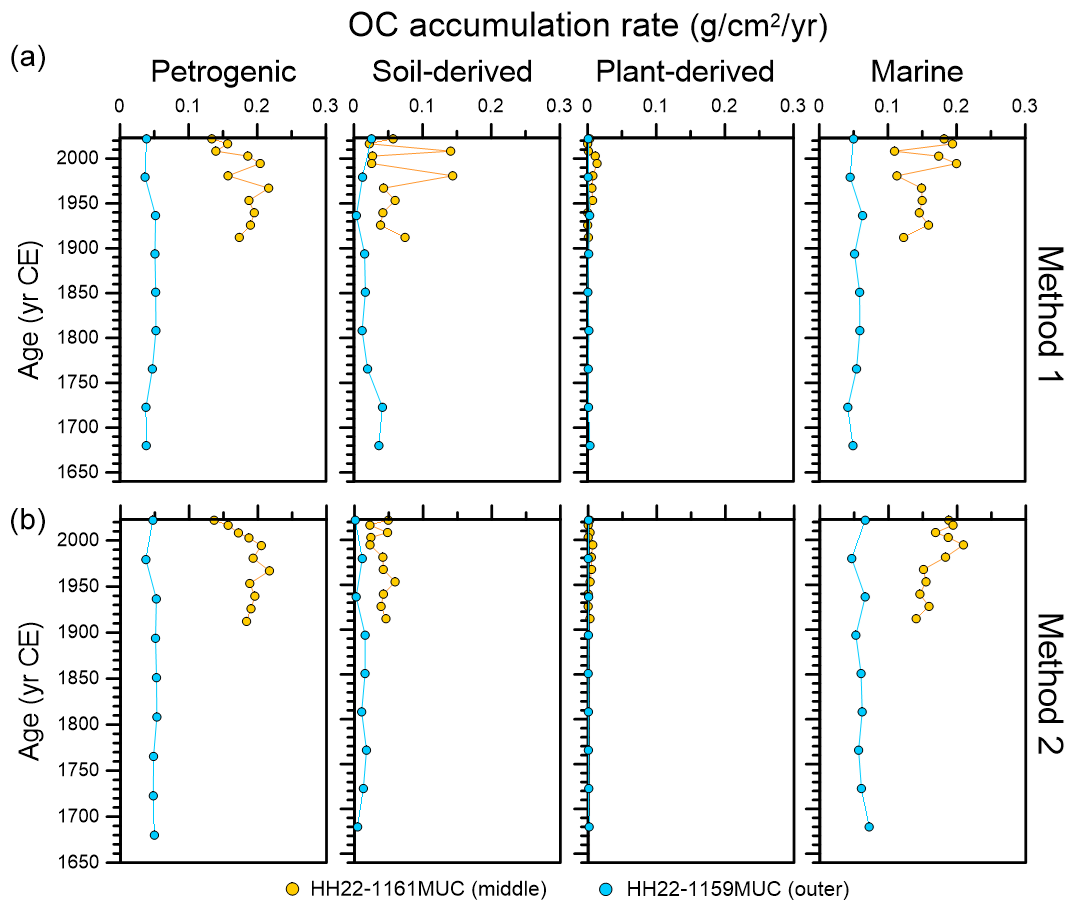
Figure 10Age profiles of the accumulation rates (g cm−2 yr−1) of petrogenic, soil-derived, plant-derived, and marine OC, as determined using Method 1 (based on δ13Corg (‰ VPDB), Δ14Corg (‰), and (Ad Al)v ratio) and Method 2 (based on δ13Corg (‰ VPDB), Δ14Corg (‰), and lignin phenols (mg gOC)), for the cores HH23-1058MUC, HH22-1161MUC, and HH22-1159MUC.
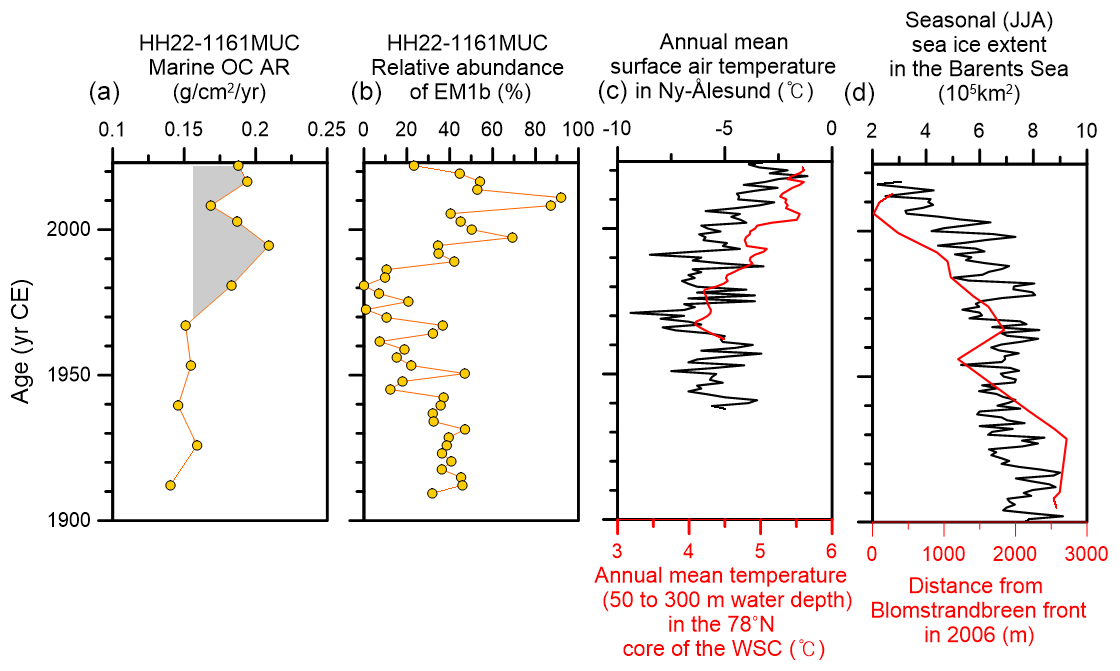
Figure 11Age profiles of (a) the accumulation rates of marine OC based on Method 2 for core HH22-1161MUC, (b) the relative abundance (%) of EM1b for core HH22-1161MUC, (c) annual mean surface air temperatures (°C) in Ny-Ålesund (black; data from MOSJ, environmental monitoring of Svalbard and Jan Mayen) and integrated annual mean temperatures (°C) at 50–300 m water depth in the 78° N core of the West Spitsbergen Current (red; data from MOSJ), and (d) seasonal (JJA) sea ice extent in the Barents Sea (black; data from NSIDC; National Snow and Ice Data Center) and the distance from the Blomstrandbreen front in Kongsfjorden in 2006 (red; data from Burton et al., 2016).
For all petrogenic and biogenic OC sources, ARs were higher at the middle site (core 1161MUC) than at the outermost site (core 1159MUC) (Fig. 10). This spatial difference likely reflects the middle site's closer proximity to glacial and fluvial sediment inputs, including the tidewater glaciers (e.g., Kronebreen and Kongsbreen) and the Bayelva River near Ny-Ålesund. Its location may have facilitated more efficient delivery and deposition of sediments and associated OC, resulting in higher ARs. Notably, marine OC ARs at core 1161MUC have shown an increasing trend since approximately the 1970s, while petrogenic OC ARs decreased over the same period. In contrast, no clear temporal trends were observed in either petrogenic or marine OC ARs at the outermost site (Fig. S11). This increase in marine OC ARs at the middle site (Fig. 11a) coincides with a shift in sediment composition, characterized by increasing relative abundances of EM1b (Fig. 11b), suggesting intensified meltwater discharge from marine-terminating glaciers. This discharge was likely driven by increased AW inflow, which enhanced basal melting of tidewater glaciers. Being situated closer to these glaciers, the middle site appears more sensitive to variability in AW inflow. Since increased AW inflow to fjords reduces sea ice cover and delivers nutrients that enhance marine productivity, this process supports greater marine OC burial. In contrast, the outermost site, under more stable AW influence, exhibited relatively consistent marine OC burial over time. Additionally, its lower SRs, a consequence of its greater distance from the glacier front, may obscure short-term variations in OC deposition. Overall, the differing trends in marine OC ARs between the middle and outermost sites likely reflect differences in hydrographic and sedimentary dynamics, with the middle site more responsive to glacial and oceanographic variability associated with AW inflow.
The rise in marine OC ARs coincides with broader climatic and environmental changes in the Svalbard region. Since the 1970s, surface air temperatures in Ny-Ålesund have increased at a rate 4 times faster than the global average from 1975 to 2014 (Fig. 11c; Wei et al., 2016). Concurrently, the Barents Sea summer sea ice extent has declined rapidly (Fig. 11d; NSIDC: National Snow and Ice Data Center, http://nsidc.org/data/seaice_index, last access: 7 January 2025), and the Blomstrandbreen glacier has experienced significant retreat (Fig. 11d; Burton et al., 2016). These changes suggest a strong link between climate warming and shifts in Kongsfjorden's carbon dynamics. Notably, during the same period, integrated temperatures (50 to 300 m water depth) from the transect across 78° N, in the core of the WSC in western Svalbard, also showed an increasing trend (Fig. 11c; Tesi et al., 2021). This suggests a connection between the observed warming of AW and broader regional climatic and environmental changes. Longer-term environmental reconstructions support this connection, with studies reporting increased AW inflow and associated productivity in Kongsfjorden in the early 20th century (Husum et al., 2019; Tesi et al., 2021). Ingrosso et al. (2025) also documented rapid greening of western Svalbard during the same period, which they attributed to extremely low sea ice extent, driven primarily by the strong advection of warm AW into Arctic fjords. This historical context highlights the likely influence of enhanced AW inflow on the rise in marine OC ARs recorded at the middle site (core 1161MUC) since the 1970s, with increased marine productivity and OC burial contributing to this rise while driving the concurrent decline in petrogenic OC ARs.
In this study, we investigated three multicores collected from Kongsfjorden, Svalbard, to explore the spatial and temporal dynamics of sedimentary OC over recent centuries. Bulk parameter analyses indicate that Kongsfjorden was the primary source of OC in the sediments, with minor contributions from Krossfjorden. Additionally, a substantial amount of old OC, likely derived from petrogenic and soil sources, was present in the sedimentary OC in Kongsfjorden. To estimate the relative proportions of OC sources, we applied a four-source apportionment approach based on Δ14Corg, δ13Corg, and lignin parameters, including the (Ad Al)v ratio and lignin phenol concentrations, using MC analysis. Our results revealed that petrogenic OC fractions were highest at the innermost site, while marine OC fractions dominated at the outermost site. The plant-derived OC fraction contributed minimally compared to petrogenic and marine OC, while soil-derived OC was more substantial at the middle and outermost sites, suggesting enhanced input from surface runoff. For all OC sources, ARs were higher at the middle site than at the outermost site. Notably, marine OC ARs at the middle site have shown an increasing trend since approximately the 1970s, likely reflecting enhanced AW inflow, which boosted marine productivity and OC burial. These findings underscore the significant role of AW inflow in reshaping carbon dynamics in Svalbard fjords over the past few decades, highlighting the sensitivity of Arctic fjords to climate shifts. More importantly, our study suggests that the marked increase in AW inflow to Kongsfjorden during the 20th century likely occurred in two distinct phases: around the early 1900s and the 1970s. This pattern reflects a two-step process driven by complex and not yet fully understood mechanisms. To better constrain the timing, drivers, and consequences of AW variability, we emphasize the need for future research that integrates high-resolution climate modeling with sediment core records from Svalbard. Such an integrated approach will be essential for improving projections of climate and carbon cycle feedbacks in the rapidly warming Arctic. Given their role as critical OC reservoirs, Arctic fjords may function as both sources and sinks of carbon in a warming climate, emphasizing the need for further research to assess the long-term consequences of climate-induced changes on regional carbon cycling.
All the primary data related to this article are available online at the Korea Polar Data Center (https://doi.org/10.22663/KOPRI-KPDC-00002831, Kim and Kim, 2025) or upon request to the corresponding author (Jung-Hyun Kim, jhkim123@kopri.re.kr).
The supplement related to this article is available online at https://doi.org/10.5194/bg-22-4087-2025-supplement.
DK and JHK designed the study, interpreted the majority of the data, and wrote the manuscript. YKA, MF, and SIN contributed to sample acquisition. DK conducted the biomarker analyses, while YKA performed the grain size analyses and the end-member modeling. All authors commented on the manuscript and contributed to its revision.
The contact author has declared that none of the authors has any competing interests.
Publisher's note: Copernicus Publications remains neutral with regard to jurisdictional claims made in the text, published maps, institutional affiliations, or any other geographical representation in this paper. While Copernicus Publications makes every effort to include appropriate place names, the final responsibility lies with the authors.
We sincerely thank the two anonymous reviewers for their insightful and constructive comments, which have significantly improved the quality of the manuscript. We thank the captains and crews of R/V Helmer Hanssen for their support at sea during sediment core retrievals. We also extend our gratitude to Yeong-Ju Son and Young Jin Joe for their analytical assistance in the laboratory at KOPRI.
This study was supported by grants from the National Research Foundation of Korea (NRF), funded by the Ministry of Science and ICT (grant nos. NRF-2021M1A5A1075512, RS-2025-24683148 and KOPRI-PN25010).
This paper was edited by Sebastian Naeher and reviewed by two anonymous referees.
Ahn, Y., Joe, Y. J., Jang, K., Kim, J.-H., Son, Y. J., Forwick, M., Hong, S., and Nam, S.-I.: Post-glaciation depositional changes in Wijdefjorden, northern Svalbard, using grain-size end-member modelling, Mar. Geol., 472, 107306, https://doi.org/10.1016/j.margeo.2024.107306, 2024.
Appleby, P. G.: Dating recent sediments by 210 Pb: problems and solutions. Seminar on Dating of sediments and determination of sedimentation rate, 7–24, https://inis.iaea.org/records/vtsmx-fvz88 (last access: 25 November 2024), 1998.
Appleby, P. G. and Oldfield, F.: The calculation of lead-210 dates assuming a constant rate of supply of unsupported 210Pb to the sediment, Catena, 5, 1–8, https://doi.org/10.1016/S0341-8162(78)80002-2, 1978.
M. A. Aquino-López, Ruiz-Fernández, A. C., Blaauw, M., and Sanchez-Cabeza, J. A.: Comparing classical and Bayesian 210Pb dating models in human-impacted aquatic environments, Quat. Geochronol., 60, 101106, https://doi.org/10.1016/j.quageo.2020.101106, 2020.
Årthun, M., Eldevik, T., Smedsrud, L., Skagseth, O., and Ingvaldsen, R.: Quantifying the influence of Atlantic heat on Barents Sea ice variability and retreat, J. Climate, 25, 4736–4743, https://doi.org/10.1175/JCLI-D-11-00466.1, 2012.
Bianchi, T. S., Cui, X., and Blair, N. E.: Fjords as aquatic critical zones (ACZs), Earth Sci. Rev., 203, 103145, https://doi.org/10.1016/j.earscirev.2020.103145, 2020.
Blair, N. E. and Aller, R. C.: The fate of terrestrial organic carbon in the marine environment, Annu. Rev. Mar. Sci., 4, 401–423, https://doi.org/10.1146/annurev-marine-120709-142717, 2012.
Burton, D. J., Dowdeswell, J. A., Hogan, K. A., and Noormets, R.: Marginal fluctuations of a Svalbard surge-type tidewater glacier, Blomstrandbreen, since the Little Ice Age: A record of three surges, Arct. Antarct. Alp. Res., 48, 411–426, https://doi.org/10.1657/AAAR0014-094, 2016.
Cantoni, C., Hopwood, M. J.,Clarke, J. S., Chiggiato, J.,Achterberg, E. P., and Cozzi, S.: Glacial drivers of marinebiogeochemistry indicate a future shiftto more corrosive conditions in anArctic fjord, J. Geophys. Res.-Biogeo., 125, e2020JG005633, https://doi.org/10.1029/2020JG005633, 2020.
Cottier, F. R., Nilsen, F., Inall, M. E., Gerland, S., Tverberg, V., and Svendsen, H.: Wintertime warming of an Arctic shelf in response to large-scale atmospheric circulation, Geophys. Res. Lett., 34, L10607, https://doi.org/10.1029/2007GL029948, 2007.
Dahlke, F. T., Wohlrab, S., Butzin, M., and Pörtner, H.-O.: Thermal bottlenecks in the life cycle define climate vulnerability of fish, Sciences, 369, 65–70, https://doi.org/10.1126/science.aaz3658, 2020.
Dallmann, W. K. and Elvevold, S.: Bedrock geology. Geoscience Atlas of Svalbard, Re-port Series 148, Norsk Polarinstitutt, Tromsø, 133–173, http://hdl.handle.net/11250/2580810 (last access: 16 October 2024), 2015.
D'Angelo, A., Giglio, F., Miserocchi, S., Sanchez-Vidal, A., Aliani, S., Tesi, T., Viola, A., Mazzola, M., and Langone, L.: Multi-year particle fluxes in Kongsfjorden, Svalbard, Biogeosciences, 15, 5343–5363, https://doi.org/10.5194/bg-15-5343-2018, 2018.
De Rovere, F., Langone, L., Schroeder, K., Miserocchi, S., Giglio, F., Aliani, S., and Chiggiato, J.: Water masses variability in inner Kongsfjorden (Svalbard) during 2010–2020, Front. Mar. Sci., 9, 741075, https://doi.org/10.3389/fmars.2022.741075, 2022.
Elverhøi, A., Liestøl, O., and Nagy, J.: Glacial erosion, sedimentation and microfauna in the inner part of Kongsfjorden, Spitsbergen, Norsk Polarinstitutt Skrifter, 172, 33–58, http://core.ac.uk/reader/30910780#page=35 (last access: 9 January 2025), 1980.
Forwick, M. and Vorren, T. O.: Late Weichselian and Holocene sedimentary environments and ice rafting in Isfjorden, Spitsbergen, Palaeogeogr. Palaeocl., 280, 258–274, https://doi.org/10.1016/j.palaeo.2009.06.026, 2009.
Friedlingstein, P., O'Sullivan, M., Jones, M. W., Andrew, R. M., Hauck, J., Olsen, A., Peters, G. P., Peters, W., Pongratz, J., Sitch, S., Le Quéré, C., Canadell, J. G., Ciais, P., Jackson, R. B., Alin, S., Aragão, L. E. O. C., Arneth, A., Arora, V., Bates, N. R., Becker, M., Benoit-Cattin, A., Bittig, H. C., Bopp, L., Bultan, S., Chandra, N., Chevallier, F., Chini, L. P., Evans, W., Florentie, L., Forster, P. M., Gasser, T., Gehlen, M., Gilfillan, D., Gkritzalis, T., Gregor, L., Gruber, N., Harris, I., Hartung, K., Haverd, V., Houghton, R. A., Ilyina, T., Jain, A. K., Joetzjer, E., Kadono, K., Kato, E., Kitidis, V., Korsbakken, J. I., Landschützer, P., Lefèvre, N., Lenton, A., Lienert, S., Liu, Z., Lombardozzi, D., Marland, G., Metzl, N., Munro, D. R., Nabel, J. E. M. S., Nakaoka, S.-I., Niwa, Y., O'Brien, K., Ono, T., Palmer, P. I., Pierrot, D., Poulter, B., Resplandy, L., Robertson, E., Rödenbeck, C., Schwinger, J., Séférian, R., Skjelvan, I., Smith, A. J. P., Sutton, A. J., Tanhua, T., Tans, P. P., Tian, H., Tilbrook, B., van der Werf, G., Vuichard, N., Walker, A. P., Wanninkhof, R., Watson, A. J., Willis, D., Wiltshire, A. J., Yuan, W., Yue, X., and Zaehle, S.: Global Carbon Budget 2020, Earth Syst. Sci. Data, 12, 3269–3340, https://doi.org/10.5194/essd-12-3269-2020, 2020.
Gealy, E. L.: Saturated bulk density, grain density, and porosity of sediment cores from the western equatorial Pacific: Leg 7, Glomar Challenger, Initial Rep. Deep Sea, 7, 1081–1104, 1971.
Goñi, M. A. and Hedges, J. I.: Lignin dimers: structures, distribution, and potential geochemical applications, Geochim. Cosmochim. Ac., 56, 4025–4043, https://doi.org/10.1016/0016-7037(92)90014-A, 1992.
Goñi, M. A. and Hedges, J. I.: Sources and reactivities of marine-derived organic matter in coastal sediments as determined by alkaline CuO oxidation, Geochim. Cosmochim. Ac., 59, 2965–2981, https://doi.org/10.1016/0016-7037(95)00188-3, 1995.
Goñi, M. A., Yunker, M. B., MacDonald, R. W., and Eglinton, T. I.: Distribution and sources of organic biomarkers in arctic sediments from the Mackenzie River and Beaufort Shelf, Mar. Chem., 71, 23–51, https://doi.org/10.1016/S0304-4203(00)00037-2, 2000.
Goñi, M. A., Yunker, M. B., MacDonald, R. W., and Eglinton, T. I.: The supply and preservation of ancient and modern components of organic carbon in the Canadian Beaufort Shelf of the Arctic Ocean, Mar. Chem., 93, 53–73, https://doi.org/10.1016/j.marchem.2004.08.001, 2005.
Hamilton, E. L.: Elastic properties of marine sediments, J. Geophys. Res., 76, 293–635, https://doi.org/10.1190/1.1440168, 1971.
Hass, H. C.: A method to reduce the influence of ice-rafted debris on a grain size record from northern Fram Strait, Arctic Ocean, Polar Res., 21, 299–306, https://doi.org/10.1111/j.1751-8369.2002.tb00084.x, 2002.
Hedges, J. I. and Ertel, J. R.: Characterization of lignin by gas capillary chromatography of cupric oxide oxidation products, Anal. Chem., 54, 174–178, https://doi.org/10.1021/ac00239a007, 1982.
Hedges, J. I. and Mann, D. C.: The characterization of plant tissues by their lignin oxidation products, Geochim. Cosmochim. Ac., 43, 1803–1807, https://doi.org/10.1016/0016-7037(79)90028-0, 1979.
Hop, H., Pearson, T., Hegseth, E. N., Kovacs, K. M., Wiencke, C., Kwasniewski, S., Eiane, K., Mehlum, F., Gulliksen, B., Wlodarska-Kowalczuk, M., Lydersen, C., Weslawski, J. M., Cochrane, S., Gabrielsen, G. W., Leakey, R., Lønne, O. J., Zajaczkowski, M., Falk-Petersen, S., Kendall, M., Wängberg, S.-Å., Bischof, K., Voronkov, A. Y., Kovaltchouk, N. A., Wiktor, J., Poltermann, M., di Prisco, G., Papucci, C., and Gerland, S.: The marine ecosystem of Kongsfjorden, Svalbard, Polar Res., 21, 167–208, https://doi.org/10.1007/978-3-319-46425-1_1, 2002.
Houel, S., Louchouarn, P., Lucotte, M., Canuel, R., and Ghaleb, B.: Translocation of soil organic matter following reservoir impoundment in boreal systems: Implications for in situ productivity, Limnol. Oceanogr., 51, 1497–1513, https://doi.org/10.4319/lo.2006.51.3.1497, 2006.
Husum, K., Howe, J. A., Baltzer, A., Forwick, M., Jensen, M., Jernas, P., Korsun, S., Miettinen, A., Mohan, R., Morigi, C., Myhre, P. I., Prins, M. A., Skirbekk, K., Sternal, B., Boos, M. , Dijkstra, N., and Troelstra, S.: The marine sedimentary environments of Kongsfjorden, Svalbard: An archive of polar environmental change, Polar Res., 38, 3380, https://doi.org/10.33265/polar.v38.3380, 2019.
Ingrosso, G., Ceccarelli, C., Giglio, F., Giordano, P., Hefter, J., Langone, L., Miserocchi, S., Mollenhauer, G., Nogarotto, A., Sabino, M., and Tesi, T.: Greening of Svalbard in the twentieth century driven by sea ice loss and glaciers retreat, Commun. Earth Environ., 6, 30, https://doi.org/10.1038/s43247-025-01994-y, 2025.
ISO 9277:2010: Determination of the Specific Surface Area of Solids by Gas Adsorption – BET Method, Edition 2, http://iso.org/standard/44941.html (last access: 13 August 2024), 2010.
Ito, H. and S. Kudoh,: Characteristics of water in Kongsfjorden, Svalbard, Proc. NIPR Symp. Polar Meteorol. Glaciol., 11, 211–232, 1997.
Jernas, P., Klitgaard-Kristensen, D., Husum, K., Koç, N., Tverberg, V., Loubere, P., Prins, M., Dijkstra, N., and Gluchowska, M.: Annual changes in Arctic fjord environment and modern benthic foraminiferal fauna: Evidence from Kongsfjorden, Svalbard, Global Planet. Change, 163, 119–140, 2018.
Jordà-Molina, È., Renaud, P. E., Silberberger, M. J., Sen, A., Bluhm, B. A., Carroll, M. L., Ambrose Jr., W. G., Cottier, F., and Reiss, H.: Seafloor warm water temperature anomalies impact benthic macrofauna communities of a high-Arctic cold-water fjord. Mar. Envrion. Res., 189, 106046, https://doi.org/10.1016/j.marenvres.2023.106046, 2023.
Keil, R. G., Tsamakis, E., Fuh, C. B., Giddings, J. C., and Hedges, J. I.: Mineralogical and textural controls on the organic composition of coastal marine sediments: Hydrodynamic separation using SPLITT-fractionation, Geochim. Cosmochim. Ac., 58, 879–893, https://doi.org/10.1016/0016-7037(94)90512-6, 1994.
Keil, R. G., Mayer, L. M., Quay, P. D., Richey, J. E., and Hedges, J. I.: Loss of organic matter from riverine particles in deltas, Geochim. Cosmochim. Ac., 61, 1507–1511, https://doi.org/10.1016/S0016-7037(97)00044-6, 1997.
Kim, D., Kim, J.-H., Tesi, T., Kang, S., Nogarotto, A., Park, K., Lee, D.-H., Jin, Y. K., Shin, K.-H., and Nam, S.-I.: Changes in the burial efficiency and composition of terrestrial organic carbon along the Mackenzie Trough in the Beaufort Sea, Estuar. Coastal Shelf S., 275, 107997, https://doi.org/10.1016/j.ecss.2022.107997, 2022.
Kim, D. and Kim, J.-H.: Bulk sediment properties and lignin phenols for sediment cores from the Kongsfjorden, Svalbard (HH22 and HH23), KPDC (Korea Polar Data Center) [data set], https://doi.org/10.22663/KOPRI-KPDC-00002831, 2025.
Kim, D., Kim, J.-H., Ahn, Y., Jang, K., Jung, J. Y., Bae, M., and Nam, S.-I.: Large contributions of petrogenic and aged soil-derived organic carbon to Arctic fjord sediments in Svalbard, Sci. Rep., 13, 17935, https://doi.org/10.1038/s41598-023-45141-z, 2023.
Kim, J.-H., Peterse, F., Willmott, V., Klitgaard Kristensen, D., Baas, M., Schouten, S., and Sinninghe Damsté, J. S.: Large ancient organic matter contributions to Arctic marine sediments (Svalbard), Limnol. Oceanogr., 56, 1463–1474, 2011.
Knies, J. and Martinez, P.: Organic matter sedimentation in the western Barents Sea region: Terrestrial and marine contribution based on isotopic composition and organic nitrogen content, Norw. J. Geol., 89, 79–89, 2009.
Knies, J., Brookes, S., and Schubert, C. J.: Re-assessing the nitrogen signal in continental margin sediments: New insights from the high northern latitudes, Earth Planet. Sc. Lett., 253, 471–484, https://doi.org/10.1016/j.epsl.2006.11.008, 2007.
Krajewska, M., Szymczak-Zyla, M., Tylmann, W., Kowalewska, G.: Climate change impact on primary production and phytoplankton taxonomy in Western Spitsbergen fjords based on pigments in sediments, Global Planet. Change, 189, 103158, https://doi.org/10.1016/j.gloplacha.2020.103158, 2020.
Kuliński, K., Kedra, M., Legezynska, J., Gluchowska, M., Zaborska, A.: Particulate organic matter sinks and sources in high Arctic fjord, J. Marine Syst., 139, 27–37, https://doi.org/10.1016/j.jmarsys.2014.04.018, 2014.
Kumar, V., Tiwari, M., Nagoji, S., and Tripathi, S.: Evidence of anomalously low δ13C of marine organic matter in an Arctic Fjord, Sci. Rep., 6, 36192, https://doi.org/10.1038/srep36192, 2016.
Lind, S., Ingvaldsen, R. B., and Furevik, T.: Arctic warming hotspot in the northern Barents Sea linked to declining sea-ice import, Nat. Clim. Change, 8, 634–639, 2018.
Mayer, L. M.: Surface area control of organic carbon accumulation in continental shelf sediments, Geochim. Cosmochim. Ac., 58, 1271–1284, https://doi.org/10.1016/0016-7037(94)90381-6, 1994.
McGovern, M., Borgå, K., Heimstad, E., Ruus, A., Christensen, G., and Evenset, A.: Small Arctic rivers transport legacy contaminants from thawing catchments to coastal areas in Kongsfjorden, Svalbard, Environ. Pollut., 304, 119191, https://doi.org/10.1016/j.envpol.2022.119191, 2022.
Meslard, F., Bourrin, F., Many, G., and Kerherve, P.: Suspended particle dynamics and fluxes in an Arctic fjord (Kongsfjorden, Svalbard), Estuar. Coast. Shelf S., 204, 212–224, https://doi.org/10.1016/j.ecss.2018.02.020, 2018.
Nam, S.-I.: Late Quaternary glacial history and paleoceanographic reconstructions along the East Greenland continental marine: evidence from high-resolution records of stable isotopes and ice-rafted debris, Rep. Polar Res., 241, 21, https://epic.awi.de/id/eprint/26419/1/BerPolarforsch1997241.pdf (last access: 16 February 2025), 1997.
Nuth, C., Kohler, J., König, M., von Deschwanden, A., Hagen, J. O., Kääb, A., Moholdt, G., and Pettersson, R.: Decadal changes from a multi-temporal glacier inventory of Svalbard, The Cryosphere, 7, 1603–1621, https://doi.org/10.5194/tc-7-1603-2013, 2013.
Ó Cofaigh, C. and Dowdeswell, J. A.: Laminated sediments in glacimarine environments: diagnostic criteria for their interpretation, Quaternary Sci. Rev., 20, 1411–1436, https://doi.org/10.1016/S0277-3791(00)00177-3, 2001.
Otto, A. and Simpson, M. J.: Evaluation of CuO oxidation parameters for determining the source and stage of lignin degradation in soil, Biogeochemistry, 80, 121–142, https://doi.org/10.1007/s10533-006-9014-x, 2006.
Pempkowiak, J.: Limitation of lignin derivatives as biomarkers of land derived organic matter in the coastal marine sediments, Oceanologia, 62, 374–386, https://doi.org/10.1016/j.oceano.2020.04.004, 2020.
Polyakov, I. V., Pnyushkov, A. V., Alkire, M. B., Ashik, I. M., Baumann, T. M., Carmack, E. C., Goszczko, I., Guthrie, J., Ivanov, V. V., Kanzow, T., Krishfield, R., Kwok, R., Sundfjord, A., Morison, J., Remember, R., and Yulin, A.: Greater role for Atlantic inflows on sea-ice loss in the Eurasian Basin of the Arctic Ocean, Science, 356, 285–291, 2017.
Prahl, F. G., Ertel, J. R., Goñi, M. A., Sparrow, M. A., and Eversmeyer, B.: Terrestrial organic carbon contributions to sediments on the Washington margin, Geochim. Cosmochim. Ac., 58, 3035–3048, https://doi.org/10.1016/0016-7037(94)90177-5, 1994.
Pramanik, A., Kohler, J., Lindbäck, K., How, P., Van Pelt, W., Liston, G., and Schuler, T. V.: Hydrology and runoff routing of glacierized drainage basins in the Kongsfjord area, northwest Svalbard, The Cryosphere Discuss. [preprint], https://doi.org/10.5194/tc-2020-197, 2020.
Rantanen, M., Karpechko, A. Y., Lipponen, A., Nordling, K., Hyvärinen, O., Ruosteenoja, K., and Räisänen, J.: The Arctic has warmed nearly four times faster than the globe since 1979, Commun. Earth Environ., 3, 168, https://doi.org/10.1038/s43247-022-00498-3, 2022.
Schubert, C. J. and Calvert, S. E.: Nitrogen and carbon isotopic composition of marine and terrestrial organic matter in Arctic Ocean sediments: implications for nutrient utilization and organic matter composition, Deep-Sea Res. Pt. I, 48, 789–810, 2001.
Schirone, A., Rozmaric, M., Barsanti, M., Raiteri, G., Sanchez-Cabeza, J. A., Garcia-Tenorio, R., and Osvath, I.: Assessment of measurement accuracy in 210Pb dating sediment methods, Quat. Geochronol., 69, 101255, https://doi.org/10.1016/j.quageo.2022.101255, 2022.
Singh, D. S., Dubey, C. A., Kumar, D., Vishawakarma, B., Singh, A. K., Tripathi, A., and Sharma, R.: Monsoon variability and major climatic events between 25 and 0.05 ka BP using sedimentary parameters in the Gangotri glacier region, Garhwal Himalaya, India, Quaterary Int., 507, 148–155, https://doi.org/10.1016/j.quaint.2019.02.018, 2019.
Skogseth, R., Asplin, L., Budgell, W. P., Eldevik, T., Gerland, S., Haugan, P., and Zamelczyk, K.: Variability and decadal trends in the Isfjorden (Svalbard) ocean climate and circulation – An indicator for climate change in the European Arctic, Progr. Oceanogr., 187, 102394, https://doi.org/10.1016/j.pocean.2020.102394, 2020.
Smith, R. W., Bianchi, T. S., Allison, M., Savage, C., and Galy, V.: High rates of organic carbon burial in fjord sediments globally, Nat. Geosci., 8, 450–453, https://doi.org/10.1038/NGEO2421, 2015.
Stein, R. and MacDonald, R. W.: The organic carbon cycle in the Arctic Ocean, Springer, https://doi.org/10.1007/978-3-642-18912-8, 2004.
Stuiver, M. and Polach, H. A.: Discussion: Reporting of 14C data, Radiocarbon, 19, 355–363, https://doi.org/10.1017/S0033822200003672, 1977.
Svendsen, H., Beszczynska-Møller, A., Hagen, J. O., Lefauconnier, B., Tverberg, V., Gerland, S., and Ørbæk, J. B.: The physical environment of Kongsfjorden–Krossfjorden, an Arctic fjord system in Svalbard, Polar Res., 21, 133–166, https://doi.org/10.3402/polar.v21i1.6479, 2002.
Tesi, T., Muschitiello, F., Smittenber, R. H., Jakobsson, M., Vonk, J. E., Hill, P., Andersson, A., Kirchner, N., Noormets, R., Dudarev, O., Semiletov, I., and Gustafsson, Ö.: Massive remobilization of permafrost carbon during past-glacial warming, Nat. Commun., 7, 13653, https://doi.org/10.1038/ncomms13653, 2016.
Tesi, T., Muschitiello, F., Mollenhauer, G., Miserocchi, S., Langone, L., Ceccarelli, C., Panieri, G., Chiggiato, J., Nogarotto, A., Hefter, J., Ingrosso, G., Giglio, F., Giordano, P., and Capotondi, L.: Rapid atlantification along the Fram Strait at the beginning of the 20th century, Sci. Advances, 7, eabj2946, https://doi.org/10.1126/sciadv.abj2946, 2021.
Torsvik, T., Albretsen, J., Sundfjord, A., Kohler, J., Sandvik, A. D., Skarohamar, J., Lindback, K., and Everett, A.: Impact of tidewater glacier retreat on the fjord system: Modeling present and future circulation in Kongsfjorden, Svalbard, Estuar. Coast. Shelf S., 220, 152–165, https://doi.org/10.1016/j.ecss.2019.02.005, 2019.
Tverberg, V., Skogseth, R., Cottier, F., Sundfjord, A., Walczowski, W., Inall, M. E., Falck, E., Pavlova, O., and Nilsen, F.: The Kongsfjorden transect: seasonal and inter-annual variability in hydrography, The Ecosystem of Kongsfjorden, Svalbard, 49–104, https://doi.org/10.1007/978-3-319-46425-1_3, 2019.
van Hateren, J. A., Prins, M. A., and van Balen, R. T.: On the genetically meaningful decomposition of grain-size distributions: A comparison of different end-member modelling algorithms, Sediment. Geol., 375, 49–71, https://doi.org/10.1016/j.sedgeo.2017.12.003, 2018.
Vogel, J. S., Southon, J. R., Nelson, D. E., and Brown, T. A.: Performance of catalytically condensed carbon for use in accelerator mass spectrometry, NIM-B., 5, 289–293, https://doi.org/10.1016/0168-583X(84)90529-9, 1984.
Vorren, T. O., Hald, M., and Thomsen, E.: Quaternary sediments and environments on the continental shelf off northern Norway, Mar. Geol., 57, 229–257, https://doi.org/10.1016/0025-3227(84)90201-9, 1984.
Wei, T., Ding, M., Wu, B., Lu, C., and Wang, S.: Variations in temperature-related extreme events (1975–2014) in Ny-Ålesund, Svalbard, Atmos. Sci. Lett., 17, 102–108, https://doi.org/10.1002/asl.632, 2016.
Winkelmann, D. and Knies, J.: Recent distribution and accumulation of organic carbon on the continental marine west off Spitsbergen, Geochem. Geophy. Geosys., 6, Q09012, https://doi.org/10.1029/2005GC000916, 2005.
Zaborska, A., Pempkowiak, J., and Papucci, C.: Some sediment characteristics and sedimentation rates in an Arctic fjord (Kongsfjorden, Svalbard), Annu. Environ. Prot., 8, 79–96, 2006.
Zhu, Z.-Y., Wu, Y., Liu, S.-M., Wenger, F., Hu, J., Zhang, J., and Zhang, R.-F.: Organic carbon flux and particulate organic matter composition in Arctic valley glaciers: examples from the Bayelva River and adjacent Kongsfjorden, Biogeosciences, 13, 975–987, https://doi.org/10.5194/bg-13-975-2016, 2016.
Zonneveld, K. A. F., Versteegh, G. J. M., and de Lange, G. J.: Preservation of organic-walled dinoflagellate cysts in different oxygen regimes: A 10,000 years natural experiment, Mar. Micropaleontol., 29, 393–405, https://doi.org/10.1016/S0377-8398(96)00032-1, 1997.