the Creative Commons Attribution 4.0 License.
the Creative Commons Attribution 4.0 License.
 | 12 Sep 2025
Variability in oxygen isotopic fractionation of enzymatic O2 consumption
Carolina F. M. de Carvalho
Moritz F. Lehmann
Stable isotope analysis of O2 has emerged as a valuable tool to study O2 dynamics at various environmental scales, from molecular mechanisms to ecosystem processes. Despite its utility, there is a lack of fundamental understanding of the large variability observed in O2 isotopic fractionation at the environmental and even enzymatic levels. To expand our knowledge of the potential causes of this variability, we determined 18O kinetic isotope effects (KIEs) across a broad range of O2-consuming enzymes. The studied enzymes included nine flavin-dependent, five copper-dependent, and one copper-heme-dependent oxidases, as well as one flavin-dependent monooxygenase. For 12 of these enzymes, 18O KIEs were determined for the first time. The comparison of 18O KIEs, determined in this and previous studies, to calculated 18O equilibrium isotope effects revealed distinct patterns of O isotopic fractionation within and between enzyme groups, reflecting differences in active-site structures and O2-reduction mechanisms. Flavin-dependent O2-consuming enzymes exhibited two distinct ranges of 18O KIEs (from 1.020–1.034 and from 1.046–1.058), likely associated with the rate-limiting steps of two different O2-reduction mechanisms (sequential vs. concomitant two-electron transfer). In comparison, iron- and copper-dependent enzymes displayed a narrower range of 18O KIEs, with overall lower values (from 1.009–1.028), associated with an increase in the degree of O2 reduction during the rate-limiting step. Similar to flavin-dependent O2-consuming enzymes, copper-dependent O2-consuming enzymes also featured two main, yet narrower, ranges of 18O KIEs (from 1.009–1.010 and from 1.017–1.022), likely associated with the rate-limiting formation of a copper-superoxo or copper-hydroperoxo intermediate. Overall, our findings support generalizations regarding expected 18O KIE ranges imparted by O2-consuming enzymes and have the potential to help interpret stable O2 isotopic fractionation patterns across different environmental scales.
- Article
(2024 KB) - Full-text XML
-
Supplement
(453 KB) - BibTeX
- EndNote


Stable isotope analysis of O2 has proven to be a valuable tool for tracking and quantifying environmentally relevant O2 dynamics across different spatial and temporal scales. On a large environmental scale, stable isotope analysis of O2 has been most commonly used in aquatic studies to estimate the productivity of oceans and lakes (Luz and Barkan, 2000; Hendricks et al., 2005; Gammons et al., 2014; Bocaniov et al., 2015; Bogard et al., 2017), but it has also been used as a tracer of ocean circulation (Kroopnick and Craig, 1976; Bender, 1990; Levine et al., 2009), as well as to estimate historical changes in the global hydrological and O2 cycles (Petit et al., 1999; Severinghaus et al., 2009; Blunier et al., 2012). On a smaller environmental scale, isotope analysis of O2 has been used to study the dynamics of O2 consumption by plants (Guy et al., 1992, 1993; Ribas-Carbo et al., 1995; Helman et al., 2005), microorganisms (Helman et al., 2005; Stolper et al., 2018; Ash et al., 2020), and humans (Epstein and Zeiri, 1988; Zanconato et al., 1992).
In most environmental applications of O2 isotope analysis, biological O2 consumption is the main process driving and modulating the changes in the and ratios of O2. Spatial and/or temporal changes in O2 isotope ratios are referred to as isotopic fractionation and can be quantified with, for example, 18ε values (see Eq. 1), which are typically reported in per mil (‰) (Coplen, 2011):
Here, () and ()0 represent the isotopic ratios of O2 in a sample at a given time point and in a reference sample (typically reflecting initial conditions or original source), respectively, and [O2]/[O2]0 represents the fraction of O2 remaining after partial consumption. Typically, 18ε values are indicative of a specific reactive process and may thus be used to identify, track, and quantify O2 consumption processes in the environment. However, the magnitude of 18ε values measured for bulk biological O2 consumption, considered to be predominantly respiration, varies considerably. Specifically, in aquatic environments, 18ε values determined for respiratory O2 consumption range from −7 ‰ to −26 ‰ (Kiddon et al., 1993; Helman et al., 2005; Wang et al., 2008; Levine et al., 2009; Bocaniov et al., 2015). Although it has been suggested that the observed variability in 18ε values can be explained by the different types of organisms consuming O2, the availability of light (e.g. effect of photosynthesis and/or photoinhibition pathways), and the main metabolic pathway (Mader et al., 2017), there is still no fundamental understanding of the underlying causes of this variability. The uncertainty associated with the O isotopic fractionation of respiratory O2 consumption has substantial implications for the application of O2 isotope analysis to study ecosystem respiration on an environmental scale. For instance, most O2 isotope applications to study aquatic ecosystems require assuming a constant 18ε value for respiration to estimate respiration rates (Wang et al., 2008; Bocaniov et al., 2012; Bogard et al., 2017). Consequently, these respiration rates are prone to considerable error depending on the accuracy of the chosen community respiration 18ε value (Hotchkiss and Hall, 2014).
To improve the quantification of gross O2 production in aquatic environments, an increasing number of studies are applying the triple oxygen isotope (TOI) method (Luz and Barkan, 2000; Hendricks et al., 2005; Juranek and Quay, 2013; Jurikova et al., 2016). In TOI applications, changes in ratios relative to changes in ratios along O2 concentration gradients are quantified as λ values (Miller, 2002; Sharp et al., 2018). λ values for biological O2 consumption range between 0.51 and 0.53 (Young et al., 2002; Luz and Barkan 2005; Ash et al., 2020; Hayles and Killingsworth, 2022), with a value of 0.518 typically assumed for marine respiration (Luz and Barkan, 2009; Juranek and Quay, 2013). Because λ values vary less than 18ε values for respiration, TOI analysis often improves gross O2 production estimates. However, the overall robustness of λ values representative for respiration, as well as other biological O2-consuming processes, has been recently questioned in other studies (Stolper et al., 2018; Ash et al., 2020; Sutherland et al., 2022a, b).
In addition to environmental applications, stable isotope analysis of O2 has also been applied on a molecular scale to uncover reaction mechanisms of substrate oxidation and O2 reduction by O2-consuming enzymes (Roth and Klinman, 2005). Specifically, oxygen equilibrium isotope effects (18O EIEs) and oxygen kinetic isotope effects (18O KIEs) are used as mechanistic probes to assess the rate-limiting steps in O2-consuming enzymatic reactions (Roth and Klinman, 2005). 18O EIEs can be calculated or experimentally determined for the reversible formation of free, or ligand-bound, reactive oxygen species (Roth and Klinman, 2005; Lanci et al., 2007; Mirica et al., 2008), such as superoxide (; see Eq. 2), and reflect the ratio of reaction rate constants of light (16O16O) versus heavy (18O16O) isotopologues of O2, as shown in Eq. (3).
where kf and 18OKIEf are the reaction rate constant and KIE of the forward reaction between O2 and , kr and 18OKIEr are the reaction rate constant and KIE of the reverse reaction, and 16k and 18k denote reaction rate constants for the light and heavy isotopologues of O2, respectively. Experimentally determined 18O KIEs reflect the O isotopic fractionation occurring in all elementary reaction steps beginning with interaction of an enzyme with O2 up to, and including, the first irreversible step (Roth, 2007), which is often rate-limiting. Experimental 18O KIEs are thus often referred to as observable or apparent 18O KIEs, and they reflect an average O isotope effect for both O atoms in O2. Apparent 18O KIEs are related to 18ε and 18α values as shown in Eq. (4).
Typically, apparent 18O KIEs closely reflect the intrinsic 18O KIE of the rate-limiting step, which can be the binding of O2 to the active site, or an elementary O2 reduction step (Roth and Klinman, 2005). Because 18O KIEs contain an additional reaction coordinate frequency compared to 18O EIEs, intrinsic 18O KIEs can be difficult to calculate (Roth, 2007). Therefore, calculated 18O EIEs are often used as a reference to assign experimentally determined 18O KIEs to a specific rate-limiting step (Roth and Klinman, 2005). Together, these parameters can help to elucidate the intermediate species, as well as the number of electrons and protons transferred to O2, before and during the rate-limiting step (Roth and Klinman, 2003; Mirica et al., 2008; Humphreys et al., 2009).
All biological O2 consumption, including respiration, detoxification, and biosynthesis, is ultimately carried out by O2-consuming enzymes. Therefore, the variability in the isotopic fractionation of O2 observed at both small and large environmental scales may be initially attributed to that observed at the enzymatic level. However, few attempts have been made to relate O2 isotopic fractionation occurring at the enzyme level to that occurring at larger environmental scales (Guy et al., 1987, 1989). So far, approximately 850 O2-consuming enzymes have been described by The Nomenclature Committee of the International Union of Biochemistry and Molecular Biology database (McDonald et al., 2009). Yet, comparatively few have been comprehensively studied. O2-consuming enzymes have evolved specialized active-site structures to overcome the kinetic limitations of O2 reduction and to exploit the reactivity of the reduced oxygen species for productive redox catalysis (Malmstrom, 1982; Klinman, 2007; Frey and Hegeman, 2007). These active-site structures are typically flavin-, copper-, or iron-dependent structures that, via the formation of radical intermediates with organic cofactors or interactions with transition-state metals, can rapidly and easily reduce O2 (Malmstrom, 1982; Bugg, 2001; Bento et al., 2006; Frey and Hegeman, 2007; Pimviriyakul and Chaiyen, 2020). There are two major groups of O2-consuming enzymes: oxidases and oxygenases. Oxidases catalyze the transfer of one, two, or four electrons from their substrate(s) to O2, reducing O2 to either hydrogen peroxide (H2O2) or water (H2O) (Malmstrom, 1982). The transfer of electrons from a given substrate to O2 typically occurs in two separate steps through oxidation and reduction of the enzyme. Substrate oxidation by the oxidized enzyme occurs in the reductive half-reaction, and O2 reduction by the reduced enzyme occurs in the oxidative half-reaction. Oxidases are more often involved in catabolic processes, oxidizing substrates like alcohols, amines, and amino acids (Medda et al., 1995; Finney et al., 2014; Pimviriyakul and Chaiyen, 2020). For example, glucose oxidase, one of the most well-studied oxidases, catalyzes the oxidation of β-D-glucose to D-glucono-δ-lactone and H2O2. This reaction is part of the catabolic process that breaks down glucose, providing energy and components needed for anabolic reactions (Bauer et al., 2022). Oxygenases, on the other hand, catalyze the incorporation of one (or both) oxygen atoms of O2 into their substrate(s), and are consequently referred to as mono- or dioxygenases, respectively. As such, O2 reduction typically co-occurs with substrate oxidation and often requires external electron donors, such as NAD(P)H. Oxygenases can catalyze a broader range of substrates, including aromatic hydrocarbons and fatty acids, and are primarily involved in biosynthesis and detoxification (Bugg, 2001; Bernhardt, 2006; van Berkel et al., 2006). For example, cytochrome P450 enzymes represent a superfamily of monooxygenases found in all domains of life, which play a vital role in the biosynthesis of steroids, fatty acids, and bile acids, as well as the inactivation of drugs, toxins, and environmental pollutants (Guengerich, 2007). To the best of our knowledge, enzymatic 18O KIEs have been experimentally determined for only 26 O2-consuming enzymes, with values ranging from 1.009–1.053 (Guy et al., 1989; Cheah et al., 2014; see full list of references in Table S1 in the Supplement). This range in enzymatic 18O KIEs is equivalent to a range in 18ε values of −9 ‰ to −50 ‰, significantly exceeding the previously mentioned range of 18ε values observed for respiratory O2 consumption (Mader et al., 2017). Most of these enzymatic 18O KIEs have been determined with the primary goal to understand specific enzymatic reaction mechanisms of O2 reduction and substrate oxidation. Comprehensive investigations into the O isotopic fractionation of enzymatic O2 consumption, which specifically aim at understanding the underlying causes of the observed variability in 18O KIEs, are lacking.
To expand and improve our understanding of the variability in isotopic fractionation of O2 at the enzyme level, this study reports 19 experimentally determined 18O KIEs for nine flavin-dependent, five copper-dependent, and one copper-heme-dependent oxidases, as well as for one flavin-dependent monooxygenase. In a first step, enzyme assays were conducted to determine initial O2 consumption rates and Michaelis–Menten kinetic constants of each enzymatic reaction to establish saturating substrate concentrations and the presence or absence of product or substrate inhibition. Subsequently, experiments to determine characteristic 18O KIEs were carried out under optimized conditions for each enzyme, whenever possible. For selected enzymes, additional 18O KIEs were measured using alternative substrates or under limiting O2 concentrations to assess the influence of these variables on the variability of single-enzyme 18O KIEs. The combined analysis of 18O KIEs of O2-consuming enzymes determined in this and previous studies allowed for a comprehensive assessment of the variability of isotope effects both within the same active-site structure and across different active-site structures. Our findings not only improve the interpretation and generalization of isotopic fractionation of O2 at the enzyme level, but also contribute to a deeper understanding of the origins of variations in O2 isotopic fractionation at the organism and environmental levels. Ultimately, this research supports the application of stable O2 isotope analysis as a useful and robust tool for investigating O2 biogeochemical dynamics from molecular to ecosystem scales.
2.1 Chemicals and enzymes
Unless noted otherwise, enzymes (see list in Table 1) and chemicals were purchased from Sigma-Aldrich and used as received. Sodium phosphate dibasic (Na2HPO4, 99 %, Carl Roth), sodium phosphate monobasic dihydrate (NaH2PO4⋅2 H2O, 99 %, Merck), sodium acetate (98.5 %, Carl Roth), 2-amino-2-(hydroxymethyl)-1,3-propanediol (Tris, 99 %), N-2-hydroxyethylpiperazine-N′-2-ethane-1-sulfonic acid sodium salt (HEPES, 99 %, Carl Roth), sodium hydroxide (NaOH, 98 %), and hydrochloric acid (HCl, 37 %, VWR) were used to make buffer solutions. Sodium chloride (NaCl, 99.5 %, Carl Roth), potassium chloride (KCl, 99 %), thiamine diphosphate (95 %), manganese sulfate (MnSO4, 99 %, Carl Roth), flavin adenine dinucleotide disodium salt hydrate (FAD, 95 %), DL-dithiothreitol (99 %), Thesit® (non-ionic surfactant for membrane research), and isopropanol (HPLC grade, Carl Roth) were added to certain enzyme assays to increase enzymatic activity or substrate solubility. Methanol (99.9 %, Carl Roth), ethanol (99.8 %, Honeywell), L-ascorbic acid (98 %), bilirubin (98 %), cholesterol (99 %), choline chloride (98 %), cytochrome c from bovine heart (95 %), D-alanine (98 %), histamine dihydrochloride (99 %), D-(+)-glucose (99.5 %), D-(+)-mannose (99 %), L-kynurenine (98 %), β-nicotinamide adenine dinucleotide phosphate reduced tetrasodium salt hydrate (NADPH, 95 %), hydroquinone (99 %), 2,2′-azino-bis(3-ethylbenzothiazoline-6-sulfonic acid) diammonium salt (ABTS, 98 %), L-(+)-lactic acid (98 %), L-lysine monohydrochloride (99.5 %), sodium pyruvate (99 %), and sarcosine (98 %) were used as (co)substrates. Hydrogen peroxide (H2O2, 30 %), formaldehyde (36 %), acetaldehyde (99.5 %), betaine (98 %), ammonium chloride (≥99 %), p-benzoquinone (98 %), sodium bicarbonate (99.5 %), and glycine (98.5 %) were used to test product inhibition of enzymatic activities. Sodium sulfite (Na2SO3, 98 %) was used to calibrate optical oxygen sensors. All solutions were made in ultrapure water (18.2 MΩ cm, ELGA LabWater). O2 (99.995 %), N2 (99.999 %), and He (99.999 %) gases were from Carbagas AG.
Table 1Names, Enzyme Commission (EC) numbers, biological sources, and activities of all enzymes used in this study.
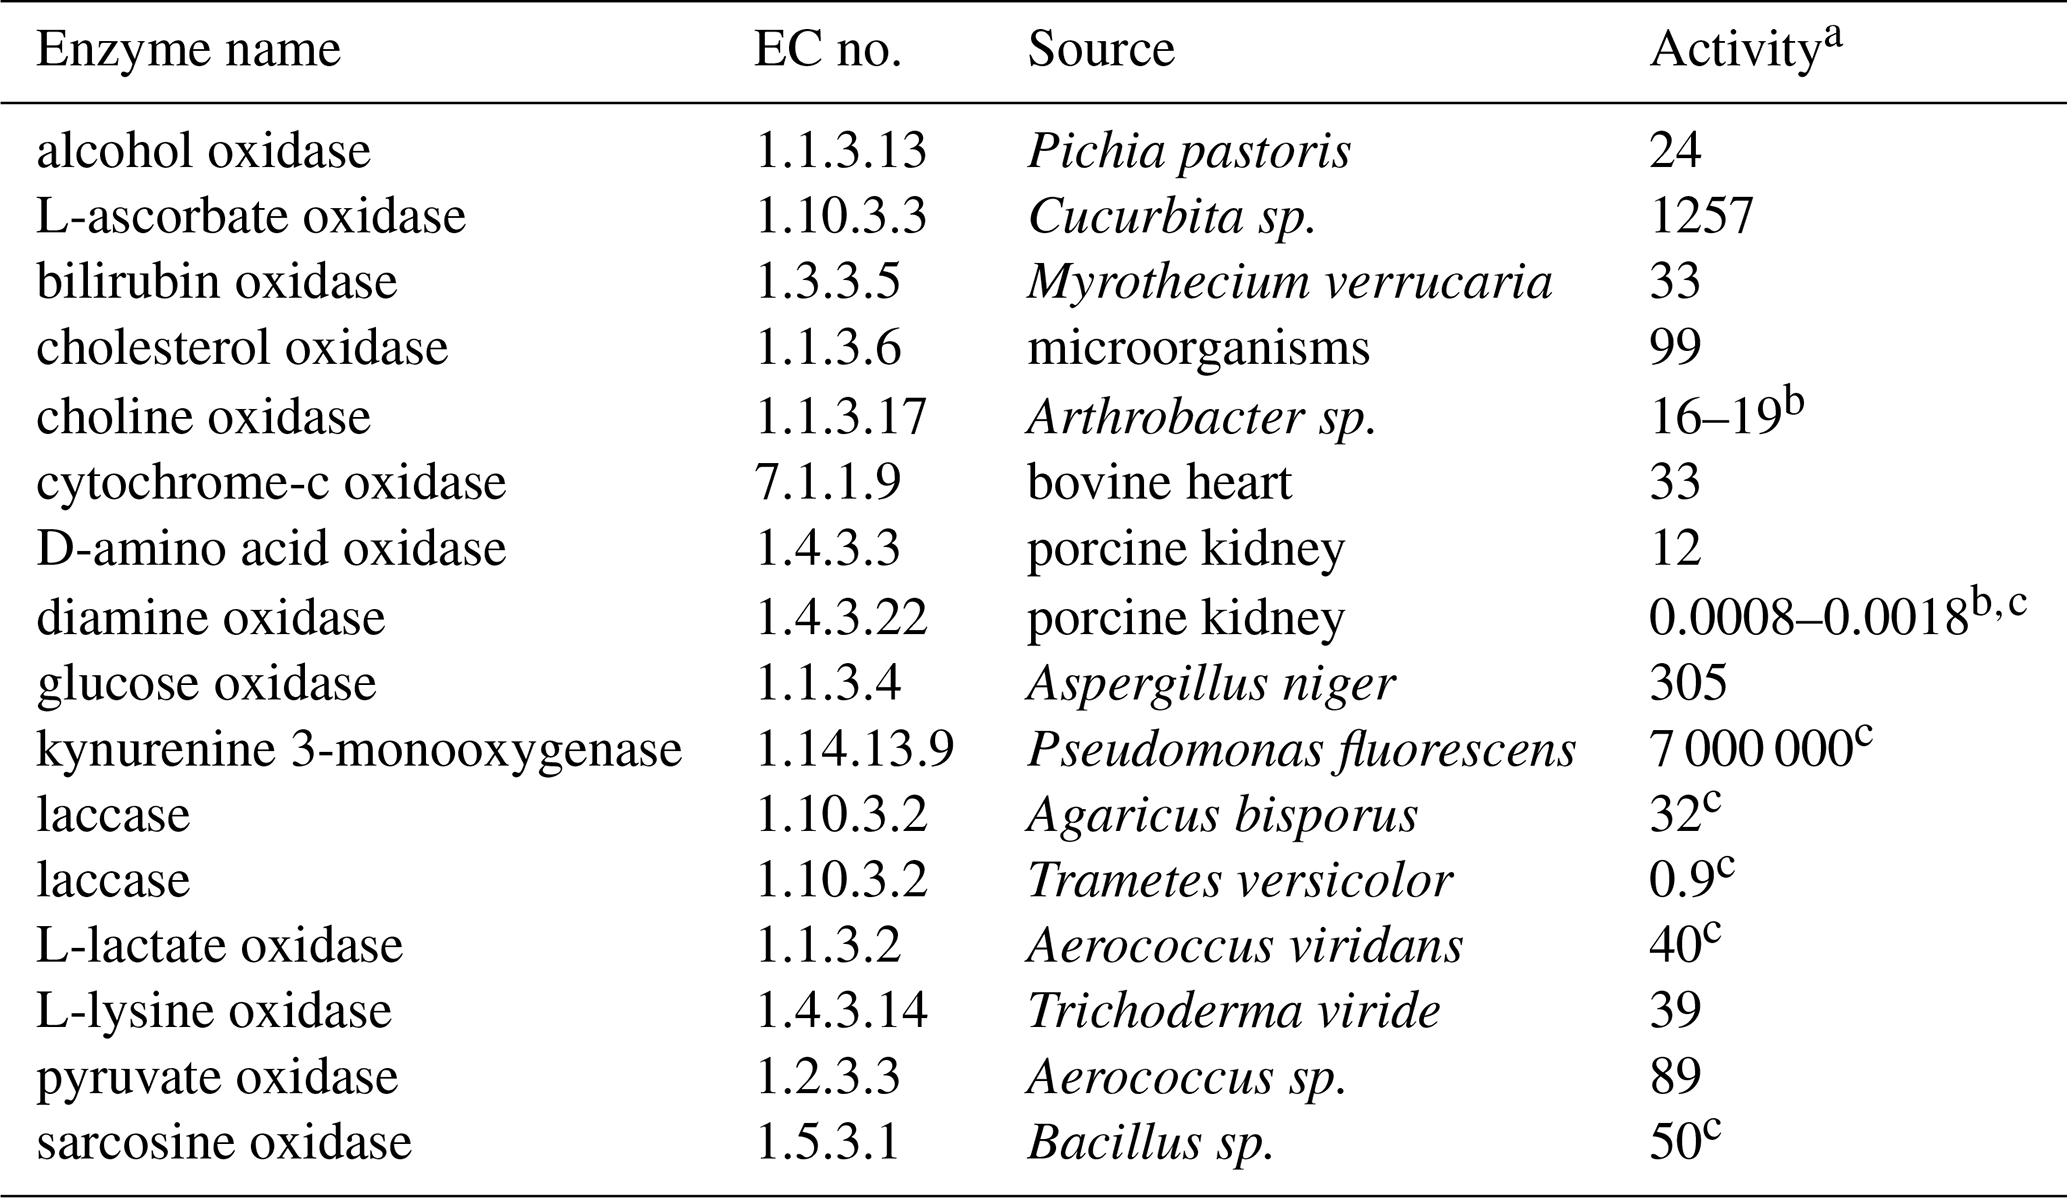
a in (unless indicated otherwise), determined under specific conditions defined by the manufacturer,
b multiple batches of enzyme with different activities were used,
c activity is reported per milligram total solid instead of per milligram protein.
2.2 Enzyme assays for kinetic parameters
To measure (initial) O2 consumption rates, enzyme assays were performed in clear-glass, crimp-top vials with a volume of 9 mL when closed. These vials contained small magnetic stir bars, were filled headspace-free with assay solution, and closed with hollow butyl rubber stoppers and crimp caps. Assay solutions consisted of an air-equilibrated buffer, an organic substrate, cofactors and co-substrates if necessary, and the respective enzyme of interest (see Appendix A for details). Once filled and closed, vials were placed on a magnetic stirring plate at room temperature (23±1 °C). Enzymatic reactions were initiated with the addition of small volumes of enzyme or substrate solution through the septum with a gas-tight glass syringe. Dissolved O2 concentrations were continuously monitored inside the closed vials with fiber-optic oxygen minisensors and a FireSting meter (PyroScience GmbH) with automated pressure, humidity, and temperature correction. The fiber-optic minisensors are housed in stainless-steel needles (1.1 mm o.d.), with which the crimp vial septa can be pierced. Optical oxygen sensors were calibrated for maximum and minimum dissolved O2 concentrations with air-equilibrated water and with a 300 mM Na2SO3 solution, respectively. Accurate temperature compensation was performed with optical temperature sensor spots (PyroScience GmbH) inside the vials. These sensor spots were regularly calibrated with the temperature probe of the FireSting meter.
With this type of enzyme assay, initial O2 consumption rates were measured to determine Km values for all enzymes with varying initial organic substrate concentrations, referred to as Km(S), except for cytochrome-c oxidase and kynurenine 3-monooxygenase (KMO) because of limited substrate availability. In addition, this type of enzyme assay was used to measure initial O2 consumption rates in the presence or absence of reaction products (see Appendix A for details). Inhibition of enzymatic activities due to the presence of reaction products (i.e., product inhibition) was tested for all enzymes but only detected for KMO and laccase from Trametes versicolor, with 2,2′-azino-bis(3-ethylbenzothiazoline-6-sulfonic acid) diammonium salt (ABTS) as the substrate, at relevant product concentrations. Due to this observed product inhibition, Km values with varying initial O2 concentrations, referred to as Km(O2), were determined as described for Km(S) above for KMO and laccase from T. versicolor with ABTS as the substrate (see Appendix A for details). Varying initial O2 concentrations were achieved by mixing air-equilibrated buffer (270±10 µM O2) with N2-purged buffer (approx. 0 µM O2) or O2-purged buffer (1200±100 µM O2). For all other enzymes, Km(O2) values were determined from complete O2 consumption experiments performed with the same type of enzyme assay either in air-equilibrated or O2-purged buffer.
2.3 Enzyme assays for 18O KIEs and λ values
Enzyme assays to determine 18O KIEs and λ values were performed in air-equilibrated buffer solutions with saturating concentrations of all other substrates (see Appendix A for details). As saturating substrate concentrations, we considered either 10 times the Km(S) value or a sufficiently high substrate concentration to limit the difference between the initial and final reaction rates (ν, determined with Eq. 8 and the corresponding Km(S) value) in the experiment to below 5 %. These enzyme assays were typically conducted in a 50 mL gas-tight glass syringe equipped with an optical oxygen sensor spot (PyroScience GmbH), an optical temperature sensor spot, and a small magnetic stir bar. Optical sensor spots were placed on the inside wall of the syringe, as close to the Luer-Lock tip as possible, and calibrated as described above for the fiber-optic oxygen sensors. These sensor spots allowed for a continuous, temperature-corrected measurement of O2 concentrations through the glass wall via an optical fiber. The syringe was filled completely with a buffer solution containing all required substrates. To start the reaction, a small volume of enzyme solution was added through the Luer-Lock tip with a gas-tight glass syringe. Immediately after enzyme addition, a stainless-steel needle (0.8 mm o.d.) was attached to the Luer-Lock tip. To limit exchange of O2 with the atmosphere, the needle was flushed with a few drops of assay solution and then pushed into a 12 mm thick chlorobutyl stopper. For experiments with diamine oxidase, the reaction was initiated by adding a small volume of substrate solution to assay solutions already containing the enzyme. Except during sampling, the syringe was placed on a magnetic stirring plate. Six sampling time points (t1 to t6) were determined from the continuously monitored O2 concentrations, typically at 200, 150, 120, 90, 70, and 50 µM remaining O2, corresponding to approx. 25 %–80 % O2 consumption. To sample, the needle was removed from the stopper and the first milliliter assay solution was discarded. The next 3–7 mL (depending on O2 concentration) was injected into 12 mL Exetainers (Labco Limited). Before starting an enzyme assay, Exetainers were closed with chlorobutyl septa, purged with He gas for 1 h, and amended with 100–200 µL of 2 M NaOH or 2–3 M HCl to stop enzymatic reactions in the added sample. To ensure equal headspace pressure in the Exetainers despite different sample volumes, Exetainer septa were pierced with a stainless-steel needle (0.45 mm o.d.), connected with a T-piece to a slow He flow and an open outlet submerged under 10 cm of water during sample injection. After sample injection, Exetainers were shaken and stored upside down until isotope analysis (see Sect. 2.4). Procedural blanks were prepared by transferring 1–7 mL of N2-purged water with a 50 mL gas-tight glass syringe from closed, over-pressured serum bottles into He-purged Exetainers containing NaOH or HCl solution, as described above for enzyme assay samples. Similarly, quantification standards (see Sect. 2.4 for details) were prepared by transferring 1–5 mL of air-equilibrated water with a 50 mL gas-tight glass syringe into He-purged Exetainers. For each experiment, one or more control samples were prepared by transferring 3 mL leftover assay solution without enzyme with a 10 mL gas-tight glass syringe into a He-purged Exetainer containing NaOH or HCl solution. These control samples were used to determine the concentration and isotopic composition of O2 at the start of the experiments (t0).
Some enzyme assays with choline, diamine, and glucose oxidase were also performed in 4–10 identically prepared 12 mL crimp-top vials per assay, as described recently (de Carvalho et al., 2024). Reactions were initiated by injecting a small volume of enzyme or substrate solution through the septa into filled vials. Prior to sampling, a fiber-optic oxygen microsensor (PyroScience GmbH) housed in a stainless-steel needle (0.5 mm o.d.) was inserted through the septa into the vials to measure the remaining O2 concentration. The oxygen sensor was calibrated as described above. After initiating the reaction and before measuring O2 concentrations, vials were shaken vigorously. To stop reactions at the desired degrees of O2 consumption, 3–7 mL assay solution was transferred into He-purged Exetainers that had been amended with 100–200 µL of 2 M NaOH or 2–3 M HCl. Procedural blanks, control samples, and quantification standards were prepared as described above. Experiments with diamine, choline, and glucose oxidase performed with the two different setups resulted in equal 18O KIEs and λ values, respectively, within error.
All samples, blanks, quantification standards, and controls were placed upside down on an orbital shaker at 125 rpm (revolutions per minute) for 1 h, prior to analysis by gas chromatography coupled to isotope-ratio mass spectrometry (GC–IRMS).
2.4 Stable isotope analysis of O2
δ18O and δ17O values of O2 were measured in the headspace of Exetainers with a GasBench II coupled via a Conflo IV to a Delta V Plus isotope-ratio mass spectrometer (Thermo Fisher Scientific) as described recently (de Carvalho et al., 2024) and reported as per mil (‰ ± one standard deviation) relative to the international measurement standard Vienna Standard Mean Ocean Water (VSMOW) according to Eq. (5),
where is the ratio of heavy (18O or 17O) to light (16O) isotopes in O2 in a sample, and is the ratio of heavy to light O isotopes in VSMOW. Briefly, seven 100 µL injections were made from each Exetainer headspace onto a 60 m Rt-Molsieve 5 Å PLOT column (Restek from BGB Analytik, 0.32 mm i.d., 30 µm film thickness), kept at 25 °C. Each GC–IRMS sequence consisted of 5–14 samples from enzyme assays, 10–12 procedural blanks, 5 quantification standards, and 3 air standards. Half of the blanks were measured at the beginning of the sequence and the other half at the end. Air standards were evenly distributed across the sequence and consisted of 150 µL ambient air in 12 mL of He. Air standards were used to verify instrument drift (which was never observed) and to perform a one-point calibration of the δ values to the VSMOW scale. The δ18O and δ17O values of O2 in air were assumed to be 23.8 ‰ and 12.1 ‰, respectively (Luz and Barkan, 2011; Laskar et al., 2019; Wostbrock et al., 2020). We recently showed that for δ18O values a one-point calibration is sufficient, while for δ17O values an additional correction factor must be used (de Carvalho et al., 2024). Procedural blanks were used to correct the measured δ values for blank contributions (Pati et al., 2016). Quantification standards were used to relate IRMS peak amplitudes to dissolved O2 concentrations and to correct δ values for instrument linearity (change in δ values with signal size) (Werner and Brand, 2001).
2.5 Data analysis
Initial O2 consumption rates were determined through linear regressions of the continuously measured O2 concentrations versus time during the initial, linear phase of enzyme assays. 18O KIEs and λ values were obtained from a single linear regression of all O2 isotope and concentration data from duplicate or triplicate enzyme assays according to Eqs. (6) and (7), respectively.
where [O2]0 and δ18O0 are the initial concentration and δ18O value of O2, respectively, measured in the control sample (see Sect. 2.3), and [O2], δ18O, and δ17O are the values measured in each enzyme assay sample at the different time points. All linear regressions were performed with Microsoft Excel, and errors are reported as 95 % confidence intervals. Km values were determined with a non-linear least square regression according to Eq. (8),
where νt is the O2 consumption rate at a given time point t, νmax is the maximum O2 consumption rate of an enzymatic reaction, [i]t is the initial (t=0) nominal concentration of an organic substrate (S) or the measured concentration of O2 at time t, and Km(i) is the Michaelis constant determined under constant initial O2 and variable initial substrate concentration (Km(S)) or under constant initial substrate and variable initial O2 concentration (Km(O2)). For all Km(S) values, as well as for Km(O2) values determined for KMO and laccase from T. versicolor with ABTS, regressions were performed with initial rates of O2 consumption (ν0) from different experiments against the nominal initial organic substrate concentrations ([S]0) or against the measured initial O2 concentrations ([O2]0), respectively. For all other enzymes, where product inhibition was not detected, we determined Km(O2) values from the continuous measurement of O2 concentration over time ([O2]t) in a single enzyme assay, as described previously (Pati et al., 2022). For each time point, νt was calculated as the derivative of the measured [O2]t vs. t (i.e., ) with Igor Pro software (WaveMetrics, Inc.). Km values and corresponding 95 % confidence intervals were determined with R software (R Core Team, 2023) using the MASS package (Venables and Ripley, 2002).
3.1 Kynurenine 3-monooxygenase
The flavin-dependent KMO was studied as an example for flavin monooxygenases, for which O2 reduction mechanisms have been well-described. Km(S) values for the native substrate L-kynurenine (0.012±0.003 mM) and the co-substrate NADPH (0.009±0.001 mM) were obtained from the literature (Crozier and Moran, 2007). Km(O2) and 18O KIEs were determined in experiments at optimal pH (7.5) and room temperature (23±1 °C), with saturating concentrations (see Sect. 2.3 for details) of L-kynurenine (1 mM) and NADPH (0.5 mM), as well as 2 mM dithiothreitol to prevent loss of KMO activity (Crozier and Moran, 2007). A Km(O2) of 6±4 µM was determined from initial rates of O2 consumption measured in 10 separate experiments with different initial O2 concentrations (25–260 µM) as shown in Fig. 1a. The 18O KIE and λ values were determined from the change in concentration, δ18O, and δ17O of O2 over time, measured in duplicate experiments. Figure 1b and c illustrate typical δ18O data from one experiment. The combined data from both experiments (see Sect. 2.5 for details) resulted in an 18O KIE of 1.0304±0.0003 and a λ value of 0.545±0.005.
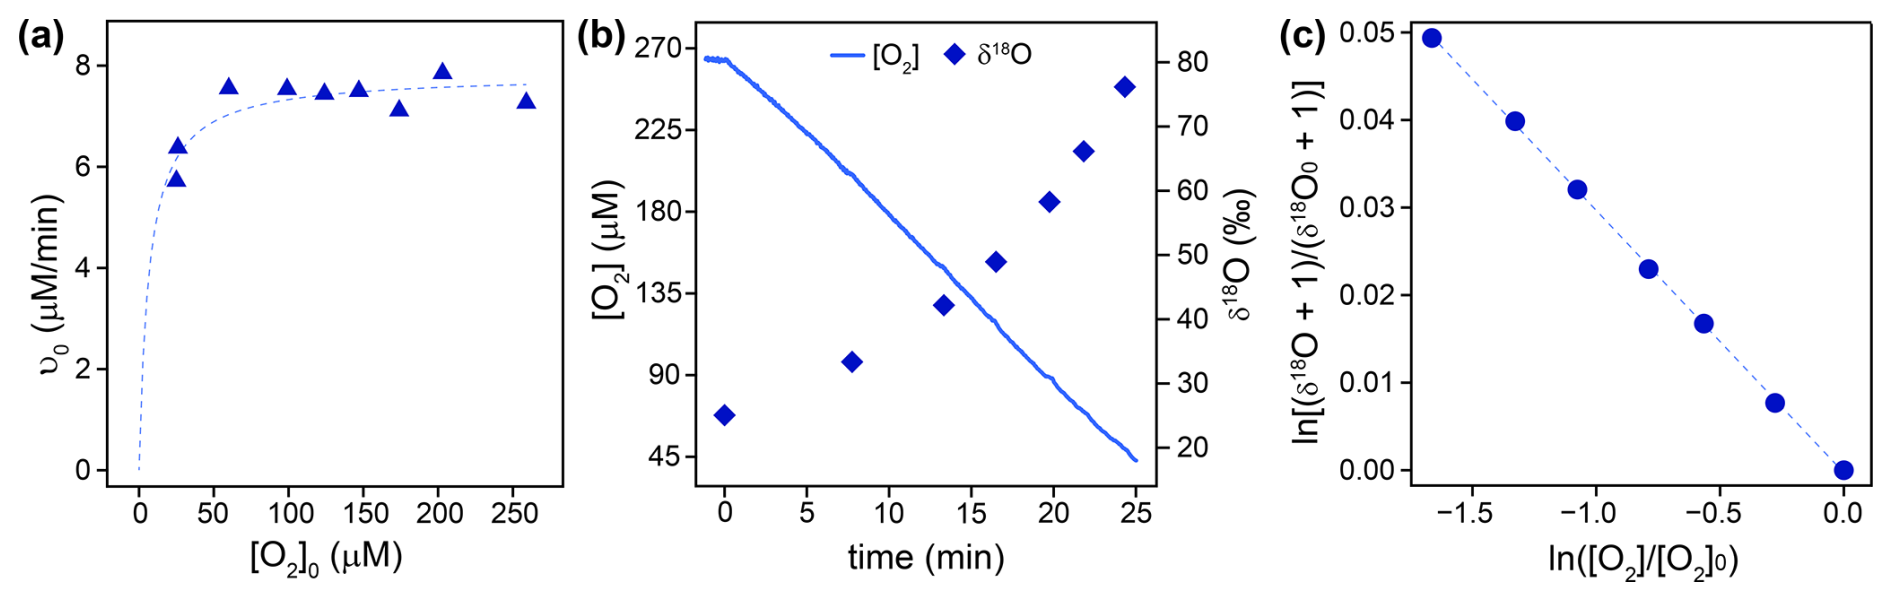
Figure 1(a) Initial rates of O2 consumption (ν0) by KMO (blue triangles) measured in 10 separate experiments with different initial O2 concentrations ([O2]0). The dotted line illustrates a non-linear least square regression fit according to Eq. (8), which was used to obtain Km(O2). (b) Continuously measured O2 concentrations (solid blue line) and δ18O values of O2 measured in discrete samples (blue diamonds) over time during an experiment with KMO. (c) Linearized and normalized data (δ18O vs. [O2]) from (b), where [O2]0 and represent the concentration and δ18O value of O2 at the beginning of the experiment. The dotted line shows a linear regression fit according to Eq. (6), from which the 18O KIE was obtained.
3.2 Flavin-dependent oxidases
Nine flavin-dependent oxidases were investigated. All of them convert O2 to H2O2 in the oxidative half-reaction and oxidize an organic substrate in the reductive half-reaction. Pyruvate oxidase was the only flavin-dependent oxidase that required cofactors for activity, namely, thiamine diphosphate, MnSO4, and FAD. Experiments with cholesterol oxidase were performed with the surfactant Thesit® and isopropanol due to the low water solubility of the native substrate cholesterol. Experiments with glucose and alcohol oxidase were each performed with their native and an alternative substrate: glucose and mannose, in the case of glucose oxidase, and methanol and ethanol, in the case of alcohol oxidase. Experiments to determine 18O KIEs for alcohol, choline, and L-lysine oxidase were performed at two different initial O2 concentrations (260±10 and 1200±100 µM).
Table 2Km(S), Km(O2), 18O KIEs, 18ε, and λ values determined for all enzymes investigated in this study with errors given as 95 % confidence intervals.
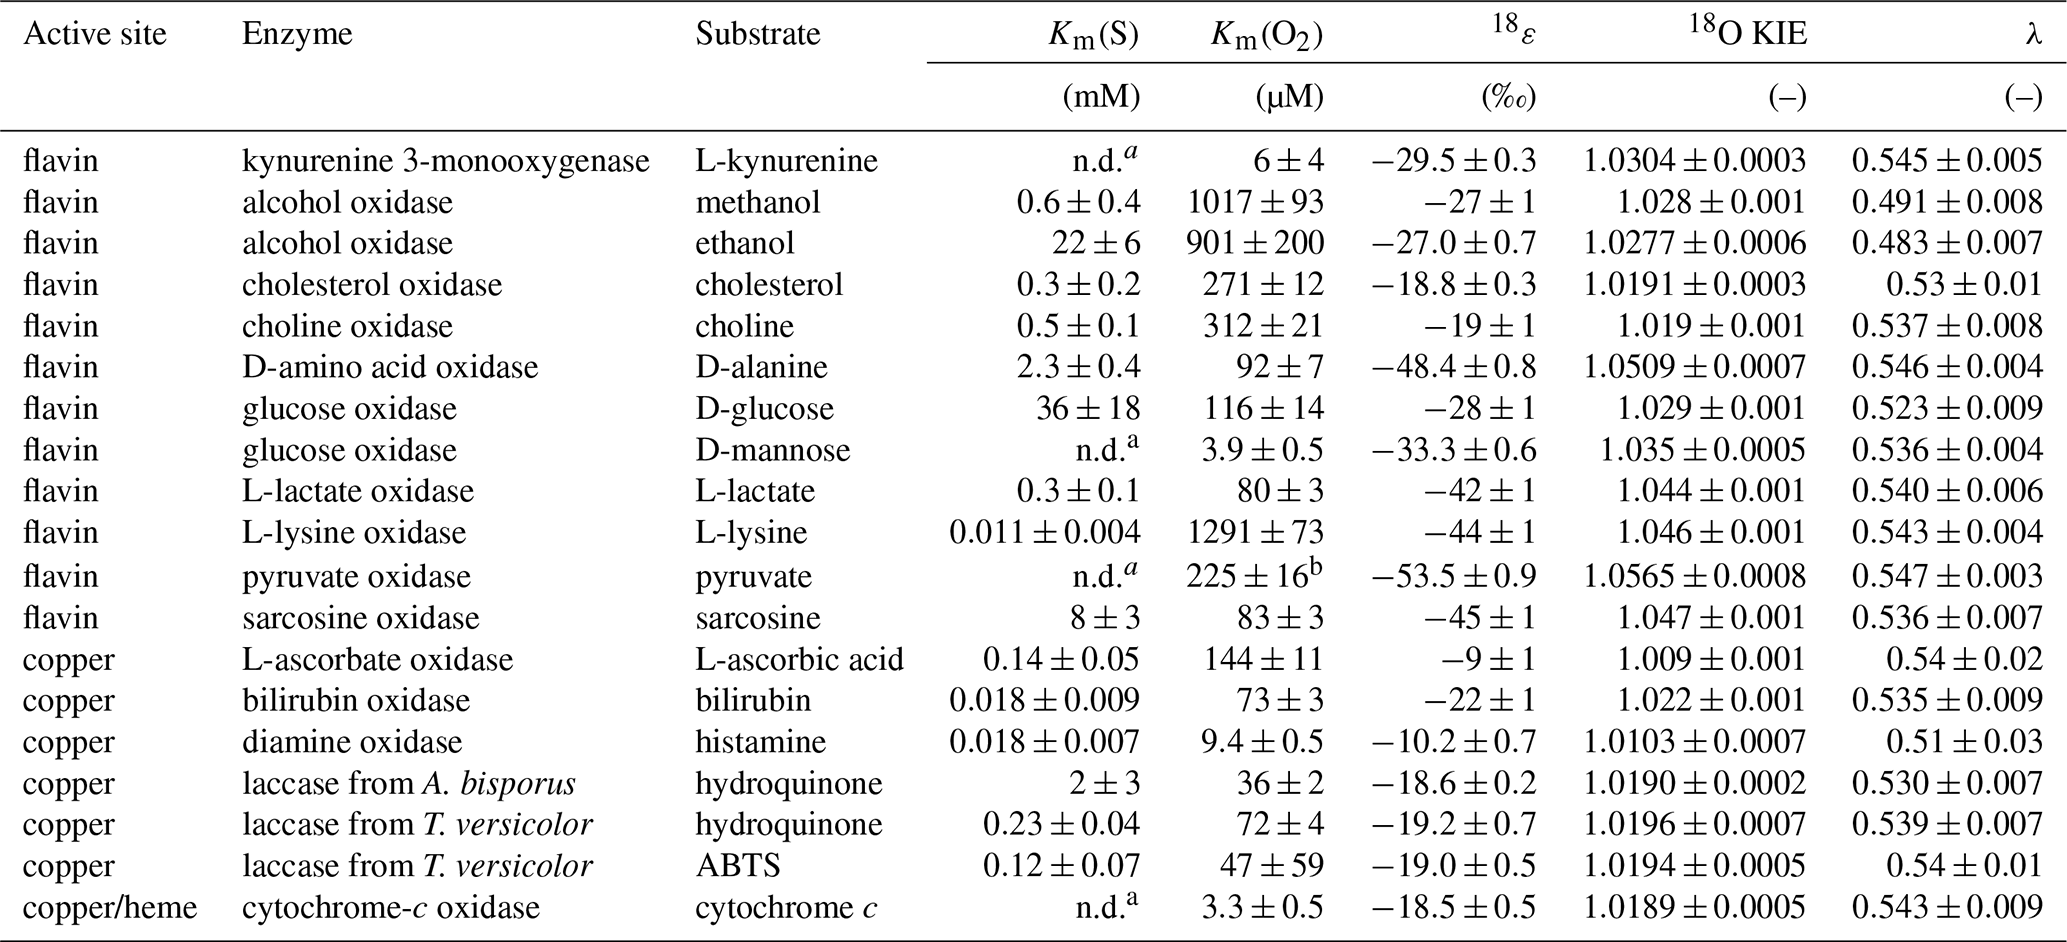
a not determined,
b tentative value (see Sect. 3.2.2).
3.2.1 Michaelis constants for organic substrates
Km(S) values were determined at 260±10 µM initial O2 concentration, as described for the Km(O2) value of KMO (see Sect. 3.1). However, initial rates of O2 consumption were measured at different initial organic substrate concentrations. For all flavin-dependent oxidases, except pyruvate oxidase, Km(S) values were determined for the native substrate, with values ranging from 0.011±0.004 mM for L-lysine oxidase to 36±18 mM for glucose oxidase (see Table 2). The Km(S) for pyruvate oxidase could not be determined as the initial rates of O2 consumption were not linear across all relevant pyruvate concentrations. For alcohol oxidase, the alternative substrate ethanol had a substantially higher Km(S) than the native substrate methanol (22±6 vs. 0.6±0.4 mM). For D-mannose, the alternative substrate of glucose oxidase, a Km(S) could not be determined, because initial rates of O2 consumption increased linearly with D-mannose concentrations up to the solubility limit of D-mannose.
3.2.2 Michaelis constants for O2
Km(O2) values were determined from complete O2 consumption experiments at saturating organic substrate concentrations (see Sect. 2.2), as shown in Fig. 2a and b for L-lactate oxidase as an example. Three flavin-dependent oxidases exhibited Km(O2) values exceeding air-saturated O2 concentrations in the presence of their native substrates, namely, alcohol oxidase with both substrates (1017±93 and 901±200 µM), choline oxidase (312±21 µM), and L-lysine oxidase (1291±73 µM). For these enzymes, Km(O2) values were obtained from complete O2 consumption experiments with initial O2 concentrations of 1200±100 µM. The remaining flavin-dependent oxidases displayed Km(O2) values between 80±3 and 260±12 µM (see Table 2). The Km(O2) value determined for pyruvate oxidase (225±16 µM) should be considered a tentative value as the effect of product inhibition could not be assessed, and the Km(S) could not be determined. Km(O2) values for alcohol and glucose oxidase were also determined at saturating concentrations of the alternative substrates, ethanol and D-mannose, respectively. In the case of alcohol oxidase, the Km(O2) values determined with methanol (1017±93 µM) and ethanol (901±200 µM) as substrates were equal within error. In contrast, glucose oxidase exhibited a significantly lower Km(O2) value with D-mannose as the substrate (3.9±0.5 µM) compared to the value determined with the native substrate D-glucose (116±14 µM).
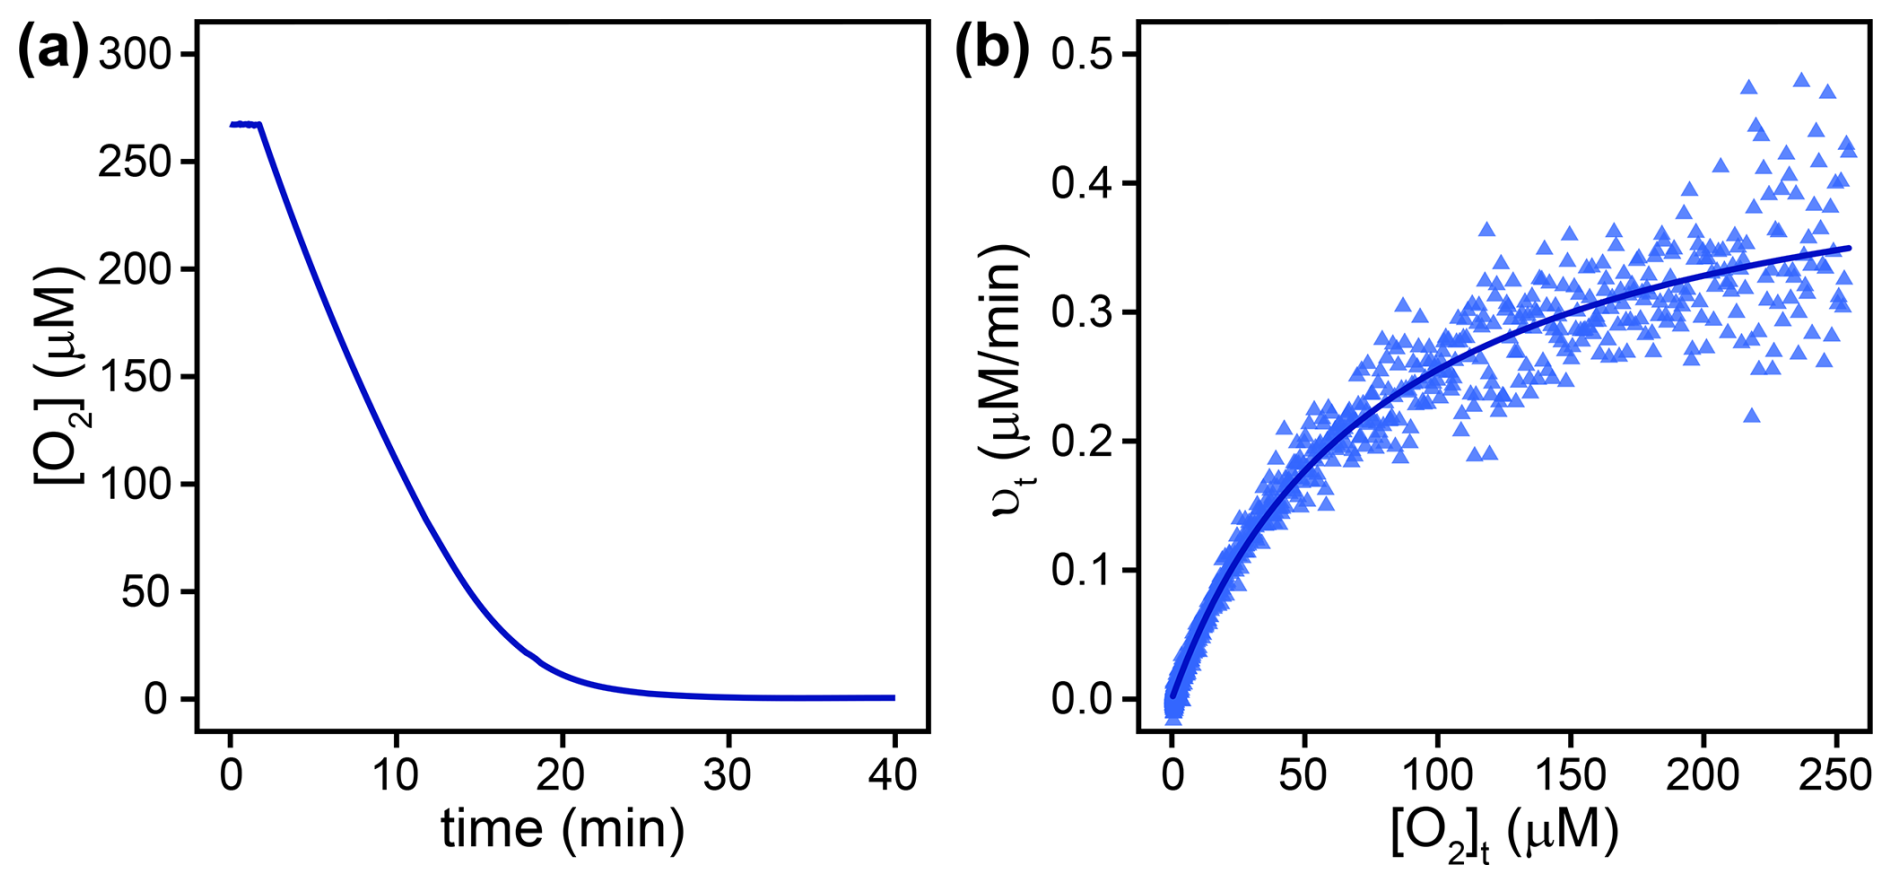
Figure 2(a) O2 concentration ([O2]) over time in a complete O2 consumption experiment with L-lactate oxidase. (b) Blue triangles show reactions rates (νt), derived by differentiating the data in (a) at corresponding O2 concentrations ([O2]t). The solid line shows a non-linear least square regression fit according to Eq. (8).
3.2.3 18O kinetic isotope effects and λ values
All 18O KIEs were determined in air-saturated buffer solutions with saturating native substrate concentrations, as described for KMO (see Sect. 3.1). The 18O KIEs of D-amino acid, L-lactate, L-lysine, pyruvate, and sarcosine oxidase ranged from 1.044±0.001 to 1.0565±0.0009 (see Table 2). In contrast, alcohol, cholesterol, choline, and glucose oxidase were associated with lower 18O KIEs, ranging from 1.0191±0.0003 to 1.029±0.001 (see Table 2). Because alcohol, choline, and L-lysine oxidase exhibited Km(O2) values above air saturation, their 18O KIEs were additionally determined in O2-purged buffer with initial O2 concentrations of 1200±100 µM (see Appendix B for details). For all three enzymes, the 18O KIEs were identical, within error, irrespective of the initial O2 concentration (data not shown). The 18O KIEs of alcohol oxidase with the two substrates methanol and ethanol were also identical within error (see Table 2). However, the 18O KIE determined for glucose oxidase with D-mannose was larger (1.0341±0.0005) than that determined with D-glucose (1.029±0.001). λ values ranged between 0.523±0.009 and 0.547±0.002 (see Table 2) for all flavin oxidases except for alcohol oxidase, which yielded lower λ values of 0.491±0.008 and 0.483±0.007 with methanol and ethanol, respectively.
3.3 Copper-dependent oxidases
Five copper-dependent oxidases were investigated, namely, laccases, L-ascorbate oxidase, and bilirubin oxidase, which convert O2 to water in the oxidative half-reaction, and diamine oxidase, which converts O2 to H2O2. All experiments were performed with native substrates, except experiments with laccase (see below), in a buffered, air-equilibrated solution at optimal pH and room temperature.
Laccases are multicopper oxidases that can oxidize a wide variety of substrates and lack a specific native substrate (Strong and Claus, 2011). Hydroquinone and ABTS were selected as substrates in this study, because they displayed different substrate-to-O2 consumption stoichiometries. Four ABTS molecules are required to reduce one molecule of O2, while only two hydroquinone molecules are required to reduce one molecule of O2 (see Appendix C). Despite these differences, laccase from T. versicolor yielded similar values for Km(S), Km(O2), and 18O KIEs irrespective of the substrate oxidized. With hydroquinone as the substrate, Km(S), Km(O2), and 18O KIEs were 0.23±0.04 mM, 72±4 µM, and 1.0196±0.0007, respectively. With ABTS as the substrate, Km(S), Km(O2), and 18O KIEs were 0.12±0.07 mM, 47±59 µM, and 1.0194±0.0005, respectively. Laccase from Agaricus bisporus exhibited a 10-fold higher Km(S) and a 2-fold lower Km(O2) with hydroquinone as the substrate compared to laccase from T. versicolor under identical conditions (see Table 2). However, the 18O KIEs were identical within error (1.0190±0.0002), and λ values ranged from 0.530±0.007 to 0.54±0.01 (see Table 2).
The three remaining copper-dependent oxidases, L-ascorbate, bilirubin, and diamine oxidase, displayed low Km(S) values between 0.14±0.05 mM and 0.018±0.007 mM (see Table 2). Km(O2) values decreased from 144±11 µM for L-ascorbate oxidase to 73±3 µM for bilirubin oxidase and 9.4±0.5 µM for diamine oxidase. L-Ascorbate and diamine oxidase exhibited the lowest observed 18O KIEs of all enzymes in this study with 1.0086±0.0006 and 1.0103±0.0007, respectively, while bilirubin oxidase had an 18O KIE of λ values ranged from 0.51±0.03 to 0.54±0.01 (see Table 2). During experimental assays with diamine oxidase, O2 production due to catalase contamination in the lyophilized diamine oxidase powder was detected. Catalase catalyzes the oxidation of H2O2 to H2O and O2, which could lead to inaccurate measurements of O2 consumption by diamine oxidase. To address this potential interference, 18O KIEs for diamine oxidase were determined in the presence of the catalase contamination alone and with the addition of excess horseradish peroxidase and ascorbic acid. Horseradish peroxidase catalyzes the oxidation of H2O2 and ascorbic acid to H2O and dehydroascorbic acid. In the presence of excess horseradish peroxidase, H2O2 was converted to H2O faster than catalase could reduce H2O2 to H2O and O2. The 18O KIEs determined for diamine oxidase were found to be identical within error, regardless of catalase activity (data not shown).
3.4 Cytochrome-c oxidase
Cytochrome-c oxidase is a heme-copper-dependent oxidase, in which the heme a3 subunit initially binds O2 (Yoshikawa and Shimada, 2015). The Km(S) was not determined, but all experiments were performed with 25 µM cytochrome c and 3 mM ascorbic acid, to continuously reduce the product ferricytochrome c back to the substrate ferrocytochrome c. Km(S) values for ferrocytochrome c are reported to be 1.48 µM or lower (Merle and Kadenbach, 1982). Therefore, the 25 µM of cytochrome c used is considered a saturating substrate concentration. The Km(O2) was 3.3±0.5 µM, the 18O KIE was 1.0189±0.0005, and the λ value was 0.543±0.009 (see Table 2).
4.1 18O KIEs of flavin-dependent O2-consuming enzymes
Flavin-dependent O2-consuming enzymes utilize derivatives of the vitamin riboflavin as cofactors in their active sites. The organic flavin cofactor can be present in three different redox states: fully oxidized flavin (FL), radical flavin intermediate (FLH•), and fully reduced flavin (FLH2 or FLH−). The oxidation of FLH2 to FL releases two electrons and two protons, which can be used for the reduction of O2 (Massey, 2002), as illustrated in a simplified catalytic cycle in Fig. 3. The reduction of O2 by both flavin-dependent monooxygenases and oxidases starts with an outer-sphere single-electron transfer from FLH2 (or FLH−) to O2 forming FLH• and . A recombination of the two radical species then forms a peroxyflavin intermediate (FLOO−), which can be protonated to a hydroperoxyflavin intermediate (FLOOH). In all known flavin-dependent monooxygenases, the (hydro)peroxyflavin can be detected and is responsible for substrate hydroxylation with concomitant O–O bond cleavage to form a hydroxyflavin (FLOH) (Massey, 2002) (see blue arrows in Fig. 3). In a subsequent step, FLOH reacts to FL by releasing H2O (see blue arrows in Fig. 3). In flavin-dependent oxidases, FLOO(H) has not been observed directly, and its formation remains a matter of ongoing debate (Massey, 2002). In addition to FL formation similar to the monooxygenation pathway (FLH• and recombination to FLOO(H) and subsequent release of hydrogen peroxide), FL can also be formed through a sequence of outer-sphere electron and proton transfer steps from FLH• to without covalent-bond formation between the flavin and O2 (see green arrows in Fig. 3) (Massey, 2002; Mattevi, 2006; Chaiyen et al., 2012). The reduction of FL to FLH2 is coupled with substrate or co-substrate oxidation in oxidases and monooxygenases, respectively, to complete the catalytic cycle (see Fig. 3).
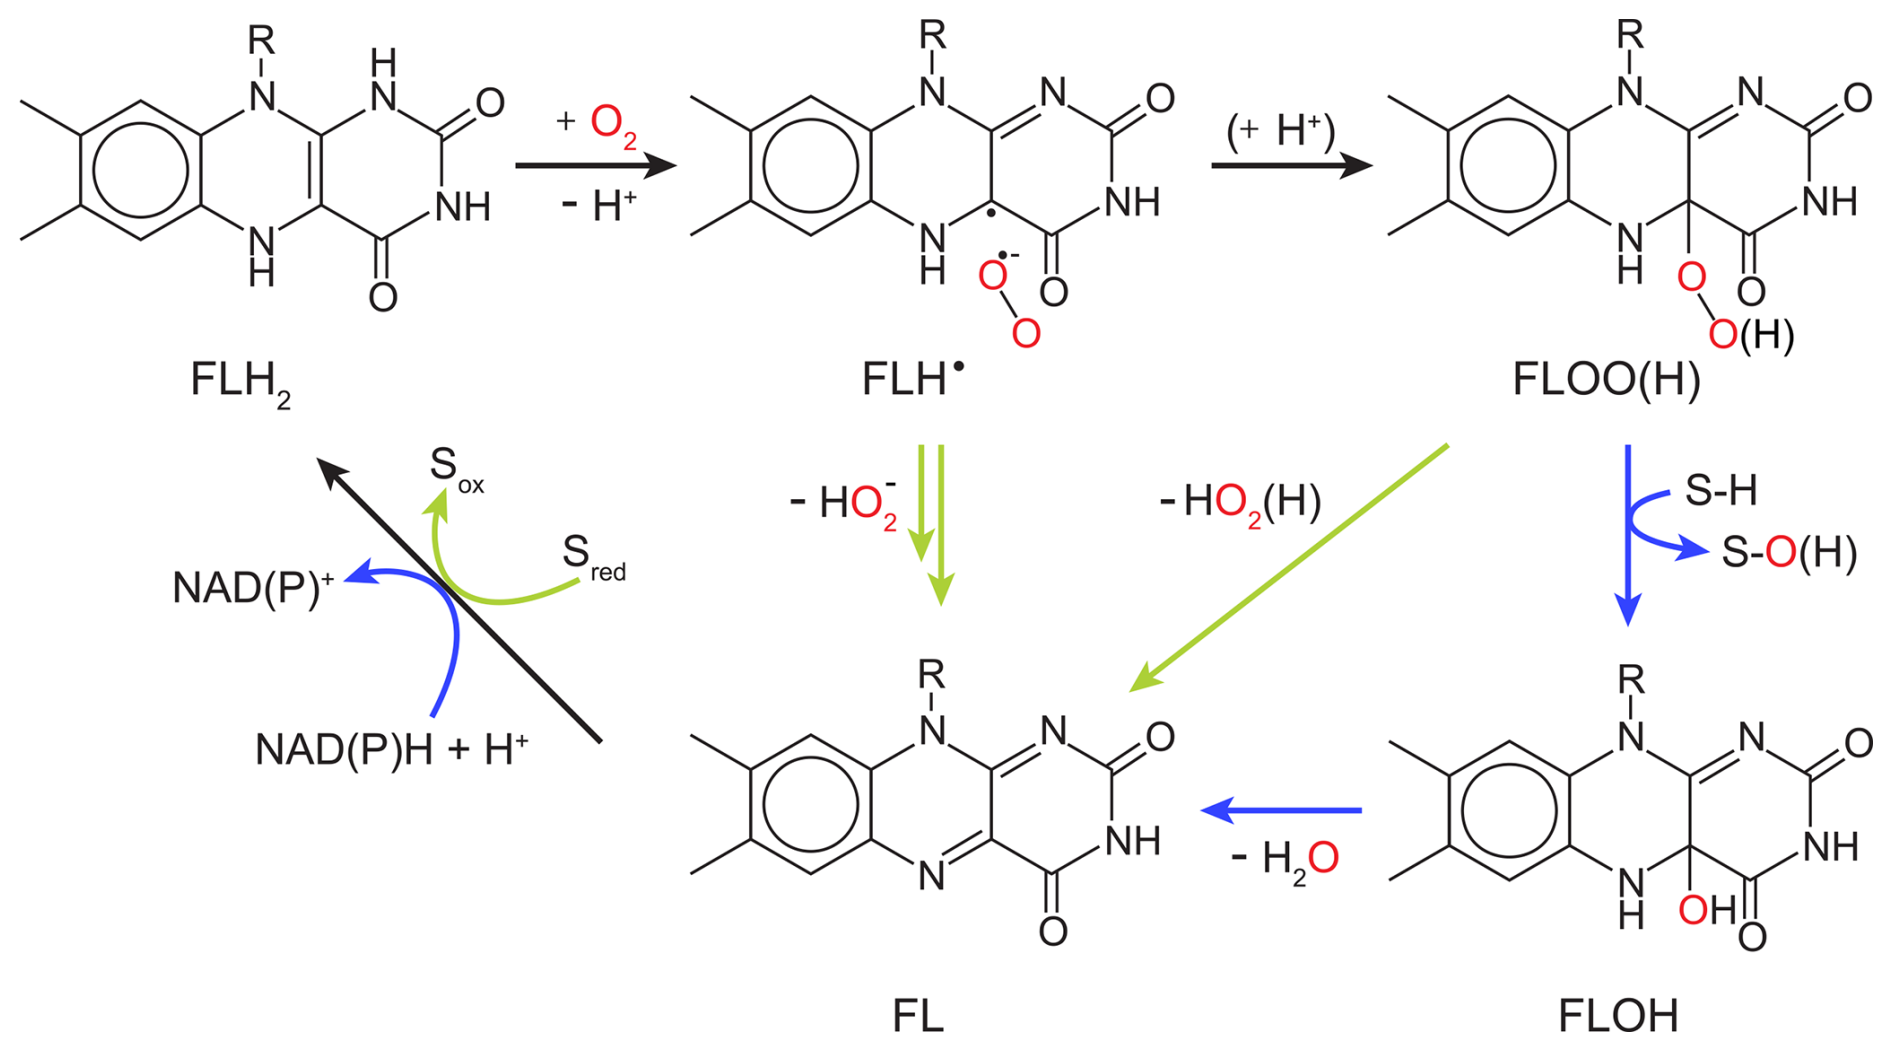
Figure 3O2 reduction mechanism of flavin-dependent oxidases and monooxygenases. Black arrows indicate common reaction steps, blue arrows indicate reaction steps performed by monooxygenases, and green arrows indicate reaction steps performed by oxidases. Sred and S–H represent an organic substrate before oxidation by an oxidase or monooxygenase, respectively, while Sox and S–O(H) represent the corresponding organic reaction products.
In this study, we determined the first 18O KIE for a flavin-dependent monooxygenase, namely, KMO, which was 1.0305±0.0003. The magnitude of this isotope effect indicates that changes in bond order of O2 occur during the rate-limiting step of the reaction between KMO and O2, excluding O2 binding and product release as possible rate-limiting steps. Hence, the rate-limiting reaction step of KMO is the formation of , FLOO−, FLOOH, or S–OH and FLOH (see blue arrows in Fig. 3). 18O EIEs have been calculated for the reversible formation of , , H2O2, and two H2O from O2 as 1.033, 1.034, 1.009, and 0.968, respectively (Roth and Klinman, 2005). When comparing experimental 18O KIEs to calculated 18O EIEs, it is generally assumed that a measured 18O KIE (i) reflects intrinsic 18O KIEs of all electron and proton transfer steps up to, and including, the rate-limiting (i.e., first irreversible) step and (ii) is similar to, but not larger than, the 18O EIE calculated for the formation of the product/intermediate after the rate-limiting step (Roth and Klinman, 2005; Roth, 2007). Based on these 18O EIEs, the reduction of O2 by KMO is thus likely characterized by a rate-limiting or FLOO− formation.
Similar magnitudes of 18O KIEs compared to KMO have been determined in this study for glucose oxidase: 1.029±0.001 and 1.0341±0.0005 with D-glucose and D-mannose as the substrate, respectively. These values agree with previous studies of the same enzyme (Su and Klinman, 1998). Based on 18O EIEs, solvent isotope effects, and viscosity effects, Roth and Klinman (2003) suggested the initial outer-sphere electron transfer from FLH− to O2 to be the rate-limiting step of O2 reduction by glucose oxidase. The 18O KIEs determined for cholesterol, choline, and alcohol oxidase in this study were similar to, or lower than, those determined for KMO and glucose oxidase (1.0191–1.028; see Table 2). Because these isotope effects were still larger than the calculated 18O EIE for H2O2 or H2O formation (1.009 and 0.968, respectively), these enzymes likely also have a rate-limiting or FLOO− formation. In contrast, D-amino acid, L-lactate, L-lysine, pyruvate, and sarcosine oxidase exhibited much larger 18O KIEs (1.044–1.0565; see Table 2). These distinctively high 18O KIEs clearly suggest a different rate-limiting step than previously discussed, even though the first outer-sphere electron transfer to O2 has also been proposed as the rate-limiting step for D-amino acid oxidase (Kiss and Ferenczy, 2019). To date, 18O KIEs of this magnitude have only been measured for L-amino acid (1.0478) and D-amino acid oxidase (1.053) by Cheah et al. (2014). The only 18O EIE of similar magnitude was calculated for the formation of , a two-electron reduction product of O2, with a value of 1.050 (Roth and Klinman, 2003).
Considering the two possible reaction mechanisms described in Fig. 3 for flavin-dependent oxidases, we suggest that glucose, cholesterol, choline, and alcohol oxidase (like KMO) reduce O2 through the formation of FLOO(H) with a rate-limiting formation of either or FLOO−. The same applies to glycolate oxidase with an 18O KIE of 1.023 (Guy et al., 1993; Ribas-Carbo et al., 1995; Cheah et al., 2014). However, for D-amino acid, L-amino acid, L-lactate, L-lysine, pyruvate, and sarcosine oxidase, we suggest the alternative O2 reduction mechanism, where FL is formed directly from FLH• and without the formation of FLOO(H) (see green arrows in Fig. 3). Still, the exact nature of the rate-limiting step (a second single electron transfer, a proton-coupled electron transfer, or a hydrogen atom transfer) in this alternative O2 reduction mechanism cannot be inferred from the current experimental evidence. It is also possible that the rate-limiting step differs among the six oxidases with 18O KIEs between 1.044 and 1.057 or that the first electron transfer to O2 is partially rate-limiting in some of these enzymes, which could explain the lower-than-expected 18O KIEs for such a rate-limiting step.
For KMO, cholesterol, choline, and glycolate oxidase, as well as glucose oxidase with three different substrates, which we consider to share a common reaction mechanism, we found a tentative correlation between 18O KIEs and the corresponding Km(O2) values (see Fig. 4). The Km(O2) values for glucose oxidase with the substrate 2-deoxy-D-glucose and for glycolate oxidase were reported to be 25±5 and 210 µM, respectively (Macheroux et al., 1991; Roth and Klinman, 2003). Based on the limited number of data points, we do not consider the correlation to be necessarily linear as shown in Fig. 4. However, the data clearly indicate that enzymes with lower Km(O2) values have higher 18O KIEs, ranging from choline oxidase with a Km(O2) of 298±20 µM and an 18O KIE of 1.0194±0.0006 to glucose oxidase with D-mannose as the substrate with a Km(O2) of 3.9±0.6 µM and an 18O KIE of Since 18O KIEs reflect the ratios of reaction rates of the different O2 isotopologues, a correlation between 18O KIE and Km(O2) only makes sense when we consider the kinetic properties of the Michaelis constant (Northrop, 1998). In O2-consuming enzymes, O2 typically binds to the enzyme after binding of the organic substrate (oxygenases) or in a ping-pong mechanism (oxidases) (Malmstrom, 1982; Romero et al., 2018). Thus, we can describe the consumption of O2 by these enzymes kinetically with a two-step reaction, where O2 first binds reversibly to the enzyme, followed by an irreversible reduction step of O2. In such a case, the measured 18O KIE depends on the intrinsic 18O KIE and 18O EIE of the O2 binding step, the 18O KIE of the irreversible reduction step, and the forward commitment to catalysis. This commitment factor is the ratio of two elementary reaction rates, namely, the rate of the irreversible reduction step divided by the rate of the backward reaction of O2 binding (see Appendix D for details). In fact, as long as the reduction step is slower than the backward binding step, and thus the commitment factor is below 1, the measured 18O KIE will show an apparently linear trend with an increasing commitment factor, similar to the trend observed in Fig. 4. For this set of enzymes, it thus appears that Km(O2) is a proxy for the forward commitment to catalysis or the extent to which O2 binding contributes to the overall reaction rate. One can indeed mathematically relate Km(O2) to the commitment factor, as shown in Appendix D, and reconcile the observed decrease in 18O KIE with increasing Km(O2) values if (i) O2 binding and unbinding is faster than O2 reduction for all enzymes but with different degrees of forward commitment, (ii) the intrinsic 18O KIE for O2 reduction is larger than for O2 binding while all intrinsic isotope effects are close to identical for these enzymes, and (iii) the dissociation constant (the ratio of backward and forward reaction rates of O2 binding) of these enzymes varies much less than Km(O2). If O2 binding does not contribute to the overall rate, the apparent 18O KIE is expected to reflect the intrinsic 18O KIE of the rate-limiting O2 reduction step. Accordingly, the intrinsic 18O KIE for the rate-limiting step of or FLOO− formation is likely between 1.030 and 1.035, based on both calculated 18O EIEs for these reactions (1.033–1.034) (Roth and Klinman 2003) and on the maximum 18O KIEs observed for glucose oxidase (1.0341±0.0005) and KMO (1.0304±0.0003). The lower 18O KIEs (1.019–1.023), particularly for cholesterol, choline, and glycolate oxidase, can thus still arise from a rate-limiting or FLOO− formation but with increasing contributions from a relatively slower O2 binding to the overall reaction rate that is likely associated with an intrinsic isotope effect close to unity because, upon binding, no bond changes occur in O2.
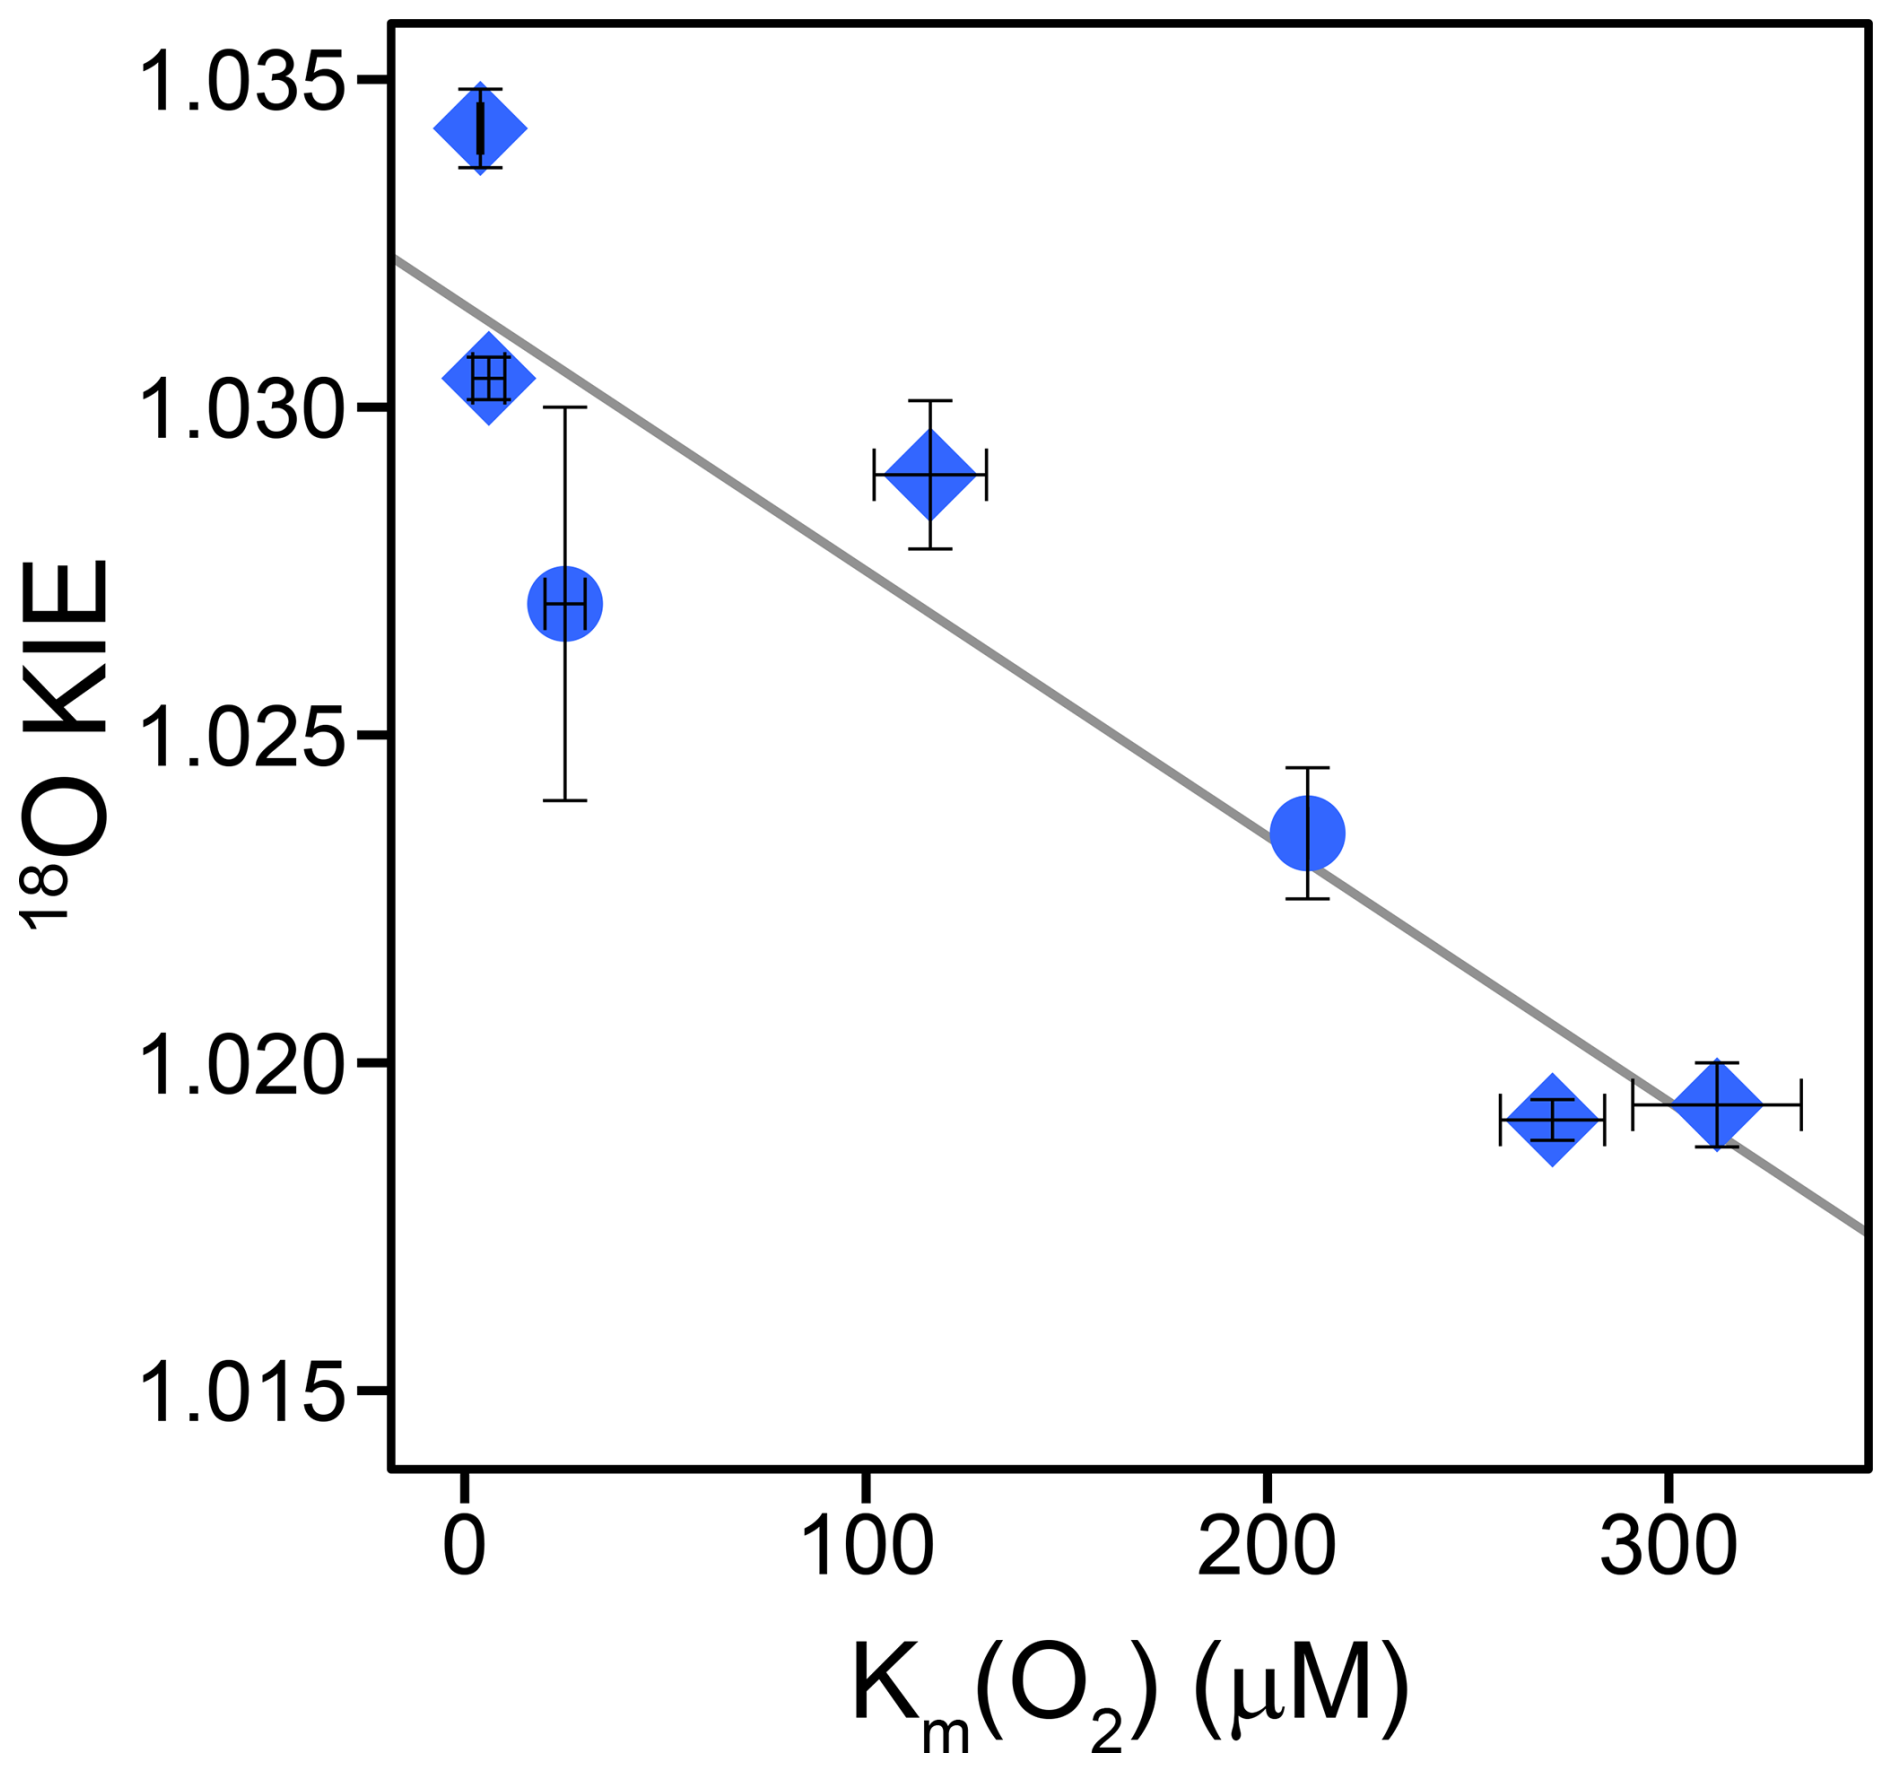
Figure 4Correlation of 18O KIEs and corresponding Km(O2) values of glucose, choline, cholesterol, and glycolate oxidase as well as KMO. Blue diamonds represent the 18O KIEs and corresponding Km(O2) values determined in this study. Blue circles represent the 18O KIEs and corresponding Km(O2) values obtained from literature for glycolate oxidase and for glucose oxidase with 2-deoxy-D-glucose as the substrate (Macheroux et al., 1991; Su and Klinman, 1999; Roth and Klinman, 2003; Cheah et al., 2014). Error bars indicate 95 % confidence intervals. The solid line indicates a tentative linear correlation.
Alcohol oxidase, with either methanol or ethanol as the substrate, was the only enzyme with 18O KIEs close to or below 1.03 that did not follow the observed trend between Km(O2) values and 18O KIEs discussed above. Km(O2) values of alcohol oxidase (1017±93 and 901±200) were substantially larger than Km(O2) values of all other flavin-dependent enzymes studied, except for L-lysine oxidase, which likely has a different O2 reduction mechanism (formation of ). Interestingly, alcohol oxidase was the only enzyme tested in this study that exhibited particularly low λ values between 0.483±0.007 and 0.488±0.009 (see Table 2). These values are not only lower than typical λ values (0.51–0.53) but also significantly lower than λ values observed for all other enzymes in this study, which ranged from 0.51±0.03 to 0.547±0.002 (see Table 2). We note that λ values determined for the majority of enzymes in this study are close to but slightly higher than previously determined λ values of 0.51–0.53 for biological O2 consumption (Young et al., 2002; Luz and Barkan, 2005; Ash et al., 2020; Hayles and Killingsworth, 2022). It is possible that the applied δ17O scale correction factor from de Carvalho et al. (2024) leads to a slight overestimation of λ values. Regardless of this uncertainty in the δ17O scale correction factor, the λ values determined for alcohol oxidase are clearly much lower than any previously determined λ values for biological O2 consumption and significantly lower than those for any other enzyme studied here. This difference in λ values suggests a unique O2 reduction mechanism for alcohol oxidase, differing from the mechanism proposed for enzymes that exhibit a correlation between 18O KIEs and Km(O2) values. However, this reduction mechanism cannot be further elucidated in this study.
4.2 18O KIEs of metal-dependent O2-consuming enzymes
Unlike flavin-dependent O2-consuming enzymes, which have a relatively conserved active site and catalytic mechanism, iron- and copper-dependent O2-consuming enzymes are known to employ a wide variety of different active-site structures and catalytic mechanisms (Costas et al., 2004; Blank et al., 2010; Liu et al., 2014; Solomon et al., 2014; Huang and Groves, 2018). For the five copper-dependent oxidases tested in this study and for six (out of seven) copper-dependent monooxygenases and oxidases examined in previous research, the 18O KIEs grouped closely around two main values. Namely, L-ascorbate and diamine oxidase from this study, as well as tyrosinase, bovine serum amine oxidase, and amine oxidase from Hansenula polymorpha, were characterized by 18O KIEs between 1.0086 and 1.011 (see Tables 2 and S1 in the Supplement) (Feldman et al., 1959; Su and Klinman, 1998; Welford et al., 2007). Conversely, the 18O KIEs of bilirubin oxidase and the two laccases from this study, as well as peptidylglycine monooxygenase, dopamine β-monooxygenase, and galactose oxidase, ranged between 1.0173 and 1.223 (see Tables 2 and S1) (Tian et al., 1994; Francisco et al., 2003; Humphreys et al., 2009). The only copper-dependent enzyme studied so far that fell in between these two clusters is pea-seedling amine oxidase with an 18O KIE of 1.014±0.001 (Mukherjee et al., 2008). The two groups of copper-dependent enzymes defined by the two groups of 18O KIE values both contain a mix of monooxygenases and oxidases (see Fig. 5). The monooxygenases peptidylglycine monooxygenase, dopamine β-monooxygenase, and tyrosinase catalyze the incorporation of one O atom from O2 into their substrate. Multicopper oxidases, including laccase, L-ascorbate oxidase, and bilirubin oxidase, reduce O2 to two H2O molecules. The cofactor-dependent mononuclear copper enzymes (copper amine oxidases including diamine oxidase and galactose oxidase) reduce O2 to H2O2 (Mure et al., 2002; Humphreys et al., 2009). Despite these differences, all copper-dependent O2-consuming enzymes form common copper–oxygen intermediates, namely, copper-superoxo (Cu(II)-OO•), copper-peroxo (Cu(II)-OO−), and copper-hydroperoxo (Cu(II)-OOH) species. Figure 6 shows the electron and proton transfer steps involved in the formation of these intermediates. 18O EIEs for the reversible formation of these three copper–oxygen species have been determined to be 1.009–1.010 for copper-superoxo, 1.018–1.031 for copper-peroxo, and 1.025–1.026 for copper-hydroperoxo intermediates (Mukherjee et al., 2008; Humphreys et al., 2009). The copper-dependent enzymes that exhibited 18O KIEs between 1.0173 and 1.223 are thus likely characterized by a rate-limiting step involving the formation of a copper-peroxo or copper-hydroperoxo intermediate. Accordingly, studies of peptidylglycine and dopamine β-monooxygenase, which exhibited 18O KIEs of 1.0173±0.0009 and 1.0197±0.0003, respectively, suggested a rate-limiting hydrogen atom abstraction by a copper-superoxo intermediate to form a copper-hydroperoxo species (Evans et al., 2003; Osborne and Klinman 2011). The 18O KIE of 1.019±0.001 determined for galactose oxidase by Humphreys et al. (2009) was also attributed to a rate-limiting hydrogen atom abstraction by a copper-superoxo intermediate. The rate-limiting steps of multicopper oxidases, such as bilirubin oxidase and laccase, have not been firmly established. However, based on the 18O KIEs determined in this study and the comparison with the three enzymes with similar 18O KIEs, a rate limiting copper-hydroperoxo formation by hydrogen atom abstraction seems likely. Similarly, the copper-dependent enzymes that displayed 18O KIEs between 1.0086 and 1.011 are likely characterized by a rate-limiting copper-superoxo formation, based on comparisons with 18O EIEs (1.009–1.010). Accordingly, copper-superoxo formation has been suggested as the rate-limiting step for bovine serum amine oxidase and amine oxidase from H. polymorpha (Su and Klinman, 1998; Mills et al., 2002). It can thus be assumed that tyrosinase, as well as L-ascorbate and diamine oxidase, also has a rate-limiting step involving the formation of a copper-superoxo intermediate. For pea-seedling amine oxidase, for which an 18O KIE of 1.014±0.001 was determined (Mukherjee et al., 2008), a rate-limiting step involving copper-peroxo formation has also been proposed. However, the preceding copper-superoxo formation is partially rate-limiting, which acts to lower the observed 18O KIE value from the expected 18O EIE range of 1.018–1.031 (Mukherjee et al., 2008).
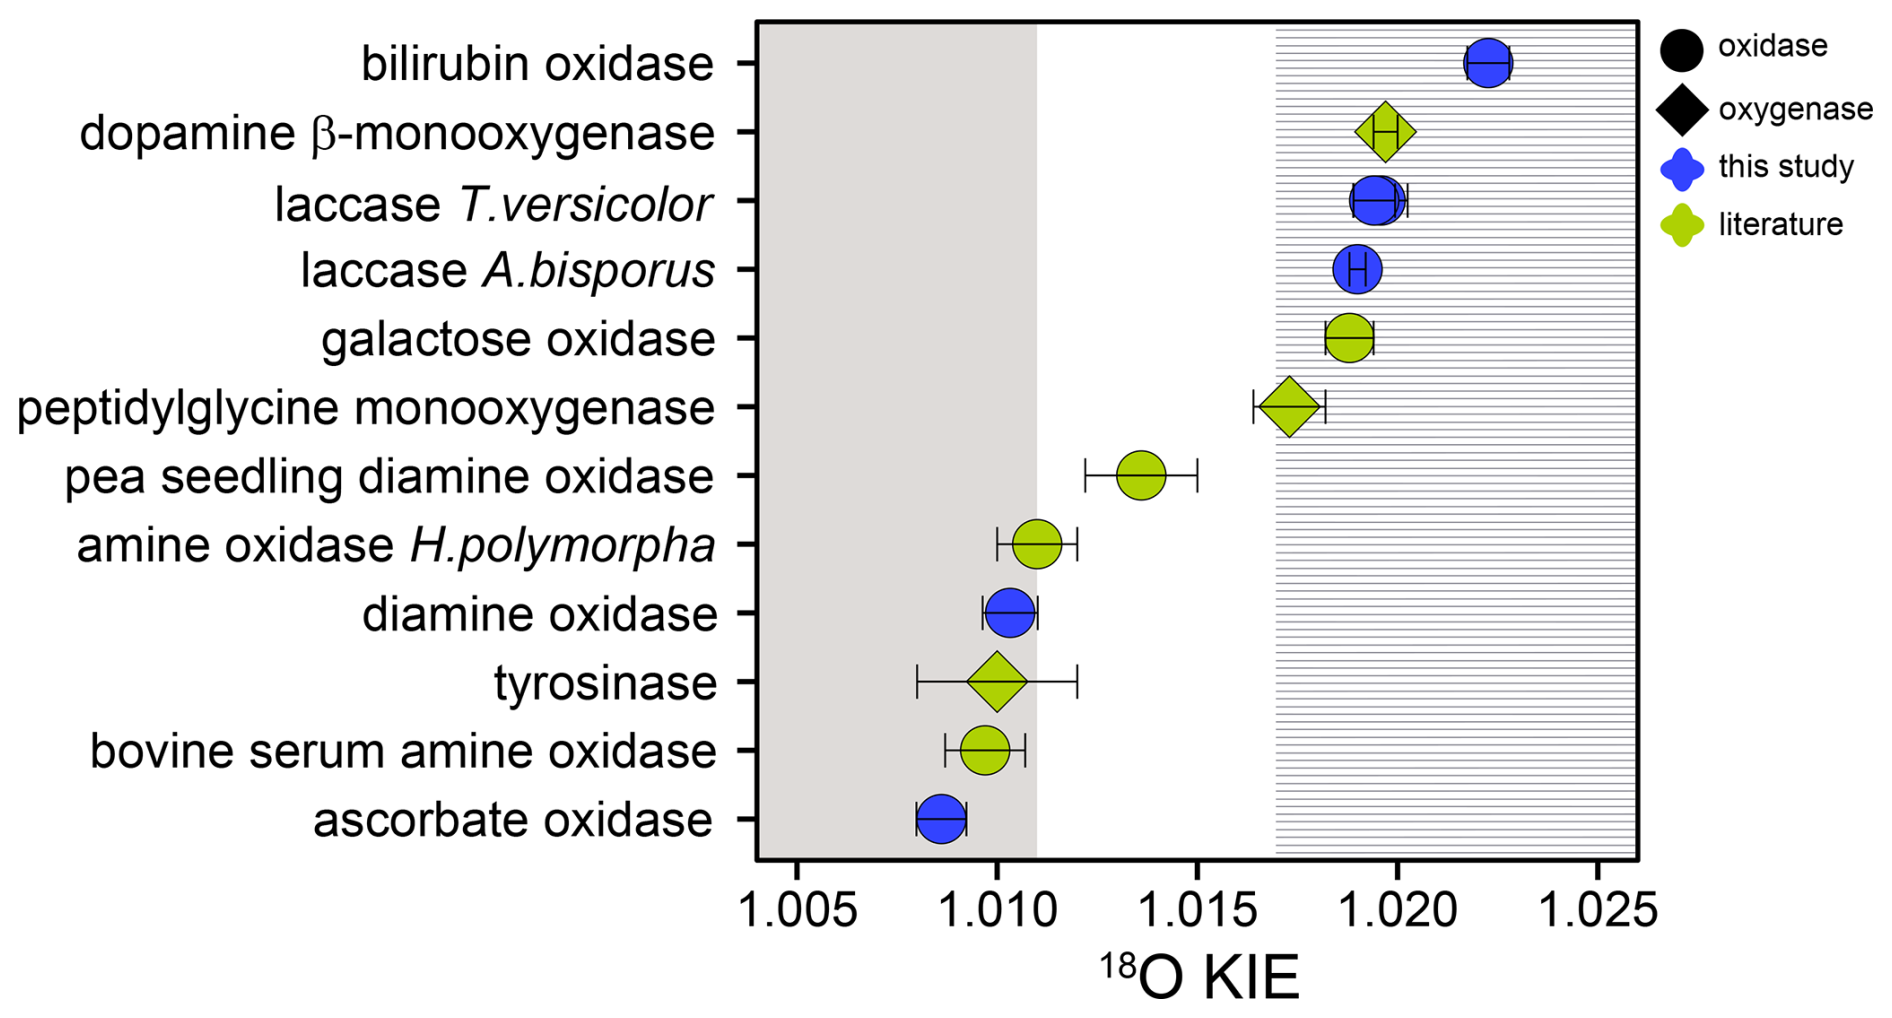
Figure 518O KIEs for copper-dependent O2-consuming oxidases (circles) and monooxygenases (diamonds) reported in this (blue) and previous studies (green) (Feldman et al., 1959; Tian et al., 1994; Su and Klinman, 1998; Francisco et al., 2003; Welford et al., 2007; Mukherjee et al., 2008; Humphreys et al., 2009). Error bars indicate 95 % confidence intervals or standard deviations. Grey and dashed areas represent expected 18O KIE ranges for a rate-limiting copper-superoxo formation (grey area) and hydrogen atom abstraction by a copper-superoxo species (dashed area) (Mukherjee et al., 2008; Humphreys et al., 2009).
The 18O KIE of 1.0189±0.0005 determined here for cytochrome-c oxidase is consistent with previous reports from the literature (Ribas-Carbo et al., 1995; Cheah et al., 2014). Cytochrome-c oxidase is a hetero-di-nuclear copper-heme oxidase, in which a copper and a heme-iron are involved in the O2-reduction mechanism (Yoshikawa and Shimada, 2015). Iron-dependent enzymes form similar reactive oxygen intermediates, as described above for copper-dependent enzymes, including iron-superoxo (Fe(III)-OO•) and iron-hydroperoxo (Fe(III)-OOH) intermediates (see Fig. 6). In addition, iron can be oxidized further in certain active-site structures to a high-valent iron-oxo (Fe(IV)=O) intermediate. Calculated or measured 18O EIEs are also similar in magnitude, with 1.004–1.009 for iron-superoxo formation, 1.011–1.017 for iron-hydroperoxo formation, and 1.029 for iron-oxo formation (Tian and Klinman, 1993; Mirica et al., 2008). Previous studies have determined 18O KIEs for 12 iron-dependent O2-consuming enzymes showing a continuous range from 1.009±0.001 for soybean lipoxygenase (Guy et al., 1992) to 1.0281±0.0004 for alternative oxidase (Cheah et al., 2014). Observed 18O KIEs for iron-dependent enzymes have consistently reflected the intrinsic 18O KIE of the rate-limiting step, with increasing 18O KIEs indicating a higher degree of O2 reduction. For example, the 18O KIE of soybean lipoxygenase (1.009–1.012) reflects a rate-limiting electron transfer to O2 to form an iron-superoxo species (Guy et al., 1992; Knapp and Klinman, 2003). The 18O KIE of 1.015±0.001 determined for hydroxyethyl phosphonate dioxygenase reflects a rate-limiting iron-hydroperoxo formation by hydrogen atom abstraction (Zhu et al., 2015). Finally, the 18O KIE of 1-aminocyclopropyl-1-carboxylic acid oxidase (1.0215±0.005) reflects a rate-limiting iron-oxo formation (Mirica et al., 2008). For cytochrome-c oxidase, a rate-limiting hydrogen atom abstraction by an iron-bound superoxo species with concomitant O–O bond cleavage and formation of a high-valent iron-oxo intermediate has been suggested (Yoshikawa and Shimada, 2015). The corresponding 18O KIE of 1.0189±0.0005 determined in this study is in agreement with both a hydrogen atom abstraction by a metal-superoxo species, as seen for many of the copper-dependent enzymes, as well as with the formation of a high-valent iron-oxo species as described for 1-aminocyclopropyl-1-carboxylic acid oxidase.
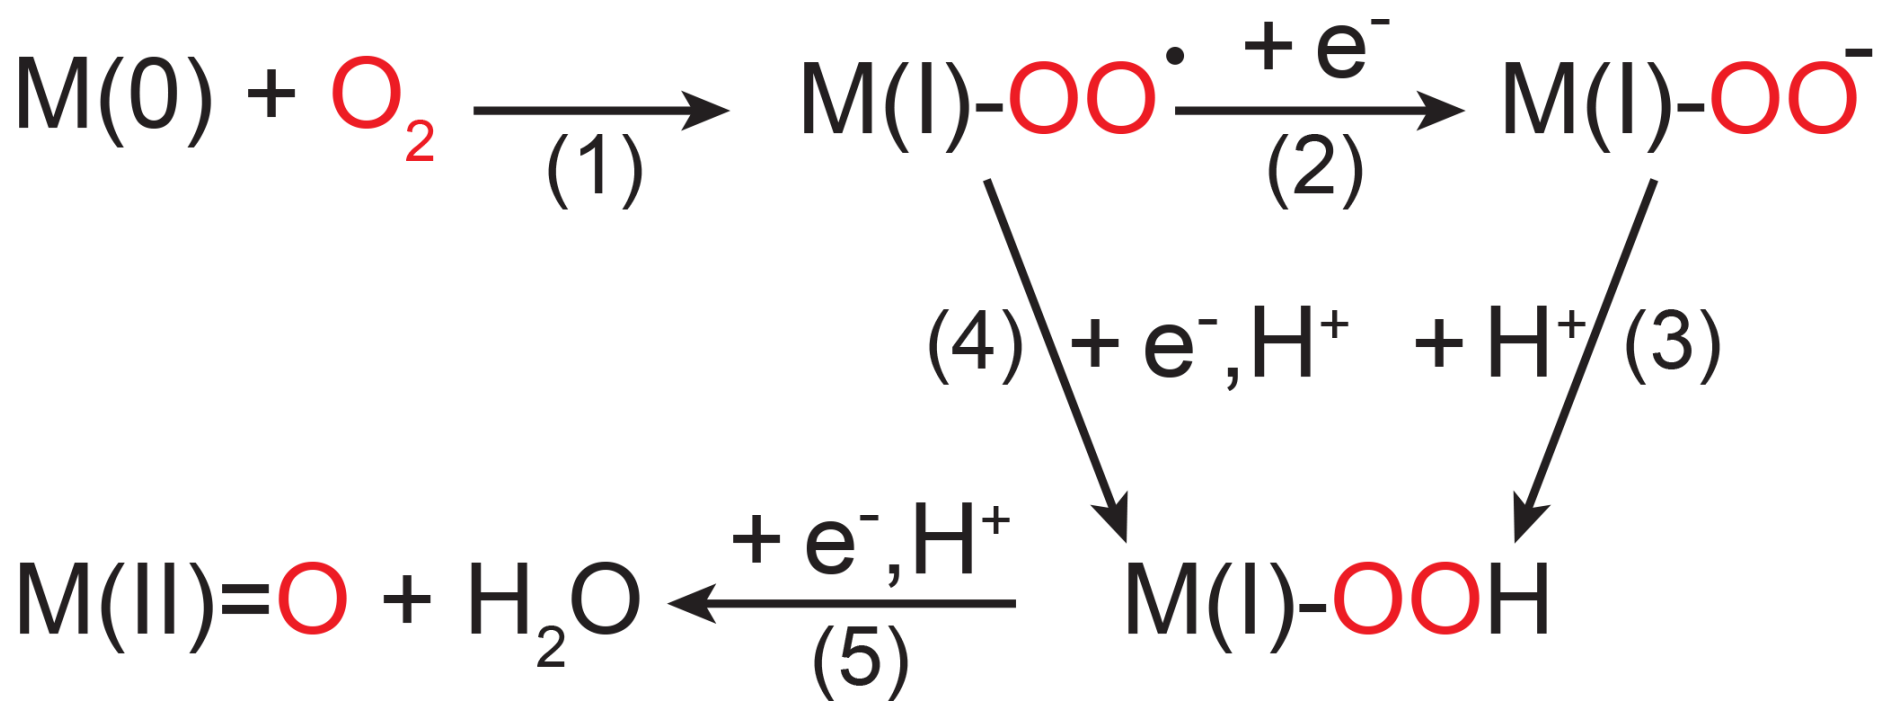
Figure 6Simplified scheme of O2 reduction steps performed by copper- and iron-dependent oxidases and oxygenases shown without interactions with (co-)substrates. M(0) indicates a metal ion in its most reduced state, which is typically Cu(I) or Fe(II); thus, M(I) corresponds to either Cu(II) or Fe(III). M(II)=O only occurs in iron-dependent enzymes as a high-valent iron-oxo species (Fe(IV)=O).
The combined analysis of 18O KIEs of O2-consuming enzymes, determined in this and previous studies, enabled a comprehensive evaluation of the variability of kinetic isotope effects within and between different active-site structures, as illustrated in Fig. 7. Notably, iron- and copper-dependent O2-consuming enzymes displayed a narrower range of 18O KIEs with lower magnitudes (1.009–1.028) compared to flavin-dependent enzymes (1.020–1.058). This variability likely reflects differences in electron transfer mechanisms, specifically inner- versus outer-sphere electron transfer. Within the flavin-dependent O2-consuming enzymes, the two distinct ranges of 18O KIEs likely correspond to two different O2 reduction mechanisms, as discussed in Sect. 4.1. Specifically, flavin-dependent enzymes with 18O KIEs below 1.035 are likely associated with a rate-limiting or FLOO− formation prior to FLOOH formation, potentially influenced by a rate-contributing O2 binding step that masks the intrinsic 18O KIE. Conversely, flavin-dependent enzymes with 18O KIEs above 1.04 are suggested to follow the alternative O2 reduction pathway, in which H2O2 and oxidized flavin are formed directly from FLH• and without the formation of FLOOH. Similarly, the copper-dependent O2-consuming enzymes investigated in this and previous studies can be assigned to one of two groups (see Fig. 5). Enzymes with 18O KIEs between 1.009 and 1.011 are likely characterized by a rate-limiting copper-superoxo formation. Enzymes with 18O KIEs between 1.017 and 1.022 are suggested to have a rate-limiting hydrogen atom abstraction, leading to the formation of a copper-hydroperoxo species. Based on comparisons with calculated 18O EIEs, a rate-limiting copper-peroxo species formation for the second group remains possible; however, existing experimental evidence favors a copper-hydroperoxo formation. The continuous increase in 18O KIEs observed for 13 iron-dependent O2-consuming enzymes, including cytochrome-c oxidase, reflects an increase in the extent of O2 reduction during the rate-limiting step, aligning with increasing 18O EIEs calculated for metal-bound reactive oxygen intermediates. Consequently, if an 18O KIE is determined for an unknown O2-consuming enzymatic reaction, it appears that a value above 1.025 will typically be indicative of a flavin-dependent enzyme, whereas a value above 1.04 is characteristic for a flavin-dependent oxidase. By contrast, an 18O KIE below 1.015 can be confidently assigned to a metal-dependent enzyme. However, distinguishing between copper- and iron-dependent enzymes within this range is not possible. In contrast to the differences observed for different active-site structures, the ranges of 18O KIEs associated with oxygenases (1.009–1.030) and oxidases (1.010–1.057) overlap. Nevertheless, these ranges provide benchmarks for comparisons with the O isotopic composition of the main products of these enzymes, namely, O-containing aromatic compounds and H2O2, respectively. δ18O values of natural, aromatic compounds, in which O atoms primarily originate from O2, have been measured to be 5‰–19‰ (Schmidt et al., 2001). Assuming a constant pool of dissolved O2 with a δ18O value of 24 ‰ suggests underlying 18ε values for the biosynthesis of these compounds in the range of −5 to −19 ‰, which agrees well with the range of 18ε values (−9 to −30 ‰) reported in this and previous studies for oxygenase enzymes. For H2O2, measurements of O isotopic composition in natural waters are scarce. In rainwater, δ18O values of 22‰–53‰ were found for H2O2 (Savarino and Thiemens, 1999). Consequently, H2O2 is more enriched in 18O than expected from 18ε values of oxidase reactions (−9 ‰ to −53 ‰). However, this is not surprising considering that H2O2 can also be formed through different processes and rapidly reacts further, which will likely lead to an increase in δ18O values as observed. Overall, the patterns of isotopic fractionation of O2 identified in this study can help clarify O2 reduction mechanisms in other O2-consuming enzymes. Furthermore, the improved understanding of the variability in isotopic fractionation of O2 at the enzyme level can assist in the interpretation of the variability in isotopic fractionation of O2 observed at the organism or ecosystem levels. For instance, the trends observed for copper-dependent O2-consuming enzymes may support the investigation of metabolic pathways carried out by environmentally relevant bacteria that possess copper-dependent O2-consuming enzymes, such as ammonia and methane monooxygenase. To further validate and support these findings, determining 18O KIEs of additional flavin-dependent monooxygenases and copper-dependent O2-consuming enzymes in particular would be highly valuable.
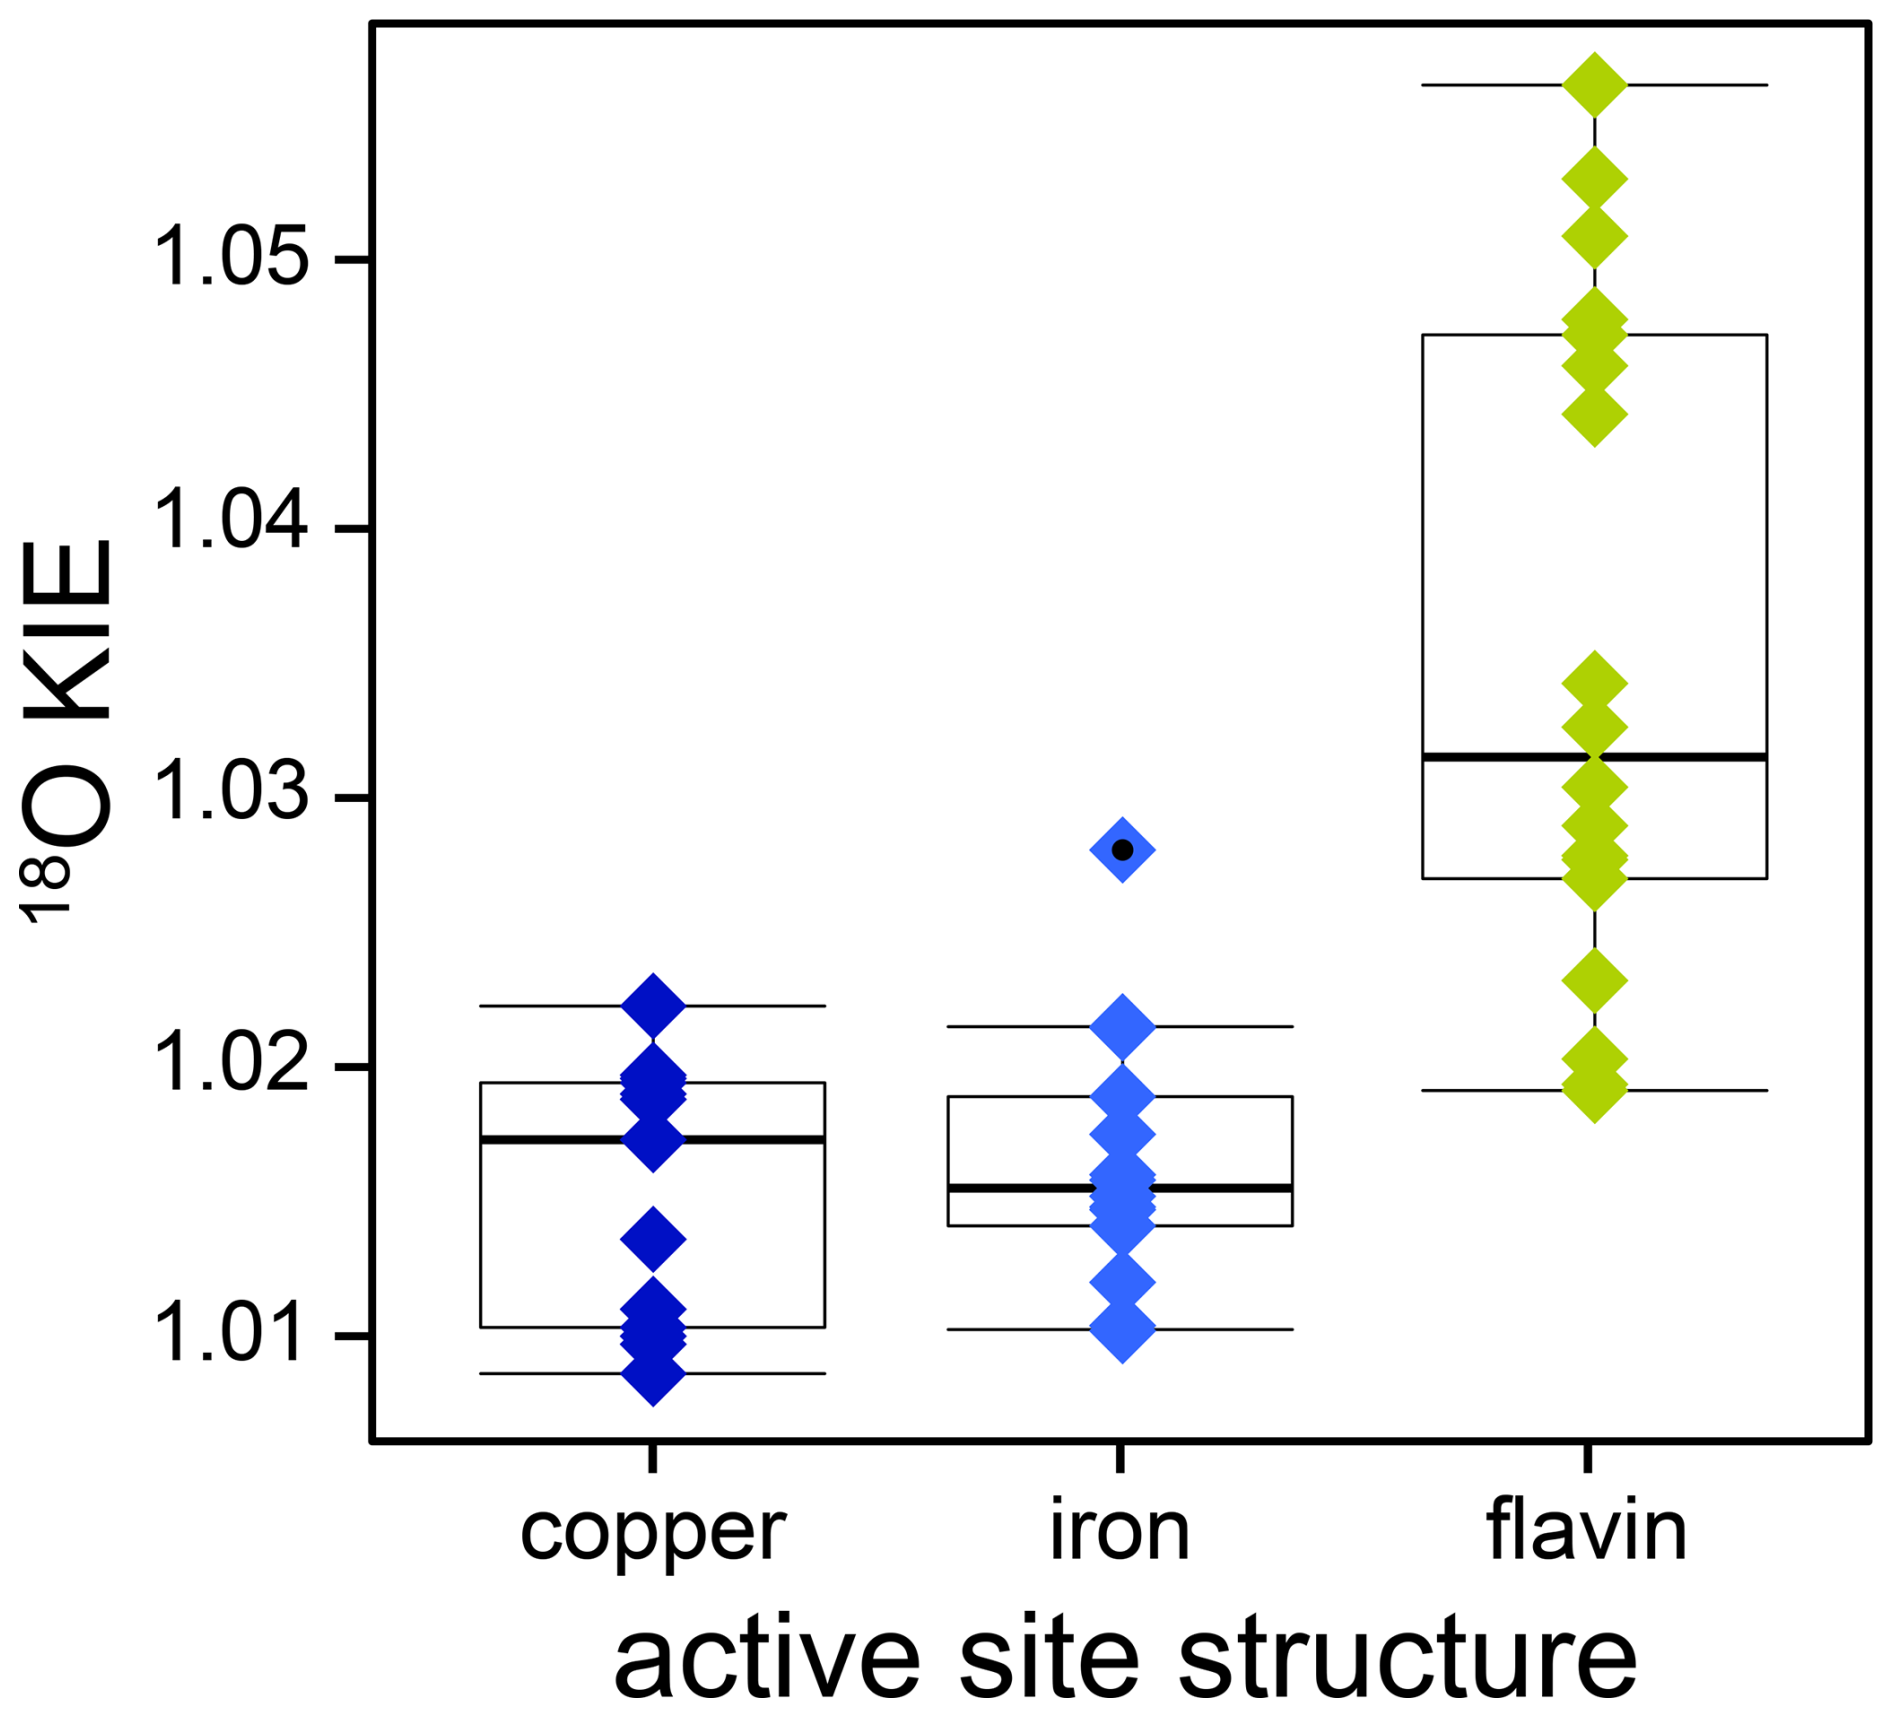
Figure 718O KIEs of copper- (dark blue diamonds), iron- (light blue diamonds), and flavin-dependent (green diamonds) O2-consuming enzymes obtained in this and previous studies. A list of the literature values including references can be found in Table S1 in the Supplement. Boxes represent interquartile range and median values. The whiskers extend to observations that fall within 1.5 times above or below the box size; individual points with black dots represent observations that fall outside of this range.
All experiments were performed at room temperature (23±1 °C) with an initial O2 concentration of 270±10 µM, unless stated otherwise. Typically, 6–8 experiments were performed to determine the Km(S) values with constant conditions, except for initial organic substrate concentrations. The Km(O2) values were determined in single experiments at saturating substrate concentrations, unless noted otherwise. 18O KIEs were determined with duplicate or triplicate experiments at saturating substrate concentrations.
Alcohol oxidase
Experiments with 0.4–32 mg protein L−1 alcohol oxidase were performed in a 50 mM phosphate buffer (pH 7.5). To calculate Km(S) values, initial O2 consumption rates were determined at 8 different initial methanol concentrations from 0.5–5 mM and at 8 different initial ethanol concentrations from 0.5–200 mM. Product inhibition was tested separately with 1 mM formaldehyde, 1 mM acetaldehyde, and 1 mM H2O2. Km(O2) values were determined with 10 mM methanol and 200 mM ethanol, respectively, at initial O2 concentrations of 1200±100 µM. Experiments with 2.5 mM methanol or 200 mM ethanol were performed to determine 18O KIEs. Equation (A1) shows the reaction catalyzed by alcohol oxidase.
L-ascorbate oxidase
Experiments with 0.06–0.19 mg protein L−1 L-ascorbate oxidase were performed in a 50 mM acetate buffer (pH 5.0). To calculate Km(S), initial O2 consumption rates were determined at 8 different initial L-ascorbic acid concentrations from 0.06–3 mM. Concentrations of L-ascorbic acid above 3 mM resulted in inhibition of enzymatic activity. Product inhibition was tested with a reaction solution after complete consumption of 0.27 mM L-ascorbic acid. The Km(O2) value and 18O KIE were determined with 2.5 and 2 mM L-ascorbic acid, respectively. Equation (A2) shows the reaction catalyzed by L-ascorbate oxidase.
Bilirubin oxidase
Experiments with 0.7–2.5 mg protein L−1 bilirubin oxidase were performed in a 100 mM Tris-HCl buffer (pH 8.5). To calculate Km(S), initial O2 consumption rates were determined at 8 different initial bilirubin concentrations from 0.025–1 mM. Product inhibition was tested with a reaction solution after complete consumption of 0.3 mM bilirubin. The Km(O2) value and 18O KIE were determined with 1 mM bilirubin. Equation (A3) shows the reaction catalyzed by bilirubin oxidase.
Cholesterol oxidase
Experiments with 1.3–11 mg protein L−1 cholesterol oxidase were performed in a 50 mM phosphate buffer (pH 7.5) with 1 % () Thesit® and 10 % () isopropanol. To calculate Km(S), initial O2 consumption rates were determined at 6 different initial cholesterol concentrations from 0.1–1 mM. Product inhibition was tested separately with 0.3 and 1 mM H2O2 and with a reaction solution after complete consumption of 0.3 mM cholesterol. The Km(O2) value and 18O KIE were determined with 1.5 mM cholesterol. Equation (A4) shows the reaction catalyzed by cholesterol oxidase.
Choline oxidase
Experiments with 3–10 mg L−1 choline oxidase were performed in a 50 mM phosphate buffer (pH 7.5). To calculate Km(S), initial O2 consumption rates were determined at 8 different initial choline concentrations from 0.075–4.5 mM. Product inhibition was tested separately with 0.3 mM H2O2 and 0.3 mM betaine. The Km(O2) value and 18O KIE were determined with 10 and 2.5 mM choline, respectively. Equation (A5) shows the reaction catalyzed by choline oxidase.
Cytochrome-c oxidase
Experiments with 1.5–2.3 mg protein L−1 cytochrome-c oxidase were performed in a 10 mM phosphate buffer (pH 7.5) with 50 mM NaCl. Km(S) was not determined. Product inhibition was not tested. Experiments to determine Km(O2) and 18O KIE were performed with 25 µM cytochrome c and 3 mM ascorbic acid. Ascorbic acid was used to recycle the substrate by abiotically reducing ferricytochrome c to ferrocytochrome c. Equation (A6) shows the reaction catalyzed by cytochrome-c oxidase.
D-amino acid oxidase
Experiments with 1.8–5.9 mg protein L−1 D-amino acid oxidase were performed in a 50 mM Tris-HCl buffer (pH 8.2). To calculate Km(S), initial O2 consumption rates were determined at 8 different initial D-alanine concentrations from 0.3–20 mM. Product inhibition was tested separately with 0.3 mM H2O2 as well as with 0.27 mM ammonium and 0.27 mM pyruvate. The Km(O2) value and 18O KIE were determined with 20 mM D-alanine. Equation (A7) shows the reaction catalyzed by D-amino acid oxidase.
Diamine oxidase
Experiments with 800–5000 mg L−1 diamine oxidase were performed in a 50 mM phosphate buffer (pH 7.2). To calculate Km(S), initial O2 consumption rates were determined at 6 different initial histamine concentrations from 0.025–0.5 mM. Concentrations of histamine above 0.5 mM resulted in inhibition of enzymatic activity. Product inhibition was tested with a reaction solution after complete consumption of 0.25 mM histamine. The Km(O2) value and 18O KIE were determined with 0.4 mM histamine. Equation (A8) shows the reaction catalyzed by diamine oxidase. The enzyme provided by the manufacturer was tested positively for catalase activity. Thus, the H2O2 formed during the reaction of histamine with diamine oxidase was immediately converted to O2 and H2O (see Sect. 3.3 for implications of O2 formation on 18O KIE determination).
Glucose oxidase
Experiments with 9–41 mg protein L−1 glucose oxidase were performed in a 100 mM acetate buffer (pH 5.0). To calculate Km(S) values, initial O2 consumption rates were determined at 7 different initial D-glucose concentrations from 0.45–70 mM and at 11 different initial D-mannose concentrations from 0.45–100 mM. Product inhibition was tested separately with 0.3 mM H2O2 and with reaction solutions after complete consumption of 0.45 mM D-mannose and 0.27 mM D-glucose, respectively. The Km(O2) values were determined with 40 mM D-glucose and 100 mM D-mannose, respectively. The 18O KIEs were determined with 40 mM D-glucose or 40 mM D-mannose. Equation (A9) shows the reaction catalyzed by glucose oxidase with D-glucose.
Kynurenine 3-monooxygenase
Experiments with 3–9 mg L−1 kynurenine 3-monooxygenase (KMO) were performed in a 20 mM HEPES buffer (pH 7.5). Km(S) was not determined. Product inhibition was tested with a reaction solution after complete consumption of 0.3 mM L-kynurenine. To calculate Km(O2), initial O2 consumption rates were determined with 1 mM L-kynurenine, 0.5 mM NADPH and 2 mM dithiothreitol at 8 different initial O2 concentrations from 25–260 µM. The 18O KIE was determined with 1 mM L-kynurenine, 0.5 mM NADPH and 2 mM dithiothreitol. Equation (A10) shows the reaction catalyzed by KMO.
Laccase from Agaricus bisporus
Experiments with 10–100 mg L−1 laccase from Agaricus bisporus were performed in a 50 mM acetate buffer (pH 5.5). To calculate Km(S), initial O2 consumption rates were determined at 10 different initial hydroquinone concentrations from 0.05–20 mM. Product inhibition was tested with 0.54 mM p-benzoquinone. The Km(O2) value and 18O KIE were determined with 15 mM hydroquinone. Equation (A11) shows the reaction catalyzed by laccase with hydroquinone.
Laccase from Trametes versicolor
Experiments with 10–100 mg L−1 laccase from Trametes versicolor were performed in a 50 mM acetate buffer (pH 5.5). To calculate Km(S) values, initial O2 consumption rates were determined at 10 different initial hydroquinone concentrations from 0.005–15 mM and at 7 different initial ABTS concentrations from 0.06–7.5 mM. Product inhibition was tested with 0.54 mM p-benzoquinone and with a reaction solution after complete consumption of 1.2 mM ABTS. The Km(O2) values were determined from a single experiment with 15 mM hydroquinone and from initial O2 consumption rates with 3.8 mM ABTS and 6 different initial O2 concentrations from 25–265 µM. The 18O KIEs were determined with 7.5 mM hydroquinone and 4 mM ABTS, respectively. Equation (A12) shows the reaction catalyzed by laccase with ABTS.
L-lactate oxidase
To calculate Km(S), initial O2 consumption rates were determined at six different initial L-lactic acid concentrations from 0.1–10 mM in a 50 mM phosphate buffer (pH 7.0) with 20 mM KCl and 2.3 mg L−1 enzyme. Product inhibition was tested separately with 0.3 mM pyruvate and 0.3 mM H2O2. The Km(O2) value and 18O KIE were determined in a 50 mM HEPES buffer (pH 7.0) with 50 mM KCl containing either 10 mM L-lactic acid and 2.3 mg L−1 enzyme or 5 mM L-lactic acid and 1.2 mg L−1 enzyme. Equation (A13) shows the reaction catalyzed by L-lactate oxidase.
L-lysine oxidase
Experiments with 0.3–2.2 mg protein L−1 L-lysine oxidase were performed in a 50 mM phosphate buffer (pH 8.0). To calculate Km(S), initial O2 consumption rates were determined at 6 different initial L-lysine concentrations from 0.01–2 mM. Product inhibition was tested separately with 0.3 mM H2O2 and with a reaction solution after complete consumption of 0.3 mM L-lysine. The Km(O2) value and 18O KIE were determined with 2.3 and 2 mM L-lysine, respectively. Equation (A14) shows the reaction catalyzed by L-lysine oxidase.
Pyruvate oxidase
Experiments with 0.3–1.3 mg protein L−1 pyruvate oxidase were performed in a 50 mM phosphate buffer (pH 6.7) with 1 mM thiamine diphosphate, 1 mM MnSO4 and 10 µM FAD. Km(S) was not determined. Product inhibition was tested separately with 0.27 mM sodium bicarbonate and 0.27 mM H2O2. The Km(O2) value was determined with 100 mM pyruvate. The 18O KIE was determined with 25, 50, and 100 mM pyruvate. Prior to starting an experiment, pyruvate oxidase was incubated with 1 mM thiamine diphosphate, 1 mM MnSO4, 10 µM FAD, and 5–100 mM pyruvate for 10 min at room temperature. Equation (A15) shows the reaction catalyzed by pyruvate oxidase.
Sarcosine oxidase
Experiments with 0.5–10 mg L−1 sarcosine oxidase were performed in a 100 mM Tris-HCl buffer (pH 8.3). To calculate Km(S) values, initial O2 consumption rates were determined at 6 different initial sarcosine concentrations from 5–100 mM. Product inhibition was tested separately with 0.3 mM glycine, 1 mM formaldehyde, and 0.3 mM H2O2. The Km(O2) value and 18O KIE were determined with 100 and 50 mM sarcosine, respectively. Equation (A16) shows the reaction catalyzed by sarcosine oxidase.
Alcohol, choline, and L-lysine oxidase exhibited Km(O2) values above air saturation. For this reason, in addition to the enzyme assays described in Sect. 2.3, the 18O kinetic isotope effects (18O KIEs) of these enzymes were additionally performed in O2-purged buffer solutions under otherwise identical experimental conditions (see Appendix A). Enzyme assays with alcohol and choline oxidase were performed each in 12 identically filled crimp-top vials as described in Sect. 2.3. Enzyme assays with L-lysine oxidase were performed directly in 8 Exetainers that were sacrificed at different time points. Exetainers were filled completely with assay solution and closed, before a small volume of enzyme or substrate solution was injected through the septa to initiate the reaction. Prior to sampling, the remaining O2 concentration was measured with a fiber-optic oxygen microsensor. After measuring O2 concentrations, the reaction was stopped by injecting 200 µL of a 3 M HCl solution through the septum with a gas-tight glass syringe while simultaneously piercing the septum with a small exhaust needle. After enzyme injection, before measuring O2 concentrations, and after HCl additions, Exetainers were shaken vigorously. To create a He headspace in the Exetainer, 5 mL assay solution was removed with a 10 mL gas-tight glass while the Exetainer was connected to a slow stream of He gas. Procedural blanks were prepared by completely filling Exetainers with N2-purged water in an anaerobic glove box with a N2 atmosphere (GS Glovebox Systemtechnik, residual O2 content<1 ppm). Under ambient atmosphere, 200 µL NaOH were then injected through the septa into the closed Exetainer. Control samples and quantification standards were prepared by completely filling Exetainers with leftover assay solution without enzyme or with air-equilibrated water, respectively. For blanks, control samples, and quantification standards, a 5 mL He headspace was created as described for the assay samples. The resulting 18O KIEs were 1.029±0.004 for alcohol oxidase, 1.019±0.002 for choline oxidase, and 1.04±0.01 for L-lysine oxidase.
With laccase from T. versicolor, the substrate-to-O2 consumption stoichiometry was determined for the two substrates hydroquinone and ABTS. Enzyme assays were performed in air-saturated buffer as described in Sect. 2.2 but with a limiting amount of substrate. O2 concentrations were stable before substrate addition. After the addition of 50 µM hydroquinone, O2 concentrations decreased rapidly from 275–249 µM and remained stable thereafter. Assuming all hydroquinone was consumed, this decrease in O2 concentration corresponds to a substrate-to-O2 consumption stoichiometry of 1.92 : 1. After the addition of 51 µM ABTS, O2 concentrations decreased rapidly from 262–249 µM and slowly thereafter. It is likely that the initial fast decrease in O2 concentration is the result of the enzymatic reaction catalyzed by laccase, while the later slower O2 consumption is a result of abiotic reaction between the radical product ABTS−• and O2. Assuming all ABTS was consumed in the initial fast reaction, the substrate-to-O2 consumption stoichiometry was 4.0 : 1.
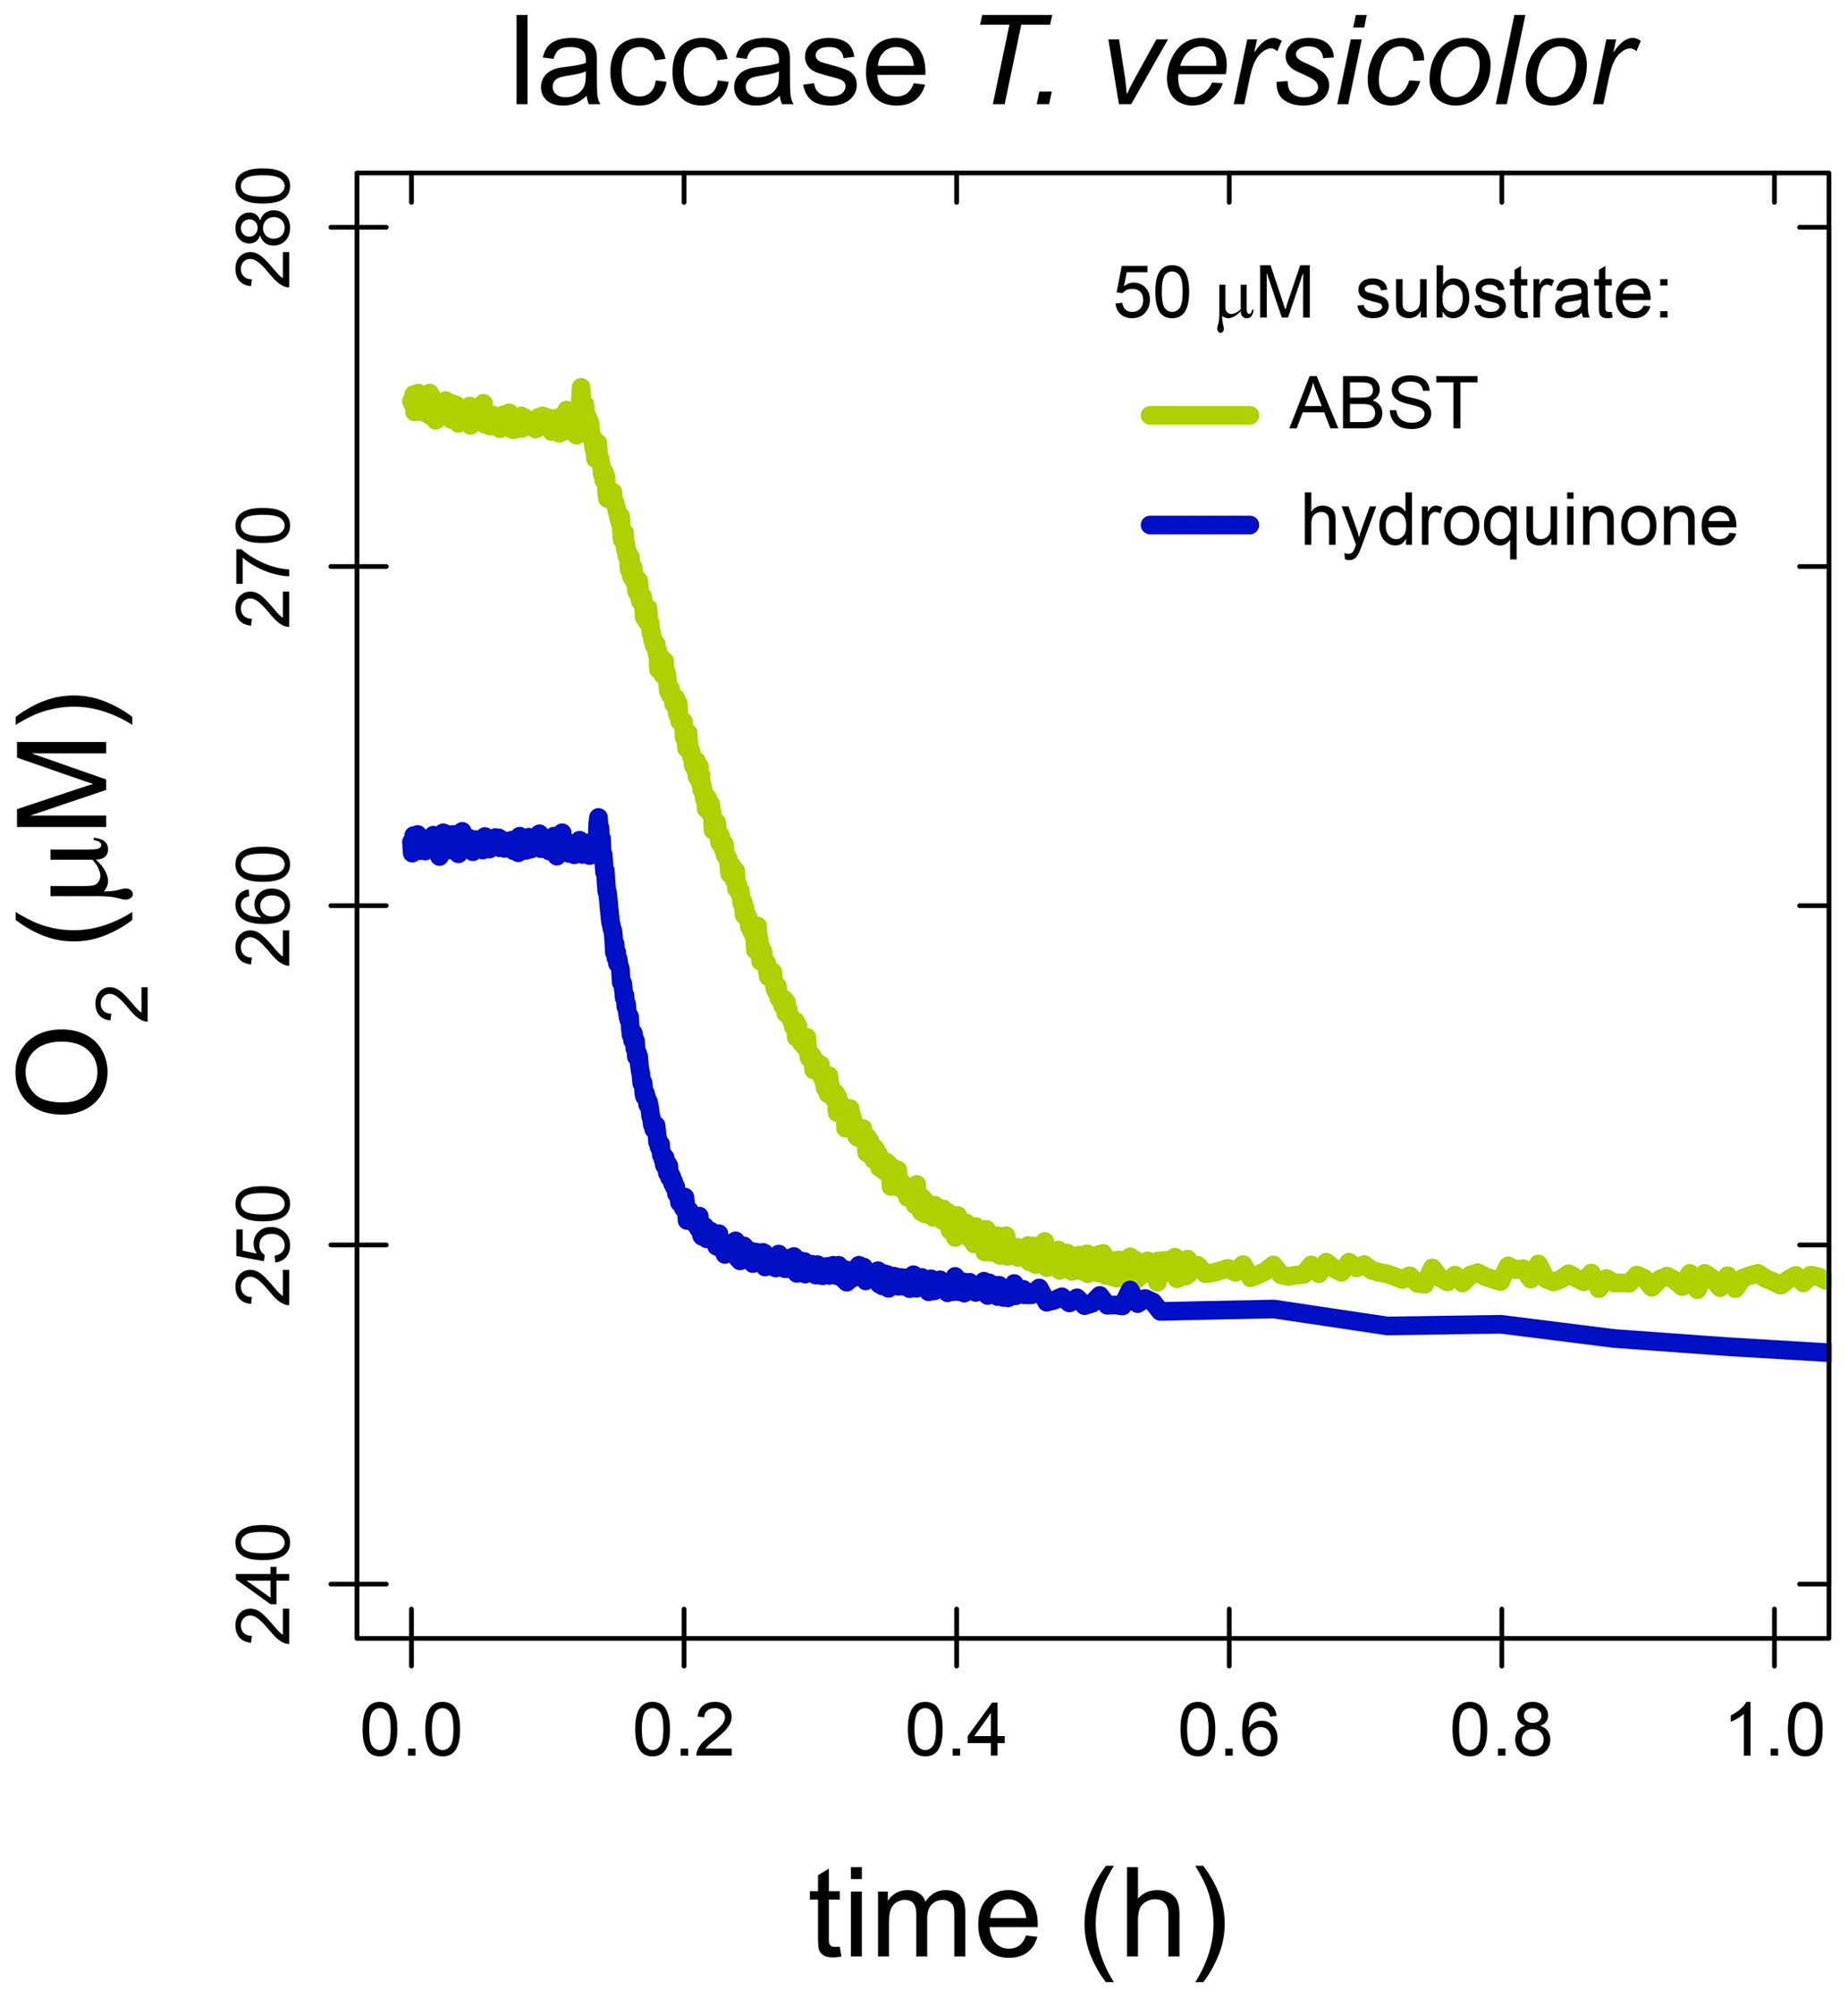
Figure C1O2 consumption profiles by laccase from T. versicolor when supplied with 50 µM ABTS (green line) or hydroquinone (blue line).
To reconcile the apparent correlation between 18O KIEs and Km(O2) as shown in Fig. 4, we consider a simple two-step enzymatic reaction involving a reversible O2 binding step and an irreversible reaction step converting enzyme-bound O2 into products (either H2O2 or hydroxylated organic substrate) as shown in Eq. (D1),
where E−O2 is the enzyme-bound O2; P represents the reaction products; and k1, k2, and k3 are elementary reaction rate constants of the forward and backward reactions. In this case, the measured 18O KIE is related to the intrinsic equilibrium and kinetic isotope effects of the two elementary steps through the forward commitment to catalysis, , as shown in Eq. (D2) (Cleland, 2005),
where EIE1 is the equilibrium isotope effect of the O2 binding step, and KIE1 and KIE3 are the kinetic isotope effects of the O2 binding and reaction steps associated with rates k1 and k3, respectively. From Eq. (D2), two extreme cases can be derived. If O2 binding alone is rate-limiting (k3≫k2), the measured 18O KIE will approximate KIE1. If the second reaction step is rate-limiting (k3≪k2), the measured 18O KIE will approximate the product of EIE1 and KIE3. When we start with the latter case, which has a small , and increase the forward commitment gradually, the measured 18O KIE will slowly decrease assuming KIE1 is smaller than EIE1KIE3. For such a reaction, plotting measured 18O KIEs vs. will yield a similar (apparently linear) trend as shown in Fig. 4 as long as the commitment factor () is below 1. As shown in Eq. (D3), can be related to Km(O2) if we consider Km(O2) to be and Kd, the dissociation constant of O2, to be . The trend observed in Fig. 4 can thus be explained if Kd varies much less than Km(O2) for this set of enzymes.
All data presented in this study are available at https://doi.org/10.5281/zenodo.14765061 (de Carvalho et al., 2025).
The supplement related to this article is available online at https://doi.org/10.5194/bg-22-4579-2025-supplement.
CFMdC contributed to conceptualization, investigation, methodology, visualization, writing (original draft, review and editing). MFL contributed to supervision, writing (review and editing). SGP contributed to conceptualization, funding acquisition, methodology, supervision, writing (review and editing).
The contact author has declared that none of the authors has any competing interests.
Publisher's note: Copernicus Publications remains neutral with regard to jurisdictional claims made in the text, published maps, institutional affiliations, or any other geographical representation in this paper. While Copernicus Publications makes every effort to include appropriate place names, the final responsibility lies with the authors.
We thank Thomas Kuhn for his support with IRMS measurements.
This research has been supported by the Swiss National Science Foundation (grant-no. PZ00P2_186083).
This paper was edited by Mark Lever and reviewed by two anonymous referees.
Ash, J. L., Hu, H., and Yeung, L. Y.: What fractionates oxygen isotopes during respiration? Insights from multiple isotopologue measurements and theory, ACS Earth and Space Chemistry, 4, 50–66, https://doi.org/10.1021/acsearthspacechem.9b00230, 2020.
Bauer, J. A., Zámocká, M., Majtán, J., and Bauerová-Hlinková, V.: Glucose oxidase, an enzyme “Ferrari”: Its structure, function, production and properties in the light of various industrial and biotechnological applications, Biomolecules, 12, 472, 2022.
Bender, M. L.: The δ18O of dissolved O2 in seawater: A unique tracer of circulation and respiration in the deep sea, J. Geophys. Res., 95, 22243–22252, https://doi.org/10.1029/JC095iC12p22243, 1990.
Bento, I., Carrondo, M. A., and Lindley, P. F.: Reduction of dioxygen by enzymes containing copper, J. Biol. Inorg. Chem., 11, 539–547, https://doi.org/10.1007/s00775-006-0114-9, 2006.
Bernhardt, R.: Cytochromes P450 as versatile biocatalysts, J. Biotechnol., 124, 128–145, https://doi.org/10.1016/j.jbiotec.2006.01.026, 2006.
Blank, L. M., Ebert, B. E., Buehler, K., and Bühler, B.: Redox biocatalysis and metabolism: Molecular mechanisms and metabolic network analysis, Antioxid. Redox Sign., 13, 349–394, https://doi.org/10.1089/ars.2009.2931, 2010.
Blunier, T., Bender, M. L., Barnett, B., and von Fischer, J. C.: Planetary fertility during the past 400 ka based on the triple isotope composition of O2 in trapped gases from the Vostok ice core, Clim. Past, 8, 1509–1526, https://doi.org/10.5194/cp-8-1509-2012, 2012.
Bocaniov, S. A., Schiff, S. L., and Smith, R. E. H.: Non steady-state dynamics of stable oxygen isotopes for estimates of metabolic balance in large lakes, J. Great Lakes Res., 41, 719–729, https://doi.org/10.1016/j.jglr.2015.05.013, 2015.
Bocaniov, S. A., Schiff, S. L., and Smith, R. E. H.: Plankton metabolism and physical forcing in a productive embayment of a large oligotrophic lake: Insights from stable oxygen isotopes, Freshwater Biol., 57, 481–496, https://doi.org/10.1111/j.1365-2427.2011.02715.x, 2012.
Bogard, M. J., Vachon, D., St.-Gelais, N. F., and del Giorgio, P. A.: Using oxygen stable isotopes to quantify ecosystem metabolism in northern lakes, Biogeochemistry, 133, 347–364, https://doi.org/10.1007/s10533-017-0338-5, 2017.
Bugg, T. D. H.: Oxygenases: Mechanisms and structural motifs for O2 activation, Curr. Opin. Chem. Biol., 5, 550–555, https://doi.org/10.1016/S1367-5931(00)00236-2, 2001.
Chaiyen, P., Fraaije, M. W., and Mattevi, A.: The enigmatic reaction of flavins with oxygen, Trends Biochem. Sci., 37, 373–380, https://doi.org/10.1016/j.tibs.2012.06.005, 2012.
Cheah, M. H., Millar, A. H., Myers, R. C., Day, D. A., Roth, J., Hillier, W., and Badger, M. R.: Online oxygen kinetic isotope effects using membrane inlet mass spectrometry can differentiate between oxidases for mechanistic studies and calculation of their contributions to oxygen consumption in whole tissues, Anal. Chem., 86, 5171–5178, https://doi.org/10.1021/ac501086n, 2014.
Cleland, W. W.: Enzyme Mechanisms from Isotope Effects, in: Isotope Effects in Chemistry and Biology, edited by: Kohen, A., Limbach, H. H., CRC Press, Boca Raton, United States, 915–930, https://doi.org/10.1201/9781420028027, 2005.
Coplen, T. B.: Guidelines and recommended terms for expression of stable-isotope-ratio and gas-ratio measurement results, Rapid Commun. Mass Sp., 25, 2538–2560, https://doi.org/10.1002/rcm.5129, 2011.
Costas, M., Mehn, M. P., Jensen, M. P., and Que, L.: Dioxygen activation at mononuclear nonheme iron active sites: Enzymes, models, and intermediates, Chem. Rev., 104, 939–986, https://doi.org/10.1021/cr020628n, 2004.
Crozier, K. R. and Moran, G. R.: Heterologous expression and purification of kynurenine-3-monooxygenase from Pseudomonas fluorescens strain 17 400, Protein Expres. Purif., 51, 324–333, https://doi.org/10.1016/j.pep.2006.07.024, 2007.
de Carvalho, C. F. M., Lehmann, M. F., and Pati, S. G.: Improving the accuracy of δ18O and δ17O values of O2 measured by continuous-flow isotope-ratio mass spectrometry with a multipoint isotope-ratio calibration, Rapid Commun. Mass Sp., 38, e9652, https://doi.org/10.1002/rcm.9652, 2024.
de Carvalho, C. F. M., Lehmann, M. F., and Pati, S. G.: Dataset for: Variability in oxygen isotopic fractionation of enzymatic O2 consumption, Zenodo [data set], https://doi.org/10.5281/zenodo.14765061, 2025.
Epstein, S. and Zeiri, L.: Oxygen and carbon isotopic compositions of gases respired by humans, P. Natl. Acad. Sci. USA, 85, 1727–1731, https://doi.org/10.1073/pnas.85.6.1727, 1988.
Evans, J. P., Ahn, K., and Klinman, J. P.: Evidence that dioxygen and substrate activation are tightly coupled in dopamine β-monooxygenase: Implications for the reactive oxygen species, J. Biol. Chem., 278, 49691–49698, https://doi.org/10.1074/jbc.M300797200, 2003.
Feldman, D. E., Yost, H. T., and Benson, B. B.: Oxygen isotope fractionation in reactions catalyzed by enzymes, Science, 129, 146–147, https://doi.org/10.1126/science.129.3342.146, 1959.
Finney, J., Moon, H. J., Ronnebaum, T., Lantz, M., and Mure, M.: Human copper-dependent amine oxidases, Arch. Biochem. Biophys., 546, 19–32, https://doi.org/10.1016/j.abb.2013.12.022, 2014.
Francisco, W. A., Blackburn, N. J., and Klinman, J. P.: Oxygen and hydrogen isotope effects in an active site tyrosine to phenylalanine mutant of peptidylglycine α-hydroxylating monooxygenase: Mechanistic implications, Biochemistry-US, 42, 1813–1819, https://doi.org/10.1021/bi020592t, 2003.
Frey, P. A. and Hegeman, A. D. (Eds.): Enzymatic Reaction Mechanisms, Oxford University Press, Oxford, United Kingdom, 710 pp., https://doi.org/10.1093/oso/9780195122589.003.0021, 2007.
Gammons, C. H., Henne, W., Poulson, S. R., Parker, S. R., Johnston, T. B., Dore, J. E., and Boyd, E. S.: Stable isotopes track biogeochemical processes under seasonal ice cover in a shallow, productive lake, Biogeochemistry, 120, 359–379, https://doi.org/10.1007/s10533-014-0005-z, 2014.
Guengerich, F. P.: Mechanisms of cytochrome P450 substrate oxidation: MiniReview, J. Biochem. Mol. Toxic., 21, 163–168, https://doi.org/10.1002/jbt.20174, 2007.
Guy, R. D., Berry, J. A., Fogel, M. L., Turpin, D. H., and Weger, H. G.: Fractionation of the stable isotopes of oxygen during respiration by plants – The basis for a new technique, in: Molecular, Biochemical and Physiological Aspects of Plant Respiration, edited by: Lambers, H., van der Plas, L. H. W., SPB Academic Publishing bv, The Hague, Netherlands, 443–453, ISBN 9051030797, 1992.
Guy, R. D., Berry, J. A., Fogel, M. L., and Hoering, T. C.: Differential fractionation of oxygen isotopes by cyanide-resistant and cyanide-sensitive respiration in plants, Planta, 177, 483–491, https://doi.org/10.1007/BF00392616, 1989.
Guy, R. D., Fogel, M. L., and Berry, J. A.: Photosynthetic fractionation of the stable isotopes of oxygen and carbon, Plant Physiol., 101, 37–47, https://doi.org/10.1104/pp.101.1.37, 1993.
Guy, R. D., Fogel, M. L., Berry, J. A., and Hoering, T. C.: Isotope fractionation during oxygen production and consumption by plants, in: Progress in Photosynthesis Research, edited by: Biggins, J., Springer Netherlands, Dordrecht, Netherlands, 597–600, https://doi.org/10.1007/978-94-017-0516-5_127, 1987.
Hayles, J. A. and Killingsworth, B. A.: Constraints on triple oxygen isotope kinetics, Chem. Geol., 589, 120646 https://doi.org/10.1016/j.chemgeo.2021.120646, 2022.
Helman, Y., Barkan, E., Eisenstadt, D., Luz, B., and Kaplan, A.: Fractionation of the three stable oxygen isotopes by oxygen-producing and oxygen-consuming reactions in photosynthetic organisms, Plant Physiol., 138, 2292–2298, https://doi.org/10.1104/pp.105.063768, 2005.
Hendricks, M. B., Bender, M. L., Barnett, B. A., Strutton, P., and Chavez, F. P.: Triple oxygen isotope composition of dissolved O2 in the equatorial Pacific: A tracer of mixing, production, and respiration, J. Geophys. Res.-Oceans, 110, 1–17, https://doi.org/10.1029/2004JC002735, 2005.
Hotchkiss, E. R. and Hall, R. O.: High rates of daytime respiration in three streams: Use of δ18O–O2 and O2 to model diel ecosystem metabolism, Limnol. Oceanogr., 59, 798–810, https://doi.org/10.4319/lo.2014.59.3.0798, 2014.
Huang, X. and Groves, J. T.: Oxygen activation and radical transformations in heme proteins and metalloporphyrins, Chem. Rev., 118, 2491–2553, https://doi.org/10.1021/acs.chemrev.7b00373, 2018.
Humphreys, K. J., Mirica, L. M., Wang, Y., and Klinman, J. P.: Galactose oxidase as a model for reactivity at a copper superoxide center, J. Am. Chem. Soc., 131, 4657–4663, https://doi.org/10.1021/ja807963e, 2009.
Juranek, L. W. and Quay, P. D.: Using triple isotopes of dissolved oxygen to evaluate global marine productivity, Annu. Rev. Mar. Sci., 5, 503–524, https://doi.org/10.1146/annurev-marine-121211-172430, 2013.
Jurikova, H., Guha, T., Abe, O., Shiah, F.-K., Wang, C.-H., and Liang, M.-C.: Variations in triple isotope composition of dissolved oxygen and primary production in a subtropical reservoir, Biogeosciences, 13, 6683–6698, https://doi.org/10.5194/bg-13-6683-2016, 2016.
Kiddon, J., Bender, M. L., Orchardo, J., Caron, D. A., and Goldman, J. C., Dennett, M.: Isotopic fractionation of oxygen by respiring marine organisms, Global Biogeochem. Cy., 7, 679–694, https://doi.org/10.1029/93GB01444, 1993.
Kiss, D. J. and Ferenczy, G. G.: A detailed mechanism of the oxidative half-reaction of D-amino acid oxidase: Another route for flavin oxidation, Org. Biomol. Chem., 17, 7973–7984, https://doi.org/10.1039/C9OB00975B, 2019.
Klinman, J. P.: How do enzymes activate oxygen without inactivating themselves?, Accounts Chem. Res., 40, 325–333, https://doi.org/10.1021/ar6000507, 2007.
Knapp, M. J. and Klinman, J. P.: Kinetic studies of oxygen reactivity in soybean lipoxygenase-1, Biochemistry-US, 42, 11466–11475, https://doi.org/10.1021/bi0300884, 2003.
Kroopnick, P. and Craig, H.: Oxygen isotope fractionation in dissolved oxygen in the deep sea, Earth Planet. Sc. Lett., 32, 375–389, https://doi.org/10.1016/0012-821X(76)90078-9, 1976.
Lanci, M. P., Smirnov, V. V., Cramer, C. J., Gauchenova, E. V., Sundermeyer, J., and Roth, J. P.: Isotopic probing of molecular oxygen activation at copper(I) sites, J. Am. Chem. Soc., 129, 14697–14709, https://doi.org/10.1021/ja074620c, 2007.
Laskar, A. H., Peethambaran, R., Adnew, G. A., and Röckmann, T.: Measurement of 18O and 17O in atmospheric O2 using the 253 Ultra mass spectrometer and applications to stratospheric and tropospheric air samples, Rapid Commun. Mass Sp., 33, 981–994, https://doi.org/10.1002/rcm.8434, 2019.
Levine, N. M., Bender, M. L., and Doney, S. C.: The δ18O of dissolved O2 as a tracer of mixing and respiration in the mesopelagic ocean, Global Biogeochem. Cy., 23, 1–12, https://doi.org/10.1029/2007GB003162, 2009.
Liu, J., Chakraborty, S., Hosseinzadeh, P., Yu, Y., Tian, S., Petrik, I., Bhagi, A., and Lu, Y.: Metalloproteins containing cytochrome, iron-sulfur, or copper redox centers, Chem. Rev., 114, 4366–4369, https://doi.org/10.1021/cr400479b, 2014.
Luz, B. and Barkan, E.: Assessment of oceanic productivity with the triple-isotope composition of dissolved oxygen, Science, 288, 2028–2031, https://doi.org/10.1126/science.288.5473.2028, 2000.
Luz, B. and Barkan, E.: The isotopic ratios of and in molecular oxygen and their significance in biogeochemistry, Geochim. Cosmochim. Ac., 69, 1099–1110, https://doi.org/10.1016/j.gca.2004.09.001, 2005.
Luz, B. and Barkan, E.: Net and gross oxygen production from , and ratios, Aquat. Microb. Ecol., 56, 133–145, https://doi.org/10.3354/ame01296, 2009.
Luz, B. and Barkan, E.: Oxygen isotope fractionation in the ocean surface and of atmospheric O2, Global Biogeochem. Cy., 25, 17–18, https://doi.org/10.1029/2011GB004178, 2011.
Macheroux, P., Massey, V., Thiele, D. J., and Volokita, M.: Expression of spinach glycolate oxidase in Saccharomyces cerevisiae: purification and characterization, Biochemistry-US, 30, 4612–4619, https://doi.org/10.1021/bi00232a036, 1991.
Mader, M., Schmidt, C., van Geldern, R., and Barth, J. A. C.: Dissolved oxygen in water and its stable isotope effects: A review, Chem. Geol., 473, 10–21, https://doi.org/10.1016/j.chemgeo.2017.10.003, 2017.
Malmstrom, B. G.: Enzymology of Oxygen, Annu. Rev. Biochem., 51, 21–59, https://doi.org/10.1146/annurev.bi.51.070182.000321, 1982.
Massey, V.: The reactivity of oxygen with flavoproteins, Int. Congr. Ser., 1233, 3–11, https://doi.org/10.1016/S0531-5131(02)00519-8, 2002.
Mattevi, A.: To be or not to be an oxidase: challenging the oxygen reactivity of flavoenzymes, Trends Biochem. Sci., 31, 276–283, https://doi.org/10.1016/j.tibs.2006.03.003, 2006.
McDonald, A. G., Boyce, S., and Tipton, K. F.: ExplorEnz: The primary source of the IUBMB enzyme list, Nucleic Acids Res., 37, D593–D597, https://doi.org/10.1093/nar/gkn582, 2009.
Medda, R., Padiglia, A., and Floris, G.: Plant copper-amine oxidases, Phytochemistry, 39, 1–9, https://doi.org/10.1016/0031-9422(94)00756-J, 1995.
Merle, P. and Kadenbach, B.: Kinetic and structural differences between cytochrome c oxidases from beef liver and heart, Eur. J. Biochem., 125, 239–244, https://doi.org/10.1111/j.1432-1033.1982.tb06674.x, 1982.
Miller, M. F.: Isotopic fractionation and the quantification of 17O anomalies in the oxygen three-isotope system: an appraisal and geochemical significance, Geochim. Cosmochim. Ac., 66, 1881–1889, https://doi.org/10.1016/S0016-7037(02)00832-3, 2002.
Mills, S. A., Goto, Y., Su, Q., Plastino, J., and Klinman, J. P.: Mechanistic comparison of the cobalt-substituted and wild-type copper amine oxidase from Hansenula polymorpha, Biochemistry-US, 41, 10577–10584, https://doi.org/10.1021/bi0200864, 2002.
Mirica, L. M., McCusker, K. P., Munos, J. W., Liu, H., and Klinman, J. P.: 18O kinetic isotope effects in non-heme iron enzymes: Probing the nature of FeO2 intermediates, J. Am. Chem. Soc., 130, 8122–8123, https://doi.org/10.1021/ja800265s, 2008.
Mukherjee, A., Smirnov, V. V., Lanci, M. P., Brown, D. E., Shepard, E. M., Dooley, D. M., and Roth, J. P.: Inner-sphere mechanism for molecular oxygen reduction catalyzed by copper amine oxidases, J. Am. Chem. Soc., 130, 9459–9473, https://doi.org/10.1021/ja801378f, 2008.
Mure, M., Mills, S. A., and Klinman, J. P.: Catalytic mechanism of the topa quinone containing copper amine oxidases, Biochemistry-US, 41, 9269–9278, https://doi.org/10.1021/bi020246b, 2002.
Northrop, D. B.: On the meaning of Km and V/K in enzyme kinetics, J. Chem. Educ., 75, 1153, https://doi.org/10.1021/ed075p1153, 1998.
Osborne, R. L. and Klinman, J. P.: Insights into the proposed copper–oxygen Intermediates that regulate the mechanism of reactions catalyzed by dopamine β-monooxygenase, peptidylglycine α-hydroxylating monooxygenase, and tyramine β-monooxygenase, in: Copper–Oxygen Chemistry, edited by: Karlin, K. D., Itoh, S., John Wiley & Sons Inc., Hoboken, United States, 1–22, https://doi.org/10.1002/9781118094365.ch1, 2011.
Pati, S. G., Bolotin, J., Brennwald, M. S., Kohler, H. P. E., Werner, R. A., and Hofstetter, T. B.: Measurement of oxygen isotope ratios () of aqueous O2 in small samples by gas chromatography/isotope ratio mass spectrometry, Rapid Commun. Mass Sp., 30, 684–690, https://doi.org/10.1002/rcm.7481, 2016.
Pati, S. G., Bopp, C. E., Kohler, H. P. E., and Hofstetter, T. B.: Substrate-specific coupling of O2 activation to hydroxylations of aromatic compounds by Rieske non-heme iron dioxygenases, ACS Catal., 12, 6444–6456, https://doi.org/10.1021/acscatal.2c00383, 2022.
Petit, J. R., Jouzel, J., Raynaud, D., Barkov, N. I., Barnola, J. M., Basile, I., Bender, M., Chappellaz, J., Davis, M., Delaygue, G., Delmotte, M., Kotlyakov, V. M., Legrand, M., Lipenkov, V. Y., Lorius, C., Pépin, L., Ritz, C., Saltzman, E., and Stievenard, M.: Climate and atmospheric history of the past 420 000 years from the Vostok ice core, Antarctica, Nature, 399, 429–436, https://doi.org/10.1038/20859, 1999.
Pimviriyakul, P. and Chaiyen, P.: Overview of flavin-dependent enzymes, in: The Enzymes – Flavin-Dependent Enzymes: Mechanisms, Structures and Applications, edited by: Chaiyen, P., Tamanoi, F., Academic Press, Cambridge, United States, 1–36, https://doi.org/10.1016/bs.enz.2020.06.006, 2020.
R Core Team: R: A language and environment for statistical computing, R Foundation for Statistical Computing, Vienna, Austria, https://www.R-project.org/, 2023.
Ribas-Carbo, M., Berry, J. A., Yakir, D., Giles, L., Robinson, S. A., Lennon, A. M., and Siedow, J. N.: Electron partitioning between the cytochrome and alternative pathways in plant mitochondria, Plant Physiol., 109, 829–837, https://doi.org/10.1104/pp.109.3.829, 1995.
Romero, E., Gómez Castellanos, J. R., Gadda, G., Fraaije, M. W., and Mattevi, A.: Same substrate, many reactions: oxygen activation in flavoenzymes, Chem. Rev., 118, 1742–1769, https://doi.org/10.1021/acs.chemrev.7b00650, 2018.
Roth, J.: Advances in studying bioinorganic reaction mechanisms: isotopic probes of activated oxygen intermediates in metalloenzymes, Curr. Opin. Chem. Biol., 11, 142–150, https://doi.org/10.1016/j.cbpa.2007.01.683, 2007.
Roth, J. and Klinman, J.: Oxygen-18 Isotope Effects as a Probe of Enzymatic Activation of Molecular Oxygen, in: Isotope Effects in Chemistry and Biology, edited by: Kohen, A., Limbach, H. H., CRC Press, Boca Raton, United States, 645–670, https://doi.org/10.1201/9781420028027, 2005.
Roth, J. P. and Klinman, J. P.: Catalysis of electron transfer during activation of O2 by the flavoprotein glucose oxidase, P. Natl. Acad. Sci. USA, 100, 62–67, https://doi.org/10.1073/pnas.252644599, 2003.
Savarino, J. and Thiemens, M. H.: Analytical procedure to determine both δ18O and δ17O of H2O2 in natural water and first measurements, Atmos. Environ., 33, 3683–3690, https://doi.org/10.1016/S1352-2310(99)00122-3, 1999.
Schmidt, H. L., Werner, R. A., and Roßmann, A.: 18O Pattern and biosynthesis of natural plant products, Phytochemistry, 58, 9–32, https://doi.org/10.1016/S0031-9422(01)00017-6, 2001.
Severinghaus, J. P., Beaudette, R., Headly, M. A., Taylor, K., and Brook, E. J.: Oxygen-18 of O2 records the impact of abrupt climate change on the terrestrial biosphere, Science, 324, 1431–1434, https://doi.org/10.1126/science.1169473, 2009.
Sharp, Z. D., Wostbrock, J. A. G., and Pack, A.: Mass-dependent triple oxygen isotope variations in terrestrial materials, Geochemical Perspectives Letters, 7, 27–31, https://doi.org/10.7185/geochemlet.1815, 2018.
Solomon, E. I., Heppner, D. E., Johnston, E. M., Ginsbach, J. W., Cirera, J., Qayyum, M., Kieber-Emmons, M. T., Kjaergaard, C. H., Hadt, R. G., and Tian, L.: Copper active sites in biology, Chem. Rev., 114, 3659–3853, https://doi.org/10.1021/cr400327t, 2014.
Stolper, D. A., Fischer, W. W., and Bender, M. L.: Effects of temperature and carbon source on the isotopic fractionations associated with O2 respiration for and ratios in E. coli, Geochim. Cosmochim. Ac., 240, 152–172, https://doi.org/10.1016/j.gca.2018.07.039, 2018.
Strong, P. J. and Claus, H.: Laccase: A review of its past and its future in bioremediation, Crit. Rev. Env. Sci. Tec., 41, 373–434, https://doi.org/10.1080/10643380902945706, 2011.
Su, Q. and Klinman, J. P.: Probing the mechanism of proton coupled electron transfer to dioxygen: The oxidative half-reaction of bovine serum amine oxidase, Biochemistry-US, 37, 12513–12525, https://doi.org/10.1021/bi981103l, 1998.
Su, Q., and Klinman, J.P.: Nature of oxygen activation in glucose oxidase from Aspergillus niger: The importance of electrostatic stabilization in superoxide formation, Biochemistry, 38, 8572–8581, https://doi.org/10.1021/bi990044o, 1999.
Sutherland, K. M., Hemingway, J. D., and Johnston, D. T.: The influence of reactive oxygen species on “respiration” isotope effects, Geochim. Cosmochim. Ac., 324, 86–101, https://doi.org/10.1016/j.gca.2022.02.033, 2022a.
Sutherland, K. M., Johnston, D. T., Hemingway, J. D., Wankel, S. D., and Ward, C. P.: Revised microbial and photochemical triple-oxygen isotope effects improve marine gross oxygen production estimates, PNAS Nexus, 1, pgac233, https://doi.org/10.1093/pnasnexus/pgac233, 2022b.
Tian, G. and Klinman, J. P.: Discrimination between l6O and l8O in oxygen binding to the reversible oxygen carriers hemoglobin, myoglobin, hemerythrin, and hemocyanin: A new probe for oxygen binding and reductive activation by proteins, J. Am. Chem. Soc., 115, 8891–8897, https://doi.org/10.1021/ja00073a001, 1993.
Tian, G. and Berry, J. A., Klinman, J. P.: Oxygen-18 kinetic isotope effects in the dopamine β-monooxygenase reaction: Evidence for a new chemical mechanism in non-heme, metallomonooxygenase, Biochemistry-US, 33, 226–234, https://doi.org/10.1021/bi00167a030, 1994.
van Berkel, W. J. H., Kamerbeek, N. M., and Fraaije, M. W.: Flavoprotein monooxygenases, a diverse class of oxidative biocatalysts, J. Biotechnol., 124, 670–689, https://doi.org/10.1016/j.jbiotec.2006.03.044, 2006.
Venables, W. N. and Ripley, B. D. (Eds.): Modern Applied Statistics with S, Springer New York, United States, https://doi.org/10.1007/978-0-387-21706-2, 2002.
Wang, X., Depew, D., Schiff, S., and Smith, R. E. H.: Photosynthesis, respiration, and stable isotopes of oxygen in a large oligotrophic lake (Lake Erie, USA–Canada), Can. J. Fish. Aquat. Sci., 65, 2320–2331, https://doi.org/10.1139/F08-134, 2008.
Welford, R. W. D., Lam, A., Mirica, L. M., and Klinman, J. P.: Partial conversion of Hansenula polymorpha amine oxidase into a “plant” amine oxidase: Implications for copper chemistry and mechanism, Biochemistry-US, 46, 10817–10827, https://doi.org/10.1021/bi700943r, 2007.
Werner, R. A. and Brand, W. A.: Referencing strategies and techniques in stable isotope ratio analysis, Rapid Commun. Mass Sp., 15, 501–519, https://doi.org/10.1002/rcm.258, 2001.
Wostbrock, J. A. G., Cano, E. J., and Sharp, Z. D.: An internally consistent triple oxygen isotope calibration of standards for silicates, carbonates and air relative to VSMOW2 and SLAP2, Chem. Geol., 533, 119432, https://doi.org/10.1016/j.chemgeo.2019.119432, 2020.
Yoshikawa, S. and Shimada, A.: Reaction mechanism of cytochrome c oxidase, Chem. Rev., 115, 1936–1989, https://doi.org/10.1021/cr500266a, 2015.
Young, E. D., Galy, A., and Nagahara, H.: Kinetic and equilibrium mass-dependent isotope fractionation laws in nature and their geochemical and cosmochemical significance, Geochim. Cosmochim. Ac., 66, 1095–1104, https://doi.org/10.1016/S0016-7037(01)00832-8, 2002.
Zanconato, S., Cooper, D. M., Armon, Y., and Epstein, S.: Effect of increased metabolic rate on oxygen isotopic fractionation, Resp. Physiol., 89, 319–327, https://doi.org/10.1016/0034-5687(92)90090-J, 1992.
Zhu, H., Peck, S. C., Bonnot, F., van der Donk, W. A., and Klinman, J. P.: Oxygen-18 kinetic isotope effects of nonheme iron enzymes HEPD and MPnS support iron(III) superoxide as the hydrogen abstraction species, J. Am. Chem. Soc., 137, 10448–10451, https://doi.org/10.1021/jacs.5b03907, 2015.
- Abstract
- Introduction
- Materials and methods
- Results
- Discussion
- Conclusions
- Appendix A: Experimental conditions by enzyme
- Appendix B: Enzyme assays for 18O kinetic isotope effects in O2-purged buffer
- Appendix C: Substrate-to-O2 consumption stoichiometries of laccase
- Appendix D: Derivation of apparent correlation between 18O KIE and Km(O2)
- Data availability
- Author contributions
- Competing interests
- Disclaimer
- Acknowledgements
- Financial support
- Review statement
- References
- Supplement