the Creative Commons Attribution 4.0 License.
the Creative Commons Attribution 4.0 License.
 | 23 Oct 2025
Improving marine sediment carbon stock estimates: the role of dry bulk density and predictor adjustments
Markus Diesing
William Ross Hunter
Anthony Grey
Brian P. Kelleher
Mark Coughlan
Continental shelves are critical for the global carbon cycle as they store substantial amounts of organic carbon (OC). Shelf sediments can also be subject to considerable anthropogenic pressures, offshore construction and bottom trawling for example, potentially releasing OC that has been sequestered into sediments. As a result, these sediments have attracted attention from policy makers regarding how their management can be leveraged to meet national emissions reduction targets. Spatial models offer solutions to identifying organic carbon storage hotspots; however, regional predictions of OC often rely on global scale predictors which may have biases on smaller scales, reducing their utility for practical management decisions. In addition, estimates of dry bulk density (DBD), an important factor in calculating OC stock from sediment OC content, are typically derived from an empirical relationship developed in one region and applied elsewhere, rather than from local in situ data, leading considerable uncertainty in regional OC stock estimates. We compared the performance of two spatial models of OC stock. The first used unadjusted predictors and a commonly used empirical relationship to estimate DBD. The second spatial model incorporated bias-adjusted predictors and a machine learning DBD model, trained on in situ DBD data. The adjusted model predicted a total OC reservoir of 46.6 ± 43.6 Tg in the top 10 cm of sediment in the Irish Sea, which was 31.4 % lower compared to unadjusted estimates. 70.1 % of the difference between adjusted and unadjusted OC stock estimates was due to the approach for estimating DBD. These findings suggest that previous models may have overestimated OC reservoirs and highlight the influence of accurate DBD and predictor adjustments on stock estimates. These findings highlight the need for increased in situ DBD measurements and refined modelling approaches to enhance the reliability of OC stock predictions. This study provides a framework for refining spatial models and underscores the importance of reducing uncertainties in key parameters to better understand and manage OC storage potential of marine sediments.
- Article
(3279 KB) - Full-text XML
-
Supplement
(1292 KB) - BibTeX
- EndNote


Continental shelves are important sinks of atmospheric carbon dioxide and play a key role in the global carbon cycle (Bianchi et al., 2018; Frankignoulle and Borges, 2001; Hedges and Keil, 1995). Marine sediments in these environments store substantial amounts of organic carbon (OC) over millennia (Laruelle et al., 2018; Smeaton et al., 2021b). Effective management of these natural long-term stores of OC has the potential to offer policy makers a mechanism to offset emissions. As a result, nature-based solutions to mitigating anthropogenic greenhouse gas emissions have received much scientific interest in recent years (Griscom et al., 2017). For example, coastal vegetated habitats store >30 Pg of OC globally and management of these habitats is thought to have the potential to offset approximately 3 % of annual global greenhouse gas emissions (Macreadie et al., 2021). Global estimates suggest that OC stocks in continental shelf sediments, ranging from 256 to 274 Pg, are up to nine times that of coastal vegetated habitats (Atwood et al., 2020). Although still heavily debated, emissions from human pressures on marine sediments may be substantial (Hiddink et al., 2023; Sala et al., 2021). Despite their large capacity to store OC, efforts to quantify stocks and potential emissions reductions from management are relatively recent (Diesing et al., 2017; Epstein et al., 2024; Smeaton et al., 2021a). Subcontinental and national scale OC stock estimates have been conducted. For example Diesing et al. (2017) reported that the Northwest European continental shelf holds between 230 and 880 Tg of OC in the top 10 cm of the sediment column, while Smeaton et al. (2021a) estimated that between 456 and 592 Tg of OC were stored in surficial (0–10 cm) marine sediments within the United Kingdom Exclusive Economic Zone.
Despite advancements in understanding OC storage in marine sediments, data and knowledge gaps remain. One such data gap is that of marine sediment Dry Bulk Density (DBD). DBD represents the mass of dry sediment within a given volume, which is multiplied by OC content and sediment depth to calculate the mass of OC in that given volume, which is termed OC stock (Taalab et al., 2013). DBD is a scaling factor on OC content and adjusts the OC stock in a given volume based on the density of sediment or soil. Thus, DBD has a significant effect on OC stock estimates. Previous estimates of OC stocks in terrestrial soils suggest much of the uncertainty in overall stock estimates results from uncertainty in soil density (Dawson and Smith, 2007). Despite the importance of DBD in calculating OC stock, there remains a lack of direct measurements for marine sediments. For example, Atwood et al. (2020) compiled a global database of ∼12 000 sediment cores to predict global OC stocks and over two-thirds (69 %) of their data were lacking DBD measurements.
Subcontinental predictions of OC content are frequently based on global environmental predictors (Diesing et al., 2017, 2021, 2024; Smeaton et al., 2021a), which may contain biases when applied to regional or smaller scales (Galmarini et al., 2019). To address these discrepancies, bias adjustment techniques are commonly used in other scientific disciplines, for example in climate science, where large-scale models are adjusted to better align with local observational data (Laux et al., 2021; Luo et al., 2018). Bias adjustments reduce systematic errors in model outputs and ensures that projections match local conditions and are reliable for practical applications (Laux et al., 2021). Bias adjustments have been used to improve climate model utility in agricultural impact assessments, such as predicting planting dates and crop suitability in water-limited regions; to correct overestimations in soil moisture models and to improve predictions in sea ice thickness (Laux et al., 2021; Lee and Im, 2015; Mu et al., 2018). Despite their widespread use in climate science, bias adjustment methods are underutilised in other areas of spatial environmental modelling, including OC stock modelling. These studies collectively highlight that bias adjustments are essential for improving the precision and applicability of climate model outputs across different environmental contexts, providing rationale for their application in this study.
Public data repositories provide an opportunity to use data gathered over large spatial scales not practical to collect over short- and medium-term research projects (Mitchell et al., 2019). Ocean and earth sciences data, in particular, lend themselves to being collated across research groups and sampling expeditions. Much of the instrumentation and parameters measured are the same, for example sediment properties and OC content. In order to perform bias adjustments of globally modelled data, large datasets of parameters of interest are required (Laux et al., 2021). Public repositories, for example, the Pangaea repository of datasets (Felden et al., 2023), the International Council for the Exploration of the Seas (ICES) data centre (https://www.ices.dk/data/Pages/default.aspx, last access: 15 October 2024) and national repositories such as Ireland's Marine Institute offer large amounts of ocean data which can be used to perform localised bias adjustments. Additionally, data specifically useful for spatial modelling of marine sedimentary OC stock, for example OC content and DBD is available from the Modern Ocean Sediment Archive and Inventory of Carbon (MOSAIC) (Paradis et al., 2023; Paradis and Eglinton, 2024).
OC stock is not directly measured; it is calculated by multiplying OC content, DBD and sediment depth. This study aimed to improve two components of this equation, OC content and DBD. Since the accuracy of OC stock estimates depends on the accuracy of these inputs, we assume that any improvements or errors in OC content and DBD would be reflected in the final OC stock estimates. While it is not possible to directly verify whether our adjusted OC stock values represent the true values, the improvements in model performance for both OC content and DBD support the assumption that our revised estimates are more accurate. To address this question, the estimates of two spatial models to predict OC stock in surficial sediments in the Irish Sea were contrasted. The first model was developed by using unadjusted predictors and a widely used DBD model (Diesing et al., 2017, 2021; Smeaton et al., 2021a) to estimate OC stock from OC content; and the second model was developed by bias adjusting and downscaling predictors using observational data and a machine learning spatial model of DBD (Fig. 1).
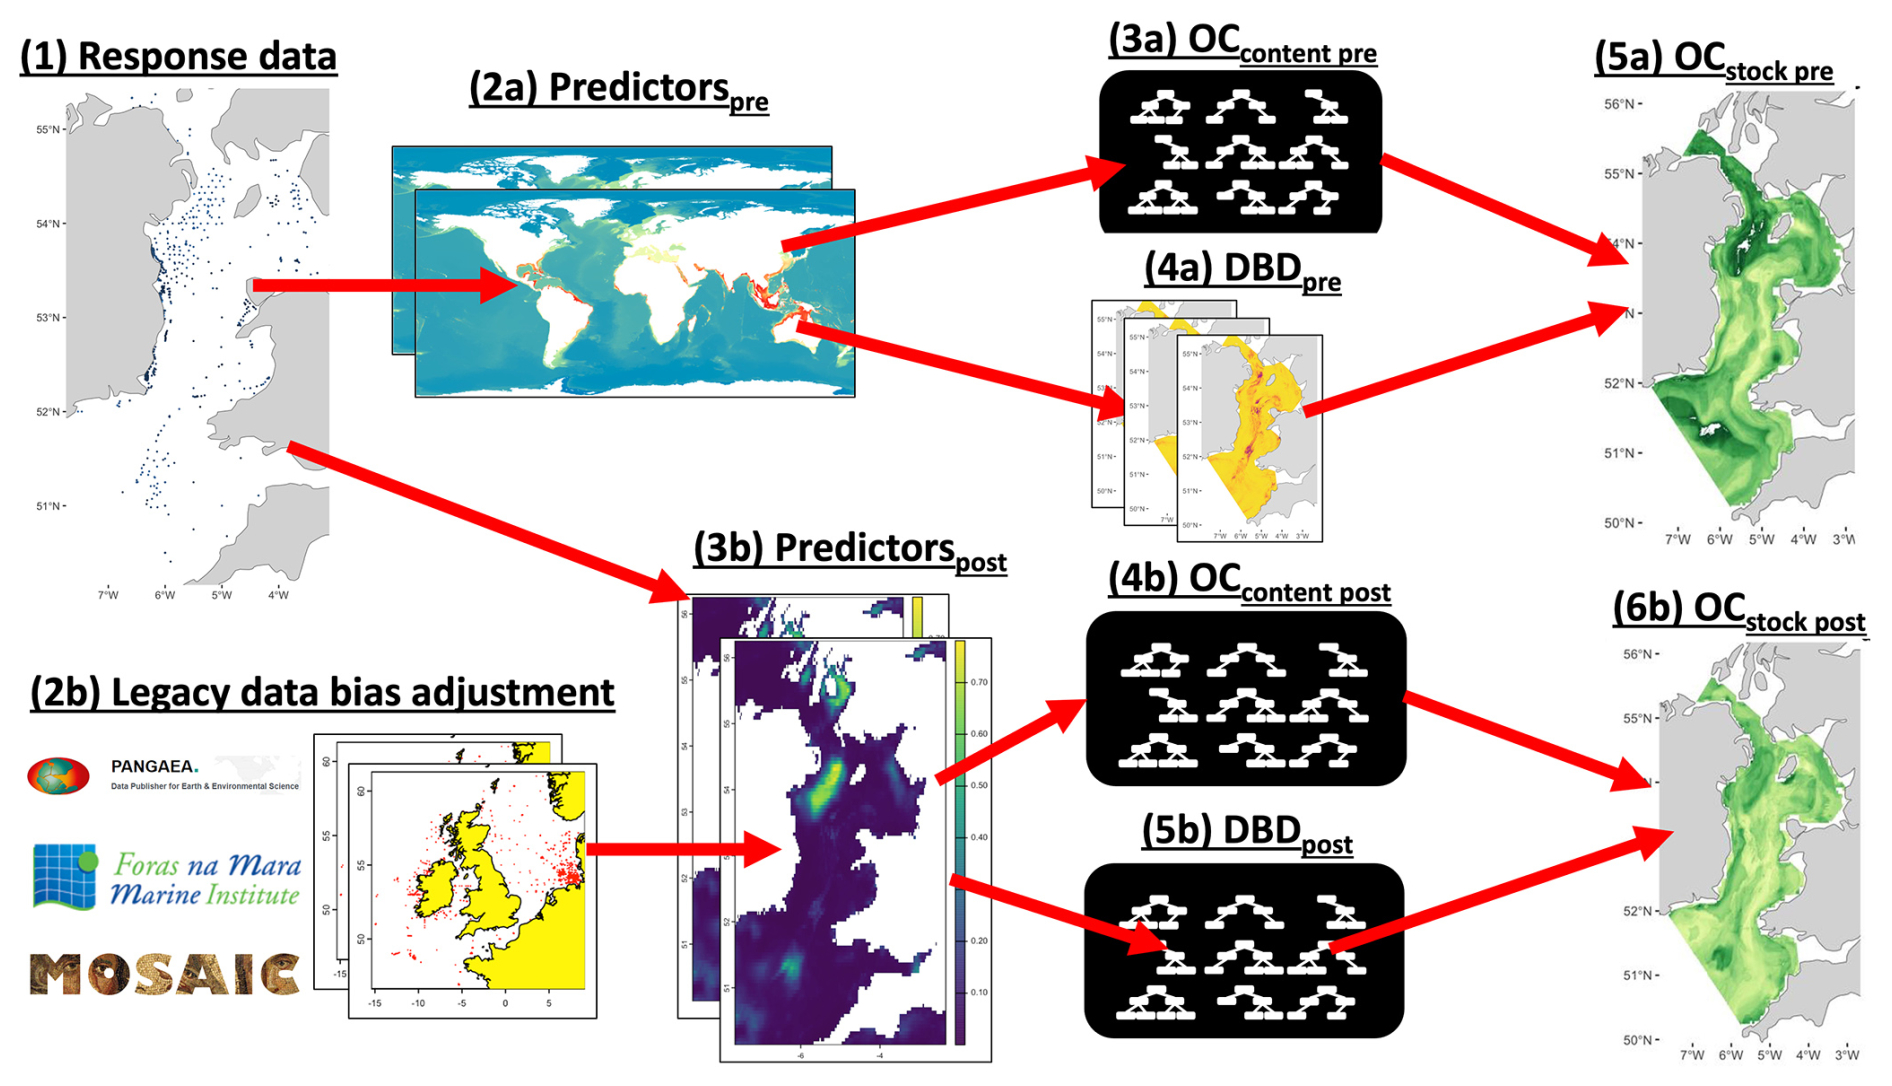
Figure 1Summary of steps taken to train and predict form two different models, which include: (1) collating response data; (2a) compiling OC content predictor data (predictorsunadj); (3a) training a random forest model to predict OC content on the non-adjusted predictor data (OCunadj); (4a) modelling Dry Bulk Density (DBD) from porosity (DBDunadj); (5a) predicting OC stock across the study area using OCcont,unadj and DBDunadj; (2b) bias adjusting predictorsunadj data using quantile-quantile mapping; (3b) compiling OC content predictor data after it has been bias adjusted (OCcont,adj); (4b) training a random forest model to predict OC content on the bias adjusted predictor data (predictorsadj); (5b) training a random forest model to predict DBD on the bias adjusted predictor data (DBDadj); (6) predicting OC stock across the study area using OCcont,adj and DBDadj.
The Irish Sea was selected as the study area due to its ecological and economic importance, making it a focal point for marine resource management and conservation. It is a cross-jurisdictional region bordered by both the UK and Ireland, where overlapping policy and management frameworks elevate its relevance for spatial planning. The Irish Sea supports some of the highest fishing intensities in Europe, with bottom otter trawling, a type of fishing gear typically used to catch species on or near the seabed, in areas such as the western Irish Sea “mud belt” and the “Smalls” reaching an annual average of 14 h per km2 between 2009 and 2014 (ICES, 2014). These same areas account for the majority of Nephrops landings in Ireland and contribute significantly to the European market, with Nephrops caught within the Irish EEZ alone valued at EUR 53.2 million (Gerritsen and Lordan, 2014). Notably, Nephrops inhabit muddy sediments, which are associated with high OC stocks. Although OC stock estimates exist for the Irish Sea, they are often either coarsely resolved or geographically limited in scope (Diesing et al., 2017; Smeaton et al., 2021a), highlighting the need for refined spatial modelling. This is particularly important in the Irish Sea, where although the region is generally data-rich, limited information on the impacts of human activities on marine sedimentary OC stocks has been identified as a barrier to incorporating OC into marine spatial planning frameworks (Allcock et al., 2024; Crowe et al., 2023). Moreover, the availability of broader environmental datasets makes the Irish Sea well suited to test and apply the spatial modelling workflow developed in this study.
The Irish Sea is a shallow continental shelf sea between the land masses of the island of Ireland and Great Britain, with an average water depth of 60 m and a maximum depth of approximately 315 m. The area has a complex geological history of previous glaciation coupled with marine transgression, and so the seafloor in this area consists of a mosaic of sediment types and bedforms (Arosio et al., 2023; Scourse et al., 2019; Ward et al., 2015). At present, a combination of wave and tidal current action results in a significant amount of sediment being mobilised and transported within the region (Coughlan et al., 2021).
The study area detailed here covers a marine area of 75 229 km2 and spans latitudes 50 to 56° N and longitudes 8 to 2° W (Fig. 2). OC content (%) (OCcont) and OC stock (OCstock) were estimated within the study area, excluding areas within inshore waters (Smeaton et al., 2021a). The inshore area was excluded from the study area and was defined as the landward area of the low-water line along the coast as recognised by the Maritime Boundaries Geodatabase (Flanders Marine Institute, 2023).
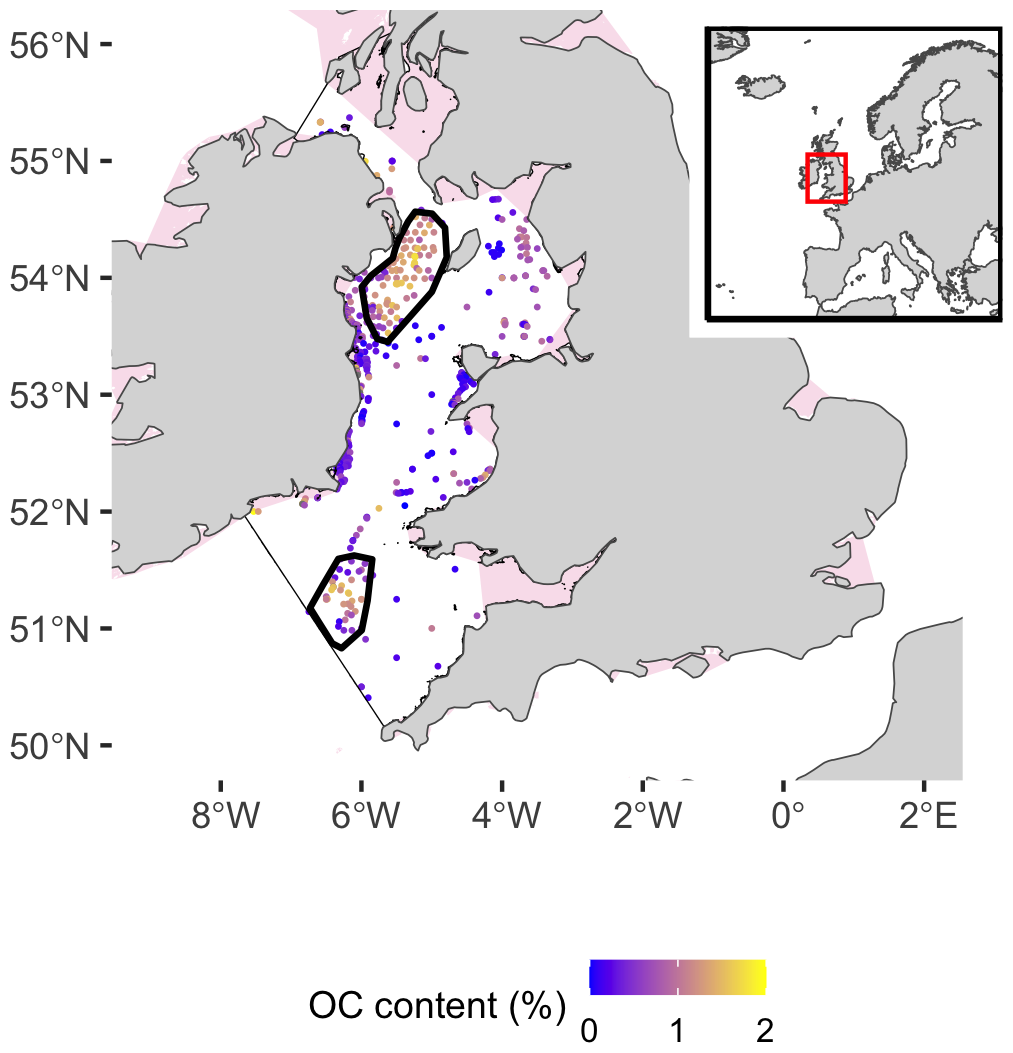
Figure 2Study area within the Irish Sea (thin black border) and within the greater North West European shelf (inset). Points indicate organic carbon (OC) data coloured by the organic carbon content. Pink areas show internal waters that have been excluded from the study area. Thick black outlined polygons indicate the western Irish Sea “mud belt” (northern) and the “Smalls” (southern), areas of known high mud content within the Irish Sea.
To estimate OCstock in surficial sediments, we developed and compared two modelling workflows. Each workflow involved predicting OCcont and dry bulk density (DBD), which were then combined to calculate OCstock. The key difference between the two workflows was the way environmental input data (predictors) were treated. The first approach used unadjusted, commonly available predictors and a standard DBD estimation method, while the second approach used bias-adjusted predictors, which were corrected using observational data and used a machine learning model to estimate DBD. A schematic overview of the workflow is provided in Fig. 1. Briefly, the process of bias-adjusting shifts the distribution of predictor data based on observational data in an effort to align predictor data with in situ observations. We evaluated the success of these improvements in two ways. First, we tested whether bias-adjusted predictors more closely matched local measurements, using an error metric (Root Mean Squared Error; RMSE) which measured how far predictions deviated from in situ observations. Second, we assessed whether these improved predictors led to more accurate predictions of OCcont and DBD using machine learning models, using cross-validation and RMSE. The assumption underpinning this study is that predictors that better align with in situ data would produce more reliable predictions of OCcont and DBD and thus more reliable estimates of OCstock.
3.1 Compiling response and predictor datasets
3.1.1 Response data
Sediment OCcont and DBD measurements were obtained from various sources, including published scientific literature, government organizations, and one private organization (Table S1 in the Supplement). Prior to developing spatial modes, response data were screened and smoothed to ensure consistency and minimise erroneous data points that could bias prediction stability. Only data from the top 10 cm of the sediment column were included, as the study aimed to estimate surficial sediment OCstock as this is standard among larger scale marine sediment OCstock quantification studies, making our results comparable to others (Diesing et al., 2017, 2021, 2024). Within the wider Northwest European shelf, sedimentation rates can range between 0 and 0.61 cm yr−1 (Diesing et al., 2021), assuming a mean sedimentation rate of the mid-point between these values (0.31 cm yr−1), the top 10 cm corresponds to approximately the last 33 years, based on 210Pb sedimentation rates. Geographic locations of all response data were visually inspected to ensure they fell within the study area. Response data were spatially smoothed to match the finest resolution model predictor (EMODNet bathymetry, approximately 155 m by 230 m cell size). When multiple response data values occurred within a single grid cell, the average across the grid cell was calculated (Wei et al., 2022). Regarding OCcont, where only Loss on Ignition (LOI) values were available, OCcont was estimated using Eq. (1), which was locally derived and based on 102 surficial sediment Irish Sea samples analysed with an elemental analyser (Grey et al., 2024):
A total of 1670 in situ measurements of surficial sediment OCcont were obtained from various sources within the study area (Fig. 2). After spatial aggregation of OCcont data and removing data points within the excluded inshore area, 450 data points were available for model training. DBD had 642 data points across the entire Northwest European Shelf.
3.1.2 Predictor data
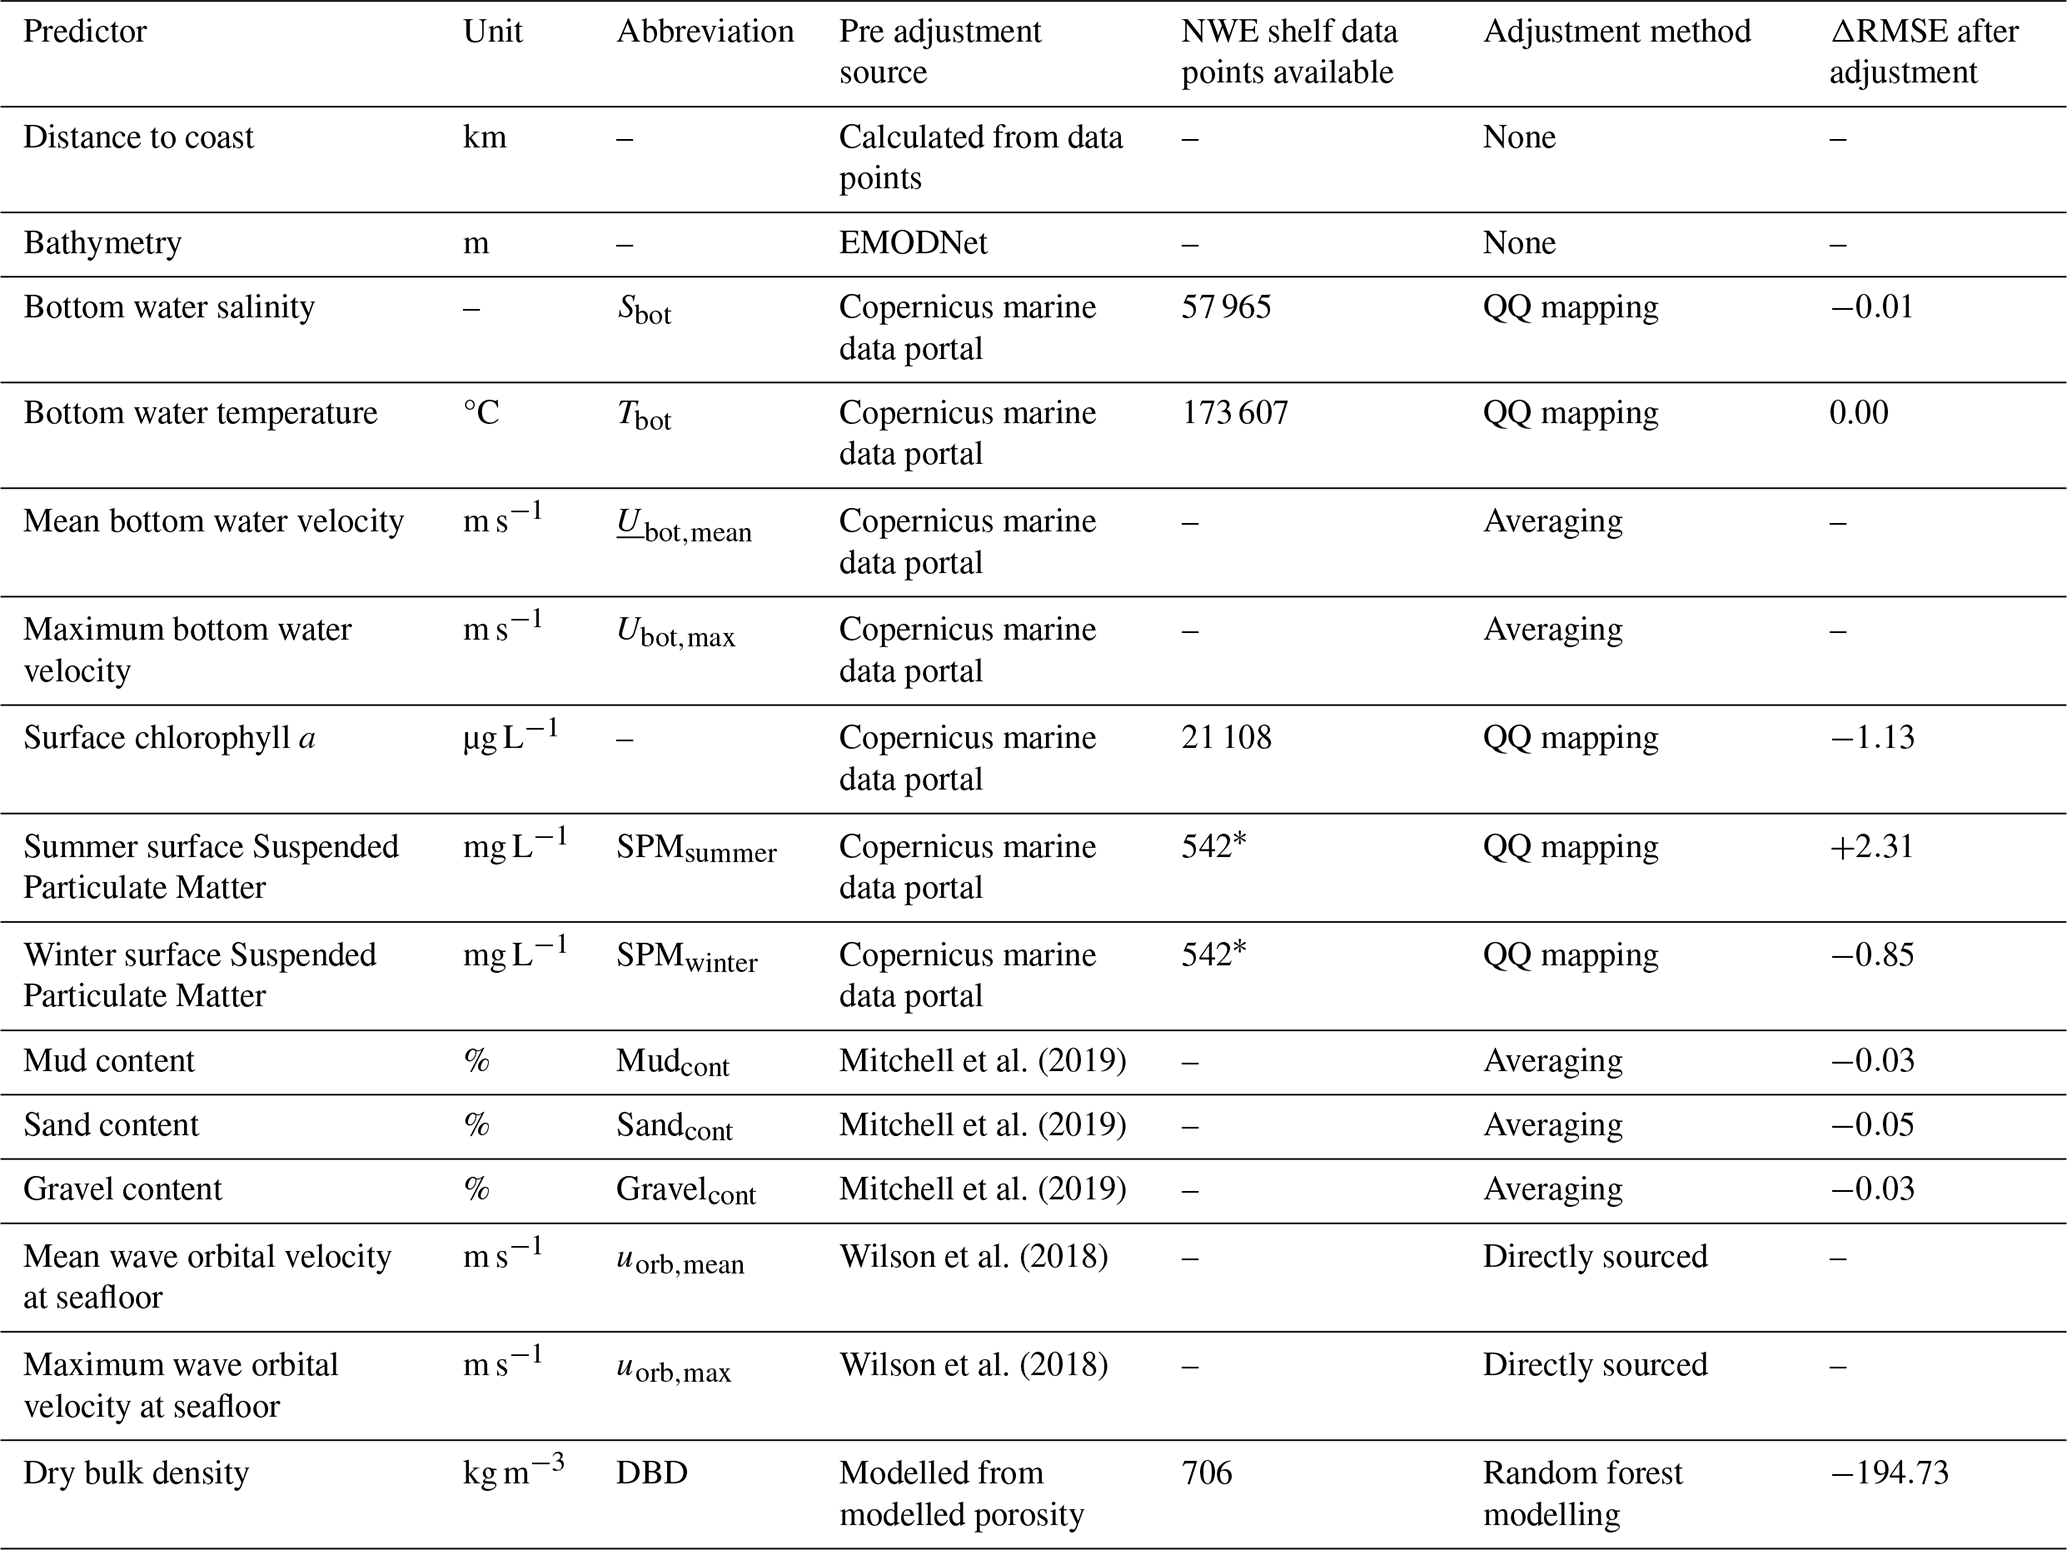
To compare the two spatial models for predicting OCcont, we developed two predictor datasets: pre-bias adjustment predictors (predictorspre) and post-bias adjustment predictors (predictorspost) (Table 1). Predictor variables were selected based on their availability and expected relevance to OCcont and predictors used in previous spatial modelling work of OCcont (Diesing et al., 2017, 2021). Predictorspre were obtained from various governmental organizations and scientific literature (Table 1). Detailed descriptions of these predictors are provided in the methods in the Supplement.
Table 1Summary of organic carbon content and stock model inputs. Directly sourced adjustments were when the adjusted data was soured directly from literature that developed a model based on locally measured observational data. SPM data points were for all months to create monthly interpolated surfaces then they were merged to create seasonal interpolated surfaces. ΔRMSE represents the change in RMSE after QQ mapping. Negative RMSE values represent reduced error, while positive RMSE values show increased error.
As global scale models can have biases on regional scales (Casanueva et al., 2018, 2020; Galmarini et al., 2019; Roberts et al., 2019), we created predictorspost by bias adjusting and downscaling predictorspre data using in situ data. To increase the amount of observation data available for adjustment, we included measurements from across the Northwest European Shelf, not just the Irish Sea. These data were sourced from public repositories: Pangaea (https://www.pangaea.de/, last access: 7 November 2024), The Marine Institute (https://erddap.marine.ie/erddap/tabledap/IMI_CTD.html, last access: 20 March 2024) and MOSAIC (Paradis et al., 2023; Paradis and Eglinton, 2024), and were temporally aligned with predictor data. More detail of the observational data is provided in Supplement.
3.2 Bias adjusting predictors
Depending on data availability, different approaches were used to bias adjust predictorspre. For bottom water temperature (Tbot), bottom water salinity (Sbot), mean and maximum bottom water velocities (Ubot,mean and Ubot,max), surface chlorophyll a, summer surface suspended particulate matter (SPMsummer) and winter surface suspended particulate matter (SPMwinter), a quantile-quantile (QQ) mapping approach was used (Casanueva et al., 2020). For bias adjusting predictors, data availability varied significantly (Table 1). For example, Tbot had more than 300 times the amount of data as SPM, which had the least amount of data available. First, point observational data were harmonized with predictorspre. Briefly, observation data were smoothed across time and space and then interpolated to create a spatially continuous surface (Cheng et al., 2017, 2020; Cheng and Zhu, 2016). Original predictor data were then adjusted using the interpolated surface by QQ mapping. This approach aligns the quantiles in observational and modelled data and preserves the spatial patterns of the original data, and has been shown to outperform un-adjusted models (Ngai et al., 2017). However, QQ mapping may be sensitive to outliers and is less reliable in capturing extreme values (Casanueva et al., 2020). To mitigate this, observational data were smoothed prior to interpolation and QQ mapping to reduce the influence of extreme values. More detail of the point data smoothing and QQ mapping is provided in the Supplement.
For sediment properties (mud (the sum of silt and clay), sand, and gravel content) three existing spatial models were averaged (Mitchell et al., 2019; Stephens and Diesing, 2015; Wilson et al., 2018) as previous research has shown averaging multiple models can improve predictions (Dormann et al., 2018). Sediment compositional data were pre-treated before averaging as they are proportional, bounded by 0 and 1 and their sum must equal 1 (Supplement) (Mitchell et al., 2019; Stephens and Diesing, 2015; Wilson et al., 2018).
Other variables were handled as follows: adjusted current and wave orbital velocities at the seabed were sourced directly from locally developed models (Table 1) (Coughlan et al., 2021); distance to coast was not adjusted as it is a simple calculation and bathymetry was taken directly from EMODNet, which is a widely used high resolution model and was developed specifically for European waters (https://emodnet.ec.europa.eu/, last access: 23 February 2024).
3.3 Validating predictor accuracy
The predictorspost dataset was validated against observation data to assess whether bias adjustment improved their agreement with in situ data. To avoid artificial skill, a k fold cross-validation approach was used, where each fold excluded a different, non-overlapping fifth of the observation dataset during adjustment (Maraun and Widmann, 2018). For each fold, the Root Mean Squared Error (RMSE) was calculated using only the excluded data, providing a more reliable estimate of prediction error (Maraun and Widmann, 2018). The average RMSE across all folds was then compared to the RMSE of the original (pre-adjustment) predictors. Lower RMSE values represent improvements in model performance (Maraun and Widmann, 2018).
3.4 Dry bulk density estimates
DBD is the mass of dry sediment per unit volume of wet sediment and is required to calculate OCstock from OCcont. Although not used as a predictor OCcont, it is crucial in calculating OCstock. Two versions of DBD were developed: an un-adjusted estimate and an adjusted version, to pair with respective OCcont models (un-adjusted vs. adjusted). Pre-adjusted DBD (DBDpre) was calculated using a commonly used approach from sediment porosity using Eqs. (2), (3) and (4) (Diesing et al., 2017; Smeaton et al., 2021a):
Sediment porosity (φ) was calculated as a function of spatially averaged mud content (mudcont) and assumed a constant grain density (ρs) of 2650 kg m−3. In contrast, bias adjusted DBD (DBDpost) was spatially modelled using in situ DBD measurements from the Northwest European Shelf and a machine learning approach (Breiman, 2001). The model training procedure and specific algorithm and predictor selection is described in detail in Sect. 3.5, alongside modelling of OCcont.
3.5 Training machine learning models
Two models of OCcont were trained to compare the use of pre-adjustment (OCcont,pre) and bias-adjusted (OCcont post) predictors. Both models used the Random Forest (RF) algorithm, which performs well for geospatial modelling (Diesing et al., 2021; Hengl et al., 2015; Meyer et al., 2018). Predictors were selected using the Forward Feature Selection (FFS) algorithm, which iteratively builds models by adding one predictor at a time (Meyer et al., 2018). It begins with all possible 2-predictor combinations, retains the best performing pair, and then adds additional predictors only if they reduce the model's RMSE (Meyer et al., 2018).
After training, partial dependence plots were used to visualize the associations between OCcont and the selected predictors. The adjusted DBD model, DBDpost, was developed in the same way, using an RF FFS applied to the bias adjusted predictors and was later used to calculate OCstock.
3.6 Model validation
All FFS RF models (OCcont,pre, OCcont,post and DBDpost) were validated using the k Nearest Neighbour Distance Matching (kNNDM) Leave-One-Out (LOO) Cross Validation (CV) approach (Milà et al., 2022). This approach matches the distance distribution functions of training to testing data to the distance distribution function of prediction to training data (Figs. S2 and S3 in the Supplement). Random k-fold cross-validation can produce overly optimistic performance estimates by allowing spatially autocorrelated data to be split across training and testing sets. In contrast, kNNDM explicitly enforces spatial independence between folds, so that models are evaluated on data that is spatially uncorrelated with the training data. This provides a more realistic estimate of model In addition to kNNDM, the RMSE of DBDpost predictions was calculated against in situ measurements to evaluate whether the machine learning model outperformed the unadjusted estimates of DBD (DBDpre) (details in Sect. 3.4). Model stability was also tested by examining prediction consistency across repeated runs using the final selected predictors. We looked at prediction stability in the highest and lowest 15 % of predicted values, we specifically chose this threshold as this is the range most susceptible to the effects of outliers (Lange et al., 2025).
3.7 Model uncertainty
It should be noted that the uncertainty estimates derived here are limited to model variance. Uncertainty introduced from measurement error in response variables (OC content or DBD) and input predictors, for example, chlorophyll a, Tbot, sediment properties, etc. was not quantified due to a lack of available uncertainty in the underlying datasets. Uncertainty for both OCcont models and DBDpost was estimated using the sum of the standard deviations of 25 RF model predictions (Diesing et al., 2021). For each run, response data were randomly split into 70 % training and 30 % testing sets, resulting in 25 models. For each pixel, the standard deviation of the 25 predictions was computed. The total uncertainty was then determined by summing these standard deviations across the study area (Diesing et al., 2021). In addition, an Area of Applicability (AOA) analysis was conducted to assess whether our adjusted OC content and DBD models could be reliably applied to the study area (Meyer and Pebesma, 2021). AOA identifies regions where the training and prediction data are comparable, indicating where machine learning models are likely to make reliable predictions. The analysis calculates a Dissimilarity Index (DI), which quantifies how different the prediction data are from the training data.
3.8 Calculation of organic carbon stock and total reservoir
The spatial variation in OCstock, which is the mass of OC stored in sediment per unit area to a specific depth, was calculated using both unadjusted (OCcont,pre and DBDpre) and adjusted inputs (OCcont,post and DBDpost) inputs. OCstock was calculated using the following equations (Diesing et al., 2017) :
OCcontent and DBD were the predicted outputs from the respective pre-adjustment (pre) and post bias adjustment models (post) Cell area was calculated for each grid cell using the cellSize() function in the terra package (Hijmans, 2025) in R, which accounts for spatial variation in cell size rather than assuming a constant cell size across the study area. A constant depth of 10 cm was used to estimate surficial sediment. These equations were applied to every grid cell across the study area.
To estimate the total organic carbon (OC) reservoir in the study area, predicted OC stock values were summed across all grid cells. To assess the relative contribution of OC content and DBD estimates to the final OC stock values, we calculated OC stock using all four combinations of input models: (1) Pre-adjustment OC content with post bias-adjustment DBD, (2) pre-adjustment OC content with adjusted DBD, (3) adjusted OC content with unadjusted DBD, and (4) adjusted OC content with adjusted DBD. Total OC stock uncertainty was calculated using the following equation:
4.1 Data collation
4.1.1 Data sourced
Predictor improvement
With the exception of SPMsummer and Tbot, all bias adjusted predictors (predictorspost) data showed improved agreement with in situ data, based on RMSE comparisons (Table 1). As no improvement was observed in SPMsummer and Tbot, their pre-bias adjustment versions were retained in the predictorspost dataset for model training.
The degree of adjustment varied across variables (Fig. 3). For instance, mean RMSE change for Sbot was minimal, With a mean difference of 0.09 psu between predictorspre and predictorspost. In contrast, SPMwinter was adjusted to a greater degree, showing a mean change of −9.97 mg L−1, which is also reflected in a greater shift in its distribution (Fig. 3). Sediment properties, mud, sand and gravel content were not changed to a large degree (Fig. 3). The mean change between predictorspre to predictorspost for mudcont, sandcont and gravelcont was −0.03, 0.07 and −0.04, respectively.
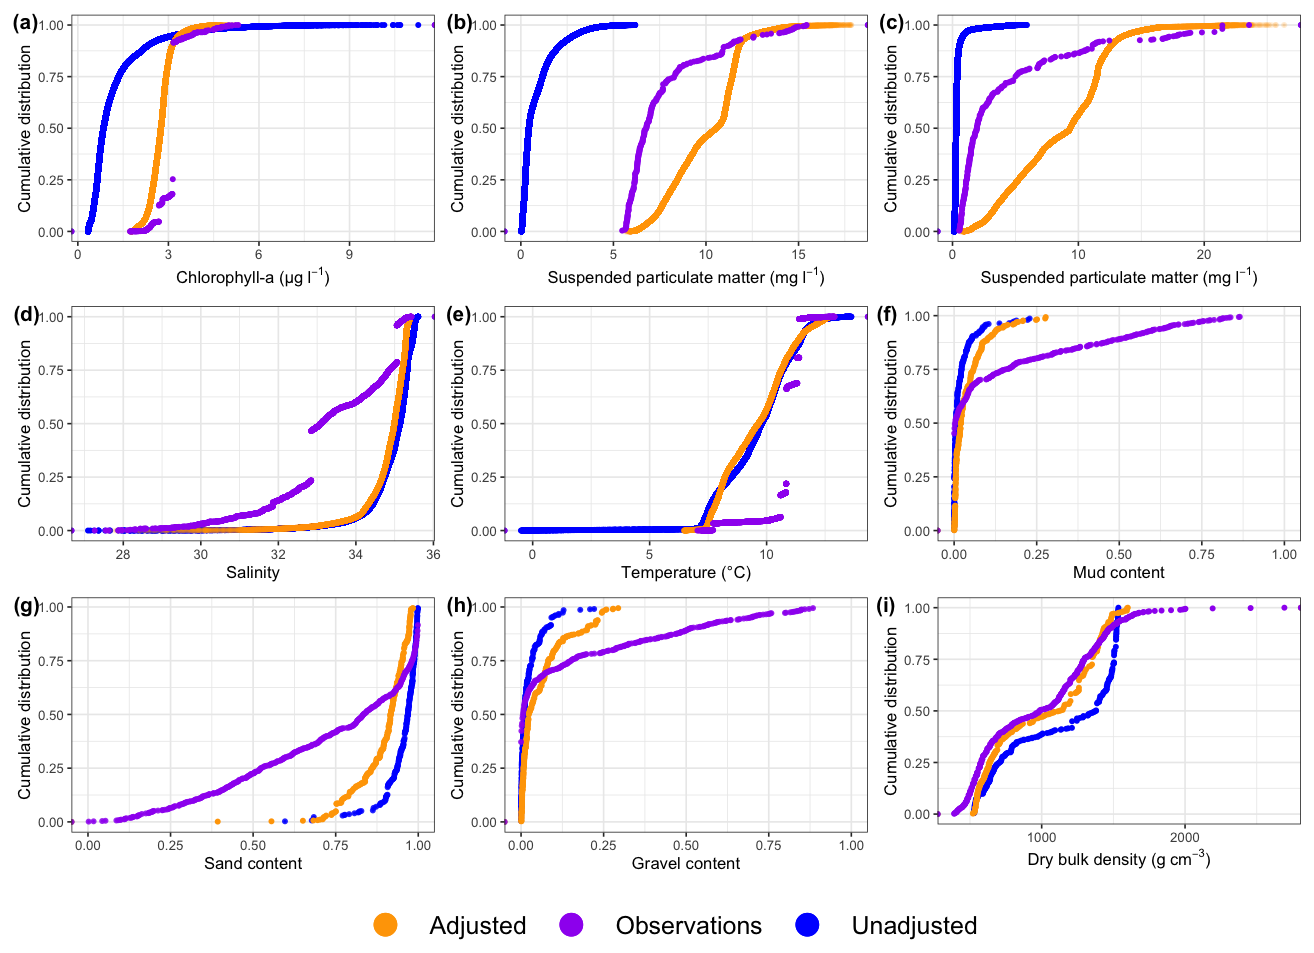
Figure 3Cumulative distribution functions (CDF) of bias adjusted (adjusted) and not bias adjusted (modelled) model input data and observational data used in bias adjustment.
4.2 Random forest modelling
4.2.1 OCcont and DBDpost Variable selection
Different predictors were selected during the OCcont model training process. Seven important predictors were selected for OCcont,pre (Fig. S3), while five were chosen for OCcont,post (Fig. 4). For OCcont,post, the selected predictors were mudcont, uorb,max, distance to the nearest coast, chlorophyll a and bathymetry. Among these, mudcont and uorb,max were the most important, removing them increased the model's Mean Squared Error (MSE) by 56.8 % and 32.4 %, respectively (Table S2). Partial plots showed OCcont increased with mudcont and decreased with uorb,max (Fig. 4).
For OCcont,pre, the selected predictors were SPMsummer, distance to the nearest coast, Tbot, Sbot, chlorophyl a, uorb,max and sandcont (Fig. S3). The most important of these was SPMsummer, whose removal increased model MSE by 37.1 % (Table S2).
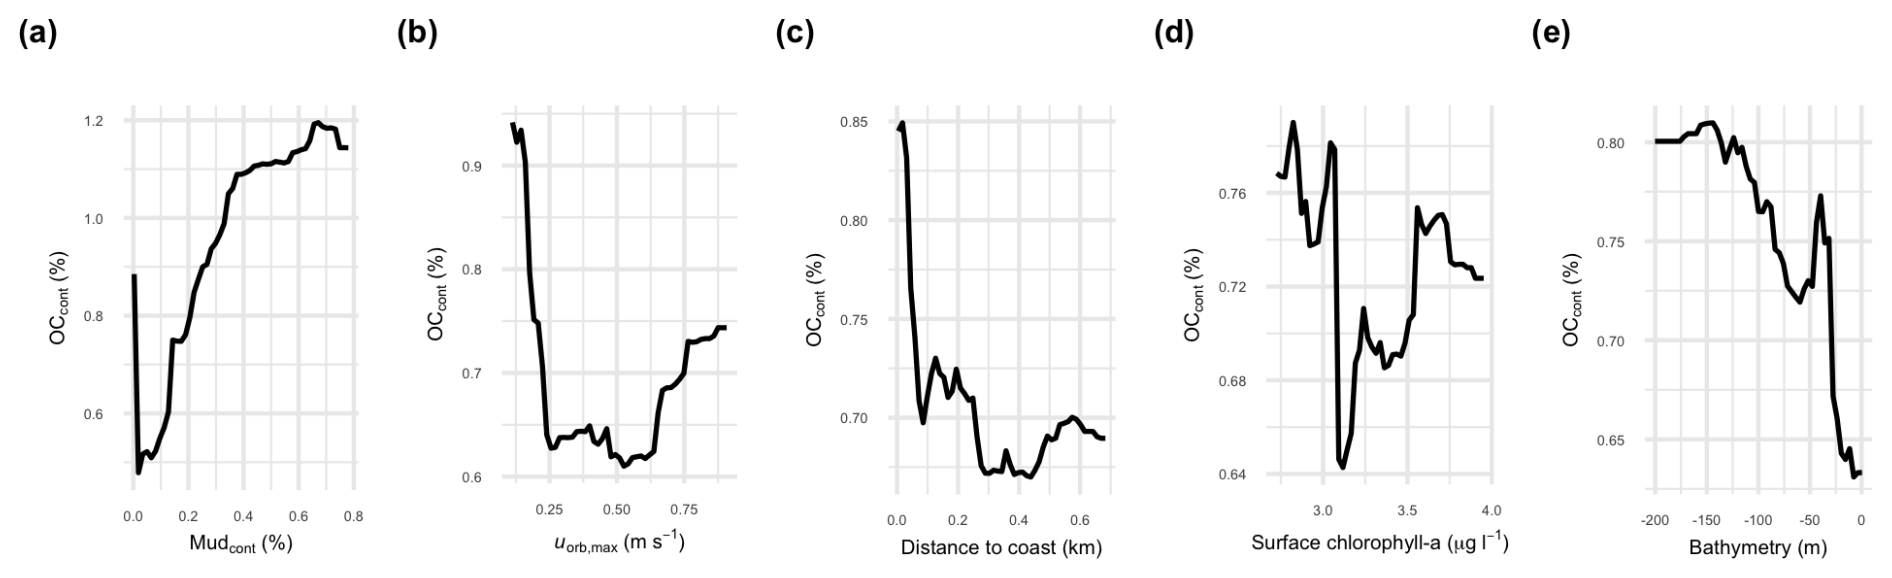
Figure 4Partial dependence plots showing the relationship between OC content and bias adjusted predictors selected by FFS: mud content, maximum wave orbital velocity at the seafloor, distance to the nearest coast, surface chlorophyll a, and bathymetry.
Six important predictors were selected for the DBDpost model: sandcont, SPMsummer, SPM, uorb,max, and Ubot,mean. Sandcont, was the most important predictor, with a positive relationship to DBD (Fig. 5). Its removal increased model MSE by 45.9 % (Table S2).
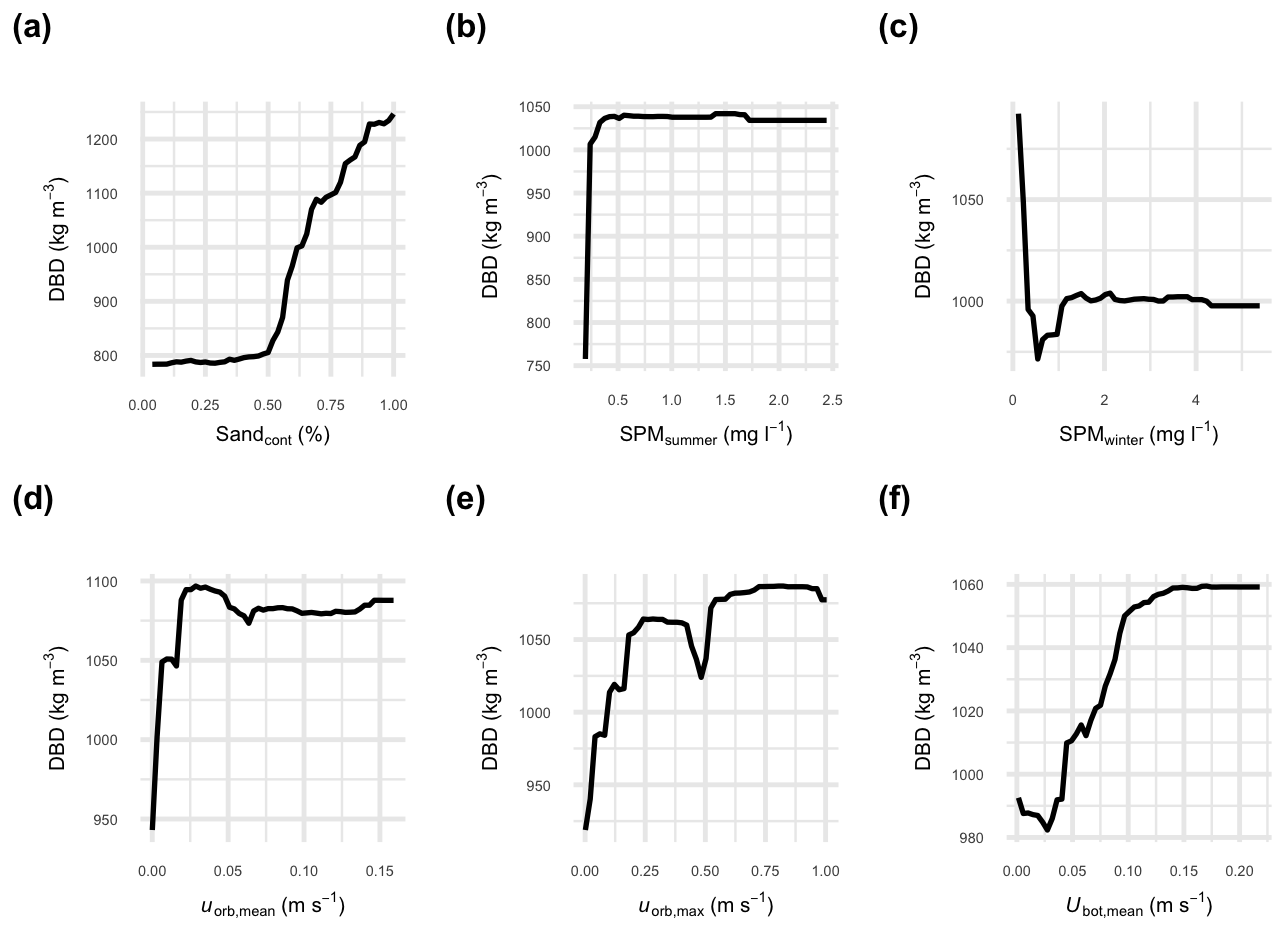
Figure 5Partial dependence plots showing the relationship between bias adjusted predictors selected by FFS and dry bulk density (DBD): sand content, surface summer suspended particulate matter, surface winter suspended particulate matter, mean wave orbital velocity at the seafloor, maximum wave orbital velocity at the seafloor, and current velocity at the seafloor.
4.2.2 Model performance and predictions
OCcont,post had an R2 of 0.47 and RMSE of 0.31 %, and showed a slight improvement in performance compared to OCcont,pre, (OC vs. OCcont,pre; OCcont,postΔRMSE % vs. OCcont,pre). Despite this, predicted OCcont values were generally similar across the study area. The mean OCcont,post prediction was 0.58 ± 0.61 %, compared to 0.65 ± 0.67 % for OCcont,pre (Table 2). Spatial differences were not uniform, OCcont,adj was higher in areas such as near the Irish coast and southeast of the Isle of Man (Fig. 5). Area of Applicability (AOA) analysis of our adjusted OCcont model showed that 97.1 % of the study area fell within its AOA (Fig. S4). For the DBDpost model, 93.6 % of the study area was within the AOA (Fig. S4). RF model stability analysis revealed that a prediction stability of 95 % was achieved with only 29 trees (the models were trained with 500 trees), indicating highly consistent predictions across runs. This low tree requirement suggests the RF models are not overly sensitive to variation in the training data.
Table 2Summary of outputs from models trained on non-bias adjusted data (predictorspre) and bias adjusted data (predictorspost). Mean OCcont represents the mean prediction value across the study area; total reservoir estimate is the total OC stock reservoir for the study area; mean DBD is the mean DBD predicted across the study area.
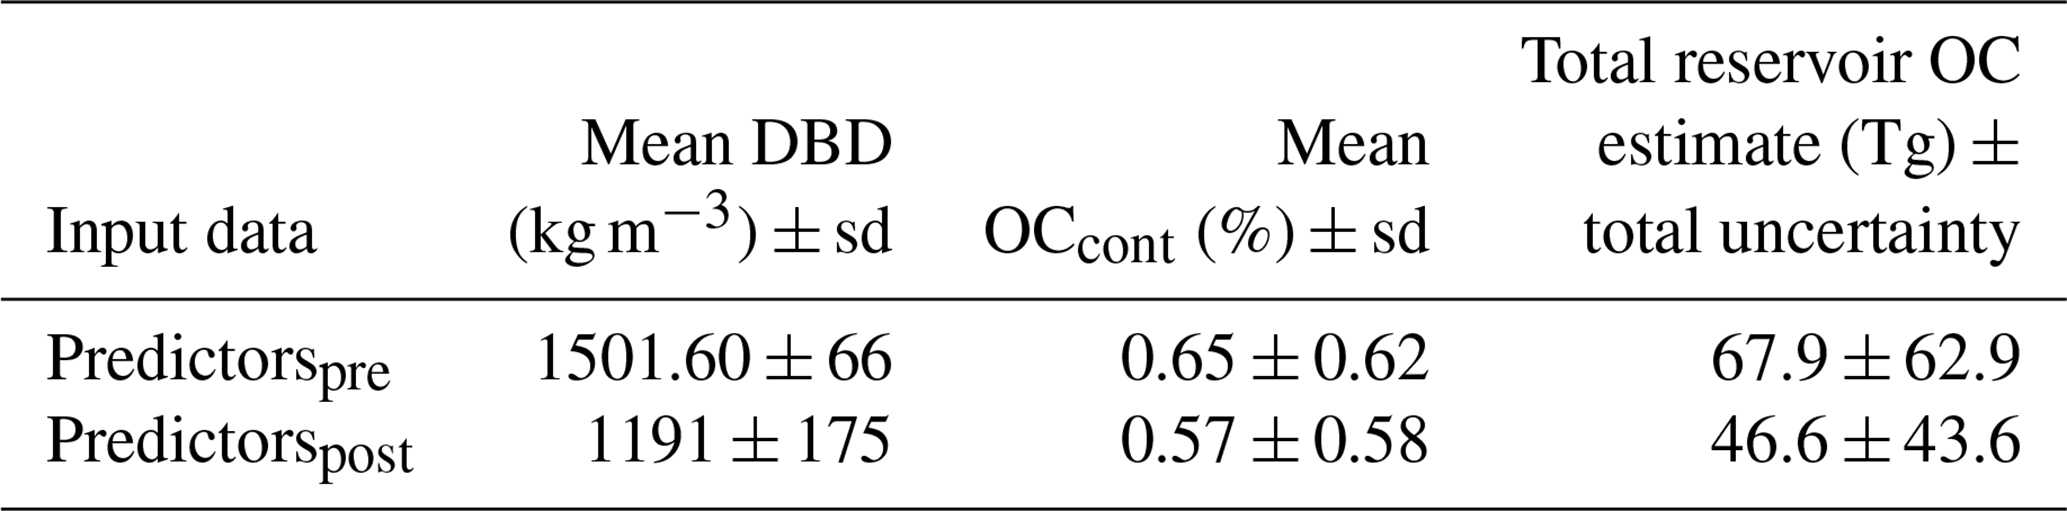
In contrast, the adjusted DBD model (DBDpost) had a better agreement with in situ data compared to DBDpre (Table 1). DBDpost explained 48% of the variance in in situ DBD data, with an RMSE of 192 kg m−3. Within the study area, DBDpost predicted consistently lower values than DBDpre, with a mean reduction of 310 kg m−3. This reduction was even more pronounced in high mud regions like the Smalls and the western Irish Sea “mud belt”, where average reductions reached 506 kg m−3 (Fig. 6).
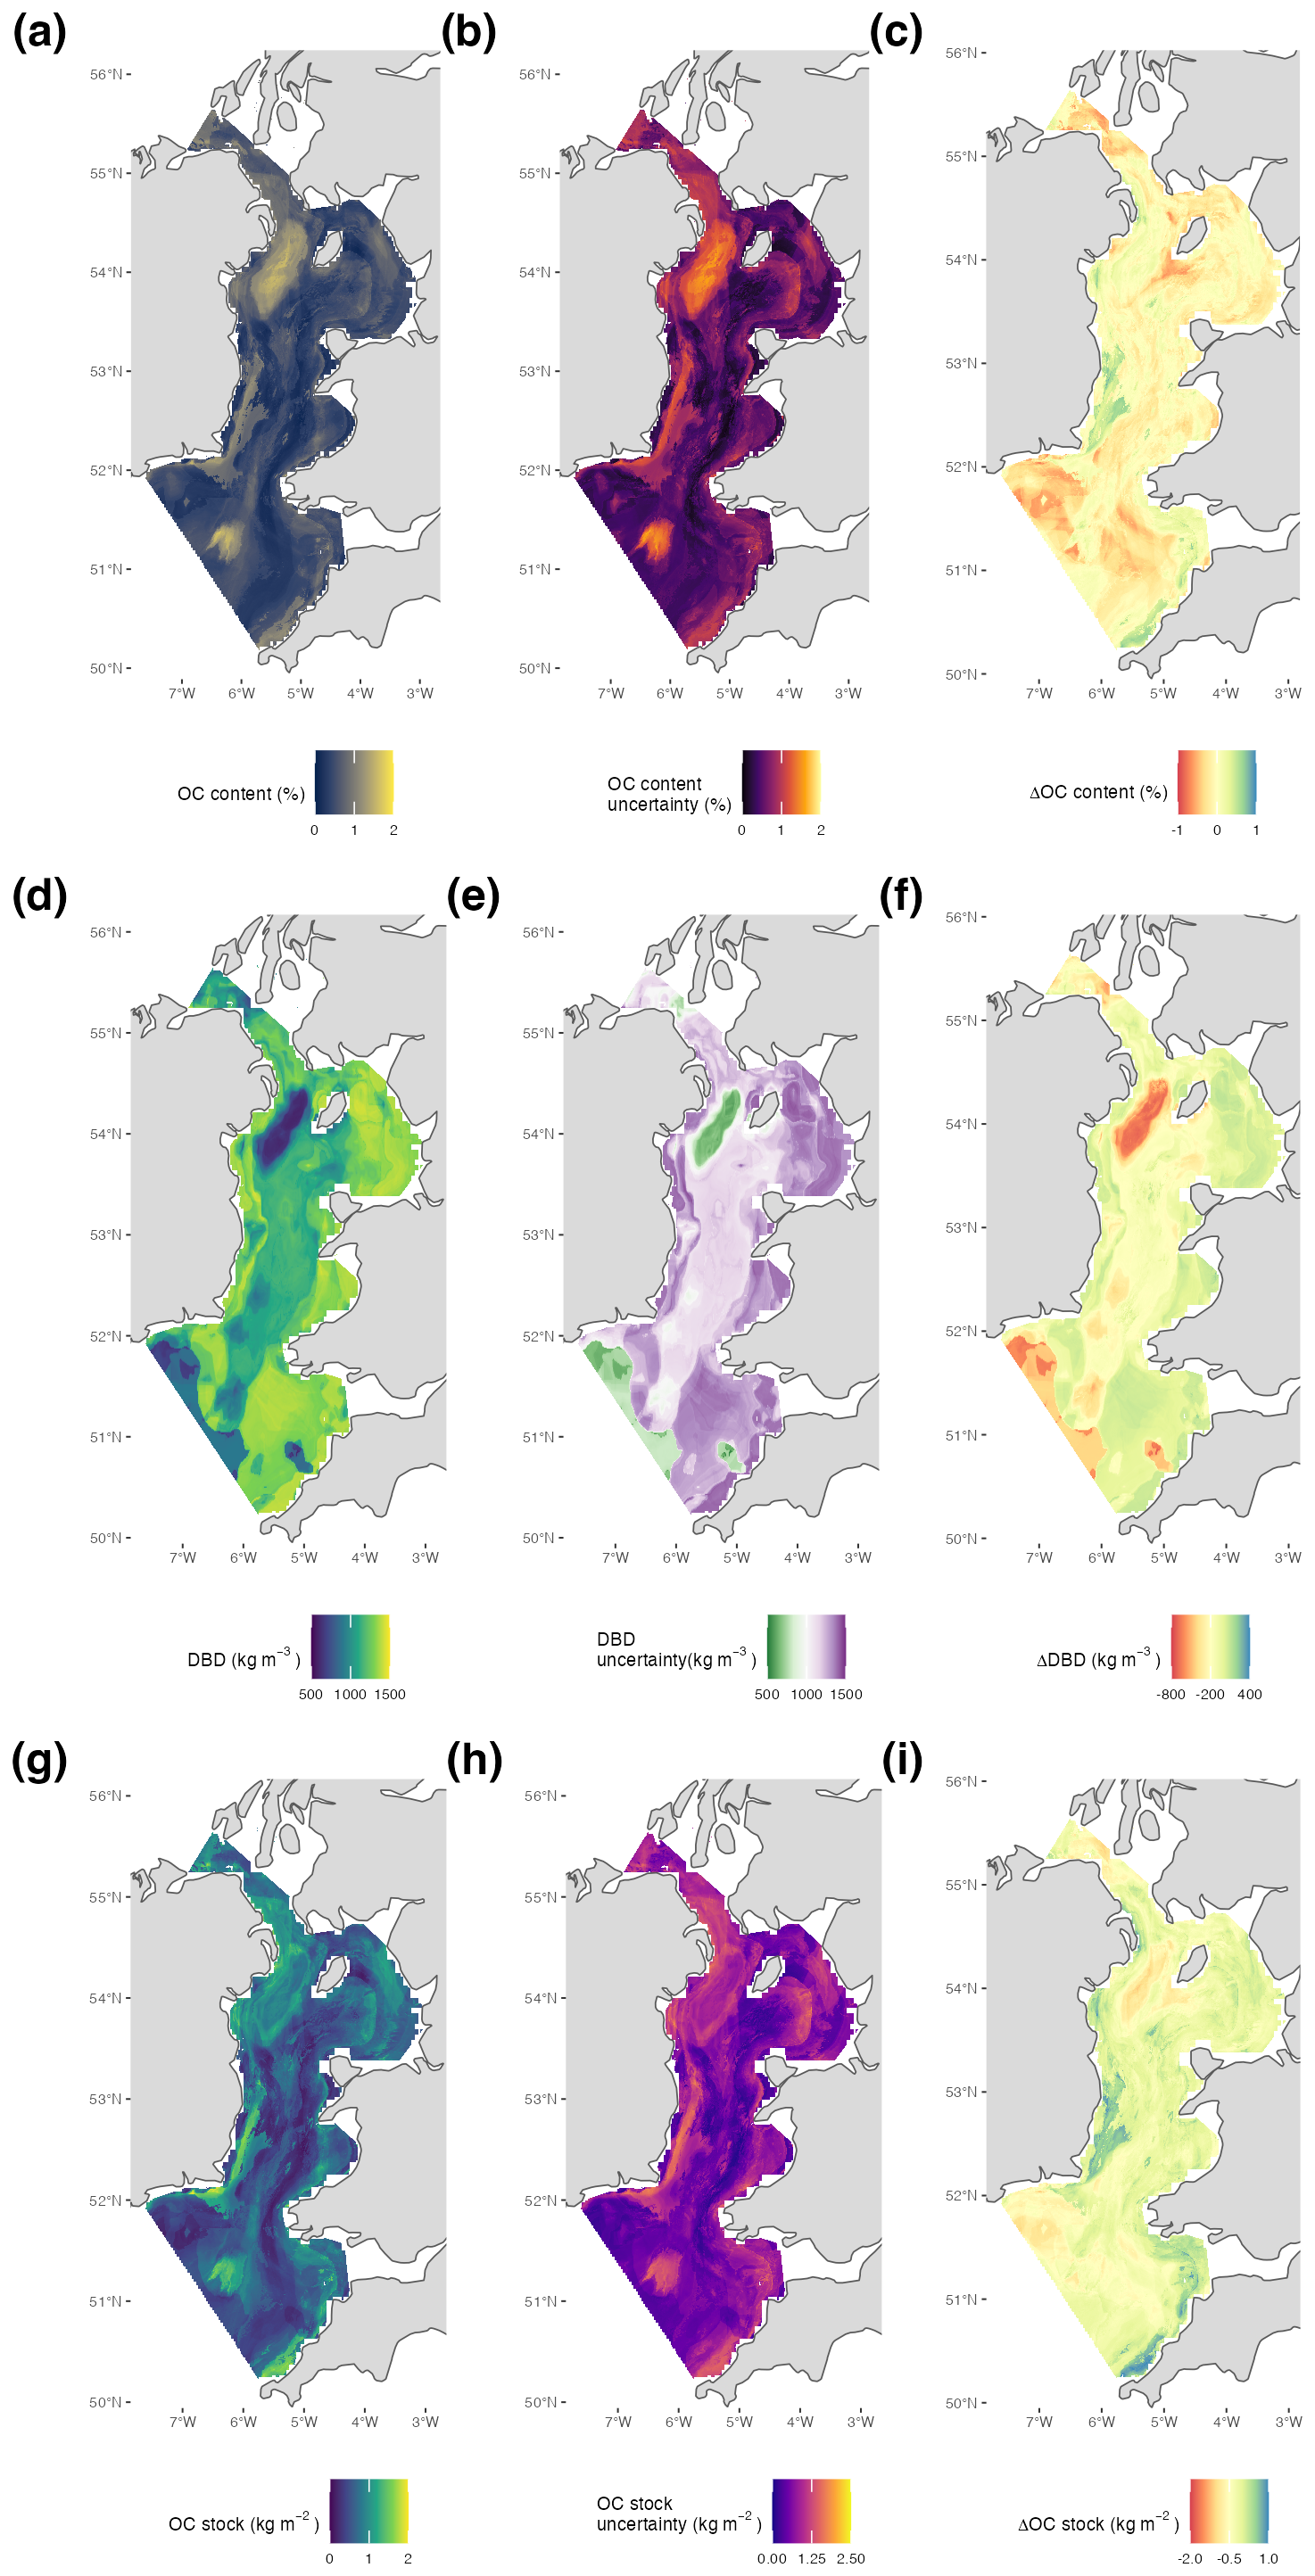
Figure 6(a) Predicted organic carbon (OC) content using adjusted model inputs; (b) the associated uncertainty and (c) difference between not bias adjusted and bias adjusted predictions across the study area (difference = OCcontent pre–OCcontent post); (d) Predicted dry bulk density (DBD) content using adjusted model inputs; (e) the associated uncertainty and (f) difference between DBD modelled from porosity and using an RF (DBDadj–DBDunadj); (g) Predicted organic carbon (OC) stock using adjusted model inputs; (h) the associated uncertainty and (i) difference between not bias adjusted and bias adjusted predictions across the study area (difference = OCstock,unadj–OCstock,adj). Negative values in panels (c), (f), and (i) indicate where predictions with adjusted model inputs were higher than non-bias adjusted inputs.
These differences in DBD significantly influenced total OCstock estimates. Using the bias adjusted model (OCstock,post), the total OC reservoir was 46.6 ± 43.6 Tg in the study area, which was 68.6 % of the unadjusted model estimate of 67.9 ± 63.0 Tg (Table 2). Despite this difference in magnitude, both models predicted similar spatial patterns, with higher OCcont and OCstock in the western Irish Sea “mud belt” and “The Smalls” (Fig. 6), and lower values in deeper central areas of the Irish Sea.
The results show that improvements in DBD modelling had a stronger influence on total OCstock estimates than improvements in OCcont. Replacing DBDpre with DBDpost (while holding OCcont constant) lead to a 15.1 Tg reduction in the total OC reservoir. In comparison, updating OCcont alone reduced the estimate by 6.5 Tg.
Our findings show that bias-adjusted model inputs reduced estimates of organic carbon (OC) stock in surficial sediments within the Irish Sea by nearly one-third (31.4 %). Adjusted inputs better aligned with in situ measurements, with lower errors observed for both OCcont,post and DBDpost compared to their unadjusted counterparts. Among these, the greatest reduction in OC stock resulted from RF modelling of DBD, which replaced widely used porosity-based approaches. Importantly, OC stock is not a directly measured value. In the equation for calculating OC stock (Eq. 5), DBD acts as a scaling factor that multiples the content of OC in the sediment by the amount of sediment (DBD). Therefore, it is likely that better predictions of OC content and DBD will result in more realistic estimates of OC stock. Additionally, these findings highlight the importance of using improved DBD models and suggests that previous estimates of OC stock that used the porosity empirical relationship may represent overestimates. These improvements in OC stock estimation are directly relevant to marine spatial planning, particularly in the context of managing OC stocks under climate and biodiversity targets. More accurate and regionally relevant OC stock estimates can improve the reliability of national assessments, help prioritise areas for protection, and inform industry activities, such as offshore renewable energy development and fisheries management. Our results underscore the importance of improving input data to enhance model reliability for informing marine spatial planning decisions.
Approximately two-thirds (70.1 %) of the difference between adjusted and unadjusted OC stock estimates was due to adjustments in DBD, with the remainder attributable to differences in OC content predictions. DBDpost had reduced error and consistently lower values across the study area (DBDpost mean 1191 ± 175 kg m−3; DBDpre mean: 1501 ± 65 kg m−3). While recent work has applied machine learning to estimate DBD (Diesing et al., 2024), most previous work has focused on modelling OC content, with less attention given to DBD (Diesing et al., 2017, 2021; Smeaton et al., 2021a). For example, unadjusted DBD was modelled from porosity using DBD data solely collected from the Mississippi-Alabama-Florida shelf (Jenkins, 2005) and implicitly assumes global applicability of this relationship. Moreover, the unadjusted DBD estimate assumed a constant grain density (2650 kg m−3) (Diesing et al., 2017), however, even within similar sediment types grain density can vary, marine mud grain densities can range from 2410 to 2720 kg m−3 (Opreanu, 2003). In contrast, >90 % of the study area has predictor data comparable to training data, we can assume that the relationships “learned” by the model during training are still applicable in the majority of the study area. Additionally, Atwood et al. (2020) estimated DBD using a transfer function based on OC content, however, the function was not based solely on marine sediment data and contained OC content values substantially greater than those observed on continental shelves. Since OC storage varies from inland to coastal to shelf sediments (Smeaton et al., 2021a), these methods may not be representative of shelf sediments. Our results support calls for standardized DBD measurement protocols and highlight DBD as a key uncertainty in OC stock estimates (Graves et al., 2022). More reliable DBD estimates, as presented here, will result in more robust baseline assessments of marine sediment OC stocks, which are crucial to investigating the effects of human pressures on seabed OC stocks and whether managing these systems can result in meaningful emissions reductions. For example, more accurate DBD estimates can result in reducing the substantial uncertainties in CO2 emissions resulting from bottom trawling. Sala et al. (2021) and Atwood et al. (2024) both suggest that as a result of bottom trawling, significant amounts of CO2 may be emitted from resuspending OC stocks in marine sediment. However, results from our study show OC stocks in surficial sediments may be substantially lower than previously reported. Additionally, impacts of trawling on marine sedimentary OC stocks has been identified as data deficient in the Irish Sea (Crowe et al., 2023), therefore, in order to incorporate marine sediment OC stocks in national marine spatial planning frameworks, more data are needed to refine estimates and provide policy makers robust empirical evidence with which to base management decisions.
Consistent with previous work, mud content (mudcont) was identified as the most important predictor of OC content (Diesing et al., 2017; Smeaton et al., 2021a). Muds across fjords and other coastal sediments have been shown to contain greater amounts of OC than sand, coarse sediments and mixed sediments (Smeaton et al., 2021a). The clay fraction in marine muds provides a large surface area for the adsorption and preservation of organic matter, including reactive interlayer surfaces in certain clay minerals, making it a key factor in OC sequestration (Babakhani et al., 2025; Keil and Hedges, 1993; Kennedy et al., 2002). The capacity for sediments to bind OC through clay-OC interactions can also vary with different mineral phases occurring in sediments, varying in the surface charge and distribution, topography and particle size and subsequent geochemical conditions constraining these characteristics (e.g. pH and ionic strength of pore water) (Bruni et al., 2022; Hunt et al., 2020; Kleber et al., 2021; Smeaton and Austin, 2019).
Our results showed a largely positive relationship between mud content and OC content, but extremely low mudcont values (<0.05 %) were also associated with high OC content, which contrasts previous work that reported a positive relationship between the two parameters (Diesing et al., 2017; Smeaton et al., 2021a). In continental shelves relationships between mud and OC content are complex. Little variation in OC content between mud, sand and coarse sediments has been reported on shelf areas (Smeaton et al., 2021a). However, the lability of organic matter can vary significantly between these environments (Smeaton and Austin, 2022). Marine muds have been shown to store organic matter ranging from highly reactive to highly resistant to degradation, whereas coarser sediments typically only contain organic matter highly resistant to degradation (Smeaton and Austin, 2022). Furthermore, muddy sediments tend to house higher infaunal biomass than coarser sediment, and these benthic faunae coupled with microbial metabolism play a key role in mediating OC mineralisation and preservation (Lin et al., 2022). For example, Zhang et al. (2024) bioturbation-induced remineralisation can account for between 25 % and 30 % of total seabed respiration (Zhang et al., 2024). These biological processes act alongside sediment disturbance from commercial fishing to create this nuanced relationship between mud and organic matter content (Epstein and Roberts, 2022; Zhang et al., 2024), which may explain why mud did not exhibit a clear positive relationship with OC content.
In addition, the importance of maximum wave orbital velocity at the seafloor in our model highlights the role of hydrodynamics in shaping OC content. In agreement with previous research (Song et al., 2022), we found an inverse relationship between OC content and maximum wave orbital velocity at the seafloor. High energy environments with thicker Sediment Mixed Layers (SML) limit OC burial by resuspending fine particles and increasing oxygen exposure, potentially increasing remineralization and reducing organic carbon accumulation rates (Song et al., 2022). However, in dynamic coastal regions, processes governing carbon mineralization in marine sediments are still not clear. First, the interaction between sediment resuspension, microbial community activity, and carbon mineralization pathways remains poorly constrained (LaRowe et al., 2020). Oxygen exposure time is a key driver of OC degradation (Hartnett et al., 1998) and the extent of short-term disturbance events, such as storms or trawling, that impact oxygen penetration depth and thus carbon remineralization rates is not well understood (Bartl et al., 2025; Glud, 2008). Additionally, the interaction between bioturbation and resuspension driven transport of sediments is not well quantified in models predicting carbon storage (Cozzoli et al., 2019). The hydrodynamic regime has a strong influence over sediment type, as high energy environments prevent mud deposition or resuspend finer particles, while low energy environments allow fine sediments to settle and accumulate, which is conducive to mud deposition and OC accumulation (Hanebuth et al., 2015). Similar findings were reported by Diesing et al. (2017), where low hydrodynamic activity was positively correlated with OC content. These insights, coupled with the present work, underscore the need to incorporate sediment dynamics, such as sediment mixing or disturbance, into models predicting OC stock, particularly in light of human activities such as trawling and offshore development (Epstein and Roberts, 2022).
Diesing et al. (2017), Smeaton et al. (2021a) and Atwood et al. (2020) all reported improved model accuracy compared to the present study. For example, Diesing et al. (2017) and Atwood et al. (2020) reported R2 values of 75 % and 76 %, respectively, compared to 47 % in the present study (bias adjusted OC content). These apparent differences in model performance may be due to the validation approach used and spatial autocorrelation, which may be inflating model metrics (Milà et al., 2022). For example, the present study used the kNNDM algorithm to ensure spatial independence between cross validation training folds. However, random k fold cross validation, as used by Atwood et al. (2020) and Diesing et al. (2017), are likely to train and test on data that are spatially dependant, and thus artificially increasing the likelihood of the model predicting correctly (Milà et al., 2022). Similarly, Smeaton et al. (2021a) who did use a form of spatial cross validation reported comparable model performance to our study (R2=53 %, RMSE = 1.72). Smeaton et al. (2021a) used “spatial blocks” to determine traintest splits. However, these spatial blocks were defined as ICES statistical grids, which do not ensure spatial independence between traintest folds, unlike the kNNDM algorithm used in the present study.
Predictions presented here still carry uncertainty, despite reducing model error through adjusting model input data. Uncertainty in OC stock estimates was greatest in nearshore areas, around the perimeter of the western Irish Sea “mud belt” and the “Smalls”, which coincided with higher OC stock predictions. These areas intersect with zones of intense human activity, such as bottom trawling and offshore development (Crowe et al., 2023), highlighting the need for caution in marine spatial planning decisions that rely solely on model outputs. Improving spatial coverage of in situ measurements, especially of DBD and OC content, in these higher uncertainty zones would help refine model estimates. The OC stock uncertainty presented here likely underestimates the true uncertainty due to unreported sampling errors in OC content measurements and modelled predictor data. Additionally, DBD data were lacking across the study area and only 3 % (18 of 642) of all DBD observational data used in bias adjustment were located within the study area. However, despite low spatial coverage of training data points within the study area, analysis of the adjusted DBD model's AOA revealed it can still be expected to perform well within the study area. Findings from the present study show spatial models of organic carbon can still be significantly improved from increased in situ data. Additionally, incorporating these datasets into public repositories can improve efforts to estimate organic carbon stocks by providing ground truthed data on which to base numerical models. The refined estimates presented in this study rely on large amounts of in situ data and environmental predictors, making this approach most suitable for data-rich regions. Within our study area, the limited availability of DBD measurements required the use of an Area of Applicability (AOA) analysis to assess whether the adjusted DBD model could be reliably applied, highlighting potential limitations of this approach in data-poor settings. Nonetheless, our findings demonstrate that where sufficient observational data are available, OC stock estimates can be substantially improved. As more in situ datasets become available in currently under-sampled regions, this modelling framework can be replicated and further refined to support better-informed carbon assessments.
Overall, our findings suggest that marine sedimentary OC stocks could be lower than previously estimated, with implications for marine spatial planning and nature-based climate solutions. A key result of this study is that uncertainties in dry bulk density (DBD) estimates strongly influence OC stock predictions. We show that reliance on previously developed empirical relationships for DBD can introduce substantial error, underscoring the need for regionally relevant data. Improved OC stock estimates, grounded in more accurate DBD values, can support more informed seabed management by identifying areas with higher carbon vulnerability or conservation potential. The findings suggest that improving model inputs based on in situ data, may help refine model predictions to be more locally relevant. We highlight the critical role that accurate DBD estimates play in determining OC stock. Moving forward, more comprehensive in situ DBD measurements and refined DBD models are essential for improving the accuracy of OC stock predictions. Alternatively, OC stocks could be calculated directly per sediment core, reducing the number of models needed to estimate OC stocks, thus reducing uncertainty in final estimates. These efforts will be instrumental in developing better strategies for managing marine sedimentary OC stocks.
Spatially modelled organic carbon content, stock data, and their associated uncertainties are available as a Zenodo repository (https://doi.org/10.5281/zenodo.14859981, Chatting, 2025). Additionally, the bias adjusted predictor data layers developed and the random forest dry bulk density model can be accessed from Zenodo (https://doi.org/10.5281/zenodo.14859981, Chatting, 2025). The underlying code used to develop these data layers and produce spatial predictions of organic carbon content and stock is available from Zenodo (https://doi.org/10.5281/zenodo.14859981, Chatting, 2025).
The supplement related to this article is available online at https://doi.org/10.5194/bg-22-5975-2025-supplement.
MCh: conceptualization, data curation, formal analysis, investigation, methodology, software, validation, visualization, writing – original draft preparation, writing – review & editing. MD: conceptualization, data curation, formal analysis, funding acquisition, methodology, supervision, writing – original draft preparation, writing – review & editing. WRH: data curation, investigation, writing – review & editing. AG: data curation, funding acquisition, investigation, writing – review & editing. BPK: funding acquisition, project administration, resources, supervision, writing – review & editing. MCo: conceptualization, funding acquisition, investigation, methodology, project administration, resources, supervision, writing – original draft preparation, writing – review & editing.
The contact author has declared that none of the authors has any competing interests.
Publisher’s note: Copernicus Publications remains neutral with regard to jurisdictional claims made in the text, published maps, institutional affiliations, or any other geographical representation in this paper. While Copernicus Publications makes every effort to include appropriate place names, the final responsibility lies with the authors. Also, please note that this paper has not received English language copy-editing. Views expressed in the text are those of the authors and do not necessarily reflect the views of the publisher.
The authors would like to thank the creators and maintainers of public data repositories, specifically the ones used in this study: PANGAEA, the Marine Institute (Eoghan Daly), Modern Ocean Sedimentary Inventory and Archive of Carbon (Tessa van der Voort, Hannah Gies and Sarah Paradis) and Natural Resources Wales.
This research has been supported by the Marine Institute (grant no. PBA/CC/21/01) and the Environmental Protection Agency (grant no. PBA/CC/21/01).
This paper was edited by Yuan Shen and reviewed by two anonymous referees.
Allcock, L., Breen, P., Conway, A., Crowe, T., Dolton, H. R., Haberlin, D., Heney, K., Johnson, M., Keena, T., Maxwell, J., Nolan, C., Orrell, D. L., Power, M., and Tully, O.: Ecological Sensitivity Analysis of the Celtic Sea to inform future designation of Marine Protected Areas (MPAs), Department of Housing, Local Government and Heritage., https://assets.gov.ie/static/documents/24643300-ecological-sensitivity-analysis-of-the-celtic-sea-to-inform-future-designatio.pdf (last access: 11 April 2024), 2024.
Arosio, R., Wheeler, A. J., Sacchetti, F., Guinan, J., Benetti, S., O'Keeffe, E., van Landeghem, K. J. J., Conti, L. A., Furey, T., and Lim, A.: The geomorphology of Ireland's continental shelf, J Maps, 19, https://doi.org/10.1080/17445647.2023.2283192, 2023.
Atwood, T. B., Witt, A., Mayorga, J., Hammill, E., and Sala, E.: Global Patterns in Marine Sediment Carbon Stocks, Front Mar Sci, 7, https://doi.org/10.3389/fmars.2020.00165, 2020.
Atwood, T. B., Romanou, A., DeVries, T., Lerner, P. E., Mayorga, J. S., Bradley, D., Cabral, R. B., Schmidt, G. A., and Sala, E.: Atmospheric CO2 emissions and ocean acidification from bottom-trawling, Front Mar Sci, 10, https://doi.org/10.3389/fmars.2023.1125137, 2024.
Babakhani, P., Dale, A. W., Woulds, C., Moore, O. W., Xiao, K.-Q., Curti, L., and Peacock, C. L.: Preservation of organic carbon in marine sediments sustained by sorption and transformation processes, Nat Geosci, 18, 78–83, https://doi.org/10.1038/s41561-024-01606-y, 2025.
Bartl, I., Evans, T., Hillman, J., and Thrush, S.: Simple assay quantifying sediment resuspension effects on marine carbon storage, Methods Ecol Evol, 16, 309–316, https://doi.org/10.1111/2041-210X.14479, 2025.
Bianchi, T. S., Cui, X., Blair, N. E., Burdige, D. J., Eglinton, T. I., and Galy, V.: Centers of organic carbon burial and oxidation at the land-ocean interface, Org Geochem, 115, 138–155, https://doi.org/10.1016/j.orggeochem.2017.09.008, 2018.
Breiman, L.: Random Forest, Mach Learn, 45, 5–32, https://doi.org/10.1023/A:1010933404324, 2001.
Bruni, E. T., Blattmann, T. M., Haghipour, N., Louw, D., Lever, M., and Eglinton, T. I.: Sedimentary Hydrodynamic Processes Under Low-Oxygen Conditions: Implications for Past, Present, and Future Oceans, Front Earth Sci (Lausanne), 10, https://doi.org/10.3389/feart.2022.886395, 2022.
Casanueva, A., Bedia, J., Herrera, S., Fernández, J., and Gutiérrez, J. M.: Direct and component-wise bias correction of multi-variate climate indices: the percentile adjustment function diagnostic tool, Clim Change, 147, 411–425, https://doi.org/10.1007/s10584-018-2167-5, 2018.
Casanueva, A., Herrera, S., Iturbide, M., Lange, S., Jury, M., Dosio, A., Maraun, D., and Gutiérrez, J. M.: Testing bias adjustment methods for regional climate change applications under observational uncertainty and resolution mismatch, Atmospheric Science Letters, 21, https://doi.org/10.1002/asl.978, 2020.
Chatting, M.: Developing Bias-Adjusted Predictors and Machine Learning Models for Organic Carbon Stock Estimation in the Irish Sea, Zenodo [code and data set], https://doi.org/10.5281/zenodo.14859981, 2025.
Cheng, L. and Zhu, J.: Benefits of CMIP5 Multimodel Ensemble in Reconstructing Historical Ocean Subsurface Temperature Variations, J Clim, 29, 5393–5416, https://doi.org/10.1175/JCLI-D-15-0730.1, 2016.
Cheng, L., Trenberth, K. E., Fasullo, J., Boyer, T., Abraham, J., and Zhu, J.: Improved estimates of ocean heat content from 1960 to 2015, Sci Adv, 3, https://doi.org/10.1126/sciadv.1601545, 2017.
Cheng, L., Trenberth, K. E., Gruber, N., Abraham, J. P., Fasullo, J. T., Li, G., Mann, M. E., Zhao, X., and Zhu, J.: Improved Estimates of Changes in Upper Ocean Salinity and the Hydrological Cycle, J Clim, 33, 10357–10381, https://doi.org/10.1175/JCLI-D-20-0366.1, 2020.
Coughlan, M., Guerrini, M., Creane, S., O'Shea, M., Ward, S. L., Van Landeghem, K. J. J., Murphy, J., and Doherty, P.: A new seabed mobility index for the Irish Sea: Modelling seabed shear stress and classifying sediment mobilisation to help predict erosion, deposition, and sediment distribution, Cont Shelf Res, 229, 104574, https://doi.org/10.1016/j.csr.2021.104574, 2021.
Cozzoli, F., Gjoni, V., Del Pasqua, M., Hu, Z., Ysebaert, T., Herman, P. M. J., and Bouma, T. J.: A process based model of cohesive sediment resuspension under bioturbators' influence, Science of The Total Environment, 670, 18–30, https://doi.org/10.1016/j.scitotenv.2019.03.085, 2019.
Crowe, T., Allcock, L., Breen, P., Conway, A., Doyle, T., Gillen, D., Haberlin, D., Heney, K., Johnson, M. P., Kamjou, E., Morris, C., Nolan, C., Orrell, D., O'Sulivan, D., and Tully, O.: Ecological sensitivity analysis of the western Irish Sea to inform future designation of Marine Protected Areas (MPAs), Department of Housing, Local Government and Heritage, https://assets.gov.ie/static/documents/main-report-of-the-irish-sea-sensitivity-analysis-project.pdf (last access: 11 April 2024), 2023.
Dawson, J. J. C. and Smith, P.: Carbon losses from soil and its consequences for land-use management, Science of The Total Environment, 382, 165–190, https://doi.org/10.1016/j.scitotenv.2007.03.023, 2007.
Diesing, M., Kröger, S., Parker, R., Jenkins, C., Mason, C., and Weston, K.: Predicting the standing stock of organic carbon in surface sediments of the North–West European continental shelf, Biogeochemistry, 135, 183–200, https://doi.org/10.1007/s10533-017-0310-4, 2017.
Diesing, M., Thorsnes, T., and Bjarnadóttir, L. R.: Organic carbon densities and accumulation rates in surface sediments of the North Sea and Skagerrak, Biogeosciences, 18, 2139–2160, https://doi.org/10.5194/bg-18-2139-2021, 2021.
Diesing, M., Paradis, S., Jensen, H., Thorsnes, T., Bjarnadóttir, L. R., and Knies, J.: Glacial troughs as centres of organic carbon accumulation on the Norwegian continental margin, Commun Earth Environ, 5, 327, https://doi.org/10.1038/s43247-024-01502-8, 2024.
Dormann, C. F., Calabrese, J. M., Guillera-Arroita, G., Matechou, E., Bahn, V., Bartoń, K., Beale, C. M., Ciuti, S., Elith, J., Gerstner, K., Guelat, J., Keil, P., Lahoz-Monfort, J. J., Pollock, L. J., Reineking, B., Roberts, D. R., Schröder, B., Thuiller, W., Warton, D. I., Wintle, B. A., Wood, S. N., Wüest, R. O., and Hartig, F.: Model averaging in ecology: a review of Bayesian, information-theoretic, and tactical approaches for predictive inference, Ecol Monogr, 88, 485–504, https://doi.org/10.1002/ecm.1309, 2018.
Epstein, G. and Roberts, C. M.: Identifying priority areas to manage mobile bottom fishing on seabed carbon in the UK, PLOS Climate, 1, e0000059, https://doi.org/10.1371/journal.pclm.0000059, 2022.
Epstein, G., Fuller, S. D., Hingmire, D., Myers, P. G., Peña, A., Pennelly, C., and Baum, J. K.: Predictive mapping of organic carbon stocks in surficial sediments of the Canadian continental margin, Earth Syst. Sci. Data, 16, 2165–2195, https://doi.org/10.5194/essd-16-2165-2024, 2024.
Felden, J., Möller, L., Schindler, U., Huber, R., Schumacher, S., Koppe, R., Diepenbroek, M., and Glöckner, F. O.: PANGAEA – Data Publisher for Earth & Environmental Science, Sci Data, 10, 347, https://doi.org/10.1038/s41597-023-02269-x, 2023.
Flanders Marine Institute: Maritime Boundaries Geodatabase, version 12, https://doi.org/10.14284/628, 2023.
Frankignoulle, M. and Borges, A. V.: European continental shelf as a significant sink for atmospheric carbon dioxide, Global Biogeochem Cycles, 15, 569–576, https://doi.org/10.1029/2000GB001307, 2001.
Galmarini, S., Cannon, A. J., Ceglar, A., Christensen, O. B., de Noblet-Ducoudré, N., Dentener, F., Doblas-Reyes, F. J., Dosio, A., Gutierrez, J. M., Iturbide, M., Jury, M., Lange, S., Loukos, H., Maiorano, A., Maraun, D., McGinnis, S., Nikulin, G., Riccio, A., Sanchez, E., Solazzo, E., Toreti, A., Vrac, M., and Zampieri, M.: Adjusting climate model bias for agricultural impact assessment: How to cut the mustard, Clim Serv, 13, 65–69, https://doi.org/10.1016/j.cliser.2019.01.004, 2019.
Gerritsen, H. D. and Lordan, C.: Atlas of Commercial Fisheries Around Ireland, Marine Institute, Ireland, 59 pp., http://hdl.handle.net/10793/1432 (last access: 20 October 2024), 2014.
Glud, R. N.: Oxygen dynamics of marine sediments, Marine Biology Research, 4, 243–289, https://doi.org/10.1080/17451000801888726, 2008.
Graves, C. A., Benson, L., Aldridge, J., Austin, W. E. N., Dal Molin, F., Fonseca, V. G., Hicks, N., Hynes, C., Kröger, S., Lamb, P. D., Mason, C., Powell, C., Smeaton, C., Wexler, S. K., Woulds, C., and Parker, R.: Sedimentary carbon on the continental shelf: Emerging capabilities and research priorities for Blue Carbon, Front Mar Sci, 9, https://doi.org/10.3389/fmars.2022.926215, 2022.
Grey, A., Kelleher, B., Chatting, M., Long, M., Walsh, P., Diesing, M., and Coughlan, M.: The QUANTIFICATION, CHARACTERISATION, SOURCE AND FATE OF PAST AND PRESENT CARBON STORAGE IN COASTAL AND OFFSHORE SEDIMENTS FOR EFFECTIVE MARINE MANAGEMENT (QUEST), EGU General Assembly 2024, Vienna, Austria, 14–19 Apr 2024, EGU24-19779, https://doi.org/10.5194/egusphere-egu24-19779, 2024.
Griscom, B. W., Adams, J., Ellis, P. W., Houghton, R. A., Lomax, G., Miteva, D. A., Schlesinger, W. H., Shoch, D., Siikamäki, J. V., Smith, P., Woodbury, P., Zganjar, C., Blackman, A., Campari, J., Conant, R. T., Delgado, C., Elias, P., Gopalakrishna, T., Hamsik, M. R., Herrero, M., Kiesecker, J., Landis, E., Laestadius, L., Leavitt, S. M., Minnemeyer, S., Polasky, S., Potapov, P., Putz, F. E., Sanderman, J., Silvius, M., Wollenberg, E., and Fargione, J.: Natural climate solutions, Proceedings of the National Academy of Sciences, 114, 11645–11650, https://doi.org/10.1073/pnas.1710465114, 2017.
Hanebuth, T. J. J., Lantzsch, H., and Nizou, J.: Mud depocenters on continental shelves – appearance, initiation times, and growth dynamics, Geo-Marine Letters, 35, 487–503, https://doi.org/10.1007/s00367-015-0422-6, 2015.
Hartnett, H. E., Keil, R. G., Hedges, J. I., and Devol, A. H.: Influence of oxygen exposure time on organic carbon preservation in continental margin sediments, Nature, 391, 572–575, https://doi.org/10.1038/35351, 1998.
Hedges, J. I. and Keil, R. G.: Sedimentary organic matter preservation: an assessment and speculative synthesis, Mar Chem, 49, 81–115, https://doi.org/10.1016/0304-4203(95)00008-F, 1995.
Hengl, T., Heuvelink, G. B. M., Kempen, B., Leenaars, J. G. B., Walsh, M. G., Shepherd, K. D., Sila, A., MacMillan, R. A., Mendes de Jesus, J., Tamene, L., and Tondoh, J. E.: Mapping Soil Properties of Africa at 250 m Resolution: Random Forests Significantly Improve Current Predictions, PLoS One, 10, e0125814, https://doi.org/10.1371/journal.pone.0125814, 2015.
Hiddink, J. G., van de Velde, S. J., McConnaughey, R. A., De Borger, E., Tiano, J., Kaiser, M. J., Sweetman, A. K., and Sciberras, M.: Quantifying the carbon benefits of ending bottom trawling, Nature, 617, E1–E2, https://doi.org/10.1038/s41586-023-06014-7, 2023.
Hijmans, R.: terra: Spatial Data Analysis, GitHub, https://github.com/rspatial/terra (last access: 15 January 2025), 2025.
Hunt, C., Demšar, U., Dove, D., Smeaton, C., Cooper, R., and Austin, W. E. N.: Quantifying Marine Sedimentary Carbon: A New Spatial Analysis Approach Using Seafloor Acoustics, Imagery, and Ground-Truthing Data in Scotland, Front Mar Sci, 7, https://doi.org/10.3389/fmars.2020.00588, 2020.
ICES: Second Interim Report of the Working Group on Spatial Fisheries Data (WGSFD), Copenhagen, 102 pp., https://archimer.ifremer.fr/doc/00223/33378/31806.pdf (last access: 20 November 2024), 2014.
Jenkins, C. J.: Summary of the onCALCULATION methods used in dbSEABED, Boulder Colorado, U.S. Geological Survey, http://pubs.usgs.gov/ds/2006/146/ (last access: 12 October 2024), 2005.
Keil, R. G. and Hedges, J. I.: Sorption of organic matter to mineral surfaces and the preservation of organic matter in coastal marine sediments, Chem Geol, 107, 385–388, https://doi.org/10.1016/0009-2541(93)90215-5, 1993.
Kennedy, M. J., Pevear, D. R., and Hill, R. J.: Mineral Surface Control of Organic Carbon in Black Shale, Science, 295, 657–660, https://doi.org/10.1126/science.1066611, 2002.
Kleber, M., Bourg, I. C., Coward, E. K., Hansel, C. M., Myneni, S. C. B., and Nunan, N.: Dynamic interactions at the mineral–organic matter interface, Nat Rev Earth Environ, 2, 402–421, https://doi.org/10.1038/s43017-021-00162-y, 2021.
Lange, T. M., Gültas, M., Schmitt, A. O., and Heinrich, F.: optRF: Optimising random forest stability by determining the optimal number of trees, BMC Bioinformatics, 26, 95, https://doi.org/10.1186/s12859-025-06097-1, 2025.
LaRowe, D. E., Arndt, S., Bradley, J. A., Burwicz, E., Dale, A. W., and Amend, J. P.: Organic carbon and microbial activity in marine sediments on a global scale throughout the Quaternary, Geochim Cosmochim Acta, 286, 227–247, https://doi.org/10.1016/j.gca.2020.07.017, 2020.
Laruelle, G. G., Cai, W.-J., Hu, X., Gruber, N., Mackenzie, F. T., and Regnier, P.: Continental shelves as a variable but increasing global sink for atmospheric carbon dioxide, Nat Commun, 9, 454, https://doi.org/10.1038/s41467-017-02738-z, 2018.
Laux, P., Rötter, R. P., Webber, H., Dieng, D., Rahimi, J., Wei, J., Faye, B., Srivastava, A. K., Bliefernicht, J., Adeyeri, O., Arnault, J., and Kunstmann, H.: To bias correct or not to bias correct? An agricultural impact modelers' perspective on regional climate model data, Agric For Meteorol, 304–305, 108406, https://doi.org/10.1016/j.agrformet.2021.108406, 2021.
Lee, J. and Im, J.: A Novel Bias Correction Method for Soil Moisture and Ocean Salinity (SMOS) Soil Moisture: Retrieval Ensembles, Remote Sens (Basel), 7, 16045–16061, https://doi.org/10.3390/rs71215824, 2015.
Lin, C. Y., Bradbury, H. J., Antler, G., Burdige, D. J., Bennett, T. D., Li, S., and Turchyn, A. V.: Sediment mineralogy influences the rate of microbial sulfate reduction in marine sediments, Earth Planet Sci Lett, 598, 117841, https://doi.org/10.1016/j.epsl.2022.117841, 2022.
Luo, M., Liu, T., Meng, F., Duan, Y., Frankl, A., Bao, A., and De Maeyer, P.: Comparing bias correction methods used in downscaling precipitation and temperature from regional climate models: A case study from the Kaidu River Basin in Western China, Water (Basel), 10, https://doi.org/10.3390/w10081046, 2018.
Macreadie, P., Costa, M., Atwood, T., Friess, D., Kelleway, J., Kennedy, H., Lovelock, C., Serrano, O., and Duarte, C.: Blue carbon as a natural climate solution, Nat Rev Earth Environ, 2, 1–14, https://doi.org/10.1038/s43017-021-00224-1, 2021.
Maraun, D. and Widmann, M.: Cross-validation of bias-corrected climate simulations is misleading, Hydrol. Earth Syst. Sci., 22, 4867–4873, https://doi.org/10.5194/hess-22-4867-2018, 2018.
Meyer, H. and Pebesma, E.: Predicting into unknown space? Estimating the area of applicability of spatial prediction models, Methods Ecol. Evol., 12, 1620–1633, https://doi.org/10.1111/2041-210X.13650, 2021.
Meyer, H., Reudenbach, C., Hengl, T., Katurji, M., and Nauss, T.: Improving performance of spatio-temporal machine learning models using forward feature selection and target-oriented validation, Environmental Modelling & Software, 101, 1–9, https://doi.org/10.1016/j.envsoft.2017.12.001, 2018.
Milà, C., Mateu, J., Pebesma, E., and Meyer, H.: Nearest neighbour distance matching Leave-One-Out Cross-Validation for map validation, Methods Ecol Evol, 13, 1304–1316, https://doi.org/10.1111/2041-210X.13851, 2022.
Mitchell, P. J., Aldridge, J., and Diesing, M.: Legacy Data: How Decades of Seabed Sampling Can Produce Robust Predictions and Versatile Products, Geosciences (Basel), 9, 182, https://doi.org/10.3390/geosciences9040182, 2019.
Mu, L., Losch, M., Yang, Q., Ricker, R., Losa, S. N., and Nerger, L.: Arctic-Wide Sea Ice Thickness Estimates From Combining Satellite Remote Sensing Data and a Dynamic Ice-Ocean Model with Data Assimilation During the CryoSat-2 Period, J Geophys Res Oceans, 123, 7763–7780, https://doi.org/10.1029/2018JC014316, 2018.
Ngai, S. T., Tangang, F., and Juneng, L.: Bias correction of global and regional simulated daily precipitation and surface mean temperature over Southeast Asia using quantile mapping method, Glob Planet Change, 149, 79–90, https://doi.org/10.1016/j.gloplacha.2016.12.009, 2017.
Opreanu, G.: Porosity Density and Physical Properties of Deep-Sea Sediments from the Black Sea, Geoecomarina, 9, https://geoecomar.ro/website/publicatii/Nr.9-10-2004/9.pdf (last access: 20 February 2025), 2003.
Paradis, S. and Eglinton, T. I.: Introducing the Modern Ocean Sedimentary Inventory and Archive of Carbon (MOSAIC v.2.0) database and its initial applications, EGU General Assembly 2024, Vienna, Austria, 14–19 Apr 2024, EGU24-12461, https://doi.org/10.5194/egusphere-egu24-12461, 2024.
Paradis, S., Nakajima, K., Van der Voort, T. S., Gies, H., Wildberger, A., Blattmann, T. M., Bröder, L., and Eglinton, T. I.: The Modern Ocean Sediment Archive and Inventory of Carbon (MOSAIC): version 2.0, Earth Syst. Sci. Data, 15, 4105–4125, https://doi.org/10.5194/essd-15-4105-2023, 2023.
Roberts, D. R., Wood, W. H., and Marshall, S. J.: Assessments of downscaled climate data with a high-resolution weather station network reveal consistent but predictable bias, International Journal of Climatology, 39, 3091–3103, https://doi.org/10.1002/joc.6005, 2019.
Sala, E., Mayorga, J., Bradley, D., Cabral, R. B., Atwood, T. B., Auber, A., Cheung, W., Costello, C., Ferretti, F., Friedlander, A. M., Gaines, S. D., Garilao, C., Goodell, W., Halpern, B. S., Hinson, A., Kaschner, K., Kesner-Reyes, K., Leprieur, F., McGowan, J., Morgan, L. E., Mouillot, D., Palacios-Abrantes, J., Possingham, H. P., Rechberger, K. D., Worm, B., and Lubchenco, J.: Protecting the global ocean for biodiversity, food and climate, Nature, 592, 397–402, https://doi.org/10.1038/s41586-021-03371-z, 2021.
Scourse, J., Saher, M., Van Landeghem, K. J. J., Lockhart, E., Purcell, C., Callard, L., Roseby, Z., Allinson, B., Pieńkowski, A. J., O'Cofaigh, C., Praeg, D., Ward, S., Chiverrell, R., Moreton, S., Fabel, D., and Clark, C. D.: Advance and retreat of the marine-terminating Irish Sea Ice Stream into the Celtic Sea during the Last Glacial: Timing and maximum extent, Mar Geol, 412, 53–68, https://doi.org/10.1016/j.margeo.2019.03.003, 2019.
Smeaton, C. and Austin, W. E. N.: Where's the Carbon: Exploring the Spatial Heterogeneity of Sedimentary Carbon in Mid-Latitude Fjords, Front Earth Sci (Lausanne), 7, https://doi.org/10.3389/feart.2019.00269, 2019.
Smeaton, C. and Austin, W. E. N.: Quality Not Quantity: Prioritizing the Management of Sedimentary Organic Matter Across Continental Shelf Seas, Geophys Res Lett, 49, https://doi.org/10.1029/2021GL097481, 2022.
Smeaton, C., Hunt, C. A., Turrell, W. R., and Austin, W. E. N.: Sediment type and surficial sedimentary carbon stocks across the United Kingdom's Exclusive Economic Zone and the territorial waters of the Isle of Man and the Chanel Islands, Frontiers in Earth Science, https://doi.org/10.3389/feart.2021.593324, 2021a.
Smeaton, C., Cui, X., Bianchi, T. S., Cage, A. G., Howe, J. A., and Austin, W. E. N.: The evolution of a coastal carbon store over the last millennium, Quat Sci Rev, 266, 107081, https://doi.org/10.1016/j.quascirev.2021.107081, 2021b.
Song, S., Santos, I. R., Yu, H., Wang, F., Burnett, W. C., Bianchi, T. S., Dong, J., Lian, E., Zhao, B., Mayer, L., Yao, Q., Yu, Z., and Xu, B.: A global assessment of the mixed layer in coastal sediments and implications for carbon storage, Nat Commun, 13, 4903, https://doi.org/10.1038/s41467-022-32650-0, 2022.
Stephens, D. and Diesing, M.: Towards quantitative spatial models of seabed sediment composition, PLoS One, 10, https://doi.org/10.1371/journal.pone.0142502, 2015.
Taalab, K. P., Corstanje, R., Creamer, R., and Whelan, M. J.: Modelling soil bulk density at the landscape scale and its contributions to C stock uncertainty, Biogeosciences, 10, 4691–4704, https://doi.org/10.5194/bg-10-4691-2013, 2013.
Ward, S. L., Neill, S. P., Van Landeghem, K. J. J., and Scourse, J. D.: Classifying seabed sediment type using simulated tidal-induced bed shear stress, Mar Geol, 367, 94–104, https://doi.org/10.1016/j.margeo.2015.05.010, 2015.
Wei, Y., Qiu, X., Yazdi, M. D., Shtein, A., Shi, L., Yang, J., Peralta, A. A., Coull, B. A., and Schwartz, J. D.: The Impact of Exposure Measurement Error on the Estimated Concentration–Response Relationship between Long-Term Exposure to PM2.5 and Mortality, Environ Health Perspect, 130, https://doi.org/10.1289/EHP10389, 2022.
Wilson, R. J., Speirs, D. C., Sabatino, A., and Heath, M. R.: A synthetic map of the north-west European Shelf sedimentary environment for applications in marine science, Earth Syst. Sci. Data, 10, 109–130, https://doi.org/10.5194/essd-10-109-2018, 2018.
Zhang, W., Porz, L., Yilmaz, R., Wallmann, K., Spiegel, T., Neumann, A., Holtappels, M., Kasten, S., Kuhlmann, J., Ziebarth, N., Taylor, B., Ho-Hagemann, H. T. M., Bockelmann, F.-D., Daewel, U., Bernhardt, L., and Schrum, C.: Long-term carbon storage in shelf sea sediments reduced by intensive bottom trawling, Nat Geosci, 17, 1268–1276, https://doi.org/10.1038/s41561-024-01581-4, 2024.