the Creative Commons Attribution 4.0 License.
the Creative Commons Attribution 4.0 License.
 | 09 Dec 2025
CO2 and CH4 fluxes from standing dead trees in a northern conifer forest
Christian Hettwer
Kathleen Savage
Andrew Ouimette
Jay Wason
Roel Ruzol
Shawn Fraver
Representing 15 %–20 % of aboveground biomass in forests, deadwood is an important, yet understudied, component of ecosystem greenhouse gas (GHG) fluxes. In particular, standing dead trees (snags) can serve as conduits for the atmospheric flux of carbon dioxide (CO2) and methane (CH4), with fluxes varying according to environmental conditions. We measured CO2 and CH4 fluxes from six snags along an upland-to-wetland gradient at Howland Research Forest (Maine, USA) with measurements made every two weeks from April to November 2024. Using nonlinear models, we quantified flux responses to environmental predictors including soil moisture, soil temperature, and air temperature. Gas fluxes increased with increasing temperature, yet CO2 flux peaked at moderate soil moisture (∼ 30 %), while CH4 peaked at the highest moisture levels. CH4 fluxes were overwhelmingly net positive, suggesting that snags are important pathways for wetland gas emission. CH4 flux was relatively insensitive under low soil moisture and temperature but increased with rising soil temperature when soil moisture was high, confirming that methanogenesis depends on anaerobic moisture conditions. Results also suggest that CO2 flux co-varied with CH4 flux from snags, with decreases in CO2 flux associated with increases in CH4 flux. As soil moisture increased, a pronounced shift in gas fluxes (from CO2 to CH4 emission) occurred at ∼ 60 % soil moisture. Compared to other substrates at the site, including soils, living trees, and various deadwood, snags were the largest emitters of CO2 and second-largest emitters of CH4. We present direct measurements of gas exchange from snags along a moisture and temperature gradient, providing new insights into CO2 and CH4 fluxes from snags.
- Article
(3001 KB) - Full-text XML
- BibTeX
- EndNote


Deadwood can represent as much as 20 % of aboveground biomass in forests, thereby contributing significantly to global carbon dynamics (Komposch et al., 2022; Russell et al., 2015; Woodall et al., 2015). Among deadwood components, standing dead trees, or snags, are particularly important because they remain upright for years, decaying and releasing gases slower than other types of deadwood (Hararuk et al., 2020; Onega and Eickmeier, 1991). This is particularly important in forests with high snag densities or recent disturbances, where deadwood volumes are elevated (Kipping et al., 2022; Yatskov et al., 2022). The issue of greenhouse gas fluxes from snags will likely gain future importance as we anticipate climate-change increases in forest disturbance (Seidl et al., 2017; McDowell et al., 2020) and hence snag abundance. Snags also influence carbon flux dynamics by serving as a conduit for atmospheric flux of carbon dioxide (CO2) and methane (CH4), transporting soil-generated gases and also producing within-stem gases (Carmichael et al., 2018). Relatively few studies have addressed greenhouse gas (GHG) fluxes from snags, despite their acknowledged importance in ecosystem functioning and forest carbon dynamics.
Snags emit CO2 as the result of heterotrophic respiration. As fungi decompose wood, environmental factors, including soil moisture and temperature, influence CO2 flux rates (Mukhortova et al., 2021; Noh et al., 2019). CO2 flux from snags is positively influenced by temperature, as warmer conditions generally enhance decomposition (Renninger et al., 2014). While moisture is known to have a positive relationship with CO2 flux from deadwood (Olajuyigbe et al., 2012), excessive moisture can limit oxygen diffusion in snag stems, reducing CO2 emissions (Oberle et al., 2018). Snag CO2 emissions (per unit area) are typically smaller in magnitude than those from soils; however, emissions from the two sources are often positively correlated, as both arise from similar biological processes and environmental drivers (Perreault et al., 2021).
Even less well understood is CH4 flux from snags, which can arise through two primary pathways: passive transport of soil-generated CH4 through the stem and in situ production within the stem. In water-saturated soils, methanogenic archaea anaerobically produce CH4, primarily by reducing CO2 (Conrad, 2020). Internal conduits, particularly in trees with compromised xylem structure, can transport CH4 upward through the stem to be diffused to the atmosphere (Keppler et al., 2006; Pangala et al., 2013). This mechanism is well documented in living trees (Barba et al., 2019; Pangala et al., 2015), and emerging evidence suggests that snags can similarly serve as conduits for soil-emitted CH4 (Carmichael et al., 2018). However, because snags have the potential to host both methanogenic (CH4 emitting) and methanotrophic (CH4 consuming) communities, they may act as net CH4 sources or sinks under certain conditions (Carmichael et al., 2024; Martinez et al., 2022). In the limited studies available on this topic, the balance between methanogenesis and methanotrophy in snags appears to be strongly influenced by moisture availability and oxygen levels (Terazawa et al., 2021). Thus, in drier, well-aerated upland conditions, methanotrophic activity may dominate, leading to CH4 uptake; in contrast, in saturated lowlands or wetlands, anaerobic conditions support CH4 production, leading to net emission.
Despite their clear contribution to GHG budgets of forests, differences in gas fluxes between living and dead tree stems remain poorly understood. CH4 emissions are generally higher in living than dead stems, depending on stage of decay (Covey et al., 2016; Covey and Megonigal, 2019). CO2 emissions from deadwood are typically higher than those from living stems, but smaller than soil emissions (Warner et al., 2017). Nonetheless, snags remain active sites of biogeochemical exchange of CO2 and CH4 due to their unique microbial composition. GHG fluxes may also co-vary in ways that reflect underlying environmental controls such as moisture and temperature. Thus, snags may represent a significant, yet often overlooked, component of GHG fluxes in forest ecosystems.
Here we describe CO2 and CH4 fluxes from repeated measurements on a series of snags along an upland-to-wetland gradient in a northern temperate conifer forest. Our objectives were to (1) identify the important drivers of CO2 and CH4 fluxes from snags, (2) illustrate how these fluxes respond to key environmental variables, and (3) determine if fluxes co-vary along an upland-to-wetland gradient. In doing so, we shed light on the importance of snags in ecosystem carbon dynamics, their dependence on environmental conditions, and their significance in GHG fluxes.
2.1 Site Description
This study was conducted at Howland Research Forest of central Maine, USA (45.2041° N 68.7402° W, elevation 60 m above sea level), located in the transition zone between deciduous and boreal forests in northeastern North America. The climate is damp and cool, with average annual temperatures of 5.9 ± 0.8 °C and mean precipitation of 112 ± 21 cm yr−1 that is evenly distributed throughout the year (Daly et al., 2008). Mean daily temperature ranged from −1.2 to 26.6 °C with an average of 15.2 °C from May to November 2024, when this study took place. During this same period, daily precipitation ranged from 0 to 41.3 mm with a mean of 2.5 mm. Peak temperature occurred on 2 August and peak precipitation occurred on 9 August.
The mature, multi-aged forest is composed of approximately 90 % conifers, primarily red spruce (Picea rubens), which accounts for 51 % of the site's basal area. The forest has not been actively managed since a partial harvest in the 1920s and now displays late-successional features, including large, old trees (over 200 years), a variety of tree diameters, and diverse stages of coarse woody debris decomposition (Fien et al., 2019). Soils in the area developed from coarse-loamy granitic basal till and vary in drainage from well-drained to poorly drained across short distances along upland-to-wetland transitions (Fernandez et al., 1993). Average soil organic layer depth at the six snags was 8 cm (Table A1). Snags account for roughly 35 % (440 ± 20 g C m−2) of deadwood biomass and 3 % of total aboveground biomass at this site (Hollinger et al., 2021).
2.2 Data Collection
We randomly selected six standing dead red spruce stems for gas flux sampling (Hettwer et al., 2025a). The snags were within decay classes two and three, based on the five-class system of Sollins (1982), where one is recently dead wood and five is heavily decomposed. Snags spanned an upland-to-wetland drainage gradient, where two were in uplands, two in transitional drainage, and two in an wetlands (Fig. 1). Drainage classes (wetland, transitional, upland) were assigned based on soil moisture data obtained from 100 randomly placed soil moisture sensors, as well as a National Wetlands Inventory wetland delineation. All analyses were conducted across continuous predictor variables (e.g., soil moisture, temperature); drainage classes were used solely to guide snag selection and were not used as grouping factors in the data analyses.
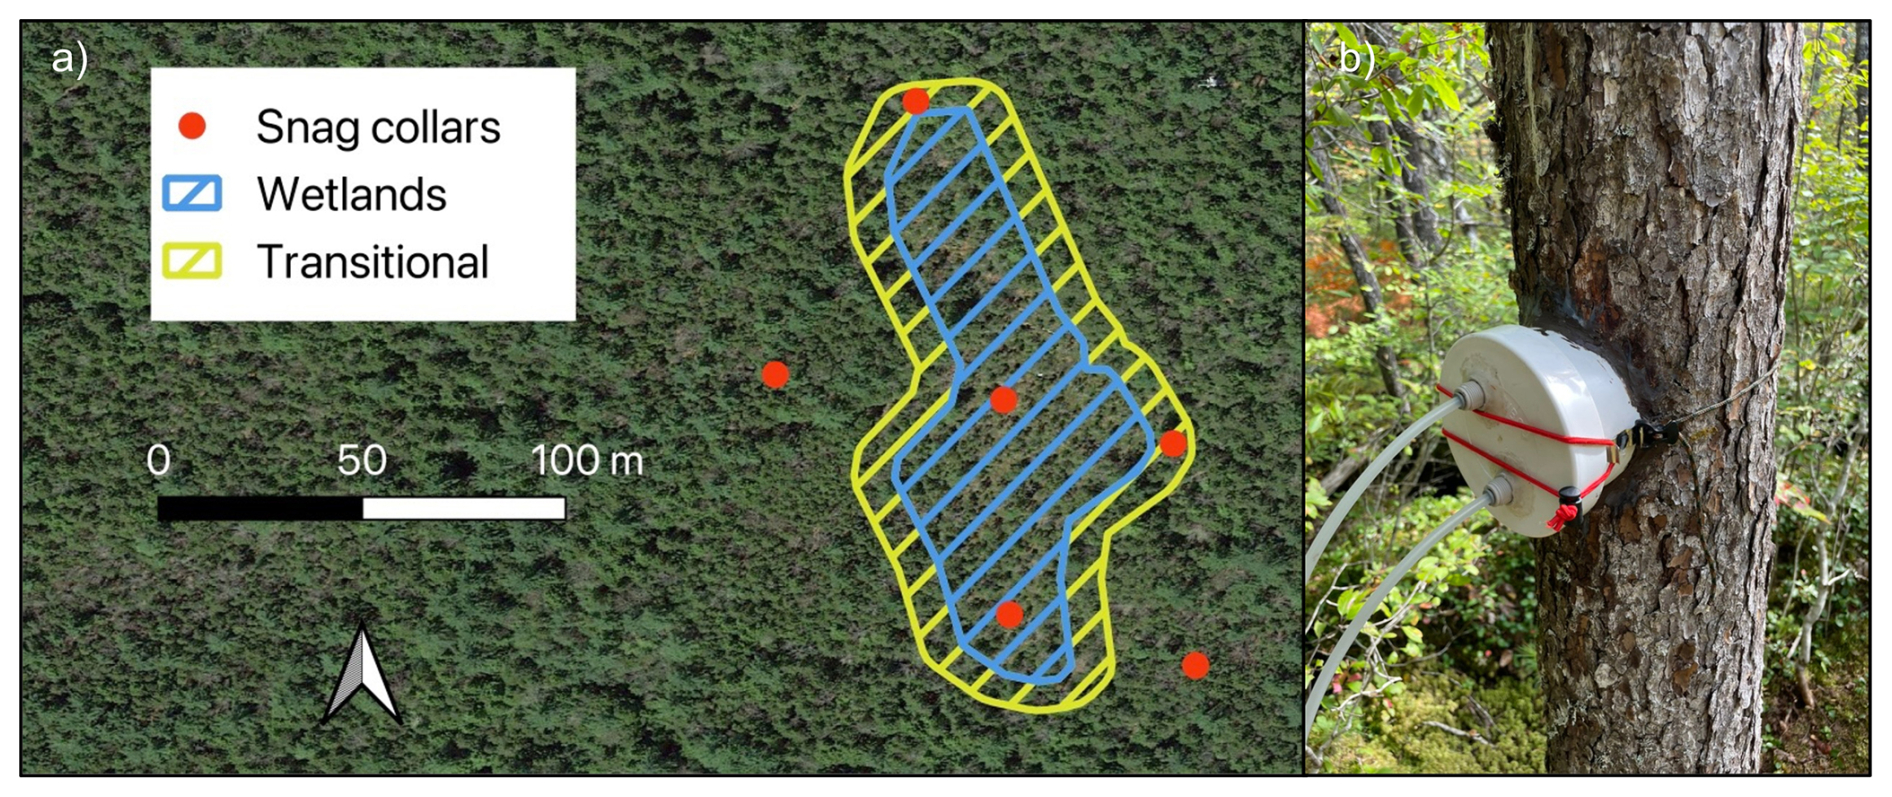
Figure 1(a) Sampling collar locations for gas flux measurements throughout the designated wetlands, transitional areas, and uplands. (b) Chamber design with inlet and outlet tubes for connecting to a gas analyzer.
To measure CO2 and CH4 flux from snag surfaces, we affixed custom-fitted PVC collars to snags with pure silicone at 50 cm stem height (Hettwer et al., 2025b). All collars were checked for leaks before each measurement by exhaling around the collar, with additional silicone applied as necessary. CO2 and CH4 concentrations were measured by sealing each collar with a custom PVC chamber lid, connected via 3 m of 6.4 mm ( in.) Bev-A-Line tubing to a LI-7810 analyzer (LI-COR Biosciences, Lincoln, NE, USA). Ambient air was flushed through the system until gas concentrations stabilized, after which manual fluxes were recorded at a frequency of 1 Hz for 6 min intervals (Hutchinson et al., 2000) per observation and processed as described below. Fluxes were also periodically measured from a set of decay class two (N = 6) and decay class four (N = 6) P. rubens logs, decay class four P. rubens stumps (N = 6), and soils according to the same protocol and at the same site.
While obtaining flux measurements from each snag, instantaneous air temperature was measured with radiation shielding (Precision Lollipop Digital Thermometer, Traceable), while soil moisture (%) and soil temperature were recorded at three locations around the snag at a depth of 15 cm (True TDR-315N Soil Moisture Sensor, Acclima). While we did not directly measure snag moisture, previous work has shown that snag volumetric water content closely tracks that of surface soil (Green et al., 2022). This makes soil moisture, a more widely available and routinely measured environmental variable, a reasonable proxy for snag moisture in our study. Flux and environmental data were collected every two weeks from May through November 2024, resulting in a total of 76 measurements. Hemispherical photographs were taken at three points around each snag (2 m from stem, at bearings 0, 120 and 240°) and processed using Gap Light Analyzer software (Frazer et al., 1999) to yield canopy openness values. Relative humidity was measured using a platinum resistance thermometer (EE181-L, Campbell Scientific) from an on-site flux tower, with data scanned every minute and averaged over 30 min intervals. For each flux measurement, the closest corresponding humidity measurement in time was selected.
2.3 Data Processing
Fluxes for CO2 (µmol m−2 s−1) and CH4 (nmol m−2 s−1) were calculated from the gas analyzer output using the ideal gas law (Eq. 1), where PV=nRT (P = barometric pressure, atm, V = chamber volume, L (liters), R (gas constant) = 0.08206 L atm mol−1 K−1, T = temperature, °C).
The rate of change in gas concentration over time () was calculated from 90 to 345 s for each sampling event, using gas concentration versus time data obtained from the gas analyzer. This timeframe was chosen to reduce the influence of chamber sealing artifacts and initial concentration surges commonly seen in wetland trees (Yong et al., 2024). Barometric pressure (P) was paired with the nearest 30 min measurement recorded by an on-site pressure sensor. Chamber volumes (V) were determined in the lab for each chamber size by sealing the tree-facing side with a contour-fitting cover, filling the chamber with quinoa seeds, and measuring the displaced volume. Surface areas (A) of tree stems within the chambers were also calculated for each template size. Air temperature (°C) at the time of sampling was converted to Kelvin (K) before calculating fluxes. The minimum detectable flux was estimated for each measurement following methods from Christiansen et al. (2015) and Nickerson (2016) with all measured fluxes falling within detectable limits. Data processing was performed in R (version 4.5.0) (R Core Team, 2024) using RStudio (Posit Team, 2024).
2.4 Data Analysis
To investigate the environmental drivers of CO2 and CH4 fluxes from snags, we conducted a series of statistical and predictive modeling approaches. Random forest analysis, using the Boruta package in R (Kursa and Rudnicki, 2010), allowed us to identify the most influential environmental predictors associated with each gas flux. These potential predictors included air temperature, soil temperature, volumetric soil moisture, relative humidity, organic soil pH, diameter at breast height, and canopy openness. We then used symbolic regression in Python (PySR) to determine mathematical models that best describe the relationships between top environmental predictors and gas fluxes (separate models for CO2 and CH4). This algorithm generated interpretable nonlinear models by automatically developing numerous candidate models and ranking them based on AICc scores (Cranmer, 2023).
To evaluate the strength of nonlinear interaction effects between predictor variables, we computed the second-order mixed partial derivatives () of the fitted nonlinear response surfaces. Doing so allowed us to assess how the effect of one predictor (e.g., soil moisture) on the response (e.g., CO2 or CH4 flux) changed depending on the level of another predictor (e.g., soil or air temperature). By calculating these interaction terms across a grid of observed data ranges, we identified regions where interactions were strongest, which may indicate synergistic or antagonistic environmental effects on gas fluxes. Given the response curve, we determined the optimal soil moisture (x1) for maximizing CO2 flux (y) by setting the derivative of ln (y) with respect to x1 to 0 (Eq. 2).
To determine if the relationship between CO2 and CH4 fluxes varied across the soil moisture gradient, we fit linear models with CH4 flux as a response to the interaction between soil moisture and CO2 flux. For CO2 and CH4 fluxes in this two-gas model, we used our top-performing nonlinear models and held temperature constant at low (25th percentile) and high (75th percentile) values. We then used a multivariate analysis of variance (MANOVA) to test whether soil moisture jointly influenced CO2 and CH4 fluxes, treating both gases as simultaneous response variables, at low and high temperatures. Lastly, we used Pearson tests on raw data to determine the correlation between CO2 and CH4 fluxes.
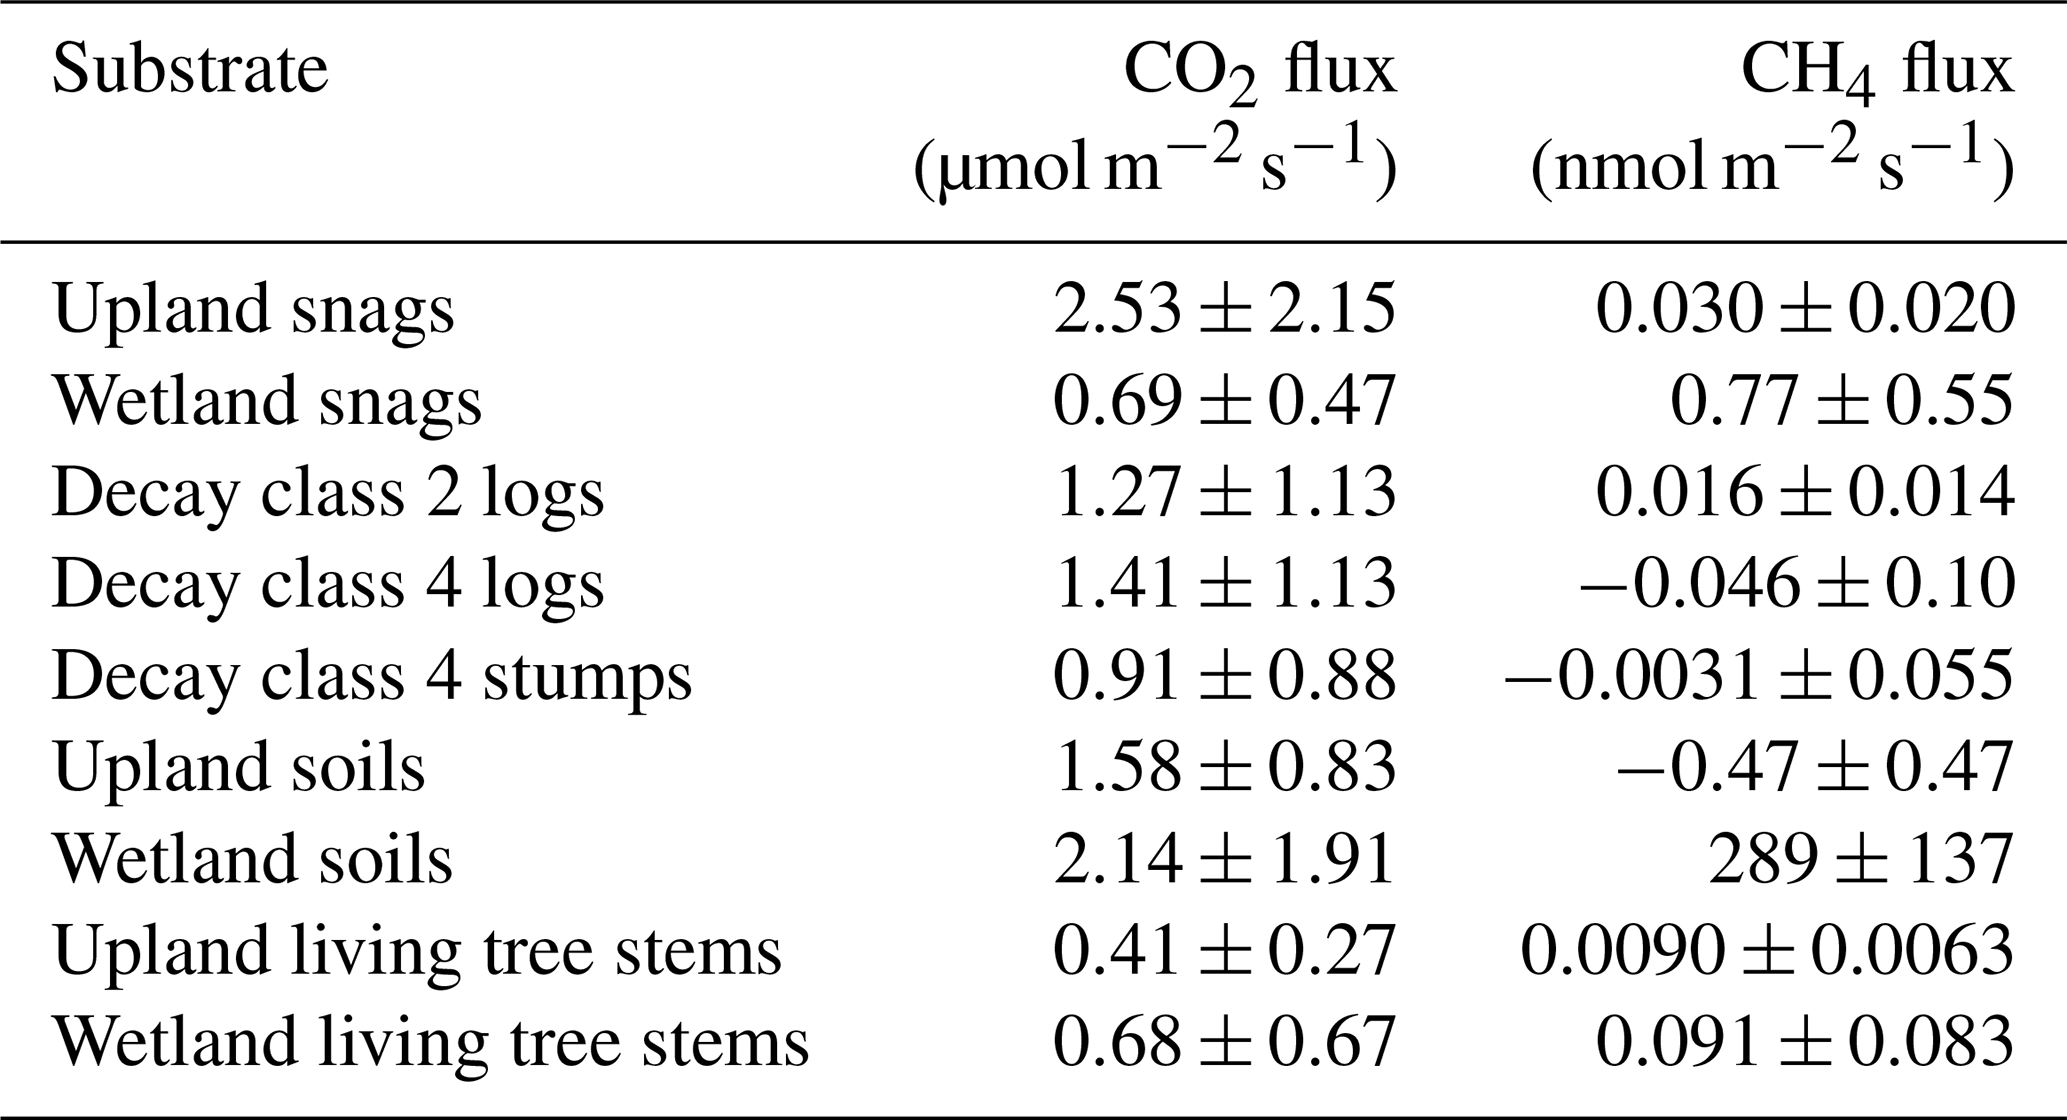
Sampling period snag CO2 fluxes ranged from 0.20 to 9.75 µmol m−2 s−1 (mean ± SD = 2.26 ± 2.34) and CH4 fluxes ranged from −0.21 to 2.46 nmol m−2 s−1 (0.25 ± 0.44). CO2 emissions were highest from late-June to late-July and CH4 emissions were highest from mid-July to mid-August (Fig. 2). Minor CH4 uptake was observed only three times out of 72 measurements throughout the sampling period, all of which occurred on upland snags. Mean CO2 and CH4 fluxes approached zero between October (day of year 275) and November. In comparing fluxes from various substrates at Howland Research Forest, upland snags emerged as the largest emitters of CO2 (Table 1). Wetland snags were the second-largest emitter of CH4 behind wetland soils.
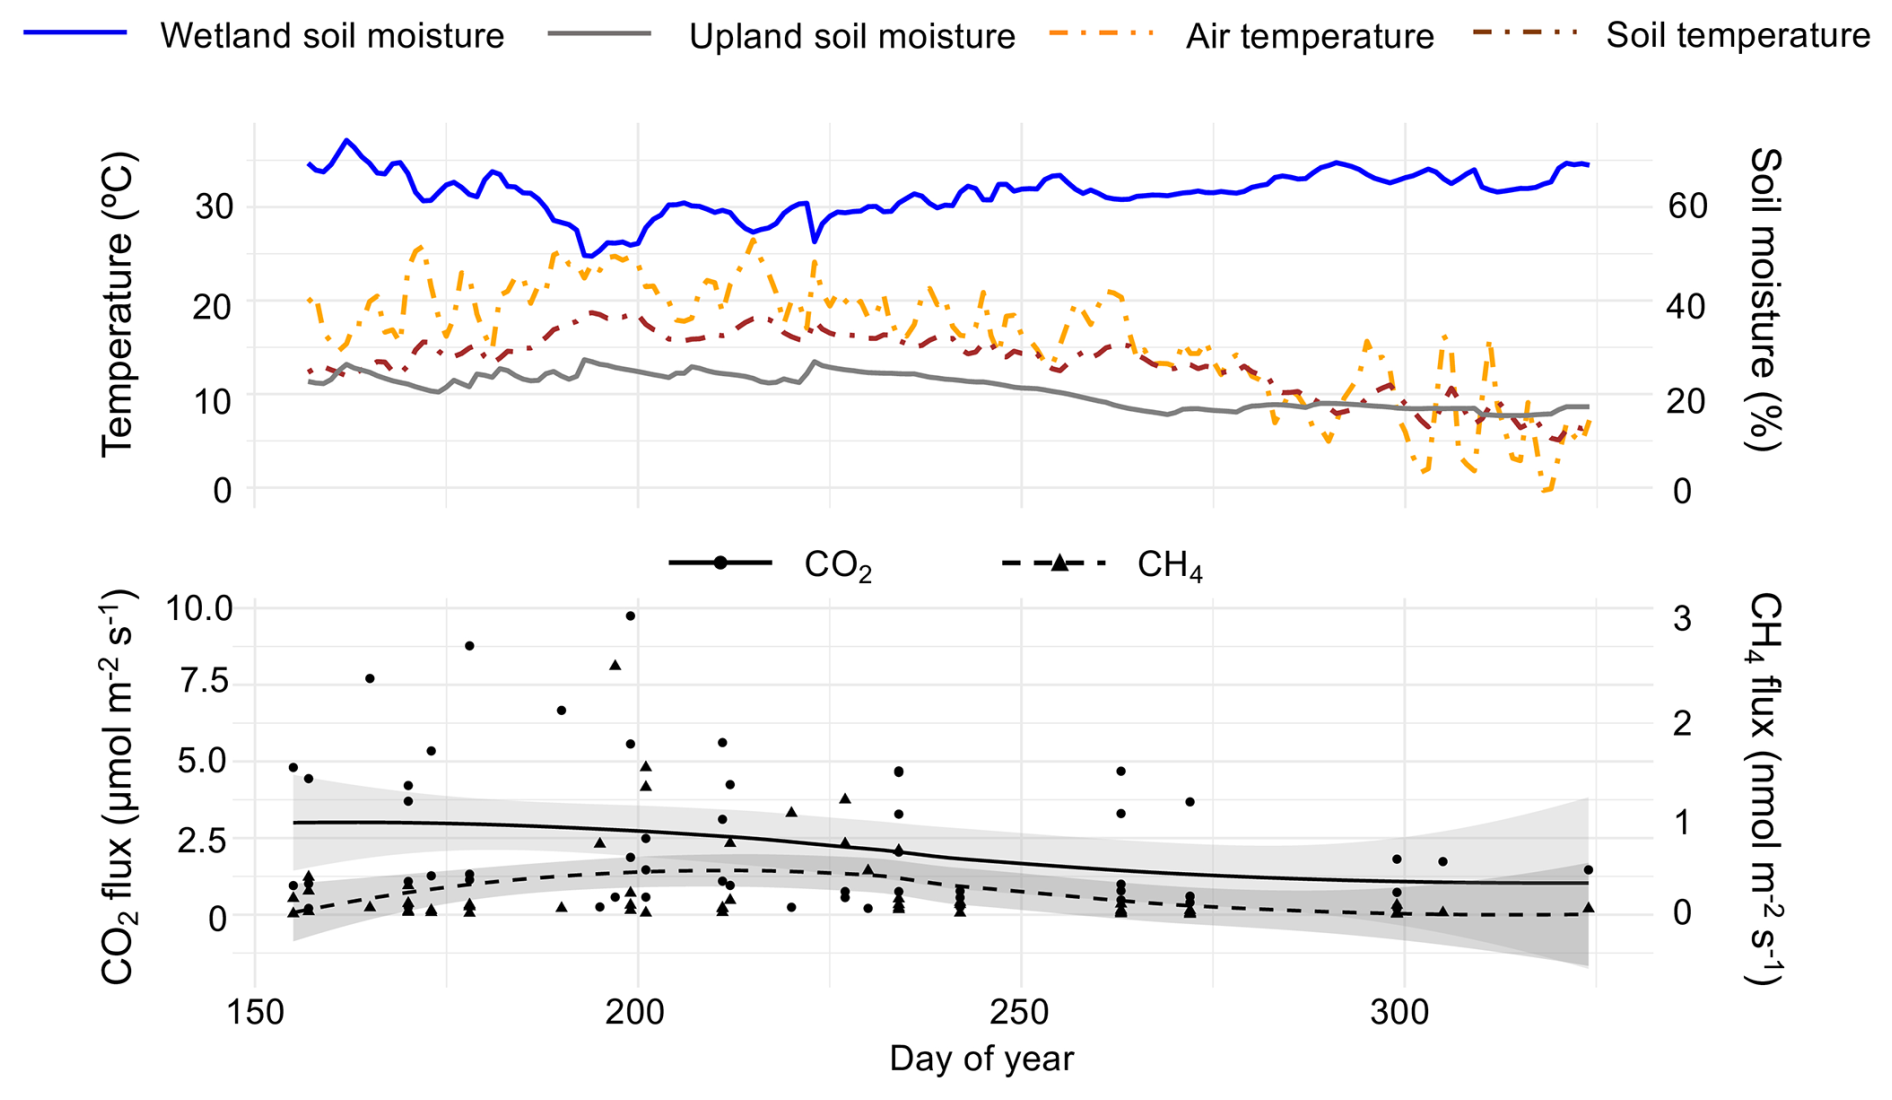
Figure 2Top pane shows environmental conditions (temperature and soil moisture) throughout the sampling period, obtained from on-site eddy-covariance tower. Bottom pane shows observed CO2 (primary y-axis) and CH4 (secondary y-axis) fluxes vs. day of year. The shaded regions around each spline represent the 95 % confidence interval, calculated using standard errors from the smoothing model.
Table 1Summary of CO2 and CH4 fluxes (mean ± SD) from snags, logs, stumps, soils, and living tree stems during the 2024 growing season at Howland Research Forest in central Maine. Data for living tree stem (Picea rubens) fluxes is from Hettwer et al. (2025a).
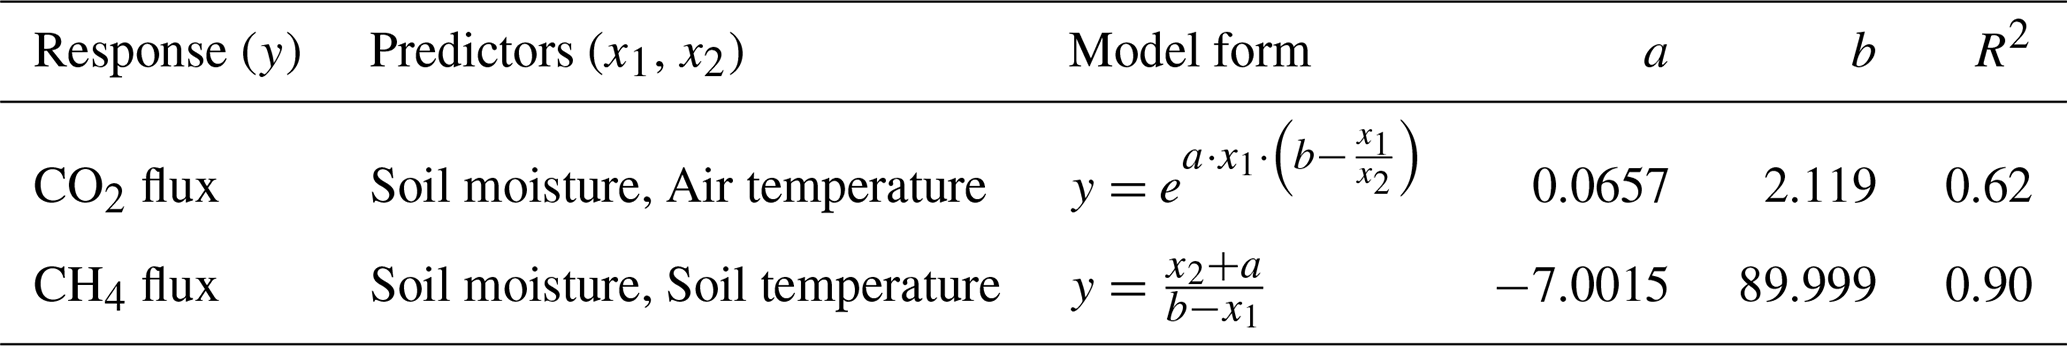
Based on random forest analysis, soil moisture, air temperature, and canopy openness were deemed important for CO2 flux, and soil moisture, soil temperature, and canopy openness for CH4 flux. Canopy openness was strongly correlated with soil moisture (r = 0.74) and was therefore omitted from subsequent analyses. Relative humidity and stem diameter were classified as unimportant and were also omitted. Results from our nonlinear model fitting suggested that CO2 flux followed an exponential increase or decrease depending on the relative values of soil moisture and air temperature (Table 2, Fig. 3a). Importantly, this model has the potential for negative, or antagonistic, interaction between predictors. CH4 flux responded to soil moisture and soil temperature as a rational function where flux changed slowly until soil moisture approached a critical value (∼ 60 %), above which it increased dramatically, although modulated by soil temperature (Table 2, Fig. 3b).
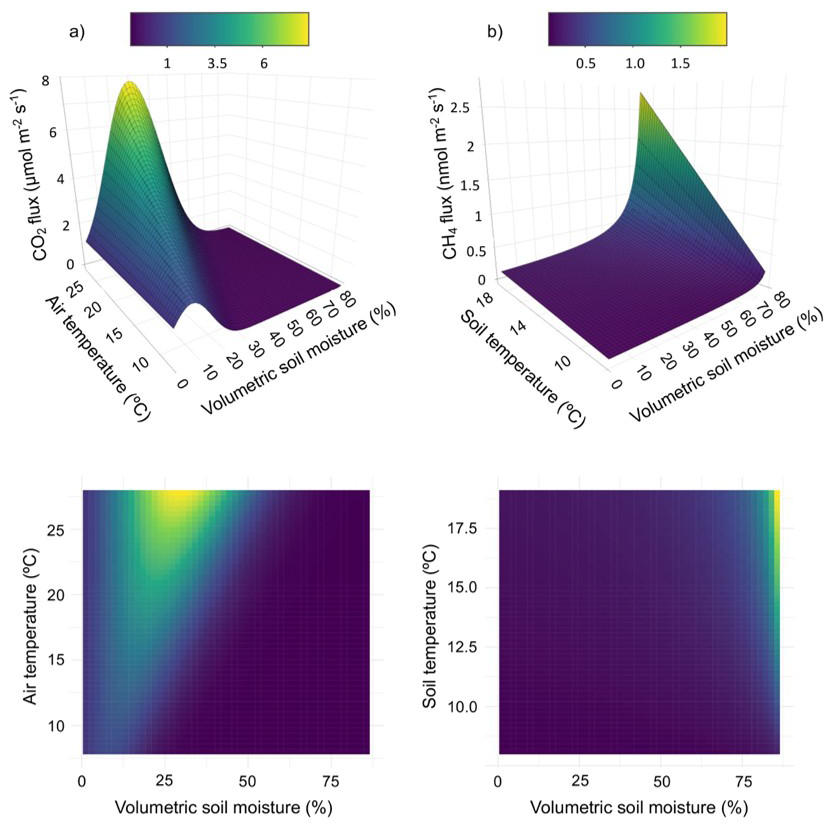
Figure 3Modeled relationships between (a) CO2 and (b) CH4 snag fluxes and top environmental variables, highlighting the important interactions between predictors for each gas. Color scales correspond to CO2 (µmol m−2 s−1) and CH4 (nmol m−2 s−1) units. Top pane shows 3D surface plots and bottom pane shows 2D heatmaps.
Table 2Top-performing nonlinear models for CO2 flux (µmol m−2 s−1) and CH4 flux (nmol m−2 s−1) from snags with the functional forms of each model, the estimated parameters, and associated coefficients of determination (R2).
Modeling based on partial derivatives highlighted distinct response surfaces for the two gases while revealing interactive effects between the predictors for each (Fig. 3). The highest CO2 fluxes occurred at intermediate soil moisture levels (25 %–35 % volumetric soil moisture) and elevated temperatures (> 20 °C). The strongest positive interaction for predicting CO2 flux ( = 0.05 µmol m−2 s−1 (%VWC °C)−1) occurred at 27 % soil moisture and 28 °C air temperature (maximum observed value). The strongest negative interaction occurred at 53 % soil moisture and 28 °C air temperature. Assuming maximum observed air temperature, CO2 flux reached its maximum at 30 % volumetric soil moisture. The nonlinear models also highlighted the relationship between CO2 and CH4 fluxes along the upland-to-wetland moisture gradient (Fig. 4). CO2 flux peaked at approximately 30 % soil moisture, then declined exponentially until becoming negligible at approximately 60 % soil moisture, where CH4 fluxes exhibited a sharp increase at that soil moisture level.
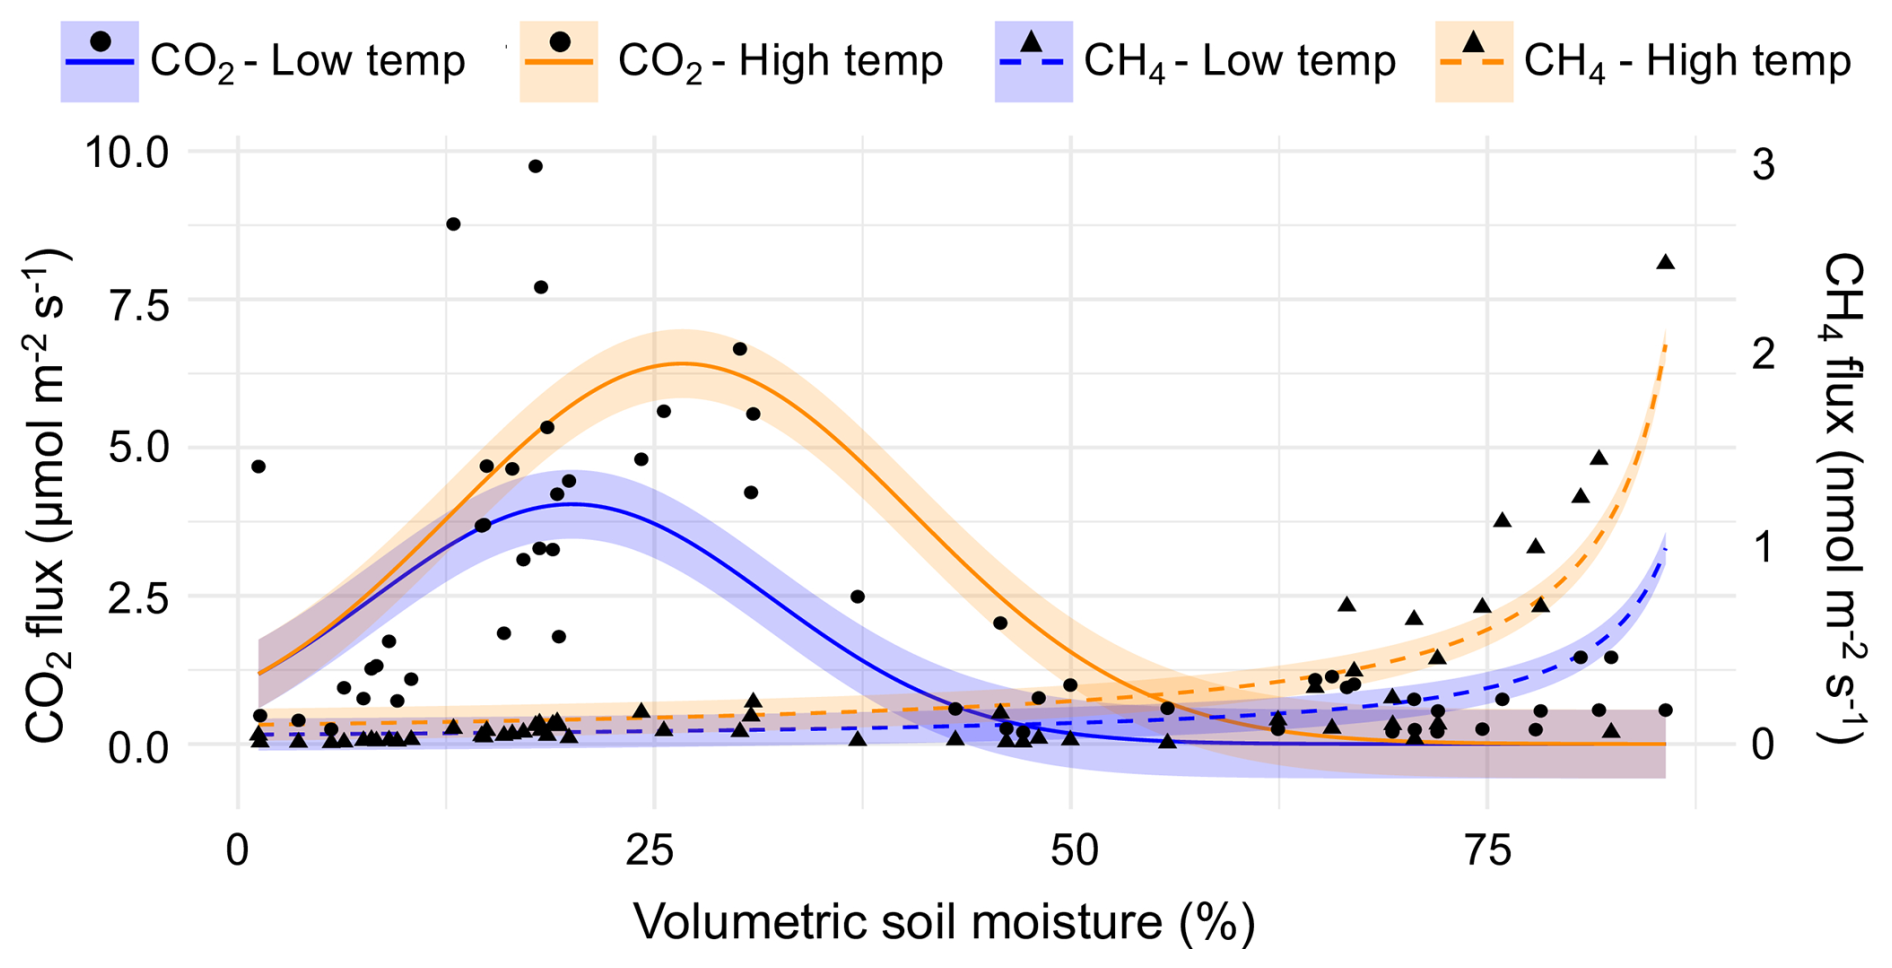
Figure 4Observed snag CO2 and CH4 fluxes along a soil-moisture gradient, with curve fits corresponding to top-performing nonlinear models. Temperature (air temperature for CO2, soil temperature for CH4) was held constant at low (25th percentile) and high (75th percentile) values for predicting curves. Shaded regions around each curve represent the 95 % confidence intervals.
CH4 fluxes increased sharply with higher soil moisture levels (∼ 60 %) and exhibited negligible response to increases in soil temperature, except when soil moisture was high. The strongest interaction effect between predictors was observed at 86 % soil moisture (maximum observed value) and 17 °C soil temperature, while the weakest interaction occurred at 1 % soil moisture (minimum observed value) and 14 °C soil temperature.
The two-gas model revealed a significant negative interaction between CO2 flux and soil moisture in predicting CH4 flux (p < 0.001), indicating that the positive effect of soil moisture on CH4 flux weakened as CO2 flux increased. Regardless of temperature percentile, the relationship between the two gases varied along the soil moisture gradient. Specifically, CH4 flux increased when CO2 flux decreased under increasing moisture conditions. Furthermore, the MANOVA results show that CO2 and CH4 fluxes were jointly influenced by soil moisture (p < 0.001). CH4 and CO2 fluxes were negatively correlated (r = −0.53), suggesting they respond differently along the soil moisture gradient.
Our results highlight the strong influence that soil moisture and temperature exert on gas fluxes from snags, demonstrating these responses along an upland-to-wetland moisture gradient. CO2 fluxes peaked at intermediate soil moisture (∼ 30 %) and high temperatures, showing a significant interaction between soil moisture and air temperature. CH4 fluxes rose sharply at high soil moisture (∼ 60 %) and were primarily driven by soil moisture, with a strong interaction between soil moisture and soil temperature. These drivers, identified by random forest, seem reasonable based on the differing origins of the emissions. CO2 emissions result from aerobic microbial respiration within the deadwood itself, and are thus more influenced by air temperature. In contrast, CH4 emissions result from anaerobic methanogenesis in the saturated soils at the snag base, with the gas then transported upward through the snag stem (Covey et al., 2016).
CO2 flux increased as air temperature increased, in agreement with previous studies (Boddy, 1983; Noh et al., 2019), but it also depended on soil moisture. As soil moisture deviated in either direction from that of maximum CO2 flux (∼ 30 %), flux decreased towards zero. Therefore, our results suggest that fungal activity in snags, and in turn CO2 emissions, may be inhibited at both low and high moisture conditions. The finding of reduced deadwood CO2 flux under low moisture conditions has been reported in previous studies (Boddy, 1983; Hicks et al., 2003). The finding of reduced CO2 flux at high moisture conditions corroborates several deadwood studies (Meyer and Brischke, 2015; Progar et al., 2000) but contrasts with others (Forrester et al., 2012; Gough et al., 2007).
CH4 flux increased sharply with rising soil moisture when soil temperature was high, indicating a synergistic effect between the two variables. Similarly, CH4 flux became more responsive to increases in soil temperature when soil moisture was high, suggesting that optimal conditions for CH4 emission occurred when both predictors were elevated. CH4 flux rates, as well as interaction effects of predictor variables, were negligible in drier, cooler conditions. The insensitivity of CH4 flux to increasing soil moisture, even at high temperatures, aligns with findings of a volumetric soil moisture threshold of ∼ 60 % beyond which CH4 flux rates from soils and living tree stems increase dramatically (von Fischer and Hedin, 2007; Hettwer et al., 2025b). While a positive relationship between CH4 flux and moisture has been observed from soils and other deadwood forms (Covey and Megonigal, 2019; Kipping et al., 2022), the dynamics of snag CH4 flux and its dependence on moisture remain poorly understood, perhaps due to the challenge of directly measuring internal snag moisture (Green et al., 2022).
Our results point to a complex, moisture-sensitive relationship between CO2 and CH4 fluxes in the studied ecosystem. The significant interaction between CO2 flux and soil moisture in predicting CH4 flux suggests that the behavior of one gas flux may be linked to the other, especially under varying moisture conditions. As soil moisture increased, CO2 flux declined while CH4 flux rose, indicating a possible transition from aerobic to anaerobic microbial processes. The negative correlation between CO2 and CH4 fluxes, combined with MANOVA results showing soil moisture as a joint flux driver, reinforces the assumption that the coupling of these gas fluxes is moisture dependent. Furthermore, the shift in positive CO2 to CH4 fluxes between 60 %–70 % moisture aligns with reported values for volumetric water content at which conditions shift from aerobic to anaerobic (Długosz et al., 2024; Fairbairn et al., 2023; Schlüter et al., 2025). Overall, these findings underscore the importance of soil moisture in regulating greenhouse gas dynamics in forested systems and the value of using a two-gas framework to understand GHG fluxes as they pertain to radiative forcing and climate change.
In addition to exhibiting complex relationships between gas fluxes and environmental drivers, snags may also emit higher rates of CO2 and CH4 than other forest surfaces. Several studies report that snags can emit CO2 and CH4 at rates comparable to or greater than those from downed wood and living trees. Martinez et al. (2022) measured average wetland snag flux rates of 0.73 µmol CO2 m−2 s−1 and 5.21 nmol CH4 m−2 s−1, and Carmichael et al. (2018) measured 0.72 µmol CO2 m−2 s−1 and 6.94 nmol CH4 m−2 s−1. While snag CH4 emissions were not this large at our site, they still exceeded those from living trees, revealing a pattern not previously documented. Emphasized by their magnitude of CO2 and CH4 fluxes and relationships with environmental predictors, snags represent an important and understudied component of forest biogeochemical exchange, particularly across drainage gradients where CO2 and CH4 emissions will vary independently. The conifer forest of this region may be at particular risk of increased snag abundance, an in turn increased GHG emissions, because of current spruce budworm (Choristoneura fumiferana) outbreaks in adjacent Canadian Provinces and growing budworm populations in northern Maine (Spruce Budworm Task Force 2023 Update, 2023).
In summary, we found that moisture and temperature interact in complex ways to govern both CO2 and CH4 fluxes from snags. Both gas fluxes increased with increasing temperature, yet CO2 flux peaked at moderate moisture levels, while CH4 peaked at the highest moisture recorded. CH4 fluxes were overwhelmingly net positive (i.e., sources to the atmosphere), suggesting that snags represent an important pathway for wetland gas production; however, they may serve as CH4 sinks under certain conditions. Our results derive from a small number of snags, yet they provide compelling evidence for the importance of snag fluxes in the forest carbon cycle, particularly considering projected increases in regional temperature and precipitation (Fernandez et al., 2020). Our results identify further knowledge gaps regarding the influence of snag wood traits, stem height, stages of snag decay, and fungal community composition.
These results demonstrate that standing dead trees (snags) in northern conifer forests emit both CO2 and CH4, with flux dynamics strongly regulated by environmental gradients, particularly soil moisture. CO2 flux peaked at intermediate soil moisture (∼ 30 %) and warm air temperatures, following a rational response shaped by interactive effects between soil moisture and air temperature. In contrast, CH4 flux remained low until soil moisture exceeded a threshold (∼ 60 %), after which emissions increased sharply, modulated by soil temperature. The observed negative correlation between CO2 and CH4 fluxes, along with evidence of an interaction between CO2 flux and soil moisture in predicting CH4 flux, suggests that the two gases respond divergently along the upland-to-wetland gradient. In comparing various substrates at our site, snags emerged as the largest emitters of CO2 and the second-largest emitters of CH4 behind soils. These environmentally-driven patterns reveal that GHG fluxes from snags behaved similarly to those from soils. Future research should incorporate simultaneous measurements of CO2 and CH4 fluxes from snags and their surrounding soils to elucidate the relative contributions of soil- versus snag-derived emissions.
Overall, these findings highlight the complexity of greenhouse gas emissions from snags and underscore the importance of considering interactive environmental drivers when modeling their contributions to forest carbon dynamics. These results are especially important because of climate-change increases in forest disturbance, particularly spruce budworm in this region, leading to increased snag abundance. Further research is needed to clarify how snag species and their associated microbial consortia influence gaseous fluxes. Additionally, quantifying snag CO2 and CH4 emissions across various ecosystems and regions remains a critical gap. Addressing these uncertainties is essential for integrating snag fluxes into ecosystem- and landscape-scale carbon budgets.
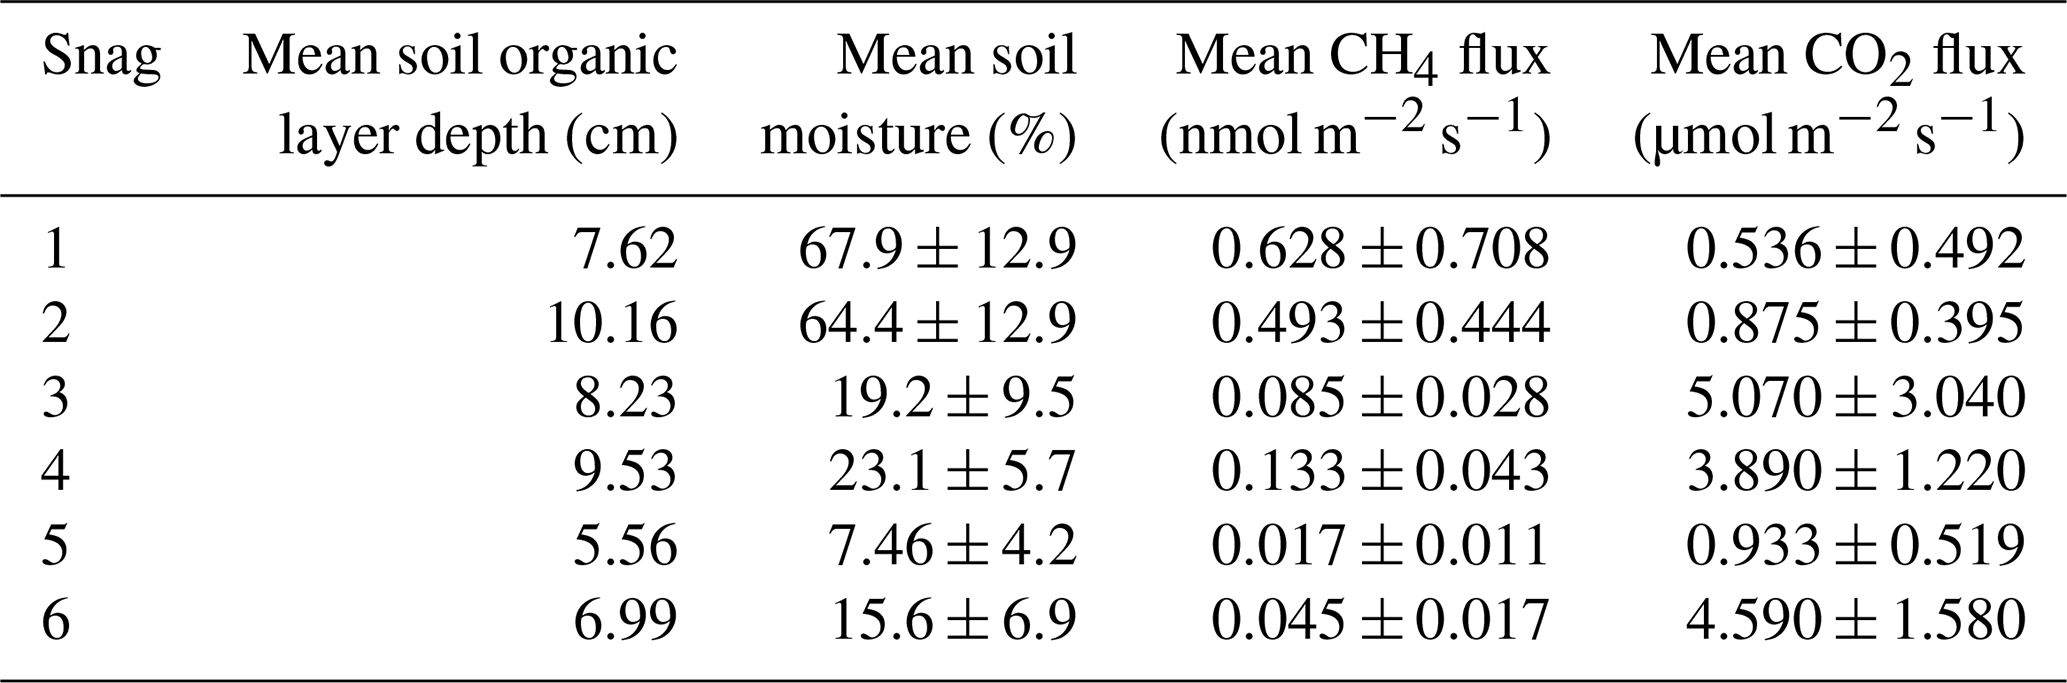
Table A1Organic layer depth (mean of three points) for each snag and mean soil moisture and snag fluxes across the sampling period. Also reported are the standard deviations for soil moisture, CH4 flux, and CO2 flux.
The datasets generated and analyzed during the current study have been made available in the Environmental Data Initiative (EDI) repository (https://doi.org/10.6073/pasta/60ef923f4f82f8931bd904ebb36a8bd7; Hettwer et al., 2025b).
All authors contributed to the study conception and design. Material preparation, data collection and analysis were performed by CH. The first draft of the manuscript was written by CH and all authors commented on previous versions of the manuscript. All authors read and approved the final manuscript.
The contact author has declared that none of the authors has any competing interests.
Publisher's note: Copernicus Publications remains neutral with regard to jurisdictional claims made in the text, published maps, institutional affiliations, or any other geographical representation in this paper. While Copernicus Publications makes every effort to include appropriate place names, the final responsibility lies with the authors. Views expressed in the text are those of the authors and do not necessarily reflect the views of the publisher.
We would like to thank Ivan Fernandez, Jonathan Gewirtzman, and Rachel Poppe for their help with this manuscript.
This research has been supported by the National Science Foundation (DEB Award nos. 2208658 and 2208655), the U.S. Department of Energy, Office of Science (AmeriFlux core site (US-Ho1)), the U.S. Forest Service, Northern Research Station (grant no. JVA 25-JV-11242306-009), and the Maine Agricultural and Forest Experiment Station (grant nos. ME042612 and ME042121).
This paper was edited by Paul Stoy and reviewed by two anonymous referees.
Barba, J., Bradford, M. A., Brewer, P. E., Bruhn, D., Covey, K., van Haren, J., Megonigal, J. P., Mikkelsen, T. N., Pangala, S. R., Pihlatie, M., Poulter, B., Rivas-Ubach, A., Schadt, C. W., Terazawa, K., Warner, D. L., Zhang, Z., and Vargas, R.: Methane emissions from tree stems: a new frontier in the global carbon cycle, New Phytologist, 222, 18–28, https://doi.org/10.1111/nph.15582, 2019.
Boddy, L.: Carbon dioxide release from decomposing wood: Effect of water content and temperature, Soil Biol. Biochem., 15, 501–510, https://doi.org/10.1016/0038-0717(83)90042-1, 1983.
Carmichael, M. J., Helton, A. M., White, J. C., and Smith, W. K.: Standing Dead Trees are a Conduit for the Atmospheric Flux of CH4 and CO2 from Wetlands, Wetlands, 38, 133–143, https://doi.org/10.1007/s13157-017-0963-8, 2018.
Carmichael, M. J., Martinez, M., Bräuer, S. L., and Ardón, M.: Microbial Communities in Standing Dead Trees in Ghost Forests are Largely Aerobic, Saprophytic, and Methanotrophic, Curr. Microbiol., 81, 229, https://doi.org/10.1007/s00284-024-03767-w, 2024.
Christiansen, J., Outhwaite, J., and Smukler, S.: Comparison of CO2, CH4 and N2O soil-atmosphere exchange measured in static chambers with cavity ring-down spectroscopy and gas chromatography, Agric. For. Meteorol., 211, https://doi.org/10.1016/j.agrformet.2015.06.004, 2015.
Conrad, R.: Methane Production in Soil Environments – Anaerobic Biogeochemistry and Microbial Life between Flooding and Desiccation, Microorganisms, 8, 881, https://doi.org/10.3390/microorganisms8060881, 2020.
Covey, K. R. and Megonigal, J. P.: Methane production and emissions in trees and forests, New Phytologist, 222, 35–51, https://doi.org/10.1111/nph.15624, 2019.
Covey, K. R., de Mesquita, C. P. B., Oberle, B., Maynard, D. S., Bettigole, C., Crowther, T. W., Duguid, M. C., Steven, B., Zanne, A. E., Lapin, M., Ashton, M. S., Oliver, C. D., Lee, X., and Bradford, M. A.: Greenhouse trace gases in deadwood, Biogeochemistry, 130, 215–226, https://doi.org/10.1007/s10533-016-0253-1, 2016.
Cranmer, M.: Interpretable Machine Learning for Science with PySR and SymbolicRegression.jl, arXiv [preprint], https://doi.org/10.48550/arXiv.2305.01582, 2023.
Daly, C., Halbleib, M. D., Smith, J. I., Gibson, W., Doggett, M. K., Taylor, G. H., Curtis, J. M., and Pasteris, P. P.: Physiographically sensitive mapping of climatological temperature and precipitation across the conterminous United States, International Journal of Climatology, 28, 2031–2064, https://doi.org/10.1002/joc.1688, 2008.
Długosz, J., Piotrowska-Długosz, A., and Breza-Boruta, B.: The effect of differences in soil water content on microbial and enzymatic properties across the soil profiles, Ecohydrology & Hydrobiology, 24, 547–556, https://doi.org/10.1016/j.ecohyd.2023.06.010, 2024.
Fairbairn, L., Rezanezhad, F., Gharasoo, M., Parsons, C. T., Macrae, M. L., Slowinski, S., and Van Cappellen, P.: Relationship between soil CO2 fluxes and soil moisture: Anaerobic sources explain fluxes at high water content, Geoderma, 434, 116493, https://doi.org/10.1016/j.geoderma.2023.116493, 2023.
Fernandez, I. J., Son, Y., Kraske, C. R., Rustad, L. E., and David, M. B.: Soil Carbon Dioxide Characteristics under Different Forest Types and after Harvest, Soil Science Society of America Journal, 57, 1115–1121, https://doi.org/10.2136/sssaj1993.03615995005700040039x, 1993.
Fernandez, I. J., Birkel, S., Schmitt, C. V, Simonson, J., Lyon, B., Pershing, A., Stancioff, E., and Jacobson, G. L.: Maine's climate future: 2020 update, University of Maine, https://doi.org/10.13140/RG.2.2.24401.07521, 2020.
Fien, E. K. P., Fraver, S., Teets, A., Weiskittel, A. R., and Hollinger, D. Y.: Drivers of individual tree growth and mortality in an uneven-aged, mixed-species conifer forest, For. Ecol. Manage., 449, 117446, https://doi.org/10.1016/j.foreco.2019.06.043, 2019.
Forrester, J., Mladenoff, D., Gower, S., and Stoffel, J.: Interactions of temperature and moisture with respiration from coarse woody debris in experimental forest canopy gaps, For. Ecol. Manage., 265, 124–132, https://doi.org/10.1016/j.foreco.2011.10.038, 2012.
Frazer, G. W., Canham, C. D., and Lertzman, K. P.: Gap Light Analyzer (GLA), Version 2.0: Imaging software to extract canopy structure and gap light transmission indices from true-colour fisheye photographs, users manual and program documentation, Simon Fraser University, Burnaby, British Columbia, and the Institute of Ecosystem Studies, Millbrook, New York, https://rem-main.rem.sfu.ca/downloads/Forestry/GLAV2UsersManual.pdf (last access: 15 April 2025), 1999.
Gough, C., Vogel, C., Kazanski, C., Nagel, L., Flower, C., and Curtis, P.: Coarse woody debris and the carbon balance of a north temperate forest, For. Ecol. Manage., 244, 60–67, https://doi.org/10.1016/j.foreco.2007.03.039, 2007.
Green, M. B., Fraver, S., Lutz, D. A., Woodall, C. W., D'Amato, A. W., and Evans, D. M.: Does deadwood moisture vary jointly with surface soil water content?, Soil Science Society of America Journal, 86, 1113–1121, https://doi.org/10.1002/saj2.20413, 2022.
Hararuk, O., Kurz, W. A., and Didion, M.: Dynamics of dead wood decay in Swiss forests, For. Ecosyst., 7, 36, https://doi.org/10.1186/s40663-020-00248-x, 2020.
Hettwer, C., Savage, K., Gewirtzman, J., Ruzol, R., Wason, J., Cadillo-Quiroz, H., and Fraver, S.: Methane flux from living tree stems in a northern conifer forest, Biogeochemistry, 168, 66, https://doi.org/10.1007/s10533-025-01257-0, 2025a.
Hettwer, C., Fraver, S., and Savage, K.: CO2 and CH4 fluxes from living and standing dead trees in Howland Research Forest, Maine USA, 2024, Environmental Data Initiative [data set], https://doi.org/10.6073/pasta/60ef923f4f82f8931bd904ebb36a8bd7, 2025b.
Hicks, W., Harmon, M., and Griffiths, R.: Abiotic controls on nitrogen fixation and respiration in selected woody debris from the Pacific Northwest, U.S.A, Ecoscience, 10, 66–73, https://doi.org/10.1080/11956860.2003.11682752, 2003.
Hollinger, D. Y., Davidson, E. A., Fraver, S., Hughes, H., Lee, J. T., Richardson, A. D., Savage, K., Sihi, D., and Teets, A.: Multi-Decadal Carbon Cycle Measurements Indicate Resistance to External Drivers of Change at the Howland Forest AmeriFlux Site, J. Geophys. Res. Biogeosci., 126, e2021JG006276, https://doi.org/10.1029/2021JG006276, 2021.
Hutchinson, G. L., Livingston, G. P., Healy, R. W., and Striegl, R. G.: Chamber measurement of surface-atmosphere trace gas exchange: Numerical evaluation of dependence on soil, interfacial layer, and source/sink properties, Journal of Geophysical Research: Atmospheres, 105, 8865–8875, https://doi.org/10.1029/1999JD901204, 2000.
Keppler, F., Hamilton, J. T. G., Braß, M., and Röckmann, T.: Methane emissions from terrestrial plants under aerobic conditions, Nature, 439, 187–191, https://doi.org/10.1038/nature04420, 2006.
Kipping, L., Gossner, M. M., Koschorreck, M., Muszynski, S., Maurer, F., Weisser, W. W., Jehmlich, N., and Noll, M.: Emission of CO2 and CH4 From 13 Deadwood Tree Species Is Linked to Tree Species Identity and Management Intensity in Forest and Grassland Habitats, Global Biogeochem. Cycles, 36, e2021GB007143, https://doi.org/10.1029/2021GB007143, 2022.
Komposch, A., Ensslin, A., Fischer, M., and Hemp, A.: Aboveground Deadwood Biomass and Composition Along Elevation and Land-Use Gradients at Mount Kilimanjaro, Front. Ecol. Evol., 9, https://doi.org/10.3389/fevo.2021.732092, 2022.
Kursa, M. B. and Rudnicki, W. R.: Feature Selection with the Boruta Package, J. Stat. Softw., 36, 1–13, https://doi.org/10.18637/jss.v036.i11, 2010.
Martinez, M., Ardón, M., and Carmichael, M. J.: Identifying Sources and Oxidation of Methane in Standing Dead Trees in Freshwater Forested Wetlands, Front. Environ. Sci., 9, https://doi.org/10.3389/fenvs.2021.737379, 2022.
McDowell, N. G., Allen, C. D., Anderson-Teixeira, K., Aukema, B. H., Bond-Lamberty, B., Chini, L., Clark, J. S., Dietze, M., Grossiord, C., Hanbury-Brown, A., and Hurtt, G. C.: Pervasive shifts in forest dynamics in a changing world, Science, 368, eaaz9463, https://doi.org/10.1126/science.aaz9463, 2020.
Meyer, L. and Brischke, C.: Fungal decay at different moisture levels of selected European-grown wood species, Int. Biodeterior. Biodegradation, 103, 23–29, https://doi.org/10.1016/j.ibiod.2015.04.009, 2015.
Mukhortova, L., Pashenova, N., Meteleva, M., Krivobokov, L., and Guggenberger, G.: Temperature sensitivity of CO2 and CH4 fluxes from coarse woody debris in northern boreal forests, Forests, 12, 624, https://doi.org/10.3390/f12050624, 2021.
Nickerson, N.: Evaluating gas emission measurements using Minimum Detectable Flux (MDF), Eosense Inc., https://doi.org/10.13140/RG.2.1.4149.2089, 2016.
Noh, N. J., Shannon, J. P., Bolton, N. W., Davis, J. C., Van Grinsven, M. J., Pypker, T. G., Kolka, R. K., and Wagenbrenner, J. W.: Temperature responses of carbon dioxide fluxes from coarse dead wood in a black ash wetland, Wetl Ecol Manag, 27, 157–170, https://doi.org/10.1007/s11273-018-9649-0, 2019.
Oberle, B., Ogle, K., Zanne, A., and Woodall, C.: When a tree falls: Controls on wood decay predict standing dead tree fall and new risks in changing forests, PLoS One, 13, e0196712, https://doi.org/10.1371/journal.pone.0196712, 2018.
Olajuyigbe, S., Tobin, B., and Nieuwenhuis, M.: Temperature and moisture effects on respiration rate of decomposing logs in a Sitka spruce plantation in Ireland, Forestry: An International Journal of Forest Research, 85, 485–496, https://doi.org/10.1093/forestry/CPS045, 2012.
Onega, T. L. and Eickmeier, W. G.: Woody Detritus Inputs and Decomposition Kinetics in a Southern Temperate Deciduous Forest, Bulletin of the Torrey Botanical Club, 118, 52–57, https://doi.org/10.2307/2996975, 1991.
Pangala, S. R., Moore, S., Hornibrook, E. R. C., and Gauci, V.: Trees are major conduits for methane egress from tropical forested wetlands, New Phytologist, 197, 524–531, https://doi.org/10.1111/nph.12031, 2013.
Pangala, S. R., Hornibrook, E. R. C., Gowing, D. J., and Gauci, V.: The contribution of trees to ecosystem methane emissions in a temperate forested wetland, Glob. Chang. Biol., 21, 2642–2654, https://doi.org/10.1111/gcb.12891, 2015.
Perreault, L., Forrester, J. A., Mladenoff, D. J., and Gower, S. T.: Linking deadwood and soil GHG fluxes in a second growth north temperate deciduous forest (Upper Midwest USA), Biogeochemistry, 156, 177–194, https://doi.org/10.1007/s10533-021-00839-y, 2021.
Posit Team: RStudio: Integrated Development Environment for R, https://posit.co/ (last access: 1 November 2025), 2024.
Progar, R. A., Schowalter, T. D., Freitag, C. M., and Morrell, J. J.: Respiration from coarse woody debris as affected by moisture and saprotroph functional diversity in Western Oregon, Oecologia, 124, 426–431, https://doi.org/10.1007/PL00008868, 2000.
R Core Team: R: A language and environment for statistical computing, https://www.r-project.org/ (last access: 1 November 2025), 2024.
Renninger, H. J., Carlo, N., Clark, K. L., and Schäfer, K. V. R.: Modeling respiration from snags and coarse woody debris before and after an invasive gypsy moth disturbance, J. Geophys. Res. Biogeosci., 119, 630–644, https://doi.org/10.1002/2013JG002542, 2014.
Russell, M. B., Fraver, S., Aakala, T., Gove, J. H., Woodall, C. W., D'Amato, A. W., and Ducey, M. J.: Quantifying carbon stores and decomposition in dead wood: A review, For. Ecol. Manage., 350, 107–128, https://doi.org/10.1016/j.foreco.2015.04.033, 2015.
Schlüter, S., Lucas, M., Grosz, B., Ippisch, O., Zawallich, J., He, H., Dechow, R., Kraus, D., Blagodatsky, S., Senbayram, M., Kravchenko, A., Vogel, H.-J., and Well, R.: The anaerobic soil volume as a controlling factor of denitrification: a review, Biol. Fertil. Soils, 61, 343–365, https://doi.org/10.1007/s00374-024-01819-8, 2025.
Seidl, R., Thom, D., Kautz, M., Martin-Benito, D., Peltoniemi, M., Vacchiano, G., Wild, J., Ascoli, D., Petr, M., Honkaniemi, J., and Lexer, M. J.: Forest disturbances under climate change, Nature Climate Change, 7, 395–402, https://doi.org/10.1038/nclimate3303, 2017.
Sollins, P.: Input and decay of coarse woody debris in coniferous stands in western Oregon and Washington, Canadian Journal of Forest Research, 12, 18–28, https://doi.org/10.1139/x82-003, 1982.
Center for Research on Sustainable Forests: Spruce Budworm Task Force 2023 Update, University of Maine, https://www.sprucebudwormmaine.org/resources/maine-spruce-budworm-task-force-report/ (last access: 1 November 2025), 2023.
Terazawa, K., Tokida, T., Sakata, T., Yamada, K., and Ishizuka, S.: Seasonal and weather-related controls on methane emissions from the stems of mature trees in a cool-temperate forested wetland, Biogeochemistry, 156, 1–20, https://doi.org/10.1007/s10533-021-00841-4, 2021.
von Fischer, J. C. and Hedin, L. O.: Controls on soil methane fluxes: Tests of biophysical mechanisms using stable isotope tracers, Global Biogeochem. Cycles, 21, GB2007, https://doi.org/10.1029/2006GB002687, 2007.
Warner, D. L., Villarreal, S., McWilliams, K., Inamdar, S., and Vargas, R.: Carbon Dioxide and Methane Fluxes From Tree Stems, Coarse Woody Debris, and Soils in an Upland Temperate Forest, Ecosystems, 20, 1205–1216, https://doi.org/10.1007/s10021-016-0106-8, 2017.
Woodall, C. W., Russell, M. B., Walters, B. F., D'Amato, A. W., Fraver, S., and Domke, G. M.: Net carbon flux of dead wood in forests of the Eastern US, Oecologia, 177, 861–874, https://doi.org/10.1007/s00442-014-3171-8, 2015.
Yatskov, M. A., Harmon, M. E., Fasth, B., Sexton, J., Hoyman, T. L., and Dudoit, C. M.: Decomposition differences between snags and logs in forests of Kenai Peninsula, Alaska, Canadian Journal of Forest Research, 52, 727–742, https://doi.org/10.1139/cjfr-2021-0208, 2022.
Yong, Z.-J., Lin, W.-J., Lin, C.-W., and Lin, H.-J.: Tidal influence on carbon dioxide and methane fluxes from tree stems and soils in mangrove forests, Biogeosciences, 21, 5247–5260, https://doi.org/10.5194/bg-21-5247-2024, 2024.