the Creative Commons Attribution 4.0 License.
the Creative Commons Attribution 4.0 License.
 | 09 Dec 2025
Using explainable AI to diagnose the representation of environmental drivers in process-based soil organic carbon models
Lingfei Wang
Gab Abramowitz
Ying-Ping Wang
Andy Pitman
Philippe Ciais
Daniel S. Goll
The accuracy of soil organic carbon (SOC) models and their ability to capture the relationship between SOC and environmental variables are critical for reducing uncertainties in future projection of soil carbon balance. In this study, we evaluate the performance of two state-of-the-art process-based SOC models, the vertically resolved MIcrobial-MIneral Carbon Stabilisation (MIMICS) and the Microbial Explicit Soil Carbon (MES-C) model, against a machine learning (ML) approach on predicting global SOC content. By applying multiple interpretable ML methods, we find that the poor performance of the two process-based models is associated both with the missing of key variables, and the underrepresentation of the role of existing variables such as net primary production (NPP). Soil cation exchange capacity (CEC) is identified as an important predictor missing from process-based models, and soil texture is given more importance in models than indicated by ML results. Although the overall relationships between SOC and individual predictors are reasonably captured, the varying sensitivity across entire predictor range is not replicated by process-based models, most notably for NPP. Observations exhibit a nonlinear relationship between NPP and SOC while models show a monotonic positive trend. Additionally, MES-C largely diminishes interacting effects of variable pairs, whereas MIMICS produces mismatches relating to the interactions between NPP and both soil temperature and moisture. Process-based models also fail to reproduce the interactions among soil moisture, soil texture, and soil pH, hindering our understanding on SOC stabilisation and destabilisation processes. Our study highlights the importance in improving the representation of environmental variables in process-based models to achieve a more accurate projection of SOC under future climate conditions.
- Article
(5805 KB) - Full-text XML
-
Supplement
(1414 KB) - BibTeX
- EndNote


Soil is the largest terrestrial carbon pool storing more organic carbon than plant and atmosphere combined (Jackson et al., 2017). It can act as either a carbon sink or source depending on the balance between carbon inputs in the forms of plant litter and root exudates, and outputs through soil respiration and leaching (Terrer et al., 2021). As a key component of global carbon cycle, soil organic carbon (SOC) plays an important role in climate change mitigation. Various land management strategies have been implemented to reduce SOC loss and enhance SOC sequestration as a means of partially mitigating climate warming (Paustian et al., 2016; Rumpel et al., 2018). However, evaluating the effectiveness of these strategies relies on accurately estimating current SOC content and its spatial distribution to provide a baseline for assessing future changes. Despite significant progress, achieving such reliable and spatially consistent estimates of global SOC remains a challenge (Todd-Brown et al., 2014; Tian et al., 2015).
Process-based models are critical tools for predicting contemporary global SOC stocks and quantifying their responses to climate change (Todd-Brown et al., 2013; Viscarra Rossel et al., 2024). However, improving modelling the SOC in Earth System Models (ESMs) has been slow over the last decade largely due to persistent uncertainties in the structure and parameterisation of SOC submodules (Varney et al., 2024), hindering our undertanding of SOC dynamics at global scale. Conventional SOC models such Century (Parton et al., 1987) and RothC (Jenkinson and Rayner, 1977) represent SOC decomposition as a first-order process wherein carbon loss and CO2 production are directly proportional to the pool size, and decomposition rate is modified mainly by soil temperature and water content, but independent of soil microbial biomass. Emerging theories demonstrate the importance of soil microbes on SOC stabilisation. Microbial organisms are central in SOC decomposition and microbial products are themselves an important source of stabilised SOC (Schmidt et al., 2011; Liang et al., 2017). Therefore, numerous SOC models with explicit representation of microbial activities have been developed aiming to improve the predictability of SOC and reduce uncertainties in the projection of the carbon-climate change feedback (Wieder et al., 2014; Abramoff et al., 2022; Chandel et al., 2023). The ability of microbial explicit models to better represent the mechanisms of SOC dynamics remains debated. For instance, Zhang et al. (2020) found that a microbial explicit model outperformed conventional models in predicting equilibrium forest SOC concentration on continental scale. However, Zhou et al. (2021) showed that the shift from conventional models to microbial explicit models do not substantially improve the accuracy in simulating the responses of soil heterotrophic respiration, a key component of SOC dynamics, to soil rewetting. Additionally, microbial explicit models introduced greater uncertainty to climate change projections compared with conventional models due partly to the complex model structure (Shi et al., 2018). Nevertheless, microbial explicit SOC models have the potential to increase our confidence in projecting SOC feedback on climate change because they explicitly represent microbial processes that are known to influence SOC cycling. However, it remains important to rigorously evaluate and reduce their uncertainties before incorporating them into large-scale modelling frameworks.
Uncertainties of microbial-explicit models arise from different sources. One major contributor is the poorly constrained parameter values (Xu et al., 2018; Pierson et al., 2022). Besides, gaps in theoretical understanding are reflected in uncertain model structures, e.g., the selection of key variables and representation of SOC decomposition and formation processes (Bradford et al., 2016; Luo et al., 2016). SOC turnover is a complex process regulated by many factors. Climate is generally considered the dominant control on sparial SOC variation at the global scale, but the role of soil properties has also been highlighted, particularly for deeper soil layers (Luo et al., 2021; Wei et al., 2024). Temperature is the most widely incorporated climate variable in microbial explicit SOC models, as it strongly influences decomposition processes, followed by soil moisture (Wang et al., 2013; Wieder et al., 2015; Abramoff et al., 2022). Soil properties, particularly clay and silt content, is only considered by some models for simulating adsorption and desorption processes (Abramoff et al., 2022; Laub et al., 2024). It is impractical to incorporate all possible factors into the process-based models, and it is still a challenge to determine which are essential for accurately simulating SOC dynamics and which can be reasonably excluded without compromising model reliability.
The effects of specific variables on SOC dynamics are complex and often interact in complex ways. For example, higher temperature stimulates soil microbial activities, which in turn accelerates SOC decomposition (Karhu et al., 2014; García-Palacios et al., 2021). Simultaneously, increasing temperature enhances plant growth leading to more carbon inputs to the soil from NPP, and the addition of fresh carbon may trigger either positive or negative priming effects to accelerate or depress microbial activities and then influence SOC mineralisation (Perveen et al., 2019; Bernard et al., 2022). Soil moisture also plays a dual role in SOC dynamics. Both excessive and insufficient soil moisture may reduce SOC decomposition by limiting oxygen availability to soil microorganisms or reducing diffusion ability of soluble SOC substrates and extracellular enzymes, respectively (Davidson and Janssens, 2006). Furthermore, the impact of a given variable on SOC can be altered by the inclusion of additional factors. For instance, when precipitation patterns remain steady, warming causes significant carbon losses from soil, however, the negative effect of warming will be offset, for example, if precipitation is reduced and severe drought occurs (Schindlbacher et al., 2012). Different models represent these dependencies in varying ways (Chandel et al., 2023). It remains unclear whether the relationships between individual predictors and SOC, as well as the combined effects of multiple factors, are accurately captured by these models.
Machine learning models are data-driven modelling approaches that capture nonlinear relationships and complex interactions between multiple predictors and target variable (Ryo and Rillig, 2017). A wide range of machine learning algorithms have been applied to SOC predictions, outperforming process-based models in terms of prediction accuracy. For instance, Wang et al. (2024) trained both a random forest model and the process-based MIcrobial-MIneral Carbon Stabilization (MIMICS) model using around 1000 SOC observations in Australia, and found that the random forest performed better in explaining spatial SOC variations with greater R2 and lower root mean square error (RMSE). Despite superior predictive accuracy, machine learning models are often criticised due to their lack of transparency and limited interpretability, earning them the label of a “black box”. To address this issue, explainable artificial intelligence (XAI) methods have been developed to build trust in machine learning models by more transparently mapping the relationship between inputs and outputs (O'Loughlin et al., 2025). Wadoux and Molnar (2022) applied various XAI methods in a case study mapping topsoil organic carbon in France, revealing how complex models can be interpreted by analysing predictor importance, their interactions, and the functional relationships between environmental covariates and SOC. XAI techniques can also be applied to diagnose process-based models by evaluating whether the representation of predictors in the models aligns with observations. Georgiou et al. (2021), for example, used machine learning models to predict the global SOC derived from observed profiles, observationally derived products (e.g., Harmonised World Soil Database, HWSD), and an ensemble of soil biogeochemical models, and disentangled the role of covariates in predicting different sources of SOC using XAI methods such as feature importance and partial dependence plots. They found that there was a mismatch between observations and models in the emergent role of environmental controls in explaining SOC variability with models overemphasizing the importance of temperature and primary productivity. However, their study didn't examine predictor interactions, and while the analysis of SOC profiles was conducted at site-level, model-derived SOC were produced at a resolution of 1.9° × 2.5°, resulting in a lack of site-to-site correspondence and limiting the reliability of fine-scale interpretations.
Evaluating the representation of environmental variables in process-based models is pivotal for enhancing our understanding on SOC dynamics and guiding future model development. In this study, we compile global SOC profile data along with relevant environmental covariates to address three key questions: (1) How much spatial SOC variation can be explained by process-based models compare to that of machine learning approaches? (2) Are there key environmental drivers missing from process-based models? (3) Are the effects of existing individual variables and their interactions on SOC accurately captured by process-based models?
2.1 Model description
Since our study focuses on applying XAI methods to diagnose potential weaknesses in process-based models, rather than on model development, detailed descriptions of the process-based models, including their underlying philosophy, equations, parameterizations and technical implementation are provided as Supplement. A brief overview of the key structures and assumptions is summarized below.
2.1.1 Vertically resolved MIcrobial-MIneral Carbon Stabilisation (MIMICS) model
MIMICS (Fig. 1a) contains two litter pools, metabolic (LITm) and structural (LITs) litter, and the partitioning of litter input into metabolic and structural pools is determined by litter quality. Litter and SOC turnover are governed by two microbial functional types, r-selected (MICr) and K-selected (MICk) microbes. SOC is divided into three pools: physically protected (SOCp), chemically protected (SOCc) and available (SOCa) carbon. The decomposition of litter pools and SOC pools follows forward Michaelis–Menten (FMM) kinetics where the maximum reaction velocity (Vmax) and the half saturation constant (Km) determine the rate of microbial decomposition. Microbial growth efficiency (MGE) determines the partitioning of carbon fluxes entering microbial biomass pools vs. heterotrophic respiration. Access of microbial enzymes to available substrates depends on the soil texture. Detailed description and equations of MIMICS can be found at Wieder et al. (2015), except that density-dependent microbial turnover is introduced to minimise an unrealistic oscillation (Zhang et al., 2020). Additionally, a soil moisture scalar K(θψ) (see Supplement) is introduced to the model to consider the effect of soil moisture on SOC turnover. Vertical transport via bioturbation and diffusion was introduced to MIMICS allowing for simulation of SOC at depths (Wang et al., 2021).
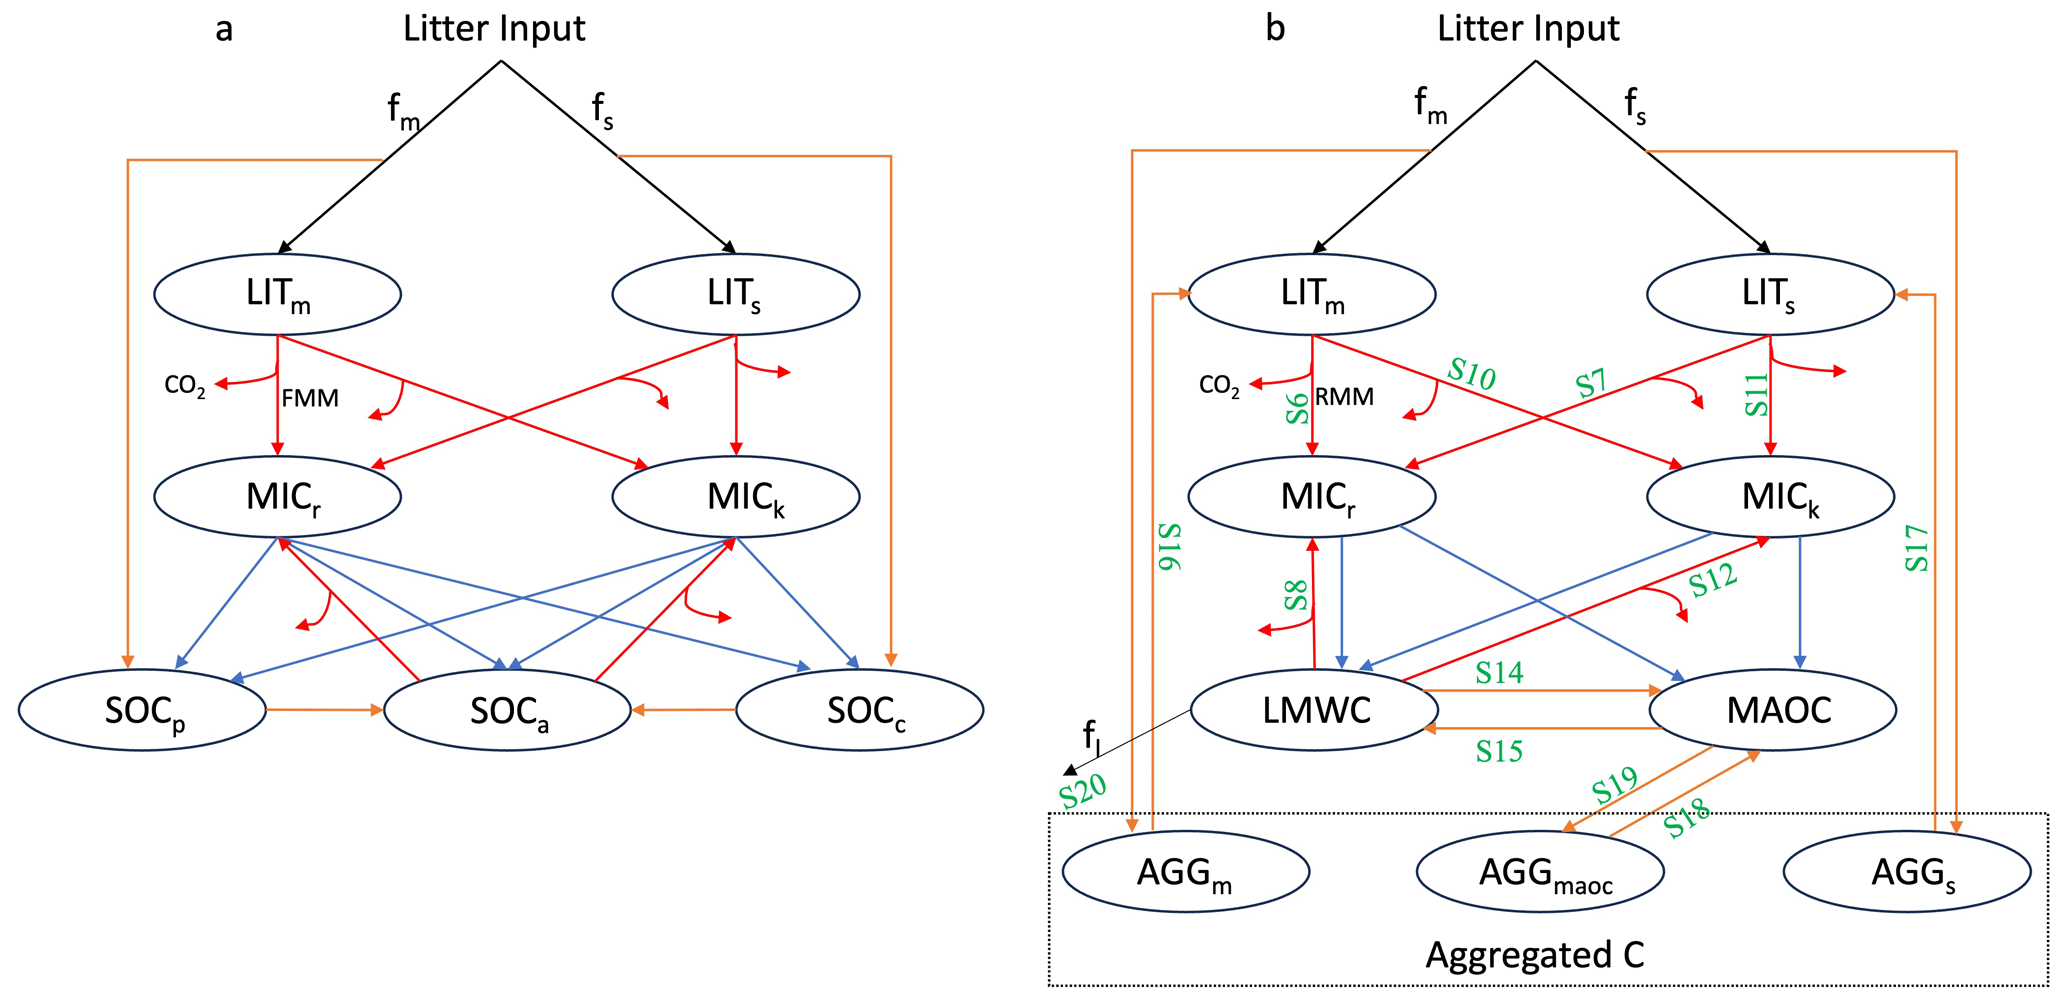
Figure 1SOC pools and fluxes represented in (a) MIMICS and (b) MES-C. Black lines represent carbon getting into and out of the soil system via litter input and leaching (fl) process. Litter inputs are partitioned into metabolic and structural litter pools (LITm and LITs, respectively) based on litter quality (fm and fs). Red lines represent decomposition of litter and SOC via two functional types of microbes (MICr and MICk) governed by forward Michaelis-Menten (FMM) and reversed Michaelis-Menten (RMM) kinetics in MIMICS and MES-C, respectively. Partitioning of C fluxes entering microbial biomass pools and heterotrophic respiration is determined by microbial growth efficiency. Blue lines represent the turnover of microbial biomass, which is partitioned into available, physically protected and chemically recalcitrant SOC pools (SOCa, SOCp and SOCc, respectively) in MIMICS, and into light molecule weight carbon (LMWC) pool and mineral associated carbon (MAOC) pool in MES-C. Orange lines represent the protection/unprotection of SOC. In MES-C, SOC protection is explicitly represented in the form of MAOC, and aggregated C including aggregated metabolic C, aggregated structural C and aggregated mineral associated C (AGGm, AGGs and AGGmaoc, respectively). Green labels in panel (b) correspond to the equations for fluxes described in Supplement.
2.1.2 Vertically resolved Microbial Explicit Soil Carbon (MES-C) model
Emerging theories highlight SOC stabilisation in the form of aggregated and mineral associated C, which are thought more stable because of less accessibility to soil microbes. MIMICS has conceptual SOC pools but does not explicitly represent the aggregation and mineral-association processes, nor does it consider the finite capacity of soils to store SOC (Georgiou et al., 2022). Therefore, we introduce MES-C (Fig. 1b) here to integrate these important SOC stabilisation theories. MES-C has two litter pools, and the decomposition of litter and SOC are governed by two functional types of microbes, which are the same as in MIMICS. SOC is divided into three parts: light molecule weight carbon (LMWC), mineral associated organic carbon (MAOC) and aggregated organic carbon, where aggregated carbon includes three fractions: aggregated metabolic carbon (AGGm), aggregated structural carbon (AGGs) and aggregated mineral associated carbon (AGGmaoc) (Laub et al., 2024). Decomposition of litter pools is similar to that in MIMICS but follows reversed Michaelis-Menten (RMM) kinetics. Protection of organic carbon in the form of MAOC is via adsorption process regulated by soil acidity, soil moisture, and maximum adsorption capacity relating to soil texture. Desorbed MAOC can either become available for microbial enzymes or be protected within soil aggregates. Vertical transport of SOC is same as that in MIMICS and has been described by Wang et al. (2021). More details and equations of MES-C can be found in the Supplement.
2.1.3 Random Forest
Random forest (RF) is a tree-based ensemble machine learning algorithm that builds multiple decision trees during training and average their outputs to make predictions for regression tasks (Breiman, 2001). Each tree is trained on a random subset of data, and a random subset of predictors is considered at each split. This approach reduces overfitting and enhances the model's ability to be generalised. It also allows for robust error estimation based on the use of out-of-bag (OOB) data (the observations excluded from the training sample). RF is particularly well-suited for explainable machine learning techniques due to its interpretable architecture (Jennath and Asharaf, 2025), enabling a comprehensive understanding of predictors' influence and interactions on model outputs.
Two random forest models, one trained using a broad set of environmental predictors (Table 1) (RFenv), and one trained only using the inputs for MES-C (RFinp) as predictors, are used in this study. RFenv helps assess if there are important predictors missing from process-based models. RFinp enables a direct comparison between machine learning and process-based models with the same set of predictors and helps evaluate whether the representation of predictors in process-based models is consistent with observations.
2.2 Data
2.2.1 Predictors
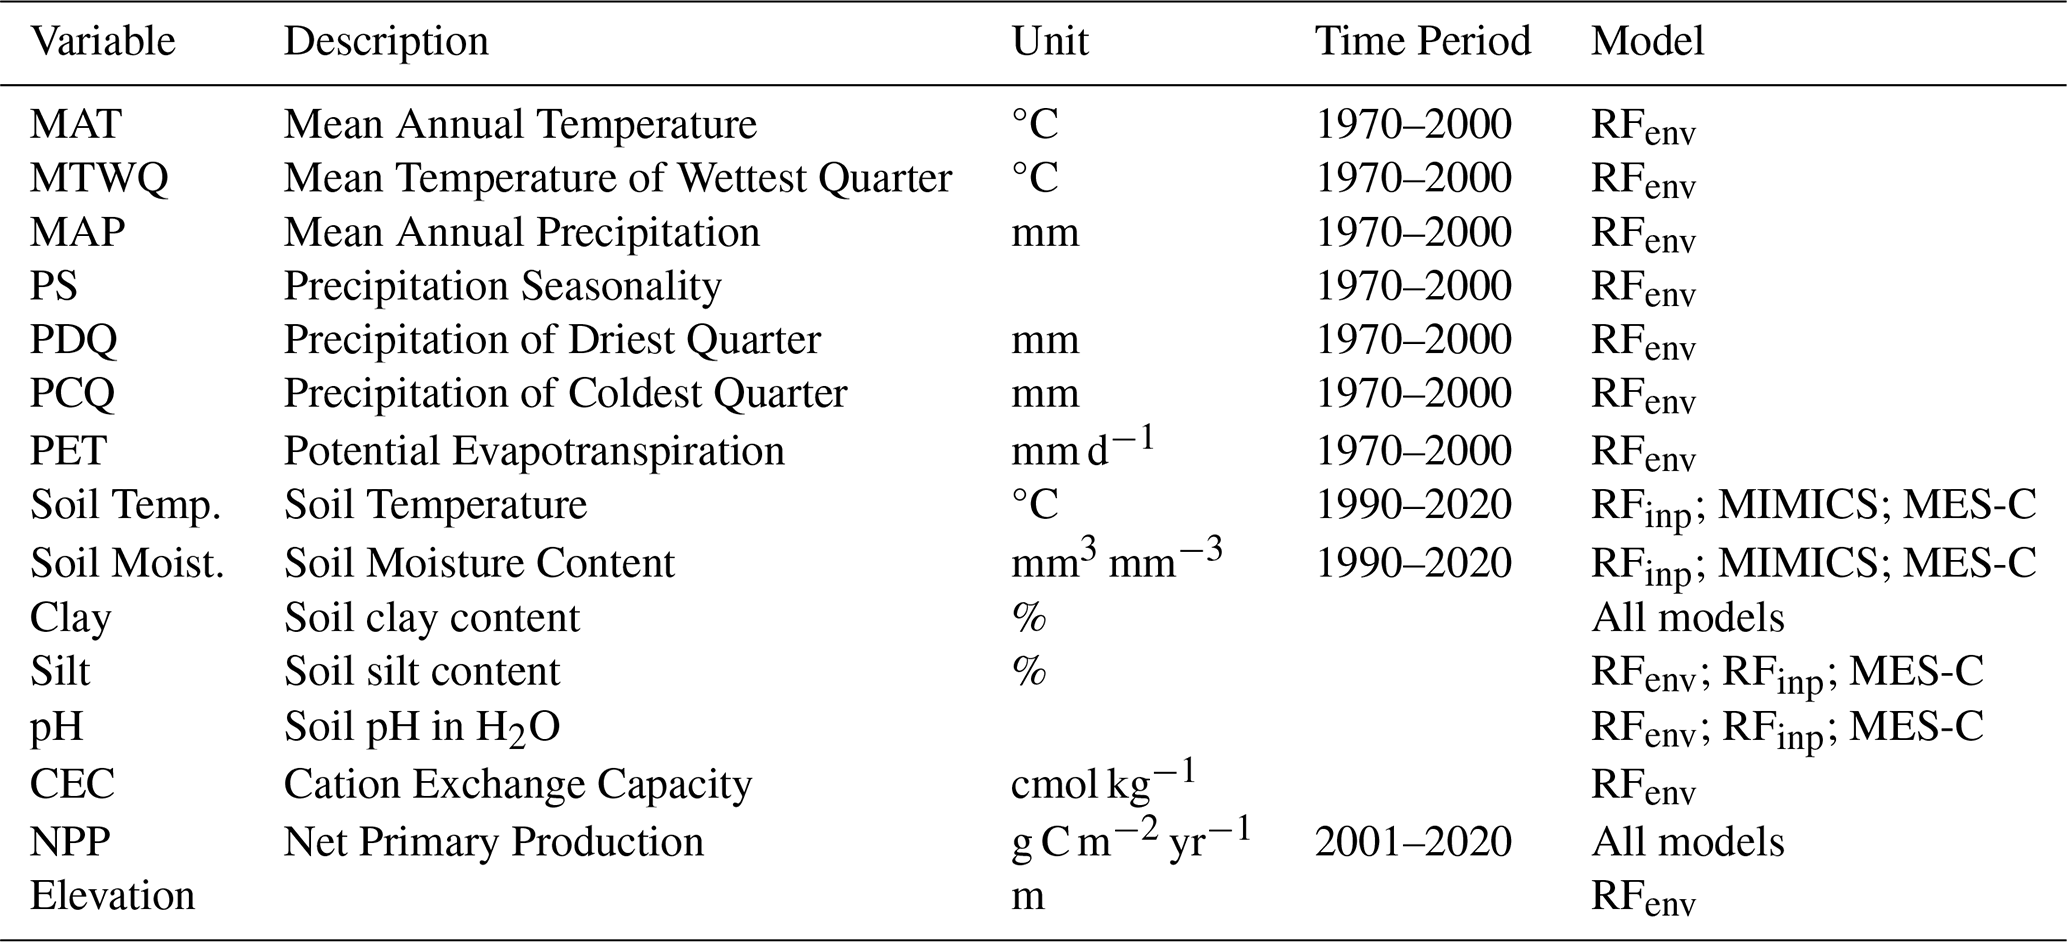
MIMICS requires soil temperature, soil moisture, carbon input and soil clay content as inputs, while MES-C additionally requires soil silt content and soil pH. Carbon input is represented by net primary production (NPP) in this study. Predictors used for the random forest models were collected from four categories, including climate, soil properties, terrain and vegetation, which have previously been found to be important for SOC prediction (McBratney et al., 2003). After checking for collinearity and correlation, 13 predictors were used (Table 1).
NPP was extracted from MODIS (MOD17A3HGF V6.1) (Running and Zhao, 2021), and the above/belowground components was estimated using the ratio of aboveground to belowground biomass carbon density from gridded global maps (Spawn et al., 2020). Fraction of belowground NPP allocated to different soil layers follows a negative exponential function (Wang et al., 2021). (Bio)climatic variables were sourced from WorldClim 2 (Fick and Hijmans, 2017). Evapotranspiration was from the Global Aridity Index and Potential Evapotranspiration Database: Version 3 (Zomer et al., 2022). Elevation was the same as used to produce WorldClim 2 data, downloaded from the WorldClim 2 website (https://www.worldclim.org/data/worldclim21.html, last access: 7 March 2025). Soil properties (e.g., pH, clay and silt content) were extracted from SoilGrids 2.0 (Poggio et al., 2021) where each property is modelled independently using environmental covariates. Soil properties were reported for multiple soil layers, and we harmonised them to every 30 cm interval using thickness weighted averages. Soil temperature and moisture were extracted from ERA5-Land (Muñoz-Sabater et al., 2021) and were harmonised to every 30 cm interval using thickness weighted averages. SOC was assumed to be at steady state in this study, and we used the mean annual value of time-series predictors to represent the average environmental conditions. All data were resampled to ∼1 km resolution using bilinear interpolation and extracted using longitude and latitude of observed SOC profiles. If the extraction returned a non-numeric value, it was replaced by the average of the adjacent eight grid cells. Profiles were excluded if no valid value was obtained after this adjustment.
All environmental variables along with units and time period used for both process-based models and random forest models are listed in Table 1.
Table 1Variables used for random forest and process-based models.
2.2.2 SOC observations
SOC profile data were obtained from WoSIS (snapshot 2019) (Batjes et al., 2020). Profiles sampled from unvegetated regions were removed based on MODIS global International Geosphere-Biosphere Programme (IGBP) map (MCD12Q1.061, https://doi.org/10.5067/MODIS/MCD12Q1.061, Friedl and Sulla-Menashe, 2022). We selected profiles with SOC less than 120 g C kg−1 soil (Cotrufo et al., 2019) to restrict our study on mineral soils which consist primarily of mineral particles such as clay, silt and sand. To better represent SOC at depths, we selected profiles with at least two observed layers. Based on data availability, SOC values were harmonized at 30 cm intervals up to a maximum depth of 1.5 m using a spline function from ithir package in R (Malone et al., 2017). To maintain consistency with the resolution of predictors, profiles were resampled to ∼1 km by averaging those located within the same 1 km × 1 km grid cell. SOC typically decreases with depth, and profiles showing increasing SOC with depth were excluded by fitting the vertical SOC data to the following equation (Jobbágy and Jackson, 2000) and removing those with slope (k) greater than 1,
Where Y (kg m−2) is cumulative SOC stocks, d (m) is soil depth, and k and I are fitted slope and intercept parameters, respectively. Here SOC stocks are estimated using soil bulk density (BD, kg m−3) and sampling depth (d, m), following the equation below,
Where BD is extracted from SoilGrids2.0 for the corresponding depth if not provided in WoSIS. SOC profiles with mean annual soil temperature below 0 °C were excluded because neither process-based model represents frozen soils. Profiles with missing predictor values (Table 1) were also excluded. This process resulted in a final dataset of 37 691 profiles, and their spatial distribution is shown in Fig. 2a. SOC profiles are unevenly distributed with most of them coming from the Northern Hemisphere. SOC at 0–30 and 30–60 cm was reported for all profiles, while SOC for deeper layers was available for fewer profiles (Fig. 2b). SOC distribution at all layers is positively skewed, and SOC at top 30 cm is significantly greater than deeper layers with a mean value at 16.59 g C kg−1 soil.
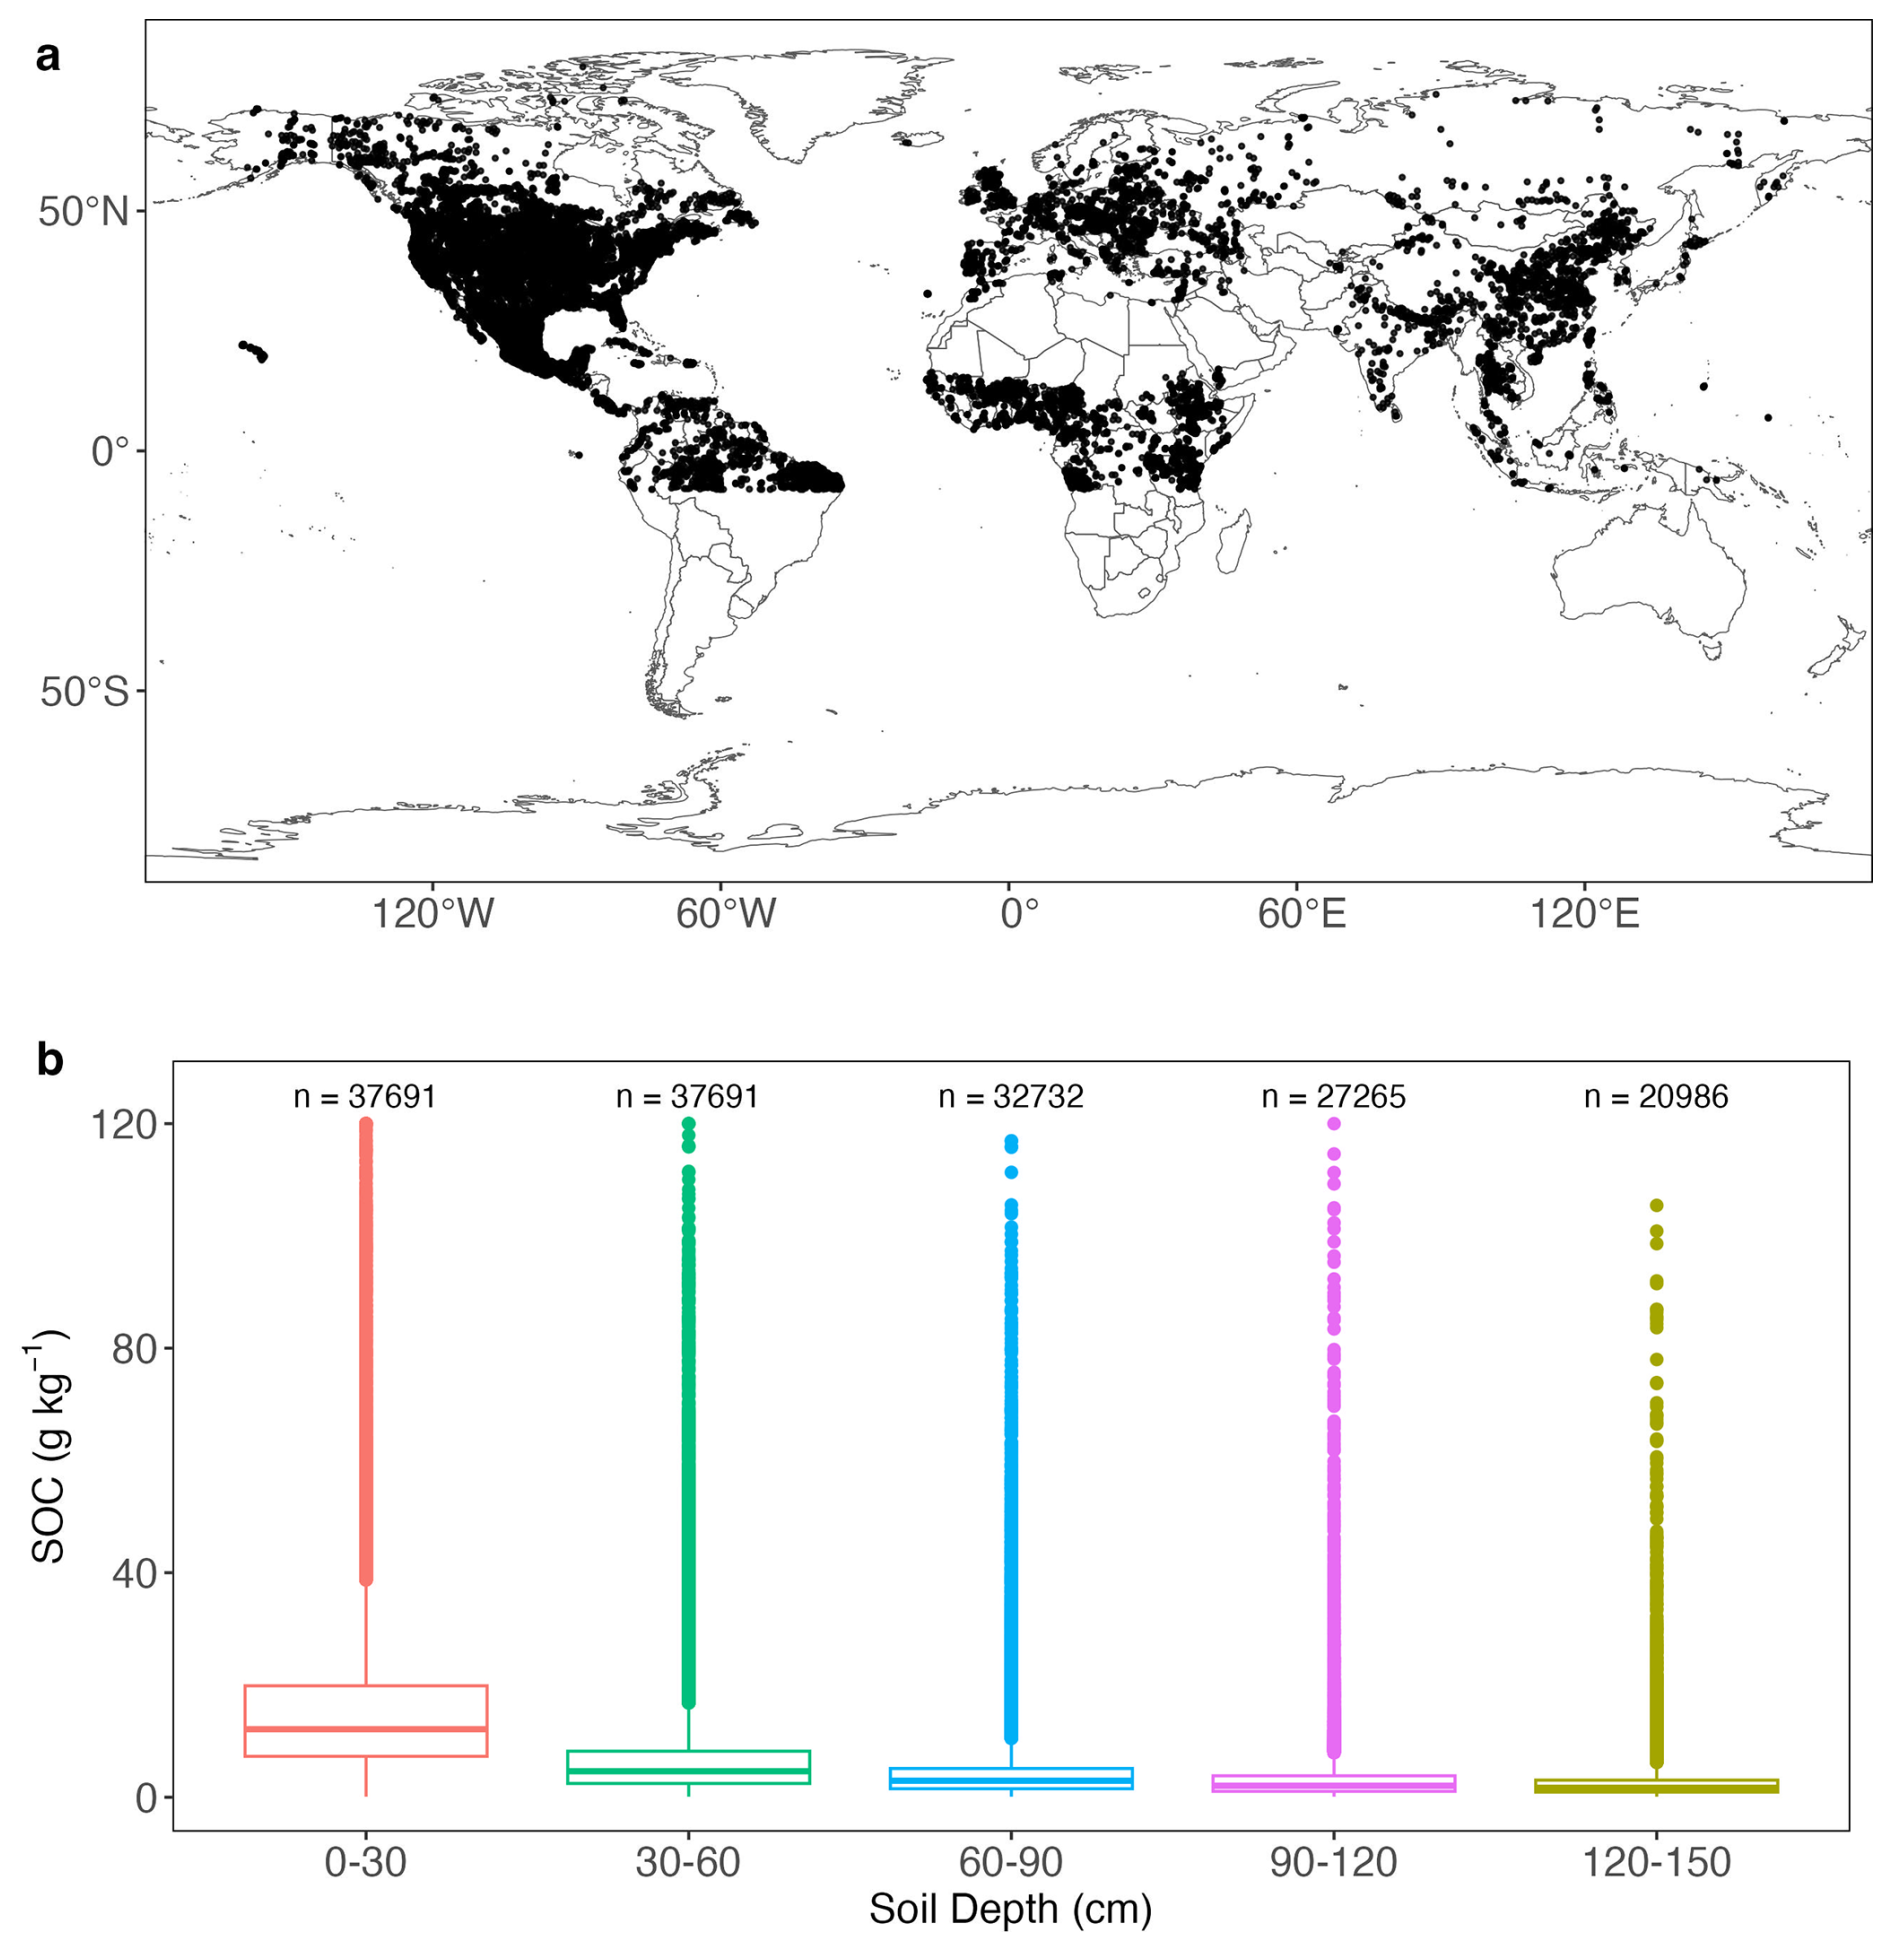
Figure 2(a) Spatial distribution of 37 691 SOC profiles used in this study; (b) box plots of SOC at depths. For box plots, centre lines represent the median value, upper and lower box boundaries represent the respective third and first quartiles, and the whiskers extend to the smallest and largest values within 1.5 times the interquartile range.
2.3 Model simulation and parameter optimization
Both the vertically resolved MIMICS and MES-C models are run at an hourly timestep. Simulations of SOC dynamics are performed in 10 cm depth increments to 1.5 m, and model outputs are averaged every 30 cm for comparison with observations. We assume that SOC at each site is at equilibrium, and both models are spun up for around 1000 years with equilibrium assumed when the relative change in carbon pool size between two successive spin-up iterations is less than 0.05 %. The simulated SOC in both process-based models is in mg C cm−3 soil, and these values were converted to g C kg−1 soil using BD (see Sect. 2.2.2) for direct comparison with SOC observations in WoSIS.
Most parameters in the process-based model (see Table S1) are either fixed across all sites or directly linked to site-specific properties. However, some key parameters remain uncertain (see Tables S2 and S3) and require calibration to better constrain model behaviour. To optimise parameters for MIMICS and MES-C, SOC profiles were divided into 12 distinct clusters by maximising the similarity of 12 environmental variables (Table 1) within each cluster, using k-means clustering (Hartigan and Wong, 1979). The underlying assumption here was that profiles sharing similar environmental conditions would exhibit a similar SOC content, which was previously proved to be more effective than using plant functional types in aggregating SOC for parameter optimisation (Wang et al., 2024). The number of clusters was determined by minimising the sum of the within-cluster sum of squares of all clusters (WCSSE), a process facilitated by the “ClusterR” package in R (Version 4.2.0). Six parameters directly control SOC decomposition rates are optimised in MIMICS (Table S2). To reduce the effect of parameter numbers on model performance comparison, we did parameter sensitivity analysis (see Table S6 and Fig. S2) and finally selected six out of fourteen relatively sensitive parameters to optimise in MES-C (Table S3). An effective global optimisation algorithm called the shuffled complex evolution (SCE-UA, version 2.2) method (Duan et al., 1993) was applied to each cluster for parameter optimisation by minimising the residual sum of squares between the observed and modelled SOC values at depths where SOC observation is reported. The optimised parameter values for MIMICS and MES-C can be found at Tables S4 and S5, respectively.
Two parameters of random forest models, the number of trees and the number of predictors at each node (mtry), were optimized by increasing coefficient of determination (R2). The number of trees for both RFenv and RFinp were set to 500, and mtry was set as default, which is the square root of the number predictors.
2.4 Model evaluation
We randomly selected 80 % of observations (training data) from each cluster (see Sect. 2.3) to train the models while the remaining 20 % of observations (test data) were used for validation. This procedure was repeated 10 times for cross-validation. The performance of models was evaluated at each 30 cm soil interval using root mean square error (RMSE), Lin's Concordance Correlation Coefficient (LCCC) (Lawrence and Lin, 1989) and Coefficient of determination (R2). Considering the highly skewed spatial and vertical distribution of SOC, we applied a natural logarithmic transformation to SOC values prior to calculating these metrics. An RMSE value closer to 0 and a LCCC closer to 1 indicate higher predictive accuracy and better agreement between predicted and observed values, and a R2 value approaching 1 reflects a stronger ability of the model to explain the observed variations in global SOC. Considering the different numbers of predictors used in RF and process-based models, we also used Akaike information criterion (AIC) (Burnham and Anderson, 2002) to compare performance of different models,
where n is the number of profiles, and p is the number of predictors. Models with lower AIC show a better trade-off between fit and complexity.
2.5 Explainable artificial intelligence techniques
The XAI techniques employed in this study are described below. To apply them to diagnose how individual variables and their interactions are represented in process-based models, we first optimised parameters for each cluster (see Sect. 2.3) using all SOC profiles to obtain modelled SOC values. The modelled SOC of MIMICS and MES-C were then used as target variable in separate RF models, each trained on the corresponding model inputs. The XAI techniques were applied to these two RF models as well as RFinp. Comparing the results among these models allowed us to identify key differences in how individual predictors and their combined effects are represented in process-based models versus those inferred by the RF models.
2.5.1 Permutation variable importance
RF-based permutation variable importance (PVI) is employed to assess the contribution of each variable in predicting SOC. PVI measures the decrease in model performance when the values of a specific predictor are randomly shuffled while keeping other predictors unchanged. By disrupting the relationship between the permuted variable and SOC, the prediction accuracy of RF typically declines if the variable is important. The magnitude of RF performance reduction is measured using mean squared error (MSE). PVI was applied to RFenv to identify whether any relatively important variables are missing from process-based models, and to RFinp to assess whether the variable importance reflected in the process-based models is consistent with observations.
2.5.2 SHAP
Shapley Additive exPlanations (SHAP) (Lundberg and Lee, 2017) were used to quantify the contribution of each predictor to the models' prediction. Derived from cooperative game theory, SHAP values fairly allocate the model's prediction among all predictors by considering all possible predictor combinations and their interactions. This approach ensures that each predictor's influence is measured based on its marginal impact. Unlike PVI evaluating a predictor's global importance by measuring the drop in overall model performance when its values are randomly shuffled, SHAP values assess predictor contribution at the individual prediction level. The sum of all SHAP values for a given instance, along with the model's baseline prediction (the average prediction across all SOC sites) equals the predicted SOC value. The absolute SHAP value indicates the strength of a predictor's influence while its sign (positive or negative) shows whether the predictor pushes the prediction higher or lower.
2.5.3 PDP and ICE
Partial dependence plots (PDPs) are used in machine learning to visualise and interpret the relationship between one or more predictors and the target variable while accounting for the average effect of all other predictors in the model. A one-dimensional PDP depicts the marginal effect of a single predictor on SOC, and the partial dependence values are computed by evenly varying the predictor values across its observed range while keeping the other predictors constant and averaging the predicted outcomes over all data instances. In addition to the average effect of a single predictor, individual conditional expectation (ICE) plots (Goldstein et al., 2015) are employed to capture the heterogeneity in the relationship between predictor and SOC by plotting individual curves for each SOC instance. To address overlapping and improve interpretability, we converted ICE plots into density plots allowing for a clearer visualisation of predictor effects while preserving the variability among observations. Two-dimensional PDPs are also employed to investigate interaction effects between pairs of predictors.
3.1 Model evaluation
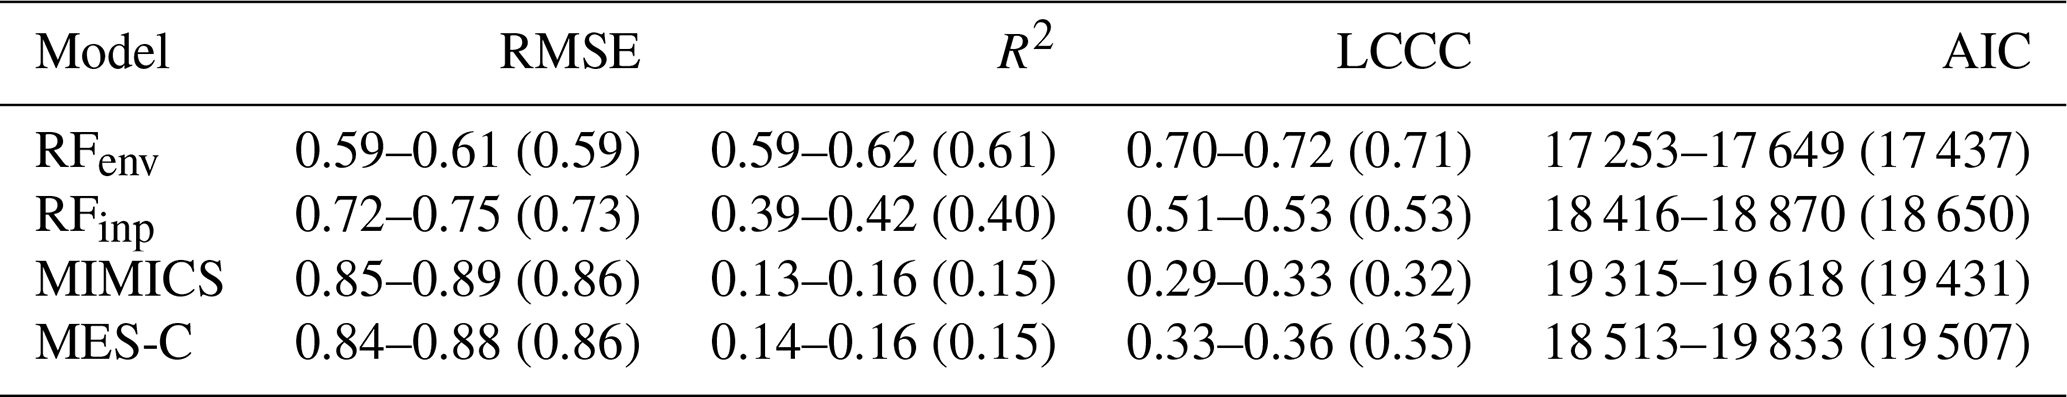
Model performance metrics for SOC prediction in 0–30 cm soils are shown in Table 2, and metrics for deeper soil layers can be found at Table S7. RFenv and RFinp consistently outperform process-based models on test data in predicting global SOC content with lower AIC, RMSE and higher LCCC at all soil layers, along with higher R2 indicating greater explained SOC variations. This advantage is particularly evident in RFenv which incorporates a broad set of environmental predictors. MIMICS and MES-C perform comparably in predicting SOC at 0–30 cm depth, but MES-C shows slightly higher performance in deeper layers with lower RMSE and higher LCCC. Vertically, predictability decreases with depth with the highest accuracy observed in the topsoil, a trend consistent across all models (Table S7). In focusing on the utility of XAI techniques below, we hereafter focus our analysis on the 0–30 cm soil, noting that the same techniques could be similarly applicable for deeper soil layers.
Table 2Minimum and maximum performance metrics of SOC predictions in 0–30 cm soil for test data. Values in brackets are the averages of 10 cross-validation simulations. Unit for depth is cm, and unit for RMSE is log(g C kg−1 soil).
3.2 XAI I – Relative variable importance
Figure 3 illustrates the relative importance of predictors for SOC prediction. In the larger set of 12 predictors (Fig. 3a), observations suggest that MAT is the most influential factor, followed by annual precipitation. Soil CEC also ranks highly, while other soil properties make minimal contributions to observed SOC prediction. Notably, NPP and elevation have relatively lower importance in predicting observed SOC. When predictors are restricted to the process-based models' inputs (Fig. 3b), NPP and soil temperature are the two most important predictors, and this is reflected in the PVI of observations and modelled SOC (Fig. 3b for observations, Fig. 3c for MES-C and Fig. 3d for MIMICS), although the gap of importance between these two predictors is larger for MES-C compared to observations or MIMICS. Soil texture (e.g., clay and silt content) ranks lowest in predicting observed SOC but is given more importance in both process-based models. In contrast, soil pH and soil moisture show lower contributions in process-based models compared to observations.
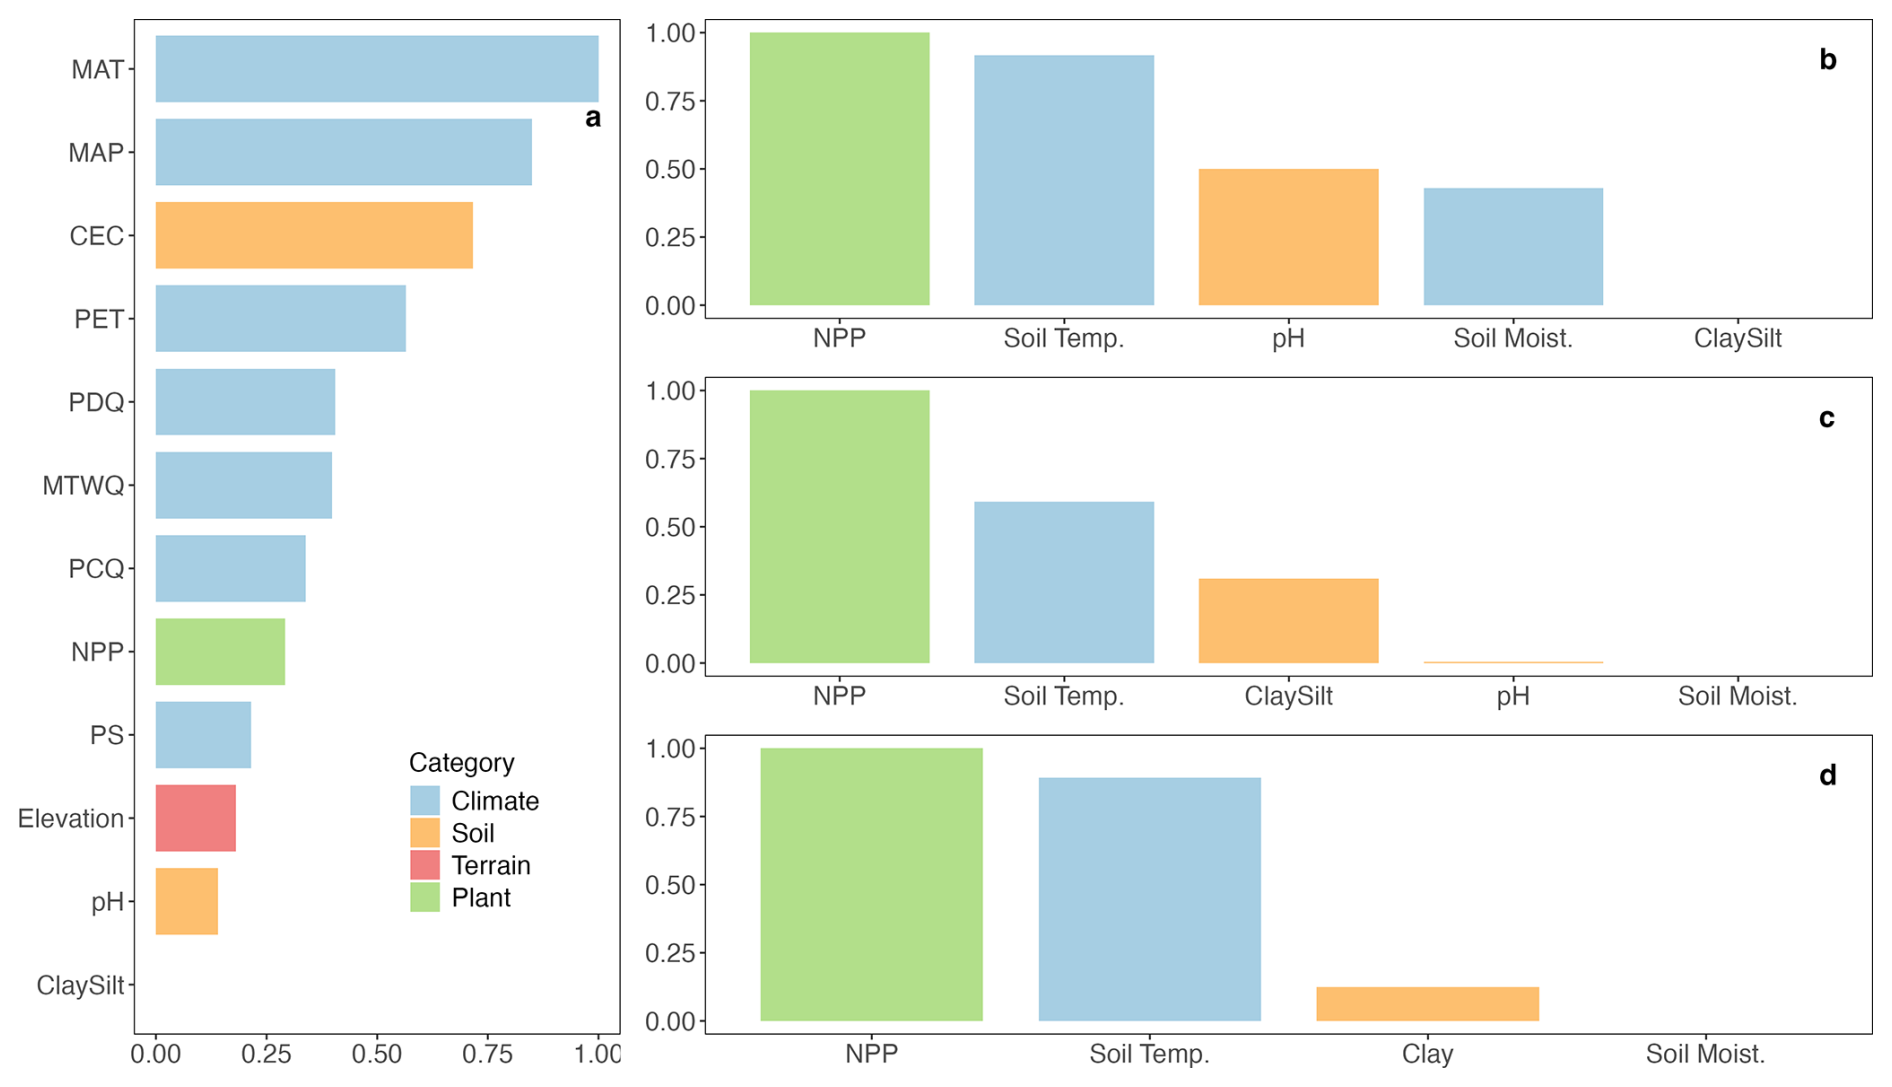
Figure 3Permutation variable importance (PVI) of predictors on SOC. (a) PVI of 12 predictors on observed SOC; (b) PVI of MES-C inputs on observed SOC; (c) PVI of MES-C inputs on SOC modelled by MES-C; (d) PVI of MIMICS inputs on SOC modelled by MIMICS. Definitions of variables can be found in Table 1.
3.3 XAI II – SHAP values
SHAP values quantifying the contributions of inputs of process-based models are shown in Fig. 4. Positive SHAP values mean that the predictor likely pushes predicted SOC higher while negative SHAP values mean that the predictor pushes predictions lower. Each point represents an individual SOC instance, and the vertical jitter helps visualise data density.
Of the inputs of process-based models, soil temperature and NPP are two most important variables for SOC observations as indicated by their greater mean absolute SHAP values (values in brackets in Fig. 4a). Both MIMICS and MES-C capture the negative relationship between soil temperature and SOC, as well as the positive effects of soil clay and silt content on SOC accumulation. The weak relationship between soil moisture and SOC is also reproduced by both process-based models, showing no clear trend in either case.
However, some discrepancies are evident. The magnitude of the relationship between SOC and soil temperature or texture is much stronger in MIMICS and MES-C than in observations, as reflected by their higher R2 values, indicating a more linear relationship. Notably, both MIMICS and MES-C exhibit a strong positive linear relationship between NPP and SOC with R2 greater than 0.8, which is contrary to the lack of clear pattern in observations.
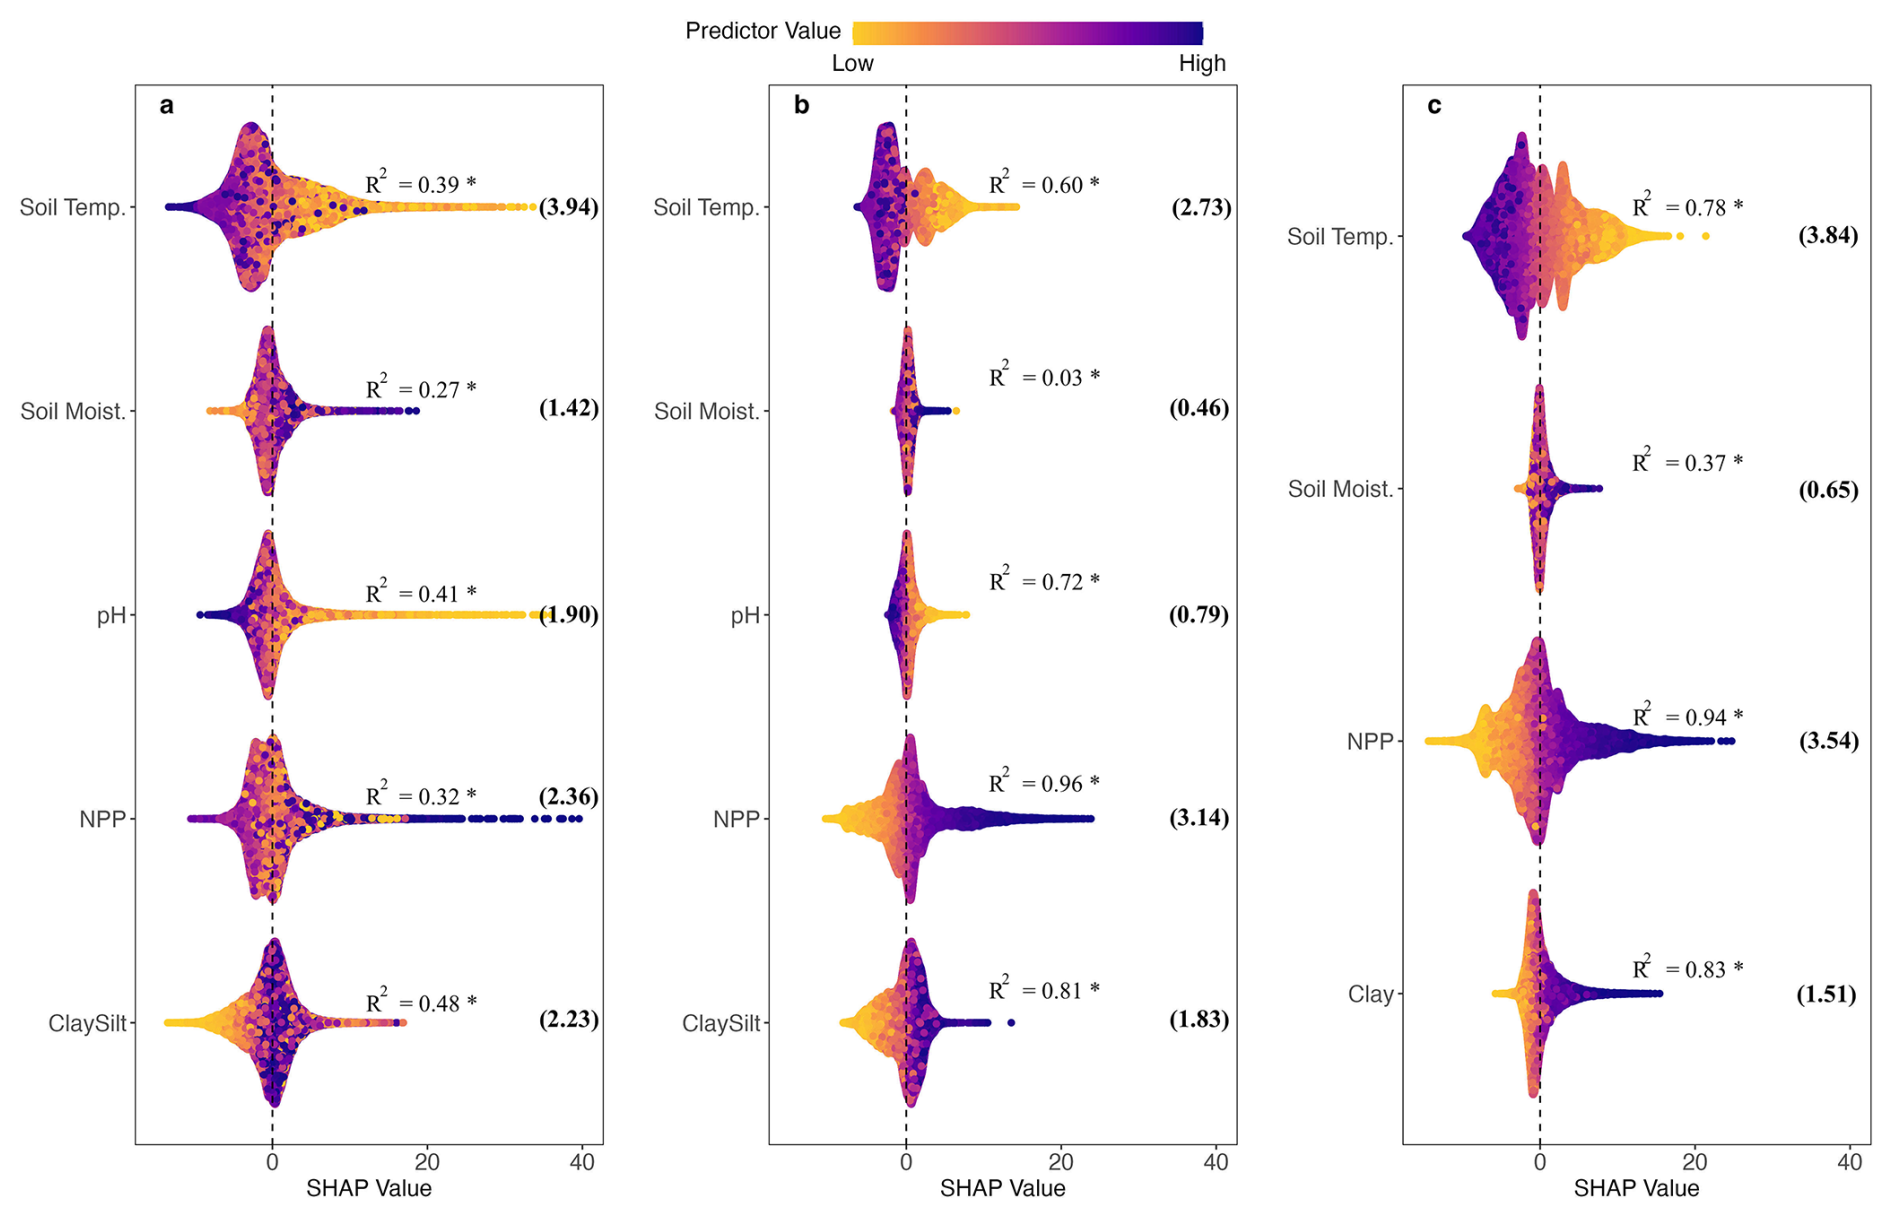
Figure 4SHAP values showing the impacts of predictors on (a) observed SOC; (b) modelled SOC by MES-C; (c) modelled SOC by MIMICS. The jitter along vertical axis is used to reduce point overlap and visualise data density. The vertical dashed line represents SHAP values at 0. Numbers in brackets are mean absolute SHAP values for each predictor. The R2 values from linear regressions between SHAP values and predictor values are also shown with * indicating statistical significance at the 0.05 confidence level. Full names of predictors can be found in Table 1.
3.4 XAI III – ICE plots
ICE plots illustrate the partial dependence of each SOC instance on each single predictor which is incorporated into process-based models. To enhance visualisation, ICE plots are converted into heatmaps with the colours showing the density of curves passing through each grid cell (Fig. 5). Mean partial dependence values across all instances are also shown in Fig. 5 (purple lines).
When focusing on mean partial dependence, the relationship between observed SOC and soil texture (clay and silt content) is generally captured by both process-based models (Fig. 5d, i, n). The relationship between observed SOC and soil moisture is captured by both models at lower moisture levels, but they fail to reproduce the degree of the increasing trend of SOC at higher moisture levels (Fig. 5b, g, l). While both observed and modelled SOC are relatively stable when mean annual soil temperature is at higher end (above 15 °C), there is a sharp decrease of observed SOC when soil temperature is between 0 to 5 °C, which is not well captured by both process-based models (Fig. 5a, f, k). Both MIMICS and MES-C exhibit a weaker response at lower temperature, which is more pronounced in MES-C. Additionally, average observed SOC initially decreases slightly with NPP until about 600 g C m−2 yr−1 before increasing, whereas modelled SOC increase with NPP continuously (Fig. 5c, h, m). Regarding soil pH, observed SOC decreases sharply with increasing pH until pH around 6, and then becomes steady at pH >6. However, SOC simulated by MES-C has much lower sensitivity to pH than the observed data when pH <6 (Fig. 5e, j).
ICE curves showing partial dependence of observed SOC on soil temperature are closely concentrated around the mean partial dependence curve with a clear decreasing trend (Fig. 5a), indicating a systematic influence of soil temperature on observed SOC variations. The density distribution of ICE curves for both MES-C and MIMICS modelled SOC (Fig. 5f, k) show similar pattern to observed SOC at higher soil temperatures but spread widely when soil temperature is below 10 °C, suggesting greater variability in model responses under cooler conditions.
The relationship between observed SOC and NPP is clearly not monotonic yet both models appear to represent it as a monotonic positive trend (Fig. 5c, h, m), as also reflected in Fig. 4. When NPP exceeds 500 g C m−2 yr−1, there is a distinct density hotspot of ICE curves at specific NPP values. However, at lower NPP values, the ICE curves form two branches with comparable density. The density distribution of ICE curves for MES-C aligns reasonably well with that of observed SOC except for a much denser, unimodal distribution at lower NPP instead of the bimodal fork seen in the observed relationship. In contrast, the ICE curves of MIMICS deviate more significantly, showing a tightly packed distribution at low NPP but a wider and evenly spread distribution at high NPP.
Overall, the density distributions of ICE curves for MES-C and MIMICS modelled SOC with respect to soil moisture are comparable to that of observed SOC (Fig. 5b, g, l). Similarly, the density distributions of ICE curves for soil texture (clay and silt content) in process-based models show consistent patterns with observations, though the curves for MIMICS spread wider at higher soil clay content (Fig. 5d, i, n). For soil pH, ICE curves related to observed SOC are more widely dispersed at low pH values with a substantial number of observed SOC greater than 30 g C kg−1 soil, but the curves are more concentrated with SOC values below 30 g C kg−1 soil for MES-C (Fig. 5e, j).
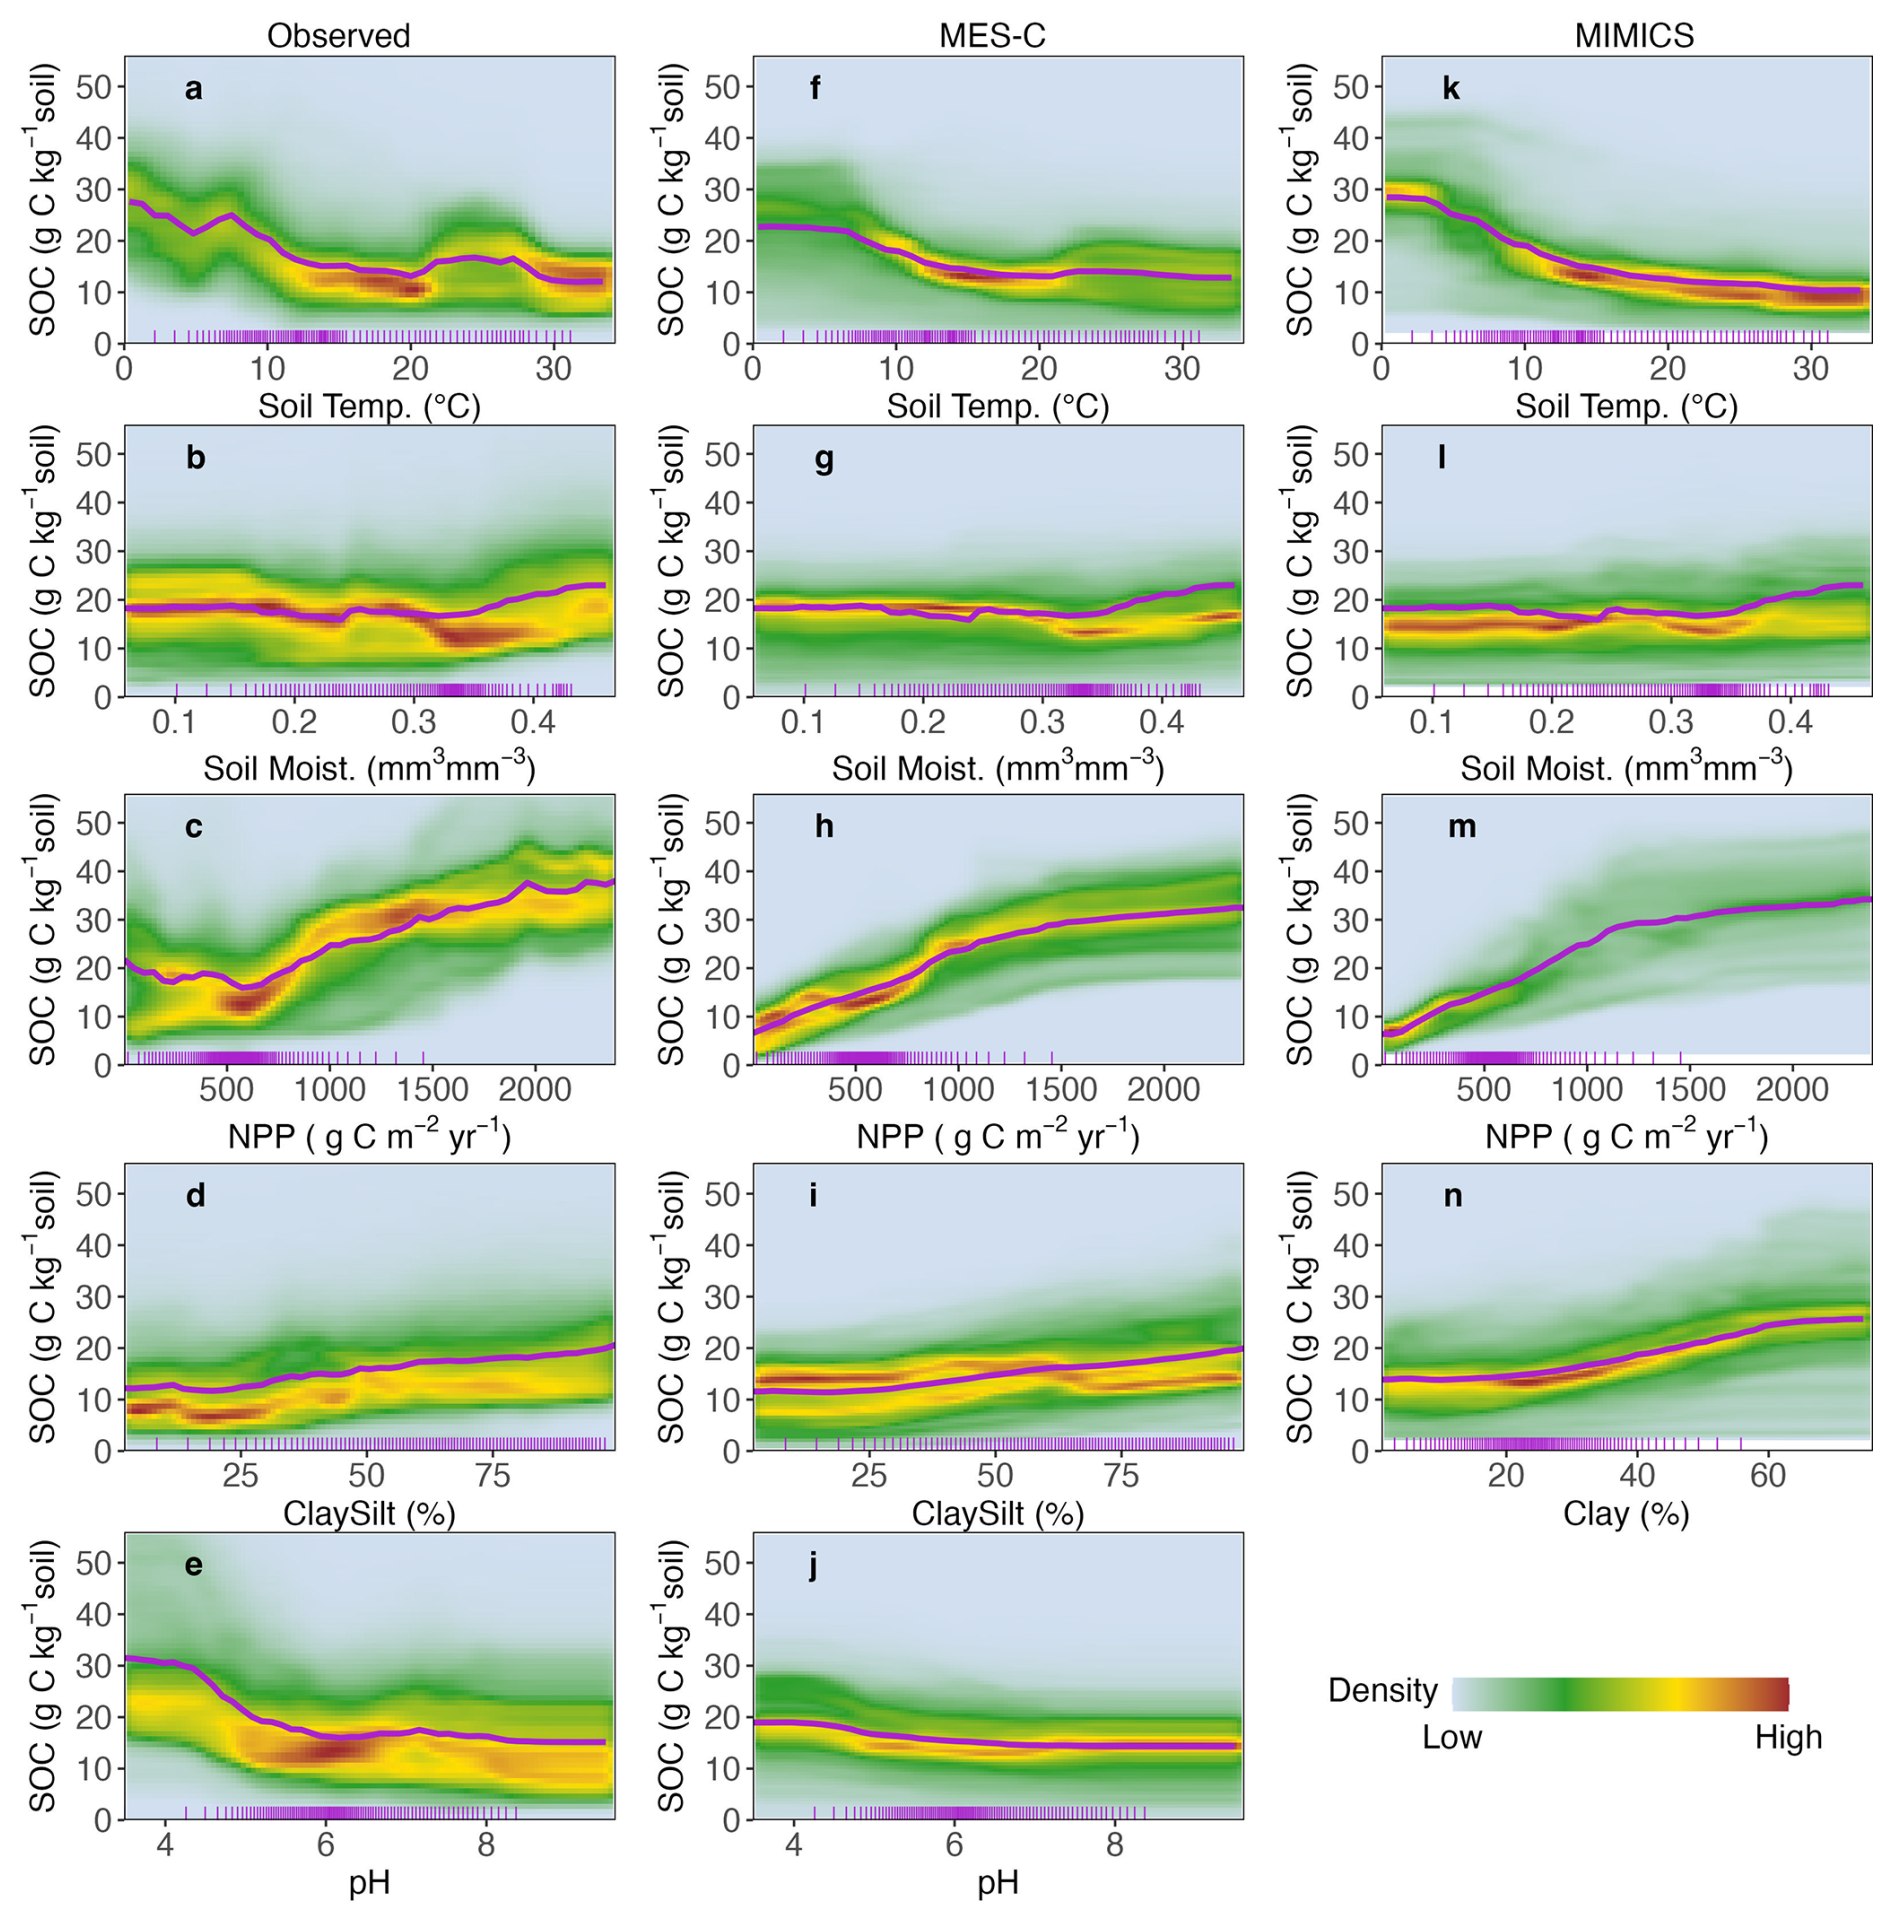
Figure 5Density representation of ICE with respect to different predictors and (a–e) observed SOC; (f–j) modelled SOC by MES-C; (k–n) modelled SOC by MIMICS. The purple curves represent the mean partial dependence across all instances, and short ticks along bottom axis represent 0 to 100 percentiles of the predictor. Note that SOC greater than 56 g C kg−1 soil (around 1 % of data) are not shown here to better highlight the dominant pattern. Full names of predictors can be found in Table 1.
3.5 XAI IV – 2-D partial dependence plots
The 2-D partial dependence plots (Fig. 6) provide insights into how pairs of predictors jointly influence SOC, revealing potential interactions that cannot be captured by one-dimensional relationships. To prevent overinterpretation, the calculations are restricted to data points within observed predictor space (Fig. 6f–s). Additionally, the density distributions of predictor pairs are visualised using contours (Fig. 6a–e) to highlight regions with higher data concentration.
When considering the interactive effects of NPP and soil temperature (Fig. 6f, k, p), observed SOC is lower at high temperature and low NPP, and achieve its highest level when soil temperature is between 10–20 °C and NPP is above 1500 g C m−2 yr−1. This pattern is captured by MES-C, though its predicted SOC are smaller than observed. However, MIMICS predicts the highest SOC values at 0–10 °C and NPP around 1000–1500 g C m−2 yr−1, deviating from observations. When considering combined effects of NPP and soil moisture (Fig. 6g, l, q), at low NPP values, observed SOC increases noticeably once soil moisture exceeds 0.35 mm mm−3, whereas modelled SOC remain stable across the entire soil moisture range. Additionally, there is a distinct difference of SOC responses to soil moisture at high NPP values. Observed SOC is highest at lower soil moisture, whereas MIMICS predicts higher SOC at higher soil moisture. MES-C predicts relatively constant SOC across moisture space at high NPP levels.
When examining the combined effects of soil temperature and moisture (Fig. 6h, m, r), both MES-C and MIMICS predict highest SOC at low temperature and high soil moisture, aligning well with observations. However, SOC values predicted by MES-C are smaller than both observed and MIMICS predicted SOC. Additionally, both MES-C and MIMICS capture the pattern where SOC decrease with increasing soil temperature at constant soil moisture level, but keep relatively constant once soil temperature exceeds 10 °C.
When soil moisture is held constant, observed SOC shows a slight increasing trend with higher soil clay and silt content (only soil clay content in MIMICS), a pattern that both MES-C and MIMICS successfully replicate (Fig. 6i, n, s). However, when focusing on the interactive effects between pH and moisture (Fig. 6j, o), observed SOC at pH below 5 is significantly greater than that at higher pH values across soil moisture space, which is not captured by MES-C, indicating underrepresentation of the effects of soil pH in the model.
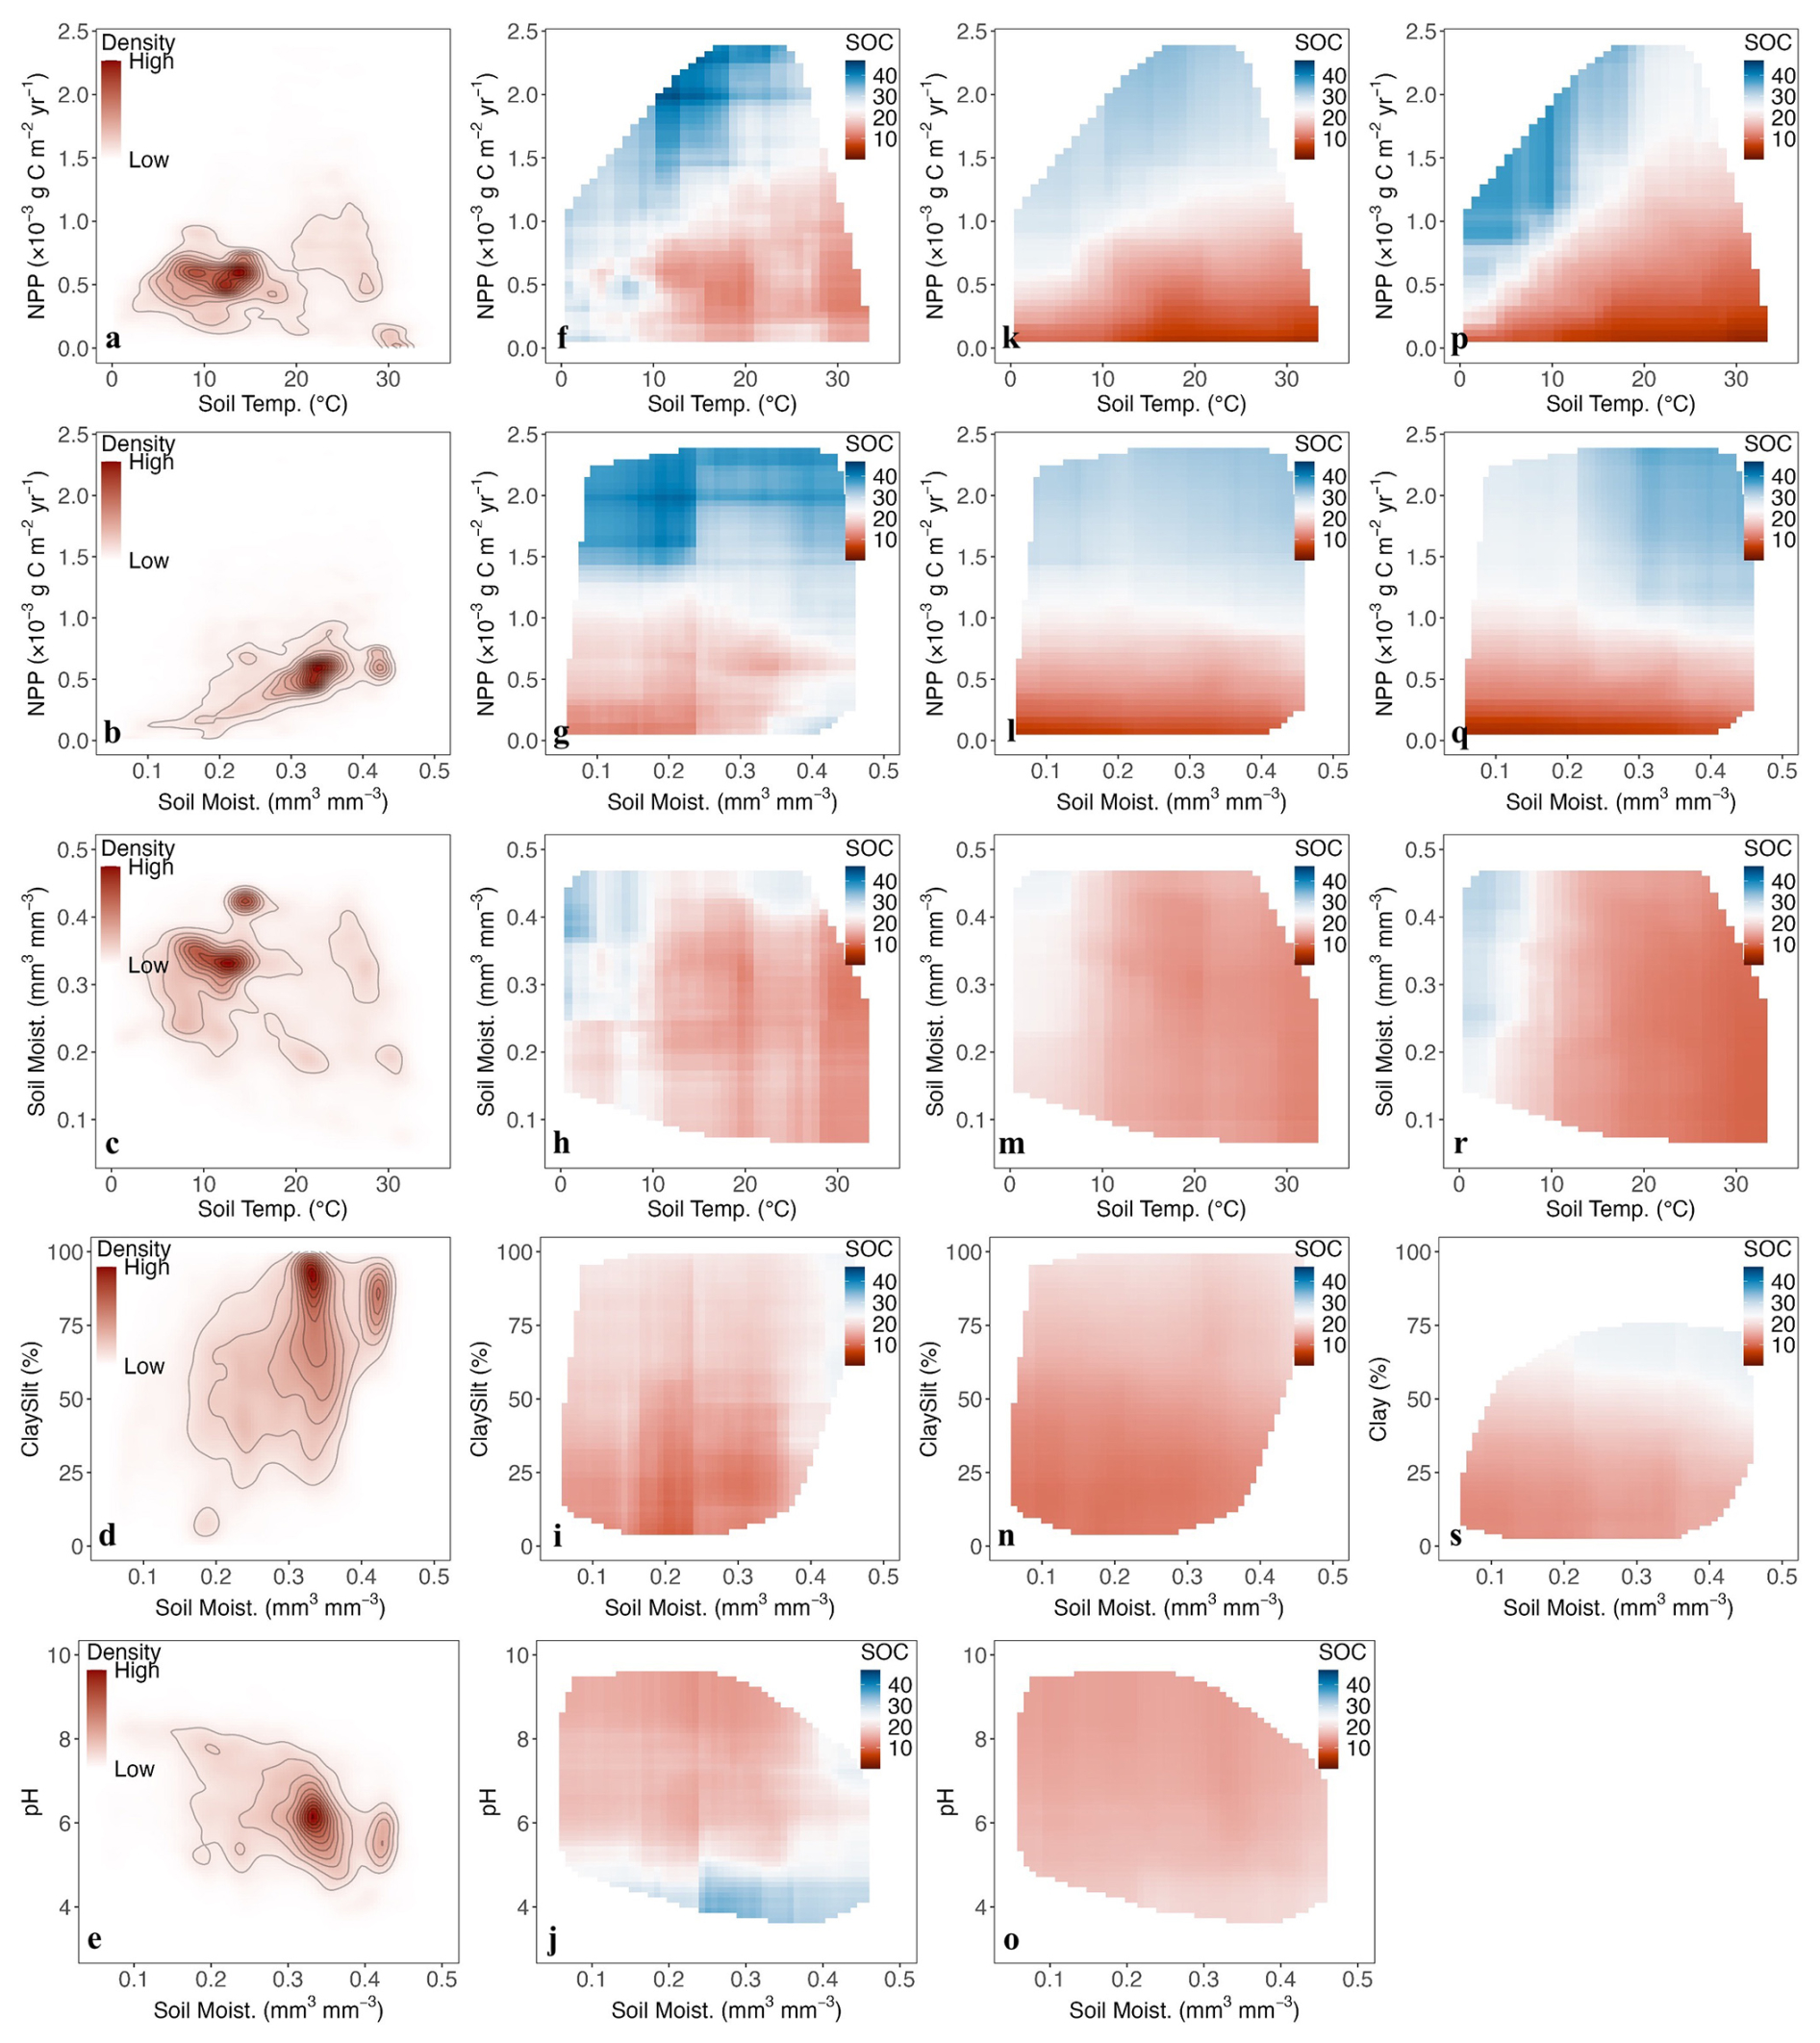
Figure 6Partial dependence plots of predictor pairs. (a–e) Contours showing density distribution of predictor pairs; (f–j) 2-D PDPs for observed SOC; (k–o) 2-D PDPs for SOC modelled by MES-C; (p–s) 2-D PDPs for SOC modelled by MIMICS. Unit of SOC is g C kg−1 soil. Full names of predictors can be found in Table 1.
4.1 Model performance
Machine learning models have been widely used in predicting global SOC content/stocks including both SOC in mineral and organic soils, and most of them achieved good results with R2 at 0.5–0.6 (Luo et al., 2021; Chen et al., 2024; Nyaupane et al., 2024), something we have replicated here. In this study, both predictor selection and model choice significantly affect the predictability of global SOC. The better performance of RF models compared to two process-based models in predicting global SOC is due to their intrinsic advantage of not relying on the predefined assumptions concerning the relationships between predictors and SOC. Instead, they identify and generalise the statistical relationships directly from the training data by minimising a loss function (Irrgang et al., 2021), such as mean square error (MSE) in this study. In contrast, the significantly lower proportion of SOC variances explained by MIMICS and MES-C highlights the need to improve the representation of SOC turnover processes in process-based models. Compared to MIMICS, MES-C has a more complex structure incorporating advanced SOC stabilisation theories, particularly reflected as a detailed representation of aggregated and mineral-associated SOC pools. However, adding more theoretical complexity did not improve the predictive performance of MES-C, likely because the larger number of parameters and greater structural complexity introduced additional uncertainty into SOC simulations, which may have offset the potential benefits that its theoretical advances incorporated.
Vertically, there is a dramatic decline in model performance in predicting SOC below 30 cm soil (Table S7), which is consistent across all models in this study and has also been found in many other studies (Kempen et al., 2011; Wadoux et al., 2023). This decline in RFinp and RFenv is partially explained by the fact that climatic covariates such as MAT and MAP represent better the conditions for surface layers but have less correlation with subsurface SOC (Minasny et al., 2013). However, the decline of performance beyond 30 cm soil in MIMICS and MES-C underscores the ongoing challenge of unravelling SOC turnover processes in subsurface soils.
Since all models perform best in the top 30 cm, our discussion will hereafter focus only on SOC in the 0–30 cm soil.
4.2 Relative variable importance
When all predictors used in RFenv are considered, climatic conditions show great influence on spatial variations of global SOC (Fig. 3a), a finding aligning with previous studies (Luo et al., 2021; Nyaupane et al., 2024). CEC, which indicates soils' ability to retain exchangeable cations, is the most important soil property in predicting global SOC but not considered by most process-based models. Soil clay (and silt) content is often used instead, as it correlates with the maximum potential of MAOC and serves as a practical proxy for soil physical properties. However, clay content alone may not fully capture important variation in mineral composition, specific surface area, or surface chemistry, which critically influence SOC stabilisation and sequestration (Bailey et al., 2018). CEC, on the other hand, provides a more integrative measure of these properties and has been shown to play a major role in SOC stabilisation, as it reflects the availability of reactive soil surfaces where organic carbon can be adsorbed as MAOC (Solly et al., 2020). As process-based modelling advances toward incorporating stabilization and decomposition mechanisms of distinct SOC fractions rather than just bulk SOC, it becomes increasingly important to account for CEC alongside clay content in the models to enable more realistic SOC predictions, particularly in soils where mineral phases (e.g., oxyhydroxides) dominate CEC contributions and thereby exert a major control on SOC stabilisation (Solly et al., 2020). Therefore, expanding CEC measurements across soil types would be beneficial in supporting efforts to build effective parameterizations in future process-based SOC models.
When considering only the inputs of process-based models, NPP and soil temperature are more important than soil properties in predicting SOC, which is different from the finding by Georgiou et al. (2021) that soil texture is the most influential factor. In addition to the differences in model structure between studies, this discrepancy compared to their study may be due to the data selection. A more recent snapshot of WoSIS dataset with more than 37 000 SOC profiles is used in our study, which is a much larger collection than analysed in their study (around 10 000 profiles) and likely provide a more comprehensive representation of the relationship between global SOC and environmental variables. Moreover, the results shown in our study focus mainly on SOC in top 30 cm soil whereas their study examines SOC down to 1 m, which potentially leads to the high importance of soil texture on observed SOC since the influence of soil properties becomes stronger in deeper soils (Luo et al., 2021).
4.3 Relationships with individual predictor variables
SOC in cold regions respond more strongly to temperature increase compared with SOC in warm regions (Koven et al., 2017), because cold regions tend to have a higher proportion of unprotected SOC which is more temperature sensitive and readily decomposable compared to MAOC (Georgiou et al., 2024), and the alleviation of low-temperature suppression on soil microbial activities accelerates SOC decomposition in cold regions once temperature rises. When isolating the effect of temperature on SOC, the higher temperature alone associated with reduced observed SOC in cold regions (0 to 5 °C) but makes little difference on MIMICS and MES-C modelled SOC (Fig. 5a, f, k). This likely reflects limited sensitivity in the models' temperature functions, which primarily mediate SOC turnover through microbial activity but do not fully capture the release of SOC from cold-limited conditions. Incorporating more realistic parameters that reflect the temperature sensitivity of microbial processes at different temperature scales, or explicitly representing permafrost and wetlands in cold regions could improve model representation (Huang et al., 2018; Xi et al., 2025).
The relationship between soil moisture and microbial activities is governed by the trade-off between oxygen availability and physical accessibility of SOC substrates to microbes (Singh et al., 2021), which is considered by the moisture function we used in both process-based models. However, the moisture function is primarily established and validated on data from incubated experiments (Ghezzehei et al., 2019), and their effectiveness at large spatial scale remains unknown. The failure of process-based models to reproduce the increase of SOC at higher moisture levels (Fig. 5b, g, i) may be due to an inaccurate representation of optimal moisture range where soil microbial activities are maximised.
At lower NPP levels, observed SOC responds in two distinct ways to increasing NPP (Fig. 5c), indicating that NPP influences SOC accumulation through different mechanisms under different environmental conditions, which is not captured in either process-based model. Increasing NPP contributes more carbon inputs to soils and then benefits SOC accumulation, but the transformation of litters into SOC is dependent on litter quality and regulated by soil microbial communities. For example, high-quality litters, which decomposes relatively rapidly, potentially enhance microbial growth and lead to greater necromass production, which may contribute to the formation of stable SOC (e.g., MAOC) (Cotrufo et al., 2013). Meanwhile, addition of fresh carbon may stimulate microbial growth and enzyme production to accelerate decomposition of existing SOC (Guenet et al., 2018). Therefore, the balance between increased C input and dual role of microbial communities in both building and decomposing SOC may result in the divergent SOC responses to increasing NPP, depending on environmental conditions. Both MIMICS and MES-C assign higher microbial CUE values when consuming higher-quality litters. However, litter quality in both models is determined by lignin : N ratio (see Supplement), which is now challenged by evidence that great variation exists between the decomposition dynamics of lignin and bulk litter (Yi et al., 2023), and using lignin may not fully represent the difference of litter quality. To evaluate whether the underrepresentation of NPP is caused by SOC profiles from managed soils, where the steady-state assumption may not hold, we removed SOC from croplands and re-examined the NPP-SOC relationship. The result showed no substantial change in the relationship (Fig. S1), suggesting that deviations from steady-state conditions in croplands did not strongly affect our findings. However, we acknowledge that using NPP as a proxy for carbon input in croplands causes uncertainties, and further study should account for human activities to better simulate C dynamics in managed soils.
Both MIMICS and MES-C captured the positive relationship between soil clay (and silt) content and SOC, but MES-C shows more consistent sensitivity due to its explicit representation of adsorption–desorption processes (Fig. 5d, i, n). This suggests that the modelling of SOC stabilization benefits from explicitly incorporating physical and chemical processes that control MAOC formation. In contrast, the poor representation of pH effects at low values underscores the need to integrate constraints on microbial activity under acidic conditions, not just adsorption processes (Malik et al., 2018).
4.4 Combined effects of covariate pairs
Though SOC variation may be dominated by specific variables under certain environmental conditions, it's generally the result of a combined influence of multiple factors acting together. A good representation of the combined effects is pivotal to improve model accuracy and reduce uncertainties in future carbon-climate change feedback.
Both MIMICS and MES-C capture broad SOC trends with temperature and NPP but miss the conditions where SOC peaks. This is potentially due to the weak response of microbial activities to temperature changes in cold regions within the models, and a greater temperature sensitivity should be achieved by applying more realistic parameter values. The inconsistency between observed and modelled SOC distribution along moisture and NPP gradient is more distinct (Fig. 6g, l, q). Low soil moisture limits the accessibility of SOC substrates to microbes, and positive priming effect is found to be lowest in dry conditions (Wang et al., 2016), which together leads to accumulation of observed SOC in these regions. However, caution is needed to interpret the results here. It's unlikely that regions with extremely low soil moisture can sustain such high NPP levels, and the data points within these conditions are sparse in our study (Fig. 6b). Further studies should employ different sources of environmental variables to ensure a more robust evaluation of model representation of the complex interactions.
Soil moisture interacts with clay (and silt) content and pH to influence SOC through its effects on microbial activity and mineral-associated stabilization (Kramer and Chadwick, 2018). While MIMICS and MES-C capture some positive effects of moisture in cold regions, they fail to reproduce the stronger moisture influence observed in warm or clay-rich soils, and MES-C fails to capture the threshold effects linked to soil pH. This suggests that current models may overemphasise temperature while underrepresenting the complex interactions between moisture, soil minerals, and acidity. In particular, the parameterisation of soil moisture effect on adsorption is still in its very initial stages and is currently considered by only a limited number of models (Chandel et al., 2023). Therefore, further experimental studies are required to better quantify these interactions and establish more universally applicable parameterisations.
4.5 Limitations and implications
We used multiple XAI methods to evaluate how two process-based SOC models represent key environmental controls on SOC. While cross-validation helped assess model performance, potential overparameterisation remains a concern, as both process-based models include multiple SOC pools but are calibrated only against total SOC. The lack of consistent global datasets for SOC fractions prevents direct validation of pool-level dynamics. Although we adjusted carbon allocation parameters to ensure simulated pool fractions (e.g., MAOC, microbial carbon) fall within reported ranges, this approach is only a partial remedy. Future efforts should focus on collecting spatially explicit SOC fraction datasets to enable more robust parameterisation and model evaluation.
In this study, model drivers were primarily derived from global datasets, which inherently contain uncertainties and do not perfectly represent the spatial scale of SOC observations. Although this does not affect the comparison between XAI results for observed and model-derived SOC since both the RF and process-based models were driven by the same inputs, it may influence model evaluation and parameterisation. For instance, some regions show unrealistically high NPP values under extremely low soil moisture (Fig. 6g), likely reflecting artefacts in the input data. Additionally, using NPP as a proxy for litter input introduces further uncertainty, as NPP does not fully capture the spatial variability of litter production and quality that regulate SOC formation in real ecosystems. Incorporating site level environmental data from diverse ecosystems could help better assess and refine the representation of environmental controls in process-based models.
The two process-based models also share some similar structural assumptions, particularly in representing litter decomposition through microbial activity. This structural convergence may limit the exploration of alternative hypotheses about how SOC responds to environmental and biological drivers. Testing a wider range of model structures and formulations could help identify more effective ways to represent these processes.
Despite these limitations, this study demonstrates the potential of XAI as a diagnostic framework for process-based models. By linking model behaviour with environmental drivers, XAI provides a transparent way to detect weaknesses and guide model improvement. The approach will become increasingly valuable as more reliable observations of SOC fractions and deep soil SOC become available, helping to bridge the gap between empirical insights and process-based understanding of global SOC dynamics.
In this study, we applied two RF models, RFenv and RFinp, and two process-based models, vertically resolved MIMICS and MES-C to predict global SOC content in mineral soils. Both RF models outperformed process-based models regardless of whether a broad set of predictors was adopted, or the same predictors as process-based models' inputs were used. Climate conditions show greatest influence on SOC variations, and CEC is an important soil property in predicting global SOC but is not considered by process-based models.
When predictors are restricted to process-based model inputs, both MIMICS and MES-C show NPP and soil temperature as the most dominant controls on SOC variation, aligning with observations. However, both models assign greater importance to soil texture and underestimate the effect of soil pH. Moreover, although both MIMICS and MES-C reasonably capture the mean partial dependence of SOC on each variable, they fail to reproduce the varying magnitude of effects across the full range of each predictor, most notably for NPP. Unlike observations, which show a nonlinear relationship between NPP and SOC, MIMICS and MES-C simplify this into a monotonic positive relationship.
Notable discrepancies are also observed in the interactive effects of variable pairs on SOC between observations and models. In MES-C, these interactions are largely diminished, while in MIMICS, mismatches occur in the combined effects between NPP and both soil temperature and moisture. Notably, MIMICS and MES-C fail to accurately represent the interaction between soil moisture and soil texture, and MES-C additionally shows deficiencies in representing the interaction with soil pH. These limitations highlight the need for further experimental studies to better quantify their effects on SOC, particularly in relation to adsorption and desorption processes.
Our study reveals that the poor performance of process-based models is associated both with the missing of key drivers of SOC, and the underrepresentation of the effects of existing variables. We suggest that further refinement of process-based models is required before incorporating them into large-scale modelling frameworks to ensure a more reliable projection of future carbon–climate feedback.
Code availability. The codes of the vertically resolved MIMICS and MES-C used in this study can be accessed at https://github.com/Wanglingfei170/MES-C (last access: 5 May 2025). Codes for data analysis and machine learning can be accessed by contacting the corresponding author.
SOC profiles from WoSIS (snapshot 2019) are described in Batjes et al. (2020). Climatic variables from WorldClim2 are described in Fick and Hijmans (2017). Soil properties from SoilGrids 2.0 are described in Poggio et al. (2021). PET data from the Global Aridity Index and Potential Evapotranspiration Database: Version 3 are described in Zomer et al. (2022). NPP from MODIS (MOD17A3HGF V6.1) are described in Running and Zhao (2021). IGBP from MODIS (MCD12Q1.061) are described in Friedl and Sulla-Menashe (2022). Soil temperature and moisture from ERA5-LAND are described in Muñoz-Sabater et al. (2021).
The supplement related to this article is available online at https://doi.org/10.5194/bg-22-7845-2025-supplement.
LW, GA, YPW and AP: conceptualisation; LW, GA and YPW: methodology; LW: investigation; LW: formal analysis, visualisation and writing – original draft preparation; LW, GA, YPW, AP, PC and DSG: writing – review and editing.
At least one of the (co-)authors is a member of the editorial board of Biogeosciences. The peer-review process was guided by an independent editor, and the authors also have no other competing interests to declare.
Publisher's note: Copernicus Publications remains neutral with regard to jurisdictional claims made in the text, published maps, institutional affiliations, or any other geographical representation in this paper. While Copernicus Publications makes every effort to include appropriate place names, the final responsibility lies with the authors. Views expressed in the text are those of the authors and do not necessarily reflect the views of the publisher.
Lingfei Wang is grateful to the China Scholarship Council and the University of New South Wales for financial support during her PhD study.
Contributions from Ying-Ping Wang, Daniel S. Goll and Philippe Ciais were supported by the CALIPSO (Carbon Loss in Plant Soils and Oceans) project, funded through the generosity of Eric and Wendy Schmidt by recommendation of the Schmidt Futures program.
This paper was edited by Akihiko Ito and reviewed by three anonymous referees.
Abramoff, R. Z., Guenet, B., Zhang, H., Georgiou, K., Xu, X., Rossel, R. A. V., Yuan, W., and Ciais, P.: Improved global-scale predictions of soil carbon stocks with Millennial Version 2, Soil Biology and Biochemistry, 164, 108466, https://doi.org/10.1016/j.soilbio.2021.108466, 2022.
Bailey, V. L., Bond-Lamberty, B., DeAngelis, K., Grandy, A. S., Hawkes, C. V., Heckman, K., Lajtha, K., Phillips, R. P., Sulman, B. N., and Todd-Brown, K. E.: Soil carbon cycling proxies: Understanding their critical role in predicting climate change feedbacks, Global change biology, 24, 895–905, https://doi.org/10.1111/gcb.13926, 2018.
Batjes, N. H., Ribeiro, E., and van Oostrum, A.: Standardised soil profile data to support global mapping and modelling (WoSIS snapshot 2019), Earth Syst. Sci. Data, 12, 299–320, https://doi.org/10.5194/essd-12-299-2020, 2020.
Bernard, L., Basile-Doelsch, I., Derrien, D., Fanin, N., Fontaine, S., Guenet, B., Karimi, B., Marsden, C., and Maron, P. A.: Advancing the mechanistic understanding of the priming effect on soil organic matter mineralisation, Functional Ecology, 36, 1355–1377, https://doi.org/10.1111/1365-2435.14038, 2022.
Bradford, M. A., Wieder, W. R., Bonan, G. B., Fierer, N., Raymond, P. A., and Crowther, T. W.: Managing uncertainty in soil carbon feedbacks to climate change, Nature Climate Change, 6, 751–758, https://doi.org/10.1038/nclimate3071, 2016.
Breiman, L.: Random forests, Machine learning, 45, 5–32, https://doi.org/10.1023/A:1010933404324, 2001.
Burnham, K. P. and Anderson, D. R. (Eds.): Basic Use of the Information-Theoretic Approach, In: Model Selection and Multimodel Inference, Springer, New York, NY, https://doi.org/10.1007/978-0-387-22456-5_3, 2002.
Chandel, A. K., Jiang, L., and Luo, Y.: Microbial Models for Simulating Soil Carbon Dynamics: A Review, Journal of Geophysical Research: Biogeosciences, 128, e2023JG007436, https://doi.org/10.1029/2023JG007436, 2023.
Chen, B., Lu, Q., Wei, L., Fu, W., Wei, Z., and Tian, S.: Global predictions of topsoil organic carbon stocks under changing climate in the 21st century, Science of the Total Environment, 908, 168448, https://doi.org/10.1016/j.scitotenv.2023.168448, 2024.
Cotrufo, M. F., Wallenstein, M. D., Boot, C. M., Denef, K., and Paul, E.: The Microbial Efficiency-Matrix Stabilization (MEMS) framework integrates plant litter decomposition with soil organic matter stabilization: do labile plant inputs form stable soil organic matter?, Global change biology, 19, 988–995, https://doi.org/10.1111/gcb.12113, 2013.
Cotrufo, M. F., Ranalli, M. G., Haddix, M. L., Six, J., and Lugato, E.: Soil carbon storage informed by particulate and mineral-associated organic matter, Nature Geoscience, 12, 989–994, https://doi.org/10.1038/s41561-019-0484-6, 2019.
Davidson, E. A. and Janssens, I. A.: Temperature sensitivity of soil carbon decomposition and feedbacks to climate change, Nature, 440, 165–173, https://doi.org/10.1038/nature04514, 2006.
Duan, Q., Gupta, V. K., and Sorooshian, S.: Shuffled complex evolution approach for effective and efficient global minimization, Journal of optimization theory and applications, 76, 501–521, https://doi.org/10.1007/BF00939380, 1993.
Fick, S. E. and Hijmans, R. J.: WorldClim 2: new 1-km spatial resolution climate surfaces for global land areas, International journal of climatology, 37, 4302–4315, https://doi.org/10.1002/joc.5086, 2017.
Friedl, M. and Sulla-Menashe, D.: MODIS/Terra+Aqua Land Cover Type Yearly L3 Global 500m SIN Grid V061, NASA Land Processes Distributed Active Archive Center [data set], https://doi.org/10.5067/MODIS/MCD12Q1.061, 2022.
García-Palacios, P., Crowther, T. W., Dacal, M., Hartley, I. P., Reinsch, S., Rinnan, R., Rousk, J., van den Hoogen, J., Ye, J.-S., and Bradford, M. A.: Evidence for large microbial-mediated losses of soil carbon under anthropogenic warming, Nature Reviews Earth & Environment, 2, 507–517, https://doi.org/10.1038/s43017-021-00178-4, 2021.
Georgiou, K., Malhotra, A., Wieder, W. R., Ennis, J. H., Hartman, M. D., Sulman, B. N., Berhe, A. A., Grandy, A. S., Kyker-Snowman, E., Lajtha, K., and Moore, J. A.: Divergent controls of soil organic carbon between observations and process-based models, Biogeochemistry, 156, 5–17, https://doi.org/10.1007/s10533-021-00819-2, 2021.
Georgiou, K., Jackson, R. B., Vindušková, O., Abramoff, R. Z., Ahlström, A., Feng, W., Harden, J. W., Pellegrini, A. F., Polley, H. W., and Soong, J. L.: Global stocks and capacity of mineral-associated soil organic carbon, Nature Communications, 13, 3797, https://doi.org/10.1038/s41467-022-31540-9, 2022.
Georgiou, K., Koven, C. D., Wieder, W. R., Hartman, M. D., Riley, W. J., Pett-Ridge, J., Bouskill, N. J., Abramoff, R. Z., Slessarev, E. W., and Ahlström, A.: Emergent temperature sensitivity of soil organic carbon driven by mineral associations, Nature Geoscience, 17, 205–212, https://doi.org/10.1038/s41561-024-01384-7, 2024.
Ghezzehei, T. A., Sulman, B., Arnold, C. L., Bogie, N. A., and Berhe, A. A.: On the role of soil water retention characteristic on aerobic microbial respiration, Biogeosciences, 16, 1187–1209, https://doi.org/10.5194/bg-16-1187-2019, 2019.
Goldstein, A., Kapelner, A., Bleich, J., and Pitkin, E.: Peeking inside the black box: Visualizing statistical learning with plots of individual conditional expectation, Journal of Computational and Graphical Statistics, 24, 44–65, https://doi.org/10.1080/10618600.2014.907095, 2015.
Guenet, B., Camino-Serrano, M., Ciais, P., Tifafi, M., Maignan, F., Soong, J. L., and Janssens, I. A.: Impact of priming on global soil carbon stocks, Global change biology, 24, 1873–1883, https://doi.org/10.1111/gcb.14069, 2018.
Hartigan, J. A. and Wong, M. A.: Algorithm AS 136: A k-means clustering algorithm, Journal of the royal statistical society, series c, 28, 100–108, https://doi.org/10.2307/2346830, 1979.
Huang, Y., Guenet, B., Ciais, P., Janssens, I. A., Soong, J. L., Wang, Y., Goll, D., Blagodatskaya, E., and Huang, Y.: ORCHIMIC (v1.0), a microbe-mediated model for soil organic matter decomposition, Geosci. Model Dev., 11, 2111–2138, https://doi.org/10.5194/gmd-11-2111-2018, 2018.
Irrgang, C., Boers, N., Sonnewald, M., Barnes, E. A., Kadow, C., Staneva, J., and Saynisch-Wagner, J.: Towards neural Earth system modelling by integrating artificial intelligence in Earth system science, Nature Machine Intelligence, 3, 667–674, https://doi.org/10.1038/s42256-021-00374-3, 2021.
Jackson, R. B., Lajtha, K., Crow, S. E., Hugelius, G., Kramer, M. G., and Piñeiro, G.: The Ecology of Soil Carbon: Pools, Vulnerabilities, and Biotic and Abiotic Controls, Annual review of ecology, evolution, and systematics, 48, 419–445, https://doi.org/10.1146/annurev-ecolsys-112414-054234, 2017.
Jenkinson, D. S. and Rayner, J. H.: The turnover of soil organic matter in some of the Rothamsted classical experiments, Soil Science, 123, 298–305, 1977.
Jennath, H. and Asharaf, S.: Explainable Optimal Random Forest model with conversational interface, Engineering Applications of Artificial Intelligence, 145, 110134, https://doi.org/10.1016/j.engappai.2025.110134, 2025.
Jobbágy, E. G. and Jackson, R. B.: The Vertical Distribution of Soil Organic Carbon and Its Relation to Climate and Vegetation, Ecological Applications, 10, 423–436, https://doi.org/10.1890/1051-0761(2000)010[0423:TVDOSO]2.0.CO;2, 2000.
Karhu, K., Auffret, M. D., Dungait, J. A., Hopkins, D. W., Prosser, J. I., Singh, B. K., Subke, J.-A., Wookey, P. A., Ågren, G. I., and Sebastià, M.-T.: Temperature sensitivity of soil respiration rates enhanced by microbial community response, Nature, 513, 81–84, https://doi.org/10.1038/nature13604, 2014.
Kempen, B., Brus, D., and Stoorvogel, J.: Three-dimensional mapping of soil organic matter content using soil type–specific depth functions, Geoderma, 162, 107–123, https://doi.org/10.1016/j.geoderma.2011.01.010, 2011.
Koven, C. D., Hugelius, G., Lawrence, D. M., and Wieder, W. R.: Higher climatological temperature sensitivity of soil carbon in cold than warm climates, Nature Climate Change, 7, 817–822, https://doi.org/10.1038/nclimate3421, 2017.
Kramer, M. G. and Chadwick, O. A.: Climate-driven thresholds in reactive mineral retention of soil carbon at the global scale, Nature Climate Change, 8, 1104–1108, https://doi.org/10.1038/s41558-018-0341-4, 2018.
Laub, M., Blagodatsky, S., Van de Broek, M., Schlichenmaier, S., Kunlanit, B., Six, J., Vityakon, P., and Cadisch, G.: SAMM version 1.0: a numerical model for microbial- mediated soil aggregate formation, Geosci. Model Dev., 17, 931–956, https://doi.org/10.5194/gmd-17-931-2024, 2024.
Lawrence, I. and Lin, K.: A concordance correlation coefficient to evaluate reproducibility, Biometrics, 45, 255–268, https://doi.org/10.2307/2532051, 1989.
Liang, C., Schimel, J. P., and Jastrow, J. D.: The importance of anabolism in microbial control over soil carbon storage, Nature Microbiology, 2, 17105, https://doi.org/10.1038/nmicrobiol.2017.105, 2017.
Lundberg, S. M. and Lee, S.-I.: A unified approach to interpreting model predictions, Advances in neural information processing systems, arXiv [preprint], https://doi.org/10.48550/arXiv.1705.07874, 2017.
Luo, Y., Ahlström, A., Allison, S. D., Batjes, N. H., Brovkin, V., Carvalhais, N., Chappell, A., Ciais, P., Davidson, E. A., and Finzi, A.: Toward more realistic projections of soil carbon dynamics by Earth system models, Global Biogeochemical Cycles, 30, 40–56, https://doi.org/10.1002/2015GB005239, 2016.
Luo, Z., Viscarra-Rossel, R. A., and Qian, T.: Similar importance of edaphic and climatic factors for controlling soil organic carbon stocks of the world, Biogeosciences, 18, 2063–2073, https://doi.org/10.5194/bg-18-2063-2021, 2021.
Malik, A. A., Puissant, J., Buckeridge, K. M., Goodall, T., Jehmlich, N., Chowdhury, S., Gweon, H. S., Peyton, J. M., Mason, K. E., and van Agtmaal, M.: Land use driven change in soil pH affects microbial carbon cycling processes, Nature Communications, 9, 3591, https://doi.org/10.1038/s41467-018-05980-1, 2018.
Malone, B. P., Minasny, B., and McBratney, A. B.: Digital Soil Mapping, in: Using R for Digital Soil Mapping, Progress in Soil Science, Springer, Cham, https://doi.org/10.1007/978-3-319-44327-0_1, 2017.
McBratney, A. B., Santos, M. M., and Minasny, B.: On digital soil mapping, Geoderma, 117, 3–52, https://doi.org/10.1016/S0016-7061(03)00223-4, 2003.
Minasny, B., McBratney, A. B., Malone, B. P., and Wheeler, I.: Digital mapping of soil carbon, Advances in agronomy, 118, 1–47, https://doi.org/10.1016/B978-0-12-405942-9.00001-3, 2013.
Muñoz-Sabater, J., Dutra, E., Agustí-Panareda, A., Albergel, C., Arduini, G., Balsamo, G., Boussetta, S., Choulga, M., Harrigan, S., Hersbach, H., Martens, B., Miralles, D. G., Piles, M., Rodríguez-Fernández, N. J., Zsoter, E., Buontempo, C., and Thépaut, J.-N.: ERA5-Land: a state-of-the-art global reanalysis dataset for land applications, Earth Syst. Sci. Data, 13, 4349–4383, https://doi.org/10.5194/essd-13-4349-2021, 2021.
Nyaupane, K., Mishra, U., Tao, F., Yeo, K., Riley, W. J., Hoffman, F. M., and Gautam, S.: Observational benchmarks inform representation of soil organic carbon dynamics in land surface models, Biogeosciences, 21, 5173–5183, https://doi.org/10.5194/bg-21-5173-2024, 2024.
O'Loughlin, R. J., Li, D., Neale, R., and O'Brien, T. A.: Moving beyond post hoc explainable artificial intelligence: a perspective paper on lessons learned from dynamical climate modeling, Geosci. Model Dev., 18, 787–802, https://doi.org/10.5194/gmd-18-787-2025, 2025.
Parton, W. J., Schimel, D. S., Cole, C. V., and Ojima, D. S.: Analysis of factors controlling soil organic matter levels in Great Plains grasslands, Soil Science Society of America Journal, 51, 1173–1179, https://doi.org/10.2136/sssaj1987.03615995005100050015x, 1987.
Paustian, K., Lehmann, J., Ogle, S., Reay, D., Robertson, G. P., and Smith, P.: Climate-smart soils, Nature, 532, 49–57, https://doi.org/10.1038/nature17174, 2016.
Perveen, N., Barot, S., Maire, V., Cotrufo, M. F., Shahzad, T., Blagodatskaya, E., Stewart, C. E., Ding, W., Siddiq, M. R., and Dimassi, B.: Universality of priming effect: An analysis using thirty five soils with contrasted properties sampled from five continents, Soil Biology and Biochemistry, 134, 162–171, https://doi.org/10.1016/j.soilbio.2019.03.027, 2019.
Pierson, D., Lohse, K. A., Wieder, W. R., Patton, N. R., Facer, J., de Graaff, M.-A., Georgiou, K., Seyfried, M. S., Flerchinger, G., and Will, R.: Optimizing process-based models to predict current and future soil organic carbon stocks at high-resolution, Scientific Reports, 12, 10824, https://doi.org/10.1038/s41598-022-14224-8, 2022.
Poggio, L., de Sousa, L. M., Batjes, N. H., Heuvelink, G. B. M., Kempen, B., Ribeiro, E., and Rossiter, D.: SoilGrids 2.0: producing soil information for the globe with quantified spatial uncertainty, SOIL, 7, 217–240, https://doi.org/10.5194/soil-7-217-2021, 2021.
Rumpel, C., Amiraslani, F., Koutika, L.-S., Smith, P., Whitehead, D., and Wollenberg, E.: Put more carbon in soils to meet Paris climate pledges, Nature Publishing Group UK London, 564, 32–34, https://doi.org/10.1038/d41586-018-07587-4, 2018.
Running, S. and Zhao, M.: MODIS/Terra Net Primary Production Gap-Filled Yearly L4 Global 500m SIN Grid V061, NASA EOS- DIS Land Processes Distributed Active Archive Centre [data set], https://doi.org/10.5067/MODIS/MOD17A3HGF.061, 2021.
Ryo, M. and Rillig, M. C.: Statistically reinforced machine learning for nonlinear patterns and variable interactions, Ecosphere, 8, e01976, https://doi.org/10.1002/ecs2.1976, 2017.
Schindlbacher, A., Wunderlich, S., Borken, W., Kitzler, B., Zechmeister-Boltenstern, S., and Jandl, R.: Soil respiration under climate change: prolonged summer drought offsets soil warming effects, Global change biology, 18, 2270–2279, https://doi.org/10.1111/j.1365-2486.2012.02696.x, 2012.
Schmidt, M. W., Torn, M. S., Abiven, S., Dittmar, T., Guggenberger, G., Janssens, I. A., Kleber, M., Kögel-Knabner, I., Lehmann, J., and Manning, D. A.: Persistence of soil organic matter as an ecosystem property, Nature, 478, 49–56, https://doi.org/10.1038/nature10386, 2011.
Shi, Z., Crowell, S., Luo, Y., and Moore III, B.: Model structures amplify uncertainty in predicted soil carbon responses to climate change, Nature Communications, 9, 2171, https://doi.org/10.1038/s41467-018-04526-9, 2018.
Singh, S., Mayes, M. A., Shekoofa, A., Kivlin, S. N., Bansal, S., and Jagadamma, S.: Soil organic carbon cycling in response to simulated soil moisture variation under field conditions, Scientific Reports, 11, 10841, https://doi.org/10.1038/s41598-021-90359-4, 2021.
Solly, E. F., Weber, V., Zimmermann, S., Walthert, L., Hagedorn, F., and Schmidt, M. W.: A critical evaluation of the relationship between the effective cation exchange capacity and soil organic carbon content in Swiss forest soils, Frontiers in Forests and Global Change, 3, 98, https://doi.org/10.3389/ffgc.2020.00098, 2020.
Spawn, S. A., Sullivan, C. C., Lark, T. J., and Gibbs, H. K.: Harmonized global maps of above and belowground biomass carbon density in the year 2010, Scientific Data, 7, 112, https://doi.org/10.1038/s41597-020-0444-4, 2020.
Terrer, C., Phillips, R. P., Hungate, B. A., Rosende, J., Pett-Ridge, J., Craig, M. E., van Groenigen, K. J., Keenan, T. F., Sulman, B. N., Stocker, B. D., Reich, P. B., Pellegrini, A. F. A., Pendall, E., Zhang, H., Evans, R. D., Carrillo, Y., Fisher, J. B., Van Sundert, K., Vicca, S., and Jackson, R. B.: A trade-off between plant and soil carbon storage under elevated CO2, Nature, 591, 599–603, https://doi.org/10.1038/s41586-021-03306-8, 2021.
Tian, H., Lu, C., Yang, J., Banger, K., Huntzinger, D. N., Schwalm, C. R., Michalak, A. M., Cook, R., Ciais, P., and Hayes, D.: Global patterns and controls of soil organic carbon dynamics as simulated by multiple terrestrial biosphere models: Current status and future directions, Global Biogeochemical Cycles, 29, 775–792, https://doi.org/10.1002/2014GB005021, 2015.
Todd-Brown, K. E. O., Randerson, J. T., Post, W. M., Hoffman, F. M., Tarnocai, C., Schuur, E. A. G., and Allison, S. D.: Causes of variation in soil carbon simulations from CMIP5 Earth system models and comparison with observations, Biogeosciences, 10, 1717–1736, https://doi.org/10.5194/bg-10-1717-2013, 2013.
Todd-Brown, K. E. O., Randerson, J. T., Hopkins, F., Arora, V., Hajima, T., Jones, C., Shevliakova, E., Tjiputra, J., Volodin, E., Wu, T., Zhang, Q., and Allison, S. D.: Changes in soil organic carbon storage predicted by Earth system models during the 21st century, Biogeosciences, 11, 2341–2356, https://doi.org/10.5194/bg-11-2341-2014, 2014.
Varney, R. M., Friedlingstein, P., Chadburn, S. E., Burke, E. J., and Cox, P. M.: Soil carbon-concentration and carbon-climate feedbacks in CMIP6 Earth system models, Biogeosciences, 21, 2759–2776, https://doi.org/10.5194/bg-21-2759-2024, 2024.
Viscarra Rossel, R., Zhang, M., Behrens, T., and Webster, R.: A warming climate will make Australian soil a net emitter of atmospheric CO2, npj Climate and Atmospheric Science, 7, 79, https://doi.org/10.1038/s41612-024-00619-z, 2024.
Wadoux, A. M. J.-C. and Molnar, C. Beyond prediction: methods for interpreting complex models of soil variation, Geoderma, 422, 115953, https://doi.org/10.1016/j.geoderma.2022.115953, 2022.
Wadoux, A. M. J., Román Dobarco, M., Malone, B., Minasny, B., McBratney, A. B., and Searle, R.: Baseline high-resolution maps of organic carbon content in Australian soils, Scientific Data, 10, https://doi.org/10.1038/s41597-023-02056-8, 2023.
Wang, G., Post, W. M., and Mayes, M. A.: Development of microbial-enzyme-mediated decomposition model parameters through steady-state and dynamic analyses, Ecological Applications, 23, 255–272, https://doi.org/10.1890/12-0681.1, 2013.
Wang, L., Abramowitz, G., Wang, Y.-P., Pitman, A., and Viscarra Rossel, R. A.: An ensemble estimate of Australian soil organic carbon using machine learning and process-based modelling, SOIL, 10, 619–636, https://doi.org/10.5194/soil-10-619-2024, 2024.
Wang, Q., Zeng, Z., and Zhong, M.: Soil moisture alters the response of soil organic carbon mineralization to litter addition, Ecosystems, 19, 450–460, https://doi.org/10.1007/s10021-015-9941-2, 2016.
Wang, Y. P., Zhang, H., Ciais, P., Goll, D., Huang, Y., Wood, J. D., Ollinger, S. V., Tang, X., and Prescher, A. K.: Microbial activity and root carbon inputs are more important than soil carbon diffusion in simulating soil carbon profiles, Journal of Geophysical Research: Biogeosciences, 126, e2020JG006205, https://doi.org/10.1029/2020JG006205, 2021.
Wei, Y., Wang, M., Viscarra Rossel, R., Chen, H., and Luo, Z.: Extreme climate as the primary control of global soil organic carbon across spatial scales, Global Biogeochemical Cycles, 38, e2024GB008200, https://doi.org/10.1029/2024GB008200, 2024.
Wieder, W. R., Grandy, A. S., Kallenbach, C. M., and Bonan, G. B.: Integrating microbial physiology and physio-chemical principles in soils with the MIcrobial-MIneral Carbon Stabilization (MIMICS) model, Biogeosciences, 11, 3899–3917, https://doi.org/10.5194/bg-11-3899-2014, 2014.
Wieder, W. R., Grandy, A. S., Kallenbach, C. M., Taylor, P. G., and Bonan, G. B.: Representing life in the Earth system with soil microbial functional traits in the MIMICS model, Geosci. Model Dev., 8, 1789–1808, https://doi.org/10.5194/gmd-8-1789-2015, 2015.
Xi, Y., Ciais, P., Zhu, D., Qiu, C., Zhang, Y., Peng, S., Hugelius, G., Bowring, S. P. K., Goll, D. S., and Wang, Y.-P.: Representing high-latitude deep carbon in the pre-industrial state of the ORCHIDEE-MICT land surface model (r8704), Geosci. Model Dev., 18, 6043–6062, https://doi.org/10.5194/gmd-18-6043-2025, 2025.
Xu, H., Zhang, T., Luo, Y., Huang, X., and Xue, W.: Parameter calibration in global soil carbon models using surrogate-based optimization, Geosci. Model Dev., 11, 3027–3044, https://doi.org/10.5194/gmd-11-3027-2018, 2018.
Yi, B., Lu, C., Huang, W., Yu, W., Yang, J., Howe, A., Weintraub-Leff, S. R., and Hall, S. J.: Resolving the influence of lignin on soil organic matter decomposition with mechanistic models and continental-scale data, Global change biology, 29, 5968–5980, https://doi.org/10.1111/gcb.16875, 2023.
Zhang, H., Goll, D. S., Wang, Y. P., Ciais, P., Wieder, W. R., Abramoff, R., Huang, Y., Guenet, B., Prescher, A. K., and Viscarra Rossel, R. A.: Microbial dynamics and soil physicochemical properties explain large-scale variations in soil organic carbon, Global change biology, 26, 2668–2685, https://doi.org/10.1111/gcb.14994, 2020.
Zhou, J., Chen, S., Yan, L., Wang, J., Jiang, M., Liang, J., Zhang, X., and Xia, J.: A comparison of linear conventional and nonlinear microbial models for simulating pulse dynamics of soil heterotrophic respiration in a semi-arid grassland, Journal of Geophysical Research: Biogeosciences, 126, e2020JG006120, https://doi.org/10.1029/2020JG006120, 2021.
Zomer, R. J., Xu, J., and Trabucco, A.: Version 3 of the Global Aridity Index and Potential Evapotranspiration Database, Scientific Data, 9, 409, https://doi.org/10.1038/s41597-022-01493-1, 2022.