the Creative Commons Attribution 4.0 License.
the Creative Commons Attribution 4.0 License.
 | 10 Dec 2025
Coastal nitrogen drives respiration quotient in the Southern California Bight
Adam J. Fagan
Adam C. Martiny
Southern California Bight coastal waters are dynamic and strongly influenced by a changing climate. In the open ocean, an increased respiration quotient has been found during high temperature and low nitrogen conditions but variation in coastal environments is uncertain. To disentangle the controlling factors in a coastal environment, we examined environmental conditions, particulate organic matter, and the respiration quotient over five years in the Southern California Bight. Our study revealed clear seasonal variation in environmental conditions and biological parameters. We detected a higher than previously reported respiration quotient in open ocean regions. We found a strong inverse relationship between the respiration quotient, nitrate and chlorophyll. Our findings also suggest that changes in community structure, triggered by nutrient shifts and a local oil spill, affected the respiration quotient range and explains some of the variability measured. As climate continues to impact coastal regions, a variable respiration quotient is likely important for subsurface oxygen concentrations and in turn the health of our coastline.
- Article
(844 KB) - Full-text XML
-
Supplement
(1071 KB) - BibTeX
- EndNote


Oxygen is vital for coastal ecosystem health, acting as the primary oxidizing agent in cellular respiration. In the California Current, increased upwelling, mixing, and remineralization rates result in higher nutrient availability during winter and spring months (Venrick, 2012), driving seasonality in primary production and subsequent dissolved oxygen demand in the subsurface layers (Bograd et al., 2008). Coastal deoxygenation events have been found to be primarily driven by nutrient cycling (Falkowski et al., 2011; Schmidtko et al., 2017). The respiration quotient or the amount of oxygen required for organic carbon oxidation, , is a potentially important factor for oxygen dynamics but is commonly assumed constant (see Methods for chemical equations). However, changes in the respiration quotient has been linked to surface plankton community composition and may be an additional regulator for deep ocean oxygen (Moreno et al., 2020). Increased is representative of larger oxygen consumption by bacteria or higher trophic organisms during respiration. The impact of an increased (1.3) away from Redfield (1.0) within an Earth System Model resulted in a 30 % decrease in global oxygen rivaling impacts of a changing export production (Gerace et al., 2023; Moreno et al., 2020). Additionally, the amount of exported organic carbon and associated oxygen consumption due to bacterial respiration is sensitive to temperature and has a strong impact on oxygen levels (Keeling et al., 2010; Matear and Hirst, 2003). As expected globally, temperatures will continue to rise in the Pacific Ocean, slowly warming the California coastline despite seasonal upwelling. However, the respiration quotient has not been quantified in coastal waters to date. Consequently, it is critical to quantify coastal dynamics and environmental controls.
Open ocean varies systematically with temperature and nutrients to produce distinct basin patterns. has been shown to vary positively with temperature in the Eastern Pacific Ocean (Moreno et al., 2020) and in nitrogen limited regions in the Atlantic Ocean (Moreno et al., 2022). Regions with high temperatures and deep nutriclines were found to have high ratios in the Pacific Ocean (Moreno et al., 2020). Further, nitrogen stress caused increased resulting in ratios higher than with temperature alone. In contrast, phosphorus stress appeared to dampen ratios, particularly when combined with high temperatures (Moreno et al., 2022). Beyond the mixed layer, decreased to its minimum at the euphotic and disphotic boundary (Gerace et al., 2023). It was hypothesized that planktonic community structure and the preferential production/removal of biochemical components (i.e., lipid followed by proteins) led to a steady decrease in (Gerace et al., 2023). However, from the base of the euphotic zone to depth, the remained relatively consistent with the average higher than the mixed layer. Oxygen consumption was consistent, resulting in an overall decrease in the deep oxygen concentrations. Thus, vary systematically with environmental conditions in the open ocean and hence, we hypothesize that similar variation occurs in coastal regions.
The Southern California Bight (SCB) is ever dynamic and changing due to climatic influences creating a unique study site. Previous work, at the “Microbes in the Coastal Region of Orange County” (MICRO) time-series, quantified variation in the particulate organic matter (POM) concentrations and stoichiometric ratios (C : N : P) corresponded to seasonal and multi-year oscillations in environmental conditions and phytoplankton abundances (Martiny et al., 2016; Fagan et al., 2019; Larkin et al., 2020). Specifically, high C , N : P corresponded to summer/fall periods with high temperatures, low nutrients and a small phytoplankton dominance and vice versa for cooler periods during the winter and spring (Martiny et al., 2016). Harmful algal bloom (HAB) forming species are present year-round, range in size and play a significant role in SCB biogeochemical cycling (Trainer et al., 2010). Changes in bloom behavior due to natural or anthropogenic influences will influence POM concentrations and in turn stoichiometric ratios. As such, we expect to exhibit seasonality and follow previously quantified stoichiometric ratio patterns with increased values during warm, low nutrient seasons, as well as major variation due to bloom formation and/or shifts in community structure.
In October 2021, an oil spill deposited over 20 000 gallons (equivalent to approximately 75,708 L) of crude oil onto Southern California beaches creating a natural community shift experiment (Brock et al., 2025). During this oil spill it was found that a significant beta-diversity shift occurred during this oil spill (Brock et al., 2025). Many other studies have found a high presence of hydrocarbon degrading bacteria during oil spills, shifting the microbial community structure away from seasonality (Hazen et al., 2010; Yang et al., 2014). Their magnitude is closely related to the season and type of oil during the event (Fuentes et al., 2016; Varjani and Gnansounou, 2017). As a result, the bulk particulate matter (i.e. surface plankton community) will shift while oil persists in the water column and could cause a lag in seasonal community composition from pre-oil conditions. It has been hypothesized that changes to the bulk carbon type could alter the average ratio (Moreno et al., 2020). Provided with this unique opportunity affecting our study site, we expect to quantify decreased patterns while oil is present and possible shifts from seasonal or annual patterns.
The goal of this study was to quantify and identify possible drivers of its coastal temporal dynamics. To this end, we quantified changes in temperature, nutrients, POM concentrations and ratios at the MICRO time-series in the SCB weekly from October 2016 to January 2022. We predicted that the cumulative average will be higher than previously quantified open ocean ratios due to increased coastal dynamics and higher anthropogenic influence. We also predicted observing seasonal patterns in , strongly controlled by temperature rather than changing in nutrient stress. As planktonic community composition shifts from larger to smaller species, we anticipated will increase. Finally, we expected that increased complex hydrocarbons during the oil spill period will decrease ratios.
2.1 Seawater Collection
Surface water was collected weekly at the MICRO time-series study site (Fig. S1 in the Supplement; 33.608° N and 117.928° W; Martiny et al., 2016) off the Newport Pier using a bucket. Two autoclaved bottles are rinsed with ocean water and filled for processing in the lab. Water temperature and chlorophyll a data are collected from an automated shore station off Newport Pier as part of the Southern California Coastal Ocean Observing Systems (SCCOOS).
For particulate organic carbon (POC) and for particulate chemical oxygen demand (PCOD) samples, we collect 300 mL for each analysis in triplicate from each bottle are filtered within an hour of collection through pre-combusted (500 °C, 5 h) 25 mm GF/F filters (Whatman, MA). Each filter is rinsed with Milli-Q water before sample filtration to remove potential P residues. Filters are stored in a starred petri dish. POC samples were placed directly into the −20 °C freezer. The PCOD samples are dried for 24 h at 55 °C and then placed in the −20 °C freezer. The filtrate from the initial filtration is collected and used for macronutrient quantification. The filtrate is filtered through a 0.2 µm syringe filter into a 50 mL tube. Triplicates were taken for nitrate and phosphate and stored in the −20 °C freezer.
2.2 Macronutrients Quantification
Soluble reactive phosphorus (SRP) concentrations were determined using the magnesium induced co-precipitation (MAGIC) protocol and calculated against a potassium monobasic phosphate standard (Karl and Tien, 1992; Lomas et al., 2010). Nitrate samples (taken before 2019) were treated with a solution of ethylenediaminetetraccetate and passed through a column of copperized cadmium fillings (Knap et al., 1993). Nitrate samples (taken after 2019) were measured using a spongy cadmium method (Jones, 1984).
2.3 Particulate Organic Carbon (POC)
After thawing, POC filters were allowed to dry overnight at 65 °C before being packed into a 25 mm tin capsule (CE Elantech, Lakewood, New Jersey). Samples were then analyzed for C content on the FlashEA 112 nitrogen and carbon analyzer (Therom Scientific, Waltham, Massachusetts), following the Sharp (1974) protocol. POC concentrations were calibrated using known quantities of atropine (C17H23NO3) and acetanilide (C8H9NO).
2.4 Particulate Chemical Oxygen Demand (PCOD) Assay
PCOD samples were quantified following Moreno et al. (2020). Samples were placed in 50 °C for 24 h. Filters were then transferred to HACH HR+ COD vials (Product no. 2415915 containing mercuric sulfate). Two mL of Milli-Q water was added to each vial and inverted to submerge the filers completely. Vials are digested at 150 °C for 2 h. in a digestion block. Samples were then cooled to room temperature. Due to uneven precipitation occurring, precipitation was induced by adding 92.1 µL of 0.17 M (or 9.5 g L−1) NaCl to each vial. Vials were inverted twice and centrifuged for 30 min at 2500 rpm and read on a photo-spectrometer at a wavelength of 600 nm. Note: Dichromate does not oxidize organic nitrogen, so this assay only quantifies changes in the carbon oxidation state. To quantify PCOD, in µM O2, we utilize a standard curve based on HACH certified COD 1000 mg L−1 standard stock solution (Product no. 2253929).
2.5 Ratio
ratios were taken from the mean concentrations of PCOD and POC triplets. We compare our measured ratio to that of Redfield (1; Redfield, 1958) and Anderson's best estimate average cell value of 1.1 (Anderson, 1995). Using Eqs. (1) and (2), where the nitrogen end member is ammonia, the for Redfield (106 : 263 : 110 : 16 : 1; C : H : O : N : P) is 1 and 1.1 for Anderson (106 : 175 : 42 : 16 : 1; C : H : O : N : P).
The standard deviation for were calculated as a pooled sample:
2.6 Large Phytoplankton Relative Abundance
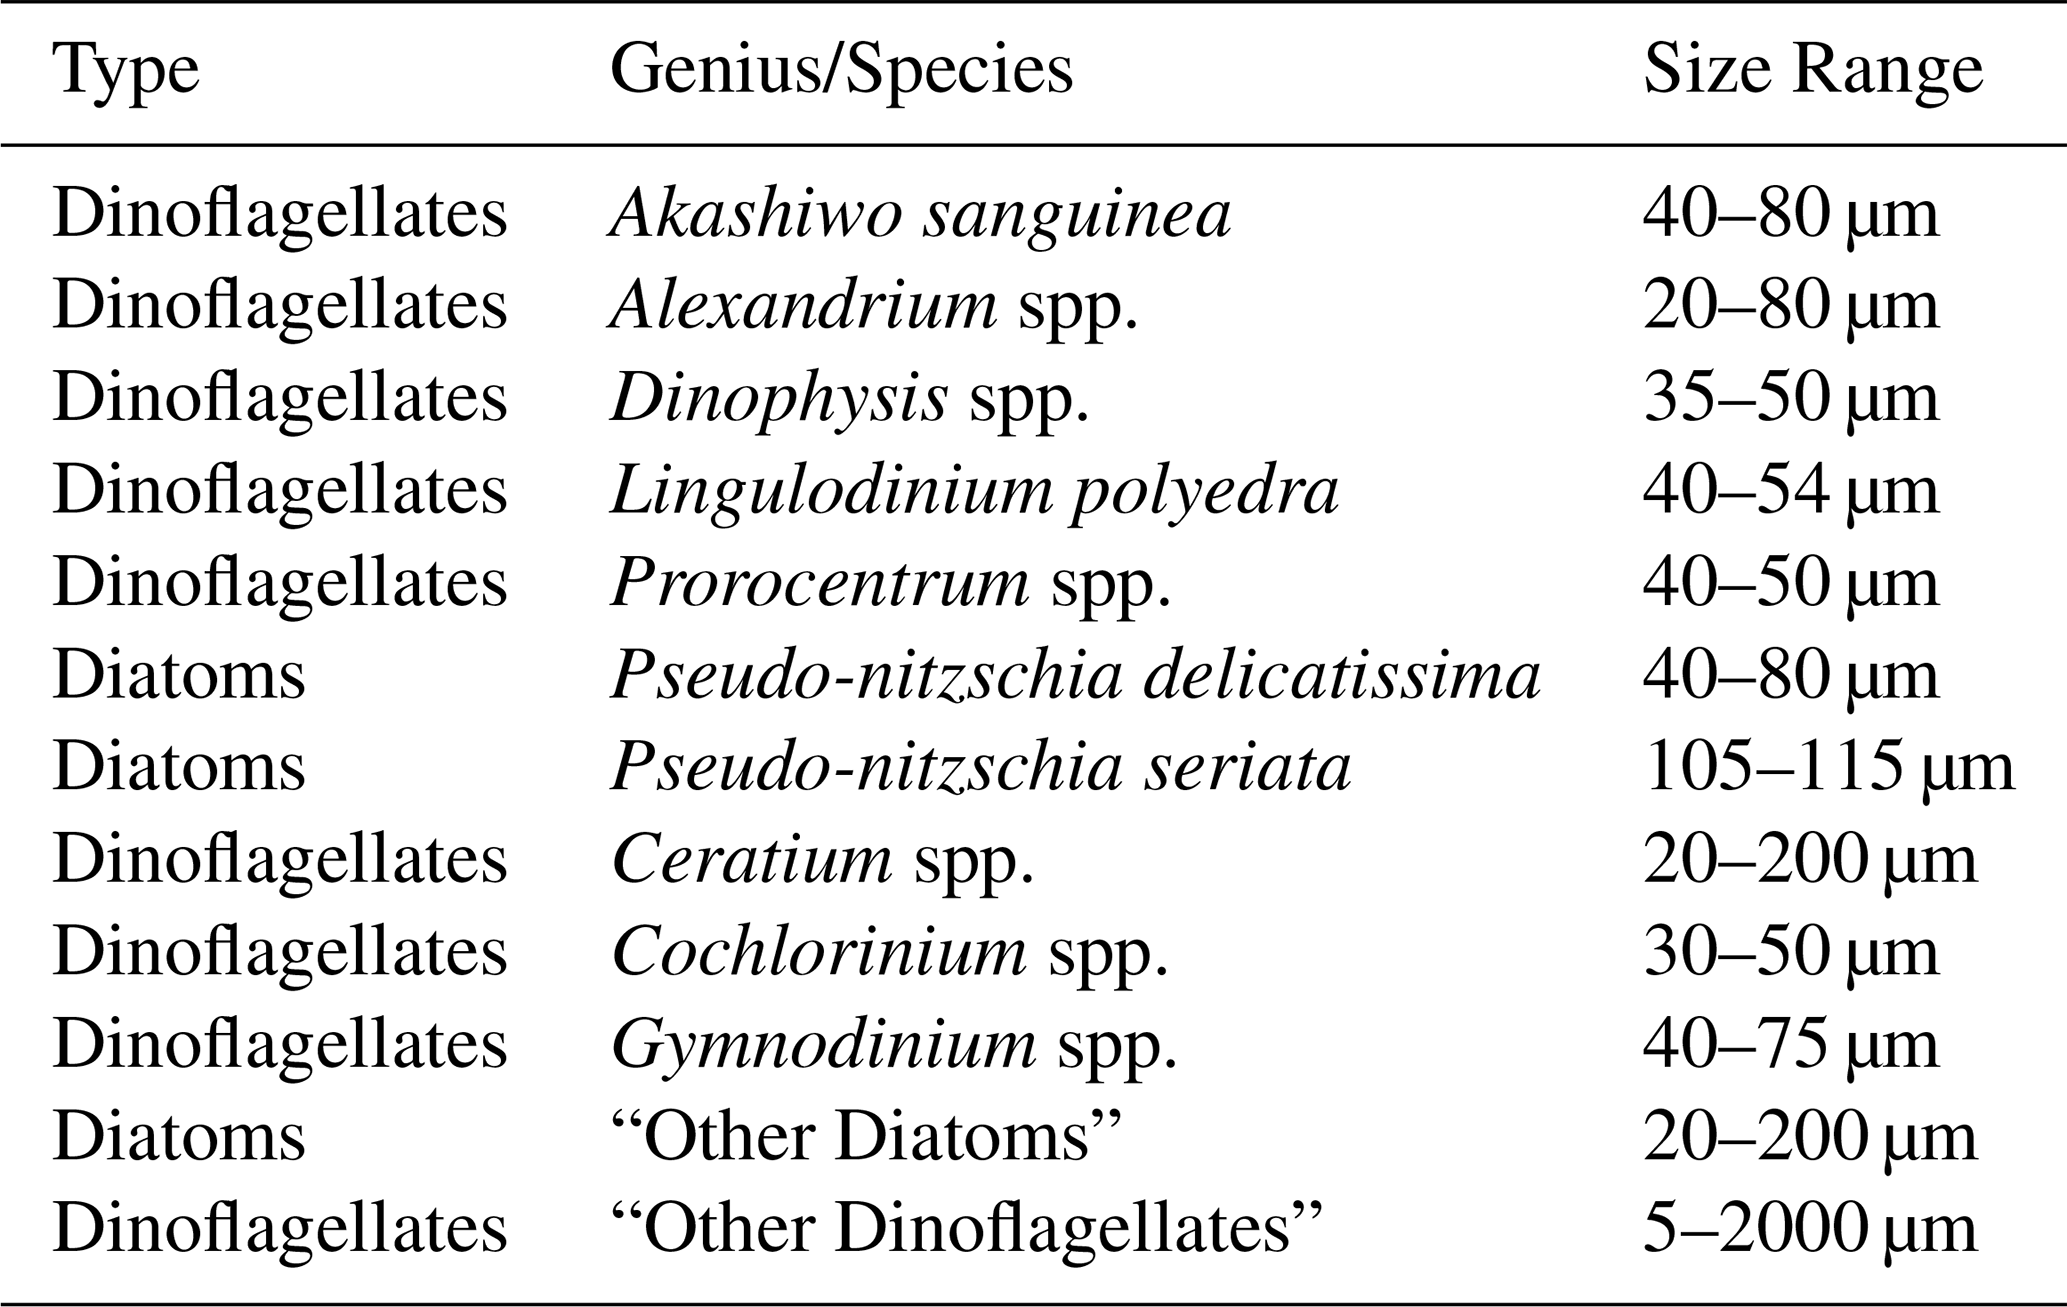
Phytoplankton abundance for ten species, two general species categories and the total phytoplankton abundance were obtained from SCCOOS. Water collection and analysis can be found at Seubert et al. (2013). The ten species are as follows: Akashiwo sanguinea, Alexandrium spp., Dinophysis spp., Lingulodinium polyedra, Prorocentrum spp., Pseudo-nitzschia (PN) delicatissima, PN seriata, Ceratium spp., Cochlodinium spp., and Gymnodinium spp. The two categories are “Other Diatoms” and “Other Dinoflagellates” (Table 1). Monthly and annual average relative abundance were calculated by averaging the abundance for each species over the specific time span (either monthly or annually) then dividing by the total abundance for that same period.
2.7 Statistical Analysis
All analyses were done using Table S1 (in the Supplement) data in Matlab (Mathworks, MA). Using the smooth function, a four-point or eight-point moving average was overlaid onto the raw data time-series plots. Sum of square analysis was conducted on linear regressions to quantify the monthly and annual contributions. To detrend seasonality in our time-series parameters, we apply a season adjustment using a stable seasonal filter applying a 53-point moving average, representing our weekly sampling. To quantify statistical significance in monthly and annual differences, a 1-way ANOVA is used. To determine potential covariations, a Pearson's correlation coefficient was calculated for each pair of environmental variables, followed by a test of statistical significance (p-value ≤ 0.05). Similarly, a Pearson's correlation coefficient was calculated between each species abundance and chlorophyll, followed by a statistical significance (p-value ≤ 0.05) test, to determine which species influenced chlorophyll concentrations.
To determine impacts on , a Pearson's correlation coefficient was calculated for each pair of species relative abundance and , followed by a statistical significance test (p-value ≤ 0.05). Due to limited data in the large phytoplankton relative abundance, we removed Ceratium spp., Cochlodinium spp., and Gymnodinium spp. from the annual correlation analysis.
Statistical nonlinear models were fitted using six predictor variables (temperature (°C), nitrate (µM), phosphate (µM), chlorophyll (mg C m−3), POC (µM), and PCOD (µM)). R2 and Akaike Information Criterion (AIC) were used to compare across models. For all regressions containing interpolated parameters, a random sampling of cruise data was conducted to ensure results were not swayed.
Oil spill analysis was accomplished using a 2-way ANOVA. First ratios were averaged over three months before the spill (July through September), the month during the spill (October), and three months after (November through January) during 2021/2022. Similar averaging was done for 2018/2019 and 2019/2020 years to quantify differences between the average ratios during this period and specifically during the oil spill.
To evaluate our hypothesis that demonstrates seasonal variability, and has systematic relationships with environmental conditions, we quantified physical (temperature), chemical (nitrate and phosphate), and biological [chlorophyll, particulate organic carbon (POC), particulate chemical oxygen demand (PCOD), and plankton relative abundance] properties and stoichiometric ratio ( over a 5-year period from 2016 to 2022. Annual oscillations and strong correlations exist between parameters.
3.1 Temporal Patterns
Physical conditions demonstrate short-term, seasonal, and annual trends. As expected for a site at 33° N, temperature oscillated annually with a peak in August and trough in January (Fig. 1A). The highest average temperature occurred in 2018 with an annual mean of 18.05 °C. As described previously, nutrient availability showed a strong seasonal anti-correlation with temperature (Fagan et al., 2019; Martiny et al., 2016) as well as clear monthly and annual differences (ANOVA p < 0.05; Fig. S2). Temperature correlations with other parameters differ on weekly, monthly, and annual timescales (Fig. S3). Temperature dynamics covaried with macronutrients. Macronutrient concentrations demonstrate clear patterns. Phosphate concentrations appeared to have a 3-year systematic shift, going from approximately 0.2 µM and steadily increasing to approximately 0.6 µM (Fig. 1B). This pattern was seen from 2016 to 2019, and again from 2019 to 2022, with a quick drawdown occurring winter 2018/2019 corresponding to an increase in chlorophyll. Phosphate was highest during the winter months, and lowest during the late summer. Weekly phosphate was correlated with temperature and nitrate (Fig. S3A). Nitrate concentrations shift on annual and seasonal cycles (Fig. 1C). Generally, nitrate was highest (with the least amount of variation) in 2018 and lowest (with the highest variation) in 2022 (Fig. S2). Nitrate was correlated with weekly temperature, phosphate, and (Fig. S3A). Nitrate and phosphate, on monthly scales, were correlated with each other, and temperature (Fig. S3B). In late 2017 to 2019, nitrate and phosphate were consistently higher than during the late 2019 to 2021 timeframe. Chlorophyll follows a seasonal cycle with peaks during period of low nutrients, possibly responding their drawdown of nutrients for growth. Dynamic environmental conditions at MICRO could have strong impacts on biological parameters leading to distinct patterns.
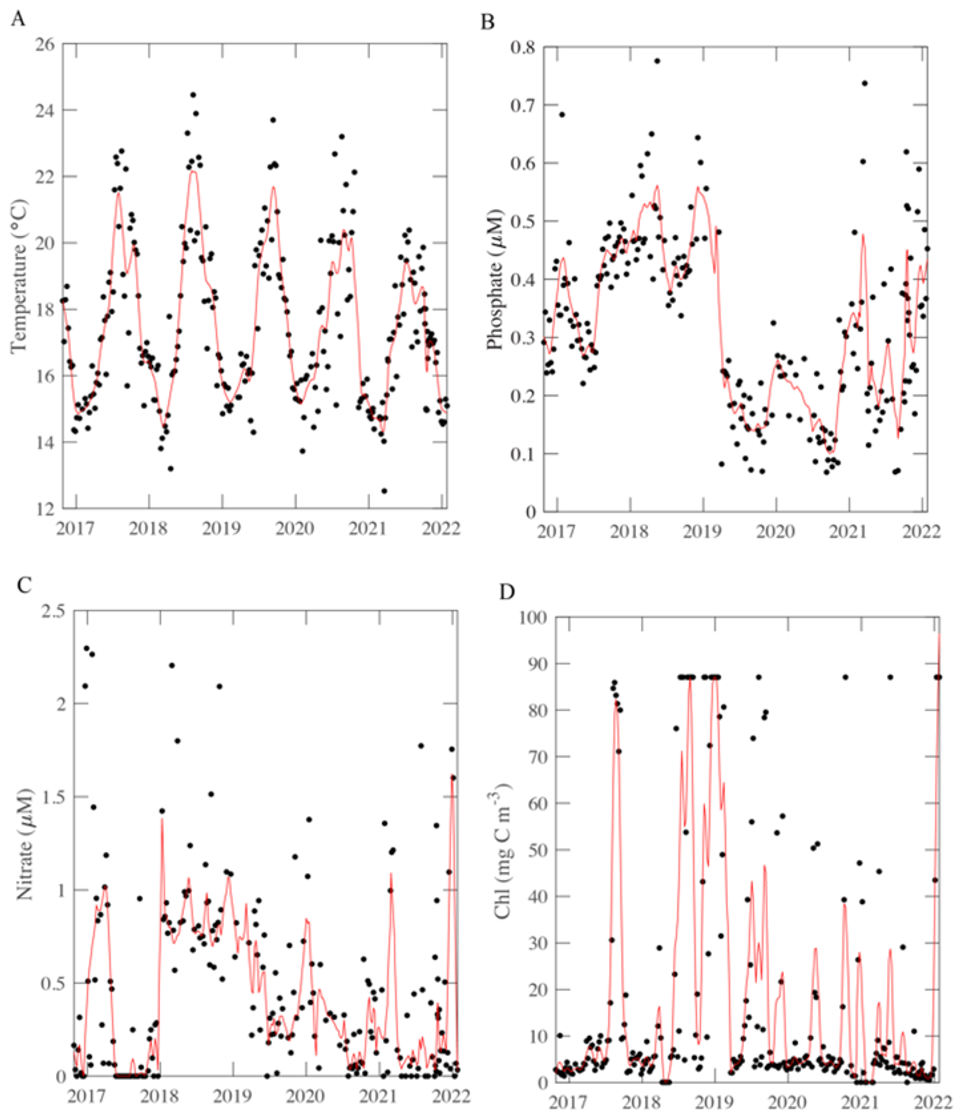
Figure 1Environmental conditions, macronutrient, and chlorophyll concentrations (A–D) over time at MICRO study site in Newport Pier, Newport, CA. The solid black points represent the average data per week from the period 26 October 2016 to 31 January 2022. The red line represents an 8-point moving average.
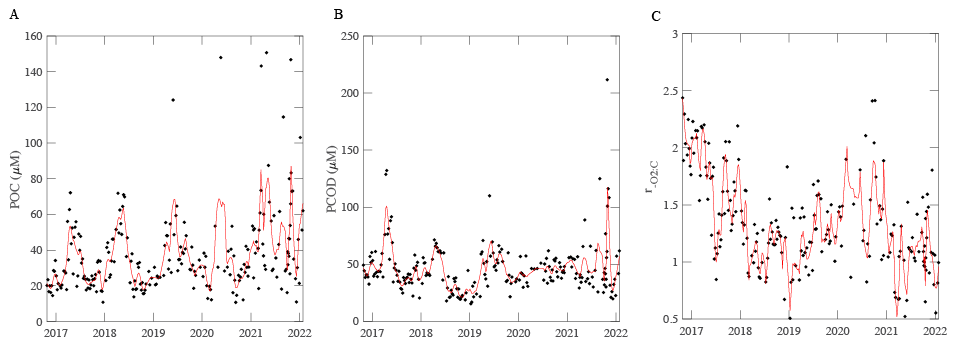
Figure 2POM concentrations (A, B) and respiration quotient (C) over time at MICRO study site. The solid black points represent the average data per week from the period 26 October 2016 to 31 January 2022. The red line represents an 8-point moving average for (A) and (B), and a MATLAB “rlowess” for C moving average. The respiration quotient is a molar ratio.
POM concentrations also demonstrated short-term, seasonal and annual variation. [POC] and [PCOD] concentrations peaked during the spring bloom period (May) and oscillated annually (Figs. 2A, B and S2, S3). Generally, [POC] had similar variability to [PCOD] (r2=0.70 and p-value < 0.05; Fig. 2A, B). [POC] appeared to be increasing through time with the highest annual average occurring in 2022. [POC] correlated with physical conditions (Fig. S3). [PCOD] was significantly higher in April and May (Fig. S2). [PCOD] also had its highest annual average in 2022. Annually [PCOD] covaried with temperature (Fig. S3C). However, where [POC] was lowest in 2020, [PCOD] had a minimum in 2018 (Fig. S3). Overall, biological parameters showed similar multiannual oscillations as environmental conditions, indicating consistency between the two.
3.2 Coastal ratios
The respiration quotient showed clear temporal variation but with no significant seasonality. The average ratio was 1.34, which was statistically higher (t-test, p-value < 0.05) than Redfield (1), Anderson (1.1), and previous open ocean estimates (1.16; Moreno et al., 2022). Although the average was higher, the range in values was smaller compared to open ocean samples. Generally, the highest monthly were found in February and September (Fig. S4). However, the highest weekly peak occurred in January and into February 2020, when [POC] values were low (Fig. 2C). The lowest average annual (0.99) was measured in 2022. Additionally, a multi-year (∼ 3 year) trend was detected, whereby decreased from 2016 to 2020 and concentrations peak at 1.85 (Fig. 2C). Weekly nitrate and [POC] were found to correlated with changing (Fig. S4). We found distinct variation in the respiration quotient ratio at the MICRO site.
We assessed links between environmental changes using a multi-dimensional principal component analysis (Fig. 3). As shown above, changes in environmental conditions covary and be associated with changes in particulate organic matter (Fig. S3). We explicitly accounted for this co-variance using principal components (PC) and linked each PC to variation. Our PC analysis explained ∼ 81 % of the variance. The environmental parameters used within the multi-dimensional analysis were temperature, phosphate, nitrate, and chlorophyll concentrations. Our first principal component (PC1) represented blooming conditions (i.e., positive chlorophyll) representing 50 % of overall variance. PC2 captured the environmental axis, dominated by seasonality (∼ 31 %; Fig. 3). Thus, PC2 corresponded to a decreased temperature with negative values and increased nutrient concentration with positive. Specifically, high ratios can be found under low nitrate and chlorophyll concentrations. Similar to open ocean analysis, when only considering a single environmental parameter, nitrate concentrations control such that increased is present during nitrogen stress (p-value = 0.0207, r2=0.023). Our analysis demonstrated an anti-correlation with environmental conditions which suggests that higher is present under high temperature and low nutrient conditions. This corresponds to blooming behavior. As nutrients stimulate bloom formation was low, and as blooms dissipate, the increased. Hence, is shifting based on the environmental changes.
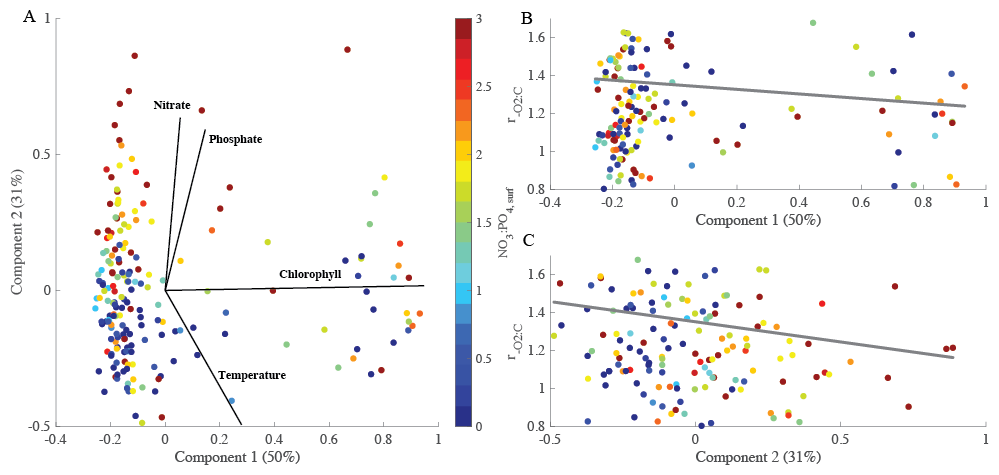
Figure 3PCA analysis of to determine the overall controlling factors. (A) PCA of four environmental variables (nitrate concentrations, phosphate concentrations, chlorophyll concentrations, and temperature) over 5-years at the MICRO site. (B, C) explained by the first and second principal component including the based on linear regression analysis. The percentages of total variance represented by principal component (PC) 1 and 2 are shown in parentheses. Colored dots represent the NO3 : PO4, surf concentration. Grey solid lines represent regression lines with r2 = 0.0003 (B) and 0.012 (C).
3.3 Large Phytoplankton Abundance
Large harmful algal bloom (HAB) phytoplankton abundance demonstrated clear shifts over the time-series. California experienced seasonal and environmentally driven HAB blooms. Ten HAB species and two categories of large phytoplankton (Table 1) were quantified and compared over our time-series to determine if community structure plays a role in variation. Seasonal cycling can be observed in Prorocentrum, Pseudo-nitzschia (PN) delicatissima, PN seriata, “Other Diatoms”, and “Other Dinoflagellates” (Fig. S5). Whereas other species, i.e. Akashiwo, Alexandrium, Cochlodinium and Gymnodinium, are observed sparingly. On weekly timescales, Akashiwo had a positive relationship with chlorophyll a concentration (p-value = 0.004, r = 0.03), whereas “Other Dinoflagellates” has a negative relationship (p-value = 0.032, r = −0.02). On monthly timescales, the “Other Diatoms” and “Other Dinoflagellates” made up 50 % to 80 % of total phytoplankton (Fig. 4A). Following this majority, we observed significant concentrations of Prorocentrum, PN delicatissima and PN seriata. During typical blooms months (spring and August) we estimated a higher presence of species, with an increase in a few species during these months. Similarly, annual relative phytoplankton abundance observations were highly dominated by “Other Diatoms” and “Other Dinoflagellates” (Fig. 4B). Akashiwo, Alexandrium, and Dinophysis were found in very low concentration throughout the time-series, however, evidence shows their impact could be great even so. Species sampling was paused from March to June 2020, which may explain the lowest diversity compared with other years. In 2021, the “Other” categories were at their lowest at 40 % of the total phytoplankton present. Additionally, in 2021 and 2022, Lingulodinium's relative abundance becomes a significant part of the breakdown at approximately 15 % to 20 %. Accordingly, we observed clear shifts in the phytoplankton community composition and corresponding relative abundance of larger cell volume species over our time-series.
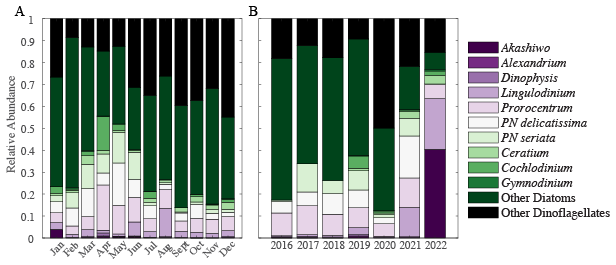
Figure 4Monthly (A) and annual (B) large phytoplankton relative abundance. Each color represents a different species, genus, or category of diatom or dinoflagellate.
Table 1Quantified genius and category of large harmful algal bloom phytoplankton.
Shifts in community structure impact dynamics. Akashiwo sanguinea, on a weekly basis, was found to positively correlate with (r = 0.18, p-value < 0.05) and “Other Dinoflagellates” were found to have a negative relationship (r = −0.14, p-value < 0.05). Mean is associated with months that contain more diverse relative abundance in large phytoplankton (January, April, and August; Figs. S4 and 4). In March and May, “Other Diatoms” and “Other Dinoflagellates” decline in abundance, and this correlated to months with the lowest . Comparatively, during these months Pseudo-nitzschia species are in highest relative abundance. This result is expected as upwelling replaces the surface with cooler nutrient rich waters stimulating plankton growth. In January, Akashiwo sanguinea is present in observable concentrations and associated with lower (Figs. 4 and S6A). Akashiwo sanguinea are similar in size to Pseudo-nitzschia delicatissima, which may provide evidence of a relationship between cell size and variation in . We found additional general trends which provide a possible line of evidence for future work (Fig. S6B). In 2016 and 2020, the relative abundance of “Other Diatoms” and “Other Dinoflagellates” is approximately 80 % of the total and was associated with high values (Figs. 4 and S4). However, in years with high distinct diversity (2019 and 2021), where “Other Diatoms” and “Other Dinoflagellates” relative abundance is low, the average is low (Fig. 4). As such, we demonstrate that community structure shifts can play a role in the average and its variability.
3.4 Orange County 2021 Oil Spill
The oil spill event had an impact on . There was no immediate response in to the oil spill following the first day of its occurrence (Fig. 5). However, in the following days (approximately a 2 d later), an increase in the [POC] and [PCOD] persisted until the beginning of November. However, there is a slight discrepancy between [POC] and [PCOD] in the first few November measurements (Fig. 5). [POC] continued to peak in the first week before starting to come down, whereas [PCOD] started to decrease immediately. show similar trends- increases after a 2 d lag. recovery is complicated to quantify; however, it appears that values are slightly lower but within range of pre-oil spill concentrations. Statistically, there is no difference in average between 3-months before, 1-month while oil was present in samples (during), and 3-month after. Intriguingly, when compared with other years (2019, 2020, and 2021), the 2021 oil spill year did have overall lower averages (Fig. S7). in 2020 has the highest concentrations for this comparative period. However, due to the range within the time periods, there is no statistical annual differences. Thus, the oil spill does appear to influence variability, though more research is needed to fully disentangle the mechanistic controls.
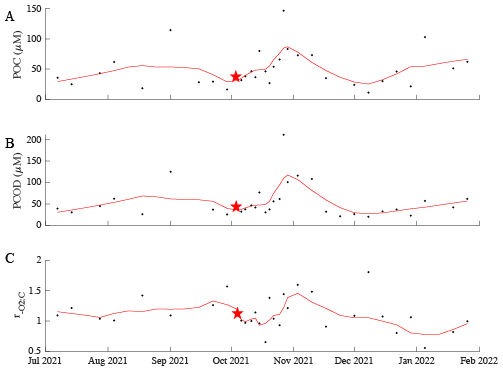
Figure 5Biological parameters (A – POC, B – PCOD, and C – ) from 1 July 2021 to 31 January 2022. This represents a 3-months before to 3-months after the oil spill occurrence. The red line represents an 8-point moving average. The red star marks the start of the oil spill.
We find evidence that nutrient limitation controls the patterns in the coastal MICRO study site. Direct quantifications of environmental parameters, large HAB forming phytoplankton relative abundance, and the allowed us to disentangle patterns and hypotheses to determine the relative control of abiotic vs. biotic processes in a coastal environment. It was previously proposed that temperature and nutrient availability are the two main environmental controls that have been shown to influence the respiration quotient in surface open ocean communities (Moreno et al., 2020, 2022). Within this dynamic location, we have quantified a larger average ratio () compared to open ocean samples (; Moreno et al., 2022). This is relatively equivalent to an increase in 18 % of oxygen consumed per organic carbon in coastal waters. We find that low nitrate and chlorophyll concentrations correspond to a higher [PCOD] and lower [POC] resulting in higher (Figs. 1 and 2). Similar to previous open ocean shifts, nitrogen stress corresponded to higher ratios (Moreno et al., 2022). A higher could lead to a decreased oxygen content deeper in the water column, as surface particles sink. Many microalgae under N stress will increase their lipid content (Juneja et al., 2013; Reitan et al., 1994; Thompson et al., 1992) consequently increasing their average . This is one possible line of evidence as to why we found an increased ratio. Changes in nutrients will result in a physiological response that can change the chlorophyll concentrations for the overall community; it can also shift the community structure toward species that require less N. Our results indicate an interaction between N stress and chlorophyll a, which corresponds to a response in .
Our data suggests that is also directly influenced by the community structure (Fig. 4). Large phytoplankton have been hypothesized to have a lower on average compared to small phytoplankton (Moreno et al., 2022). We estimated the average functional group based on an allometric relationship with molecular components- primarily lipid, carbohydrate, and protein concentrations (Moreno et al., 2022). Here, we found that was high in years where relative abundance of “Other Diatoms” and “Other Dinoflagellates” are high (2016 and 2020). An increase in lipid storage will increase their range and add variability. Although dinoflagellates are estimated to have an average (average size and protein rich flagella), they also have storage capabilities. Similar to diatoms, during stress an increase in lipid storage in dinoflagellates will increase their range. Shifts in physiological response by larger phytoplankton under stress could impact variable in this region. Additionally, changes in cyanobacterial ecotypes could also affect . Previous time-series studies of cyanobacteria have demonstrated interannual patterns in ecotype relative abundance and seasonal switching in ecotype occurring in response to rapid environmental changes (Larkin et al., 2020; Malmstrom et al., 2010; Nagarkar et al., 2018; Tai and Palenik, 2009). Although ecotypes are genetically similar, physiological and morphologically differences exist. Additionally, intracellular metabolites that are involved in methylating DNA, RNA, and proteins differ in culture and effect metabolism differently per ecotype (Kujawinski et al., 2023). Under nutrient replete conditions Prochlorococcus and Synechococcus C : P and N : P ratios range from 121–165 and 21–33 (Bertilsson et al., 2003), demonstrating significant variation in cellular composition. Further, cellular quotas of Prochlorococcus and Synechococcus in the North Atlantic varied significantly demonstrating species diversity and size distributions within the surface community (Baer et al., 2017). Although we do not quantify cyanobacteria in this study, previous published work at the MICRO site with a short overlapping window agrees with an ecotype shift being captured (Larkin et al., 2020). Our 2016 to 2018, ratios overlap with the Larkin data (Fig. 4) and as expected is highest in 2016 when Prochlorococcus HLI is in highest abundance. As Synechococcus IV dominates the region, the ratio decreases. Prochlorococcus HLI dominate the cyanobacterial community under high temperature and lower nitrate concentration, whereas Synechococcus IV dominate in lower temperatures and higher nitrate. As Synechococcus IV dominates the region, the ratio decreases. The shift in dominating cyanobacteria under it optimal conditions could result in a shift in the bulk chemical composition, in turn the POC concentration and . We suggest that a shift in environmental conditions will impact the surface community composition and could add variation to .
Trophic structure and detrital matter could also influence variability. Zooplankton and heterotrophic bacteria can makeup ∼ 50 % of surface organic matter (Martiny et al., 2016). The relative presence and abundance of heterotrophic organisms are important in breaking down particles and setting POC concentrations. For example, POC is comprised of ∼ 5 % to 30 % lipids (Behrendt et al., 2024; Hedges et al., 2001; Wakeham et al., 1997) and up to 25 % detrital matter (Kaiser and Benner, 2008; Martiny et al., 2016). In a recent study, bacterial degradation rates differed based on lipid content and bacterial preference (Behrendt et al., 2024). Some bacteria were highly selective and targeted specific lipid classes, whereas others did not (Behrendt et al., 2024). Preferential remineralization can occur (e.g., particulate organic phosphorus (Gundersen et al., 2002) and phosphonates (Benitez-Nelson et al., 2004). While the physiological mechanisms for this preferential remineralization are still being researched, its presence could have strong impacts on the fate of detrital matter in surface waters, particularly in dynamic coastline. These variations in POM remineralization and thus, oxygen consumption, can be reflected in the . Similarly, the quality and quantity of detrital matter captured in the POM will also have an impact. Although, regional shifts in the fraction and quality of the detrital matter are currently unknown, previous estimates found that detritus and terrestrially derived particles make-up a small contribution of POC (Martiny et al., 2016). However, as grazers messily breakdown organic matter, produce fecal pellets, and reproduce, the composition of POC is changing. A shift in organic C caused by trophic interactions and/or detrital matter will result in a one directional shift in .
Crude oil does not directly affect ratios but appears to indirectly affect the community dominance. do not show a significant impact compared with a three-month period before and after (Figs. 5 and S6). Instead, a two-day lag in ratios exist (Fig. 5), which could be attributed to a community response to the amount and type of oil present. Hydrocarbon degrading bacteria are always present in small concentrations in most coastal regions, especially in highly anthropogenically impacted coastlines. Incubation experiments found large significant shifts in both bacterial and archaeal communities in seawater (Aktas et al., 2013). After the initial oil spill day, our [PCOD] and [POC] increased resulting in a slight increase. This response could be due to the continued increase in oil concentrations and its effect on the community. Increased oil can preferentially cause certain bacterial and archaeal species to bloom and affect the rate of degradation- some compounds will degrade quickly and others extremely slowly (Leahy and Colwell, 1990). As the oil is degraded to low concentrations (or background values in our coastal setting), ratios taper off to normal values and behaviors. Although does not show large shifts during the oil spill, there is evidence that oil presence does indirectly impact ratios through community shifts and their physiological responses.
There are multiple caveats to be considered within this study that could affect the overall findings. The most prominent and obvious is the extremely high respiration quotient ratios. We quantify ratios that are higher than previously measured and expected. Within our data, higher ratios typically corresponded to higher [PCOD] rather than a lower [POC]. One possibility that needs to be explored in the future is if our [PCOD] assay is capturing the oxidation of iron (Fe) and/or biogenic sulfur (S) on samples. Trace concentrations of either would be difficult to explicitly quantify from samples taken. Dissolved Fe is a main limiting nutrient along the California Current system (Hutchins et al., 1998). However, iron from continent margin sediments have been shown to affect primary production and carbon export in the Pacific Ocean (Johnson et al., 1999; Lam et al., 2006). A small fraction of the sediment-derived Fe remains in solution as organic ligands (Homoky et al., 2021; Kondo and Moffett, 2015) or in suspension as colloids or nanoparticles (Krachler et al., 2012; Pan et al., 2011). Sulfur, on the other hand, makes up about 1 % of organismal dry weight and is rarely limited in the ocean. There is a large variation in its oxidation state, ranging from completely reduced (−2) to completely oxidized (+6). Inorganic sulfur compounds thiosulfate and sulfite can be transformed to hydrogen sulfide and sulfate by bacteria making these S species readily available. Additionally, organic hydrogen sulfides like sulfur-containing amino acids, dimethylsufoniopropinate and 2,3-dihydroxypropane-1 sulfonate are also highly present in surface waters and play vital roles in sulfur cycling (Hu et al., 2018). In natural respiration processes, Fe reduction precedes sulfate reduction. However, within our assay dichromate is a powerful oxidate and could be used to oxide reduced Fe and S, resulting in high . Although this is still to be considered, [PCOD] is more constrained than [POC] throughout the time-series (Fig. 2), so if we are oxidizing either element, it is being done uniformly. Another caveat we recognize is the lack of sample blanking, which could introduce some bias. However, previously we touched upon the idea that sample blanking is not important for open ocean samples because of the high volume filtered (Moreno et al., 2022). Due to high biomass within coastal waters, the filtered volume within this study is smaller (300 mL compared to 2 L vs. 8 L). The minimal variation in [PCOD], provides evidence that blanking would also not play a strong role in quantifying the . Our third caveat is the presence of non-biological material (i.e., sand or dirt). During periods of higher biomass, darker filters are observed. High biomass filters can become packed or overloaded, allowing for higher rates of excess biological and non-biological material (including nanoparticles) present on filters. Note that darker filters are not equivalent to higher ratios. Although there are a few recognized caveats, our findings are bringing new insights into coastal variation and are robust.
Our study suggests that the is controlled by plankton's response to nutrient stressors in this coastal ecosystem. High along the coast has very strong implications on future hypoxic region expansions and general ecosystem health. Here, increased could lead to increase oxygen consumption by grazers and bacteria. Given future rising surface ocean temperatures (Di Lorenzo et al., 2005; Durack et al., 2018; Kwiatkowski et al., 2020; Xu et al., 2022) and continued changes to nutrients, dynamics further the complexities of coastal deoxygenation. Both direct (nutrient concentrations) and indirect (community shifts) controls play important roles in setting and therefore future oxygen levels. Although much research is still needed to understand the mechanistic responses to nutrients and its effects on coastal oxygen levels, changes to community structure appear to have an impact on variable in this dynamic region. As shown in our study the average is 18 % higher than open ocean measurements. With increased temperatures and decreased nutrients due to climate change, we may observe increased coastal deoxygenation events at a higher frequency than in the open ocean. The potentially devastating impacts of increased events threaten the health and livelihood of surrounding communities that rely to tourism, fishing, and other ecosystem services. The respiration quotient is a grazer proxy for oxygen consumption during the breakdown of organic C. Ultimately, the MICRO is higher than previously measured open ocean samples. Our findings have strong implications for future respiration and oxygen cycling. Future research is needed to examine other coastal environments under a changing climate to understand the severity of coastal deoxygenation and determine if this study site is anomalous.
Environmental data are available via the MICRO BCO-DMO data page (DOI: https://doi.org/10.26008/1912/bco-dmo.564351.3) and within the Supplement (Table S1).
The supplement related to this article is available online at https://doi.org/10.5194/bg-22-7915-2025-supplement.
ARM and ACM designed the time-series. ARM and AJF collected and analyzed samples. ARM prepared the manuscript with contributions and edits from all co-authors.
The contact author has declared that none of the authors has any competing interests.
Publisher's note: Copernicus Publications remains neutral with regard to jurisdictional claims made in the text, published maps, institutional affiliations, or any other geographical representation in this paper. While Copernicus Publications makes every effort to include appropriate place names, the final responsibility lies with the authors. Views expressed in the text are those of the authors and do not necessarily reflect the views of the publisher.
We thank all undergraduate students through the years that participated at the MICRO time-series, as well as Alyse Larkin for their assistance in editing our manuscript.
This research has been supported by NSF GRFP, UCI Chancellor's Club Fellowship, and the UCLA Chancellor's Postdoctoral Fellowship to ARM as well as NSF OCE-2135035 and NSF-OCE 1948842 to ACM.
This paper was edited by Mark Lever and reviewed by two anonymous referees.
Aktas, D. F., Lee, J. S., Little, B. J., Duncan, K. E., Perez-Ibarra, B. M., and Suflita, J. M.: Effects of oxygen on biodegradation of fuels in a corroding environment, International Biodeterioration and Biodegradation, 81, 114–126, https://doi.org/10.1016/j.ibiod.2012.05.006, 2013.
Anderson, L. A.: On the hydrogen and oxygen content of marine phytoplankton, Deep Sea Research Part I: Oceanographic Research Papers, 42, 1675–1680, https://doi.org/10.1016/0967-0637(95)00072-E, 1995.
Baer, S. E., Lomas, M. W., Terpis, K. X., Mouginot, C., and Martiny, A. C.: Stoichiometry of Prochlorococcus, Synechococcus, and small eukaryotic populations in the western North Atlantic Ocean, Environmental Microbiology, 19, 1–23, https://doi.org/10.1111/1462-2920.13672, 2017.
Behrendt, L., Alcolombri, U., Hunter, J. E., Smriga, S., Mincer, T., Lowenstein, D. P., Yawata, Y., Peaudecerf, F. J., Fernandez, V. I., Fredricks, H. F., Almblad, H., Harrison, J. J., Stocker, R., and Van Mooy, B. A. S.: Microbial dietary preference and interactions affect the export of lipids to the deep ocean, Science, 385, eaab2661, https://doi.org/10.1126/science.aab2661, 2024.
Benitez-Nelson, C. R., O'Neill, L., Kolowith, L. C., Pellechia, P., and Thunell, R.: Phosphonates and particulate organic phosphorus cycling in an anoxic marine basin, Limnology and Oceanography, 49, 1593–1604, https://doi.org/10.4319/lo.2004.49.5.1593, 2004.
Bertilsson, S., Berglund, O., Karl, D. M., and Chisholm, S. W.: Elemental composition of marine Prochlorococcus and Synechococcus: Implications for the ecological stoichiometry of the sea, Limnology and Oceanography, 48, 1721–1731, https://doi.org/10.4319/lo.2003.48.5.1721, 2003.
Bograd, S. J., Castro, C. G., Di Lorenzo, E., Palacios, D. M., Bailey, H., Gilly, W., and Chavez, F. P.: Oxygen declines and the shoaling of the hypoxic boundary in the California Current, Geophysical Research Letters, 35, 1–6, https://doi.org/10.1029/2008GL034185, 2008.
Brock, M. L., Tavares-Reager, J. F., Dong, J., Larkin, A. A., Lam, T., Pineda, N., Olivares, C. I., Mackey, K. R. M., and Martiny, A. C.: Bacterial response to the 2021 Orange County, California, oil spill was episodic but subtle relative to natural fluctuations, Microbiol Spectr., 13, https://doi.org/10.1128/spectrum.02267-24, 2025.
Di Lorenzo, E., Miller, A. J., Schneider, N., and McWilliams, J. C.: The Warming of the California Current System: Dynamics and Ecosystem Implications, Journal of Physical Oceanography, 35, 336–362, https://doi.org/10.1175/JPO-2690.1, 2005.
Durack, P. J., Gleckler, P. J., Purkey, S. G., Johnson, G. C., Lyman, J. M., and Boyer, T. P.: Ocean Warming: From the Surface to the Deep in Observations and Models, Oceanography, 31, 41–51, 2018.
Fagan, A. J., Moreno, A. R., and Martiny, A. C.: Role of ENSO Conditions on particulate organic matter concentrations and elemental ratios in the Southern California Bight, Frontiers in Marine Science, 6, 1–8, https://doi.org/10.3389/fmars.2019.00386, 2019.
Falkowski, P.G., Algeo, T., Codispoti, L., Deutsch, C., Emerson, S., Hales, B., Huey, R.B., Jenkins, W.J., Kump, L.R., Levin, L.A., Lyons, T.W., Nelson, N.B., Schofield, O.S., Summons, R., Talley, L.D., Thomas, E., Whitney, F., and Pilcher, C.B.: Ocean Deoxygenation: Past, Present, and Future, Eos Trans Am Geophys Union, 92, https://doi.org/10.1029/2011EO460001, 2011.
Fuentes, S., Barra, B., Gregory Caporaso, J., and Seeger, M.: From rare to dominant: A fine-tuned soil bacterial bloom during petroleum hydrocarbon bioremediation, Applied and Environmental Microbiology, 82, 888–896, https://doi.org/10.1128/AEM.02625-15, 2016.
Gerace, S. D., Fagan, A. J., Primeau, F. W., Moreno, A. R., Lethaby, P., Johnson, R. J., and Martiny, A. C.: Depth Variance of Organic Matter Respiration Stoichiometry in the Subtropical North Atlantic and the Implications for the Global Oxygen Cycle, Global Biogeochemical Cycles, 37, e2023GB007814, https://doi.org/10.1029/2023GB007814, 2023.
Gundersen, K., Heldal, M., Norland, S., Purdie, D. A., and Knap, A. H.: Elemental C, N, and P cell content of individual bacteria collected at the Bermuda Atlantic Time-Series Study (BATS) site, Limnology and Oceanography, 47, 1525–1530, 2002.
Hazen, T. C., Dubinsky, E. A., DeSantis, T. Z., Andersen, G. L., Piceno, Y. M., Singh, N., Jansson, J. K., Probst, A., Borglin, S. E., Fortney, J. L., and Stringfellow, W. T.: Deep-Sea Oil Plume Enriches Indigenous Oil-Degrading Bacteria, Science, 330, 204–209, 2010.
Hedges, J. I., Baldock, J. A., Gelinas, Y., Lee, C., Peterson, M., and Wakeham, S. G.: Evidence for non-selective preservation of organic matter in sinking marine particles, Nature, 409, 801–804, 2001.
Homoky, W. B., Conway, T. M., John, S. G., König, D., Deng, F. F., Tagliabue, A., and Mills, R. A.: Iron colloids dominate sedimentary supply to the ocean interior, Proceedings of the National Academy of Sciences of the United States of America, 118, https://doi.org/10.1073/PNAS.2016078118, 2021.
Hu, X., Liu, J., Liu, H., Zhuang, G., and Xun, L.: Sulfur metabolism by marine heterotrophic bacteria involved in sulfur cycling in the ocean, Science China Earth Sciences, 61, 1369–1378, https://doi.org/10.1007/s11430-017-9234-x, 2018.
Hutchins, D. A., DiTullio, G. R., Zhang, Y., and Bruland, K. W.: An iron limitation mosaic in the California upwelling regime, Limnology & Oceanography, 43, 1037–1054, https://doi.org/10.4319/lo.1998.43.6.1037, 1998.
Johnson, K. S., Chavez, F. P., and Friederich, G. E.: Continental-Shelf sediment as a primary source of iron for coastal phytoplankton, Nature, 398, 697–700, 1999.
Jones, M. N.: Nitrate reduction by shaking with cadmium. Alternative to cadmium columns, Water Research, 18, 643–646, https://doi.org/10.1016/0043-1354(84)90215-X, 1984.
Juneja, A., Ceballos, R. M., and Murthy, G. S.: Effects of environmental factors and nutrient availability on the biochemical composition of algae for biofuels production: A review, Energies, 6, 4607–4638, https://doi.org/10.3390/en6094607, 2013.
Kaiser, K. and Benner, R.: Major bacterial contribution to the ocean reservoir of detrital organic carbon and nitrogen, Limnology and Oceanography, 53, 1192, https://doi.org/10.4319/lo.2008.53.3.1192, 2008.
Karl, D. M. and Tien, G.: MAGIC: A sensitive and precise method for measuring dissolved phosphorus in aquatic environments, Limnology and Oceanography, 37, 105–116, https://doi.org/10.4319/lo.1992.37.1.0105, 1992.
Keeling, R. E., Körtzinger, A., and Gruber, N.: Ocean deoxygenation in a warming world, Annual review of marine science, 2, 199–229, https://doi.org/10.1146/annurev.marine.010908.163855, 2010.
Knap, A., Michaels, A., Dow, R., Johnson, R., Gundersen, K., Sorensen, J., Close, A., Howse, F., Hammer, M., Bates, N., Doyle, A., and Waterhouse, T.: Bermuda Atlantic timeseries study methods manual (Version 3), Bermuda biological station for research, Inc., US JGOFS, Intergovernmental Oceanographic Commission (IOC), 1993.
Kondo, Y. and Moffett, J. W.: Iron redox cycling and subsurface offshore transport in the eastern tropical South Pacific oxygen minimum zone, Marine Chemistry, 168, 95–103, https://doi.org/10.1016/j.marchem.2014.11.007, 2015.
Krachler, R., Von Der Kammer, F., Jirsa, F., Süphandag, A., Krachler, R. F., Plessl, C., Vogt, M., Keppler, B. K., and Hofmann, T.: Nanoscale lignin particles as sources of dissolved iron to the ocean, Global Biogeochemical Cycles, 26, 1–9, https://doi.org/10.1029/2012GB004294, 2012.
Kujawinski, E. B., Braakman, R., Longnecker, K., Becker, J. W., Chisholm, S. W., Dooley, K., Kido Soule, M. C., Swarr, G. J., and Halloran, K.: Metabolite diversity among representatives of divergent Prochlorococcus ecotypes, mSystems, 8, e01261-22, https://doi.org/10.1128/msystems.01261-22, 2023.
Kwiatkowski, L., Torres, O., Bopp, L., Aumont, O., Chamberlain, M., Christian, J. R., Dunne, J. P., Gehlen, M., Ilyina, T., John, J. G., Lenton, A., Li, H., Lovenduski, N. S., Orr, J. C., Palmieri, J., Santana-Falcón, Y., Schwinger, J., Séférian, R., Stock, C. A., Tagliabue, A., Takano, Y., Tjiputra, J., Toyama, K., Tsujino, H., Watanabe, M., Yamamoto, A., Yool, A., and Ziehn, T.: Twenty-first century ocean warming, acidification, deoxygenation, and upper-ocean nutrient and primary production decline from CMIP6 model projections, Biogeosciences, 17, 3439–3470, https://doi.org/10.5194/bg-17-3439-2020, 2020.
Lam, P. J., Bishop, J. K. B., Henning, C. C., Marcus, M. A., Waychunas, G. A., and Fung, I. Y.: Wintertime phytoplankton bloom in the subarctic Pacific supported by continental margin iron, Global Biogeochemical Cycles, 20, 1–12, https://doi.org/10.1029/2005GB002557, 2006.
Larkin, A. A., Moreno, A. R., Fagan, A. J., Fowlds, A., Ruiz, A., and Martiny, A. C.: Persistent El Niño driven shifts in marine cyanobacteria populations, PLoS ONE, 15, 1–19, https://doi.org/10.1371/journal.pone.0238405, 2020.
Leahy, J. G. and Colwell, R. R.: Microbial degradation of hydrocarbons in the environment, Microbiological Reviews, 54, 305–315, https://doi.org/10.1128/mr.54.3.305-315.1990, 1990.
Lomas, M. W., Burke, A. L., Lomas, D. A., Bell, D. W., Shen, C., Dyhrman, S. T., and Ammerman, J. W.: Sargasso Sea phosphorus biogeochemistry: an important role for dissolved organic phosphorus (DOP), Biogeosciences, 7, 695–710, https://doi.org/10.5194/bg-7-695-2010, 2010.
Malmstrom, R. R., Coe, A., Kettler, G. C., Martiny, A. C., Frias-Lopez, J., Zinser, E. R., and Chisholm, S. W.: Temporal dynamics of Prochlorococcus ecotypes in the Atlantic and Pacific oceans, The ISME journal, 4, 1252–64, https://doi.org/10.1038/ismej.2010.60, 2010.
Martiny, A. C., Talarmin, A., Mouginot, C., Lee, J. A., Huang, J. S., Gellene, A. G., and Caron, D. A.: Biogeochemical interactions control a temporal succession in the elemental composition of marine communities, Limnology and Oceanography, 61, 531–542, https://doi.org/10.1002/lno.10233, 2016.
Matear, R. J. and Hirst, A. C.: Long-term changes in dissolved oxygen concentrations in the ocean caused by protracted global warming, Global Biogeochemical Cycles, 17, https://doi.org/10.1029/2002GB001997, 2003.
Moreno, A. R., Garcia, C. A., Larkin, A. A., Lee, J. A., Wang, W.-L., Moore, J. K., Primeau, F. W., and Martiny, A. C.: Latitudinal gradient in the respiration quotient and the implications for ocean oxygen availability, Proceedings of the National Academy of Sciences, 117, 202004986, https://doi.org/10.1073/pnas.2004986117, 2020.
Moreno, A. R., Larkin, A. A., Lee, J. A., Gerace, S. D., Tarran, G. A., and Martiny, A. C.: Regulation of the Respiration Quotient Across Ocean Basins, AGU Advances, 3, 1–12, https://doi.org/10.1029/2022AV000679, 2022.
Nagarkar, M., Countway, P. D., Du Yoo, Y., Daniels, E., Poulton, N. J., and Palenik, B.: Temporal dynamics of eukaryotic microbial diversity at a coastal Pacific site, ISME Journal, 12, 2278–2291, https://doi.org/10.1038/s41396-018-0172-3, 2018.
Pan, X. F., Yan, B. X., and Muneoki, Y.: Effects of land use and changes in cover on the transformation and transportation of iron: A case study of the Sanjiang Plain, Northeast China, Science China Earth Sciences, 54, 686–693, https://doi.org/10.1007/s11430-010-4082-0, 2011.
Redfield, A. C.: The biological control of the chemical factors in the environment, American Scientist, 46, 1–18, 1958.
Reitan, K. I., Rainuzzo, J. R., and Olsen, Y.: Effect of Nutrient Limitation of Fatty Acid and Lipid Content of Marine Microalgae, J. Phycol., 30, 972–979, 1994.
Schmidtko, S., Stramma, L., and Visbeck, M.: Decline in global oceanic oxygen content during the past five decades, Nature, 542, 335–339, https://doi.org/10.1038/nature21399, 2017.
Seubert, E. L., Gellene, A. G., Howard, M. D. A., Connell, P., Ragan, M., Jones, B. H., Runyan, J., and Caron, D. A.: Seasonal and annual dynamics of harmful algae and algal toxins revealed through weekly monitoring at two coastal ocean sites off southern California, USA, Environmental Science and Pollution Research, 20, 6878–6895, https://doi.org/10.1007/s11356-012-1420-0, 2013.
Sharp, J. H.: Improved analysis for “particulate” organic carbon and nitrogen from seawater, Limnology and Oceanography, 19, 984–989, https://doi.org/10.4319/lo.1974.19.6.0984, 1974.
Tai, V. and Palenik, B.: Temporal variation of Synechococcus clades at a coastal Pacific Ocean monitoring site, The ISME journal, 3, 903–915, https://doi.org/10.1038/ismej.2009.35, 2009.
Thompson, P. A., Guo, M., Harrison, P. J., and Whyte, J. N. C.: Effects of Variation in Temperature. II. on the Fatty Acid Composition of Eight Species of Marine Phytoplankton, Journal of Phycology, 28, 488–497, https://doi.org/10.1111/j.0022-3646.1992.00488.x, 1992.
Trainer, V. L., Pitcher, G. C., Reguera, B., and Smayda, T. J.: The distribution and impacts of harmful algal bloom species in eastern boundary upwelling systems, Progress in Oceanography, 85, 33–52, https://doi.org/10.1016/j.pocean.2010.02.003, 2010.
Varjani, S. J. and Gnansounou, E.: Microbial dynamics in petroleum oilfields and their relationship with physiological properties of petroleum oil reservoirs, Bioresource Technology, 245, 1258–1265, https://doi.org/10.1016/j.biortech.2017.08.028, 2017.
Venrick, E. L.: Phytoplankton in the California Current system off southern California: Changes in a changing environment, Progress in Oceanography, 104, 46–58, https://doi.org/10.1016/j.pocean.2012.05.005, 2012.
Wakeham, S. G., Lee, C., Hedges, J. I., Hernes, P. J., and Peterson, M. L.: Molecular indicators of diagenetic status in marine organic matter, Geochimica et Cosmochimica Acta, 61, 5363–5369, https://doi.org/10.1016/S0016-7037(97)00312-8, 1997.
Xu, T., Newman, M., Capotondi, A., Stevenson, S., Di Lorenzo, E., and Alexander, M. A.: An increase in marine heatwaves without significant changes in surface ocean temperature variability, Nat. Commun., 13, 7396, https://doi.org/10.1038/s41467-022-34934-x, 2022.
Yang, T., Nigro, L. M., Gutierrez, T., D'Ambrosio, L., Joye, S. B., Highsmith, R., and Teske, A.: Pulsed blooms and persistent oil-degrading bacterial populations in the water column during and after the Deepwater Horizon blowout, Deep-Sea Research Part II: Topical Studies in Oceanography, 129, 282–291, https://doi.org/10.1016/j.dsr2.2014.01.014, 2014.