the Creative Commons Attribution 4.0 License.
the Creative Commons Attribution 4.0 License.
 | 13 Feb 2026
Distribution and sea-to-air exchange of carbon monoxide in surface microlayer and subsurface seawater in the eastern marginal seas of China
Lin Yang
Bin Yang
Jing Zhang
Anja Engel
Sea-surface microlayer (SML) is the boundary interface between the atmosphere and ocean, exhibiting an enrichment of dissolved organic matter (DOM) and participating in sea-to-air gas exchange. However, how DOM enrichment in the SML controls the flux of several gases in sea-to-air exchange remains poorly understood. In our study, incubation experiments and in-situ investigation in the eastern marginal seas of China were conducted to determine the distribution of carbon monoxide (CO) and its production and consumption rates in the SML during winter. Chromophoric dissolved organic matter (CDOM) (92 %) and fluorescent dissolved organic matter (FDOM) (92 %) were frequently enriched in the SML during winter, and the enrichment of CO was lower than the enrichments of CDOM and FDOM. CO ranged from 0.48 to 2.81 nmol L−1 (1.22±0.85 nmol L−1) and 0.50 to 3.61 nmol L−1 (1.54±1.61 nmol L−1) in the subsurface layer (SSW) and the SML, respectively, with higher concentration observed in the SML due to CDOM enrichment. Enrichment in the SML was expressed as enrichment factors (EFs) defined as the ratio of values in the SML to those in the SSW. Although CO, CDOM and FDOM concentrations decreased from in-shore regions to open oceans, higher enrichment factors (EFs > 2) of CO and CDOM and FDOM in the SML were generally observed in the off-shore areas. Considering the photoproduction rate (mean value: 12.41 nmol L−1 d−1) of CO in the SML was significantly higher than that in the SSW (10.32 nmol L−1 d−1), the enrichment and concentration of CO in the SML showed diurnal variation, with higher values observed in the early afternoon. The flux of CO exhibited a significantly negative correlation with the CDOM absorption coefficient at 254 nm and marine-humic-like FDOM in the SML, suggesting that elevated DOM could stimulate the photoproduction of CO, but may also decrease sea-to-air CO exchange in the SML. Given the importance of the organic-rich SML as a diffusion layer in the air–sea exchange of climate-relevant gases and heat, understanding the layer's enrichment processes is crucial.
- Article
(6650 KB) - Full-text XML
-
Supplement
(712 KB) - BibTeX
- EndNote


Carbon monoxide (CO) is an indirect greenhouse gas, and it plays an important role in atmospheric chemistry (Nguyen et al., 2020). It is the predominant sink of hydroxyl radical (OH•, Conte et al., 2019; Cordero et al., 2019), which oxidizes pollutants and greenhouse gases (such as CH4) emitted to the atmosphere by human activities (Nguyen et al., 2020). The photodegradation of dissolved organic matter (DOM) is thought to be the main source of CO in the ocean (Stubbins et al., 2006), and the ocean acts as a net source of atmospheric CO (Mopper and Kieber, 2002). In addition, direct production of CO by phytoplankton has been observed in laboratory experiments (Troxler, 1972; Gros et al., 2009) and dark/thermal production was also inferred from modeling at Bermuda Atlantic Time Series (BATS, Kettle, 2005), and from incubations of water samples from the Delaware Bay (Xie et al., 2005) and St Lawrence estuary (Zhang et al., 2008). Microbial consumption and sea-to-air fluxes (Doney et al., 1995; Song et al., 2015) of CO are considered the primary sinks of oceanic CO (Zafiriou et al., 2003). The average annual sea-to-air flux accounted for 10 % of the global CO sinks estimated by Zafiriou et al. (2003), Conte et al. (2019) and Yang et al. (2024). In the ocean, CO acts as a microbial energy source that supports food webs, a link in carbon cycling that connects surface and deep waters, and a modulator of oxygen cycles. With increasing concern about atmospheric pollution and the potential role of CO, a primary goal of studying oceanic CO concentrations is to evaluate its long-term stability and distribution trends in the marine boundary layer (Conte et al., 2019; Xu et al., 2023), where the ocean and atmosphere exchange momentum, heat, moisture, and gases.
The ocean surface layer plays a vital role in climate change through the sea-to-air exchange of greenhouse gases (Engel and Galgani, 2016). The sea-surface microlayer (SML) is located at the sea-to-air interface and is considered to play a critical role in global biogeochemical cycles and climate change by regulating the sea-to-air exchange of gases and aerosol particles (Liss and Duce, 1997; Cunliffe et al., 2013). In addition, SML is exposed to the most intense solar radiation of any seawater layer, especially ultraviolet (UV) light, and shows significantly higher colored dissolved organic matter (CDOM) concentration and microbial abundances compared to the subsurface layer (SSW, Obernosterer et al., 2006; Obernosterer et al., 2008; Wurl et al., 2009; Yang et al., 2022). For decades, articles have emphasized the presence and enrichment of organic matter and gases (CO and DMS) in the SML (Liss and Duce, 1997; Orellana et al., 2011; Ma and Yang, 2023; Sugai et al., 2021), but it remains unclear how this is maintained whilst CO is lost to the atmosphere.
The role and response of the SML, along with the complex interplay of biological, geochemical, and physical processes, govern the transfer of CO from the SSW, where it can either be consumed by bacteria or released into the atmosphere. Generally, the sea-to-air flux is estimated from CO concentration in sea surface waters (2 to 10 m), but there is evidence that biogeochemical processes within the SML may also affect the CO flux (Sugai et al., 2021). CDOM enrichment in the SML relative to the SSW has been reported, with an enrichment factor (EF) range of 0.4 to 6.7 (Huang et al., 2015; Shaharom et al., 2018; Yang et al., 2022), and mediates all mass transfer across the SML (Rickard et al., 2019, 2022). Although intense solar radiation and enrichment of DOM may promote CO photoproduction involving SML (Cunliffe et al., 2013; Pereira et al., 2018; Sugai et al., 2021), and likely modify sea-to-air gas transfer velocity (kw) of CO and other gases (Pereira et al., 2018). However, CO-related data from the SML is especially scarce, and the fate of CO in the SML remains unknown, because of the sampling limitation (Engel et al., 2017). Our study hypothesized that SML-specific environmental changes (i.e., enrichment processes and biogeochemical processes) and the abundance and composition of DOM in the eastern marginal seas of China influence the rate of sea-to-air CO exchange, and they contribute to the formation of the marine boundary layer involved in atmospheric chemistry and climate regulation.
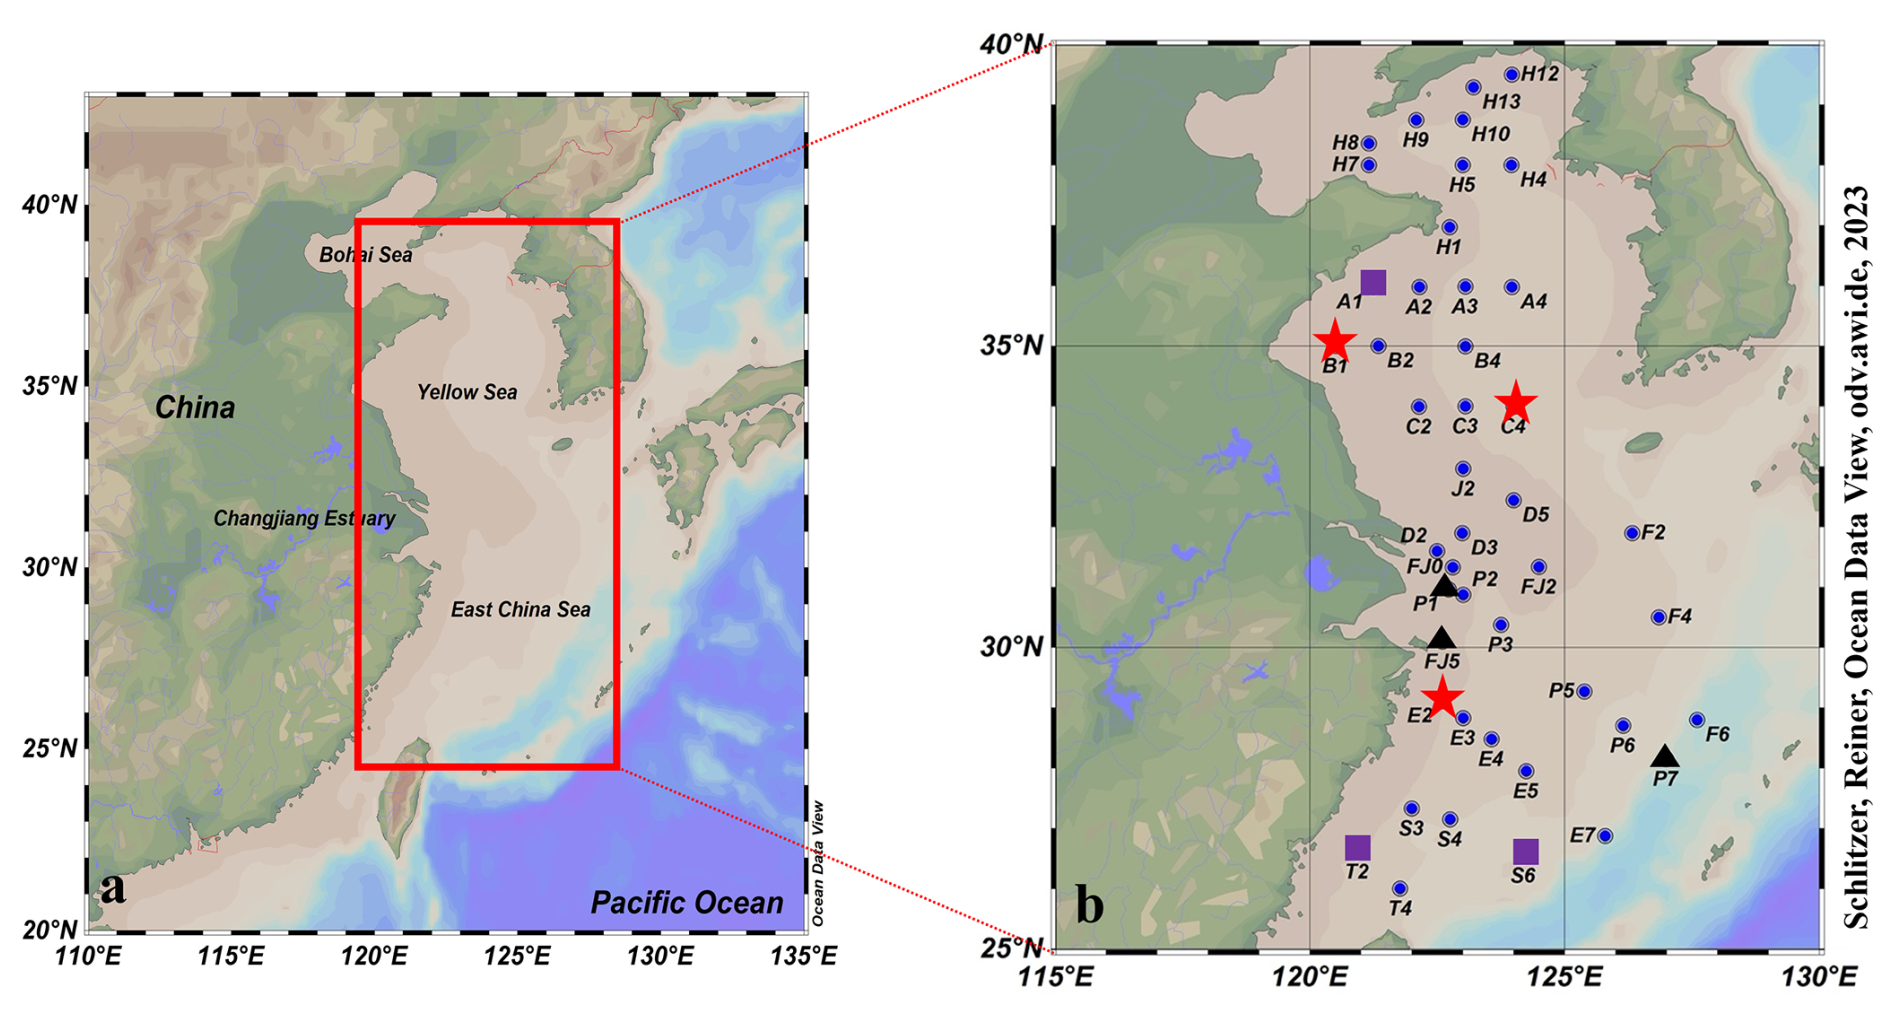
Figure 1Map of sampling stations in the East China Sea and the Yellow Sea during winter. Red box represented photochemical incubation experiment stations, and the purple rhomboid represented biological consumption experiment stations. ![]() : Stations for CO microbial consumption incubation experiments; ▴: Stations for CO photochemical production incubation experiments;
: Stations for CO microbial consumption incubation experiments; ▴: Stations for CO photochemical production incubation experiments; ![]() : Station for both CO microbial consumption and photochemical production incubation experiments;
: Station for both CO microbial consumption and photochemical production incubation experiments; ![]() : Stations only for seawater sampling.
: Stations only for seawater sampling.
2.1 Study area
The Yellow Sea (YS) and the East China Sea (ECS) are marginal seas of the western Pacific Ocean with complicated hydrological characteristics and are substantially affected by the Yellow Sea Cold Water Mass (YSCWM), the Kuroshio Current, and the coastal currents (Fig. 1). The YSCWM is a low-temperature (<10 °C) and high-salinity (32.0–33.0) water mass. Seawater in the Kuroshio presents high temperatures (20–29 °C), high salinities (34.2–34.8), and low suspended particulate concentrations (SPC) (<2 mg L−1) (Yang et al., 2022). The Changjiang River contributed more than 80 % of the total freshwater inflow to the YS and the ECS (Wang et al., 2020). In addition, the atmospheric circulation in the study area was generally governed by the East Asian monsoon, with strong northerly winds prevailing from September to April. Low pressure over the northwestern Pacific Ocean produced offshore winds that transported continental air masses into the study area (Li et al., 2019). This interaction significantly influences the hydrological conditions, circulation structures, material exchange, ecological environment, and the biogeochemical processes of CO and DOM in the region (Chen, 2009; Yu et al., 2025; Zhang et al., 2007).
2.2 Sampling and analysis
We collected 52 paired SML and SSW water samples in the YS and ECS aboard the R/V Dong Fang Hong 3 from 28 December 2019 to 16 January 2020. There were 38 sampling stations during the daytime (07:00–19:00 LT) and 32 sampling stations during the nighttime (19:00–07:00, Table S1 in the Supplement). SSW samples were collected at 2–5 m depth using 24×10 L Niskin bottles mounted on a rosette equipped with a conductivity–temperature–depth (CTD) profiler. SML sampling used a Garrett Screen (Garrett, 1965; Chen et al., 2016; Ma and Yang, 2023) (mesh: 16 mm, wire diameter: 0.36 µm; effective surface area: 2.025 cm2) according to standard procedures (Pereira et al., 2016; Sabbaghzadeh et al., 2017) when seawater conditions were calm. While SML integrity is disrupted by a moving vessel, or when sampling from its stern (Cunliffe and Wurl, 2014; Wurl et al., 2016), the SML can be successfully sampled from a vessel's bow while on-station (Sabbaghzadeh et al., 2017) with the ambient waterflow toward the RV (Cunliffe and Wurl, 2014). The sampling distance is at a certain distance (∼5–8 m) where the CTD sampler was deployed, and both SSW and SML CO did not change during the sampling. We therefore adopted this procedure, hand-deploying the Garrett Screen over the bow on the crest of a wave (Cunliffe and Wurl, 2014) and further minimizing potential contamination (engines off, wheelhouse and afterdeck downwind) (Pereira et al., 2016).
A TA3000R trace gas analyzer (Ametek, USA) was used to measure CO concentrations in the atmosphere and seawater with a lower detection limit of 10 ppbv. Before analysis, the instrument was calibrated using a CO standard gas (nominal concentration: 100 ppbv in zero-grade air; analytical accuracy: ±2 %, State Center for Standard Matter, China). The calibration was repeated every 6 h during measurements. Atmospheric CO samples ([CO]atm, ppbv) were collected about 10 m above sea level using a 10 mL gas-tight syringe (VICI, USA) and were obtained by injecting atmospheric samples directly into the instrument through a PTFE hydrophobic filter membrane (Millipore, USA, atmospheric CO samples were filtered for dust/aerosol particles) into the TA3000R trace gas analyzer for determination. To minimize the influence of ship emissions, [CO]atm samples were collected from the highest deck of the ship (∼10 m), facing the wind, with 8 mL gastight glass syringes when the ship was decelerating. CO in seawater was measured using the headspace equilibrium method (Xie et al., 2002), wherein a 50 mL sample bottle was filled with seawater sample and sealed (as above), and then an equivalent amount of the seawater sample was replaced with 8 mL of ultrahigh-purity N2 using a gas-tight syringe. The samples were then shaken at 300 r min−1 for 5 min to ensure that the nitrogen-filled headspace in the bottle reached gas-liquid equilibrium before 6 mL of the equilibrated gas was extracted using a gas-tight syringe and injected through a PTFE hydrophobic filter membrane (Millipore, USA) into the TA3000R trace gas analyzer for determination (the PTFE filter membranes were set up to prevent the potential entry of liquid water). The measured equilibrated headspace mixing ratio of CO (ppbv) was corrected using the saturated water vapor pressure and standard atmospheric pressure (Stubbins et al., 2006) and then converted to obtain the concentration of dissolved CO (nmol L−1) in seawater. The method's lower detection limit was 0.02 nmol L−1, with an analytical accuracy of better than 10 %.
CO data from the SML samples is scarce. The SML samples were collected in 500 mL brown sample bottles. The screen was held level and dipped into the sea surface, moved laterally to sample from an undisturbed film, and then withdrawn slowly from the surface. Repeated dipping (11 times, 600 mL) was conducted until the desired volume was collected (the depths of the SML samples ranged within 100–500 µm, Garrett, 1965). The screening method is often applied during field studies because of its relative quickness and large sample volume compared to other techniques (Chen et al., 2016). CO in seawater samples was collected and measured first on board, immediately after collection. A comparison showed that screen-collected samples usually exhibit greater microlayer enrichment of gas than the plate-collected samples, indicating that the screen sampler might be more effective for in-situ measurements (Yang et al., 2001). Although established sampling techniques of the SML (Garrett screen and glass plate) are associated with high losses for the volatile trace gases (Engel et al., 2017). As the Garrett screen is widely used and can collect a large number of SML samples in the short term (Walker et al., 2016; Yang et al., 2001), we chose the Garrett screen.
CDOM, DOC, and Chl a samples were filtered using 0.7 µm glass fiber filters (GF/F, Whatmann) and the filtrates were transferred to 60 and 40 mL brown glass bottles (pre-cleaned and pre-combusted) for later CDOM and DOC analyses. All samples were frozen (−20 °C) and protected from light. Upon arriving at the land laboratory, samples were analyzed as soon as possible. Sea-surface temperature and salinity were obtained from the sensors on the Seabird 911 CTD rosette. Seawater temperature and salinity in the SML were measured in situ using a pre-calibrated multi-parameter water quality probe (AP-5000, Aquaread Co., UK). Meteorological data (e.g., wind speed and air temperature, ∼10 m) were recorded simultaneously by a ship-borne weather instrument (Li et al., 2019, Table S1). Net solar radiation is the balance between all incoming and outgoing radiant energy fluxes at the Earth's surface. Our ocean surface net solar radiation was measured and recorded using a net radiometer (Table S1). Ocean surface net solar radiation is significant in research on the Earth's heat balance systems, sea-to-air interactions, and other applications.
2.3 Photoexposure experiments
The in-situ natural sunlight incubation experiment was conducted to estimate the CO photoproduction rates in different seawater layers. SSW and SML samples for photochemical incubation were collected from stations B1 and C4, as well as E2, FJ5, P1, and P7, located in the YS and the ECS, respectively (Fig. 1). SML and SSW (5 m below seawater surface) samples (SSW: 2 L; SML: 500 mL) were passed through a 0.22 µm PES filters (Pall Corp. Port Washington, NY, USA) immediately to remove the majority of the bacteria and was then placed in an acid-washed and pre-combusted quartz tubes (120 mL, acid-washed and pre-combusted) in a natural sunlight incubation and sealed without headspace or air bubbles. Photo incubation experiments were conducted on the ship immediately after sample collection. To measure the photoproduction at solar radiation production rates of CO, the quartz tubes were treated as follows: (1) uncovered quartz tubes exposed to full-spectrum irradiation; (2) quartz tubes wrapped in multiple layers of aluminum foil to eliminate all light transmission. Treatment (2) was subtracted from light-exposed treatments to remove the fraction of CO produced by dark production. The quartz tubes were positioned under the in-situ irradiation source to maximize the exposure of the sample; the water depth in each tube was 5 cm (i.e., the diameter of the tube). SML and SSW quartz tubes were irradiated for 4 h and were exposed to direct solar irradiation while being held in a water bath with circulating seawater. The change in the CO photoproduction with time can be seen as a constant due to the relatively small amount of total radiation during the short exposure time.
2.4 Microbial consumption and dark production experiments
Six stations were selected to determine the microbial consumption rates of CO (YS: stations A1, B1, and C4; ECS: stations E2, T2, and S6). CO concentrations in seawater samples were measured immediately after collection from the SSW and the SML and used as background values. Seawater was used to fill 1 L glass syringes equipped with a 3-way nylon valve, which were pre-cleaned with 10 % HCl-Milli-Q water and Milli-Q water until free of headspace, and wrapped with aluminum foil. The syringes were immersed in a shallow tank of flowing water that was continuously pumped from the sea to maintain the temperature of the incubation experiments equal to that of the ambient surface seawater. Each sampling series consisted of 4–5 points, and the data from each series were fitted exponentially to determine the consumption rate constant (kbio). The turnover time of the photochemical production (τprod) and biological consumption (τcons) in the SML (SSW) was calculated by the following equations (Doney et al., 1995; Jones and Amador, 1993):
The dark production incubations were used to eliminate the effect of dark production from the microbial CO consumption measurements. According to Zhang et al. (2008), the dark production is the abiotic dark production. Seawater was first filtered through 0.2 µm polyethersulfone membranes and bubbled with CO-free gas (ultrahigh-purity N2, China) to reduce the background CO values before being put into the 1 L syringes as previously described. Then syringes were rinsed with the sample water and then overflowed with the sample twice their volumes before they were closed without headspace. All incubations were conducted in duplicate, and wrapped in multiple layers of aluminum foil, and placed in the same incubator environment. Samples were collected at 0, 0.5, 1, 2, and 4 h during incubation. CO incubation experiment was performed under the same conditions as the CO degradation processes according to the method of Xie et al. (2005) and Xu et al. (2023).
2.5 Calculation of sea-to-air flux of CO
The two-layer model proposed by Liss and Merlivat (1986) was used to calculate the instantaneous sea-to-air flux of CO according to the following equation:
Where F refers to the sea-to-air flux of CO (nmol m−2 h−1), and k is the gas transfer coefficient (cm h−1) as a function of wind speed u (m s−1) and the Schmidt number of CO (Sc). In this paper, we used empirical formula E2011 (Edson et al., 2011), which applies to wind speeds from 0 to 18 m s−1 (Wind speed ranged from 0.68 to 12.00 m s−1), to calculate the gas transfer coefficient as follows:
The Schmidt number of CO was referenced from the research of Zafiriou et al. (2008):
where t is seawater temperature (°C).
[CO]surf represents the concentration of CO in the initial SML and SSW seawater, calculated by the following equation:
Where P is the standard atmosphere pressure (atm) and ma represents the concentration of CO in the headspace when the sample reaches equilibrium. β is the Bunsen solubility coefficient which is dependent on salinity and temperature (Wiesenburg and Guinasso, 1979). Vw and Va are the volumes of seawater and headspace in the sample bottle, respectively. T is temperature (in Kelvin) and R is the gas constant with the value of 0.08206 atm L (mol K)−1.
The daily fluxes () of CO in the YS and the ECS were calculated using the method reported by Stubbins et al. (2006) and Yang et al. (2011), based on the hourly flux (). These hourly fluxes were examined on the scale of individual days by plotting hourly fluxes against the time of day. Days without full coverage of diurnal variations were discarded, leaving 4 d of data in the final analysis. The area under each daily curve was calculated (OriginPro 8.0) to give daily CO emissions.
2.6 Determination of CDOM absorption
The Napierian absorption coefficients of CDOM (aCDOM(λ) (m−1)) were calculated as follows:
Where ACDOM(λ) is the absorbance of the sample at wavelength λ; and L is the cell pathlength of the quartz cuvette in meters (0.1 m, Stedmon et al., 2003). CDOM absorption aCDOM(254) is an effective proxy for dissolved organic carbon (DOC) and chlorophyll a (Chl a) concentrations in the eastern marginal seas of China (Yang et al., 2021).
The spectral slope of the absorption spectrum was obtained by nonlinear fitting of the absorption coefficient according to the following equation (Stedmon et al., 2003):
Where aCDOM(λ) and aCDOM(λ0) are the Napierian absorption coefficients at wavelengths λ and λ0; λ0 is the reference wavelength (440 nm); S is the spectral slope of the absorption spectrum; and K represents the background parameters with CDOM removed (Yang et al., 2022). The specific UV absorbance (SUVA254) can be used to measure aromaticity (Weishaar et al., 2003) and molecular weight (Chowdhury, 2013) of DOM, with higher values generally indicative of higher aromaticity. SUVA254 is calculated by dividing the absorbance at 254 nm by DOC. Detailed Chl a, DOC, fluorescence DOM (FDOM), dissolved oxygen (DO), and wavelength (λ)-dependent absorption coefficients of CDOM (aCDOM(λ)) were determined in the laboratory using published techniques. See Supplement (Sect. S1) for analytical details.
2.7 Statistical analyses
The correlation coefficient (r) and probability (p) values were used to assess the goodness of fit. The correlation matrix, analysis of variance, and principal components analysis were performed with SPSS version 18.0 (SPSS Inc., Chicago, IL, USA) to examine potential relationships between CO, DOM parameters, and environmental factors. P values <0.05 were considered significant. Shapiro-Wilk tests (Table S2) indicated that the data were normally distributed for DOC in the SSW (p=0.258), but not for [CO]SSW, [CO]SML, aCDOM(254) in the SSW and SML, and DOC in the SML (p<0.001 for all). Therefore, all data were analyzed consistently using non-parametric Kruskal-Wallis and Dunn-Bonferroni post-hoc tests. Pearson's product-moment correlation was used to identify relationships between parameters and was calculated at a 95 % confidence level.
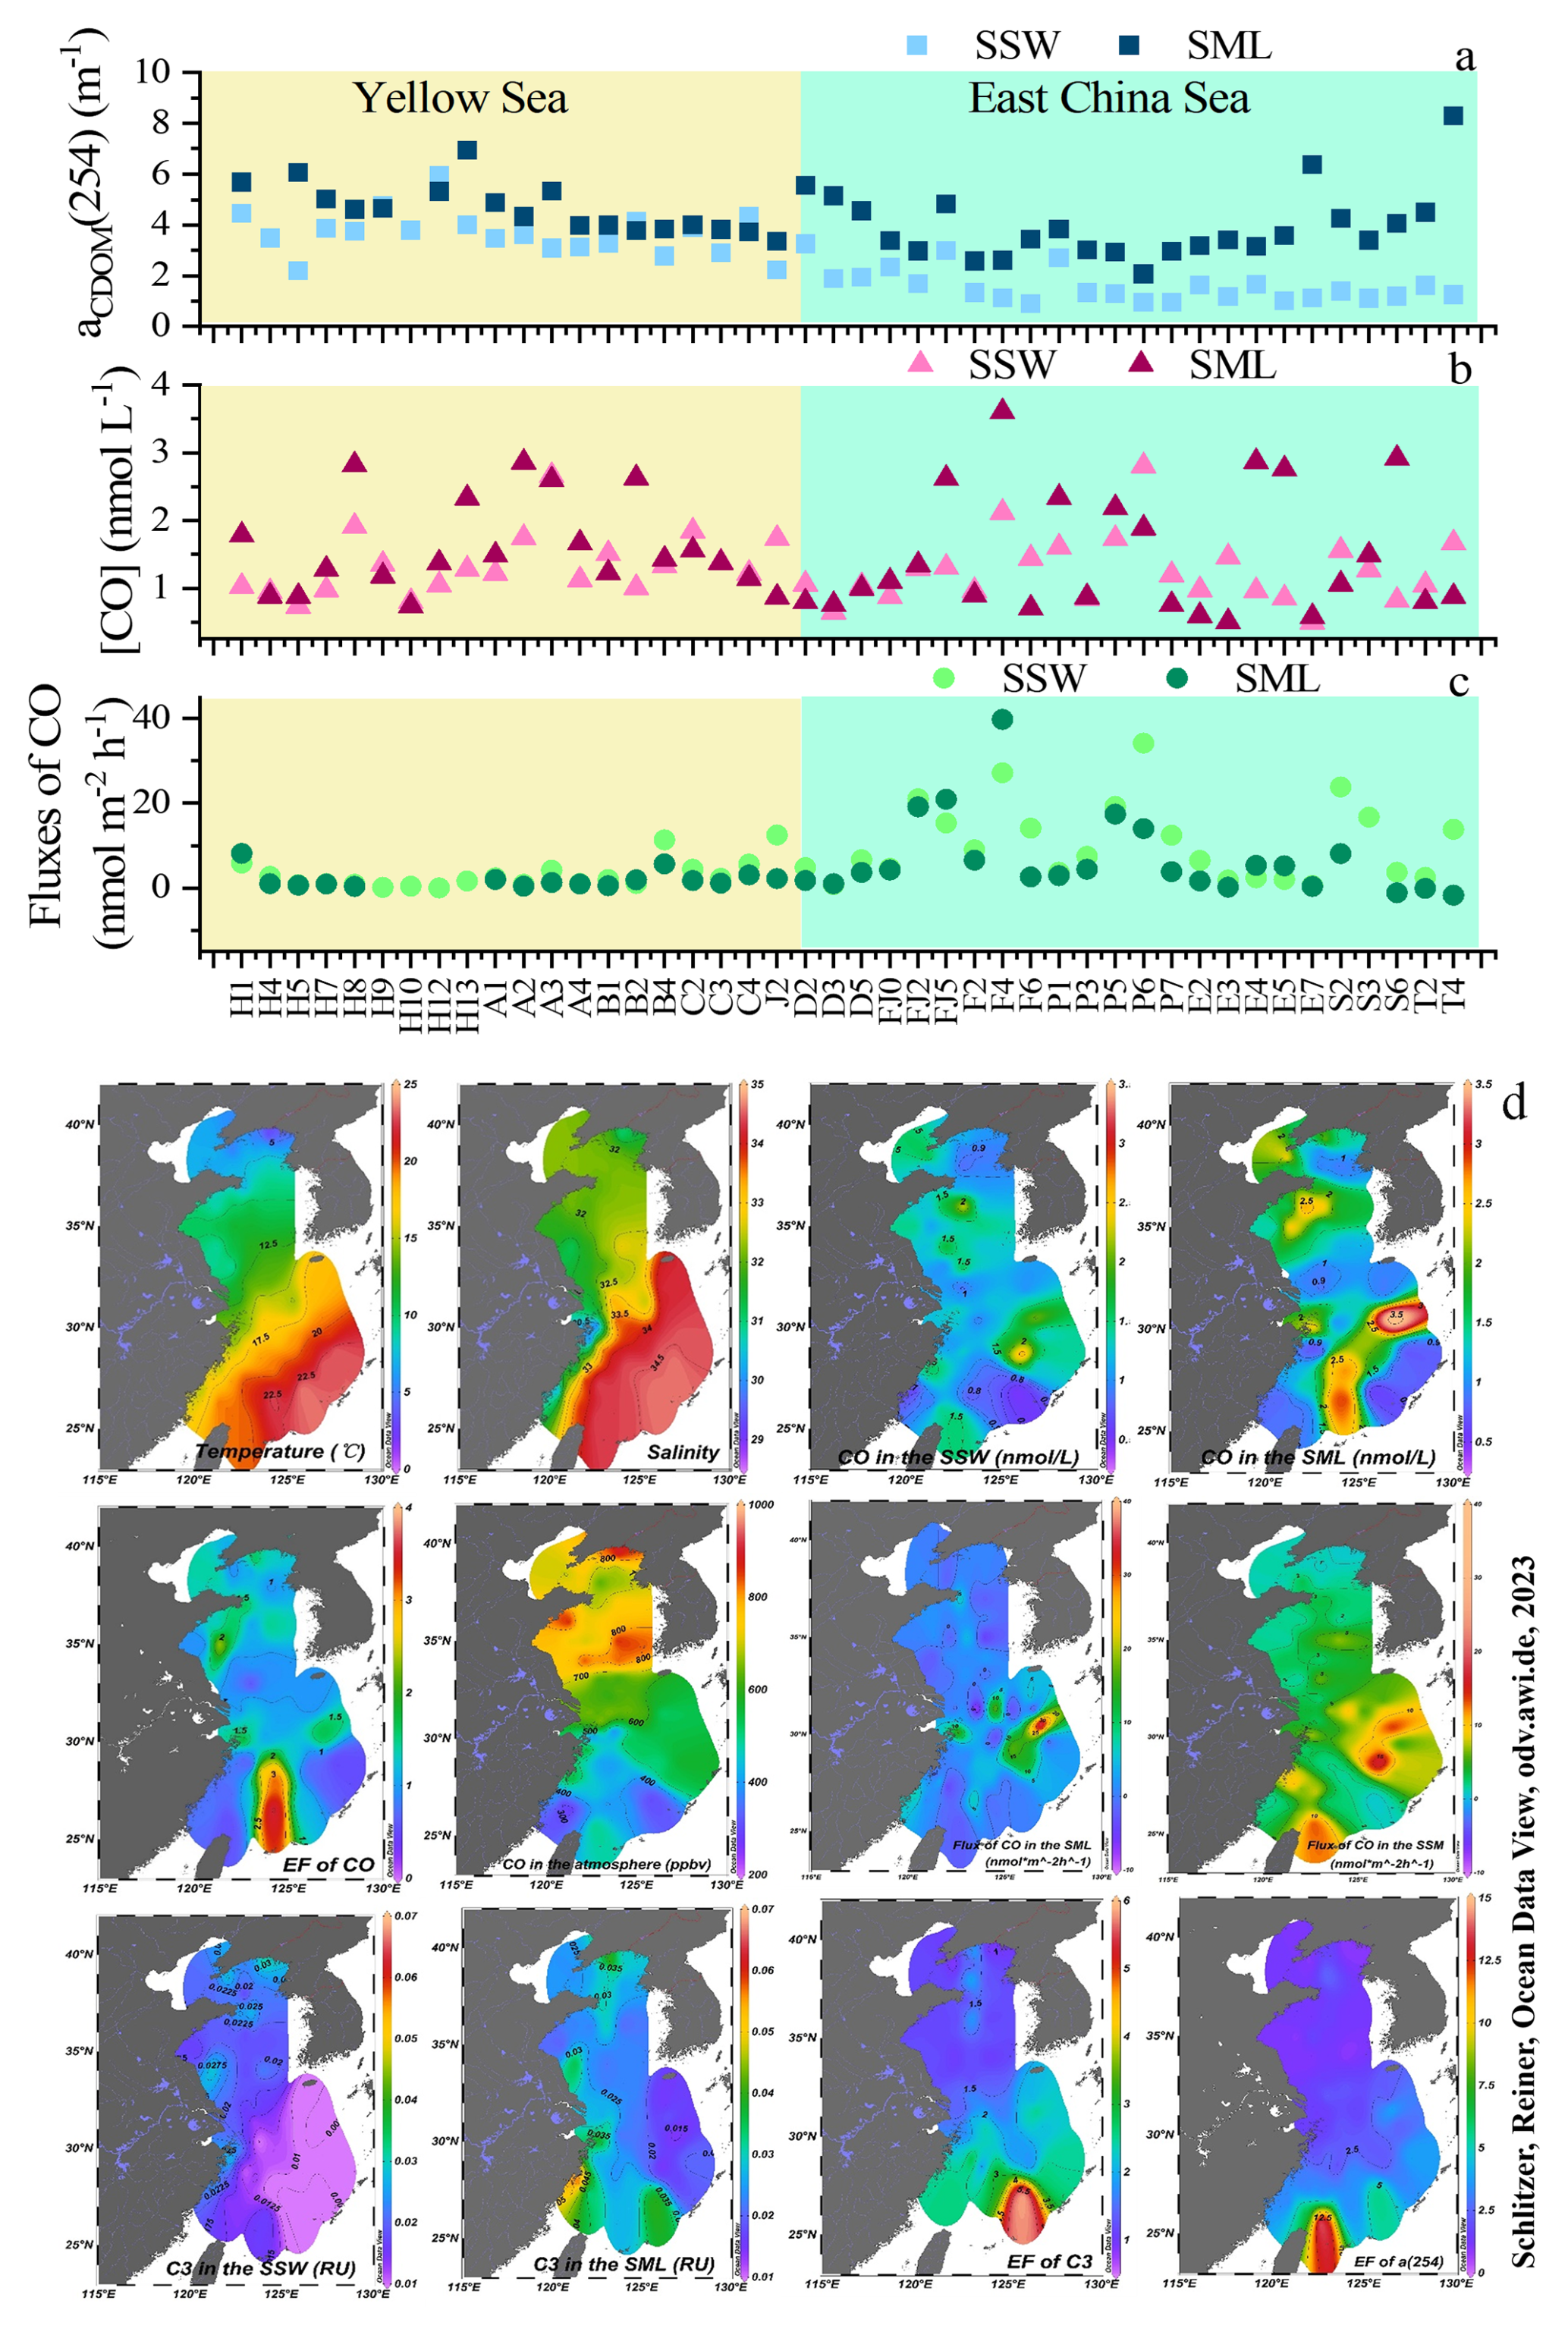
Figure 2aCDOM(254) values in the SSW and the SML (a); CO concentrations in the SSW and the SML (b); The flux of CO in the SSW and the SML (c); Spatial distributions of temperature and salinity, CO and the marine-like fluorescence C3 in the SSW and the SML; CO in the atmosphere, and the enrichment factors of CO and the marine-like fluorescence C3 in the SML in the East China Sea and the Yellow Sea in January 2020 (Schlitzer, 2023) (d). The concentration profiles of CO in the SSW resemble those of CO in the SML, which is evidence for a biogeochemically very stable environment.
3.1 Environmental factors and CO concentration in the SSW and the SML
Surface water temperature increased from 2.08 °C at YS station H12 to 23.8 °C at ECS station E7 (mean value: 11.85±4.53 °C, Fig. 2). Surface salinity increased from 28.85 at Changjiang River Estuary (CRE) station E1 to 34.62 at ECS station E7 (32.35±1.17, Fig. 2). Wind speed during sampling ranged from 0.68 m s−1 at station H9 to 12.00 m s−1 at station FJ1 (6.09±2.50 m s−1). The integrated net solar irradiance (14.09±114.64 kW m−2) during the in-situ incubation ranged from −111.8 kW m−2 at YS station H5 to 417.9 kW m−2 at ECS station F4 (Table S1).
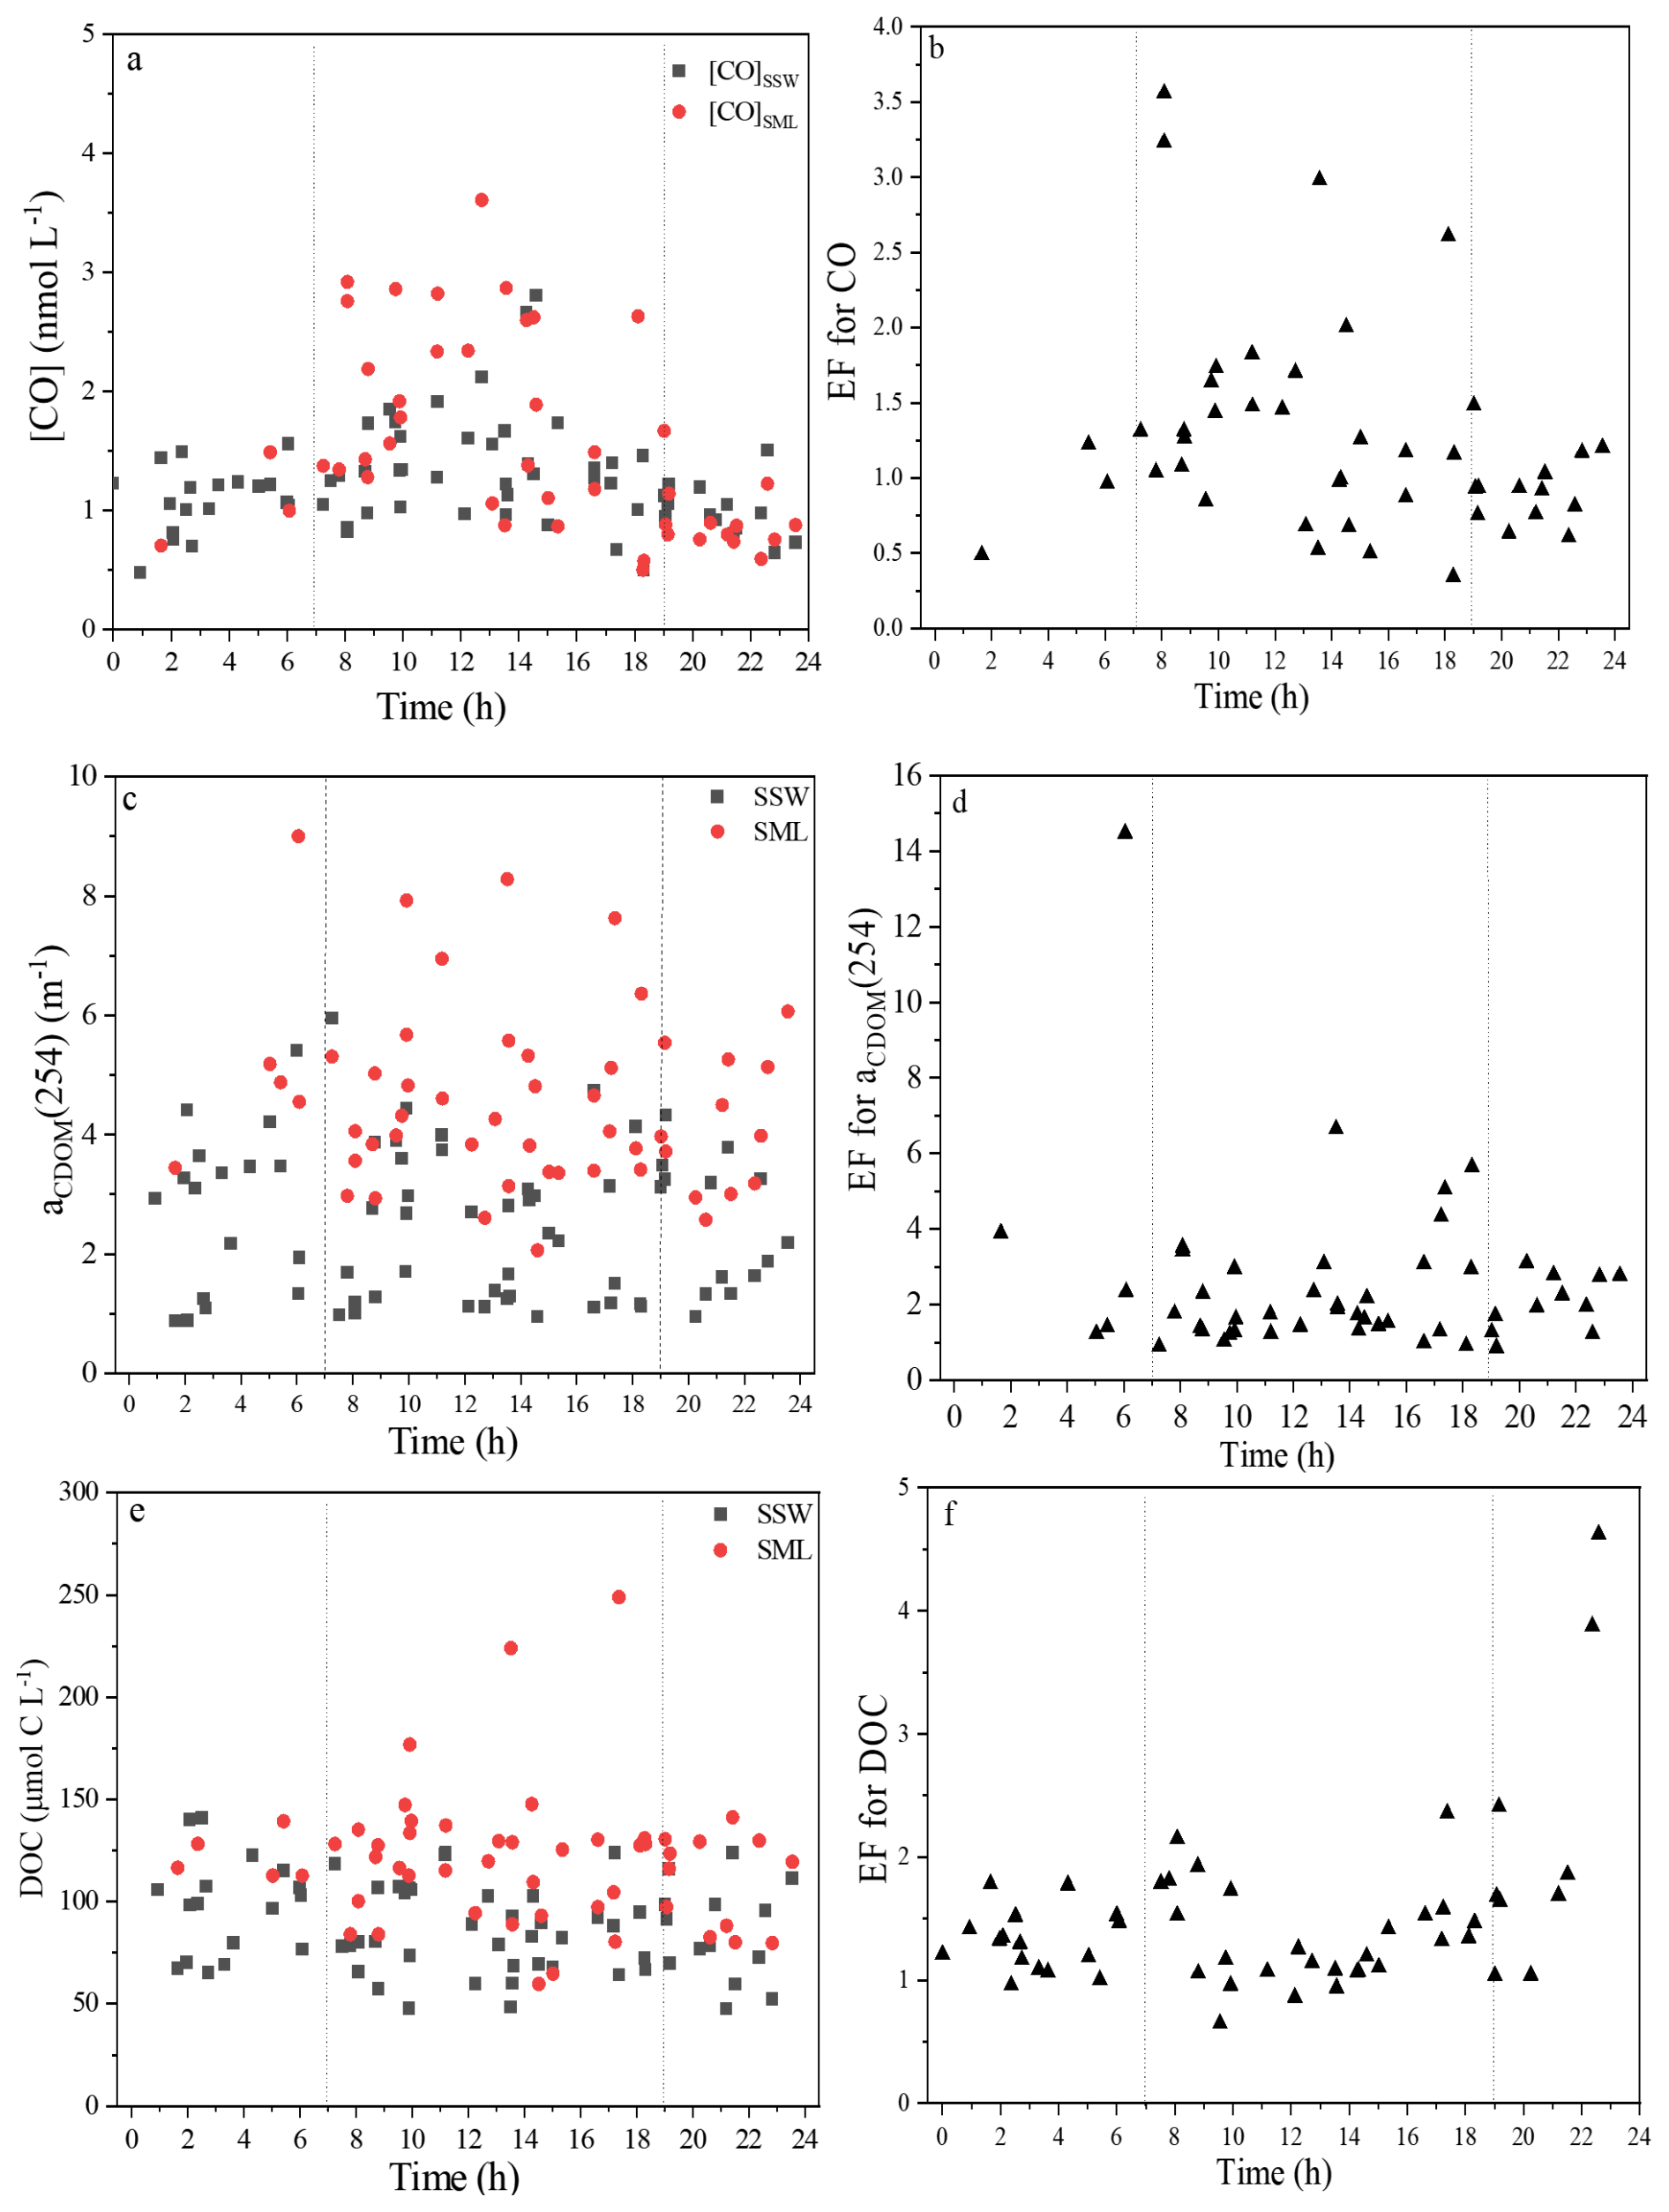
Figure 3Variations in the [CO]SML, [CO]SSW, aCDOM(254), and DOC, EFs of [CO], aCDOM(254), and DOC with the sampling time at each station.
During the study period, [CO]SSW was particularly high at the station F4 (3.61 nmol L−1, sampling time: 12:43) in the SML and relatively high at the station P6 (2.81 nmol L−1, sampling time: 14:36) in the SSW (Fig. 2). The maximum [CO]SML was observed during daytime, but the minimum [CO]SML was observed during nighttime (station E2: 0.59 nmol L−1, sampling time: 22:22, Fig. 3). No significant difference was observed between [CO] in the SML (1.54 nmol L−1) and the SSW (1.23 nmol L−1) (n=52, p=0.11, Wilcoxon signed-rank test). [CO] mean value in the YS (SSW: 1.23±0.40 nmol L−1; SML: 1.54±0.68 nmol L−1) was similar to the concentration observed in the ECS (SSW: 1.23±0.45 nmol L−1; SML: 1.55±0.92 nmol L−1) between the SML and the SSW, respectively. aCDOM(254) in the YS (SSW: 3.59±0.89 m−1; SML: 4.78±0.85 m−1) was higher than that in the ECS (SSW: 1.64±0.72 m−1; SML: 4.70±3.35 m−1) in both the SML and the SSW. aCDOM(254) in the SML (4.74±2.50 m−1) showed relatively higher values compared to the SSW (2.52±1.26 m−1) during winter. The stronger negative linear relationship observed between salinity and aCDOM(254) was observed in the SSW (, n=52, p<0.01), where the influence of terrestrial input in this water layer was higher than that in the SML (, n=52).
3.2 Variations in parallel factor analysis (PARAFAC)-derived fluorescent DOM components and factors controlling the composition of the fluorescent components
The three fluorescent DOM components were determined statistically by conducting Parallel factor analysis (PARAFAC) of the samples (Table S3; Fig. S1; Sect. 1.2). Component C1 was apparent with excitation and emission peaks at 275 and 335 nm, respectively, and was likely a tryptophan-like peak T (Yamashita et al., 2017). C2 exhibited excitation/emission () maxima at 350 nm/455 nm and similar to peak C derived from terrestrial humic sources (Coble and Paula, 2007). Peak C has often been observed in various coastal (Coble, 1996) and oceanic environments (Yamashita et al., 2017). C3 appeared as a fluorophore with wavelengths of 320 nm/390 nm and was similar to marine humic-like components from coastal environments (Yamashita and Jaffe, 2008).
3.3 Variation and enrichment of CO, CDOM, DOC, and FDOM in the SML
[CO] showed relatively higher mean value in the SML, where its EFs ranged from 0.34 to 3.6 and it had a mean EFs value of 1.3±0.7 (Fig. 3). The absorption of CDOM and the fluorescence intensity of FDOM components in the SML were positively correlated with their respective SSW values (Fig. S2), indicating that transport of DOM from the SSW to the SML is an important pathway. Up to 92 % of CDOM samples were enriched in the SML, with the average EF value of aCDOM(254) of 2.2±1.2, ranging between 0.4 and 6.7. The EFs of C3, C1 and C2 were 1.6±0.7, 1.4±0.6, and 1.3±0.5, respectively. The EFs of CO, CDOM, and DOC in the SML were generally higher in the ECS than those in the YS• (Figs. 2 and S3). Furthermore, relatively higher CDOM absorption slope mean values (S275−295 and SR) were observed in the SML (SSW: S275−295: 0.0206±0.0068 and SR: 1.48±0.49; SML: S275−295: 0.0210±0.0055 and SR: 1.53±0.22), indicating that CDOM in the SML experienced more significant photodegradation than that in the SSW. The EF of CO in the daytime (1.5±0.8, 07:00–19:00) was 1.6 times higher than that in the nighttime (0.9±0.3, 19:00–07:00) (Fig. 3b)). The EF of CDOM in the daytime (2.3±11.4) was 1.1 times higher than that in the nighttime (2.1±0.9) (Fig. 3b)). In addition, [CO]SSW in the daytime (1.39±0.47 nmol L−1) was 1.3 times higher than that in the nighttime (1.05±0.22 nmol L−1) and [CO]SML in the daytime (1.88±0.77 nmol L−1) was 2.0 times higher than that in the nighttime (0.95±0.29 nmol L−1).
3.4 Variation of sea-to-air flux of CO
The atmospheric mixing ratios ([CO]atm) of the eastern marginal seas of China ranged from 239 to 900 ppbv, with an average of 602±164 ppbv (n=69; Fig. 2) during winter. [CO]atm measured at station A1 in the YS (the highest concentration) was nearly 4 times higher than that measured at station T2 in the ECS (the lowest concentration). YS showed higher CO mixing ratios (mean value: 423 ppbv in 2007; 657 ppbv in 2019) than ECS (mean value: 252 ppbv in 2007; 476 ppbv in 2019) in this study and a previous study (Yang et al., 2010), indicating that [CO]atm was relatively higher in the YS than the ECS. Generally, [CO]atm showed a significant decreasing trend from the northern to the southern regions in the eastern marginal seas of China (Fig. 2).
The instantaneous sea-to-air fluxes of CO ranged from −1.75 to 39.78 nmol m−2 h−1 in the SML (4.96±7.35 nmol m−2 h−1) and from −0.04 to 34.18 nmol m−2 h−1 in the SSW (7.40±7.31 nmol m−2 h−1). Higher fluxes mostly occurred in the southernmost part of the survey area in the ECS (Fig. 2). Although the concentrations of [CO]atm in the northern region (YS) were generally higher than those in the southern region (ECS), the sea-to-air fluxes of CO in the SML in the southern region (6.94±9.61 nmol m−2 h−1) were 3.5 times higher than that in the northern region (1.97±2.11 nmol m−2 h−1), indicated that the sea-to-air flux of CO did not followed [CO]atm shown in Fig. 2.
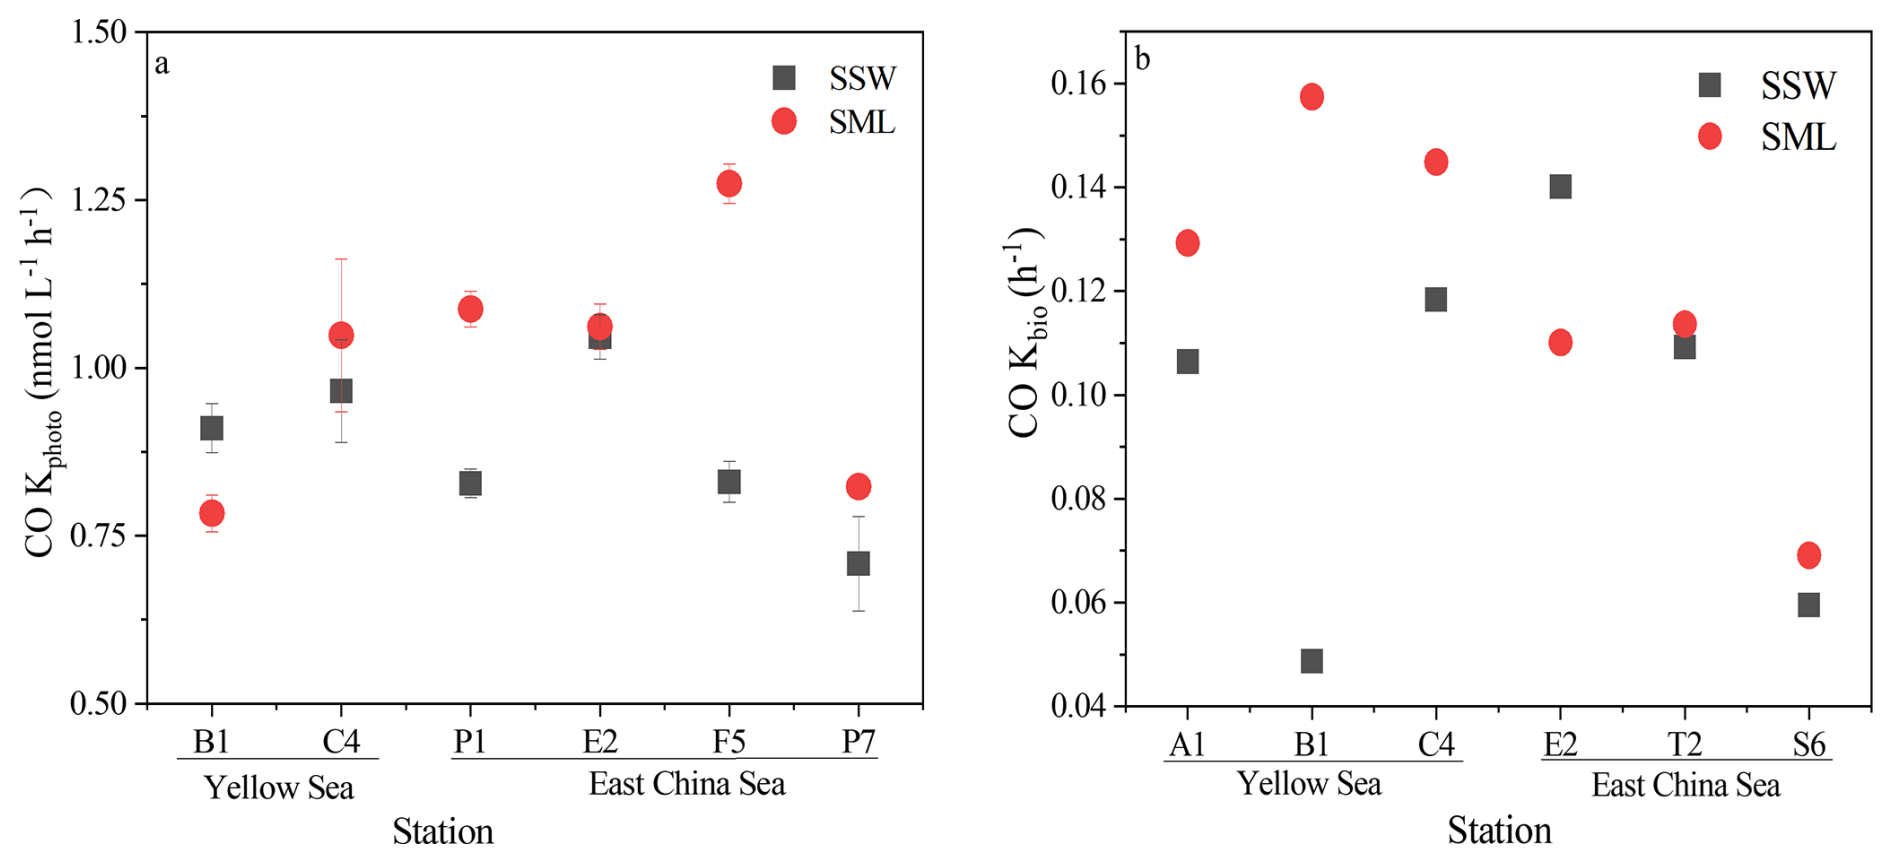
Figure 4Variations in photochemical CO production rate of CO (Kphoto) in the SML (red) and the SSW (black) (a). Variations in microbial consumption rate constants of CO (Kbio) in the SML (red) and the SSW (black (b)). Data are presented as mean values and error bars represent the standard deviation of duplicate samples.
3.5 CO production and consumption
The photoproduction rate of CO (Kphoto) under solar irradiance ranged from 0.71 to 1.05 nmol L−1 h−1 (0.86±0.12 nmol L−1 h−1) and 0.71 to 1.27 nmol L−1 h−1 (1.03±0.16 nmol L−1 h−1) during the in-situ incubation experiments in the SSW and the SML, respectively, as shown in Fig. 4a and Table S4. The mean value of Kphoto in the SML was slightly higher than that in the SSW, but the τprod was lower in the SML (1.35 h) than in the SSW (1.22 h). In addition, a significant relationship was observed between the light-normalized CO production rates between the SML and the SSW (r=0.408, p<0.01, n=6) during winter. The dark production rates of CO (kdark) ranged from −0.01 to 4.81 nmol L−1 d−1, with a mean value of 1.25±2.34 nmol L−1 d−1 in the SSW (Table S3). However, no significant dark production was observed in the SML water samples, which indicated that dark production may be the main factor controlling CO concentrations in deeper seawater.
The microbial consumption rates of CO in the SML varied greatly (0.18±0.05 nmol L−1 h−1), higher than the average in the SSW (0.13±0.03 nmol L−1 h−1) (Fig. 4b). CO photoproduction rates were 5.7 times higher than CO consumption rates in the SML, and CO photoproduction rates were 6.6 times higher than CO consumption rates in the SSW. The turnover times driven by microorganism (τbio), i.e., the reciprocal of kbio, were 8.9±2.9 and 11.9±5.4 h in the SML and the SSW, respectively. τbio in the SML and the SSW ranged between 1.43 and 3.78 d−1 (2.76±0.80 d−1) and between 1.17 and 3.48 d−1 (2.46±0.88 d−1), respectively, higher than those observed in the Arctic marginal sea (0.96±0.29 d−1; Xie et al., 2005), but lower than those in the Northwest Atlantic Ocean (6.24±5.76 d−1; Xie et al., 2005) and the China shelf sea (4.80±1.82 d−1; Zhang et al., 2019). The maximum kbio value appeared at the near-shore station B1 and the minimum value at the offshore station S6 in the SML (Table S3). Thus, the bacterial consumption rate constant of CO was low in oligotrophic open ocean regions but higher in productive coastal areas. Since the CO photoproduction rate in the SSW at the near-shore station B1 was lower than that of the near-shore station E2 and its CO consumption ability was much stronger, the seawater concentration of CO at coastal station E2 (1.62 nmol L−1) was higher than that at coastal station B1 (1.51 nmol L−1).
Table 1Correlation coefficients between [CO], CDOM optical parameters, DOC, Chl a, O2, salinity, and temperature in SSW (a) and SML (b).
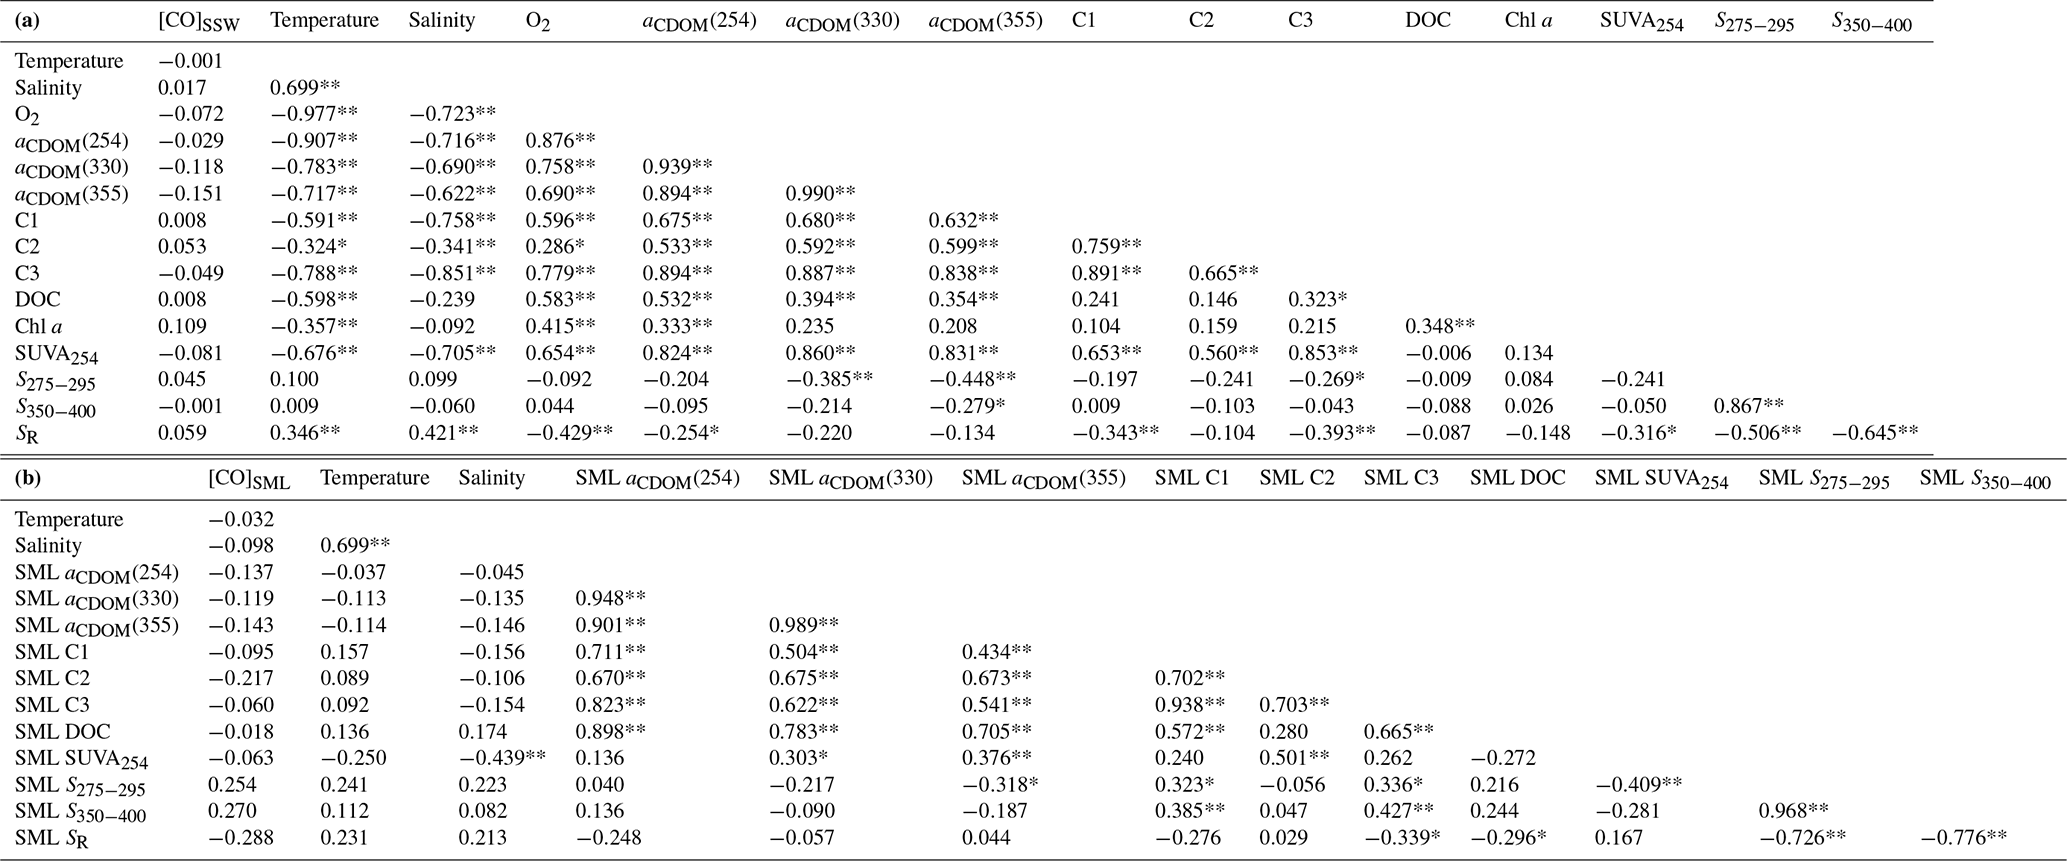
* Correlation is significant at the 0.05 level (two-tailed). ** Correlation is significant at the 0.01 level (two-tailed). N=69 for (a) and N=45 for (b).
3.6 Primary factors controlling the distribution of the optical parameters of DOM and CO and their EFs
Negative relationships were observed between salinity and aCDOM(254) (SSW: p<0.01, , n=62; SML: , n=52), aCDOM(355) (SSW: p<0.01, ; SML: ), and the C1 (SSW: p<0.01, ; SML: ), C2 (SSW: p<0.01, ; SML: ), and C3 (SSW: p<0.01, ; SML: ) components in SSW and SML (Table 1). High and low fluorescence levels of these three components were usually found at sites with low and high salinities, respectively (Fig. 2). These results indicated that riverine inputs mainly determined the distributions of CDOM and FDOM. aCDOM(254) and all three fluorescence components were also positively correlated with SUVA254 (Table 1), indicating that CDOM showed higher aromaticity and humification in the eastern marginal seas of China. In addition, we observed a significant positive relationship between aCDOM(254) and Chl a in the SSW (p<0.01, r=0.333, n=62), suggesting that phytoplankton biomass and biological processes played an essential role in generating new CDOM and controlling the distribution of CDOM in winter.
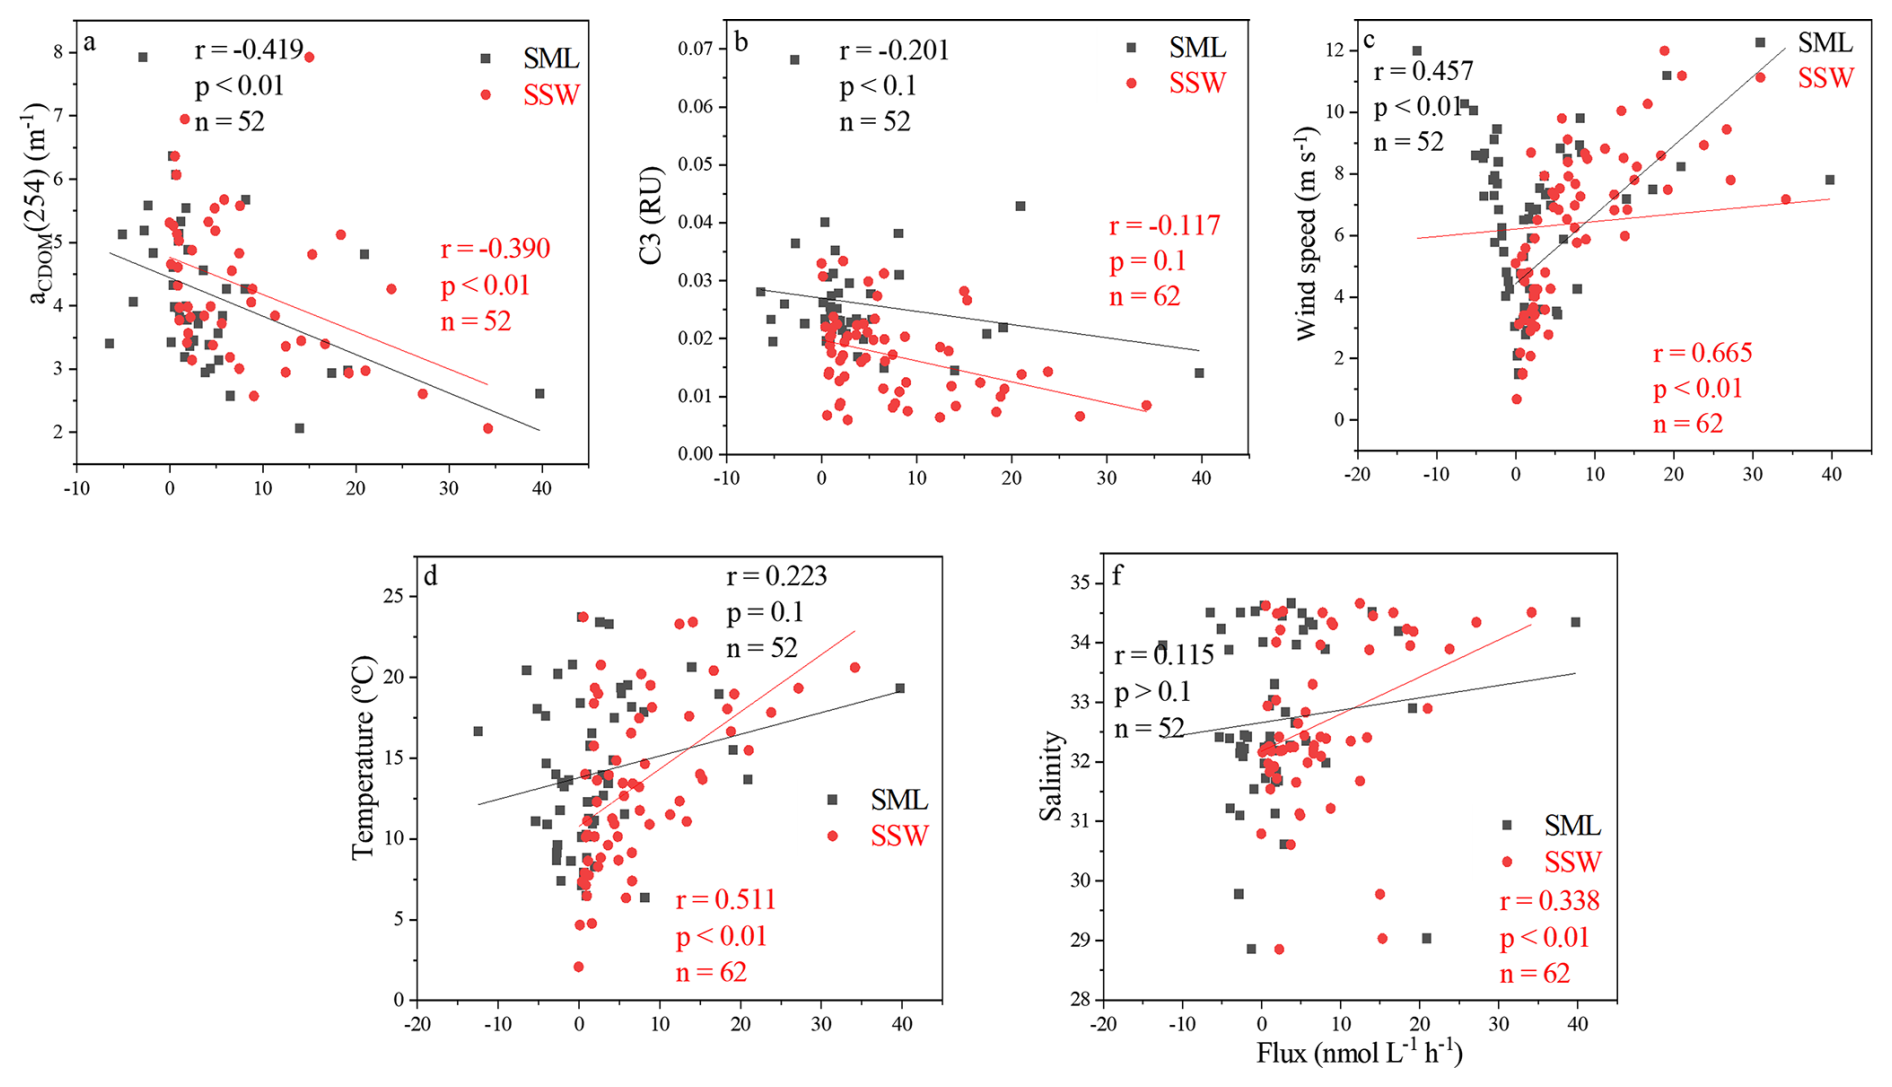
Figure 5Correlations between the instantaneous sea-to-air fluxes of CO (Flux) in the SSW and the SML with aCDOM(254), marine humic-like C3, wind speeds, temperature, and salinity in the East China Sea and the Yellow Sea during winter.
Although significant CO production via CDOM photodegradation has been recorded in estuarine systems (Stubbins et al., 2011), no significant relationships were observed between [CO] and aCDOM(254) in either the SSW or the SML in our study regions. aCDOM(254) (p<0.01, ) and the marine humic-like C3 (p<0.01, ) were both negatively correlated with the flux of CO in the SML (Fig. 5a and b). The flux of CO was positively related to temperature (p<0.01, r=0.511) and salinity (p<0.01, r=0.338) in the SSW (Fig. 5), but the EF of CO showed no significant relationship with surface water temperature, salinity, or mean wind speed during sampling (Fig. 5d and f).
4.1 CO and DOM distribution and enrichment in the SML
[CO] showed great seasonal and diel variability, as well as variability between ocean regions. [CO]SSW mean value in the YS in January 2020 (1.23±0.40 nmol L−1) was higher than in September 2010 (1.05 nmol L−1, Zhao et al., 2015). [CO]SSW mean value in the ECS during winter (1.23±0.45 nmol L−1) was also higher than in October 2021 (0.97±0.86 nmol L−1, Yang et al., 2024). Globally, [CO]SSW mean value (1.23 nmol L−1) in the eastern marginal seas of China was similar to that observed in the Bohai Sea and the YS during autumn (Zhang et al., 2019, 1.22 nmol L−1) and the Arctic waters of the Amundsen Gulf (Beaufort Sea) in September/October (Xie et al., 2009, 0.17–1.34 nmol L−1), but was relatively lower than the Eastern Indian Ocean (Xu et al., 2023, 1.92 nmol L−1). The Eastern Indian Ocean, on the other hand, had a salinity of approximately 34 and a relatively high temperature (around 29 °C) in autumn 2020 (Xu et al., 2023). Tropical and subtropical open ocean regions were generally less affected by terrestrial influences compared to estuarine, coastal and high-latitude areas. CO production and fluxes normalized to discharge are usually higher in warmer waters (Kieber et al., 2014), presumably also partly due to temperature controls on dissolution (Johnson and Bates, 1996). Therefore, the relatively higher concentration of [CO]SSW in the open ocean (ECS) might be characterized by the relatively high seawater temperature and/or strong production processes during our sampling period.
Table 2Correlation coefficients between EFs of CO, DOM absorption, DOC, three fluorescence components, temperature, salinity, and wind speed.
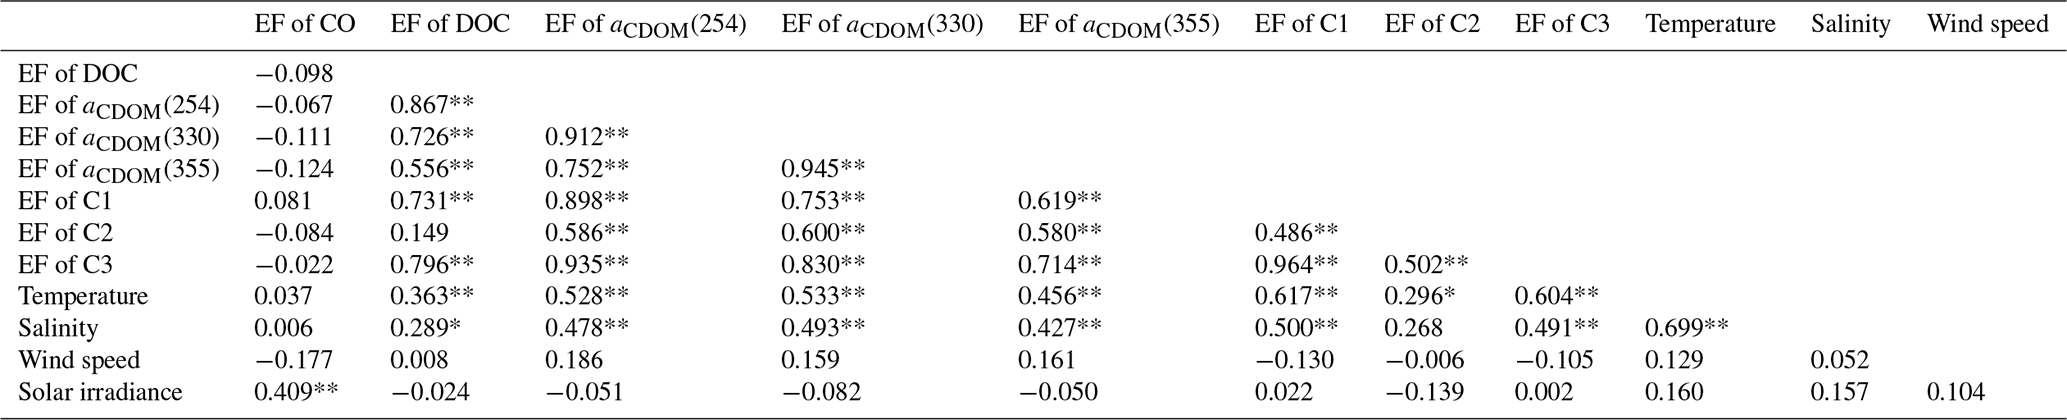
* Correlation is significant at the 0.05 level (two-tailed). ** Correlation is significant at the 0.01 level (two-tailed). N=45.
Our results showed that there was no significant enrichment of CO in SML during the investigation, and CO enrichment in SML only occurred at 25 stations. Earlier studies have shown that the diurnal variation of [CO]SSW in sea surface concentration, which was first noted in the Atlantic Ocean by Swinnerton et al. (1970), with a characteristic minimum just before dawn and a maximum in the early afternoon. This cycle was subsequently observed in other expeditions in both the Pacific and Atlantic Oceans (Ren et al., 2014; Yang et al., 2010; Yang et al., 2011). Here, [CO]SSW, [CO]SML and the EFs of CO also showed strong diurnal fluctuations (Fig. 3, Sect. 3.1 and 3.3). Significant positive relationships were observed between the EFs of CO and the net solar irradiance (Table 2), likely resulting from the sunlight-induced photochemical production of CO during daytime and the stronger microbial consumption at night. The higher EF values of CO also occurred in the daytime (Fig. 3b), suggesting that sufficient light and higher temperatures combined to facilitate the photoproduction of CO and its enrichment in the SML.
CO, CDOM, and FDOM were more frequently enriched in the ECS (Fig. 2). DOC and CDOM decreased from coastal regions to the open ocean, and decreased from the northern sampling area (the YS) to the southern sampling area (the ECS) in both the SSW and the SML (Fig. 2), which was likely due to the input from the land-based sources (Yang et al., 2022). Moreover, atmospheric deposition of organic carbon and nutrients was found to peak in winter over the coastal ECS (Wang et al., 2019). Although the source of CDOM originated from allochthonous terrestrial sources in the ECS and the YS (Yang et al., 2021), the sink of CDOM in the ECS was more dominated by photochemical degradation processes (Zhu et al., 2018). The EF of marine humic-like Component 3 was significantly higher than the other fluorescence components (1.6 vs. 1.4 and 1.3), indicating that in-situ autochthonous DOM was more strongly enriched in the SML than terrestrial DOM. Thus, CO, CDOM, and FDOM were more frequently enriched in the open ocean (ECS), which was attributed mainly to the significant local photoproduction. Further, one note of the study of gases in the SML is that gases supersaturated with respect to their atmospheric concentrations, including CO, are inevitably lost from SML samples during sampling, depending on environmental conditions such as water temperature and wind. For example, in case of dimethylsulfide (DMS), a volatile gas with large concentration difference between the atmosphere and the ocean, Yang et al. (2001) and Yang et al. (2005) showed about 50 %–70 % and 60 % (mean) of loss from SML samples collected using a mesh screen at 0–15 °C and at a water temperature of 10 °C and wind speed of 4 m s−1, respectively. A mesh screen was also used in this study, and parameters such as [CO]SML and the EF of CO may have been underestimated.
4.2 Photochemical and dark CO production and biological CO consumption in the SML and the SSW
Photochemical CO production is the most active in the SML, the mean photoproduction rate of CO in the SML was 1.1 times higher than that in the SSW in the eastern marginal seas of China. CO in our study region showed a longer turnover time than the findings of Sugai et al. (2021) in Sagami Bay, Japan (τprod=0.09 h), which is probably due to the relatively low photochemical CO production rate in the SML and/or the higher photochemical degradability of CDOM in the SML under more intense light conditions in our study region.
The turnover times driven by sea-to-air exchange were much longer than those of microbial consumption, about 219 and 1029 h in the SSW and SML, respectively. This indicated that microbial removal of CO was much faster than sea-to-air exchange, which may make the latter a subordinate pathway for CO removal in our study regions. Relatively higher microbial consumption rate of CO in marine systems has been historically attributed to higher Chl a, but lower salinity level (Xie et al., 2009; Yang et al., 2010; Xu et al., 2023). In addition, the heterotrophic bacterial abundance in the SML was ∼7.5 times greater than in the SSW and the ECS in March 2017 (Sun et al., 2020). The SML is an aggregate-enriched biofilm environment with distinct microbial communities, the diversity of which can differ significantly from underlying waters (Liss and Duce, 2005; Cunliffe et al., 2013). This higher abundance of bacteria could result in the rapid consumption of CO, along with a wide variety of other organic substances in the SML. Moreover, elevated nutrient concentrations can stimulate the growth of phytoplankton, biological activity, and subsequently lead to abundant primary production in the SML (Yang et al., 2022). Therefore, compared to the SSW, the elevated DOM concentrations and bacteria abundances could enhance the influences of photoproduction and microbial consumption on CO cycling processes in the SML.
4.3 Implications of CO sea-to-air exchange and emission to the atmosphere
Based on the areas of the ECS (7.7×10⁵ km2) and YS (3.8×10⁵ km2) and their respective CO sea-to-air fluxes, the releases of CO from the ECS and YS to the atmosphere were estimated to range from 3 to 230 Mg CO-C per month (Mg = 106 g) and from −0.2 to 880 Mg CO-C per month, with averages of 70 Mg CO-C per month and 10 Mg CO-C per month, respectively. Clearly, the average annual release of CO to the atmosphere in the ECS was much higher (nearly 7 times) than in the YS. Yang et al. (2010) suggested that [CO]SSW was the main factor affecting the sea-to-air flux of CO, but [CO]SSW in the ECS was similar to that in the YS. The lower temperatures and especially reduced wind speeds may hinder its outgassing to the atmosphere. The higher [CO]atm at the northern stations (the YS) was representative of the regionally polluted continental outflow air mass due to the anthropogenic activity in East Asia. Therefore, [CO]atm values in the YS were heavily dependent on land anthropogenic input, but in the ECS, the distribution of [CO]atm was more dependent on the sea-to-air flux of CO.
As noted above, the most probable sources of CO in the SML of these sea regions are in-situ photoproduction from DOM and/or vertical export through underlying SSW water. Actually, surface-active surfactants are ubiquitous and accumulate in the uppermost <1000 µm in seawater (Rickard et al., 2019), where they slow the rate of gas exchange between seawater and air (Cunliffe et al., 2013). Although surfactants represent only a fraction of the dissolved organic matter pool, Rickard et al. (2022) observed that the first-order estimates of the potential suppression of the gas transfer velocity (kw) by photo-derived surfactants were 12.9 %–22.2 % in coastal North Sea water. The highest SML enrichments in surfactants have been seen in low productivity, oligotrophic regions away from terrestrial influences, where surfactant concentrations in SSW are generally low (Wurl et al., 2016). Pereira et al. (2018) also noted that the observed reduction in the air-to-sea CO2 exchange in the Atlantic Ocean was due to biological surfactants acting as physical barriers and altering turbulent transfer near the water surface. Therefore, the relatively lower fluxes of CO observed in the YS may indicate that seawater contains lots of DOM (surfactants) in the SML. Despite the clear importance of surfactants at the sea-to-air interface, we did not conduct surfactant-specific analyses due to the analytical limitations. In our experiments, the CO flux varied by 131 % in winter. The negative correlations between aCDOM(254) and the sea-to-air flux of CO, and between marine humic-like C3 and the sea-to-air flux of CO suggested that CDOM concentration may reduce the CO sea-to-air gas exchange rate in our study regions (Fig. 5a and b). In addition, low wind speeds may lead to high DOM enrichment, but in the meantime give rise to low sea-to-air fluxes as well. Therefore, due to the complexity of the DOM pool in the SML and its may result in decreased sea-to-air flux of CO, more measurements are needed to validate our conceptual model and provide a better understanding of the flux measurements of CO in the SML.
During our study period (winter), surface seawater temperatures showed substantial spatial fluctuations (ranging from 2.08 °C in the YS to 23.80 °C in the ECS) due to the broad investigation range. In our previous manuscript (Yang et al., 2022), we observed that relatively higher nutrient enrichment in summer could enhance phytoplankton growth and promote DOM production in the SML; stronger enrichment and photochemical processes in the SML result in relatively accelerated enrichment of more locally produced marine DOM in the SML than in the SSW. During warm seasons, stronger light and temperature may alter the relative importance of light production, microbial production, and DOM (surfactants) composition, as well as the inhibition of CO flux. Therefore, the fact that DOM inhibits CO flux still requires further verification in other seasons and regions.
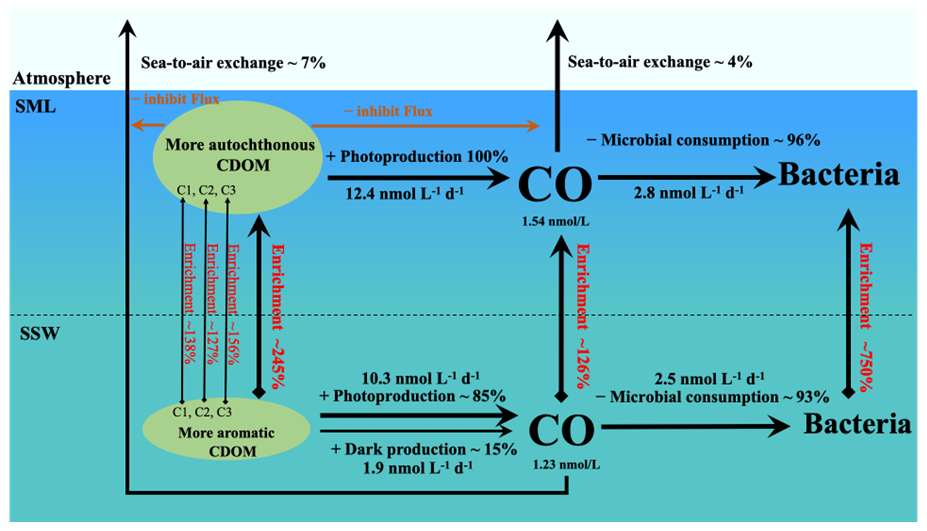
Figure 6Budget model of CO transformation in the SML and the SSW in the eastern marginal seas of China during winter. (Bacterial enrichment was calculated by Sun et al., 2020).
Modeling of CO dynamics in the SML and the SSW
All sources and sinks, including photoproduction and dark production, microbial consumption and sea-to-air emission, should be considered in estimating CO dynamics in the SML and SSW (Fig. 6). The effective solar illumination period of each day was approximately 12 h, and based on this the average photoproduction rates in the SML and the SSW were calculated to be 12.41±1.87, 10.32±1.48 nmol L−1 d−1, respectively. In the SSW, the ratio of photoproduction to dark production (1.88±2.89 nmol L−1 d−1) was about 4:1, and dark production accounted for about 15 % of the total production. No dark production of CO was observed in the SML. CO photoproduction was lower in deeper water, while dark production was higher. The calculated contribution of dark production to CO production in this study was similar to that for the St. Lawrence estuary (14 %; Zhang and Xie, 2012) but much lower than for the Eastern Indian Ocean (20 %; Xu et al., 2023). These were because dark production needs to be given more weight in estimating its contribution to the total production of CO in the deeper waters of the ocean than in estuaries (Xu et al., 2023). The total removal rates of CO were about 2.64 and 2.88 nmol L−1 d−1 in the SSW and the SML, respectively, including the microbial consumption rates of 2.46±0.88 and 2.76±0.80 nmol L−1 d−1 in the SSW and the SML, respectively. The sea-to-air exchange rates were 0.18±0.18 nmol L−1 d−1 in the SSW and 0.12±0.18 nmol L−1 d−1 in the SML. The turnover of CO occurred faster in the SML environment than in the SSW (∼1.2 times). Microbial consumption was the primary sink of CO, accounting for about 95 % of CO removal, indicating that the biogeochemical cycling of CO is almost entirely contained within seawater and only a small amount of CO is released into the atmosphere (Xie et al., 2005; Yang et al., 2010; Zhang et al., 2019; Xu et al., 2023). The production rates of CO in both SML and SSW significantly exceed the loss rates, this could lead to the accumulation of CO in these systems. Therefore, CO balance in the ECS and YS indicated that the underlying loss of CO (via sea-to-air flux and biodegradation) was slower than the production of CO in the SML, therefore, a positive CO balance was maintained in the SML.
The average annual photoproduction, microbial consumption, and sea-to-air flux of CO in the SSW were about 3.02, 1.58, and 0.04 Gg CO-C per month, respectively, based on the area of the survey region ( km2, SSW ∼10 m). Conte et al. (2019) used the NEMO-PISCES model combined with original ocean CO data collected worldwide over the last 50 years, ultimately estimating that global emissions of CO to the atmosphere were 4.0 Tg CO-C yr−1 (Tg = 1012 g). Based on our data, we estimated the contribution of China's eastern marginal seas to global marine CO emissions via sea-to-air flux to be ∼0.3 ‰, and the YS and the ECS occupy 2.7 ‰ of the global ocean area. The simulated surface CO concentrations and sea-to-air fluxes based on our measured values were much smaller than those simulated by Erickson (1989). In our study, CO produced can be rapidly consumed by microorganisms and only a small fraction was released into the atmosphere, which may explain why the relative contribution of the eastern marginal seas of China to atmospheric CO was much lower than the global level.
Notably, the enrichment of CO in the SML was more common during the daytime when photochemical processes were more active, but natural sunlight can inhibit the microbial consumption of CO. CO was maximal in the SML, leading to the significant enrichment and supersaturation. CDOM in the SML experienced more significant photodegradation than that in the SSW, as can be seen in Sect. 3.3. Moreover, researchers assumed that biological, chemical and physical processes in the SML are controlled by changes in DOM concentration at this uppermost thin boundary layer between the ocean and the atmosphere (Cunliffe et al., 2013). We found that autochthonous humic-like DOM was more enriched in the SML than terrestrial DOM, indicating that it could be an indispensable part of CO photoproduction (Yang et al., 2022). Solar irradiance was positively related to the EFs of CO (Table 2), suggesting that the integrated solar irradiance influenced CO enrichment in the SML. Moreover, we did discover the potential for CDOM accumulation in the SML to prevent CO emissions into the atmosphere (Sect. 4.3). Therefore, CDOM accumulation and the production rates of CO in the SML significantly exceed the loss rates, which could lead to the significant accumulation of CO in the SML, especially in the daytime.
This study is the first comprehensive analysis of CO distribution, loss, and production in both the SML and SSW, as well as sea-to-air CO flux in the ECS and YS during winter. [CO]SSW, [CO]SML, CDOM, FDOM, and DOC generally decreased from coastal regions toward the open ocean. However, the EFs of CO, CDOM, FDOM, and DOC were significantly higher in offshore areas, indicating that stronger enrichment and/or production processes in the SML are more common in open waters than nearshore. CDOM absorption slope mean values (S275−295 and SR) showed that CDOM in the SML experienced more extensive photodegradation than in the SSW. Notably, the EF of the marine humic-like component C3 was significantly higher than other fluorescence components, suggesting that in-situ autochthonous DOM was more strongly enriched in the SML compared to terrestrial DOM. Significant negative correlations were observed between aCDOM(254) and sea-to-air CO flux, as well as between sea-to-air CO flux and humic-like C3 in the SML, indicating that the open sea had lower CDOM concentrations but greater suppression of CO gas transfer compared to nearshore waters. This suggests that DOM enrichment may influence CO emissions to the atmosphere in the SML. The diurnal variability in CO EF and [CO]SML indicates that in-situ photoproduction processes are vital in shaping CO distribution within the SML. Our results demonstrate a complex interaction between DOM enrichment and sea-to-air CO fluxes in the SML, which should be incorporated into future carbon budget models for more accurate assessments of carbon cycling in marine environments.
Data will be made available on request.
The supplement related to this article is available online at https://doi.org/10.5194/bg-23-1261-2026-supplement.
LY: Conceptualization, Writing-Original Draft, Writing-Review and Editing; BY: Writing-Review and Editing; JZ: Writing-Review and Editing, Funding acquisition; AE: Writing-Review and Editing; GPY: Writing-Review and Editing, Supervision.
The contact author has declared that none of the authors has any competing interests.
Publisher's note: Copernicus Publications remains neutral with regard to jurisdictional claims made in the text, published maps, institutional affiliations, or any other geographical representation in this paper. The authors bear the ultimate responsibility for providing appropriate place names. Views expressed in the text are those of the authors and do not necessarily reflect the views of the publisher.
This article is part of the special issue “Biogeochemical processes and Air–sea exchange in the Sea-Surface microlayer (BG/OS inter-journal SI)”. It is not associated with a conference.
We are grateful to the captain and crew of the R/V Dong Fang Hong 3 for their help and cooperation during the in-situ investigation. This study was financially supported by the National Natural Science Foundation of China (grant no. 42330402), the National Key Research and Development Program (grant no. 2016YFA0601300), and the Natural Science Research Project of Jiangsu Province Higher Education Institutions (grant no. 25KJD170004).
This study was financially supported by the National Natural Science Foundation of China (grant no. 42330402), the National Key Research and Development Program (grant no. 2016YFA0601300), and the Natural Science Research Project of Jiangsu Province Higher Education Institutions (grant no. 25KJD170004).
This paper was edited by Peter S. Liss and reviewed by Mariana Ribas-Ribas and two anonymous referees.
Chen, C. T. A.: Chemical and physical fronts in the Bohai, Yellow and East China seas, J. Mar. Syst., 78, 394–410, https://doi.org/10.1016/j.jmarsys.2008.11.016, 2009.
Chen, Y., Yang, G., Xia, Q., and Wu, G.: Enrichment and characterization of dissolved organic matter in the surface microlayer and subsurface water of the South Yellow Sea, Mar. Chem., 182, 1–13, https://doi.org/10.1016/j.marchem.2016.04.001, 2016.
Chowdhury, S.: Trihalomethanes in drinking water: effect of natural organic matter distribution, WATER SA, 39, 1–7, https://doi.org/10.4314/wsa.v39i1.1, 2013.
Coble, P. G.: Characterization of marine and terrestrial DOM in seawater using excitation-emission matrix spectroscopy, Marine Chem., 51, 325–346, https://doi.org/10.1016/0304-4203(95)00062-3, 1996.
Coble, P. G. and Paula, G.: Marine optical biogeochemistry: the chemistry of ocean color, Cheminform, 38, 402–418, https://doi.org/10.1002/chin.200720265, 2007.
Conte, L., Szopa, S., Séférian, R., and Bopp, L.: The oceanic cycle of carbon monoxide and its emissions to the atmosphere, Biogeosciences, 16, 881–902, https://doi.org/10.5194/bg-16-881-2019, 2019.
Cordero, P. R. F., Bayly, K., Leung, P. M., Huang, C., and Greening, C., Atmospheric carbon monoxide oxidation is a widespread mechanism supporting microbial survival, ISME J., 13, https://doi.org/10.1038/s41396-019-0479-8, 2019.
Cunliffe, M. and Wurl, O.: Guide to best practices to study the ocean's surface. Occasional Publications of the Marine Biological Association of the United Kingdom, Plymouth, UK, 118 pp., https://doi.org/10.25607/OBP-1512, 2014.
Cunliffe, M., Engel, A., Frka, S., Gašparovi, B., Guitart, C., Murrell, J. C., Salter, M., Stolle, C., Upstill-Goddard, R., and Wurl, O.: Sea surface microlayers: A unified physicochemical and biological perspective of the air-ocean interface, Prog. Oceanogr., 109, 104–116, https://doi.org/10.1016/j.pocean.2012.08.004, 2013.
Doney, S. C., Najjar, R. G., and Stewart, S.: Photochemistry, mixing and diurnal cycles in the upper ocean, J. Mar. Res., 53, 341–369, https://doi.org/10.1357/0022240953213133, 1995.
Edson, J. B., Fairall, C. W., Bariteau, L., Zappa, C. J., Cifuentes-Lorenzen, A., Mcgillis, W. R., Pezoa, S., Hare, J. E., and Helmig, D., Direct covariance measurement of CO2 gas transfer velocity during the 2008 Southern Ocean Gas Exchange Experiment: Wind speed dependency, J. Geophys. Res., 116, 1943–1943, https://doi.org/10.1029/2011jc007022, 2011.
Engel, A. and Galgani, L.: The organic sea-surface microlayer in the upwelling region off the coast of Peru and potential implications for air–sea exchange processes, Biogeosciences, 13, 989–1007, https://doi.org/10.5194/bg-13-989-2016, 2016.
Engel, A., Bange, H. W., Cunliffe, M., Burrows, S. M., Friedrichs, G., Galgani, L., Herrmann, H., Hertkorn, N., Johnson, M., Liss, P. S., Quinn, P. K., Schartau, M., Soloviev, A., Stolle, C., Upstill-Goddard, R. C., van Pinxteren, M., and Zäncker, B.: The Ocean's Vital Skin: Toward an Integrated Understanding of the Sea Surface Microlayer, Front. Mar. Sci., 4, https://doi.org/10.3389/fmars.2017.00165, 2017.
Erickson, D. J.: Ocean to atmosphere carbon monoxide flux: Global inventory and climate implications, Global Biogeochem. Cy., 3, 305–314, https://doi.org/10.1029/GB003i004p00305, 1989.
Garrett, W. D.: Collection of slick-forming materials from the sea surface, Limnol. Oceanogr., 10, 602–605, https://doi.org/10.4319/lo.1965.10.4.0602, 1965.
Gros, V., Peeken, I., Bluhm, K., Zöllner, E., Sarda-Esteve, R., and Bonsang, B.: Carbon monoxide emissions by phytoplankton: evidence from laboratory experiments, Environ. Chem., 6, 369–379, https://doi.org/10.1071/EN09020, 2009.
Huang, Y. J., Brimblecombe, P., Lee, C. L., and Latif, M. T.: Surfactants in the sea-surface microlayer and sub-surface water at estuarine locations: Their concentration, distribution, enrichment, and relation to physicochemical characteristics, Mar. Pollut. Bull., 97, 78–84, https://doi.org/10.1016/j.marpolbul.2015.06.031, 2015.
Johnson, J. E. and Bates, T. S.: Sources and sinks of carbon monoxide in the mixed layer of the tropical South Pacific Ocean, Global Biogeochem. Cy., 10, 347–359, https://doi.org/10.1029/96GB00366, 1996.
Jones, R. D. and Amador, J. A.: Methane and carbon monoxide production, oxidation, and turnover times in the Caribbean Sea as influenced by the Orinoco River, J. Geophys. Res., 98, 2353–2359, https://doi.org/10.1029/92JC02769, 1993.
Kettle, A. J.: Diurnal cycling of carbon monoxide (CO) in the upper ocean near Bermuda, Ocean Model., 8, 337–367, https://doi.org/10.1016/j.ocemod.2004.01.003, 2005.
Kieber, D. J., Miller, G. W., Neale, P. J., and Mopper, K.: Wavelength and temperature-dependent apparent quantum yields for photochemical formation of hydrogen peroxide in seawater, Env. Sci.: Processes Impacts, 16, 777–791, https://doi.org/10.1039/C4EM00036F, 2014.
Li, Y., He, Z., Yang, G. P., Wang, H., and Zhuang, G. C.: Volatile halocarbons in the marine atmosphere and surface seawater: diurnal and spatial variations and influences of environmental factors, Atmos. Environ. 214, 116820, https://doi.org/10.1016/j.atmosenv.2019.116820, 2019.
Liss, P. S. and Duce, R. A. (Eds.): The sea surface and global change, Cambridge University Press, Cambridge, UK, ISBN 0-521-56273-2, 1997.
Liss, P. S. and Duce, R. A.: The Sea Surface and Global Change, Cambridge University Press, UK, ISBN-13 978-0511525025, 2005.
Liss, P. S. and Merlivat, L.: Air-sea gas exchange rates: Introduction and synthesis, in: The role of air-sea exchange in geochemical cycling, edited by: Buat-Ménard, P., 113–127, Springer, Dordrecht, the Netherlands, http://publication/uuid/BAFDE7E6-A29C-466C-B1CD-2A7DAFF930D5 (last access: 9 February 2026), 1986.
Ma, Q. Y. and Yang, G. P.: Roles of phytoplankton, microzooplankton, and bacteria in DMSP and DMS transformation processes in the East China Continental Sea, Prog. Oceanogr., 103003, https://doi.org/10.1016/j.pocean.2023.103003, 2023.
Mopper, K. and Kieber, D. J.: Photochemistry and cycling of carbon, sulfur, nitrogen and phosphorus, in: Biogeochemistry of Marine Dissolved Organic Matter, edited by: Hansell, D. A. and Carlson, C. A., AP, https://doi.org/10.1016/b978-012323841-2/50011-7, 2002.
Nguyen, N. H., Turner, A. J., Yin, Y., Prather, M. J., and Frankenberg, C.: Effects of chemical feedbacks on decadal methane emissions estimates, Geophys. Res. Lett., 47, e2019GL085706, https://doi.org/10.1029/2019GL085706, 2020.
Obernosterer, I., Catala, P., Reinthaler, T., Herndl, G. J., and Lebaron, P.: Enhanced heterotrophic activity in the surface microlayer of the Mediterranean Sea, Aquat. Microb. Ecol., 39, 293–302, https://doi.org/10.3354/ame039293, 2006.
Obernosterer, I., Catala, P., Lami, R., Caparros, J., Ras, J., Bricaud, A., Dupuy, C., van Wambeke, F., and Lebaron, P.: Biochemical characteristics and bacterial community structure of the sea surface microlayer in the South Pacific Ocean, Biogeosciences, 5, 693–705, https://doi.org/10.5194/bg-5-693-2008, 2008.
Orellana, M. V., Matrai, P. A., Leck, C., Rauschenberg, C. D., Lee, A. M., and Coz, E.: Marine microgels as a source of cloud condensation nuclei in the high Arctic, P. Natl. Acad. Sci. USA, 108, 13612–13617, https://doi.org/10.1073/pnas.1102457108, 2011.
Pereira, R., Schneider-Zapp, K., and Upstill-Goddard, R. C.: Surfactant control of gas transfer velocity along an offshore coastal transect: results from a laboratory gas exchange tank, Biogeosciences, 13, 3981–3989, https://doi.org/10.5194/bg-13-3981-2016, 2016.
Pereira, R., Ashton, I., Sabbaghzadeh, B., Shutler, J. D., and Upstill-Goddard, R. C., Reduced air–sea CO2 exchange in the Atlantic Ocean due to biological surfactants, Nat. Geosci., 11, 492–496, https://doi.org/10.1038/s41561-018-0136-2, 2018.
Ren, C., Yang, G., and Lu, X.: Autumn photoproduction of carbon monoxide in Jiaozhou Bay China, J. Ocean U. China, 13, 428–436, https://doi.org/10.1007/s11802-014-2225-1, 2014.
Rickard, P. C., Uher, G., Upstill-Goddard, R. C., Frka, S., Mustaffa, N. I. H., Banko-Kubis, H. M., Hanne Marie, B. K., Ana Cvitesic, K., Blazenka, G., Christian, S., Oliver, W., and Ribas-Ribas, M.: Reconsideration of seawater surfactant activity analysis based on an inter-laboratory comparison study, Mar. Chem., 208, 103–111, https://doi.org/10.1016/j.marchem.2018.11.012, 2019.
Rickard, P. C., Uher, G., and Upstill Goddard, R. C.: Photo reactivity of surfactants in the sea surface microlayer and subsurface water of the Tyne estuary, UK, Geophys. Res. Lett., 49, e2021GL095469, https://doi.org/10.1029/2021GL095469, 2022.
Sabbaghzadeh, B., Upstill-Goddard, R. C., Beale, R., Pereira, R., and Nightingale, P. D.: The Atlantic Ocean surface microlayer from 50° N to 50° S is ubiquitously enriched in surfactants at wind speeds up to 13 m s−1, Geophys. Res. Lett., 44, 2852–2858, https://doi.org/10.1002/2017GL072988, 2017.
Schlitzer, R.: Ocean Data View, http://odv.awi.de (last access: 9 February 2026), 2023.
Shaharom, S., Latif, M. T., Khan, M. F., Yusof, S. N. M., Sulong, N. A., Wahid, N. B. A., Uning, R., and Suratman, S.: Surfactants in the sea surface microlayer, subsurface water and fine marine aerosols in different background coastal areas, Environ. Sci. Pollut. Res. Int., 25, 27074–27089, https://doi.org/10.1007/s11356-018-2745-0, 2018.
Song, G., Richardson, J. D., Werner, J. P., Xie, H., and Kieber, D. J.: Carbon monoxide photoproduction from particles and solutes in the Delaware estuary under contrasting hydrological conditions, Environ. Sci. Technol., 49, 14048–14056, https://doi.org/10.1021/acs.est.5b02630, 2015.
Stedmon, C. A., Markager, S., and Bro, R.: Tracing dissolved organic matter in aquatic environments using a new approach to fluorescence spectroscopy, Mar. Chem., 82, 239–254, https://doi.org/10.1016/S0304-4203(03)00072-0, 2003.
Stubbins, A., Uher, G., Kitidis, V., Law, C. S., Upstill-Goddard, R. C., and Woodward, E. M. S.: The open-ocean source of atmospheric carbon monoxide, Deep-Sea Res. Pt. II, 53, 1685–1694, https://doi.org/10.1016/j.dsr2.2006.05.010, 2006.
Stubbins, A., Law, C. S., Uher, G., and Upstill-Goddard, R. C.: Carbon monoxide apparent quantum yields and photoproduction in the Tyne estuary, Biogeosciences, 8, 703–713, https://doi.org/10.5194/bg-8-703-2011, 2011.
Sugai, Y., Tsuchiya, K., Shimode, S., and Toda, T.: Photochemical Production and Biological Consumption of CO in the SML of Temperate Coastal Waters and Their Implications for Air-Sea CO Exchange, J. Geophys. Res.-Oceans, 125, 1–14, https://doi.org/10.1029/2019JC015505, 2021.
Sun, H., Zhang, Y. H., Tan, S., Zheng, Y. F., Zhou, S., Ma, Q. Y., Yang, G. P., Todd, J., and Zhang, X. H.: DMSP-Producing Bacteria Are More Abundant in the Surface Microlayer than Subsurface Seawater of the East China Sea, Microb. Ecol., 80, 350–365, https://doi.org/10.1007/s00248-020-01507-8, 2020.
Swinnerton, J. W., Linnenbom, V. J., and Lamontagne, R. A.: The ocean: a natural source of carbon monoxide, Science, 167, 984–986, https://doi.org/10.1126/science.167.3920.984, 1970.
Troxler, R. F.: Synthesis of bile pigments in plants. Formation of carbon monoxide and phycocyanobilin in wild-type and mutant strains of the alga, Cyanidium caldarium, Biochemistry, 11, 4235–4242, https://doi.org/10.1021/bi00773a007, 1972.
Walker, C. F., Harvey, M. J., Smith, M. J., Bell, T. G., Saltzman, E. S., Marriner, A. S., McGregor, J. A., and Law, C. S.: Assessing the potential for dimethylsulfide enrichment at the sea surface and its influence on air–sea flux, Ocean Sci., 12, 1033–1048, https://doi.org/10.5194/os-12-1033-2016, 2016.
Wang, F., Feng, T., Guo, Z., Li, Y., Lin, T., and Rose, N. L.: Sources and dry deposition of carbonaceous aerosols over the coastal East China Sea: Implications for anthropogenic pollutant pathways and deposition, Environ. Pollut., 245, 771–779, https://doi.org/10.1016/j.envpol.2018.11.059, 2019.
Wang, H., Sun, F., and Liu, W.: Characteristics of Streamflow in the Main stream of Changjiang River and the Impact of the Three Gorges Dam, Catena, 189, 104498, https://doi.org/10.1016/j.catena.2020.104498, 2020.
Weishaar, J. L., Aiken, G. R., Bergamaschi, B. A., Fram, M. S., Fujii, R., and Mopper, K.: Evaluation of specific ultraviolet absorbance as an indicator of the chemical composition and reactivity of dissolved organic carbon, Environ. Sci. Technol., 37, 4702–4708, https://doi.org/10.1021/es030360x, 2003.
Wiesenburg, D. A. and Guinasso, N. L.: Equilibrium solubilities of methane, carbon monoxide, and hydrogen in water and sea water, J. Chem. Eng. Data, 24, 356–360, https://doi.org/10.1021/je60083a006, 1979.
Wurl, O., Miller, L., Röttgers, R., and Vagle, S.: The distribution and fate of surface-active substances in the sea-surface microlayer and water column, Mar. Chem., 115, 1–9, https://doi.org/10.1016/j.marchem.2009.04.007, 2009.
Wurl, O., Stolle, C., Thuoc, C. V., Thu, P. T., and Mari, X.: Biofilm-like properties of the sea surface and predicted effects on air-sea CO2 exchange, Prog. Oceanogr., 144, 15–24, https://doi.org/10.1016/j.pocean.2016.03.002, 2016.
Xie, H., Andrews, S. S., Martin, W. R., Miller, J., and Zafiriou, O. C.: Validated methods for sampling and headspace analysis of carbon monoxide in seawater, Mar. Chem., 77, 93–108, https://doi.org/10.1016/S0304-4203(01)00065-2, 2002.
Xie, H., Zafiriou, O. C., Umile, T. P., and Kieber, D. J.: Biological consumption of carbon monoxide in Delaware Bay, NW Atlantic and Beaufort Sea, Mar. Ecol. Prog. Seri., 290, 1–14, https://doi.org/10.3354/meps290001, 2005.
Xie, H. X., Bélanger, S., Demers, S., Vincent, W. F., and Papakyriakou, T. N.: Photobiogeochemical cycling of carbon monoxide in the southeastern Beaufort Sea in spring and autumn, Limnol. Oceanogr., 54, 234–249, https://doi.org/10.4319/lo.2009.54.1.0234, 2009.
Xu, G. B., Xu, F., Ji, X., Zhang, J., Yan., S. B., Mao, S. H., and Yang, G. P.: Carbon monoxide cycling in the Eastern Indian Ocean, J. Geophys. Res.-Oceans, 128, https://doi.org/10.1029/2022JC019411, 2023.
Yamashita, Y. and Jaffe, R.: Characterizing the interactions between trace metals and dissolved organic matter using excitation-emission matrix and parallel factor analysis, Environ. Sci. Technol., 42, 7374–7379, https://doi.org/10.1021/es801357h, 2008.
Yamashita, Y., Hashihama, F., Saito, H., Fukuda, H., and Ogawa, H.: Factors controlling the geographical distribution of fluorescent dissolved organic matter in the surface waters of the Pacific Ocean, Limnol. Oceanogr., 62, 2360–2374, https://doi.org/10.1002/lno.10570, 2017.
Yang, G. P., Watanabe, S., and Tsunogai, S.: Distribution and cycling of dimethylsulfide in surface microlayer and subsurface seawater, Mar. Chem., 76, 137–153, https://doi.org/10.1016/S0304-4203(01)00054-8, 2001.
Yang, G. P., Tsunogai, S., and Watanabe, S.: Biogenic sulfur distribution and cycling in the surface microlayer and subsurface water of Funka Bay and its adjacent area, Cont. Shelf Res., 25, 557–570, https://doi.org/10.1016/j.csr.2004.11.001, 2005.
Yang, G. P., Ren, C. Y., Lu, X. L., Liu, C. Y., and Ding, H. B.: Distribution, flux, and photoproduction of carbon monoxide in the East China Sea and Yellow Sea in spring, J. Geophys. Res.-Oceans, 116, C02001, https://doi.org/10.1029/2010jc006300, 2011.
Yang, G. P., Wang, W. L., Lu, X. L., and Ren, C. Y.: Distribution, flux and biological consumption of carbon monoxide in the Southern Yellow Sea and the East China Sea, Mar. Chem., 122, 74–82, https://doi.org/10.1016/j.marchem.2010.08.001, 2010.
Yang, L., Zhang, J., and Yang, G. P.: Mixing behavior, biological and photolytic degradation of dissolved organic matter in the East China Sea and the Yellow Sea, Sci. Total Environ., 762, 143164, https://doi.org/10.1016/j.scitotenv.2020.143164, 2021.
Yang, L., Zhang, J., Engel, A., and Yang, G.-P.: Spatio-temporal distribution, photoreactivity and environmental control of dissolved organic matter in the sea-surface microlayer of the eastern marginal seas of China, Biogeosciences, 19, 5251–5268, https://doi.org/10.5194/bg-19-5251-2022, 2022.
Yang, L., Gong, C. Y., Mo, X. J., Zhang, J., Yang, B., and Yang, G. P.: Carbon monoxide in the marine atmosphere and seawater: Spatiotemporal distribution and photobiogeochemical cycling, J. Geophys. Res.-Oceans, 129, e2024JC021286, https://doi.org/10.1029/2024JC021286, 2024.
Yu, C., Lu, C., Li, Y., Li, H., Lin, J., and Chang, L.: Spatial and temporal variation of nutrient distribution in the Yangtze River estuary and adjacent waters: insights from GOCI data analysis, Mar. Environ. Res., 204, https://doi.org/10.1016/j.marenvres.2024.106895, 2025.
Zafiriou, O. C., Andrews, S. S., and Wang, W.: Concordant estimates of oceanic carbon monoxide source and sink processes in the Pacific yield a balanced global “blue-water” CO budget, Global Biogeochem. Cy., 17, 1015–1027, https://doi.org/10.1029/2001gb001638, 2003.
Zafiriou, O. C., Xie, H., Nelson, N. B., and Wang, N. W.: Diel carbon monoxide cycling in the upper Sargasso Sea near Bermuda at the onset of spring and in midsummer, Limnol. Oceanogr., 53, 835–850, https://doi.org/10.4319/lo.2008.53.2.0835, 2008.
Zhang, J., Liu, S. M., Ren, J. L., Wu, Y., and Zhang, G. L.: Nutrient gradients from the eutrophic Changjiang (Yangtze River) estuary to the oligotrophic kuroshio waters and re-evaluation of budgets for the east China sea shelf, Prog. Oceanog., 74, 449–478, https://doi.org/10.1016/j.pocean.2007.04.019, 2007.
Zhang, J., Wang, J., Zhuang, G. C., and Yang, G. P.: Carbon monoxide cycle in the Bohai Sea and the Yellow Sea: Spatial variability, sea-air exchange and biological consumption in autumn, J. Geophys. Res.-Oceans, 124, 4248–4257, https://doi.org/10.1029/2018JC014864, 2019.
Zhang, Y. and Xie, H.: The sources and sinks of carbon monoxide in the St. Lawrence system, Deep-Sea Res. Pt. II, 81, 114–123, https://doi.org/10.1016/j.dsr2.2011.09.003, 2012.
Zhang, Y., Xie, H., Fichot, C. G., and Chen, G.: Dark production of carbon monoxide (CO) from dissolved organic matter in the St. Lawrence estuarine system: Implication for the global coastal and blue water CO budgets, J. Geophys. Res.-Oceans, 113, 1–9, https://doi.org/10.1029/2008JC004811, 2008.
Zhao, B. Z., Yang, G. P., Xie, H., Lu, X. L., and Yang, J.: Distribution, flux and photoproduction of carbon monoxide in the Bohai and Yellow Seas, Mar. Chem., 168, 104–113, https://doi.org/10.1016/j.marchem.2014.11.006, 2015.
Zhu, W. Z., Zhang, H. H., Zhang, J., and Yang, G. P.: Seasonal variation in chromophoric dissolved organic matter and relationships among fluorescent components, absorption coefficients, and dissolved organic carbon in the Bohai Sea, the Yellow Sea and the East China Sea, J. Mar. Syst., 180, 9–23, https://doi.org/10.1016/j.jmarsys.2017.12.003, 2018.