the Creative Commons Attribution 4.0 License.
the Creative Commons Attribution 4.0 License.
 | 24 Feb 2026
Enhanced methane cycling across the Laptev Sea signaled by time-integrated biomarkers of aerobic methane oxidation
Birgit Wild
Wei-Li Hong
Henry Holmstrand
Francisco J. A. Nascimento
Stefano Bonaglia
Denis Kosmach
Igor Semiletov
Natalia Shakhova
Örjan Gustafsson
Elevated methane concentrations in seawater have been reported over extensive areas of the East Siberian Arctic Seas, overlying thawing subsea permafrost. However, observed methane concentrations of the ephemeral seawater are highly variable across both space and time, compromised by both the timing of rare measurements and storm-driven exchanges to the atmosphere. Here, we applied time-integrated signals of the δ13C-composition of specific C30 hopanoids (diploptene, hop-17(21)-ene, neohop-13(18)-ene and diplopterol) in surface sediments to trace aerobic methane oxidation as a proxy for enhanced methane cycling. Interpretations of hopanoids and possible sources were further assessed by 16S-rRNA analyses in the surface sediments. The consistently low δ13C-C30 hopenes signals, ranging between −57.5 ‰ to −37.1 ‰ (n=23) across the Laptev Sea shelf indicated aerobic methane oxidation. This suggests ubiquitous methane cycling with the most pronounced intensities in the outer shelf region, broadly consistent with the observed methane concentrations. Notably, depleted δ13C-C30 hopenes were also found in the mid-shelf region of the Laptev Sea, earlier thought to be an area of comparatively low methane cycling. High methane concentrations were also observed in the vicinity of the Lena River delta, yet the isotopically heavier δ13C-C30 hopenes may here reflect a combination of lower aerobic methane oxidation, a greater relative abundance of type II methanotrophs (lower isotope fractionation during hopanoid production) and isotope dilution from non-methanotrophic sources. While this complicates the biomarker interpretation in the unique setting near the Lena River delta, the δ13C-C30 hopenes were still much lower than δ13C-organic carbon, indicating aerobic methane oxidation and a clear methane cycling signal also in this regime. Taken together, the results unravel the wider cross-shelf patterns of enhanced methane cycling in the Laptev Sea through probing of methane fossilised in membrane lipids of aerobic methanotrophs, with the molecular-isotopic pattern being preserved in the sedimentary archive.
- Article
(4184 KB) - Full-text XML
-
Supplement
(1068 KB) - BibTeX
- EndNote


Large uncertainties remain regarding methane (CH4) emissions from both anthropogenic and natural systems (Saunois et al., 2025; Schaeffer et al., 2025). Terrestrial permafrost stores massive amounts of carbon, but climate change and Arctic amplification have enhanced its thawing, causing net CH4 emissions to the atmosphere (Ramage et al., 2024; Hugelius et al., 2024). Subsea permafrost, formed from the inundation of the northern tundra during the last deglaciation, is often overlooked. Partly due to its inaccessibility, limiting the number of observations. However, observations display highly elevated CH4 concentrations in the shallow seawater column overlying subsea permafrost (e.g., Semiletov, 1999; Shakhova et al., 2010; Steinbach et al., 2021), which is currently thawing about ten times faster than nearby terrestrial permafrost in Northeastern Siberia (Shakhova et al., 2017; Wild et al., 2022).
The East Siberian Arctic Shelf (ESAS), the world's largest continental shelf sea, is very shallow (on average, ca. 50 m) and estimated to host the majority of the world's subsea permafrost (Romanovskii and Hubberten, 2001; Romanovskii et al., 2005; Overduin et al., 2019). The concentration of CH4 in the surface waters of the ESAS is, particularly in the Laptev Sea, much higher than what would be expected from CH4 levels in the atmospheric boundary layer, suggesting that the thawing subsea permafrost system may serve as a conduit for CH4 release to the atmosphere (Shakhova et al., 2010, 2014, 2019). A key challenge to constrain the geospatial pattern of CH4 releases is the short-term variability of water column CH4 concentrations, together with the sparseness of observations over time in this remote region. While subsea permafrost thaw and related CH4 emissions are governed by environmental changes on decadal time-scales (Shakhova et al., 2017, 2019), the sparse and infrequent measurements of water column CH4 concentrations might capture neither temporal nor geospatial trends of CH4 emissions from these systems. Water sampling has revealed the general pattern of elevated CH4 concentrations and discovered a few major hotspots, but this pattern is strongly affected by short-term variability governed by storms and the shallow water column of the Laptev Sea (e.g., Shakhova et al., 2014). Furthermore, a recent modeling study concluded that current atmospheric observation networks are not able to detect abrupt CH4 releases from this region (Wittig et al., 2024). To better grasp the CH4 dynamics over a longer timespan than what is captured in snapshot seawater samples, there is a need for an integrated metric to observe patterns of long-term CH4 release from the subsea permafrost system over both space and time scales.
Specific biomarkers in surface sediments offer an opportunity to study large-scale variabilities in CH4 and its dynamics integrated over time scales of years to decades. Bacteria in oxygenated sediments and in the water column can utilize CH4 as an energy and carbon source through aerobic CH4 oxidation (AeOM), converting it to carbon dioxide (CO2; Hanson and Hanson, 1996), or assimilating it into biomass (e.g., lipid synthesis). Hopanoid lipids such as diploptene and diplopterol are important constituents of the cell membranes of Methane Oxidizing Bacteria (MOB) carrying out these processes (Summons et al., 1994), but can also derive from bacteriohopanepolyols (BHPs) upon diagenesis (Mackenzie et al., 1981). Hopanoids and BHPs are not only produced by MOB, but can stem from a variety of aerobic and anaerobic bacteria utilizing CH4 and/or inorganic/organic carbon (Rohmer et al., 1980; Summons et al., 1999; Sinninghe Damsté et al., 2004; Belin et al., 2018). Thus, hopanoid analyses are frequently combined with compound-specific isotope analysis of stable carbon isotopes (δ13C) to relate these biomarkers to CH4 cycling. The isotopically depleted stable carbon isotopes of CH4, δ13C-CH4 (as low as −90 ‰; Milkov and Etiope, 2018), is used to differentiate CH4-derived hopanoids from other sources. Thereby, C30-hopanoids (hopanoids with 30 carbon atoms) have been used as a proxy to infer enhanced CH4 cycling in past climates (e.g., Hinrichs, 2001; Hinrichs et al., 2003; Birgel and Peckmann, 2008; Sun et al., 2022; Blumenberg et al., 2024; Yan et al., 2025) and contemporary systems (Davies et al., 2016; Inglis et al., 2019). Generally, enhanced CH4 cycling has been linked to decreasing δ13C values of hopanoids (e.g., Inglis et al., 2019; van Winden et al., 2020; Yan et al., 2025). Therefore, δ13C-hopanoids may be used as a time-integrated signal of enhanced CH4 cycling. In particular, hopanoid carbon chain lengths ≤ C30 are often more depleted in 13C compared to C31-hopanoids and therefore closely associated with MOB production of hopanoids (Inglis et al., 2019). While the proxy has been widely used to study CH4 dynamics in past climates, contemporary system calibrations of ≤ C30 hopanoids only exist in peatlands (≤ C30 hopanoids between −21 ‰ and −45 ‰; Inglis et al., 2019) and lacustrine systems (diploptene ranging from −38.8 ‰ to −68.8 ‰; Davies et al., 2016). The lack of a large-scale comparison of CH4 and hopanoids in marine systems leaves uncertainties when interpreting δ13C-hopanoids as tracers of CH4 cycling in geological records. In summary, δ13C-hopanoids in oxygenated surface sediments can be an informative tool to constrain a time-integrated signal of enhanced CH4 cycling on a years-decade scale, complementing observations of CH4 concentrations in seawater which is highly variable over much shorter time-scales.
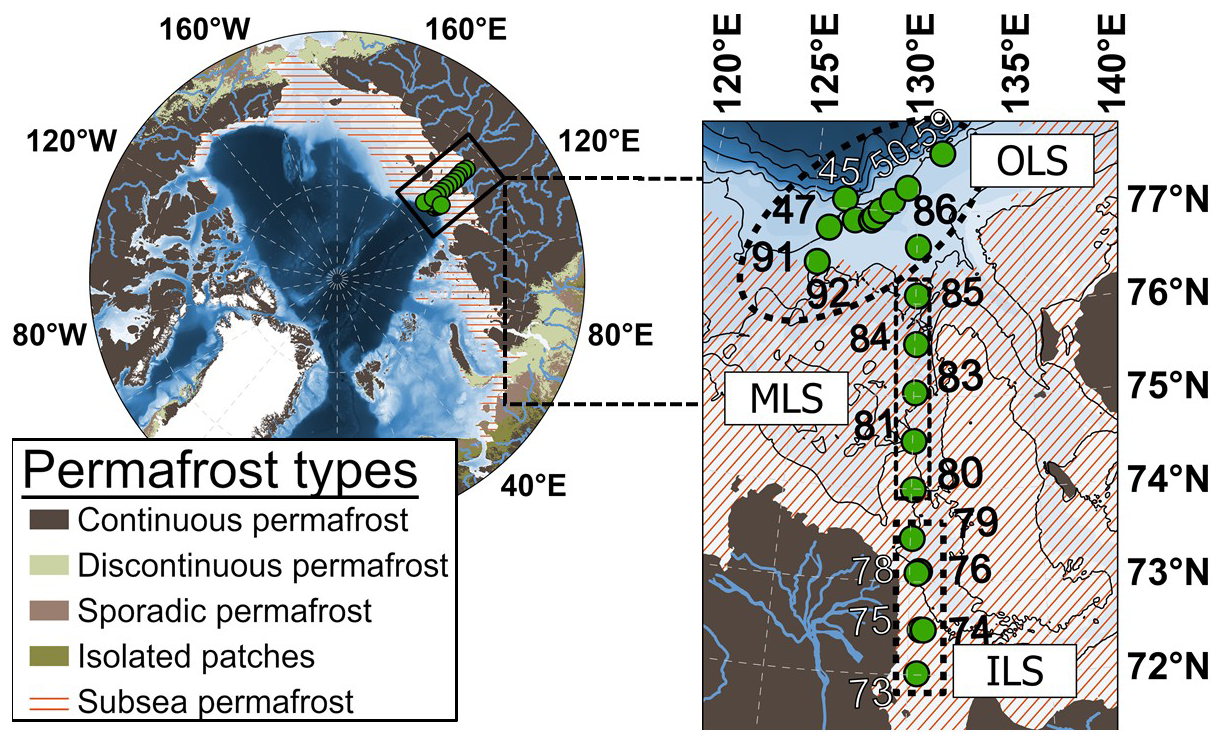
Figure 1The Laptev Sea sampling locations and station numbers, including estimates of the current Arctic land and subsea permafrost covers. Permafrost datasets were generated from Obu et al. (2019) and Overduin et al. (2019). The bathymetry was plotted using IBCAO version 5.0 (Jakobsson et al., 2024).
Observations across the Laptev Sea suggest the presence of AeOM, but its efficiency is questionable and spatially variable. The Laptev Sea water and surface sediments are well oxygenated (Stepanova et al., 2017; Brüchert et al., 2018; Maciute et al., 2025), with the water column oxygen saturation ranging from 70 %–100 % during expeditions between 2015 and 2020 (Xie et al., 2023). This combined with high CH4 concentrations, indicates the general possibility for AeOM. Furthermore, microbial studies have confirmed the presence of MOB in Laptev Sea sediments and water column (Samylina et al., 2021; Savvichev et al., 2023). Recent machine-learning estimations deemed the global AeOM to be generally efficient in coastal waters (Mao et al., 2022), but AeOM observations in the vicinity of the Lena River delta display a rather weak methanotrophic sink, with a CH4 turnover time of 193 d in mixed sea/river water (Bussmann et al., 2017). In contrast, incubation experiments in the outer Laptev Sea cold seep region suggest more efficient AeOM in those surface sediments (Tikhonova et al., 2021), but with very low AeOM rates in the water column (300–1000 d turnover time, Shakhova et al., 2015). Taken together, AeOM is active in the Laptev Sea, but observations are diverging on the scale and efficiency of AeOM across the Laptev Sea. Such discrepancies highlight the importance of constraining the geospatial distribution of AeOM to unravel areas of more intense CH4 cycling.
In this study, we explore AeOM biomarkers as time-integrated proxies of CH4 cycling in Arctic Ocean water and sediments, focusing on the Laptev Sea. We hypothesize that known CH4 ebullition hotspots in the Outer Laptev Sea and Inner Laptev Sea (OLS and ILS), where > 1000 nM dissolved CH4 concentrations have been observed (Shakhova et al., 2010, 2014; Steinbach et al., 2021), have high concentrations of AeOM-tracing C30 hopanoids (diploptene, hop-17(21)-ene, neohop-13(18)-ene and diplopterol) with low δ13C values. In contrast, we hypothesize that the mid-shelf region without any discovered CH4 hotspots, yet with dissolved CH4 concentrations in the range 10–60 nM (Fig. 2) display lower concentrations of C30 hopanoids more enriched in 13C. Observations of AeOM biomarkers are also compared to water CH4 concentrations and 16S-rRNA data on abundance of MOB- and non-methanotrophic hopanoid-producing bacteria. We finally use this dataset to explore the geospatial distribution of CH4 cycling across the 600 km wide Laptev Sea shelf. Insights from this study also allows to establish some general considerations for interpreting hopanoids in geological records.
2.1 Study area and the ISSS-2020 expedition
During the last deglaciation, sea level rise caused the northern regions of East Siberian permafrost to be submerged, thus forming the present coverage of Laptev Sea subsea permafrost (Romanovskii and Hubberten, 2001; Romanovskii et al., 2005; Nicolsky and Shakhova, 2010; Shakhova et al., 2017; Lindgren et al., 2018; Overduin et al., 2019). The Laptev Sea water column is shallow (average water depth ∼ 50 m), with well oxygenated top mm to cm of surface sediments (Brüchert et al., 2018; Maciute et al., 2025). Ebullition appears to be a key transport vector in this shallow region, transferring large amounts of CH4 to the water column (Shakhova et al., 2010, 2014; Steinbach et al., 2021). The Inner (ILS; latitudes < 73.9° N and longitudes ∼ 130° E) and Outer Laptev Sea hotspot regions (OLS; latitudes ≥ 76.1° N and longitudes 125-131° E) are established as areas of extensive CH4 cycling in the water column, with their shallowness causing frequent ventilation of the water column CH4 to the overlying atmosphere (e.g., Shakhova et al., 2010, 2014; Thornton et al., 2016, 2020; Steinbach et al., 2021; Chernykh et al., 2023). Results from campaigns of subsea permafrost drilling have indicated rapid thawing of subsea permafrost in the ILS region (e.g., Shakhova et al., 2017). Thawing subsea permafrost is considered to facilitate CH4 release from the very shallow ILS (Shakhova et al., 2014; Sapart et al., 2017; Wild et al., 2022). In the deeper, yet still shallow OLS (46–72 m), a thermogenic gas reservoir has been constrained as the main CH4 source using triple isotope fingerprinting (Steinbach et al., 2021). The Laptev Sea is also strongly influenced by the Lena River plume (Shakhova and Semiletov, 2007; Shakhova et al., 2010). While the ILS receives substantial amounts of organic carbon from the Lena River (Vonk et al., 2012; Holmes et al., 2012; McClelland et al., 2016; Bröder et al., 2018; Martens et al., 2022), the riverine export of CH4 is negligible in comparison to the regional CH4 emissions (Shakhova and Semiletov, 2007; Shakhova et al., 2010). The mid-outer Laptev Sea transect (MLS; latitudes between 73.9–76.1° N and longitudes ∼ 130° E) is, in contrast, an area of lower CH4 concentrations than the ILS and OLS, yet the still elevated CH4 levels over extensive MLS scales (Shakhova et al., 2010) call for investigations on potential CH4 sources also for this region. Samples in the current study were collected from the Laptev Sea during the International Siberian Shelf Study in 2020 (ISSS-2020; September–November 2020) aboard the research vessel Akademik Keldysh (Fig. 1).
2.2 Sediment and Water Sampling
2.2.1 Sediment sampling
Sediment samples were retrieved using an Oktopus Multicorer System that sampled eight cores per station with an undisturbed sediment-water interface. The penetration depth of the liners were maximum of 30 cm. Overlying water was drained off the surface sediment in the cores and the sediment was subsequently sectioned in 1 cm intervals onboard using an Oktopus Core Extruder. All sediment subsamples for organic geochemical analyses were immediately frozen in plastic seal bags and the 1–2 cm slice in each core was used to extract lipid biomarkers for this study.
Sediment cores with pre-drilled holes on the liners were collected for 16S-rRNA analysis at n= 36 stations (Maciute et al., 2025), where n=11 samples from the Laptev Sea shelf were used in this study. The overlying water was siphoned from the top of the sediment core and 3 ml of sediment was subsampled from three sampling depths in the core (0–1.5, 1.5–3, and 3–4.5 cm). Subsamples were vortexed with 10 mL RNA later (Sigma Aldrich) and stored for 2 h at 4 °C before being frozen at −80 °C. In this study, we only report the top 0–1.5 cm subsection for microbial analyses, as the focus was on aerobic CH4 oxidizers.
2.2.2 Measurements of dissolved methane concentration in the water column
Water samples were taken from a Rosette sampler with 24×10 L bottles, closed at selected depths. Subsamples were immediately taken through silicon tubes into 60 mL Luer-lock plastic syringes for onboard CH4 concentration measurements. Briefly, a Restek reservoir bag was used for helium headspace equilibration with an IKA KS 260 benchtop shaker. Before concentration measurements using Gas Chromatography-Flame Ionization Detection (GC-FID), the gases were transferred through stainless-steel Millipore filter holders packed with granular Drierite and quartz wool, sealed using PTFE tape. The CH4 concentration measurements were made with 5 mL sample injections through one Porapak Q packed pre-column and a 3 m Heyesep D column before FID. In this study, the surface water is described as the topmost CTD/Rosette-based water samples (mean = 3.5 m; n=21) and the sub-pycnocline (mean = 37 m; n= 71) as water samples below the largest density gradient (σθ) based on the CTD profile (Conductivity, Temperature and Depth). The sub-pycnocline concentrations are here reported as the median and interquartile ranges of all samples between the pycnocline and the bottom water (Fig. 2).
2.3 Measurements of methane-tracing lipid biomarkers and their isotope composition
Bulk organic carbon and stable carbon isotope (δ13C-OC) analyses of the 1–2 cm slice in each multicore were made according to standard operating procedures at Stockholm University (e.g., Martens et al., 2020). Briefly, ∼ 10 mg freeze-dried sediment was weighed in silver capsules and acidified with 100 µL 1 M HCl twice for the removal of inorganic carbon. After the first acidification, the sample was stored at 50 °C for 3–4 h, followed by acidification again and reaction at 50 °C overnight. The acidified samples were wrapped in tin capsules and analysed with an elemental analyser coupled to an isotope ratio mass spectrometer (EA-irMS, Delta V Plus, Thermo Scientific, Germany).
2.3.1 Lipid extraction
Around 5 g of freeze-dried sediment was subsampled from one core per station. Before the extractions, internal standards were added to each sample (5α-androstane, tetracosane-d50, triacontane-d62, eicosanoic acid-d39, 2-hexadecanol and stigmasterol-d5) to calculate recoveries and correct for losses during the laboratory procedure. The lipid extraction and clean-up were a modification of standard operating procedures at Stockholm University (e.g., van Dongen et al., 2008; Vonk et al., 2012; Martens et al., 2020). Briefly, lipids were extracted using accelerated solvent extraction (ASE 350, Dionex), followed by elemental sulphur and water removal from the extracts by addition of HCl-activated Cu and anhydrous NaSO4. The total lipid extracts were saponified for 2 h at 80 °C following the addition of ∼ 3 mL KOH (6 % in MeOH) to each of the dried samples. Base-catalysed hydrolysis was applied as it has been shown to increase the amount of hopenes through dehydration of diplopterol (Sessions et al., 2013). The saponified neutral lipids (containing hopanoids, alkanes, sterols and alkenones) were collected with liquid-liquid extraction five times with the addition of 1 mL Milli-Q water and ∼ 2 mL hexane: DCM (9:1, ). After collecting the neutral fraction, the saponified sample was acidified to pH 1 with 6 M HCl, ∼ 2 mL hexane: DCM (9:1, ) was added, the sample was mixed and the supernatant containing the fatty acid fraction was collected. The fatty acid liquid-liquid extraction was repeated five times in total. In this study, we focused on the neutral fraction, containing hopanes/hopenes/diplopterol.
Following the saponification and separation of the neutral and fatty acid fractions, preparative chromatography was applied to the neutral fraction, with furnace-baked alkaline Al2O3 (∼ 0.5 g) in a pre-combusted Pasteur pipette as the stationary phase. The neutral fraction was separated into non-polar hydrocarbons (hopanes/hopenes, F1), alkenones/diplopterol (F2) and polar hydrocarbons (F3) using 4 mL hexane: DCM (9:1, ), hexane: DCM (1:1) and DCM: MeOH (1:1, ), respectively. To enable clean chromatograms for δ13C measurements, urea adduction was applied to purify the non-polar extracts (Pancost et al., 2008; Inglis et al., 2019). The sample was separated into an adduct (containing n-alkanes) and a non-adduct fraction (containing cyclic and branched hydrocarbons, e.g., hopenes). Before instrument analysis, the diplopterol fraction was silylated for 1h at 80 °C using BSTFA: pyridine (1:1).
2.3.2 Hopanoid identification and quantification
Hopanoids were quantified using gas chromatography-mass spectrometry (GC-MS 7820-A, Agilent Technologies USA) with a DB5-MS ultra-inert column (30 m × 250 µ m × 0.25 µm). The GC-MS was run in splitless mode with a starting temperature of 50 °C for 2 min, then 10 °C min−1 to 210 °C, where the temperature increased by 3 °C min−1 to 262 °C for 10 min. Thereafter, the temperature increased by 0.5 °C min−1 to 270 °C and lastly a 3 °C min−1 ramp until 310 °C for 5 min. A post-run at 305 °C for 2 min was used to minimize sample carryover. Identification of hopanoids was done according to published mass spectra in Sessions et al. (2013), Sinninghe Damsté et al. (2014) and Elvert and Niemann (2008). Hopenes were quantified using the C30 hopane external calibration standard (NIST 2266). However, during sample pre-treatment, dehydration of diplopterol and subsequent conversion to diploptene and hop-21-ene were observed within F2. This was likely catalysed by the basic Al2O3 column, as the problem resolved when switching to neutral Al2O3, which was used to separate the molecules before the final analysis. Diplopterol dehydration commonly occurs during sample workup, even during instrumental analysis (Kannenberg et al., 1995; Sessions et al., 2013). Thus, in this paper, we only present the δ13C value of diplopterol when possible and not its concentrations.
2.3.3 Compound-specific isotope analysis of hopanoids
Compound-specific isotope analysis (CSIA) of hopenes/diplopterol was carried out at Stockholm University using gas chromatography coupled to continuous flow isotope ratio mass spectrometry (GC-irMS; Trace-GC, GC-Isolink and Delta V Plus, Thermo Scientific, Germany) on a DB5-MS ultra-inert column (60 m × 0.25 mm × 0.25 µm). The oven temperature program was the same as for GC-MS analyses. Briefly, triplicate 3 µL injections were made for each sample and quantified using external n-alkane standards (n-alkane mixture A7, Dr. Arndt Schindelmann, Indiana University). Before each batch of sample measurements, the precision and linearity of n-alkane standards were monitored to ensure precision ≤ 0.5 ‰ (n= 6). The reproducibility of triplicate sample measurements was 0.1 ‰–2.3 ‰ (mean = 0.8 ‰). The higher standard deviations of some samples were attributed to lower peak areas, causing less precise measurements. To minimize the precision effect from lower peak areas, an acceptance threshold of ≥ 100 mV peak areas was set, at which n-alkane standard measurements yielded a precision of 0.9 ‰. The added trimethylsilyl (TMS; Si-(CH3)3) in δ13C measurements was corrected by measuring a silylated β-sitosterol standard using GC-irMS and the unsilylated β-sitosterol powder with EA-irMS. The difference in δ13C between the silylated and unsilylated standard was used as the δ13C of the added carbon to derivatized compounds, where f is the fraction of added carbon from the TMS group and δ13CTMS is the isotopic value of the TMS (Eq. 1).
2.4 Microbiology
2.4.1 DNA extraction and sequencing
Sediment samples were thawed and prepared to facilitate 16S-rRNA analyses as described in Maciute et al. (2025). Extractions were made from 2.9±0.7 g wet sediment and amplification of the 16S rRNA gene V4 region was conducted with the primers 515 F (Parada et al., 2016) and 806 R (Apprill et al., 2015). Library preparation was conducted using the NEBNext® Ultra™ II DNA Library Prep Kit with index adapters synthesized in-house by Novogene. The pooled library was sequenced on the Illumina NovaSeq 6000 SP platform with a 2×250 bp paired-end setup. The raw sequencing data have been uploaded to NCBI GenBank (https://www.ncbi.nlm.nih.gov/bioproject/, last access: 20 February 2026) and can be accessed at BioProject: PRJNA1264051.
2.4.2 Bioinformatics
A total of 2 341 395 million sequencing reads, averaging 65 039 reads per sample (36 samples in total) were analysed according to the DADA2 (version 1.28) pipeline (Callahan et al., 2016) with default settings except for the filter commands: truncLen=c(0,0), maxEE=2, truncQ=2, trimLeft=c(22,21); error model: MAX_CONSIST=30; merging of pair-ends: minOverlap=10; and chimera removal: allowOneOff=TRUE, minFoldParentOverAbundance=4. After trimming, filtering, merging pair-ends and chimera removal, a total of 89 148 amplicon sequence variants and 9.2 million sequences were retained, averaging 43 485 reads per sample (minimum 26 424 and maximum 66 969 reads per sample). The sequences in the created ASV table were then assigned to taxonomy using the SILVA database version 132 (Quast et al., 2013) and analysed further as relative abundances (i.e., [counts/∑counts] × 100) in RStudio software. Only the samples collected and sequenced from the Laptev Sea shelf are discussed in this study (n= 11).
2.4.3 Relative abundance of methane-oxidizing bacteria and non-methanotrophic hopanoid producers
Microbial sequencing data were explored for both aerobic methanotrophs as well as other hopanoid-producing bacteria. Aerobic methanotrophs were identified within Gammaproteobacteria (Type I) and Alphaproteobacteria (Type II). Bacteria within phyla that commonly encode shc (squalene-hopane cyclases, i.e., hopanoid producers), such as Cyanobacteria, were assumed to be hopanoid producers. Literature exploration of other organisms with documented production of hopanoids was made using LOTUS (Rutz et al., 2022) and was further used to assess “Other hopanoid producers”. Particularly, the abundance of certain Acidobacteria, Actinobacteria and non-methanotrophic Proteobacteria described in previous research of hopanoid producers (Sohlenkamp and Geiger, 2016; Sinninghe Damsté et al., 2017) was used to explore non-methanotrophic hopanoid producers. The information on all investigated hopanoid producers can be found in the supplementary data (data availability).
2.5 Statistical analyses
Statistical differences were evaluated using a significance level α= 0.05 in RStudio (Version 2024.12.1). One-way Welch's ANOVAs were applied to analyse differences in hopanoid concentrations and isotope signatures between the OLS, MLS and ILS due to the wide concentration ranges and the limited number of samples in the MLS. After Welch's ANOVAs, Games-Howell post-hoc tests were applied to verify where there were significant differences. Comparisons of CH4 concentrations above and below the pycnocline were made using t-tests assuming unequal variances. All statistical results (F-values, degrees of freedom, n-values, p-values and adjusted p-values) are reported in the Supplement Tables S1–S5.
Sequencing data indicated three microbial types of hopanoid producers (Figs. S1 and S2 in the Supplement) and no evidence for anammox bacteria. Aerobic methanotrophs and heterotrophs were most common and therefore used as the two endmembers for hopanoid source apportionment. The hopanoid source apportionment was calculated through a Bayesian stable carbon isotope mixing model using two endmembers (MOB and heterotrophic bacteria) applied with “simmr” in RStudio (Parnell et al., 2013). Due to a larger isotope fractionation in MOB-I hopanoid synthesis compared to MOB-II (Jahnke et al., 1999), the relative contribution of the different AeOM pathways was estimated using the relative abundance of MOB-I versus MOB-II within each sample (Eq.2). Since 16S-rRNA does not indicate the relative activity of these microbes, this approach is a semi-quantitative estimation of CH4-related hopanoid production. The associated isotope endmembers and isotope fractionation during hopanoid biosynthesis are displayed in Tables S6 and S7 and further described in Eqs. (2)–(4), where fMOB-I and fMOB-II are the fractions of MOB based on the relative abundance of 16S-rRNA. The Δδ13CMOB-I/II and Δδ13CDOC describe the isotope fractionation from CH4 to hopanoid and dissolved OC to hopanoid, respectively.
3.1 Large-scale spatial patterns of dissolved CH4 concentrations
The dissolved CH4 concentrations in the Laptev Sea were high compared to the atmospheric equilibrium at ∼ 4 nM. The sub-pycnocline CH4 concentrations for the 26 studied stations varied widely between 8 and 11 850 nM (median = 278 (IQR = 88–966) nM), with the highest concentrations at station 47 in the Outer Laptev Sea hotspot region (OLS; Fig. 2). The sub-pycnocline CH4 concentrations were significantly different between all regions (Table S1). The CH4 concentrations in the OLS (defined as latitudes ≥ 76.1° N and longitudes 125–131° E) were significantly higher compared to the Inner and Mid Laptev Sea (ILS/MLS; defined as latitudes < 73.9° N and 73.9–76.1° N and longitudes ∼ 130° E, respectively; Table S1). In all regions, dissolved CH4 was significantly lower in the surface water compared to below the pycnocline (Table S2). Additionally, surface water CH4 was significantly higher in the ILS hotspot region (Table S3) compared to the MLS and OLS (Table S3).
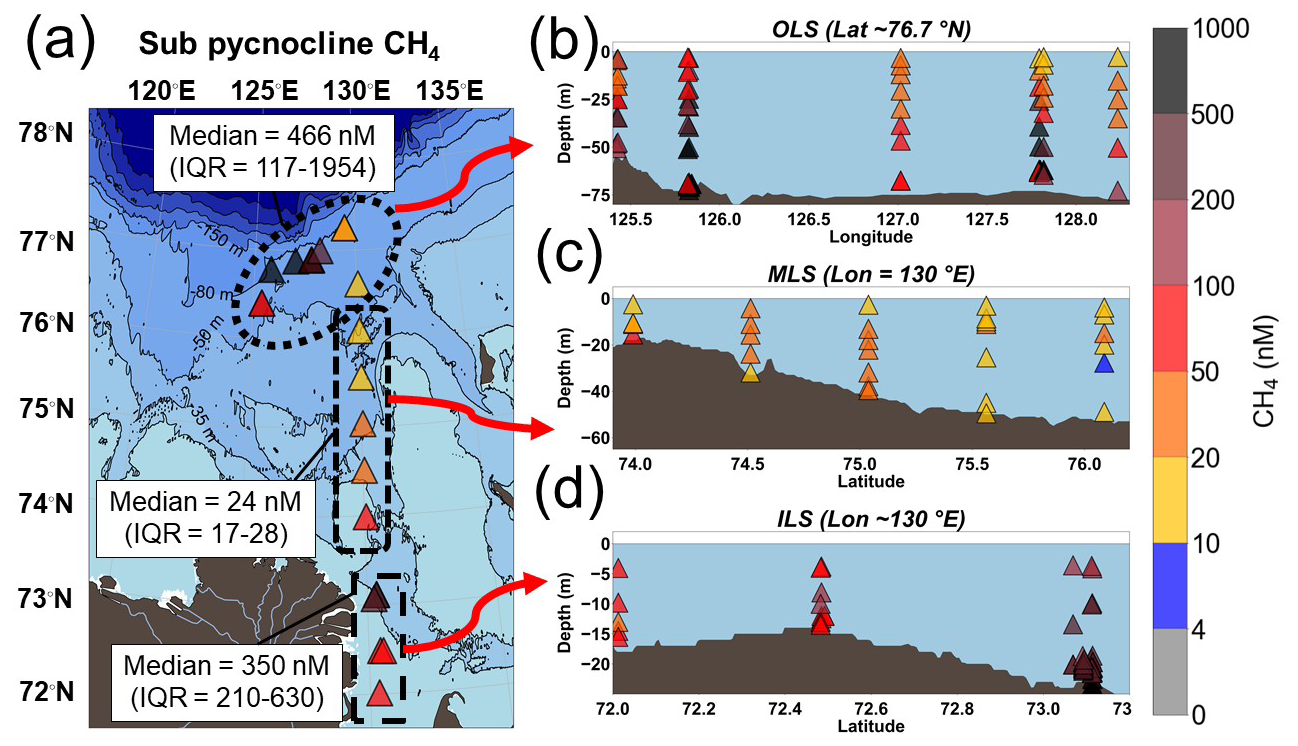
Figure 2Dissolved CH4 concentrations (nM). (a) Average CH4 concentrations below the pycnocline. (b) The outer Laptev Sea hotspot region (OLS). (c) Mid-Outer Laptev Sea transect (MLS). (d) The inner Laptev Sea hotspot region (ILS). The bathymetry was plotted using IBCAO version 5.0 (Jakobsson et al., 2024).
3.2 Organic geochemistry
3.2.1 Bulk organic carbon
The total Organic Carbon (OC) content displayed strong variability across the Laptev Sea. The total OC varied between 0.2 % and 2.3 % (mean ± standard deviation; 1.0 ± 0.5 %, n= 25), with the lowest concentrations observed in the the OLS (0.9 ± 0.4, n= 14), and higher concentrations in the MLS (1.0 ± 0.5, n= 5) and ILS (1.3±0.8, n= 6). The δ13C-OC ranged from −26.8 ‰ to −23.3 ‰ (−24.7 ± 1.0 ‰, n= 25), with the highest values in the OLS (−23.9 ± 0.4 ‰, n= 14) and slightly lower values in the MLS (−25.0 ± 0.7 ‰, n= 5) and the ILS (−26.1 ± 0.5 ‰, n= 6).
3.2.2 Hopanoid lipid concentrations and spatial distribution patterns
Hopanoids were present at detectable levels across all surface sediments. The sum of C30-hopenes (∑C30-hopenes; diploptene, hop-17(21)-ene and neohop-13(18)-ene) displayed a large range of concentrations across the Laptev Sea (mean ± standard deviation; 27 ± 19 µg gOC−1; n= 25). The highest concentrations were found in the OLS (35 ± 20 µg gOC−1; n= 15; Fig. 5). Relatively high ∑C30-hopenes concentrations were also present in the ILS, with no significant difference compared to the OLS (18 ± 11 µg gOC−1; n= 6; Fig. 5; Table S4). In contrast, the concentrations of ∑C30-hopenes were significantly lower in the MLS (10 ± 4 µg gOC−1; n= 4; Fig. 5) compared to the OLS, but did not show significantly different concentrations compared to the ILS (Table S4). The large standard deviation of hopanoid concentrations in the OLS and ILS is likely related to the presence of main “hotspot” stations, causing a log-normal distribution of the data. On average, diploptene (hop-22(29)-ene) comprised the majority of C30-hopenes (68 %), with a lower abundance of its diagenetic products (hop-17(21)-ene and neohop-13(18)-ene; 19 % and 13 %). While diploptene dominated the C30-hopene abundance across all regions, it comprised a larger part of the C30-hopenes in the ILS (74 %) compared to the MLS and OLS (52 % and 69 %, respectively). In the MLS in particular, hop-17(21)-ene and neohop-13(18)-ene constituted a larger part of the ∑C30-hopenes (31 % and 18 %).
3.2.3 Hopanoid isotope composition and spatial distribution patterns
The compound-specific isotope composition of δ13C-C30-hopenes (diploptene, hop-17(21)-ene and neohop-13(18)-ene) in the Laptev Sea was remarkably depleted compared to the bulk OC. The δ13C-C30-hopenes were on average −47.8 ± 7.2 ‰ (mean ± standard deviation; n= 23; Fig. 5). The δ13C-C30-hopenes were lowest in the OLS, with a mean ± standard deviation of −52.9 ± 4.3 ‰ across the region (Fig. 5). Hopanoids in MLS and ILS exhibited depleted but relative to the OLS more enriched δ13C-C30-hopenes (−42.0 ± 1.9 ‰ and −39.4 ± 3.0 ‰; Fig. 5). No significant differences were observed between the two regions (Table S5), yet both were much more depleted than their regional δ13C-OC.
Amongst the C30-hopanoids, δ13C-diploptene and diplopterol displayed the lowest values in the OLS (−59.5 ‰ and −61.0 ‰; Fig. 3). Hop-17(21)-ene and neohop-13(18)-ene likewise demonstrated low δ13C, yet neohop-13(18)-ene was more enriched in 13C in the OLS (Fig. 3). However, in the MLS/ILS diploptene and diplopterol in particular were more enriched in δ13C, up to a maximum of −34.1 ‰ and −29.0 ‰, respectively (Fig. 3). On the contrary, δ13C of hop-17(21)-ene exhibited lower values compared to diploptene in the ILS (−41.9 ± 4.6 ‰ and −37.6 ± 2.2 ‰; Fig. 3). While diplopterol was also present in the ILS samples, coelution with other molecules hindered accurate concentration and isotope measurements. Hence, δ13C-diplopterol was not quantified in the ILS. In summary, δ13C-C30-hopanoids were generally low across the Laptev Sea, especially in the OLS. However, in the ILS, hop-17(21)-ene was more depleted in comparison to other hopanoids (Fig. 3).
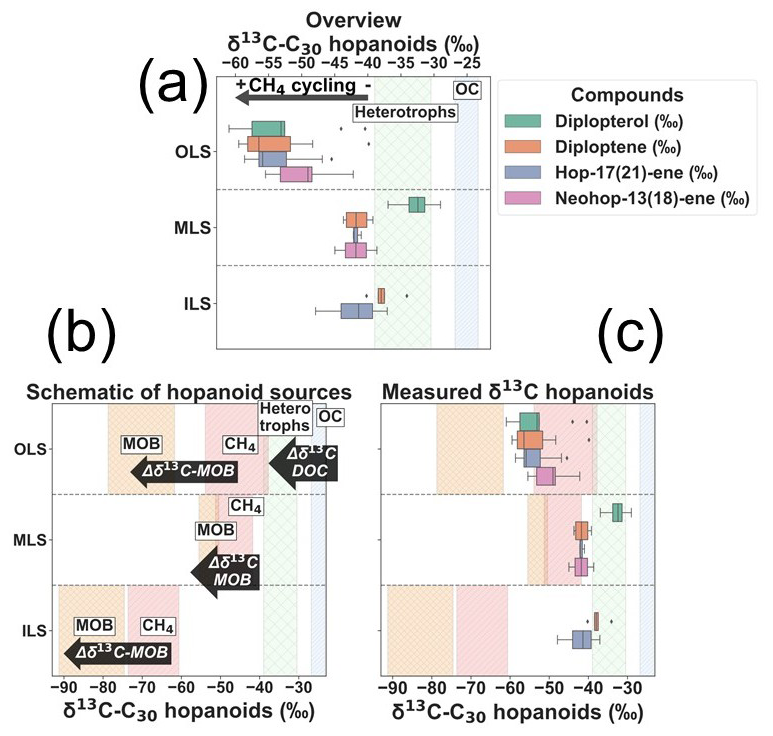
Figure 3(a) Overview of the measured δ13C of individual C30 hopanoids across each region. The shaded green zone indicates the range of δ13C-heterotrophic hopanoids by production from DOC after isotope fractionation during hopanoid synthesis (Tables S6 and S7; Salvado et al., 2016; Schwartz-Narbonne et al., 2023). The light blue indicates the measured δ13C-OC in this study. (b) Schematic of δ13C of carbon substrates used for hopanoid production and the associated isotope fractionation (Δδ13C; Tables S6 and S7; Jahnke et al., 1999; Salvadó et al., 2016; Steinbach et al., 2021; Schwartz-Narbonne et al., 2023; Brussee et al., 2026). Semi-quantitative estimations of the Methane Oxidizing Bacteria (MOB; orange) in each region are the δ13C-hopanoid endmembers, where the isotope fractionation of MOB-I and II, respectively, was weighted against the relative fraction of MOB (Eq. 2). The pink displays the δ13C-CH4 in each investigated region (Table S6). (c) Measured δ13C-C30 hopanoids compared against the hopanoid and carbon source endmembers in each region.
3.3 Bacterial consortia of hopanoid producers
Aerobic methanotrophs, here referred to as Methane Oxidizing Bacteria (MOB), were present in 9 out of the 11 sediment samples probed for 16S-rRNA. Both type I (Gammaproteobacteria; MOB-I) and type II (Alphaproteobacteria; MOB-II, Fig. 4; Fig. S1) MOB were detected in those 9 samples. Type I MOB constituted the majority of the MOB in the OLS compared to MOB-II (mean ± standard deviation; 1.2 ± 1.8 % of all sequences, n= 5; 0.10 ± 0.08 %, n= 3; Fig. 4). Specifically, the highest relative abundance of MOB-I was present at station 47 (4.3 %: Fig. 3). While the relative abundances of MOB were overall low in the MLS, MOB-II were more abundant (0.04 ± 0.01, n= 2 and 0.01 ± 0.01 %, n= 2; Fig. 4). On the other hand, in the ILS MOB I and II were of similar relative abundances (0.18 ± 0.15 %, n= 2 and 0.17 ± 0.15 %, n= 3), yet almost a factor ten lower than in the OLS. The most common MOB-I were of the order Methylococcales, specifically of the genera Methyloprofundus and Marine methylotrophic group 2 (Fig. S1). Other common type I MOB in the Laptev Sea were pLW-20, Milano-WF1B-03, Milano-WF1B-42 and pItb-vmat-59 (Fig. S1). Crenothrix was only detected in the ILS (Figs. 4; S1) and IheB2-23 and Cycloclasticus only at the OLS stations (Fig. S1). Candidates of Type II MOB were of the family Methyloligellaceae, with one identified genus known to produce hopanoids (Methyloceanibacter). However, it should be recognized that not all Methyloligellaceae are necessarily methanotrophs. In addition to MOB, heterotrophic and autotrophic hopanoid producers were present in the Laptev Sea, particularly in the ILS (Fig. S2). Taken together, MOB-I constituted the largest part of the bacterial hopanoid producers in the OLS, with almost ten times higher relative abundance compared to the MLS/ILS. Hopanoid producers in the ILS/MLS were a mix of MOB-I/II and non-methanotrophic hopanoid producers, primarily heterotrophic bacteria (Fig. 4).
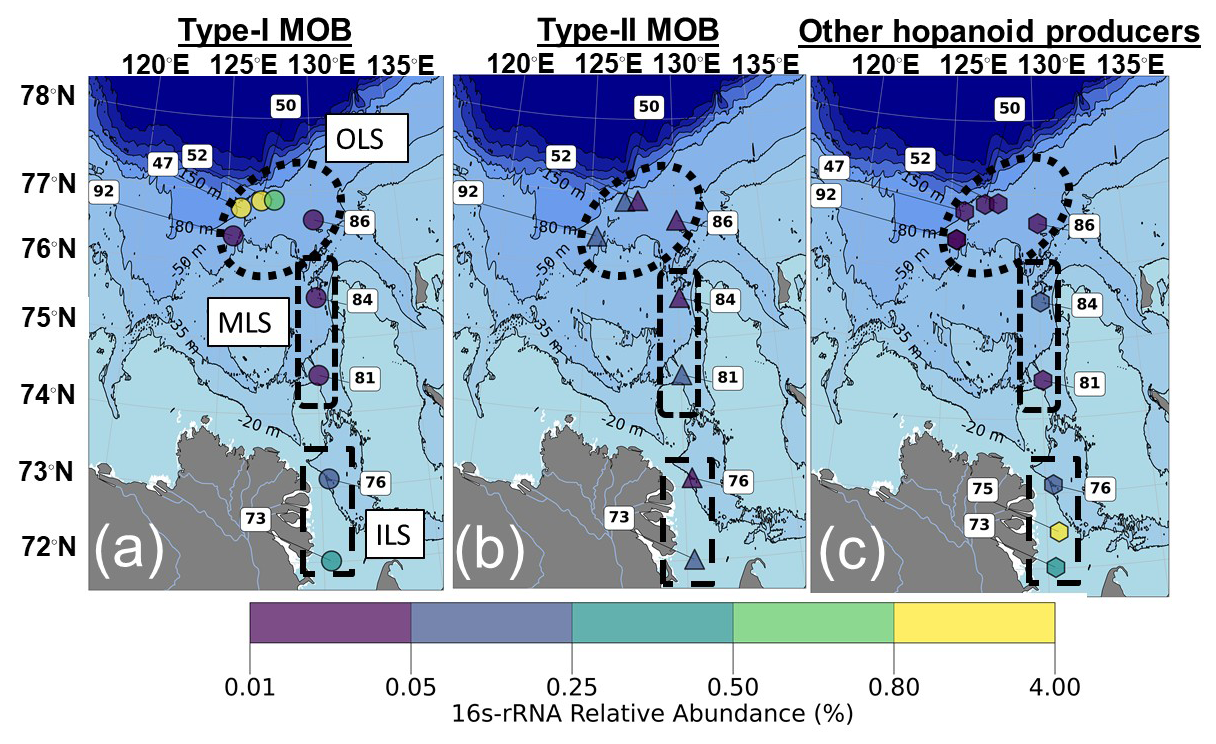
Figure 4Relative abundance of hopanoid producers in the surface sediments (%), based on 16S-rRNA. (a) Type I MOB. (b) Type II MOB. (c) Other hopanoid producers. The bathymetry was plotted using IBCAO version 5.0 (Jakobsson et al., 2024).
4.1 Indications of widespread enhanced methane cycling across the Laptev Sea displayed by lipid biomarkers
Depleted δ13C-C30 hopanoids in surface sediments indicate large-scale enhanced CH4 cycling across the Laptev Sea. As the Laptev Sea water and surface sediments are well oxygenated (Stepanova et al., 2017; Brüchert et al., 2018; Maciute et al., 2025), the CH4 signal in hopanoids is most likely related to aerobic processes. The Laptev Sea is frequently ventilated through storms, resulting in a wide variety of dissolved CH4 concentrations dependent on the time of sampling relative to storm ventilation of the water column CH4 (e.g., Shakhova et al., 2014). In contrast, the CH4 signal from δ13C-C30 hopanoids accumulated in sediments indicates a CH4 signal averaged over several years. Thus, δ13C-C30 hopanoids provide means to assess long-term CH4 cycling patterns compared to the ephemeral dissolved CH4 concentrations in the Laptev Sea. Hence, the δ13C-C30 hopanoids help to unearth CH4 dynamics in a region that is hard to access and thereby void of time-series monitoring of CH4. The proxy-derived CH4 signal in the isotopes of these hopanoids also corroborates previous suggestions of the Laptev Sea as a region of widespread CH4 cycling in the water column (e.g., Semiletov, 1999; Shakhova et al., 2010, 2014; Steinbach et al., 2021).
4.2 Spatial variations of methane concentrations and hopanoid-isotope patterns
4.2.1 Intensive CH4 cycling in the Outer Laptev Sea hotspot region
The high abundance of very depleted δ13C-C30 hopanoids in the OLS highlights ubiquitous enhanced CH4 cycling through AeOM across this region (Fig. 5). High concentrations of C30 hopenes in the OLS hotspot region are broadly consistent with previous observations of diploptene from surface sediments sampled in this area in 2011 and 2016 (Grinko et al., 2020, 2025). Beyond earlier studies, our findings of depleted δ13C-C30 hopanoids in this region confirm a methanotrophic source of the hopanoids. The presence of very low δ13C-C30 hopanoids in the OLS is a strong indication of MOB-I, which is further corroborated by 16S-rRNA (Figs. 4 and 5). Indeed, the application of a stable isotope mixing model (Eq. 4) suggests that 59 ± 4 % of hopanoids in the OLS are related to MOB-I and II. As the mixing model is weighted against the abundance of MOB-I and II and not their respective activity, these results should be regarded as semi-quantitative. Nonetheless, it supports the hypothesis of CH4 incorporation in hopanoids. Additionally, diplopterol is slightly more depleted in 13C in the OLS compared to other C30 hopanoids; this might reflect increased depletion in 13C of hopanoids for each step in the biosynthetic pathway (i.e., 13C isotope depletion from squalene to diploptene, to diplopterol; Summons et al., 1994). In short, very low values of δ13C-C30 hopanoids together with high CH4 concentrations and a high relative abundance of MOB-I indicate the OLS as a region of extensive CH4 emissions and associated AeOM (Figs. 2b and 5).
4.2.2 AeOM-biomarkers tracing methane cycling in the Mid-Outer Laptev Sea transect
In the MLS, lower yet readily detectable C30 hopene concentrations suggest less MOB biomass present in this region. Nonetheless, the depleted δ13C-C30 hopenes signals and presence of MOB in the MLS regime indicate hopanoids tracing CH4 cycling (Figs. 4 and 5), with the source apportionment indicating that MOB contributed to 55 ± 15 % of the hopanoid production. In situ hopanoid production in the MLS region or surface water transport of hopanoids from the ILS hotspot are possible causes. Given that CH4 concentrations are higher in the sub-pycnocline waters of the MLS than in the surface water, where transport from the ILS would be centered and that a larger fraction of hopanoids comes from MOB compared to in the ILS, it seems likely that most hopanoids in the MLS are locally produced. Prior assessments have considered the MLS as a region of continuous subsea permafrost and comparatively low CH4 concentrations (Shakhova et al., 2010; Bukhanov et al., 2023). In contrast, here we show a proxy-derived record of CH4 in a region that was previously conceived as being of low CH4 cycling. However, additional modern calibrations of these hopanoid proxy tools in regions with lower CH4 concentrations are necessary to confirm whether this indicates an onset of enhanced CH4 cycling, or if it is regarded as a “background signal” of CH4-related hopanoids in marine systems. Taken together, we display a record of biomarker proxy-derived CH4 in the MLS, most likely dominated by a more diffuse regional CH4 source in the MLS. The presence of low δ13C-C30 hopenes across the Laptev Sea indicates the potential to trace proxy-derived CH4 in all investigated regions and displays important factors to consider when interpreting such biomarker records.
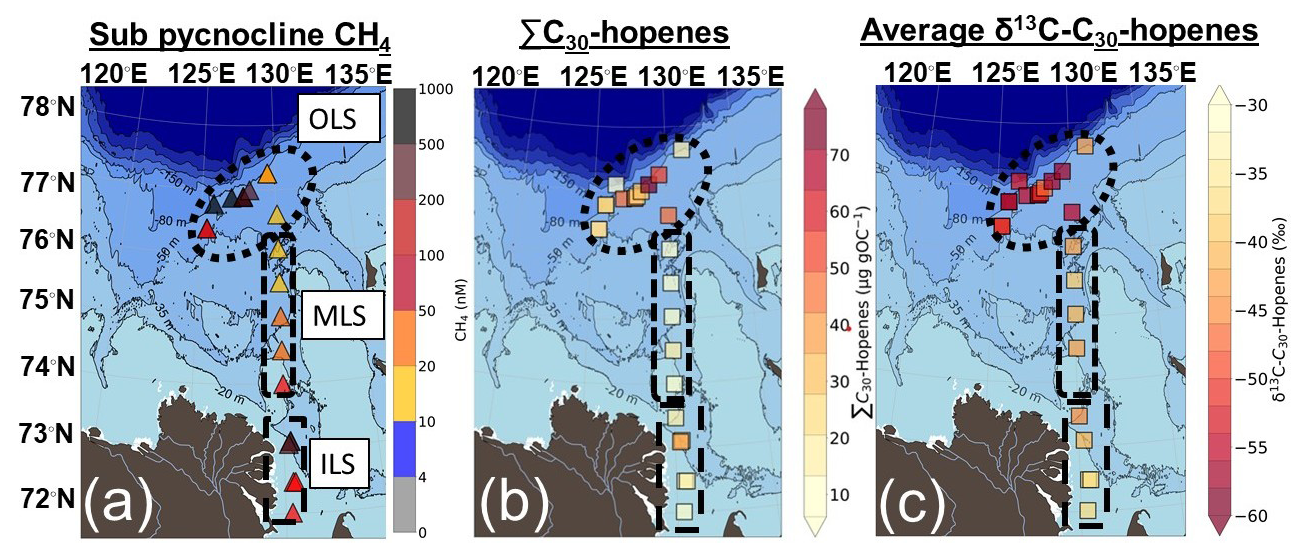
Figure 5(a) Sub pycnocline CH4 concentrations, (b) the total concentration of C30 hopenes (diploptene, hop-17(21)-ene and neohop-13(18)-ene; µg gOC−1) and (c) the average δ13C-C30 hopenes (‰) in Laptev Sea surface sediments. The bathymetry was plotted using IBCAO version 5.0 (Jakobsson et al., 2024).
4.2.3 Varying hopanoid sources in the Inner Laptev Sea hotspot region
High concentrations of CH4, depleted δ13C-C30 hopenes values and the presence of MOB highlight the possibility of tracing CH4 cycling also in the ILS. However, while concentrations of C30 hopenes were relatively high and not significantly different from those in the OLS, the δ13C-C30 hopenes in the ILS are less depleted. This can be interpreted in different ways, but is likely a combination of three mechanisms: (1) the relative contribution from MOB-I and II, (2) isotopic dilution from non-methanotrophic sources and (3) lower activity of AeOM in the ILS compared to the OLS. In contrast to the OLS, a higher relative abundance of MOB-II is present in relation to MOB-I in the ILS. Type II MOB can produce hopanoids more enriched in 13C compared to MOB-I due to their ability to also assimilate CO2 into biomass (Jahnke et al., 1999). Methyloceanibacter constituted the only genus of MOB-II in the ILS (Fig. S1) and have to our knowledge only been isolated from marine systems (Takeuchi et al., 2014, 2019; Vekeman et al., 2016). Thus, the MOB-II present in our study is likely an in situ signal of AeOM rather than of coastal influence as was found in the Kara Sea/Yenisei River (De Jonge et al., 2016), despite MOB-II generally dominating terrestrial ecosystems (Hanson and Hanson, 1996; Inglis et al., 2019). Noteworthy, δ13C-C30 hopenes values ∼ −40 ‰ has in contemporary peatland settings been interpreted as a strong indication of enhanced CH4 cycling related to MOB-II (Inglis et al., 2019). In fact, even δ13C-diploptene as high as −35 ‰ has been interpreted as an indication of AeOM in the Cariaco Trench (Freeman et al., 1994), due to co-occurring autotrophic biomarkers with a δ13C composition of > 4 ‰ higher than diploptene (Freeman et al., 1994). Therefore, the less depleted δ13C-C30 hopenes, yet in similar concentrations to the OLS, can be an indication of MOB-II and shows that a proxy-derived CH4 signal in coastal regions needs thorough system knowledge to depict the source.
The higher δ13C-C30 hopenes in the ILS compared to the OLS can also be explained by a dilution of hopanoid production from non-methanotrophic bacteria. Hopanoids (e.g., diploptene, hop-17(21)-ene) are directly synthesized or produced as degradation products of bacteriohopanepolyols (BHPs; Rohmer et al., 1980; Mackenzie et al., 1981). A mixture of hopanoid sources is to be expected, as ∼ 10 % percent of bacteria can synthesize hopanoids (Ourisson et al., 1979; Fischer et al., 2005; Racolta et al., 2012; Belin et al., 2018). Relatively high concentrations of bacteriohopanetetrol (BHT) have previously been found in the ILS and have been attributed to terrestrial sources (Bischoff et al., 2016). This study thereby indicates that a dilution from non-methanotrophic terrestrial sources may contribute to the higher δ13C-C30 hopenes, due to the vicinity of the Lena River delta and higher relative abundance of non-methanotrophic hopanoid producers compared to MOB. This is further strengthened by δ13C-OC around ∼ 26 ‰, indicating a larger terrestrial loading to the sediments of the ILS. Hopanoid source apportionment displayed that 77 ± 7 % of hopanoids in the ILS are related to non-methanotrophic hopanoid synthesis and 16S-rRNA data indicate that the “other hopanoid producers” are partly of terrestrial origin (Figs. 4; S2). Consequently, the presence of hopenes more enriched in 13C is also an indication of an additional contribution from non-methanotrophic hopanoid sources, rather than reflecting lower CH4 cycling in this region. It should also be noted that the high CH4 concentrations in the ILS originate from an old biogenic source in the coastal region (Sapart et al., 2017) and not riverine input of CH4 (Shakhova and Semiletov, 2007; Shakhova et al., 2010, 2014, 2017).
Despite high CH4 concentrations in the ILS, higher δ13C-C30 hopenes compared to the OLS hotspot region could alternatively also indicate less active AeOM. Incubation experiments of ILS surface sediments and water show the possibility of AeOM (Bussmann et al., 2017, 2021; Tikhonova et al., 2021), yet at lower rates compared to the OLS (Tikhonova et al., 2021). Taken all together, the relative enrichment of δ13C-hopenes in the ILS compared to the OLS hotspot is likely a combination of: (1) a higher relative input of hopanoids from MOB-II, (2) non-methanotrophic bacteria produced in situ and in terrestrial settings and (3) lower activity of AeOM compared to the OLS. Nonetheless, the depleted δ13C-hop-17(21)-ene does indicate the presence of AeOM and thereby traces CH4 cycling (Fig. 3).
4.3 Large-scale implications for Laptev Sea CH4 cycling
Since the discovery two decades ago, the Laptev Sea CH4 dynamics and sources have been increasing. It has been suggested that gas-hydrate-bearing sediments in the region store vast amounts of CH4 (Soloviev et al., 1987), functioning as a possible CH4 source upon destabilization (e.g., Shakhova et al., 2010). Thawing subsea permafrost has also been suggested as a source of CH4 in the ILS (Shakhova et al., 2014; Sapart et al., 2017) and to serve as a conduit for leakage of deep thermogenic CH4 gas reservoirs in the OLS (Steinbach et al., 2021). Our biomarkers of AeOM across the Laptev Sea indicate the presence of a microbial sink, but the high CH4 concentrations question its efficiency. Historically, a large focus has been given to the ILS and OLS regions with detected CH4 ebullition (e.g., Shakhova et al., 2010, 2014; Sapart et al., 2017; Steinbach et al., 2021), but few investigations have paid attention to the MLS as the observations have reported lower CH4 concentrations in that region, yet still elevated relative to atmospheric partial pressures. Thus, our indications of enhanced CH4 cycling in the MLS stimulate a few questions. (1) Why has subsea permafrost-related CH4 release only been observed in the ILS/OLS? (2) Is the CH4 activity in the MLS linked to ILS CH4 cycling, or is there a large-scale diffuse source across the MLS?
Many challenges still exist regarding our understanding of the state of current subsea permafrost and associated CH4 releases. In situ bottom sediment temperatures point towards thawing permafrost in the ILS/OLS CH4 hotspot regions (Chuvilin et al., 2022; Bukhanov et al., 2023). However, the state of the subsea permafrost and consequent CH4 releases from these two regions are likely caused by different mechanisms. Inundation of the OLS and accompanied heat exposure from both Atlantic water and underlying fault zones transporting geothermal heat have likely contributed to its warming thermal state (Chuvilin et al., 2022). Indeed, areas of warmer sediment temperatures in the OLS are coinciding with CH4 seepages and underlying fault zones (Baranov et al., 2020; Chuvilin et al., 2022). In the ILS, heat flux from the Lena River is proposed to be the main mechanism thawing subsea permafrost, but thawing is also likely induced by geothermal heat through the Ust' Lenskii Rift (Chuvilin et al., 2022; Bukhanov et al., 2023). Additionally, the bottom water from the Lena River plume has increased by ∼ 1 °C between 1999–2012 (Shakhova et al., 2014) during which time subsea permafrost has rapidly thawed (Shakhova et al., 2017). Thus, the state of subsea permafrost and lower CH4 cycling in the MLS can be related to the mechanisms regulating the thermal state of subsea permafrost (i.e., heat flux from geothermal or riverine sources).
The surface water CH4 concentrations in the MLS are lower than in the ILS and OLS, yet they exceed the atmospheric equilibrium (4 nM) by ∼ 4.6 times (median = 18.6 nM). However, the source of CH4 in the MLS is not fully clear. Assuming that a regional CH4 source is present in the MLS, further investigations are necessary, especially if it is related to the subsea permafrost thaw-state. In situ bottom sediment temperatures indicate that the MLS is on the border of discontinuous/continuous subsea permafrost (Chuvilin et al., 2022; Bukhanov et al., 2023) and thus possibly on the “thaw-front”, which could be an indication of the thaw-state regulating the CH4 emissions from the MLS. If a regional-MLS source of CH4 is present in this region, the source of these CH4 emissions and the associated AeOM needs to be further investigated. Taken together, there may be geospatial thaw fronts of the subsea permafrost from the OLS moving inwards and from the ILS moving outwards, thus both over time leading to a shrinking MLS transition zone and growing coverage of the extensive areas with accompanying CH4 releases.
This study demonstrates that δ13C-C30 hopanoids can be used as time-integrated proxies to deduce geospatial patterns of CH4 cycling from marine sediments. A clear signal of CH4 being incorporated into hopanoids is shown throughout the wide outer Laptev Sea hotspot region, indicating the possibility to also investigate time trends of enhanced CH4 cycling from this region in chronologically-constrained sediment cores. Additionally, a signal of enhanced CH4 cycling is discovered in the Mid-Outer Laptev Sea transect (MLS), previously thought to be a region of comparatively low CH4 cycling. The MLS signal could be derived from the Inner Laptev Sea hotspot (ILS), yet, more likely, from a diffuse source in the MLS itself. In the ILS, high CH4 concentrations were less well reflected in the molecular fossils, indicating AeOM, yet still indicative of CH4. This is attributed to a higher relative abundance of MOB-II that utilize both CH4 and CO2 for hopanoid production, isotopic mixing with non-methanotrophic bacteria, partly of terrestrial origin, producing hopanoids, but also less active AeOM in the ILS hotspot. This indicates that complementary evidence to δ13C-C30 hopanoids and thorough system knowledge is necessary in coastal settings in the vicinity of large rivers. However, low AeOM in a region of high CH4 concentrations, such as the ILS, could have consequences for the amount of CH4 emitted to the atmosphere. To the best of our knowledge, this is the first modern calibration of δ13C-hopanoids over an extensive marine setting, facilitating improved interpretations of hopanoid sources in contemporary and past climates. Furthermore, this study provides a large-scale geospatial picture of Laptev Sea CH4 cycling, with considerations for future studies of CH4 cycling in the circum-Arctic shelf regions.
The Supplement contains the composition of hopanoid producers, results from statistical analyses, chromatograms, and mass spectra of biomarkers. The supplementary data can be accessed through the Bolin Centre Database (https://doi.org/10.17043/eriksson-2026-biomarker-1, Eriksson et al., 2026) and the code to run the stable isotope mixing model through “simmR” is provided in “Supplementary Code”.
The supplement related to this article is available online at https://doi.org/10.5194/bg-23-1459-2026-supplement.
This study was conceptualized by Ö.G and A.E. Shipborne expedition and at-sea sampling strategies were conceived by I.S, Ö.G., N.S and B.W. Shipborne sampling and protocols were performed by Ö.G, I.S, B.W, D.K, H.H. Laboratory procedures, calculations, mapping and the first draft of the manuscript were made by A.E., in collaboration and under supervision of Ö.G., B.W., W-L.H., and H.H. All the authors contributed to data interpretation and writing.
The contact author has declared that none of the authors has any competing interests.
Publisher's note: Copernicus Publications remains neutral with regard to jurisdictional claims made in the text, published maps, institutional affiliations, or any other geographical representation in this paper. The authors bear the ultimate responsibility for providing appropriate place names. Views expressed in the text are those of the authors and do not necessarily reflect the views of the publisher.
We thank Dr. Jannik Martens, Dr. Tommaso Tesi, and the rest of the ISSS-2020 participants, enabling the expedition, including sediment and CH4 sampling. Additionally, we thank Dr. Qingzeng Zhu, Dr. Xinwei Yan, Prof. Weichao Wu, and Felipe Matsubara for helpful discussions regarding laboratory protocols.
This research was funded by the Swedish Research Council (Grant 2017-01601 to Ö.G; FORMAS grant 2021-01750 to B.W), Knut and Alice Wallenberg Foundation (Wallenberg Academy Fellowship 2023.0058 to B.W, and Tipping Arctic Ocean Methane Project, grant KAW 2024.0140 to Ö.G), and the European Research Council (ERC Advanced Grant CC-TOP 695331 to Ö.G). The charter of the RV Academician Mstislav Keldysh and post-cruise data processing were funded by grant 124022100083-1 to POI (I.S), by the program “Priority 2030” to TSU (I.S), and theme FEFF-2024-0004 to SakhSU (N.S) from the Ministry of Science and Higher Education of the Russian Federation, and by grant 22-67-00025 to IGD (N.S) from the Russian Scientific Foundation. (submitted)
This paper was edited by Sebastian Naeher and reviewed by two anonymous referees.
Apprill, A., Mcnally, S., Parsons, R., and Weber, L.: Minor revision to V4 region SSU rRNA 806R gene primer greatly increases detection of SAR11 bacterioplankton, Aquatic Microbial Ecology, 75, 129–137, https://doi.org/10.3354/ame01753, 2015.
Baranov, B., Galkin, S., Vedenin, A., Dozorova, K., Gebruk, A., and Flint, M.: Methane seeps on the outer shelf of the Laptev Sea: characteristic features, structural control, and benthic fauna, Geo-Mar Lett, https://doi.org/10.1007/s00367-020-00655-7, 2020.
Belin, B. J., Busset, N., Giraud, E., Molinaro, A., Silipo, A., and Newman, Di. K.: Hopanoid lipids: From membranes to plant-bacteria interactions, Nature Reviews Microbiology, https://doi.org/10.1038/nrmicro.2017.173, 2018.
Birgel, D. and Peckmann, J.: Aerobic methanotrophy at ancient marine methane seeps: A synthesis, Org. Geochem., 39, 1659–1667, https://doi.org/10.1016/j.orggeochem.2008.01.023, 2008.
Bischoff, J., Sparkes, R. B., Doğrul Selver, A., Spencer, R. G. M., Gustafsson, Ö., Semiletov, I. P., Dudarev, O. V., Wagner, D., Rivkina, E., van Dongen, B. E., and Talbot, H. M.: Source, transport and fate of soil organic matter inferred from microbial biomarker lipids on the East Siberian Arctic Shelf, Biogeosciences, 13, 4899–4914, https://doi.org/10.5194/bg-13-4899-2016, 2016.
Blumenberg, M., Naafs, B. D. A., Lückge, A., Lauretano, V., Schefuß, E., Galloway, J. M., Scheeder, G., and Reinhardt, L.: Biomarker Reconstruction of a High-Latitude Late Paleocene to Early Eocene Coal Swamp Environment Across the PETM and ETM-2 (Ellesmere Island, Arctic Canada), Paleoceanogr. Paleoclimatol., 39, https://doi.org/10.1029/2023PA004712, 2024.
Brussee, M., Holmstrand, H., Wild, B., Kosmach, D., Chernykh, D., Shakhova, N., Kurilenko, A., Semiletov, I., and Gustafsson, Ö.: Triple-isotopic analyses pinpoint microbial methane release from subsea permafrost in the inner Laptev Sea, Commun. Earth Environ., https://doi.org/10.1038/s43247-026-03222-7, 2026.
Bukhanov, B., Chuvilin, E., Zhmaev, M., Shakhova, N., Spivak, E., Dudarev, O., Osadchiev, A., Spasennykh, M., and Semiletov, I.: In situ bottom sediment temperatures in the Siberian arctic seas: Current state of subsea permafrost in the kara sea vs laptev and east Siberian seas, Mar. Pet. Geol., 157, https://doi.org/10.1016/j.marpetgeo.2023.106467, 2023.
Bussmann, I., Hackbusch, S., Schaal, P., and Wichels, A.: Methane distribution and oxidation around the Lena Delta in summer 2013, Biogeosciences, 14, 4985–5002, https://doi.org/10.5194/bg-14-4985-2017, 2017.
Bussmann, I., Fedorova, I., Juhls, B., Overduin, P. P., and Winkel, M.: Methane dynamics in three different Siberian water bodies under winter and summer conditions, Biogeosciences, 18, 2047–2061, https://doi.org/10.5194/bg-18-2047-2021, 2021.
Bröder, L., Tesi, T., Andersson, A., Semiletov, I., and Gustafsson, Ö.: Bounding cross-shelf transport time and degradation in Siberian-Arctic land-ocean carbon transfer, Nat. Commun., 9, https://doi.org/10.1038/s41467-018-03192-1, 2018.
Brüchert, V., Bröder, L., Sawicka, J. E., Tesi, T., Joye, S. P., Sun, X., Semiletov, I. P., and Samarkin, V. A.: Carbon mineralization in Laptev and East Siberian sea shelf and slope sediment, Biogeosciences, 15, 471–490, https://doi.org/10.5194/bg-15-471-2018, 2018.
Callahan, B. J., McMurdie, P. J., Rosen, M. J., Han, A. W., Johnson, A. J. A., and Holmes, S. P.: DADA2: High-resolution sample inference from Illumina amplicon data, Nat. Methods, 13, 581–583, https://doi.org/10.1038/nmeth.3869, 2016.
Chernykh, D., Shakhova, N., Yusupov, V., Gershelis, E., Morgunov, B., and Semiletov, I.: First Calibrated Methane Bubble Wintertime Observations in the Siberian Arctic Seas: Selected Results from the Fast Ice, Geosciences (Switzerland), 13, https://doi.org/10.3390/geosciences13080228, 2023.
Chuvilin, E., Bukhanov, B., Yurchenko, A., Davletshina, D., Shakhova, N., Spivak, E., Rusakov, V., Dudarev, O., Khaustova, N., Tikhonova, A., Gustafsson, O., Tesi, T., Martens, J., Jakobsson, M., Spasennykh, M., and Semiletov, I.: In-situ temperatures and thermal properties of the East Siberian Arctic shelf sediments: Key input for understanding the dynamics of subsea permafrost, Mar. Pet. Geol., 138, https://doi.org/10.1016/j.marpetgeo.2022.105550, 2022.
Damsté, J. S. S., Rijpstra, W. I. C., Dedysh, S. N., Foesel, B. U., and Villanueva, L.: Pheno- and genotyping of hopanoid production in Acidobacteria, Front. Microbiol., 8, https://doi.org/10.3389/fmicb.2017.00968, 2017.
Davies, K. L., Pancost, R. D., Edwards, M. E., Walter Anthony, K. M., Langdon, P. G., and Chaves Torres, L.: Diploptene δ13C values from contemporary thermokarst lake sediments show complex spatial variation, Biogeosciences, 13, 2611–2621, https://doi.org/10.5194/bg-13-2611-2016, 2016.
De Jonge, C., Talbot, H. M., Bischoff, J., Stadnitskaia, A., Cherkashov, G., and Sinninghe Damsté, J. S.: Bacteriohopanepolyol distribution in Yenisei River and Kara Sea suspended particulate matter and sediments traces terrigenous organic matter input, Geochim. Cosmochim. Acta, 174, 85–101, https://doi.org/10.1016/j.gca.2015.11.008, 2016.
Elvert, M. and Niemann, H.: Occurrence of unusual steroids and hopanoids derived from aerobic methanotrophs at an active marine mud volcano, Org. Geochem., 39, 167–177, https://doi.org/10.1016/j.orggeochem.2007.11.006, 2008.
Eriksson, A., Wild, B., Hong, W.-L., Holmstrand, H., Nascimento, F. J. A., Bonaglia, S., Kosmach, D., Semiletov, I., Shakhova, N., and Gustafsson, Ö.: Biomarker concentrations, compound-specific isotope data, and microbial information from Laptev Sea surface sediments, Bolin Centre Database. [data set], https://doi.org/10.17043/eriksson-2026-biomarker-1, 2026.
Fischer, W. W., Summons, R. E., and Pearson, A.: Targeted genomic detection of biosynthetic pathways: anaerobic production of hopanoid biomarkers by a common sedimentary microbe, Geobiology, 3, 33–40, https://doi.org/10.1111/j.1472-4669.2005.00041.x, 2005.
Freeman, K. H., Wakeham, S. G., and Hayes, J. M.: Predictive isotopic biogeochemistry: hydrocarbons from anoxic marine basins, Org. Geochem., 21, 629–644, https://doi.org/10.1016/0146-6380(94)90009-4, 1994.
Grinko, A. A., Goncharov, I. V., Shakhova, N. E., Gustafsson, Ö., Oblasov, N. V., Romankevich, E. A., Zarubin, A. G., Kashapov, R. S., Chernykh, D. V., Gershelis, E. V., Dudarev, O. V., Mazurov, A. K., and Semiletov, I. P.: Sediment organic matter in areas of intense methane release in the Laptev Sea: characteristics of molecular composition, Russ. Geol. Geophys., 61, 456–477, 2020.
Grinko, A. A., Gershelis, E. V., Cherykh, D. V., Kurilenko, A. V., Dudarev, O., Kosmach, D. A., and Semiletov, I. P.: Characterization of Organic Matter in Areas of Methane Emission in the Laptev Sea (Expedition 2016), Geochem. Int. 63, 496–509, https://doi.org/10.1134/S0016702924601451, 2025.
Hanson, R. S. and Hanson, T. E.: Methanotrophic Bacteria, Microbiological Reviews, 60, 439–471, 1996.
Hinrichs, K.: A molecular recorder of methane hydrate destabilization, Geochemistry, Geophysics, Geosystems, 2, https://doi.org/10.1029/2000gc000118, 2001.
Hinrichs, K., Hmel, L.R., and Sylva, S.P.: Molecular Fossil Record of Elevated Methane Levels in Late Pleistocene Coastal Waters, Science, 299, 1214–1217, https://doi.org/10.1126/science.1079601, 2003.
Holmes, R. M., McClelland, J. W., Peterson, B. J., Tank, S. E., Bulygina, E., Eglinton, T. I., Gordeev, V. V., Gurtovaya, T. Y., Raymond, P. A., Repeta, D. J., Staples, R., Striegl, R. G., Zhulidov, A. V., and Zimov, S. A.: Seasonal and Annual Fluxes of Nutrients and Organic Matter from Large Rivers to the Arctic Ocean and Surrounding Seas, Estuaries and Coasts, 35, 369–382, https://doi.org/10.1007/s12237-011-9386-6, 2012.
Hugelius, G., Ramage, J., Burke, E., Chatterjee, A., Smallman, T. L., Aalto, T., Bastos, A., Biasi, C., Canadell, J. G., Chandra, N., Chevallier, F., Ciais, P., Chang, J., Feng, L., Jones, M. W., Kleinen, T., Kuhn, M., Lauerwald, R., Liu, J., López-Blanco, E., Luijkx, I. T., Marushchak, M. E., Natali, S. M., Niwa, Y., Olefeldt, D., Palmer, P. I., Patra, P. K., Peters, W., Potter, S., Poulter, B., Rogers, B. M., Riley, W. J., Saunois, M., Schuur, E. A. G., Thompson, R. L., Treat, C., Tsuruta, A., Turetsky, M. R., Virkkala, A. M., Voigt, C., Watts, J., Zhu, Q., and Zheng, B.: Permafrost Region Greenhouse Gas Budgets Suggest a Weak CO2 Sink and CH4 and N2O Sources, But Magnitudes Differ Between Top-Down and Bottom-Up Methods, Global Biogeochem Cycles, 38, https://doi.org/10.1029/2023GB007969, 2024.
Inglis, G. N., Naafs, B. D. A., Zheng, Y., Schellekens, J., and Pancost, R. D.: δ13C values of bacterial hopanoids and leaf waxes as tracers for methanotrophy in peatlands, Geochim. Cosmochim. Acta, 260, 244–256, https://doi.org/10.1016/j.gca.2019.06.030, 2019.
Jahnke, L. L., Summons, R. E., Hope, J. M., and Des Marais, D. J.: Carbon isotopic fractionation in lipids from methanotrophic bacteria II: the effects of physiology and environmental parameters on the biosynthesis and isotopic signatures of biomarkers, Geochim. Coscmochim. Acta, 63, 79–93, https://doi.org/10.1016/S0016-7037(98)00270-1, 1999.
Jakobsson, M., Mohammad, R., Karlsson, M., Salas-Romero, S., Vacek, F., Heinze, F., Bringensparr, C., Castro, C. F., Johnson, P., Kinney, J., Cardigos, S., Bogonko, M., Accettella, D., Amblas, D., An, L., Bohan, A., Brandt, A., Bünz, S., Canals, M., Casamor, J. L., Coakley, B., Cornish, N., Danielson, S., Demarte, M., Di Franco, D., Dickson, M. L., Dorschel, B., Dowdeswell, J. A., Dreutter, S., Fremand, A. C., Hall, J. K., Hally, B., Holland, D., Hong, J. K., Ivaldi, R., Knutz, P. C., Krawczyk, D. W., Kristofferson, Y., Lastras, G., Leck, C., Lucchi, R. G., Masetti, G., Morlighem, M., Muchowski, J., Nielsen, T., Noormets, R., Plaza-Faverola, A., Prescott, M. M., Purser, A., Rasmussen, T. L., Rebesco, M., Rignot, E., Rysgaard, S., Silyakova, A., Snoeijs-Leijonmalm, P., Sørensen, A., Straneo, F., Sutherland, D. A., Tate, A. J., Travaglini, P., Trenholm, N., van Wijk, E., Wallace, L., Willis, J. K., Wood, M., Zimmermann, M., Zinglersen, K. B., and Mayer, L.: The International Bathymetric Chart of the Arctic Ocean Version 5.0, Scientific Data, 11, https://doi.org/10.1038/s41597-024-04278-w, 2024.
Kannenberg, E. L., Perzl, M., and Härtner, T.: The occurrence of hopanoid lipids in Bradyrhizobium bacteria, FEMS Microbiol. Lett., 127, 255–262, https://doi.org/10.1111/j.1574-6968.1995.tb07482.x, 1995.
Lindgren, A., Hugelius, G., and Kuhry, P.: Extensive loss of past permafrost carbon but a net accumulation into present-day soils, Nature, 560, 219–222, https://doi.org/10.1038/s41586-018-0371-0, 2018.
Maciute, A., Broman, E., Nascimento, F. J. A., Tesi, T., Yakushev, E., Wild, B., Kirillova, E., Semiletov, I., Gustafsson, Ö., and Bonaglia, S.: Environmental Gradients, Not Geographic Boundaries, Structure Meiofaunal Communities in Siberian Seas, Environmental DNA, 7, https://doi.org/10.1002/edn3.70124, 2025.
Mackenzie, A. S., Lewis, C. A., and Maxwell, J. R.: Molecular parameters of maturation in the Toarcian shales, Paris Basin, France-IV. Laboratory thermal alteration studies, Geochim. Cosmochim. Acta, 45, 2369–2376, https://doi.org/10.1016/0016-7037(81)90090-9, 1981.
Mao, S. H., Zhang, H. H., Zhuang, G. C., Li, X. J., Liu, Q., Zhou, Z., Wang, W. L., Li, C. Y., Lu, K. Y., Liu, X. T., Montgomery, A., Joye, S. B., Zhang, Y. Z., and Yang, G. P.: Aerobic oxidation of methane significantly reduces global diffusive methane emissions from shallow marine waters, Nat. Commun., 13, https://doi.org/10.1038/s41467-022-35082-y, 2022.
Martens, J., Wild, B., Muschitiello, F., O'regan, M., Jakobsson, M., Semiletov, I., Dudarev, O. V., and Gustafsson, Ö.: Remobilization of dormant carbon from Siberian-Arctic permafrost during three past warming events, Sci. Adv., 6, eabb6546, https://doi.org/10.1126/sciadv.abb6546, 2020.
Martens, J., Wild, B., Semiletov, I., Dudarev, O. V., and Gustafsson, Ö.: Circum-Arctic release of terrestrial carbon varies between regions and sources, Nat. Commun., 13, https://doi.org/10.1038/s41467-022-33541-0, 2022.
McClelland, J. W., Holmes, R. M., Peterson, B. J., Raymond, P. A., Striegl, R. G., Zhulidov, A. V., Zimov, S. A., Zimov, N., Tank, S. E., Spencer, R. G. M., Staples, R., Gurtovaya, T. Y., and Griffin, C. G.: Particulate organic carbon and nitrogen export from major Arctic rivers, Global Biogeochem. Cycles, 30, 629–643, https://doi.org/10.1002/2015GB005351, 2016.
Milkov, A. V. and Etiope, G.: Revised genetic diagrams for natural gases based on a global dataset of > 20,000 samples, Org. Geochem, 125, 109–120, https://doi.org/10.1016/j.orggeochem.2018.09.002, 2018.
Nicolsky, D. and Shakhova, N.: Modeling sub-sea permafrost in the East Siberian Arctic Shelf: The dmitry laptev strait, Environmental Research Letters, 5, https://doi.org/10.1088/1748-9326/5/1/015006, 2010.
Obu, J., Westermann, S., Bartsch, A., Berdnikov, N., Christiansen, H. H., Dashtseren, A., Delaloye, R., Elberling, B., Etzelmüller, B., Kholodov, A., Khomutov, A., Kääb, A., Leibman, M. O., Lewkowicz, A. G., Panda, S. K., Romanovsky, V., Way, R. G., Westergaard-Nielsen, A., Wu, T., Yamkhin, J., and Zou, D.: Northern Hemisphere permafrost map based on TTOP modelling for 2000–2016 at 1 km2 scale, Earth-Science Reviews, https://doi.org/10.1016/j.earscirev.2019.04.023, 1 June 2019.
Overduin, P. P., Schneider von Deimling, T., Miesner, F., Grigoriev, M. N., Ruppel, C., Vasiliev, A., Lantuit, H., Juhls, B., and Westermann, S.: Submarine Permafrost Map in the Arctic Modeled Using 1-D Transient Heat Flux (SuPerMAP), J. Geophys. Res. Oceans, 124, 3490–3507, https://doi.org/10.1029/2018JC014675, 2019.
Ourisson, G., Albrecht, P., and Rohmer, M.: The hopanoids: palaeochemistry and biochemistry of a group of natural products, Pure Appl. Chem., 51, 709–729, https://doi.org/10.1351/pac197951040709, 1979.
Pancost, R. D., Coleman, J. M., Love, G. D., Chatzi, A., Bouloubassi, I., and Snape, C. E.: Kerogen-bound glycerol dialkyl tetraether lipids released by hydropyrolysis of marine sediments: A bias against incorporation of sedimentary organisms?, Org. Geochem., 39, 1359–1371, https://doi.org/10.1016/j.orggeochem.2008.05.002, 2008.
Parada, A. E., Needham, D. M., and Fuhrman, J. A.: Every base matters: Assessing small subunit rRNA primers for marine microbiomes with mock communities, time series and global field samples, Environ. Microbiol., 18, 1403–1414, https://doi.org/10.1111/1462-2920.13023, 2016.
Parnell, A. C., Phillips, D. L., Bearhop, S., Semmens, B. X., Ward, E. J., Moore, J. W., Jackson, A. L., Grey, J., Kelly, D. J., and Inger, R.: Bayesian stable isotope mixing models, Environmetrics, 24, 387–399, https://doi.org/10.1002/env.2221, 2013.
Quast, C., Pruesse, E., Yilmaz, P., Gerken, J., Schweer, T., Yarza, P., Peplies, J., and Glöckner, F. O.: The SILVA ribosomal RNA gene database project: Improved data processing and web-based tools, Nucleic Acids Res., 41, https://doi.org/10.1093/nar/gks1219, 2013.
Racolta, S., Juhl, P. B., Sirim, D., and Pleiss, J.: The triterpene cyclase protein family: a systematic analysis, Proteins, 80, 2009–2019, https://doi.org/10.1002/prot.24089, 2012.
Ramage, J., Kuhn, M., Virkkala, A. M., Voigt, C., Marushchak, M. E., Bastos, A., Biasi, C., Canadell, J. G., Ciais, P., López-Blanco, E., Natali, S. M., Olefeldt, D., Potter, S., Poulter, B., Rogers, B. M., Schuur, E. A. G., Treat, C., Turetsky, M. R., Watts, J., and Hugelius, G.: The Net GHG Balance and Budget of the Permafrost Region (2000–2020) From Ecosystem Flux Upscaling, Global Biogeochem. Cycles, 38, https://doi.org/10.1029/2023GB007953, 2024.
Rohmer, M., Dastillung, M., and Ourisson, G. Hopanoids from C30 to C35 in recent muds, Naturwissenschaften, 67, 456–458, https://doi.org/10.1007/BF00405643, 1980.
Romanovskii, N. N. and Hubberten, H. W.: Results of permafrost modelling of the lowlands and shelf of the Laptev Sea Region, Russia, Permafr. Periglac. Process., 12, 191–202, https://doi.org/10.1002/ppp.387, 2001.
Romanovskii, N. N., Hubberten, H. W., Gavrilov, A. V., Eliseeva, A. A., and Tipenko, G. S.: Offshore permafrost and gas hydrate stability zone on the shelf of East Siberian Seas, Geo-Marine Letters, 25, 167–182, https://doi.org/10.1007/s00367-004-0198-6, 2005.
Rutz, A., Sorokina, M., Galgonek, J., Mietchen, D., Willighagen, E., Gaudry, A., Graham, J. G., Stephan, R., Page, R., Vondrášek, J., Steinbeck, C., Pauli, G. F., Wolfender, J. L., Bisson, J., and Allard, P. M.: The LOTUS initiative for open knowledge management in natural products research, Elife, 11, https://doi.org/10.7554/eLife.70780, 2022.
Salvadó, J. A., Tesi, T., Sundbom, M., Karlsson, E., Kruså, M., Semiletov, I. P., Panova, E., and Gustafsson, Ö.: Contrasting composition of terrigenous organic matter in the dissolved, particulate and sedimentary organic carbon pools on the outer East Siberian Arctic Shelf, Biogeosciences, 13, 6121–6138, https://doi.org/10.5194/bg-13-6121-2016, 2016.
Samylina, O. S., Rusanov, I. I., Tarnovetskii, I. Y., Yakushev, E. V., Grinko, A. A., Zakharova, E. E., Merkel, A. Y., Kanapatskiy, T. A., Semiletov, I. P., and Pimenov, N. V.: On the Possibility of Aerobic Methane Production by Pelagic Microbial Communities of the Laptev Sea, Microbiology (Russian Federation), 90, 145–157, https://doi.org/10.1134/S0026261721020119, 2021.
Sapart, C. J., Shakhova, N., Semiletov, I., Jansen, J., Szidat, S., Kosmach, D., Dudarev, O., van der Veen, C., Egger, M., Sergienko, V., Salyuk, A., Tumskoy, V., Tison, J.-L., and Röckmann, T.: The origin of methane in the East Siberian Arctic Shelf unraveled with triple isotope analysis, Biogeosciences, 14, 2283–2292, https://doi.org/10.5194/bg-14-2283-2017, 2017.
Saunois, M., Martinez, A., Poulter, B., Zhang, Z., Raymond, P. A., Regnier, P., Canadell, J. G., Jackson, R. B., Patra, P. K., Bousquet, P., Ciais, P., Dlugokencky, E. J., Lan, X., Allen, G. H., Bastviken, D., Beerling, D. J., Belikov, D. A., Blake, D. R., Castaldi, S., Crippa, M., Deemer, B. R., Dennison, F., Etiope, G., Gedney, N., Höglund-Isaksson, L., Holgerson, M. A., Hopcroft, P. O., Hugelius, G., Ito, A., Jain, A. K., Janardanan, R., Johnson, M. S., Kleinen, T., Krummel, P. B., Lauerwald, R., Li, T., Liu, X., McDonald, K. C., Melton, J. R., Mühle, J., Müller, J., Murguia-Flores, F., Niwa, Y., Noce, S., Pan, S., Parker, R. J., Peng, C., Ramonet, M., Riley, W. J., Rocher-Ros, G., Rosentreter, J. A., Sasakawa, M., Segers, A., Smith, S. J., Stanley, E. H., Thanwerdas, J., Tian, H., Tsuruta, A., Tubiello, F. N., Weber, T. S., van der Werf, G. R., Worthy, D. E. J., Xi, Y., Yoshida, Y., Zhang, W., Zheng, B., Zhu, Q., Zhu, Q., and Zhuang, Q.: Global Methane Budget 2000–2020, Earth Syst. Sci. Data, 17, 1873–1958, https://doi.org/10.5194/essd-17-1873-2025, 2025.
Savvichev, A. S., Rusanov, I. I., Kadnikov, V. V., Beletsky, A. V., Zakcharova, E. E., Samylina, O. S., Sigalevich, P. A., Semiletov, I. P., Ravin, N. V., and Pimenov, N. V.: Biogeochemical Activity of Methane-Related Microbial Communities in Bottom Sediments of Cold Seeps of the Laptev Sea, Microorganisms, 11, https://doi.org/10.3390/microorganisms11020250, 2023.
Schaeffer, R., Schipper, E. L. F., Ospina, D., Mirazo, P., Alencar, A., Anvari, M., Artaxo, P., Biresselioglu, M. E., Blome, T., Boeckmann, M., Brink, E., Broadgate, W., Bustamante, M., Cai, W., Canadell, J. G., Cardinale, R., Chidichimo, M. P., Ditlevsen, P., Eicker, U., Feron, S., Fikru, M. G., Fuss, S., Gaye, A. T., Gustafsson, Ö., Harring, N., He, C., Hebden, S., Heilemann, A., Hirota, M., Janardhanan, N., Juhola, S., Jung, T. Y., Kejun, J., Kilkiș, Ş., Kumarasinghe, N., Lapola, D., Lee, J. Y., Levis, C., Lusambili, A., Maasakkers, J. D., MacIntosh, C., Mahmood, J., Mankin, J. S., Marchegiani, P., Martin, M., Mukherji, A., Muñoz-Erickson, T. A., Niazi, Z., Nyangon, J., Pandipati, S., Perera, A. T. D., Persad, G., Persson, Å., Redman, A., Riipinen, I., Rockström, J., Roffe, S., Roy, J., Sakschewski, B., Samset, B. H., Schlosser, P., Sharifi, A., Shih, W. Y., Sioen, G. B., Sokona, Y., Stammer, D., Suk, S., Thiam, D., Thompson, V., Tullos, E., van Westen, R. M., Vargas Falla, A. M., Vecellio, D. J., Worden, J., Wu, H. C., Xu, C., Yang, Y., Zachariah, M., Zhang, Z., and Ziervogel, G.: Ten new insights in climate science 2024, One Earth, https://doi.org/10.1016/j.oneear.2025.101285, 2025.
Schwartz-Narbonne, R., Schaeffer, P., Lengger, S. K., Blewett, J., Martin Jones, D., Motsch, E., Crombie, A., Jetten, M. S. M., Mikkelsen, D., Normand, P., Nuijten, G. H. L., Pancost, R. D., and Rush, D.: Bacterial physiology highlighted by the δ13C fractionation of bacteriohopanetetrol isomers, Org Geochem, 181, https://doi.org/10.1016/j.orggeochem.2023.104617, 2023.
Semiletov, I. P.: Aquatic Sources and Sinks of CO2 and CH4 in the Polar Regions, Journal of the Atmospheric Sciences 56, 286–306, https://doi.org/10.1175/1520-0469(1999)056<0286:ASASOC>2.0.CO;2, 1999.
Sessions, A. L., Zhang, L., Welander, P. V, Doughty, D., Summons, R. E., and Newman, D. K.: Identification and quantification of polyfunctionalized hopanoids by high temperature gas chromatography-mass spectrometry, Organic Geochemistry, 56, 120–130, https://doi.org/10.1016/j.orggeochem.2012.12.009, 2013.
Shakhova, N., Semiletov, I., Salyuk, A., Yusupov, V., Kosmach, D., and Gustafsson, Ö.: Extensive Methane Venting to the Atmosphere from Sediments of the East Siberian Arctic Shelf, Science, 327, 1246–1250, https://doi.org/10.1126/science.1182221, 2010.
Shakhova, N. and Semiletov, I.: Methane release and coastal environment in the East Siberian Arctic shelf, Journal of Marine Systems, 66, 227–243, https://doi.org/10.1016/j.jmarsys.2006.06.006, 2007.
Shakhova, N., Semiletov, I., Leifer, I., Sergienko, V., Salyuk, A., Kosmach, D., Chernykh, D., Stubbs, C., Nicolsky, D., Tumskoy, V., and Gustafsson, Ö.: Ebullition and storm-induced methane release from the East Siberian Arctic Shelf, Nat. Geosci., 7, 64–70, https://doi.org/10.1038/ngeo2007, 2014.
Shakhova, N., Semiletov, I., Sergienko, V., Lobkovsky, L., Yusupov, V., Salyuk, A., Salomatin, A., Chernykh, D., Kosmach, D., Panteleev, G., Nicolsky, D., Samarkin, V., Joye, S., Charkin, A., Dudarev, O., Meluzov, A., and Gustafsson, Ö.: The East Siberian Arctic Shelf: towards further assessment of permafrost-related methane fluxes and role of sea ice, Philos. Trans. R. Soc. A, 373, 20140451, https://doi.org/10.1098/rsta.2014.0451, 2015.
Shakhova, N., Semiletov, I., Gustafsson, O., Sergienko, V., Lobkovsky, L., Dudarev, O., Tumskoy, V., Grigoriev, M., Mazurov, A. K., Salyuk, A., Ananiev, R., Koshurnikov, A., Kosmach, D., Charkin, A., Dmitrevsky, N., Karnaukh, V., Gunar, A., Meluzov, A., and Chernykh, D.: Current rates and mechanisms of subsea permafrost degradation in the East Siberian Arctic Shelf, Nat. Commun., 8, https://doi.org/10.1038/ncomms15872, 2017.
Shakhova, N., Semiletov, I., and Chuvilin, E.: Understanding the Permafrost–Hydrate System and Associated Methane Releases in the East Siberian Arctic Shelf, Geosciences, 9, 251, https://doi.org/10.3390/geosciences9060251, 2019.
Sinninghe Damsté, J. S., Rijpstra, W. I. C., Schouten, S., Fuerst, J. A., Jetten, M. S. M., and Strous, M.: The occurrence of hopanoids in planctomycetes: Implications for the sedimentary biomarker record, Org. Geochem., 35, 561–566, https://doi.org/10.1016/j.orggeochem.2004.01.013, 2004.
Sinninghe Damsté, J. S., Schouten, S., and Volkman, J. K.: C27-C30 neohop-13(18)-enes and their saturated and aromatic derivatives in sediments: Indicators for diagenesis and water column stratification, Geochim. Cosmochim. Acta, 133, 402–421, https://doi.org/10.1016/j.gca.2014.03.008, 2014.
Sinninghe Damsté, J. S., Rijpstra, W. I. C., Dedysh, S. N., Foesel, B. U., and Villanueva, L.: Pheno- and genotyping of hopanoid production in Acidobacteria, Frontiers in Microbiology, 8, 968, https://doi.org/10.3389/fmicb.2017.00968, 2017.
Sohlenkamp, C. and Geiger, O.: Bacterial membrane lipids: Diversity in structures and pathways, FEMS Microbiology Reviews, 40 133–159, https://doi.org/10.1093/femsre/fuv008, 2016.
Soloviev, V. A., Ginzburg, G. D., Telepnev, E. V., and Mikhaluk, Y. N.: Cryothermia and Gas Hydrates in the Arctic Ocean, 150 pp., Sevmorgelogia, Leningrad, Russia, 1987.
Steinbach, J., Holmstrand, H., Shcherbakova, K., Kosmach, D., Brüchert, V., Shakhova, N., Salyuk, A., Sapart, C. J., Chernykh, D., Noormets, R., Semiletov, I., and Gustafsson, Ö.: Source apportionment of methane escaping the subsea permafrost system in the outer Eurasian Arctic Shelf, PNAS, https://doi.org/10.1073/pnas.2019672118, 2021.
Stepanova, S. V., Polukhin, A. A., and Kostyleva, A. V.: Hydrochemical structure of the waters in the eastern part of the Laptev Sea in autumn 2015, Oceanology, 57, 58–64, https://doi.org/10.1134/S0001437017010180, 2017.
Summons, R. E., Jahnke, L. L., and Roksandic, Z.: Carbon isotopic fractionation in lipids from methanotrophic bacteria: Relevance for interpretation of the geochemical record of biomarkers, Geochim. Cosmochim. Acta, 2853–2863, https://doi.org/10.1016/0016-7037(94)90119-8, 1994.
Summons, R. E., Jahnke, L. L., Hope, J. M., and Logan, G. A.: 2-Methylhopanoids as biomarkers for cyanobacterial oxygenic photosynthesis, Nature, 400, 554–557, https://doi.org/10.1038/23005, 1999.
Sun, F., Hu, W., Cao, J., Wang, X., Zhang, Z., Ramezani, J., and Shen, S.: Sustained and intensified lacustrine methane cycling during Early Permian climate warming, Nat. Commun., 13, https://doi.org/10.1038/s41467-022-32438-2, 2022.
Takeuchi, M., Katayama, T., Yamagishi, T., Hanada, S., Tamaki, H., Kamagata, Y., Oshima, K., Hattori, M., Marumo, K., Nedachi, M., Maeda, H., Suwa, Y., and Sakata, S.: Methyloceanibacter caenitepidi gen. nov., sp. nov., a facultatively methylotrophic bacterium isolated from marine sediments near a hydrothermal vent, Int. J. Syst. Evol. Microbiol., 64, 462–468, https://doi.org/10.1099/ijs.0.053397-0, 2014.
Takeuchi, M., Ozaki, H., Hiraoka, S., Kamagata, Y., Sakata, S., Yoshioka, H., and Iwasaki, W.: Possible cross-feeding pathway of facultative methylotroph Methyloceanibacter caenitepidi Gela4 on methanotroph Methylocaldum marinum S8, PloS One, 14, https://doi.org/10.1371/journal.pone.0213535, 2019.
Thornton, B., Geibel, M. C., Crill, P. M., Humborg, C., and Mörth, C. M: Methane fluxes from the sea to the atmosphere across the Siberian shelf seas, Geophys. Res. Lett., 43, 5869–5877, https://doi.org/10.1002/2016GL068977, 2016.
Thornton, B., Prytherch, J., Anderson, K., Brooks, I. M., Salisbury, D., Tjernström, M., and Crill, P. M.: Shipborne eddy covariance observations of methane fluxes constrain Arctic sea emissions, Sci. Adv., 6, eaay7934, https://doi.org/10.1126/sciadv.aay7934, 2020.
Tikhonova, E. N., Kadnikov, V. V., Rusanov, I. I., Beletsky, A. V., Zakharova, E. E., Samylina, O. S., Ravin, N. V., and Pimenov, N. V.: Methane-Oxidizing Activity and Phylogenetic Diversity of Aerobic Methanotrophs in the Laptev Sea Upper Sediment Horizons, Microbiology (Russian Federation), 90, 314–323, https://doi.org/10.1134/S0026261721030127, 2021.
van Dongen, B. E., Semiletov, I., Weijers, J. W. H., and Gustafsson, Ö.: Contrasting lipid biomarker composition of terrestial organic matter exported from across the Eurasian Arctic by the five great Russian Arctic rivers, Global Biogeochem. Cycles, 22, https://doi.org/10.1029/2007GB002974, 2008.
van Winden, J. F., Talbot, H. M., Reichart, G. J., McNamara, N. P., Benthien, A., and Sinninghe Damsté, J. S.: Influence of temperature on the δ13C values and distribution of methanotroph-related hopanoids in Sphagnum-dominated peat bogs, Geobiology, 18, 497–507, https://doi.org/10.1111/gbi.12389, 2020.
Vekeman, B., Kerckhof, F.-M., Cremers, G., De Vos, P., Vandamme, P., Boon, N., Op Den Camp, H. J. M., and Heylen, K.: New Methyloceanibacter diversity from North Sea sediments includes methanotroph containing solely the soluble methane monooxygenase, Environ. Microbiol., 18, 4523–4536, 2016.
Vonk, J. E., Sanchez-Garca, L., Van Dongen, B. E., Alling, V., Kosmach, D., Charkin, A., Semiletov, I. P., Dudarev, O. V., Shakhova, N., Roos, P., Eglinton, T. I., Andersson, A., and Gustafsson, A.: Activation of old carbon by erosion of coastal and subsea permafrost in Arctic Siberia, Nature, 489, 137–140, https://doi.org/10.1038/nature11392, 2012.
Wild, B., Shakhova, N., Dudarev, O., Ruban, A., Kosmach, D., Tumskoy, V., Tesi, T., Grimm, H., Nybom, I., Matsubara, F., Alexanderson, H., Jakobsson, M., Mazurov, A., Semiletov, I., and Gustafsson, Ö.: Organic matter composition and greenhouse gas production of thawing subsea permafrost in the Laptev Sea, Nat. Commun., 13, https://doi.org/10.1038/s41467-022-32696-0, 2022.
Wittig, S., Berchet, A., Pison, I., Saunois, M., and Paris, J.-D.: Surface networks in the Arctic may miss a future methane bomb, Atmos. Chem. Phys., 24, 6359–6373, https://doi.org/10.5194/acp-24-6359-2024, 2024.
Xie, L., Yakushev, E., Semiletov, I., Grinko, A., Gangnus, I., Berezina, A., Osadchiev, A., Zhdanov, I., Polukhin, A., Moiseeva, J., Purgina, D., Pipko, I., Pugach, S., Dudarev, O., and Ge, Z.: Biogeochemical structure of the Laptev Sea in 2015-2020 associated with the River Lena plume, Front. Mar. Sci. 10, 1180054, https://doi.org/10.3389/fmars.2023.1180054, 2023.
Yan, X., Liu, J., Kang, W., Huang, X., Zhou, A., Chen, L., Zhang, J., Dong, H., Chen, Z., Wu, J., Holmstrand, H., Rühland, K. M., Smol, J. P., Chen, F., and Gustafsson, Ö.: Pronounced methane cycling in northern lakes coincided with a rapid rise in atmospheric CH4 during the last deglacial warming, Sci. Adv., 11, eadt2561, https://doi.org/10.1126/sciadv.adt2561, 2025.