the Creative Commons Attribution 4.0 License.
the Creative Commons Attribution 4.0 License.
 | 25 Feb 2026
Wintertime production and storage of methane in thermokarst ponds of subarctic Norway
Anfisa Pismeniuk
Peter Dörsch
Mats Ippach
Clarissa Willmes
Sunniva Sheffield
Norbert Pirk
Sebastian Westermann
The ongoing climate change in permafrost areas can trigger abrupt thaw processes, leading to the formation of thermokarst lakes and ponds. These water bodies, especially in organic-rich areas, are recognized as strong methane (CH4) emitters during the ice-free periods and have the potential to accumulate large CH4 amounts in and below the ice, which is released during the ice melt. We estimated winter CH4 bottom flux in nine shallow ponds within two permafrost peatlands in Northern Norway, Iškoras and Áidejávri, during the 2023–2024 ice cover season. The cumulative winter CH4 bottom flux ranged from 0.6 to 24 g CH4-C m−2 which at the Iškoras site contributed up to 40 % to the annual CH4 budget. The heterogeneity of the CH4 wintertime accumulation is related to pond depth, differences in vegetation, and the thermokarst pond formation age. The latter was investigated using a space-for-time substitution approach along chronosequences of thermokarst formation spanning more than 70 years. The winter CH4 bottom flux increased from 2 mg CH4-C m−2 d−1 in two-year-old pond to 106 mg CH4-C m−2 d−1 in a pond formed between 30 and 60 years ago. Pond that formed more than 70 years ago and is currently experiencing sedge regrowth exhibited large winter CH4 bottom flux of 59 mg CH4-C m−2 d−1, while older ponds dominated by Sphagnum mosses showed 4 to 10 times smaller CH4 bottom fluxes.
- Article
(4195 KB) - Full-text XML
-
Supplement
(1831 KB) - BibTeX
- EndNote


Lakes and ponds are key sources of methane (CH4) at high northern latitudes (Wik et al., 2016), particularly in ice-rich permafrost regions where abrupt thaw processes lead to the formation of thermokarst waterbodies (Heslop et al., 2015; Vonk et al., 2015; Turetsky et al., 2020). Recent synthesis studies have summarized existing data on CH4 fluxes from waterbodies in boreal and Arctic ecosystems (Wik et al., 2016; Denfeld et al., 2018; Kuhn et al., 2021). However, most of this data represents ice-free periods, while studies addressing seasonal variations remain limited. Northern lakes are ice-covered for roughly 60 % of the year, underscoring the importance of estimating wintertime CH4 storage and bottom flux during frozen periods (Walter Anthony et al., 2010, Wik et al., 2011; Boereboom et al., 2012; Greene et al., 2014, Langer et al., 2015). Ice-covered lakes and ponds often experience anoxic conditions which lead to significant CH4 accumulation both below and in the ice. This CH4 is released upon ice-off from the ice and the oversaturated water column (Greene et al., 2014; Sepulveda-Jauregui et al., 2015; Vonk et al., 2015). It remains unclear to what extent the emission of CH4 accumulated during winter contributes to the annual CH4 budget of arctic landscapes. Several studies have reported high emissions during ice melt (Phelps et al., 1998, Karlsson et al., 2013; Jammet et al., 2015), but quantification of wintertime CH4 production in northern lakes and ponds is scarce (Boereboom et al., 2012; Langer et al., 2015) and may result in underestimation of annual CH4 emissions, especially for peatland thermokarst lakes (Matveev et al., 2019).
Northern peatlands cover approximately 3.7±0.5 million km2 and store around 415±150 Pg of carbon (Hugelius et al., 2020). Given this large carbon pool, decomposition of peat may trigger significant additional greenhouse gas (GHG) emissions, potentially amplifying global warming. The sporadic permafrost zone outside the mountain regions of Fennoscandia largely consists of peat plateaus, which are currently undergoing significant degradation due to thermokarst processes and may completely disappear from most of these areas in the coming decades (Borge et al., 2017). The intensification of abrupt thaw is leading to the expansion of small (<1000 m2 in surface area) and shallow (<2 m in depth) thermokarst lakes and ponds. Despite their significance as active CH4 sources, these small water bodies are often overlooked in the global assessments, although high CH4 emissions have been reported in Canada, Northern Sweden, and Russia (Matveev et al., 2016; Kuhn et al., 2018; Burke et al., 2019; Serikova et al., 2019).
In this study, we evaluated wintertime CH4 production and accumulation in nine ponds across two permafrost peatland sites within the sporadic permafrost zone of Finnmark, Northern Norway, by estimating CH4 storage below and in the ice during the 2023–2024 winter season. Our specific objectives are to (1) quantify CH4 winter bottom fluxes in various ponds across two permafrost peatland sites in Finnmark, (2) assess the contribution of wintertime cumulative CH4 flux to the annual CH4 budget at one of the sites, (3) identify the main factors causing differences in CH4 winter bottom fluxes, and (4) explore the relationship between CH4 winter bottom fluxes and the age of thermokarst pond formation.
2.1 Climatic and environmental settings
We investigated nine ponds located within two peat plateau complexes in the sporadic permafrost zone of Finnmark, Northern Norway (Fig. 1a): Iškoras (69°20′26.4′′ N; 25°17′42.2′′ E; 380 m a.s.l.) and Áidejávri (68°45′14′′ N; 23°19′01′′ E, 398 m a.s.l.). Both peat plateau complexes are located on the Finnmarksvidda mountain plateau in a continental subarctic climate. For 1980–2024, the mean annual air temperatures were −2 °C at Áidejávri (meteorological station Sihccajavri) and −1.5 °C at Iškoras (meteorological station Cuovddatmohkki, https://seklima.met.no, last access: 15 May 2025). At Iškoras, the mean 2 m air temperature over the past three years was 0.15 °C (Pirk et al., 2024).
The Áidejávri peat plateau extends along both sides of the Luovosjohka River. Its main area on the eastern bank covers approximately 40 ha (including thermokarst depressions and ponds) and is divided into northeastern and southwestern sections by the Ruovdejohka stream. The Iškoras peat plateau covers roughly 4 ha (Knutson et al., 2025). Peat formation on the Finnmarksvidda plateau began after the last deglaciation, ca. 10 000–8000 cal yr BP (Kjellman et al., 2018). At Iškoras, peatland initiated around 9200 cal yr BP and developed as a wet fen through most of the Holocene, with permafrost aggradation occurring ca. 800 cal yr BP (Kjellman et al., 2018). At Áidejávri, peat inception and permafrost aggradation ages are not dated. However, given its similar setting to Iškoras on Finnmarksvidda, it is likely that peat initiation and permafrost aggradation occurred at roughly comparable ages in Áidejávri. The peat thickness at the top of the peat plateau reaches 1.7 m at Iškoras (Kjær et al., 2024) and 2 m at Áidejávri (unpublished data).
At both sites, the dominant vegetation includes mosses (e.g. Polytrichum commune) and lichens (Cladonia spp.), as well as dwarf shrubs (e.g., Betula. nana). The surrounding fen areas and thermokarst ponds are dominated by sedges (Carex spp.), cotton grass (Eriophorum spp.), and various Sphagnum species (Kjellman et al., 2018; Pirk et al., 2024). The Iškoras site is well studied, with a documented paleoenvironmental history (Kjellman et al., 2018), water chemistry and greenhouse-gas flux measurements from ponds (Knutson et al., 2025). Moreover, an Eddy Covariance flux system has been operated at the Iškoras site since 2019, monitoring the CH4 and CO2 exchange. While Áidejávri is less extensively studied, geochemical characteristics and carbon mobilization potentials of the permafrost peat for both sites are reported in Kjær et al. (2024).
The studied peatlands have experienced thawing for many decades and thermokarst pond formation has accelerated significantly in the last 20 years (Borge et al., 2017). While some thermokarst ponds are currently undergoing a transition to terrestrial wetland ecosystems through sedge and/or Sphagnum succession, recently formed ponds continue to expand due to thawing and collapse of peat plateau edges.
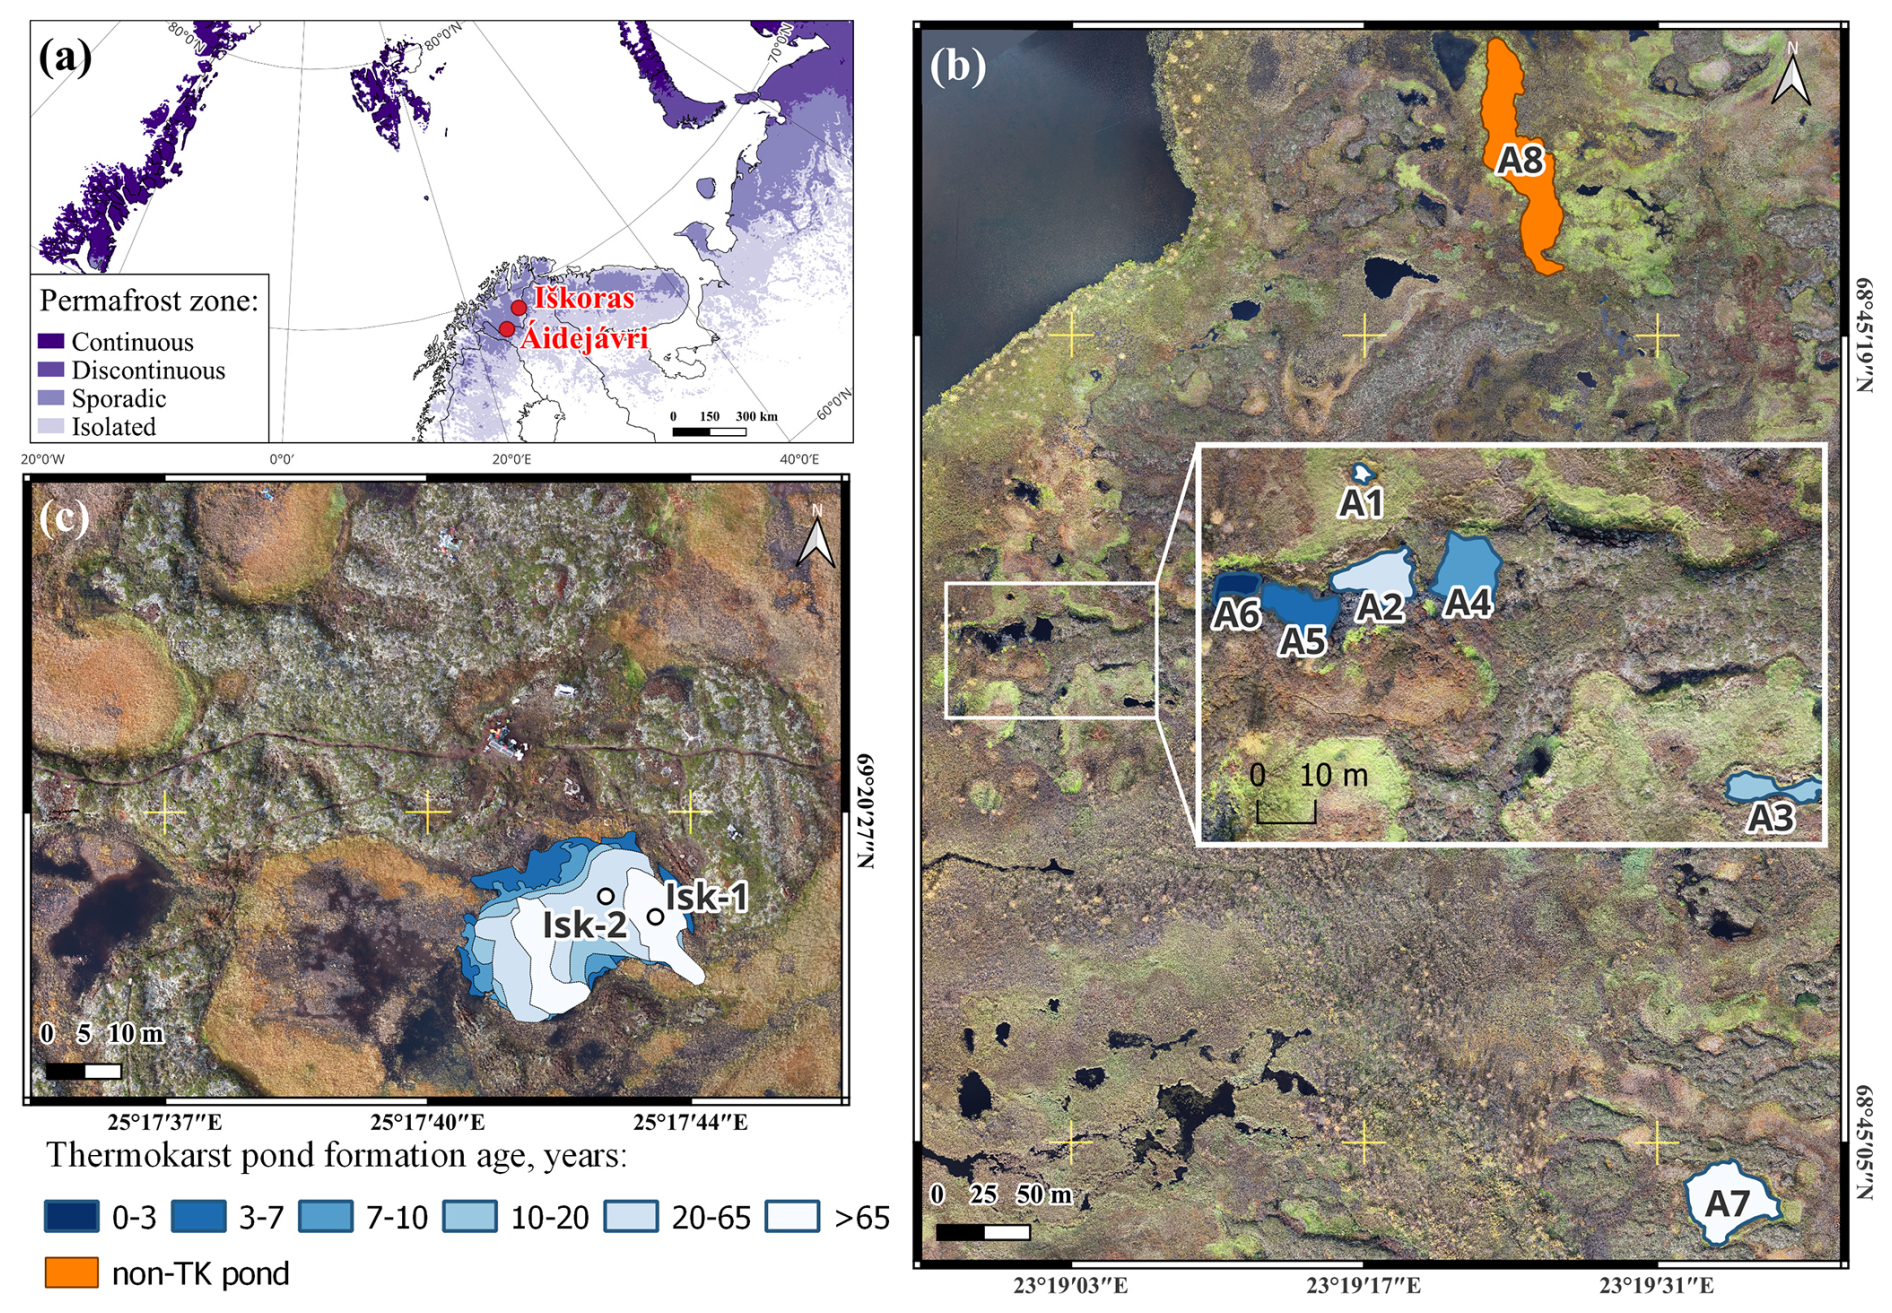
Figure 1Study area: (a) map showing permafrost distribution in Northern Scandinavia and surrounded territories with the location of two studied peat plateaus (adapted from Obu et al., 2019); (b) studied ponds in Áidejávri (A1–A8), with the main study area as insert; (c) studied pond Iškoras with two sampling locations (Isk-1 and Isk-2). The colour of the ponds represents the thermokarst pond formation age (Sect. 3.7). The orthophotos used in (b) and (c) were obtained from a drone survey conducted in 2023 and processed as described in Martin et al. (2021) (Sect. 3.7).
2.2 Sampling sites
At Áidejávri, we focused on eight shallow ponds (ranging from 0.4 to 1.5 m depth) located in the northeastern section of the large peat plateau complex (Fig. 1b, Table 1). Six of the ponds (A1–A6) are located in a relatively small area of 150 m × 100 m in which all available ponds were sampled (referred to as “main study area” in Áidejávri in the following, see also Fig. S1 in the Supplement). These ponds were all derived from the same peat plateau complex, suggesting similar environmental conditions and a shared origin of the submerged peat material. However, analysis of aerial images (Sect. 3.7) revealed different formation ages of the ponds, spanning a chronosequence from 1 to 70 years, which allows us to compare wintertime CH4 production with thermokarst pond formation age (Fig. S1). The ponds were named in chronological order with A1 being the oldest and A6 the youngest pond. The successional stages (Sect. 3.7) differ among ponds and are not clearly linked to formation age. Notably, pond A1, the oldest in the study area, and pond A3, formed over the last two decades, are rapidly overgrowing with sedges. Ponds A2 and A4–A6 are currently expanding and are to some degree hydrologically connected but initially formed as separate water bodies.
In addition, we included two reference ponds (A7 and A8) located to the north and east of the main study area at Áidejávri (Fig. 1b). The large pond A7, located in the eastern part of the plateau, has been present in the earliest aerial image from 1958 (Fig. S2). It has retained relatively stable boundaries since then, undergoing only very slow Sphagnum succession from the edges (Fig. S2a–b, Table 1). Due to its rounded shape and the location inside an extensive peat plateau complex, we interpret A7 to be a thermokarst pond as well. While its formation age cannot be fully constrained (Sect. 3.7), it clearly formed before 1958, making it the oldest thermokarst pond sampled in Áidejávri together with A1. Finally, we sampled pond A8, located north of the main study area, which is being slowly overgrown by sedges (Fig. S2c–d). Unlike the thermokarst ponds in the area, A8 has an elongated shape, and a strongly different pH compared to the thermokarst ponds (Sect. 4.1). For these reasons, we rather interpret A8 as a remnant of a larger post-glacial water body which has partly transitioned into a mire than a thermokarst pond. A8 is therefore referred to as “non-thermokarst” pond in the following.
At the Iškoras peat plateau complex, we sampled two locations in the large central pond (Isk1/2, Fig. 1c), which differed by their formation ages. While the oldest part of the pond with sampling location Isk-1 formed before 1955 (i.e. the first available aerial image, Fig. S3a), it subsequently expanded in size, with sampling location Isk-2 becoming submerged between 1955 and 2003 (Fig. S3b). Despite ongoing retreat of the surrounding peat plateau edges, the pond margins appear relatively stable. However, slow Sphagnum colonization from the edges has started, indicating that the final stage of thermokarst pond development is approached. At the sampling site Isk-1, submerged Sphagnum species were also observed at the bottom. The pond is situated in the footprint of an eddy-covariance tower operating at the Iškoras site (Pirk et al., 2024), allowing us to estimate the potential contribution of cumulative winter CH4 flux to the annual CH4 budget (Sect. 5.2). More detailed information about all ponds studied is given in Table 1.
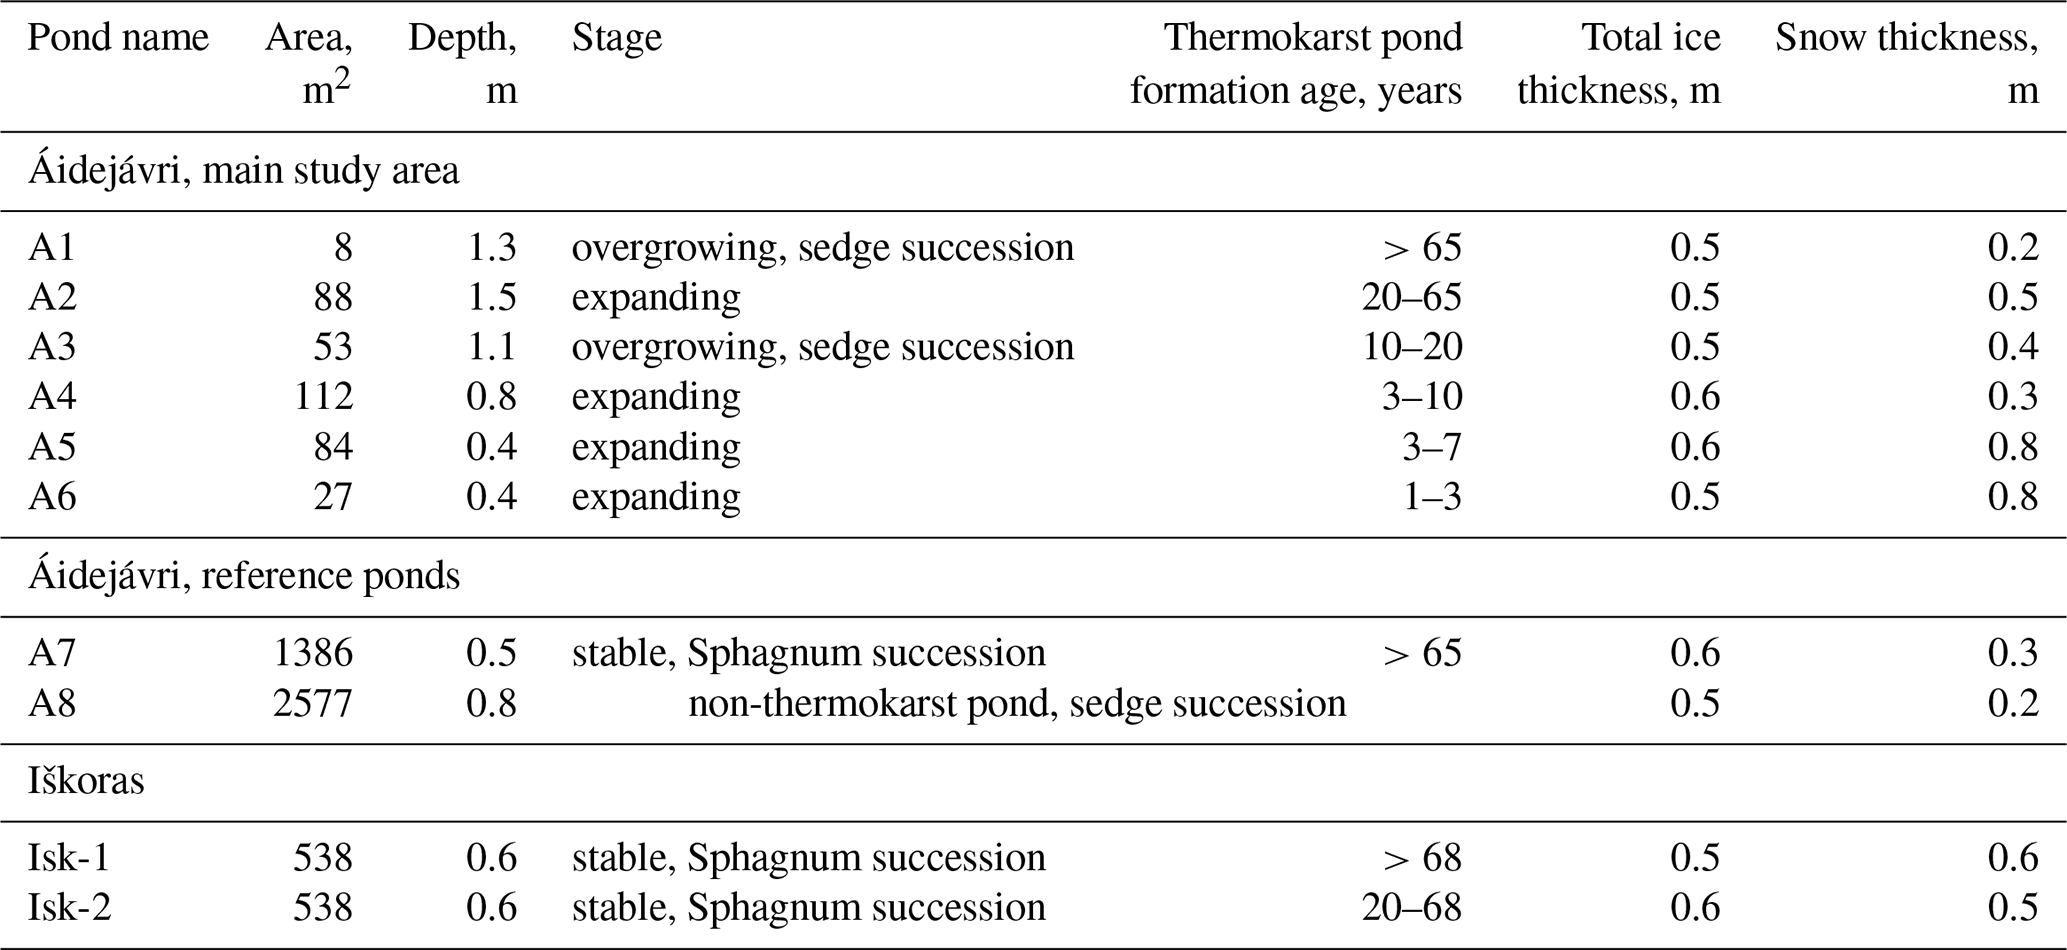
Table 1Characteristics of the studied ponds. The thermokarst pond formation age and stage were determined based on historical and modern aerial images (Sect. 3.7), 2023 was used as baseline for the age estimations. Snow and ice thicknesses were measured during the field campaign in March 2024. Total ice thickness included superimposed ice and the frozen peat layers in ponds A5 and A6 (Sect. 3.2).
3.1 Field Sampling
The main fieldwork was carried out 11–17 March 2024, with additional campaigns on 10–13 September and 4–5 October 2024. During the winter campaign in March 2024, ice cores and below-ice pond water samples were collected for each of sampling sites (Sect. 2.2). The exact positions were determined from the aerial imagery (Sect. 3.7), generally in the central area of each pond, and located by differential GPS in the field. At each sampling location, after measuring the snow thickness, we cleaned the ice surface and drilled through the ice using an ice auger. If the pond was not frozen to the bottom, water was sampled from both near the bottom and directly below the ice using a custom-made sampler consisting of a 120 mL serum bottle on a rotating arm. The sampler was lowered to a specific depth with the bottle neck pointing downwards, before turning the bottle upwards to fill it with water. Immediately after bringing the water samples to the surface, dissolved gases were extracted from a subsample on-site using the acidified headspace method (Åberg and Wallin, 2014) following the protocol of Knutson et al. (2025). 30 mL of water was collected into a 60 mL disposable syringe equipped with a 3-way valve and 20 mL headspace with ambient air was created. The samples were acidified with 0.6 mL of 3 % HCl to achieve a pH <2, so that the dissolved inorganic carbon (DIC) was completely released as CO2 into the headspace. To reach the equilibrium, the syringe was shaken for 1 min, followed by a 30 s rest and this sequence was repeated three times (Knutson et al., 2025). The headspace gas was transferred to a Helium (He) washed and evacuated 12 mL septum vials (Chromacol, remaining pressure 4–6 mbar). Ambient air was collected at each sampling point to correct for background concentrations. Another subsample of the pond water was stored in 50 mL Falcon tubes for dissolved organic carbon (DOC) analysis. These samples were filtered through a 0.45 µm sterile syringe filter with an RC membrane (VWR International) on the same day and subsequently stored for maximum 7 d in darkness at 4 °C before being analyzed. Water temperature and pH were measured in the field.
After processing the water samples, we extracted one ice column per sampling location using an ice auger. The ice core was subsampled horizontally according to visible differences in texture, and the samples were shipped frozen to a cold container (−5 °C) at the University of Oslo where they were stored until analysis.
In September 2024, we sampled dissolved gases and DOC for ice-free conditions at the winter sampling locations. The water samples were collected at a depth of 0.1 m from the center of each pond. For the Iškoras pond, in which the two winter sampling sites Isk-1 and Isk-2 are located, only a single location was sampled. Sample extraction and analysis were performed following the same procedures as in winter, with pH and temperature measured in the field. In addition, dissolved gas samples were taken in October 2024 just after freeze-up from selected ponds (A1, A2, A4, A5, Isk1/2) both from below the newly formed ice and from the bottom of the pond, again using the water sampler and the acidified headspace method described above.
At Iškoras, the water temperature was continuously measured at two depths (0.4 and 0.6 m) at the Isk-1 site using automatic data loggers (Fig. S4). The results indicate that the pond is well mixed during the ice-free period (Fig. S4), in particular during the September sampling campaign. In winter, the temperature between two depths varied due to the ice formation which reached the upper logger, but temperature differences did not exceed 2 °C.
3.2 Ice sample preparation
Ice samples were cleaned and cut in a cold container at −5 °C at the University of Oslo. The bubble structure was visually described, partly following the classification of Boereboom et al. (2012). Samples were characterized as “Superimposed ice”, “Clear ice”, “Spherical and nut-shaped bubbles”, “Elongated bubbles”, “Mixed bubbles”, “Methane ebullition bubbles” and “Frozen peat”. “Superimposed ice” was found on a top of the ice cores, identified by its texture, brownish color, and higher impurities and DOC contents (Sect. 4.2) compared to the ice layers below (Manasypov et al., 2015). “Methane ebullition bubbles” were identified as relatively large (1–2 cm in diameter), flat bubbles near the surface layers. In the deeper layers, ebullition bubbles were categorized as “Mixed bubbles”. Two of the shallower ponds (<0.5 m deep) were frozen to the bottom, including the bottom peat layers; these layers were classified as “Frozen peat”.
The ice samples of each layer were divided into two to three subsamples, except for 7 of the layers for which the sample material was not sufficient to divide in subsamples. Each subsample was placed into a 1050 mL glass jar and sealed with an airtight lid equipped with a sampling septum. The jars were flushed with He using an automated manifold and a vacuum pump, and after releasing He-overpressure, the ice was left to melt at room temperature (+23 °C) overnight. The bottles were shaken at 120 rpm for 1 h to equilibrate gases between the sample and the headspace. Immediately following shaking, the jar headspace was analyzed for CH4 using a gas chromatograph (Sect. 3.3). After, the meltwater was collected to measure the ice water equivalent (w.e.), pH and DOC content, the melted ice was filtered using the same procedure as described for the pond water samples (Sect. 3.1). The frozen peat samples were dried in an oven at +40 °C to estimate dry weight and liquid volume.
3.3 Analysis of gas concentrations
Gases dissolved in pond water and entrapped in the ice monoliths were analyzed at the Norwegian University of Life Sciences (Ås, Norway) using a gas chromatograph (GC; Model 7890A, Agilent, Santa Clara, CA, USA) equipped with an autosampler (GC-Pal, CTC, Switzerland). Approximately 1 mL of headspace gas was sampled by a hypodermic needle connected to a peristaltic pump (Gilson Minipuls 3) and admitted to two heated 250 µL sampling loops loading the analyte on two separation columns: a 20 m wide-bore (0.53 mm) Poraplot Q column for the separation of CH4 and CO2 from bulk gases, and a 60 m wide-bore Molsieve 5Å PLOT column for separating O2, + Ar, and N2. CH4 was measured with a flame-ionization detector (FID; detection limit 0.1 ppm). CO2, O2 and N2 were measured with a thermal-conductivity detector (TCD; detection limits 10 ppm for CO2 and 100 ppm for O2 and N2). Calibration and conversion of peak areas to ppm were performed using dry bottles with standard gas mixtures (AGA, Norway). The precision of the GC measurements was within 1 % determined by repeated analyses of certified gas standards.
The concentrations of the gasses in the ice were calculated using solubility constants adjusted to the laboratory temperature during melting (Wilhelm et al., 1977). Only the CH4 concentrations of the ice layers are reported in this study, but all the gasses measured were used to calculate the gas volume (Sect. 3.5).
Dissolved concentrations of CH4, CO2 and O2 were corrected for background air concentrations and calculated using solubility constants adjusted to in situ temperature (Wilhelm et al., 1977). Dissolved CO2 concentrations in the ponds were calculated from total DIC concentrations after acidification (Sect. 3.1) using in situ pH and equilibrium constants adjusted for the pond temperature (Åberg and Wallin, 2014). Dissolved O2 concentrations were analyzed for the samples collected in September 2024. To assess the oxygen conditions in the ponds in September 2024, we determined the O2 saturation in the water relative to atmospheric equilibrium. We classified the oxygen conditions as oxic when the saturation exceeded 30 %, as hypoxic when the saturation was below 30 %, and as anoxic when saturation values were below 1 %. We estimated an uncertainty of 20 % in oxygen saturation measurements due to significant differences observed between measured values in replicate samples. Dissolved oxygen concentrations below ice were not measured.
3.4 pH and Dissolved Organic Carbon analysis
The pH was measured using a HANNA instruments pH meter HI9124 with a HI1230B pH electrode, which was 3-point calibrated using Cetripur® buffer solutions from Supelco® (buffer solutions pH 4.01, 7, 10). The Dissolved Organic Carbon content (DOC) was analyzed using the Total Organic Carbon Analyser (TOCV, Shimadzu, Japan) coupled to an autosampler (ASI-V) using combustion and near infrared detection of CO2 after removing carbonates by HCl.
3.5 CH4 storage in water and ice
To assess winter CH4 accumulation, we evaluated the pond-derived winter CH4 storage (Swinter), i.e. the amount of CH4 contained in the combined water and ice column (unit mg CH4-C m−2) at the sampling day in March 2024, as well as the CH4 storage in the water column prior to freezing (Sprior). The winter storage was obtained as the sum of CH4 stored in the ice and unfrozen water column below the ice:
where Cw, below is the dissolved CH4 concentration in the water column below the ice, dw, below the thickness of the water layer below the ice, di the thickness of the ice layer i and Cice, i the CH4 concentration in ice layer i. Layers 1 to N cover the vertical extent of the ice column, excluding superimposed ice layers (Sect. 3.2), for which it is unclear whether the contained CH4 is derived from the pond or from the atmosphere (see below for uncertainty assessment). The second term on the right-hand side of Eq. (1) is referred to as “ice storage”, while the first term is referred to as “below-ice storage”. Each term in Eq. (1) was estimated separately to assess the relative contributions of ice and below-ice storage to the total winter storage and to quantify the uncertainty of each term. When the pond was frozen to the bottom, the below-ice storage was set to 0. We assumed a 5 % uncertainty for Cw, below, based on existing uncertainty estimates of the field headspace method (Åberg and Wallin, 2014; Koschorreck et al., 2021). The presence of plants or loose peat layers on the pond bottoms created challenges for determining dw, below. We therefore assumed a depth uncertainty of ±0.1 m for dw, below in ponds where the water layer was deeper than 0.1 m. When the residual water layer was shallower than 0.1 m, we assumed a 100 % relative uncertainty on dw, below. For the Iškoras ponds (Isk-1 and 2), disturbances caused by the drilling made it impossible to determine whether it was frozen to the bottom or whether a shallow (0.05 to 0.1 m) water layer remained below the ice. Furthermore, it was not possible to collect dissolved CH4 samples from the stirred-up water. As even a thin water layer can contain substantial amounts of CH4, we report two confining estimates of Swinter: one assuming that the pond was frozen completely to the bottom, and a second estimate assuming a dw, below of 0.05 m (Isk-2) and 0.1 m (Isk-1) with Cw, below corresponding to the average CH4 partial pressures from the Áidejávri ponds. The ice storage was calculated by summing up the CH4 content of individual ice layers i (Eq. 1). The CH4 concentration in an ice sample, Cice, i, was obtained from the amount of CH4 in the sample (Sect. 3.3), as well as the sample volume of ice. The latter was calculated from the meltwater volume using the ice–water density ratio, as well as the bubble volume derived from the measured total gas volume in the sample (Sect. 3.3) using the ideal gas law, assuming a temperature of 0 °C and atmospheric pressure. For the frozen peat layers, Cice, i was additionally corrected by the peat volume using the total dry weight and the substance density (1.3 g cm−3; Farouki, 1981).
The uncertainty for Cice, i was calculated from the standard deviation of all available ice subsamples. When the number of subsamples was less than three, we assigned the average relative uncertainty of comparable ice layers (Sect. 3.2) from the other ponds. For the frozen peat samples, when only a single sample was available, we applied the average relative uncertainty from the deepest ice layers in other ponds. During fieldwork, the uncertainty of di was estimated to be 0.02 m. Finally, the uncertainty of Swinter was determined from the individual uncertainties of all right-hand side terms in Eq. (1) using Gaussian error propagation and assuming that the individual uncertainties are independent (Taylor, 1997). CH4 stored in superimposed ice layers constitutes a potential systematic bias for winter ice storage, as it is unclear whether the stored CH4 was derived from the atmosphere or from pond water pressed upwards through cracks. However, its contribution was in most cases very small (<5 % of Swinter for pond A3, <1 % for all other ponds except A6), so that the uncertainty was negligible compared to the uncertainties of Cice, i in the different ice layers and thus not included in the uncertainty calculation of Swinter. However, in pond A6, superimposed ice contributed around 50 % to Swinter. For this pond, we assigned a 50 % uncertainty to the ice storage.
The CH4 storage in the water column prior to freezing (Sprior) was estimated as:
in which Cw, prior is the dissolved CH4 concentrations in water prior to ice formation and dw, prior the pond depth. As in-situ measurements of Cw, prior were not available for October 2023, we used two proxies to constrain its magnitude. First, the mean of the CH4 concentrations of the uppermost winter ice layer as sampled in March 2024 was used, which reflects the gas concentrations in the water prior to freezing. Secondly, we use the CH4 concentrations measured in September 2024 adjusted to a water temperature of 0 °C by applying solubility constants for 0 °C. While the magnitude of the two values agreed well for most ponds, larger differences occurred in some cases (Sect. 4.3), thus leading to considerable uncertainty. Therefore, we defined the uncertainty for Cw, prior as the interval between the minimum and maximum of the two estimates, expressed relative to the mean value used in the calculations. For dw, prior, we estimated uncertainties of ±0.1 m for the Áidejávri ponds, and ±0.2 m for Iškoras. The uncertainty of Sprior was determined by Gaussian error propagation from the individual uncertainties of the right-hand side terms in Eq. (2).
3.6 Winter CH4 bottom flux
The “winter CH4 bottom flux” (i.e. the CH4 flux at the sediment-water interface) was calculated as:
where Δt is time interval between the start of ice formation and the day of sampling in March 2024. Δt was estimated using meteorological data and Sentinel-2 satellite imagery available for October 2023. Initial ice formation at Iškoras started between 1 and 2 October 2023, coinciding with the first substantial drop in air temperature (Fig. S5). In Áidejávri, the onset of ice growth occurred between 6 and 13 October as indicated by temperature data from the meteorological station Sihccajavri and Sentinel-2 satellite imagery (Fig. S6). Sampling on both sites was conducted from 11 to 17 March 2024. For simplicity, we set Δt from 7 October 2023, to 14 March 2024, and assigned a temporal uncertainty of ±10 d.
The uncertainty in Fwinter was calculated by Gaussian error propagation (Sect. 3.5) using the uncertainties of the individual terms. We emphasize that the magnitude of Sprior is generally small compared to Swinter, so that it does not contribute strongly to the overall uncertainty of the winter CH4 bottom fluxes, despite large relative uncertainties associated with Sprior.
Spearman's rank correlation coefficients (rs) were calculated to assess relationships between biogeochemical pond parameters, estimated winter CH4 bottom fluxes, and environmental factors. The strength of the correlation was characterized as weak (rs=0.20–0.39), moderate (rs=0.40–0.59), strong (rs=0.60–0.79) and very strong (rs=0.80–1). A p value smaller than 0.05 was considered a statistically significant correlation.
3.7 Thermokarst pond formation ages
The thermokarst pond formation age was defined as the time of collapse of the peat plateau section, which typically coincided with water accumulation; however, there can be exceptions with the accumulation of water starting several years after collapse, as observed in the case of pond A4 (Fig. S1). We used 2023 as the baseline year for the age estimation. The thermokarst pond formation age was determined using geo-referenced historical aerial images (1955, 1958, 2003 and 2013) from the Norwegian Mapping Authority, as well as drone images (2015, 2020 and 2023) obtained from the Drone Infrastructure Lab, University of Oslo. The earliest available photographs are from 1955 for Iškoras (Kartverket survey WF-688 H-13) and 1958 for Áidejávri (Norgeibilder.no, 2025). The ortho-rectified drone imagery was processed following Martin et al. (2021) and has a ground resolution of 3 cm (2023), 5 cm (2020), and 10 cm (2015). The estimation of formation age was limited by the available imagery. No imagery from before the 1950s was available, and there is a gap between the 1950s and 2003. For the oldest pond types, which were already present in 1955 at Iškoras and 1958 at Áidejávri, it is not possible to constrain formation age prior to 1955.
Based on the area change, we classified pond developmental stages as stable, expanding, or overgrowing. If the net area change from 2015 to 2023 (including both permafrost degradation and succession) was less than 15 %, ponds were identified as “stable”. If the pond was formed or its area increased by more than 15 % since 2015, it was named “expanding”. If the pond area decreased by more than 15 % because of vegetation succession, it was classified as “overgrowing”. Succession by Sphagnum or sedges was identified based on the predominant species observed in aerial imagery and validated during fieldwork.
4.1 Seasonal variations of pH, DOC, and dissolved gases in water
All studied ponds were acidic, with pH levels ranging from 4 to 6.4 (Table 2). The highest pH (6.4) was measured in the non-thermokarst pond A8. Apart from the latter, the pH increased from September to March for all ponds not frozen to the bottom.
Table 2Water column pH and concentration of Dissolved Organic Carbon (DOC) in studied ponds sampled in March and September 2024. Ponds A5-A7 were frozen to the bottom in March 2024. Note that the months are presented in non-chronological order to reflect the logical sequence of the winter CH4 accumulation.
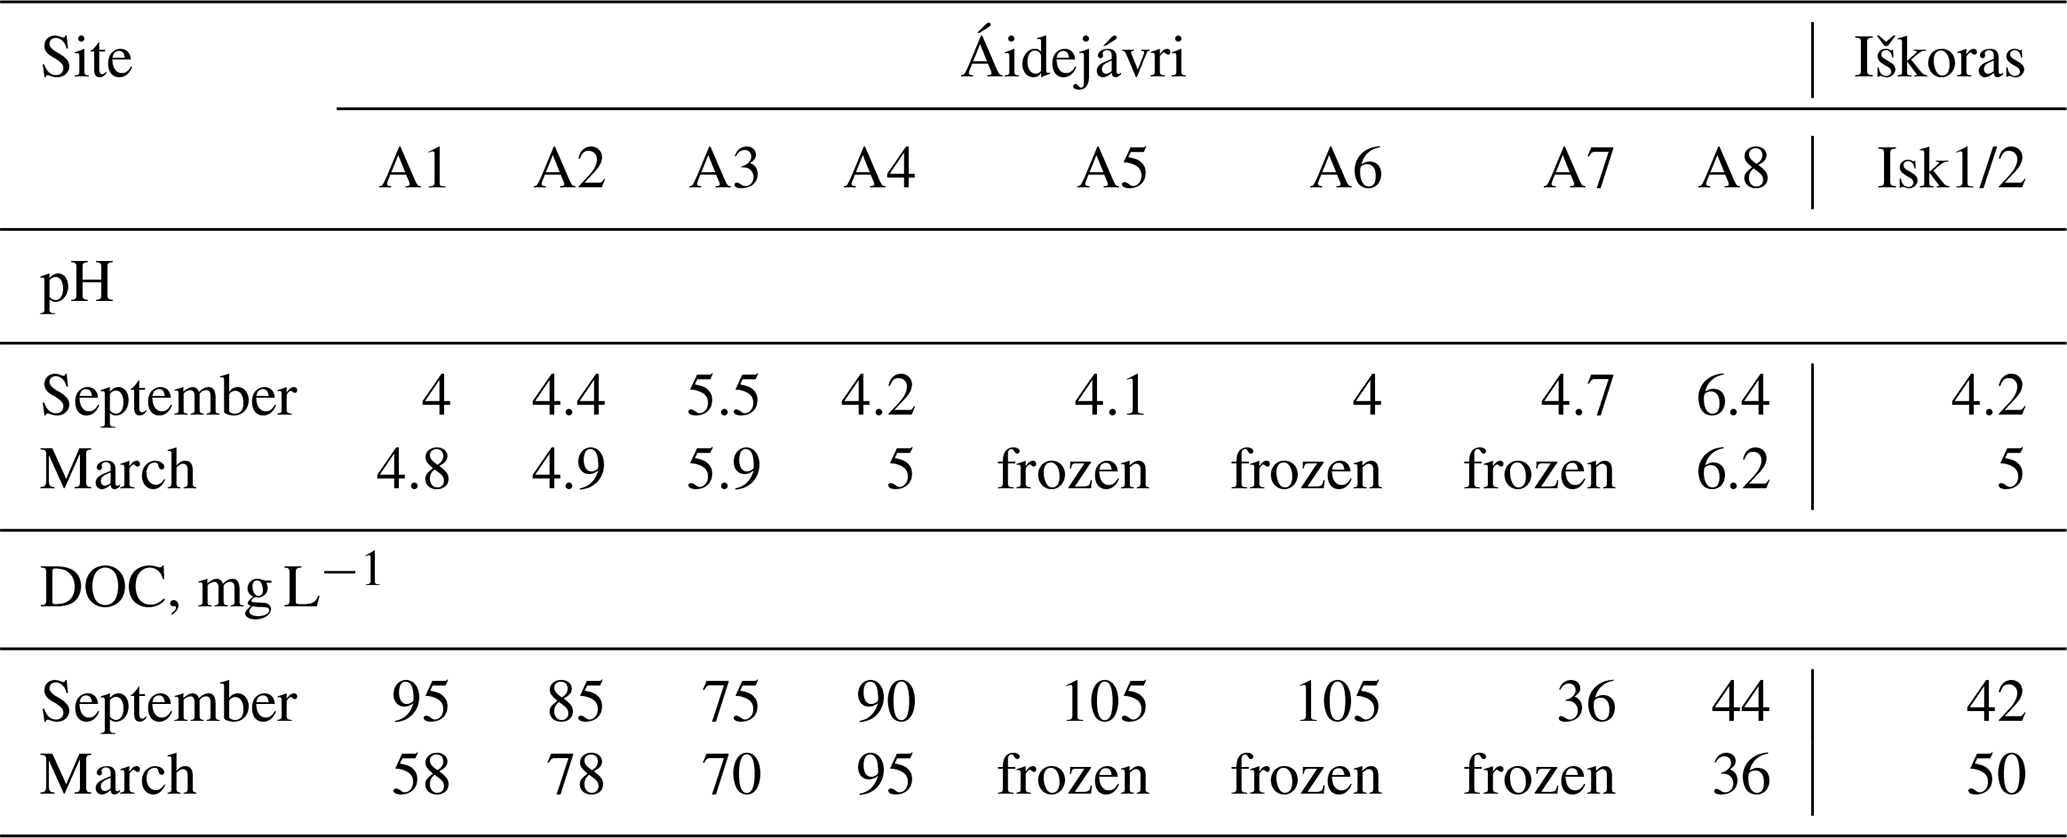
DOC concentrations varied from 36 mg L−1 in the non-thermokarst pond A8, sampled in March, to 105 mg L−1 in the young, shallow ponds A5 and A6, sampled in September (Table 2). In contrast to pH, DOC concentrations showed no clear seasonal pattern. The largest seasonal difference was observed in pond A1, which is overgrowing with sedges (Table 2). A strongly negative correlation (p<0.05) was observed between pond size and DOC concentration in September. Concentrations were low (<50 mg L−1) in the ponds A7 and A8 in Áidejávri, and Isk1/2 in Iškoras which are larger than 500 m2. Although DOC concentrations in September showed no distinct pattern with thermokarst pond formation age, there was a moderate negative correlation (p<0.05) with pond age in the main study area (A1–A6) in Áidejávri. DOC concentrations in the overgrowing ponds A1 and A3 ranged from 58 to 95 mg L−1. DOC concentrations in A2, A4, A5, and A6 averaged at 91 mg L−1 and correlated negatively with ponds age, increasing from 78 mg L−1 in the oldest pond A2, to a maximum of 105 mg L−1 in the recently formed ponds A5 and A6.
Large ponds (>500 m2, A7, A8 and Isk1/2) were saturated with oxygen in September (Fig. S8), while A2 and A6 were hypoxic, and ponds A1, A3 and A5 anoxic. Dissolved oxygen concentrations below ice were not measured, but available literature indicates that ponds experience anoxic conditions (Matveev et al., 2019).
Dissolved CH4 concentrations generally exceeded atmospheric equilibrium irrespective of season and pond characteristics. Similar to DOC, a strongly negative correlation was observed between pond size and CH4 concentrations in September 2024 (p<0.05). In September, the dissolved CH4 concentrations ranged from 0.4 to 170 µM, with the lowest values found in the stable ponds Isk1/2, A7, and the expanding pond A4 (Fig. 2). The highest concentrations up to 170 µM were measured in the anoxic ponds A1, A3, and pond A5. Notably, the recently formed pond A6, which is connected to A5, had a mean CH4 concentration that was at least one order of magnitude lower than A5. Sampling in early October revealed that all ponds experienced a rapid increase in CH4 concentrations with the start of ice formation. A maximum CH4 concentration of 701 µM was measured in pond A5 (Fig. 2). In pond A4, dissolved CH4 increased by two orders of magnitude, reaching 144 µM. The increase was smaller in Iškoras than Áidejávri ponds, with a maximum increase from 1.7 to 82 µM (Fig. 2). Dissolved CH4 concentrations in the remaining water column in March ranged from 660 to 1487 µM (Fig. 2). Interestingly, the overgrowing ponds A1 and A3, which exhibited high concentrations in September and October, showed relatively smaller CH4 accumulation over the winter. In contrast, the highest concentrations were measured in the ponds that were hypoxic in September, with the maximum mean value in pond A2 (1398 µM). The non-thermokarst pond aligned with the others, exhibiting a value of 1302 µM (Fig. 2).
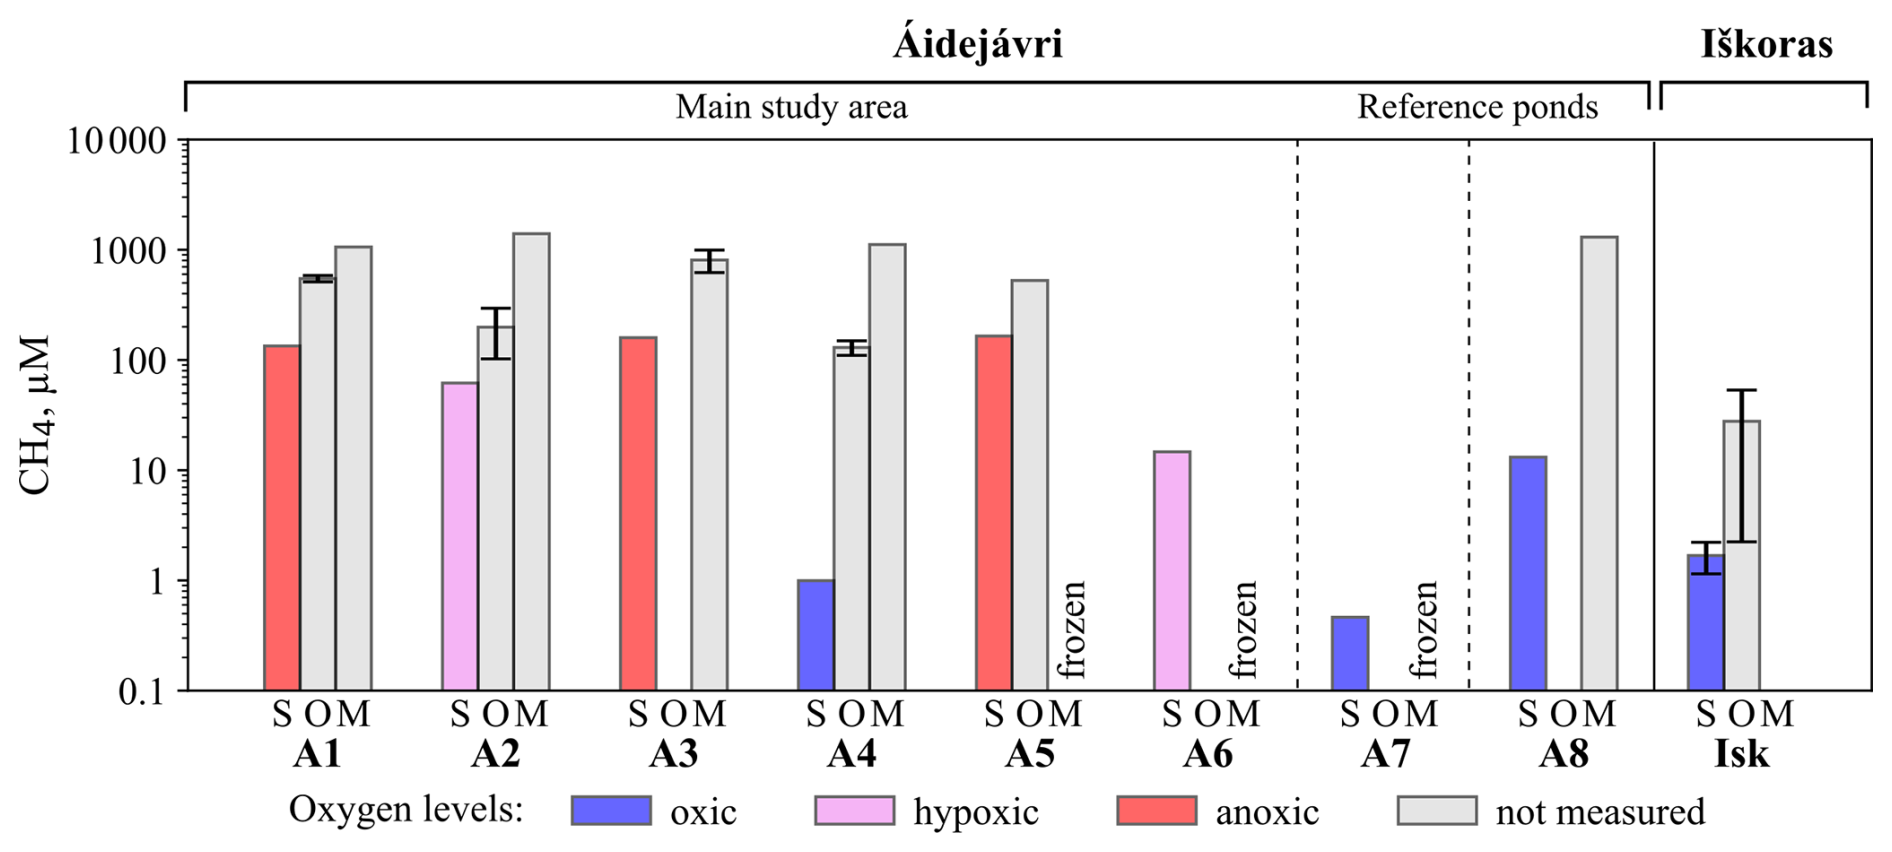
Figure 2Dissolved CH4 concentrations in the water column in March (M), September (S), and October (O) 2024. Error bars represent the standard deviations of multiple samples (n=3–12) collected from different depths in March and October, as well as replicate samples taken in September from the same depth. Note that the months are presented in non-chronological order to reflect the logical sequence of the winter CH4 accumulation.
Dissolved CO2 concentrations, like CH4, exceeded atmospheric values and increased substantially after ice formation (Fig. S9a). In all ponds, the CO2 : CH4 ratio was higher than 1 (Fig. S9b). In most of the ponds, the ratio decreased from September to March, indicating a shift from oxic to anoxic metabolism. CO2 data are presented in Sect. S2 in the Supplement.
4.2 pH, DOC, and CH4 in ice layers
In the ice samples, the pH values ranged from 4.4 to 8.2, with an average of 5.9 (Table S1 in the Supplement). A pH higher than 7 was only observed in the superimposed ice of non-thermokarst pond A8. DOC concentrations ranged from 1.9 to 160 mg L−1 (Table S1). However, for most ice samples without visible organic material, DOC concentrations were confined to a small range of 1.9 to 7.7 mg L−1. Superimposed ice formed a distinct group, with DOC concentrations ranging from 7.4 mg L−1 in the non-thermokarst pond A8 to 42 mg L−1 in pond A6. Values exceeding 60 mg L−1 were only measured in ice layers close to the pond bottom and in frozen peat (Table S1).
Ice core layers were classified (Sect. 3.2) in the categories “Superimposed ice”, “Clear ice”, “Methane ebullition bubbles”, “Spherical and nut-shaped bubbles”, “Elongated bubbles”, “Mixed bubbles”, or “Frozen peat” (Fig. 3).
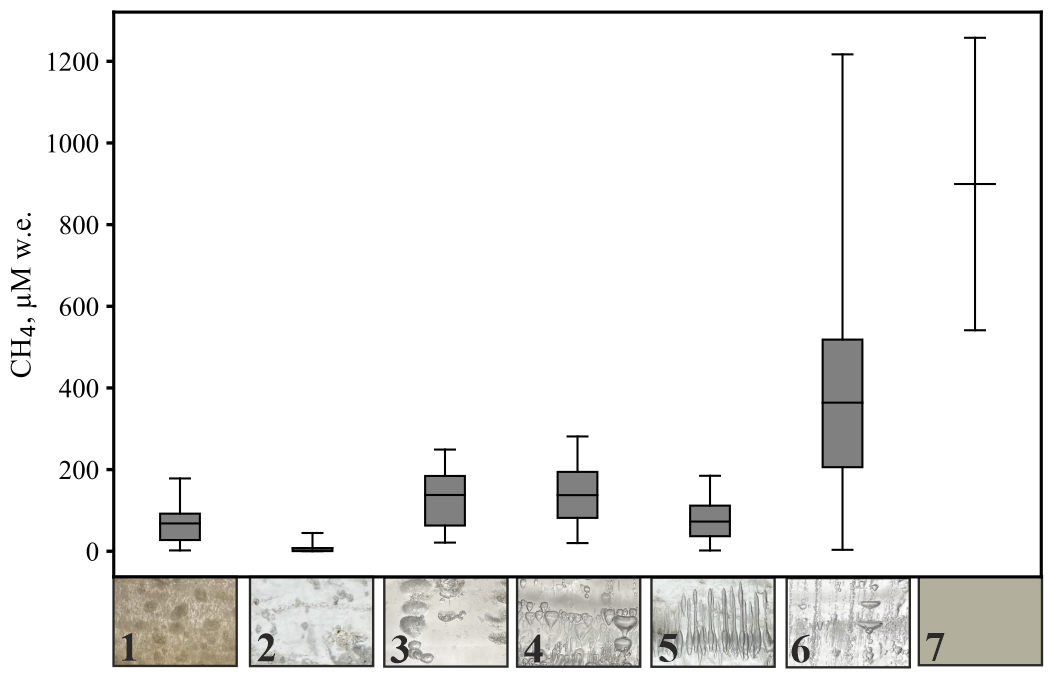
Figure 3Box plots illustrating CH4 concentrations in distinct ice types (ice types from Boereboom et al., 2012, with adjustments): 1: Superimposed ice (n=20), 2: Clear ice (n=31), 3: Methane ebullition bubbles (n=9), 4: Spherical and nut–shaped bubbles (n=10), 5: Elongated bubbles (12), 6: Mixed bubbles (n=38). Boxes show the interquartile range (25th–75th percentiles), the line indicates the mean, and whiskers extend to the min and max values. For Frozen peat (7) with n=2, only mean, min and max are shown. CH4 concentrations are reported on a water-equivalent (w.e.) basis.
Superimposed ice (1) was found on most ponds, forming an upper, up to 0.1 m thick layer (Fig. 4). In ponds A3 and A6, superimposed ice was up to 0.3 m thick and contained bubbles which may indicate that the ice was indeed formed from pond water (and the contained CH4 thus contributes to the winter CH4 bottom flux, Sect. 3.2). In addition to our visual inspection, we considered a higher DOC content than in ice layers below as an additional indicator for the presence of superimposed ice derived from pond water (Table S1). The Iškoras pond had the lowest CH4 content in superimposed ice, averaging 2.9 µM water equivalent (w.e.) In Áidejávri, the CH4 content in the superimposed ice ranged from 21 µM w.e. in A3 to 178 µM w.e. in A1.
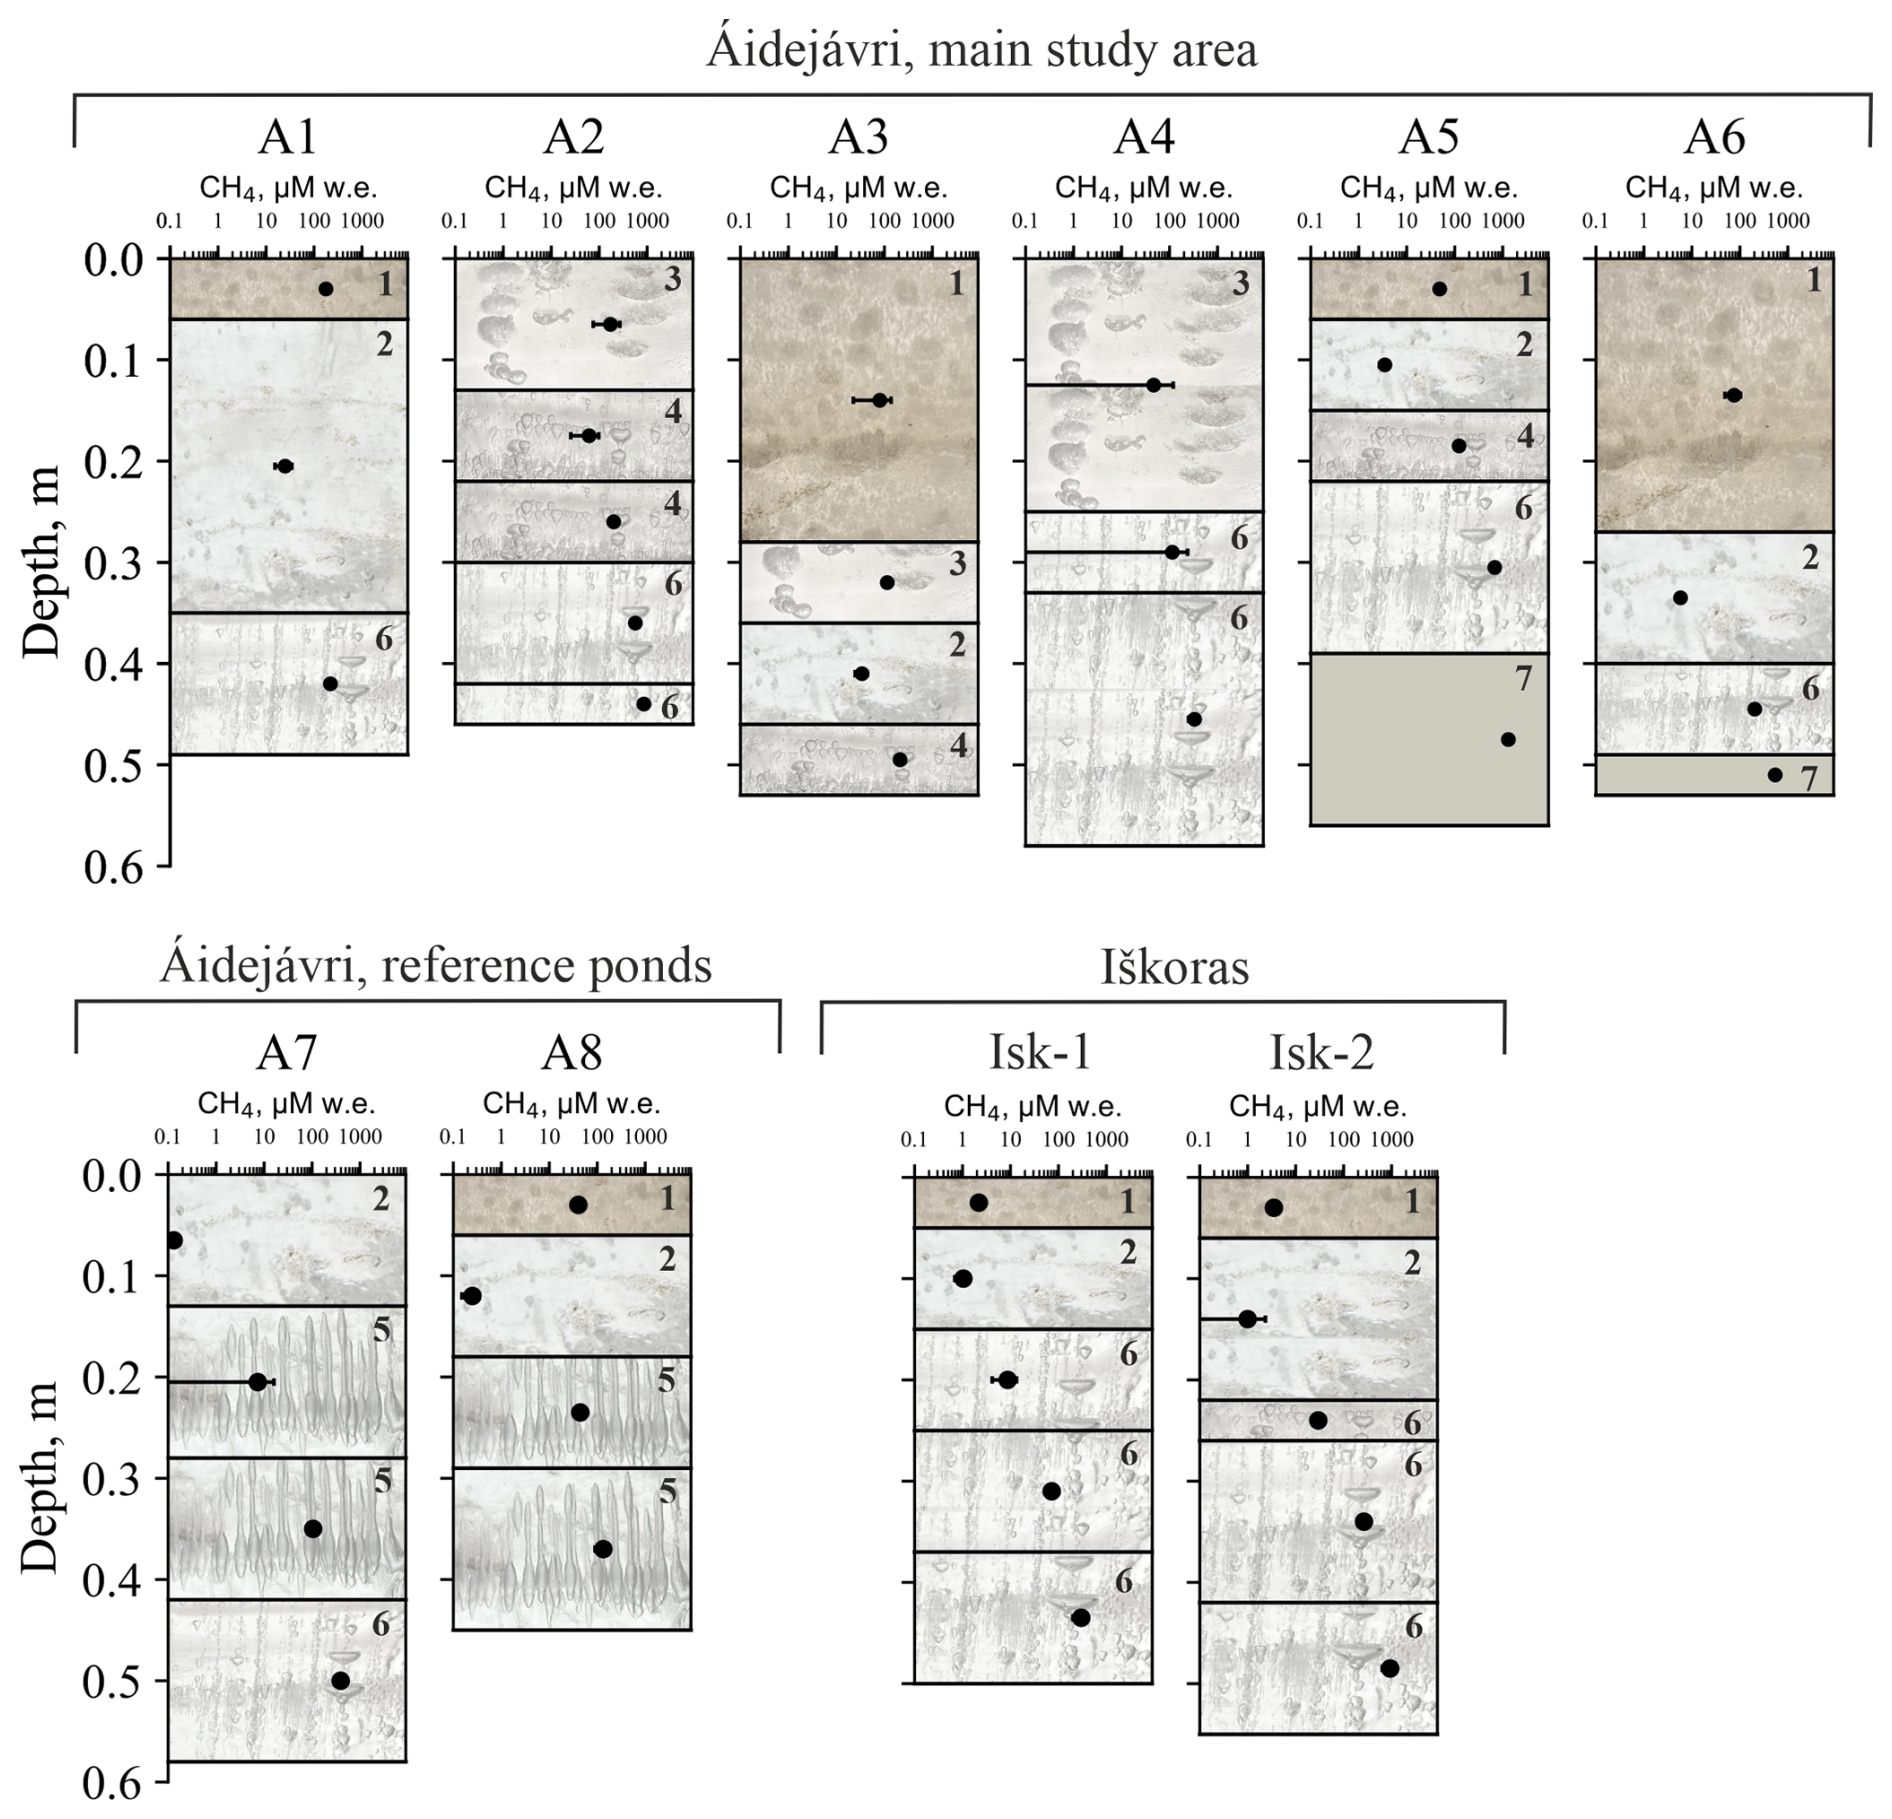
Figure 4Ice stratigraphy and CH4 concentration profiles across various ice and frozen peat layers in ponds from Áidejávri (A1–A8) and Iškoras (Isk–1 and Isk–2). Error bars are standard deviations across multiple samples (n=3–11). The numbers and the background picture of the ice layers correspond to the ice types indicated in the legend of Fig. 3.
Below the superimposed ice, the CH4 content in the ice increased with depth. Clear ice (2) layers represented the first winter ice formed and were characterized by small, irregularly distributed bubbles with diameters <2 mm, typically found as the initial ice layer or beneath the superimposed ice. The CH4 content in clear ice varied from 0.1 to 45 µM w.e., with the highest value found in the anoxic pond A3.
Methane ebullition bubbles (3), relatively flat and up to 2 cm in diameter, were identified in the surface layers (0–0.25 m) of ice cores from ponds A2 and A4, as well as in the first ice layer formed below the superimposed ice in pond A3 (depth from 0.3 to 0.4 m). The CH4 content of ice layers with methane ebullition bubbles varied between 21 and 249 µM w.e. Distinct layers of spherical and nut–shaped bubbles (4) were found in only four ice cores: A2, A3, and as individual thin layers in A5 and Isk-2 (Fig. 4). CH4 content of these bubbles ranged from 20 to 281 µM w.e. with depth within the same ice column of pond A2. In pond A3, this type of ice was found the middle of the ice column, with an average CH4 content of 212 µM w.e. Elongated bubbles (5) were present only in two large ponds in Áidejávri: the old thermokarst pond A7 and the non-thermokarst pond A8. The CH4 content in the ice of these ponds increased with depth, ranging from 1.9 to 122 µM w.e. in A8 and from 43 to 185 µM w.e. in A7.
When spherical, nut-shaped, elongated, and methane ebullition bubbles were found together in an ice layer, it was attributed to the mixed bubbles group (6), typically located in the lower parts of the ice core. This group was identified in all ice cores except for A3 and A8 and exhibited the highest CH4 content among the ice types (Fig. 3). The minimum (3.4 µM w.e.) and maximum (1217 µM w.e.) CH4 content for the mixed bubbles group were recorded in the different sampling locations of Iškoras pond (Isk-1 and Isk-2, respectively). The concentrations in the deepest layer of the old (Isk-1) and young (Isk-2) parts of the Iškoras pond were significantly different, with an average CH4 content of 933 µM w.e. in ice core Isk-2 (young part) and 299 µM w.e. in ice core Isk-1 (old part). In Áidejávri, the recently formed pond A6 and the deep overgrowing pond A1 exhibited the lowest average CH4 content in the mixed bubble layers around 200 µM w.e., respectively. In contrast, pond A5, despite its connection to A6 and similar depth, had a more than three times higher CH4 content. The CH4 content of the mixed bubble layers increased with depth from 567 to 856 µM w.e. in A2, and from 114 to 321 µM w.e. in A4 (Fig. 4). The shallow ponds A5 and A6 were completely frozen to the bottom, including the uppermost peat bottom layer. Within the frozen peat (7), the measured CH4 content were 1258 µM w.e. for pond A5 and 541 µM w.e. for pond A6 (Fig. 3).
4.3 CH4 storage in ice and water
The contribution of ice and below-ice storages to the total wintertime storage (Swinter) accumulated by the sampling date (Sect. 3.5) strongly depended on the depth of the pond. The largest contribution of ice storage to total winter CH4 storage, up to 3349±431 mg CH4-C m−2, was found in pond A5 that was fully frozen to the bottom. In contrast, other shallow ponds in Áidejávri that were completely frozen to the bottom – such as A6, A7 – exhibited lower values, 422±211 and 846±104 mg CH4-C m−2, respectively. Little CH4 ice storage was observed in the deeper ponds A1, A3, and A8 (Table S2), while the expanding deep thermokarst ponds A2 and A4 showed significantly larger CH4 ice storage with values of 1521±260 mg CH4-C m−2 and 1114±159 mg CH4-C m−2, respectively, standing out from the patterns described for the other ponds. The ice storage in the sampling location Isk-2 (young part) was 3 times larger than in Isk-1 (Table S2). The uncertainty of the calculated ice storage (Sect. 3.5) did not exceed 30 % in most of the ponds, being highest with 50 % in the ice core A6 with a significant contribution of superimposed ice in the ice column.
The CH4 below-ice storage was highest in the deep ponds A1 and A2, reaching 16 626±1874 mg CH4-C m−2 in the pond A2. In the Áidejávri ponds A3, A4, and A8, values ranged from 3347±1349 to 5524±1008 mg CH4-C m−2 (Table S2). The uncertainty in these estimations was mostly related to depth error and was less than 40 % for the Áidejávri ponds. The below-ice storage calculated for the Iškoras pond was 636 mg CH4-C m−2 for Isk-2 and 1271 mg CH4-C m−2 for Isk-1, with a 100 % uncertainty due to the ambiguity of whether a residual water layer remained below the ice (Sect. 3.5).
To estimate the CH4 storage prior to freezing (Sprior) we use both measurements from September 2024 and from the first winter ice layer (Sect. 3.5). In the latter, the CH4 contents (Sect. 4.2) were up to 5 times lower than the dissolved CH4 concentrations measured in September 2024 for most of the ponds (Fig. S10), with the exceptions of A5 and A8 where it was 50 times lower. The largest CH4 storage prior to freezing was measured in the deepest ponds A1, A2, and A3, with values ranging from 1121±81 to 1343±901 mg CH4-C m−2 (Table S2). At the same time, the shallow pond A5 stored 418±416 mg CH4-C m−2, while the remaining ponds stored less 70 mg CH4-C m−2 (Table S2). While values for Sprior are associated with considerable relative uncertainties ranging from 5 % to 100 %, absolute values are generally small compared with Swinter. Therefore, the uncertainty in estimating Sprior contributes little to the overall uncertainty of the winter CH4 bottom flux Fwinter (Sect. 4.4).
4.4 Winter CH4 bottom flux
Winter CH4 bottom fluxes (Fwinter; Sect. 3.6) varied significantly for the thermokarst ponds in Áidejávri, ranging from 2.4±1.3 mg CH4-C m−2 d−1 in the recently formed shallow pond A6 to 106±14 mg CH4-C m−2 d−1 in the pond A2 formed 40 years ago (Fig. 5, Table S2). In comparison, the fluxes in the Iškoras pond sampling locations were lower than those observed in Áidejávri ponds of similar formation age (Fig. 5). Even assuming that the Iškoras pond was not frozen to the bottom and adding a potential below-ice CH4 storage (Sect. 3.5), the fluxes were estimated to be 11±8 mg CH4-C m−2 d−1 in the old part of the pond (Isk-1) and 15±5 mg CH4-C m−2 d−1 in the section of the pond formed between 20 and 68 years ago (Isk-2).
A significantly higher CH4 flux was estimated for the non-thermokarst pond A8 with 36±10 mg CH4-C m−2 d−1 in comparison to the thermokarst ponds of the same size. The uncertainty in the calculated fluxes was less than 31 % for all ponds, except for pond A6, where the presence of superimposed ice resulted in a 57 % uncertainty in the estimated flux, and the oldest part of Iškoras pond Isk-1, in which the uncertainty of the below-ice storage led to a higher value of 72 % (Sect. 3.5).
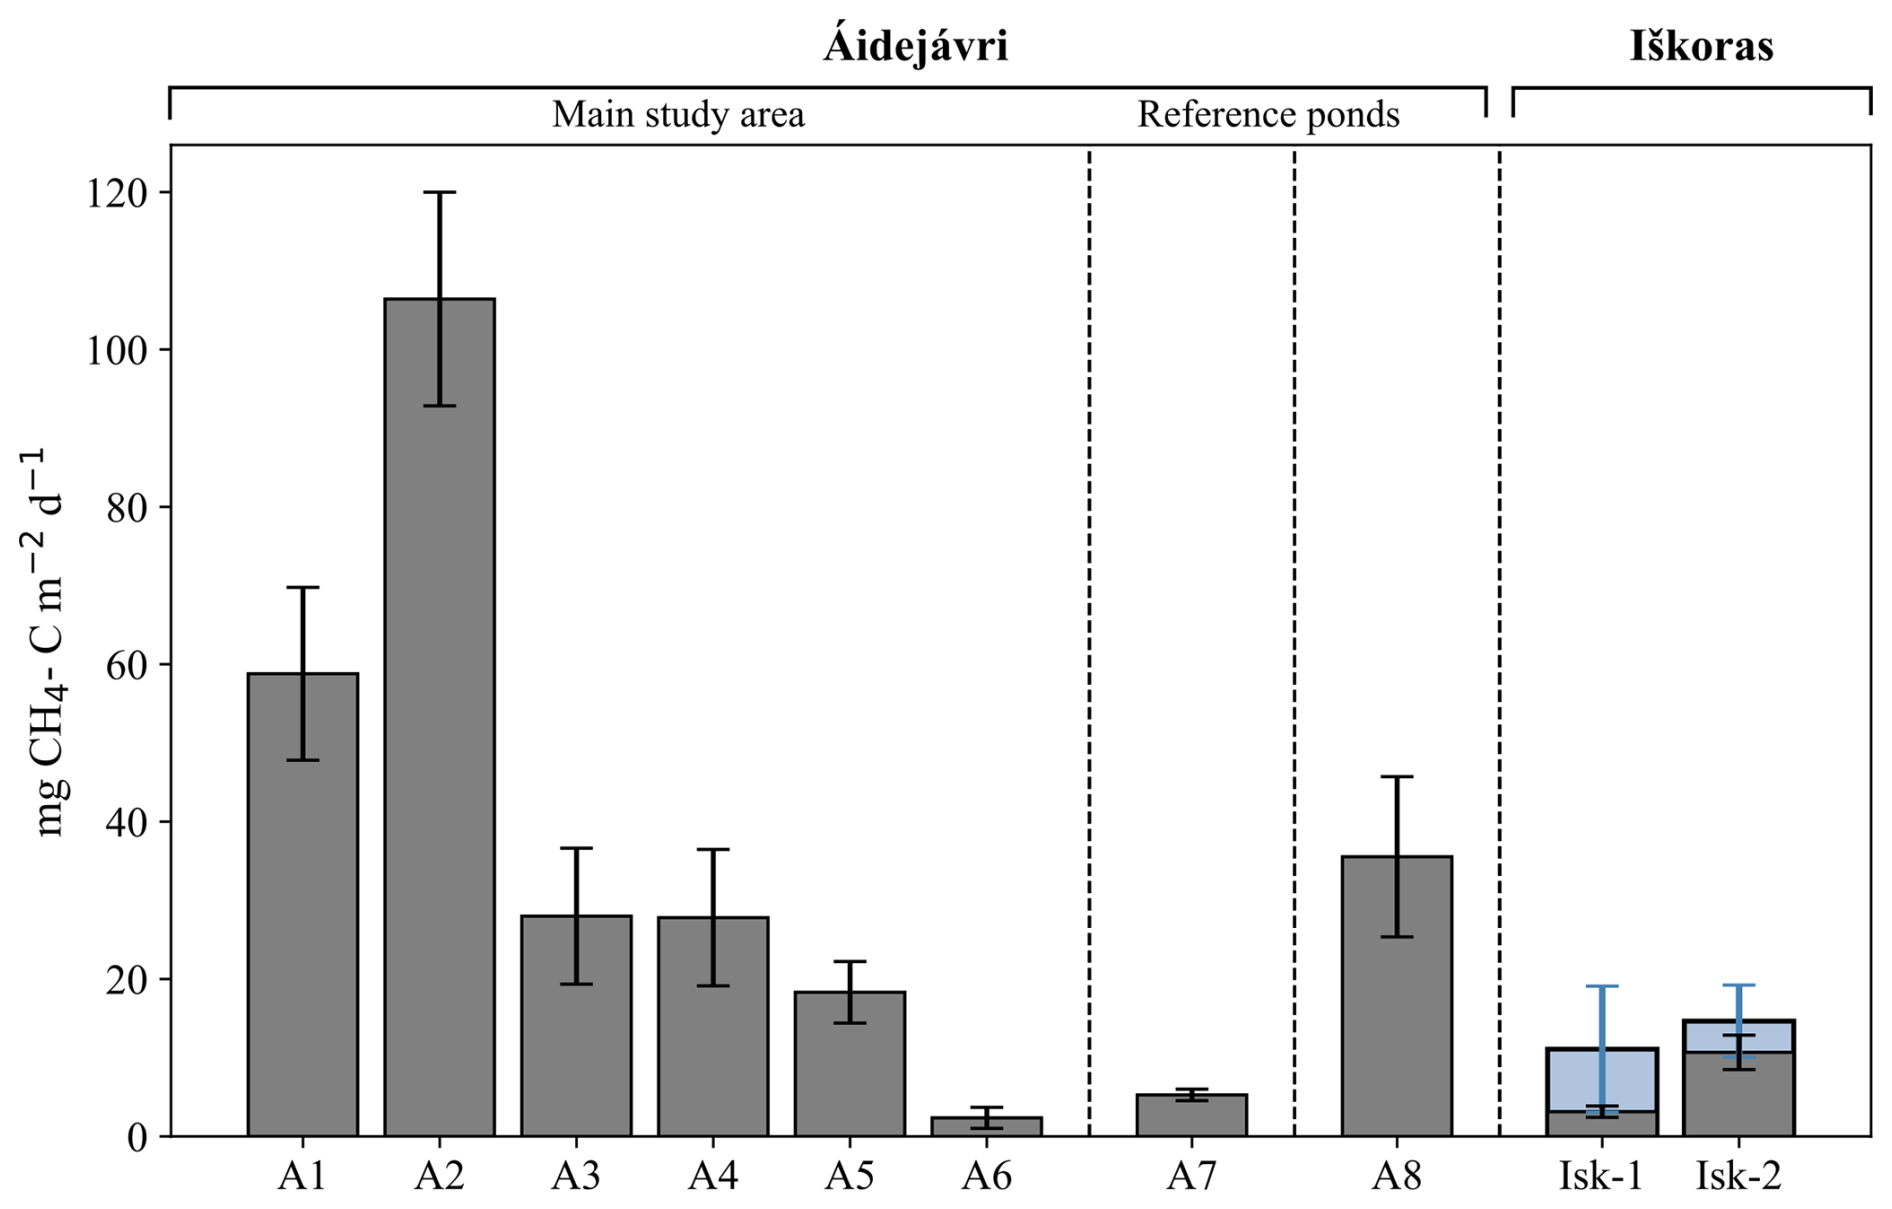
Figure 5Winter CH4 bottom flux Fwinter in the studied ponds. Error bars represent the uncertainties calculated using Gaussian error propagation (Sect. 3.6). Blue error bars indicate the values estimated based on the assumption of below-ice storage in the Iškoras pond (Sect. 3.5) The vertical lines separate the main study area in Áidejávri (A1–A6) from the reference ponds A7 and A8, and the Iškoras pond.
There was a strongly positive correlation (p<0.05) between winter CH4 bottom flux and pond depth, resulting in the highest fluxes estimated for ponds A1 and A2. However, correlation with pond depth does not explain similar fluxes observed in ponds A3, A4, and A5, which have different depths. For ponds A1–A6, which originated from the same section of the peat plateau (Sect. 2.2), we compared the relationship between the age of thermokarst pond formation and winter CH4 bottom fluxes (Fig. 6). Winter CH4 bottom flux increased with age, from about 2 mg CH4-C m−2 d−1 in the recently formed pond A6 to around 25 mg CH4-C m−2 d−1 in ponds A3, A4, and A5, which were formed between 3 and 20 years ago. The highest flux was recorded in A2 formed between 20 and 65 years ago. The oldest pond A1 had a smaller winter CH4 bottom flux than A2, but still higher than all younger ponds. To evaluate the correlation between winter CH4 bottom flux and age, we use mean ages (Sect. 3.7), while a value of 70 years is assigned to the age of pond A1 formed before 1958. The relationship between CH4 winter bottom flux and the age of thermokarst pond formation was statistically significant (p=0.0048), although the limited number of ponds makes the statistical evaluation challenging.
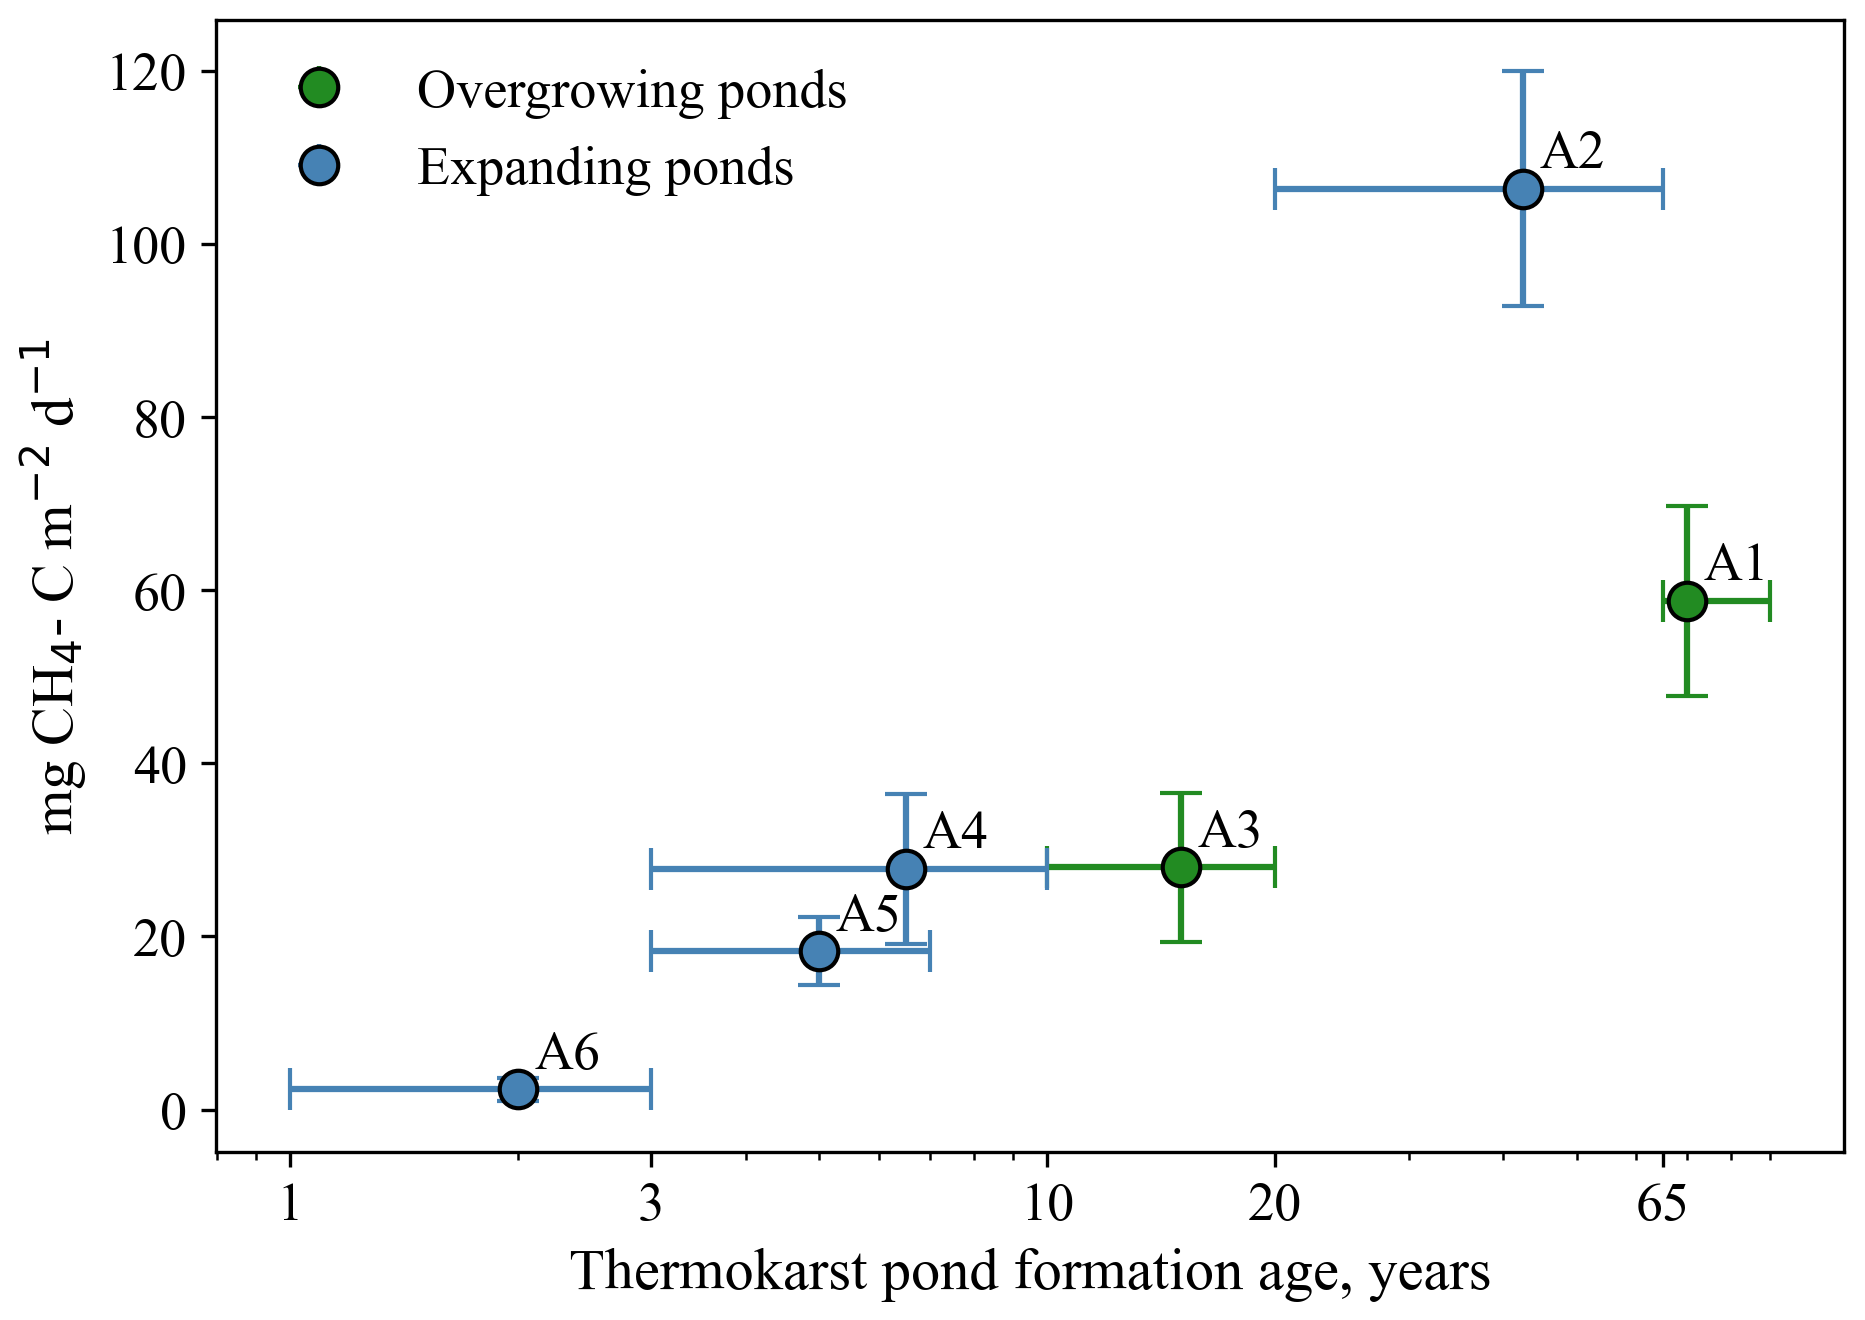
Figure 6Winter CH4 bottom flux Fwinter (Sect. 3.6) vs. thermokarst pond formation age (Sect. 3.7) in ponds of the main study area in Áidejávri (A1–A6). Vertical error bars show the uncertainties calculated using Gaussian error propagation (Sect. 3.6). Horizontal error bars show the age limits estimated using available aerial images (Sect. 3.7). Succession stage according to Table 1 (Sect. 2.2).
5.1 Methodological limitations
We estimated winter CH4 bottom fluxes for the 2023–2024 winter season for nine ponds located within two permafrost peatlands in Northern Scandinavia. We based our estimates on CH4 ice and below-ice storages, corrected for the storage prior to freezing. Conceptionally, we used the pond ice and the remaining water as a natural chamber to quantify winter CH4 bottom fluxes capturing both ebullition and diffusive fluxes of CH4. Our approach entails the following uncertainties and limitations:
-
A significant uncertainty arises from measuring the depth of the water column in the shallow ponds, especially below the winter ice. The loose peat material and presence of plants at the bottom renders accurate measurements of pond depth challenging (Sect. 3.5). We accounted for this by assigning estimated uncertainties of 10 % to 100 % to the water depth, with 100 % for thin water layers of only 0.05–0.1 m thickness below the ice. Moreover, sampling was conducted at the central part of the ponds, but lateral variations in pond depth could lead to biases in the estimates of winter CH4 storage, particularly in the larger ponds. The presence of plants on the bottom and difficulties in sampling dissolved CH4 from the residual water layer (Sect. 3.5) resulted in high flux uncertainties of about 70 % for the Iškoras pond sites Isk-1 and Isk-2.
-
Another uncertainty arises from superimposed ice, i.e. the upper 0.05–0.1 m of the ice column found on most of the frozen ponds (Sect. 4.2). This type of ice forms primarily by freezing of melt- or rainwater within the snowpack on the ice surface. However, it can also be formed when unfrozen water spreads across the ice surface following crack formation and subsequently refreezes, resulting in high DOC contents in the ice (Manasypov et al., 2015). In the first case, any stored CH4 would originate from the ambient air, thus not contributing to the bottom CH4 flux. In the latter case, the CH4 trapped in the ice originates at least partly from the water body below. Since we cannot distinguish between these two CH4 sources, we excluded the superimposed ice layer from our winter CH4 storage calculations to avoid overestimating CH4 flux. In any case, CH4 contents in the superimposed ice were relatively low compared to those in the deeper ice layers and the CH4 below-ice storage. For almost all cores, the contribution of superimposed ice to the winter CH4 storage was less than 5 % and thus was negligible in the final uncertainty of winter CH4 bottom fluxes. However, superimposed ice in pond A6 accounted for 50 % of the ice storage and was included in the final uncertainty estimate (Sect. 3.5). This resulted in a high relative uncertainty of the winter CH4 bottom flux for A6, but it is still clear that the absolute flux values were significantly below those of the ponds A1–A5 (Fig. 6, Sect. 4.4).
-
Another source of uncertainty is related to the lack of measured concentrations of dissolved CH4 prior to freezing in 2023. To estimate CH4 storage prior to freezing, we used the average concentration from the first winter ice layer combined with available September data from 2024. In some cases, this approach led to an uncertainty of up to 100 % for the CH4 storage prior to freezing. However, this uncertainty has a limited effect on the final CH4 flux estimates, as the CH4 storage prior to freezing was relatively small compared to the total CH4 accumulation during winter. For example, winter CH4 storage was 4 to 400 times higher than the CH4 storage prior to freezing. Notably, in ponds that were anoxic before freezing, the differences between these CH4 storages (Fig. S10) were less pronounced (4 to 16 times).
Despite the challenges in estimating the individual terms of the winter CH4 storage, our approach captures both ebullition and diffusive fluxes during the winter, thus making it well-suited to estimate winter CH4 storage in high latitudes. In this study, we estimated the uncertainties of the individual terms of the winter CH4 storage, including ice storage, below-ice storage and the CH4 storage prior to freezing, and used Gaussian error propagation to determine the overall uncertainty for estimated winter CH4 bottom flux. Our ice records suggested that CH4 production in shallow ponds continued until the pond was frozen to the bottom in mid-March (Fig. S4). This highlights the importance of assessing both the ice storage and the water storage below the ice. In ponds shallower than 0.6 m, the ice storage is the dominant term for CH4 winter storage, while the ice storage accounted for less than 25 % of the estimated winter CH4 storage in deeper ponds. The absolute magnitude of these individual storage terms strongly influences the final uncertainty, with the uncertainty in shallow ponds largely related to ice storage, while the below-ice storage dominates the uncertainty for deep ponds.
5.2 Annual CH4 budget at the Iškoras site
In Finnmark, shallow ponds are ice-covered for at least seven months of the year and anoxic conditions are likely to establish shortly after the formation of the first winter ice. The lack of oxygen and the reduced activity of methanotrophs at low temperatures lead to accumulation of CH4 in and below the ice, which is released to the atmosphere during ice-off in late spring (Denfeld et al., 2018). This highlights the importance of accurately estimating wintertime CH4 production and storage to understand and predict annual CH4 budgets of northern water bodies.
Assuming a constant production rate and 228 d of ice cover prior to ice melt on 22 May 2024 (Fig. S7), we estimate the cumulative winter CH4 bottom flux in the ponds to be between 0.6 and 24 g CH4-C m−2 for Áidejávri and ∼3 g CH4-C m−2 for Iškoras. These estimated values in our study are generally higher than the storage estimates reported for small peatland lakes (Kuhn et al., 2021) and thermokarst lakes in Alaska (Sepulveda-Jauregui et al., 2015). However, they align well with cumulative winter CH4 flux for thermokarst lakes at a Canadian palsa site, which were around 5 g CH4-C m−2 (Matveev et al., 2019).
At Iškoras, the surface-to-atmosphere CH4 fluxes have been monitored by an eddy covariance tower, and a footprint analysis combined with machine learning provided an average CH4 flux for the thermokarst ponds within the peat plateau complex during the ice-free period (Pirk et al., 2024). As the Iškoras pond investigated in this study represents a significant fraction of the “thermokarst pond” class within the eddy covariance footprint, it is possible to establish a rough annual CH4 balance by combining the eddy covariance measurements during the ice-free season with the estimated winter CH4 bottom fluxes. For the ice-free season, the mean CH4 flux for ponds measured by the eddy covariance system is 38 mg CH4-C m−2 d−1 (Pirk et al., 2024; Table S3), while our mean daily winter CH4 bottom flux for the Iškoras pond is about three times lower (13 mg CH4-C m−2 d−1). This is consistent with findings from Alaskan lakes, where summer CH4 production rates increase by a factor of two to three due to warmer bottom sediment temperatures (Matheus Carnevali et al., 2015). The apparent Q10 value for the estimated CH4 bottom flux at Iškoras is 2.8, based on a mean bottom water temperature of 1 °C below ice cover and an average temperature of 11.4 °C during the ice-free period (Fig. S4, Table S3). This value aligns well with previously reported Q10 values for northern lakes (Kuhn et al., 2021).
Assuming that Áidejávri ponds follow the same Q10 relationship as inferred at Iškoras, the corresponding ice-free CH4 flux for Áidejávri would range from 7 to 309 mg CH4-C m−2 d−1, with an average value of 102 mg CH4-C m−2 d−1. This assumption allows us to estimate the annual CH4 budget for each pond system, which ranges from 2 to 66 g CH4-C m−2 yr−1, with averages (over all ponds) of 8.3 and 22 g CH4-C m−2 yr−1 at Iškoras and Áidejávri, respectively.
Our back-of-the-envelope calculations suggest that the cumulative winter CH4 bottom flux at Iškoras constitutes up to 40 % of the annual CH4 flux from the ponds, resulting in elevated emissions during the ice-melt period. Multi-year data from the Iškoras eddy covariance tower showed only small CH4 flux peaks during the ice-off period. A direct comparison of these pond flux estimates is difficult, as the eddy covariance flux footprint comprises, on average, only about 7 % pond surfaces, and during the ice-off period the pond surface was not consistently within the footprint due to the prevailing wind direction. Hence, a dedicated experimental design would be required to reliably capture the CH4 ice-off signal in such complex landscapes. In some northern lakes, ice-off emissions have been reported to contribute up to 60 % of the annual CH4 budget (Jansen et al., 2019; Denfeld et al., 2018).
5.3 Key factors controlling the CH4 budget
In our study, the highest CH4 flux was estimated for thermokarst ponds smaller than 500 m2. This agrees with previous studies that found that pond size is a critical factor for CH4 fluxes during the ice-free period (Bastviken et al., 2004; Shirokova et al., 2013; Zabelina et al., 2021, Manasypov et al., 2024). Among the key factors driving CH4 production in our dataset, winter CH4 bottom flux showed a strongly positive correlation with the pond depth, with deeper lakes consistently exhibiting a higher CH4 bottom flux. The winter CH4 bottom fluxes observed in the Áidejávri ponds were generally higher than those at the Iškoras pond. This aligns with results of incubation experiments under controlled temperature and anoxic conditions with permafrost samples from both permafrost peat complexes (Kjær et al., 2024). The CH4 production potential of the Iškoras permafrost samples was lower than for the samples from Áidejávri, which might be related to differences in peat formation history, resulting in different geochemistry of the peat (e.g. a high iron content in Áidejávri) or other local factors (Kjær et al., 2024). Such variability highlights the importance of site-specific factors in constraining wintertime CH4 production across different permafrost peatlands and complicates the extrapolation of CH4 fluxes to the ecosystem-scale.
The winter CH4 bottom fluxes in the studied ponds in the two peat plateau sites ranged from 2 to 106 mg CH4-C m−2 d−1. While data on wintertime CH4 bottom flux from thermokarst ponds remain limited, our findings are within the range of winter fluxes reported for other northern regions. In polygonal ponds in the Lena River Delta (Eastern Siberia), winter CH4 fluxes ranged from 0.01 mg CH4-C m−2 d−1 in ponds at the initial development stage to 104 mg CH4-C m−2 d−1 in ponds exhibiting signs of thermal erosion (Langer et al., 2015). Thermokarst ponds, particularly those formed in organic-rich regions such as yedoma and permafrost peatlands are significant sources of CH4 compared to other pond and lake types in northern ecosystems (Wik et al., 2016; Kuhn et al., 2021). The relatively higher CH4 fluxes in thermokarst systems are likely related to the input of permafrost-derived organic matter, which accelerates CH4 production rates. In our study, we observed a strongly negative correlation between pond size, dissolved CH4 concentrations and DOC at the end of the ice-free season in September (Sect. 4.1). Higher DOC concentrations enhance oxygen consumption, leading to oxygen depletion and complete anoxia, which favors methanogenesis and CH4 release with minimal oxidation during summer. Together with the predominance of ebullition as a major emission pathway in small thermokarst peatland ponds (Kuhn et al., 2018), this suggests that most of the CH4 produced during the summer is quickly released to the atmosphere. Factors controlling the production of CH4 are likely similar in both winter and summer, with seasonal differences largely driven by variations in sediment temperature.
5.4 Winter CH4 bottom flux vs. thermokarst pond formation age
The CH4 production in thermokarst water bodies is influenced by a number of factors, including permafrost type (organic-rich vs. non-organic-rich), pond depth and size, as well as vegetation (Burke et al., 2019). Our study design makes it possible to explore the role of thermokarst pond formation age for CH4 production. For this purpose, we focused on the ponds in the main study area of Áidejávri (A1–A6, Sect. 2.2) which shared the same submerged peat properties, climatic and hydrological conditions, while exhibiting similar DOC concentrations (ranging from 90 to 105 mg L−1). Our results suggest that there may be a functional relationship between winter CH4 bottom flux and thermokarst pond formation age. Thermokarst lakes and ponds undergo several development stages, from initial thawing and expansion to succession into wetland ecosystems. Methane production is generally strongest during the first decades of thermokarst pond evolution when permafrost thawing is most active (Walter et al., 2006; Desyatkin et al., 2009; Shirokova et al., 2013; Vonk et al., 2015). However, in our study, the youngest pond, A6 (2 years old), exhibited the lowest winter CH4 bottom flux among all the studied ponds. Meanwhile, the pond A5, which is only 2 years older, showed the flux 8 times higher. This delayed onset of CH4 production could possibly be explained by a lag phase required for methanogenic archaea to recover after prolonged dormancy in frozen permafrost and to adapt to new environmental conditions (Rivkina et al., 2007; Knoblauch et al., 2018). This lag is also associated with the shift from previously oxic conditions in the active layer to anoxic conditions after inundation. Such lag phases in CH4 production are well-documented from incubation studies of Siberian permafrost soils (Rivkina et al., 2007; Knoblauch et al., 2018) and from the same peatlands in Finnmark studied here (Kjær et al., 2024). Low CH4 production during the initial stages of thermokarst pond formation has also been reported for the polygonal tundra ponds in the Lena River delta (Langer et al., 2015). An alternative explanation for the low CH4 winter bottom flux in the only two years old pond A6 could be that more CH4 was indeed produced but trapped below the still intact root zone of the freshly submerged peat plateau surface, thus preventing its release to the water column. During summer, we observed that a large amount of gas bubbles could be released by disturbing this uppermost root layer with a probe which suggests that gas is indeed accumulated. While the exact dynamics of this process remain unclear, it is at least possible that not all the produced CH4 is directly released to the water column and eventually the atmosphere in such young thermokarst water bodies.
Pond A2 showed the largest winter CH4 bottom flux among all studied ponds, while the younger pond A4, which shares similar physical characteristics (i.e., pond depth, location, and evidence of ebullition bubbles in ice column), had almost four times lower flux. This difference may indicate that thermokarst pond formation age is a major factor influencing CH4 production, when other environmental conditions are comparable.
Methane production and emissions from newly formed thermokarst lakes or along thermokarst margins in organic-rich permafrost areas are generally higher than those from older ones (Vonk et al., 2015; Walter Anthony et al., 2016; Heslop et al., 2020). At the Iškoras pond, the estimated winter bottom CH4 flux from the younger part of the pond was at least 30 % larger than from the central part which is older than 68 years. In the main study area of Áidejávri (A1–A6), our results show that CH4 production can remain high in ponds older than 60 years. For example, the winter bottom CH4 flux was about 60 mg CH4-C m−2 d−1 for the old pond A1, more than double the values for the relatively young thermokarst ponds (A3–A6).
While the limited number of investigated ponds does not allow for a robust statistical evaluation, ponds in the later stages of development during the transition to a permafrost-free mire (A1, A3, A7, Isk-1, Isk-2) displayed significant differences in CH4 wintertime production which may also be related to vegetation type. Ponds undergoing a transition through sedge regrowth exhibited higher winter CH4 bottom fluxes than those experiencing Sphagnum colonization. Sedges release highly labile organic acids, such as root exudates, including sugars and organic acids, which are rapidly converted into CH4 by methanogens (Ström et al., 2012; Dorodnikov et al., 2011). Furthermore, vascular plants can reduce oxidation rates and deplete oxygen levels, particularly toward the end of the growing season (Turner et al., 2020). The old, stable thermokarst ponds at both Iškoras and Áidejávri (Isk-1 and -2 and A7), exhibited low winter CH4 bottom flux (<15 mg CH4-C m−2 d−1). At Iškoras, submerged Sphagnum was observed at the bottom of the sampling location Isk-1. In the ice-free season, submerged Sphagnum can reduce CH4 bottom flux via oxidation mediated by symbiotic, endophytic methanotrophic bacteria (Raghoebarsing et al., 2005; Parmentier et al., 2011). In winter, however, the water column is predominantly anoxic, so Sphagnum-associated CH4 oxidation is likely not a controlling factor. The low winter CH4 bottom flux in Iškoras and A7 could indirectly be linked to pond age as Sphagnum succession marks the late stages of thermokarst pond development (Magnússon et al., 2020).
This study assessed winter CH4 bottom flux in nine shallow ponds within two permafrost peatlands in Northern Norway (Iškoras and Áidejávri) during the 2023–2024 winter season. These ponds form a chronosequences of thermokarst formation spanning more than 70 years. Using pond ice and the below-ice water column as natural chambers, we estimated winter CH4 bottom flux and storage. Our key findings are:
-
Ponds remained ice-covered for more than seven months per year. Limited oxygen availability and reduced methanotrophic activity led to significant CH4 accumulation. The average winter CH4 bottom flux ranged from 2 to 106 mg CH4-C m−2 d−1 across the studied ponds in the two permafrost peatlands.
-
The cumulative winter CH4 bottom flux ranged from 0.6 to 24 g CH4-C m−2 which at the Iškoras site accounts for up to 40 % of the annual CH4 budget.
-
Ponds dominated by sedge regrowth had larger CH4 bottom fluxes, while older ponds experiencing colonization by Sphagnum mosses featured smaller CH4 bottom fluxes.
-
Pond age appeared to be a significant factor influencing the wintertime CH4 bottom flux. A young pond that formed two years prior showed the smallest flux, but fluxes increased considerably with pond age. Our results suggest that the wintertime CH4 bottom flux can remain at high values (up to 60 mg CH4-C m−2 d−1) in thermokarst ponds older than 70 years.
Current trends of atmospheric warming may lead to an acceleration of thermokarst processes, resulting in an increase of small shallow thaw ponds in organic-rich permafrost regions. While this could increase CH4 emissions from these permafrost landscapes, studies on the seasonality and especially the wintertime production of CH4 remain sparse. This study highlights the need to constrain the wintertime CH4 production from thermokarst ponds to accurately estimate the present-day and project the future CH4 budgets at high latitudes.
Data supporting this study are available at Zenodo: https://doi.org/10.5281/zenodo.18507511 (Pismeniuk et al., 2026).
The supplement related to this article is available online at https://doi.org/10.5194/bg-23-1497-2026-supplement.
AP, SW and PD conceptualized the research. AP, SW, MI, CW and SS conducted the field sampling. AP conducted the laboratory analyses, with PD providing expertise and help. AP performed the data analysis, with input from PD, NP and SW. NP contributed with data from eddy covariance measurements in Iškoras. AP prepared the manuscript, and all co-authors revised and edited the final version.
The contact author has declared that none of the authors has any competing interests.
Publisher's note: Copernicus Publications remains neutral with regard to jurisdictional claims made in the text, published maps, institutional affiliations, or any other geographical representation in this paper. The authors bear the ultimate responsibility for providing appropriate place names. Views expressed in the text are those of the authors and do not necessarily reflect the views of the publisher.
We would like to thank our colleagues at the Faculty of Environmental Sciences and Natural Resource Management, NMBU, especially Thomas Rohrlack, Sigrid Trier Kjær, Trygve Fredriksen and Mona Mirgeloybayat. ChatGPT (version GPT-4) was used for English grammar and spelling correction during the preparation of the manuscript. We are grateful to two anonymous reviewers for their constructive comments, which helped us improve the manuscript.
This study was supported by BIOGOV (project no. 323945, Research Council of Norway) and PEAT-THAW (within the sustainability initiative of the Faculty of Mathematics and Natural Sciences, University of Oslo, Norway).
This paper was edited by Hermann Bange and reviewed by two anonymous referees.
Åberg, J. and Wallin, M.: Evaluating a fast headspace method for measuring DIC and subsequent calculation of pCO2 in freshwater systems, IW, 4, 157–166, https://doi.org/10.5268/IW-4.2.694, 2014.
Bastviken, D., Cole, J., Pace, M., and Tranvik, L.: Methane emissions from lakes: Dependence of lake characteristics, two regional assessments, and a global estimate, Global Biogeochem. Cycles, 18, 2004GB002238, https://doi.org/10.1029/2004GB002238, 2004.
Boereboom, T., Depoorter, M., Coppens, S., and Tison, J.-L.: Gas properties of winter lake ice in Northern Sweden: implication for carbon gas release, Biogeosciences, 9, 827–838, https://doi.org/10.5194/bg-9-827-2012, 2012.
Borge, A. F., Westermann, S., Solheim, I., and Etzelmüller, B.: Strong degradation of palsas and peat plateaus in northern Norway during the last 60 years, The Cryosphere, 11, 1–16, https://doi.org/10.5194/tc-11-1-2017, 2017.
Burke, S. A., Wik, M., Lang, A., Contosta, A. R., Palace, M., Crill, P. M., and Varner, R. K.: Long-Term Measurements of Methane Ebullition From Thaw Ponds, J. Geophys. Res.-Biogeo., 124, 2208–2221, https://doi.org/10.1029/2018JG004786, 2019.
Denfeld, B. A., Baulch, H. M., Del Giorgio, P. A., Hampton, S. E., and Karlsson, J.: A synthesis of carbon dioxide and methane dynamics during the ice-covered period of northern lakes, Limnol. Oceanogr. Lett., 3, 117–131, https://doi.org/10.1002/lol2.10079, 2018.
Desyatkin, A. R., Takakai, F., Fedorov, P. P., Nikolaeva, M. C., Desyatkin, R. V., and Hatano, R.: CH4 emission from different stages of thermokarst formation in Central Yakutia, East Siberia, Soil Science and Plant Nutrition, 55, 558–570, https://doi.org/10.1111/j.1747-0765.2009.00389.x, 2009.
Dorodnikov, M., Knorr, K.-H., Kuzyakov, Y., and Wilmking, M.: Plant-mediated CH4 transport and contribution of photosynthates to methanogenesis at a boreal mire: a 14C pulse-labeling study, Biogeosciences, 8, 2365–2375, https://doi.org/10.5194/bg-8-2365-2011, 2011.
Farouki, O. T.: The thermal properties of soils in cold regions, Cold Reg. Sci. Technol., 5, 67–75, 1981.
Greene, S., Walter Anthony, K. M., Archer, D., Sepulveda-Jauregui, A., and Martinez-Cruz, K.: Modeling the impediment of methane ebullition bubbles by seasonal lake ice, Biogeosciences, 11, 6791–6811, https://doi.org/10.5194/bg-11-6791-2014, 2014.
Heslop, J. K., Walter Anthony, K. M., Sepulveda-Jauregui, A., Martinez-Cruz, K., Bondurant, A., Grosse, G., and Jones, M. C.: Thermokarst lake methanogenesis along a complete talik profile, Biogeosciences, 12, 4317–4331, https://doi.org/10.5194/bg-12-4317-2015, 2015.
Heslop, J. K., Walter Anthony, K. M., Winkel, M., Sepulveda-Jauregui, A., Martinez-Cruz, K., Bondurant, A., Grosse, G., and Liebner, S.: A synthesis of methane dynamics in thermokarst lake environments, Earth-Sci. Rev., 210, 103365, https://doi.org/10.1016/j.earscirev.2020.103365, 2020.
Hugelius, G., Loisel, J., Chadburn, S., Jackson, R. B., Jones, M., MacDonald, G., Marushchak, M., Olefeldt, D., Packalen, M., Siewert, M. B., Treat, C., Turetsky, M., Voigt, C., and Yu, Z.: Large stocks of peatland carbon and nitrogen are vulnerable to permafrost thaw, P. Natl. Acad. Sci. USA, 117, 20438–20446, https://doi.org/10.1073/pnas.1916387117, 2020.
Jammet, M., Crill, P., Dengel, S., and Friborg, T.: Large methane emissions from a subarctic lake during spring thaw: Mechanisms and landscape significance, J. Geophys. Res.-Biogeo., 120, 2289–2305, https://doi.org/10.1002/2015JG003137, 2015.
Jansen, J., Thornton, B. F., Jammet, M. M., Wik, M., Cortés, A., Friborg, T., MacIntyre, S., and Crill, P. M.: Climate-Sensitive Controls on Large Spring Emissions of CH4 and CO2 From Northern Lakes, J. Geophys. Res.-Biogeo., 124, 2379–2399, https://doi.org/10.1029/2019JG005094, 2019.
Karlsson, J., Giesler, R., Persson, J., and Lundin, E.: High emission of carbon dioxide and methane during ice thaw in high latitude lakes, Geophys. Res. Lett., 40, 1123–1127, https://doi.org/10.1002/grl.50152, 2013.
Kjær, S. T., Westermann, S., Nedkvitne, N., and Dörsch, P.: Carbon degradation and mobilisation potentials of thawing permafrost peatlands in northern Norway inferred from laboratory incubations, Biogeosciences, 21, 4723–4737, https://doi.org/10.5194/bg-21-4723-2024, 2024.
Kjellman, S. E., Axelsson, P. E., Etzelmüller, B., Westermann, S., and Sannel, A. B. K.: Holocene development of subarctic permafrost peatlands in Finnmark, northern Norway, Holocene, 28, 1855–1869, https://doi.org/10.1177/0959683618798126, 2018.
Knoblauch, C., Beer, C., Liebner, S., Grigoriev, M. N., and Pfeiffer, E.-M.: Methane production as key to the greenhouse gas budget of thawing permafrost, Nat. Clim. Change, 8, 309–312, https://doi.org/10.1038/s41558-018-0095-z, 2018.
Knutson, J. K., Clayer, F., Dörsch, P., Westermann, S., and de Wit, H. A.: Water chemistry and greenhouse gas concentrations in waterbodies of a thawing permafrost peatland complex in northern Norway, Biogeosciences, 22, 3899–3914, https://doi.org/10.5194/bg-22-3899-2025, 2025.
Koschorreck, M., Prairie, Y. T., Kim, J., and Marcé, R.: Technical note: CO2 is not like CH4 – limits of and corrections to the headspace method to analyse pCO2 in fresh water, Biogeosciences, 18, 1619–1627, https://doi.org/10.5194/bg-18-1619-2021, 2021.
Kuhn, M., Lundin, E. J., Giesler, R., Johansson, M., and Karlsson, J.: Emissions from thaw ponds largely offset the carbon sink of northern permafrost wetlands, Sci. Rep., 8, 9535, https://doi.org/10.1038/s41598-018-27770-x, 2018.
Kuhn, M. A., Varner, R. K., Bastviken, D., Crill, P., MacIntyre, S., Turetsky, M., Walter Anthony, K., McGuire, A. D., and Olefeldt, D.: BAWLD-CH4: a comprehensive dataset of methane fluxes from boreal and arctic ecosystems, Earth Syst. Sci. Data, 13, 5151–5189, https://doi.org/10.5194/essd-13-5151-2021, 2021.
Langer, M., Westermann, S., Walter Anthony, K., Wischnewski, K., and Boike, J.: Frozen ponds: production and storage of methane during the Arctic winter in a lowland tundra landscape in northern Siberia, Lena River delta, Biogeosciences, 12, 977–990, https://doi.org/10.5194/bg-12-977-2015, 2015.
Magnússon, R. Í., Limpens, J., Van Huissteden, J., Kleijn, D., Maximov, T. C., Rotbarth, R., Sass-Klaassen, U., and Heijmans, M. M. P. D.: Rapid Vegetation Succession and Coupled Permafrost Dynamics in Arctic Thaw Ponds in the Siberian Lowland Tundra, J. Geophys. Res.-Biogeo., 125, e2019JG005618, https://doi.org/10.1029/2019JG005618, 2020.
Manasypov, R. M., Vorobyev, S. N., Loiko, S. V., Kritzkov, I. V., Shirokova, L. S., Shevchenko, V. P., Kirpotin, S. N., Kulizhsky, S. P., Kolesnichenko, L. G., Zemtzov, V. A., Sinkinov, V. V., and Pokrovsky, O. S.: Seasonal dynamics of organic carbon and metals in thermokarst lakes from the discontinuous permafrost zone of western Siberia, Biogeosciences, 12, 3009–3028, https://doi.org/10.5194/bg-12-3009-2015, 2015.
Manasypov, R., Fan, L., Lim, A. G., Krickov, I. V., Pokrovsky, O. S., Kuzyakov, Y., and Dorodnikov, M.: Size matters: Aerobic methane oxidation in sediments of shallow thermokarst lakes, Global Change Biology, 30, e17120, https://doi.org/10.1111/gcb.17120, 2024.
Martin, L. C. P., Nitzbon, J., Scheer, J., Aas, K. S., Eiken, T., Langer, M., Filhol, S., Etzelmüller, B., and Westermann, S.: Lateral thermokarst patterns in permafrost peat plateaus in northern Norway, The Cryosphere, 15, 3423–3442, https://doi.org/10.5194/tc-15-3423-2021, 2021.
Matheus Carnevali, P. B., Rohrssen, M., Williams, M. R., Michaud, A. B., Adams, H., Berisford, D., Love, G. D., Priscu, J. C., Rassuchine, O., Hand, K. P., and Murray, A. E.: Methane sources in arctic thermokarst lake sediments on the North Slope of Alaska, Geobiology, 13, 181–197, https://doi.org/10.1111/gbi.12124, 2015.
Matveev, A., Laurion, I., and Vincent, W. F.: Winter Accumulation of Methane and its Variable Timing of Release from Thermokarst Lakes in Subarctic Peatlands, J. Geophys. Res.-Biogeo., 124, 3521–3535, https://doi.org/10.1029/2019JG005078, 2019.
Matveev, A., Laurion, I., Deshpande, B. N., Bhiry, N., and Vincent, W. F.: High methane emissions from thermokarst lakes in subarctic peatlands, Limnol. Oceanogr., 61, https://doi.org/10.1002/lno.10311, 2016.
Norgeibilder.no: Statens kartverk, Geovekst og kommunene: Kautokeino 1958, Alta Kautokeino riksgrensen 1966, Roavvoaivi 2003, Finnmark 2013, Karasjok 2003, Finnmark 2011, https://www.norgeibilder.no/, last access: 3 June 2025.
Obu, J., Westermann, S., Bartsch, A., Berdnikov, N., Christiansen, H. H., Dashtseren, A., Delaloye, R., Elberling, B., Etzelmüller, B., Kholodov, A., Khomutov, A., Kääb, A., Leibman, M. O., Lewkowicz, A. G., Panda, S. K., Romanovsky, V., Way, R. G., Westergaard-Nielsen, A., Wu, T., Yamkhin, J., and Zou, D.: Northern Hemisphere permafrost map based on TTOP modelling for 2000–2016 at 1 km2 scale, Earth-Sci. Rev., 193, 299–316, https://doi.org/10.1016/j.earscirev.2019.04.023, 2019.
Parmentier, F. J. W., van Huissteden, J., Kip, N., Op den Camp, H. J. M., Jetten, M. S. M., Maximov, T. C., and Dolman, A. J.: The role of endophytic methane-oxidizing bacteria in submerged Sphagnum in determining methane emissions of Northeastern Siberian tundra, Biogeosciences, 8, 1267–1278, https://doi.org/10.5194/bg-8-1267-2011, 2011.
Phelps, A. R., Peterson, K. M., and Jeffries, M. O.: Methane efflux from high-latitude lakes during spring ice melt, J. Geophys. Res., 103, 29029–29036, https://doi.org/10.1029/98JD00044, 1998.
Pirk, N., Aalstad, K., Mannerfelt, E. S., Clayer, F., De Wit, H., Christiansen, C. T., Althuizen, I., Lee, H., and Westermann, S.: Disaggregating the Carbon Exchange of Degrading Permafrost Peatlands Using Bayesian Deep Learning, Geophys. Res. Lett., 51, e2024GL109283, https://doi.org/10.1029/2024GL109283, 2024.
Pismeniuk, A., Westermann, S., Dörsch, P., and Ippach, M.: Methane concentrations in the water and ice columns of thermokarst ponds in Subarctic Norway, Zenodo [data set], https://doi.org/10.5281/zenodo.18507511, 2026.
Raghoebarsing, A. A., Smolders, A. J. P., Schmid, M. C., Rijpstra, W. I. C., Wolters-Arts, M., Derksen, J., Jetten, M. S. M., Schouten, S., Sinninghe Damsté, J. S., Lamers, L. P. M., Roelofs, J. G. M., Op Den Camp, H. J. M., and Strous, M.: Methanotrophic symbionts provide carbon for photosynthesis in peat bogs, Nature, 436, 1153–1156, https://doi.org/10.1038/nature03802, 2005.
Rivkina, E., Shcherbakova, V., Laurinavichius, K., Petrovskaya, L., Krivushin, K., Kraev, G., Pecheritsina, S., and Gilichinsky, D.: Biogeochemistry of methane and methanogenic archaea in permafrost: Methane and methanogenic archaea in permafrost, FEMS Microbiology Ecology, 61, 1–15, https://doi.org/10.1111/j.1574-6941.2007.00315.x, 2007.
Sepulveda-Jauregui, A., Walter Anthony, K. M., Martinez-Cruz, K., Greene, S., and Thalasso, F.: Methane and carbon dioxide emissions from 40 lakes along a north–south latitudinal transect in Alaska, Biogeosciences, 12, 3197–3223, https://doi.org/10.5194/bg-12-3197-2015, 2015.
Serikova, S., Pokrovsky, O. S., Laudon, H., Krickov, I. V., Lim, A. G., Manasypov, R. M., and Karlsson, J.: High carbon emissions from thermokarst lakes of Western Siberia, Nat. Commun., 10, 1552, https://doi.org/10.1038/s41467-019-09592-1, 2019.
Shirokova, L. S., Pokrovsky, O. S., Kirpotin, S. N., Desmukh, C., Pokrovsky, B. G., Audry, S., and Viers, J.: Biogeochemistry of organic carbon, CO2, CH4, and trace elements in thermokarst water bodies in discontinuous permafrost zones of Western Siberia, Biogeochemistry, 113, 573–593, https://doi.org/10.1007/s10533-012-9790-4, 2013.
Ström, L., Tagesson, T., Mastepanov, M., and Christensen, T. R.: Presence of Eriophorum scheuchzeri enhances substrate availability and methane emission in an Arctic wetland, Soil Biol. Biochem., 45, 61–70, https://doi.org/10.1016/j.soilbio.2011.09.005, 2012.
Taylor, J. R. : An Introduction to Error Analysis: The Study of Uncertainties in Physical Measurements, 2, University Science Books, Sausalito, CA, USA, 1997.
Turetsky, M. R., Abbott, B. W., Jones, M. C., Anthony, K. W., Olefeldt, D., Schuur, E. A. G., Grosse, G., Kuhry, P., Hugelius, G., Koven, C., Lawrence, D. M., Gibson, C., Sannel, A. B. K., and McGuire, A. D.: Carbon release through abrupt permafrost thaw, Nat. Geosci., 13, 138–143, https://doi.org/10.1038/s41561-019-0526-0, 2020.
Turner, J. C., Moorberg, C. J., Wong, A., Shea, K., Waldrop, M. P., Turetsky, M. R., and Neumann, R. B.: Getting to the Root of Plant-Mediated Methane Emissions and Oxidation in a Thermokarst Bog, J. Geophys. Res.-Biogeo., 125, e2020JG005825, https://doi.org/10.1029/2020JG005825, 2020.
Vonk, J. E., Tank, S. E., Bowden, W. B., Laurion, I., Vincent, W. F., Alekseychik, P., Amyot, M., Billet, M. F., Canário, J., Cory, R. M., Deshpande, B. N., Helbig, M., Jammet, M., Karlsson, J., Larouche, J., MacMillan, G., Rautio, M., Walter Anthony, K. M., and Wickland, K. P.: Reviews and syntheses: Effects of permafrost thaw on Arctic aquatic ecosystems, Biogeosciences, 12, 7129–7167, https://doi.org/10.5194/bg-12-7129-2015, 2015.
Walter, K. M., Zimov, S. A., Chanton, J. P., Verbyla, D., and Chapin, F. S.: Methane bubbling from Siberian thaw lakes as a positive feedback to climate warming, Nature, 443, 71–75, https://doi.org/10.1038/nature05040, 2006.
Walter Anthony, K., Daanen, R., Anthony, P., Schneider Von Deimling, T., Ping, C.-L., Chanton, J. P., and Grosse, G.: Methane emissions proportional to permafrost carbon thawed in Arctic lakes since the 1950s, Nat. Geosci., 9, 679–682, https://doi.org/10.1038/ngeo2795, 2016.
Walter Anthony, K. M., Vas, Dragos. A., Brosius, L., Chapin, F. S., Zimov, S. A., and Zhuang, Q.: Estimating methane emissions from northern lakes using ice-bubble surveys, Limnol. Ocean Methods, 8, 592–609, https://doi.org/10.4319/lom.2010.8.0592, 2010.
Wik, M., Crill, P. M., Bastviken, D., Danielsson, Å., and Norbäck, E.: Bubbles trapped in arctic lake ice: Potential implications for methane emissions, J. Geophys. Res., 116, G03044, https://doi.org/10.1029/2011JG001761, 2011.
Wik, M., Varner, R. K., Anthony, K. W., MacIntyre, S., and Bastviken, D.: Climate-sensitive northern lakes and ponds are critical components of methane release, Nat. Geosci., 9, 99–105, https://doi.org/10.1038/ngeo2578, 2016.
Wilhelm, E., Battino, R., and Wilcock, R. J.: Low-pressure solubility of gases in liquid water, Chem. Rev., 77, 219–262, https://doi.org/10.1021/cr60306a003, 1977.
Zabelina, S. A., Shirokova, L. S., Klimov, S. I., Chupakov, A. V., Lim, A. G., Polishchuk, Y. M., Polishchuk, V. Y., Bogdanov, A. N., Muratov, I. N., Guerin, F., Karlsson, J., and Pokrovsky, O. S.: Carbon emission from thermokarst lakes in NE European tundra, Limnol. Oceanogr., 66, https://doi.org/10.1002/lno.11560, 2021.