the Creative Commons Attribution 4.0 License.
the Creative Commons Attribution 4.0 License.
 | 27 Feb 2026
A simplified approach for measuring Rubisco carbon isotope fractionation and the first determination in marine haptophyte Gephyrocapsa oceanica
Pere Aguiló-Nicolau
Madalina Jaggi
Jeroni Galmés
Heather M. Stoll
Rubisco is the central photosynthetic enzyme that catalyzes the fixation of CO2 to RuBP, initiating the most dominant carbon assimilation pathway on Earth that supports nearly all trophic chains in the biosphere. The CO2 fixation reaction expresses a strong kinetic isotope effect, producing biomass depleted in 13C and leaving characteristic imprints in sediments and sedimentary rocks, which are widely used to reconstruct past biological activity and environmental conditions, including ancient atmospheric CO2 levels. Despite its importance, carbon isotope fractionation of Rubisco (ϵRubisco) has been measured in only a limited number of organisms, with most studies focusing on land plants rather than on major contributors to the sedimentary record, such as cyanobacteria and coccolithophores. This scarcity reflects the complexity of existing experimental procedures and the high cost of instrumentation. Here, we present a simplified method that overcomes these limitations, eliminating the need for complex purification protocols, specialized equipment, and experimental designs that yield little CO2 fixation and high uncertainties. We use a simplified purification procedure yielding semi-purified Rubisco extracts, together with an Apollo–Picarro δ13C-DIC analyzer capable of simultaneously measuring DIC concentration and 13C isotope ratios. Using this protocol, we accurately determined ϵRubisco for the model plant Spinacia oleracea, the cyanobacterium Synechococcus sp., and provide the first determination for the coccolithophore Gephyrocapsa oceanica. The measured values span a striking range, from 13.1 ‰ to 30 ‰, highlighting both the variability of Rubisco fractionation and the versatility of our approach for studying carbon isotope discrimination across diverse biological systems. This study establishes a method that enables reliable determination of ϵRubisco across phylogenetically diverse groups, thereby supports research that provides new insights into the mechanisms of Rubisco fractionation, and improves interpretation of environmental carbon isotope records.
- Article
(4021 KB) - Full-text XML
- BibTeX
- EndNote


Ribulose-1,5-bisphosphate carboxylase oxygenase (Rubisco) is the key photosynthetic enzyme that catalyses the addition of CO2 to ribulose-1,5-bisphosphate (RuBP), producing two molecules of 3-phosphoglycerate (3-PGA). This reaction underpins the primary step of carbon fixation and supports almost all trophic chains in the biosphere (Prywes et al., 2023). While Rubisco also participates in other biochemical pathways, its most critical role is oxygenic photosynthesis via the Calvin-Benson-Bassham (CBB) cycle (Berg, 2011), contributing to the fixation of ∼ 220 Gt of carbon annually (Bar-On and Milo, 2019).
In addition to CO2 fixation, Rubisco also catalyses the oxygenation of RuBP, producing one molecule of 3-PGA and one of 2-phosphoglycolate (2-PG). The latter requires detoxification via the photorespiratory pathway, which results in energy loss and the release of previously fixed CO2 (Bauwe et al., 2012). Beyond its dual substrate specificity, Rubisco is characterized by a low carboxylation turnover rate () and low affinity for CO2 (inverse of Michaelis-Menten constant for CO2; KC). For these reasons, it is often described as an inefficient enzyme, although this designation remains a topic of debate (Bathellier et al., 2018).
Another feature of Rubisco’s carboxylation activity is its kinetic isotope effect (KIE), whereby it preferentially fixes the lighter carbon isotope, 12CO2, over 13CO2 (Farquhar et al., 1989). This discrimination results in photosynthetic biomass that is significantly depleted in 13C. The carbon isotope fractionation of Rubisco (ϵRubisco) arises from the higher zero-point vibrational energy of 12CO2, which lowers the activation energy for the transition state and facilitates bond formation. The KIE is further amplified when the transition state closely resembles the carboxylation product, thereby stabilizing the intermediate (Tcherkez and Farquhar, 2005).
Rubisco’s isotope effect has been preserved in the carbon isotope signatures of sedimentary rocks, allowing the reconstruction of biological and environmental conditions as far back as 3.8 billion years ago – shortly after Earth formed approximately 4.5 billion years ago (Wang et al., 2023b). Despite its biogeological importance, ϵRubisco has only been measured in a limited number of organisms (Table A1), with most studies focused on land plants rather than in the major contributors to sedimentary records: cyanobacteria for Precambrian era, and coccolithophores and diatoms as marine primary producers during the Phanerozoic (Garcia et al., 2021). However, recent work is being done to explore ϵRubisco in such phylogenetic groups (Aguiló Nicolau et al., 2025).
Reported ϵRubisco values in extant enzymes range from 11 % to 30 % (Boller et al., 2015, 2011; Thomas et al., 2019; Roeske and O'Leary, 1984; Wang et al., 2023b; Scott et al., 2004b; Guy et al., 1993). This wide variation has been documented in only a limited number of species, suggesting that additional values are yet to be discovered. Characterizing this variation is essential, as ϵRubisco directly influences interpretations of carbon isotope records used to reconstruct past biological activity and environmental conditions. However, because ϵRubisco is governed by a hyperbolic-sine relationship typical of mass-dependent fractionation, its potential range of variation is more constrained than that of Rubisco kinetic parameters, which follow an Arrhenius-type function (Galmés et al., 2016; Tcherkez and Farquhar, 2005). One of the main reasons for the limited number of reported ϵRubisco values is the complexity of the experimental procedures involved and the high cost of the required instrumentation.
Early determinations of carbon isotope fractionation by Rubisco date back to the 1960. Park and Epstein (1960) isolated tomato Rubisco and incubated it with bicarbonate and RuBP at 25 °C for 1 h. Assuming complete conversion of RuBP to 3-PGA, they acidified the mixture to release unreacted bicarbonate, isolated and purified the 3-PGA, combusted it, and analysed the resulting CO2 using a Nier-type mass spectrometer. The same method was later applied to other species such as Sorghum bicolor, Glycine max and Gossypium sp. (Christeller et al., 1976; Whelan et al., 1973; Wong et al., 1979). A major refinement came with the work of Roeske and O'Leary (1984, 1985) who conducted similar incubations using pure spinach and Rhodospirillum rubrum Rubisco for up to 9 h at 25 °C. After removing protein, they precipitated 3-PGA using barium salt, followed by enzymatic decarboxylation to release the fixed CO2 from 3-PGA. This CO2 was collected and analysed using isotope ratio mass spectrometry (IRMS). To account for 3-PGA formed via non-carboxylation pathways, they also ran a parallel oxygenase-only reaction. Later, Guy et al. (1993) introduced a method based on tracking changes in the isotope composition of the substrate during its consumption – a method known as substrate depletion, based on Rayleigh fractionation principle. In this approach, purified Rubisco was incubated in sealed vessels, and two to five samples were taken over the course of the reaction. Each was acidified and transferred to a dry-ice-ethanol trap to collect CO2 before being analysed on an IRMS. This method has since become widely adopted, with various improvements and adaptations (McNevin et al., 2006; Scott et al., 2004b; Thomas et al., 2019; Wang et al., 2023a, b). von Caemmerer et al. (2014) introduced the simultaneous measurement of gas exchange and isotope discrimination using a tuneable diode laser coupled to a Li-6400 system, applying the data to a ternary-corrected discrimination model (Farquhar and Cernusak, 2012).
Despite these developments, all existing methods for determining ϵRubisco present limitations, which this study aims to address. Early approaches lacked key methodological details and relied on several problematic assumptions: complete conversion of RuBP to 3-PGA, no consideration of oxygenation activity or enzyme deactivation over time, and omission of carbonic anhydrase to facilitate rapid interconversion of dissolved inorganic carbon (DIC) to CO2 – the true substrate of Rubisco (O'Leary, 1981). Although the substrate depletion method no longer requires accounting for oxygenation-derived 3-PGA because the measurement focuses on isotopic changes in the substrate rather than the reaction products, some applications have reported high variability in ϵRubisco estimates within the same species (Boller et al., 2011, 2015). In cases where RuBP was limiting, the assumption of full substrate consumption becomes questionable. This can be particularity problematic when DIC concentration is not measured directly and changes in reaction rate caused by inhibitor formation from Rubisco side reactions are not accounted for in the estimation of DIC depletion (Wang et al., 2023a, b; Pearce, 2006). Moreover, several studies report experiments in which DIC consumption remained below 30 % DIC – and in some cases even below 6 % – in at least some replicates, yet still yielded reproducible ϵRubisco values. While these results suggest the assay can yield consistent outcomes under low substrate turnover, such low conversion rates inherently reduce the reliability of the linearization required for Rayleigh fractionation, increasing uncertainty and potentially compromising the accuracy of the derived ϵRubisco values (Wang et al., 2023a, b; Boller et al., 2011, 2015; Thomas et al., 2019).
The requirement for highly purified enzymes adds complexity and time to an already demanding protocol, yet this requirement was experimentally validated primarily in early studies and has not been systematically re-evaluated using modern analytical approaches (Estep et al., 1978). Furthermore, the use of IRMS entails high equipment maintenance costs.
Despite the importance of ϵRubisco for biogeochemical and evolutionary models, no standardized and accessible protocol exists for its determination across diverse phylogenetic groups. Here, we introduce a simplified method that overcomes key limitations of existing approaches and enables robust ϵRubisco measurements across a wide range of taxa. Specifically, we couple a rapid Rubisco semi-purification method to an Apollo–Picarro δ13C-DIC analyzer, avoiding the need for time-consuming full enzyme purification while enabling simultaneous quantification of DIC concentration and isotopic composition. We compare the performance of this semi-purified preparation with a more complex protocol yielding fully purified Rubisco, and we assess the utility of the Apollo–Picarro δ13C-DIC analyzer relative to classical GasBench-IRMS measurements. In addition, we incorporate a simple kinetic model to account for DIC consumption dynamics during incubations, thereby providing a rational basis for selecting appropriate enzyme concentrations and sampling intervals. Using this simplified approach, we demonstrate reproducibility in Spinacia oleracea and Synechococcus sp. and provide the first determination of ϵRubisco for the coccolithophore Gephyrocapsa oceanica.
2.1 Strains, Media, and Growth Conditions
Three to four S. oleracea (cultivar Winter Giant Santos) seeds were sown in each of 45 individual 2 L pots containing a universal growing medium and maintained under automated watering. Plants were grown in a temperature- and humidity-controlled chamber (Fitoclima 10 000 HP, Aralab, Spain) under 500 µmol photons m−2 s−1 of photosynthetically active radiation, at 25 °C and 60 % relative humidity for one month. Fully illuminated, non-senescent leaves were harvested.
G. oceanica (RCC 1303) purchased from the Roscoff Culture Collection, was grown in batch cultures in sterile flasks placed on a roller at 10 rpm to ensure uniform mixing and light exposure. Cultures were maintained in medium as described in Keller et al. (1987). Artificial seawater (pH 8.1) was used instead of natural seawater, following the composition described by Kester et al. (1967). Cultures were incubated under LED light strips programmed with a sinusoidal 14 h light/10 h dark cycle, reaching a maximum light intensity of 120 µmol photons m−2 s−1. Growth temperature was set to 21 °C. Cell growth was monitored using a Z2 Coulter particle counter (Beckman Coulter, Inc., Brea, California, United States). Cultures were maintained semi-continuously by harvesting 80 %–90 % of the culture volume and refreshing it when cell density reached approximately 450 000 cells per mL. Cells were harvested by vacuum filtration through 2 µm mesh filters.
Synechococcus sp. PCC 6301 was obtained from Pasteur Culture Collection of Cyanobacteria (PCC, France) and grown under constant agitation in 50 or 250 mL graduated and ventilated cell culture flasks (CCFP-25V-100, Labbox, Spain). The strain was cultured in Z-medium (Staub, 1961) under a 16 h light/8 h dark cycle, with a light intensity of 50 µmol photons m−2 s−1 (4000 K, Osram L 18W/840 Lumilux, Germany) and a constant temperature of 24 °C (Aralab Fitoclima S600, PLH, Spain). Growth was monitored continuously by measuring culture absorbance at 650 nm (OD650, Multiskan Sky 1530-00433C, Thermo Scientific, USA). Once the OD650 reached 0.5, biomass was collected by centrifugation at 8000 g for 3 min at 24 °C. All harvested biomass was snap-frozen in liquid nitrogen, and stored at −80 °C until Rubisco extraction.
2.2 Extraction and purification
2.2.1 Semi-purification
Rubisco from S. oleracea was extracted following the protocol described by Capó-Bauçà et al. (2023). Briefly, 0.3 g of fresh leafs were snap-frozen in liquid N2 and ground into a fine powder using a mortar and pestle. The powder was then mixed with 0.2 g of polyvinylpolypyrrolidone (PVPP) and an equal amount of pre-washed sand. The mixture was lysed with 2 mL of ice-cold extraction buffer containing 100 mM EPPS (pH 8.1), 15 mM MgCl2, 1 mM ethylenediaminetetraacetic acid (EDTA), 10 mM dithiothreitol (DTT), 100 mM β-mercaptoethanol, 2 % protease inhibitor cocktail (PIC, P9599, Merck, USA), 4 mM phenylmethylsulfonyl fluoride (PMSF), and 0.5 % Triton X-100. The lysate was centrifuged at 15 000 g for 3 min at 4 °C, and the resulting supernatant was aliquoted.
Rubisco from G. oceanica was extracted by resuspending 10 filters containing cells in 4 mL of ice-cold extraction buffer using a vortex mixer. Empty filters were then removed, and approximately 1 mL of 2 mm glass beads was added. Cell lysis was performed on ice using a probe sonicator (UP200St, Hielscher Ultrasonics, Germany) for 8 min, with alternating 30 s on/off intervals at 40 % of the maximum power output. The lysate was centrifuged at 8000 g for 20 min at 4 °C. The resulting supernatant was aliquoted.
Rubisco from Synechococcus sp. was extracted using the same procedure, but with a modified extraction buffer composed of 100 mM Bicine pH 8.1, 20 mM MgCl2, 1 mM EDTA, 1 mM Benzamidine, 1 mM ϵ-aminocaproic acid, 10 mM DTT, 2 % PIC, 100 mM β-mercaptoethanol, 20 mM PMSF, 2 % CelLyticTM B (B7435, Merck, USA), 2.5 mL of 2 mm glass beads, and 0.1 g PVPP as described in Aguiló Nicolau et al. (2025). All aliquoted supernatant were snap-frozen in liquid nitrogen and stored at −80 °C
Rubisco from S. oleracea and G. oceanica was partially-purified via anion-exchange chromatography using Bio-Scale Mini Macro-Prep High Q cartridges (7324124, Bio-Rad, USA). The protein was then desalted and concentrated approximately 10-fold by centrifugation at 2000 g and 4 °C using 10 kDA Amicon Ultra-4 centrifugal filter units (UFC8010, Merck, USA). For Synechococcus sp., the same anion-exchange procedure was employed, with specific variations as described in Aguiló Nicolau et al. (2025)
2.2.2 Full-purification
The full-purification protocol from Amaral et al. (2024) was followed and adapted to fully purify Rubisco from S. oleracea leaves. Approximately 20–30 g of fresh leaf tissue were placed in a 100 mL beaker together with 100 mL of ice-cold extraction buffer. The mixture was homogenized on ice using a blender. The homogenate was filtered through several layers of wet Miracloth (475855, Merck, USA) into a pre-chilled 50 mL beaker, transferred to centrifuge tubes, and centrifuged at 18 000 g for 20 min at 4 °C. The resulting supernatant was transferred into a cold graduated cylinder, and 60 % polyethylene glycol (PEG) was added at a volume equal to 50 % of the supernatant. 1 M MgCl2 was then added to a final concentration of 20 mM followed by gentle mixing by inversion and incubated under magnetic stirring at 4 °C for 30 min. After incubation, the mixture was centrifuged at 18 000 g for 30 min at 4 °C with slow deceleration, and the resulting pellet was resuspended in 20 mL of buffer (100 mM EPPS pH 8.1, 15 mM MgCl2, and 1 mM EDTA) containing 2 % PIC using a pre-chilled tissue homogenizer. This homogenate was subjected to ultracentrifugation at 200 000 g for 20 min at 4 °C with slow deceleration. The final supernatant was loaded onto two 5 mL Bio-Scale Mini Macro-Prep High Q anion-exchange cartridges (7324124, Bio-Rad, USA) connected in series to an ÄKTA pureTM 25 FPLC system (29018226, Cytiva, USA). Protein elution was monitored at 280 nm (OD280), and Rubisco-containing fractions were collected and further desalted using a SuperdexTM 200 Increase 10/300 GL column (28990944, Cytiva, Sweden). The desalted fractions were concentrated approximately 10-fold by centrifugation at 2000 g and 4 °C using 10 kDa Amicon Ultra-4 filters, snap-frozen in liquid nitrogen, and stored at −80 °C.
2.2.3 Assessing the degree of Rubisco purification
The degree of Rubisco purification achieved using the two different protocols (semi-purification and full-purification) was assessed by loading ∼ 10 µL of S. oleracea crude leaf extract and both semi-purified and fully-purified extracts into S-dodecyl-sulphate polyacrylamide gel electrophoresis (SDS-PAGE), separating the proteins and stained with Coomassie Brilliant Blue. Molecular weight marker was added confirming the presence of prominent bands at approximately 55 and 14 kDa, corresponding to the large and small Rubisco subunits respectively.
2.3 Isotope fractionation experiment
The KIE of S. oleracea, G. oceanica, and Synechococcus sp. Rubisco was determined based on the substrate depletion method described by Scott et al. (2004b). This method tracks changes in δ13C of dissolved inorganic carbon (DIC) during its progressive consumption by the Rubisco-catalyzed carboxylation reaction. Assays were conducted in 10 mL gas-tight syringes (Hamilton, USA) to prevent contamination by atmospheric CO2. The reaction buffer consisted of 100 mM EPPS at pH 7.8, 20 mM MgCl2, and approximately 6 mM NaHCO3. Buffers were purged with N2 gas overnight before use to eliminate CO2. Carbonic anhydrase (40 µg mL−1, from bovine erythrocytes; C3934, Sigma-Aldrich) was included to ensure rapid chemical and isotopic equilibration between CO2 and . Partially or fully-purified Rubisco, pre-activated by incubation with 20 mM NaHCO3 for 30 min at room temperature, was added to the reaction syringe at a final concentration of 70–80 µg mL−1 of active enzyme. The reaction was initiated by injecting an equimolar concentration of RuBP synthesized and purified according to Kane et al. (1994) relative to the DIC. At defined time intervals, samples were withdrawn to monitor both DIC concentration and δ13C. Each sample was divided into two fractions. The first fraction, containing at least 1.25 µmol DIC (0.5–2 mL), was diluted into 2 mL of N2-purged 110 mM EPPS buffer (pH 7.8) and either injected directly into a DIC-δ13C Analyzer or filtered through a 50 kDa Amicon Ultra-4 centrifugal unit (UFC8010, Merck, USA) at 2000 g for 3 min at 25 °C before injection for concentration and carbon isotope analysis of DIC. The second fraction, containing at least 0.3 µmol DIC (0.1–0.5 mL), was immediately injected into a 5 mL septum-capped vial flushed with helium and preloaded with 0.1 mL of 200 mM H3PO4. These samples were analyzed the following day using a GasBench system. Reactions were carried out in a temperature-controlled incubator or climate chamber set precisely to 25 °C. Syringes were continuously rotated at 20 rpm on a roller to ensure homogeneous mixing. Control assays were performed under identical conditions but without RuBP or Rubisco extract. All experiments were conducted in duplicate or triplicate.
2.4 Analytical methods
2.4.1 Total soluble protein and active Rubisco quantification
As described in detail by Aguiló Nicolau et al. (2025), the concentration of Rubisco active sites was determined by incubating extracts with 25 mM NaHCO3 for 30 min at 25 °C, followed by a 30 min incubation with the Rubisco specific binding inhibitor 14C-radiolabelled 2′-carboxy-D-arabinitol-1,5-bisphosphate (14C-CABP) (Ruuska et al., 1998). The unbound inhibitor was then separated from Rubisco-bound 14C-CABP by column chromatography using Sephadex G-50 Fine (17-0042-01, GE Healthcare, USA). The radioactivity of the fraction containing Rubisco-bound inhibitor was quantified using a scintillation counter (Tri-Carb 4910 TR, Revity, USA). Total soluble protein (TSP) content in the extracts was determined using the Bradford assay (Bradford, 1976).
2.4.2 Concentration and stable isotope ratio measurement
Concentration and δ13C composition of DIC were measured using an Apollo acidification system AS-D1 (Apollo SciTech, LLC, USA) coupled to a Picarro G2131-i cavity ring-down spectrometer (Picarro Inc., USA). Samples were injected into the acidification chamber, where 0.9 mL of 5 M phosphoric acid was added to convert DIC into CO2 gas. The evolved CO2 was subsequently sparged and transferred to the Picarro analyzer for isotopic and concentration analysis.
Two concentrations of in-house NaHCO3 isotope standards, prepared in both deionized water and 110 mM EPPS buffer, were analyzed at the beginning and end of each run to monitor instrument accuracy and correct for any drift. The average standard deviation of these standards was 0.2 ‰. Additionally, a certified DIC reference material from the Scripps Institution of Oceanography (Dickson, 2010) was injected at multiple concentrations to calibrate the quantitative DIC measurements. The EPPS buffer used to dilute the samples was analyzed repeatedly as a blank. Although it was degassed by bubbling with N2 overnight, trace amounts of DIC were still detectable and were subtracted from measured sample concentrations.
To independently validate the Apollo-Picarro results, the carbon isotope composition of DIC was also measured using a GasBench II system (Thermo Fisher Scientific, Germany) equipped with an autosampler (CTC Analytics AG, Switzerland), coupled to a ConFlo IV interface and a Delta V Plus isotope ratio mass spectrometer (Thermo Fisher Scientific). The same in-house NaHCO3 isotope standards used in the Apollo–Picarro setup were also employed in a standard bracketing procedure. Average offsets between known and measured δ13C values of the standards were used to correct all sample measurements. The average standard deviation of these standards was 0.2 ‰. All carbon isotope signatures are reported in per mil ( ‰) relative to Vienna Pee Dee Belemnite (VPDB) (δ13CVPDB).
2.5 Data evaluation
The calculation of ϵRubisco is based on the Rayleigh distillation effect, which describes the progressive change in the isotopic composition of CO2 as it is consumed during the reaction. The ϵRubisco value was determined by linear regression analysis of the natural logarithm of the carbon isotope ratios of CO2 versus the natural logarithm of the remaining CO2 concentration, following Scott et al. (2004a) and Eq. (1):
where and [CO2] are the carbon isotope ratio and concentration of CO2 at time t, and and [CO2]0 are the corresponding initial values. Since CO2 is the actual substrate for Rubisco, but our measurements were performed on DIC, it was necessary to correct for the equilibrium isotope fractionation between CO2 and , as described in Scott et al. (2004b), using the modified Rayleigh equation for DIC (Eq. 2):
where Ci is the equilibrium isotope effect between dissolved CO2 and at reaction temperature i, as reported by Guy et al. (1993) and Mook et al. (1974). RDIC and [DIC] are the isotope ratio and concentration of DIC at time t, and RDIC,0 and [DIC]0 are their corresponding initial values. The slope m obtained from the linear regression of ln(RDIC) versus ln([DIC]) was used to calculate α and ϵRubisco according to Eqs. (3) and (4):
Data from replicate experiments were combined using the Pitman estimator (Scott et al., 2004a). Measurement uncertainties were propagated using Gaussian error propagation, and the resulting propagated standard deviations represent the standard errors of the parameter estimates. Comparisons of measured ϵRubisco values were performed using two-tailed t-tests, with differences considered statistically significant at p<0.05.
2.6 Kinetic modeling of DIC depletion
To improve calculation of the needed Rubisco concentration and optimal sampling times, we modeled the concentration dynamics of DIC during the in vitro Rubisco catalyzed CO2 fixation assay using Michaelis-Menten kinetics, incorporating the formation of a inhibitory side product – xylulose 1,5-biphosphate (XBP) – known as a competitive inhibitor of Rubisco activity (Pearce, 2006). At each time point ti, the concentrations of DIC and CO2 were recalculated based on their values at the preceding time point ti−1. The initial DIC concentration at ti−1 was set to the measured value at the start of the assay. DIC depletion over time was modelled as:
The corresponding CO2 concentration at each time point was calculated from the DIC pool using the carbonate equilibrium, as follows:
where [H+] was derived from the measured pH of the reaction mixture. The equilibrium constants K1 and K2 (Zeebe and Wolf-Gladrow, 2001) were adjusted for temperature and ionic strength as described by Yokota and Kitaoka (1985). Reaction rates were modeled using Michaelis-Menten kinetics, with and without competitive inhibition:
where KM is the Michaelis-Menten constant, taken from Hermida-Carrera et al. (2016), Aguiló-Nicolau et al. (2023), and unpublished data. KI represents the inhibition constant for XBP, specific to the Rubisco form, and was taken from Pearce (2006). vmax is the maximum reaction rate. The concentration of the inhibitor at each time point was modeled as:
where kacc is the accumulation rate of inhibitor XBP. The parameters vmax and kacc were estimated by fitting the model to experimental data. Parameter optimization was achieved by minimizing the root mean square deviation between the modeled and measured DIC concentrations. For this purpose, we used the built-in Solver function in Microsoft Excel.
3.1 Optimizing Rubisco purity for reliable isotope fractionation measurements
To establish a protocol for measuring ϵRubisco, we used enzyme extracted from S. oleracea leaves. This species was selected because of its high biomass yield and high Rubisco content, and because it enables direct comparison of our fractionation results with previously published values. To minimize potential interference in the in vitro CO2 fixation assays from other carboxylases that could alter the δ13C composition, as well as to reduce the influence of inhibitory proteins, Rubisco was purified from other proteins present in the crude leaf extract. Two different purification protocols were tested: (1) a fast and simple method that yields partially-purified Rubisco, and (2) a more time-intensive procedure that produces a highly purified Rubisco extract (see Methods for details).
To visually assess the extent of purification achieved by the two protocols, we performed SDS-PAGE. The gel, shown in Fig. 1, was loaded with comparable amounts of non-purified crude cell extract (CE), semi-purified Rubisco extract (SPE), and fully-purified Rubisco extract (FPE) obtained from the two purification procedures. The fully-purified extract shows almost exclusively two bands at approximately 55 and 14 kDa, corresponding to the large and small subunits of Rubisco, respectively. In contrast, the semi-purified lane displays, in addition to the two prominent Rubisco bands, several faint bands that indicate the presence of other proteins, although these are substantially less intense than the numerous additional bands observed in the crude extract. Overall, the gel demonstrates a clear increase in Rubisco purity from crude extract to semi-purified to fully-purified extract.
To quantify the degree of Rubisco purification in the three extracts, we compared the total protein content with the amount of Rubisco present. Total protein concentration was determined using the Bradford assay, and Rubisco content was quantified from SDS PAGE analysis. We estimated that Rubisco accounts for approximately 34±9 % of the total protein in crude extract, 70±8 % in the semi-purified extract, and 91±9 % in the fully-purified exract. This represents a roughly twofold enrichment in the semi-purified extract and nearly threefold in the fully-purified extract relative to the crude extract. Based on the 14C–CABP binding assay, approximately 63 % of the Rubisco in the fully-purified extract was catalytically active. For the semi-purified extract, the 14C–CABP assay indicated a high proportion of active Rubisco, but this estimate was not used quantitatively because the isotope fractionation experiment was performed on a separate extract. In the following sections, we describe and discuss the results of in vitro isotope fractionation experiments conducted using both the fully-purified and semi-purified Rubisco extracts.
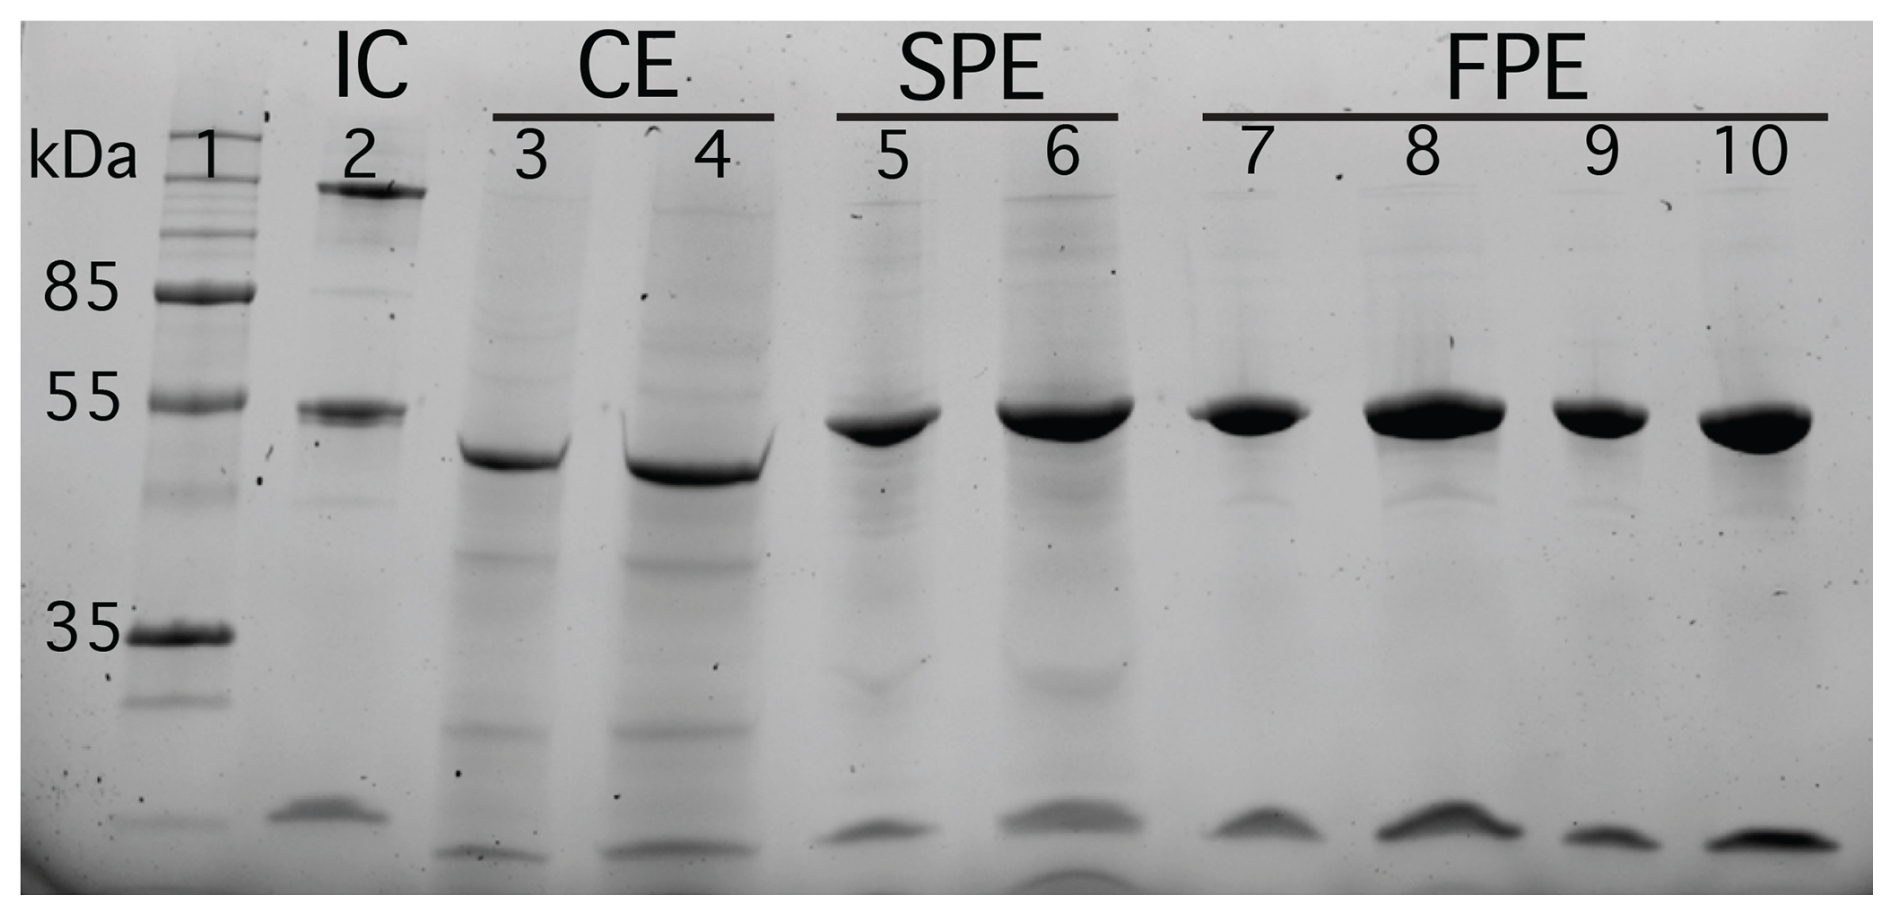
Figure 1Qualitative SDS-PAGE analysis of protein extracts from S. oleracea leaves purified for Rubisco using two different protocols: one for semi-purification and the other for full purification. Proteins were separated on an SDS-PAGE gel and stained with Coomassie Brilliant Blue. Lane 1: molecular weight marker; Lane 2: internal control (IC); Lanes 3–4: crude extract (CE); Lanes 5–6: semi-purified extract (SPE); Lanes 7–10: fully-purified extract (FPE). Prominent bands at approximately 55 and 14 kDa correspond to the large and small subunits of Rubisco, respectively.
3.2 Optimization of Rubisco concentration and sampling using a kinetic model
The concentration of Rubisco used in the assay was a critical parameter, as it directly influenced the rate of CO2 consumption, the extent of dissolved inorganic carbon (DIC) depletion, and the optimal timing of sample collection. To optimize both the enzyme concentration and the sampling schedule, we developed a kinetic model to simulate DIC dynamics throughout the course of the reaction.
Figure 2a shows the time course of DIC consumption during CO2 fixation for two different concentrations of fully-purified Rubisco from S. oleracea. The symbols represent experimentally measured DIC concentrations sampled throughout the reaction, while the black lines indicate the modelled DIC decline based on standard Michaelis-Menten kinetics. In the early stages of the reaction, DIC is consumed rapidly and aligns well with the model predictions. As the reaction proceeds, however, the fixation rate progressively declines and eventually approaches zero, deviating substantially from the expected Michaelis-Menten behavior. This discrepancy is attributed to a progressive loss of Rubisco catalytic activity over time. It is well established that intermediate by-products formed during the enolization-carboxylation reaction – such as XBP – can act as inhibitors, leading to self-inhibition of Rubisco (Pearce, 2006). To account for this effect, we extended the Michaelis-Menten model by incorporating a competitive inhibition term, assuming a linear accumulation of this inhibitory by-product throughout the reaction. Although XBP accumulation is likely non-linear and substrate dependent, a linear approximation was used in the absence of more detailed kinetic constraints. The inhibitor accumulation rate (kacc) was treated as a free parameter. Similarly, while vmax could in principle be constrained from known kcat values and Rubisco concentrations, the resulting fits were unsatisfactory, so vmax was also treated as a free fitting parameter.
Our dataset contained sufficient time points to distinguish both the curvature defining kacc and the peak defining vmax, therefore allowing us to constrain both parameters. The best-fit solution for the two free parameters was obtained by minimizing the root mean square (RMS) difference between the experimental and model-predicted DIC concentrations over the course of the reaction. The optimized parameters yielded an RMS deviation of approximately 0.07±0.04 mM across all experiments and a strong linear correlation between measured and modelled DIC values, with an R2 of 0.997 (see Fig. 3). The modelled DIC depletion, shown as green lines in Fig. 2a, captures the experimental observations significantly better than the standard Michaelis-Menten model without inhibition (black lines in Fig. 2a). The best-fit parameters for vmax and the production rates are summarized in Table 1. Based on the fitted vmax values and the known Rubisco concentrations, we calculated an average kcat of 2.3±0.5 s−1, which is in excellent agreement with the reported kcat of 2.4±0.1 s−1 for S. oleracea Rubisco (Hermida-Carrera et al., 2016). We note that other factor, such as change in Rubisco activation state can also contribute to deviation form simple Michaelis-Menten kentics, but were not considered in this model here.
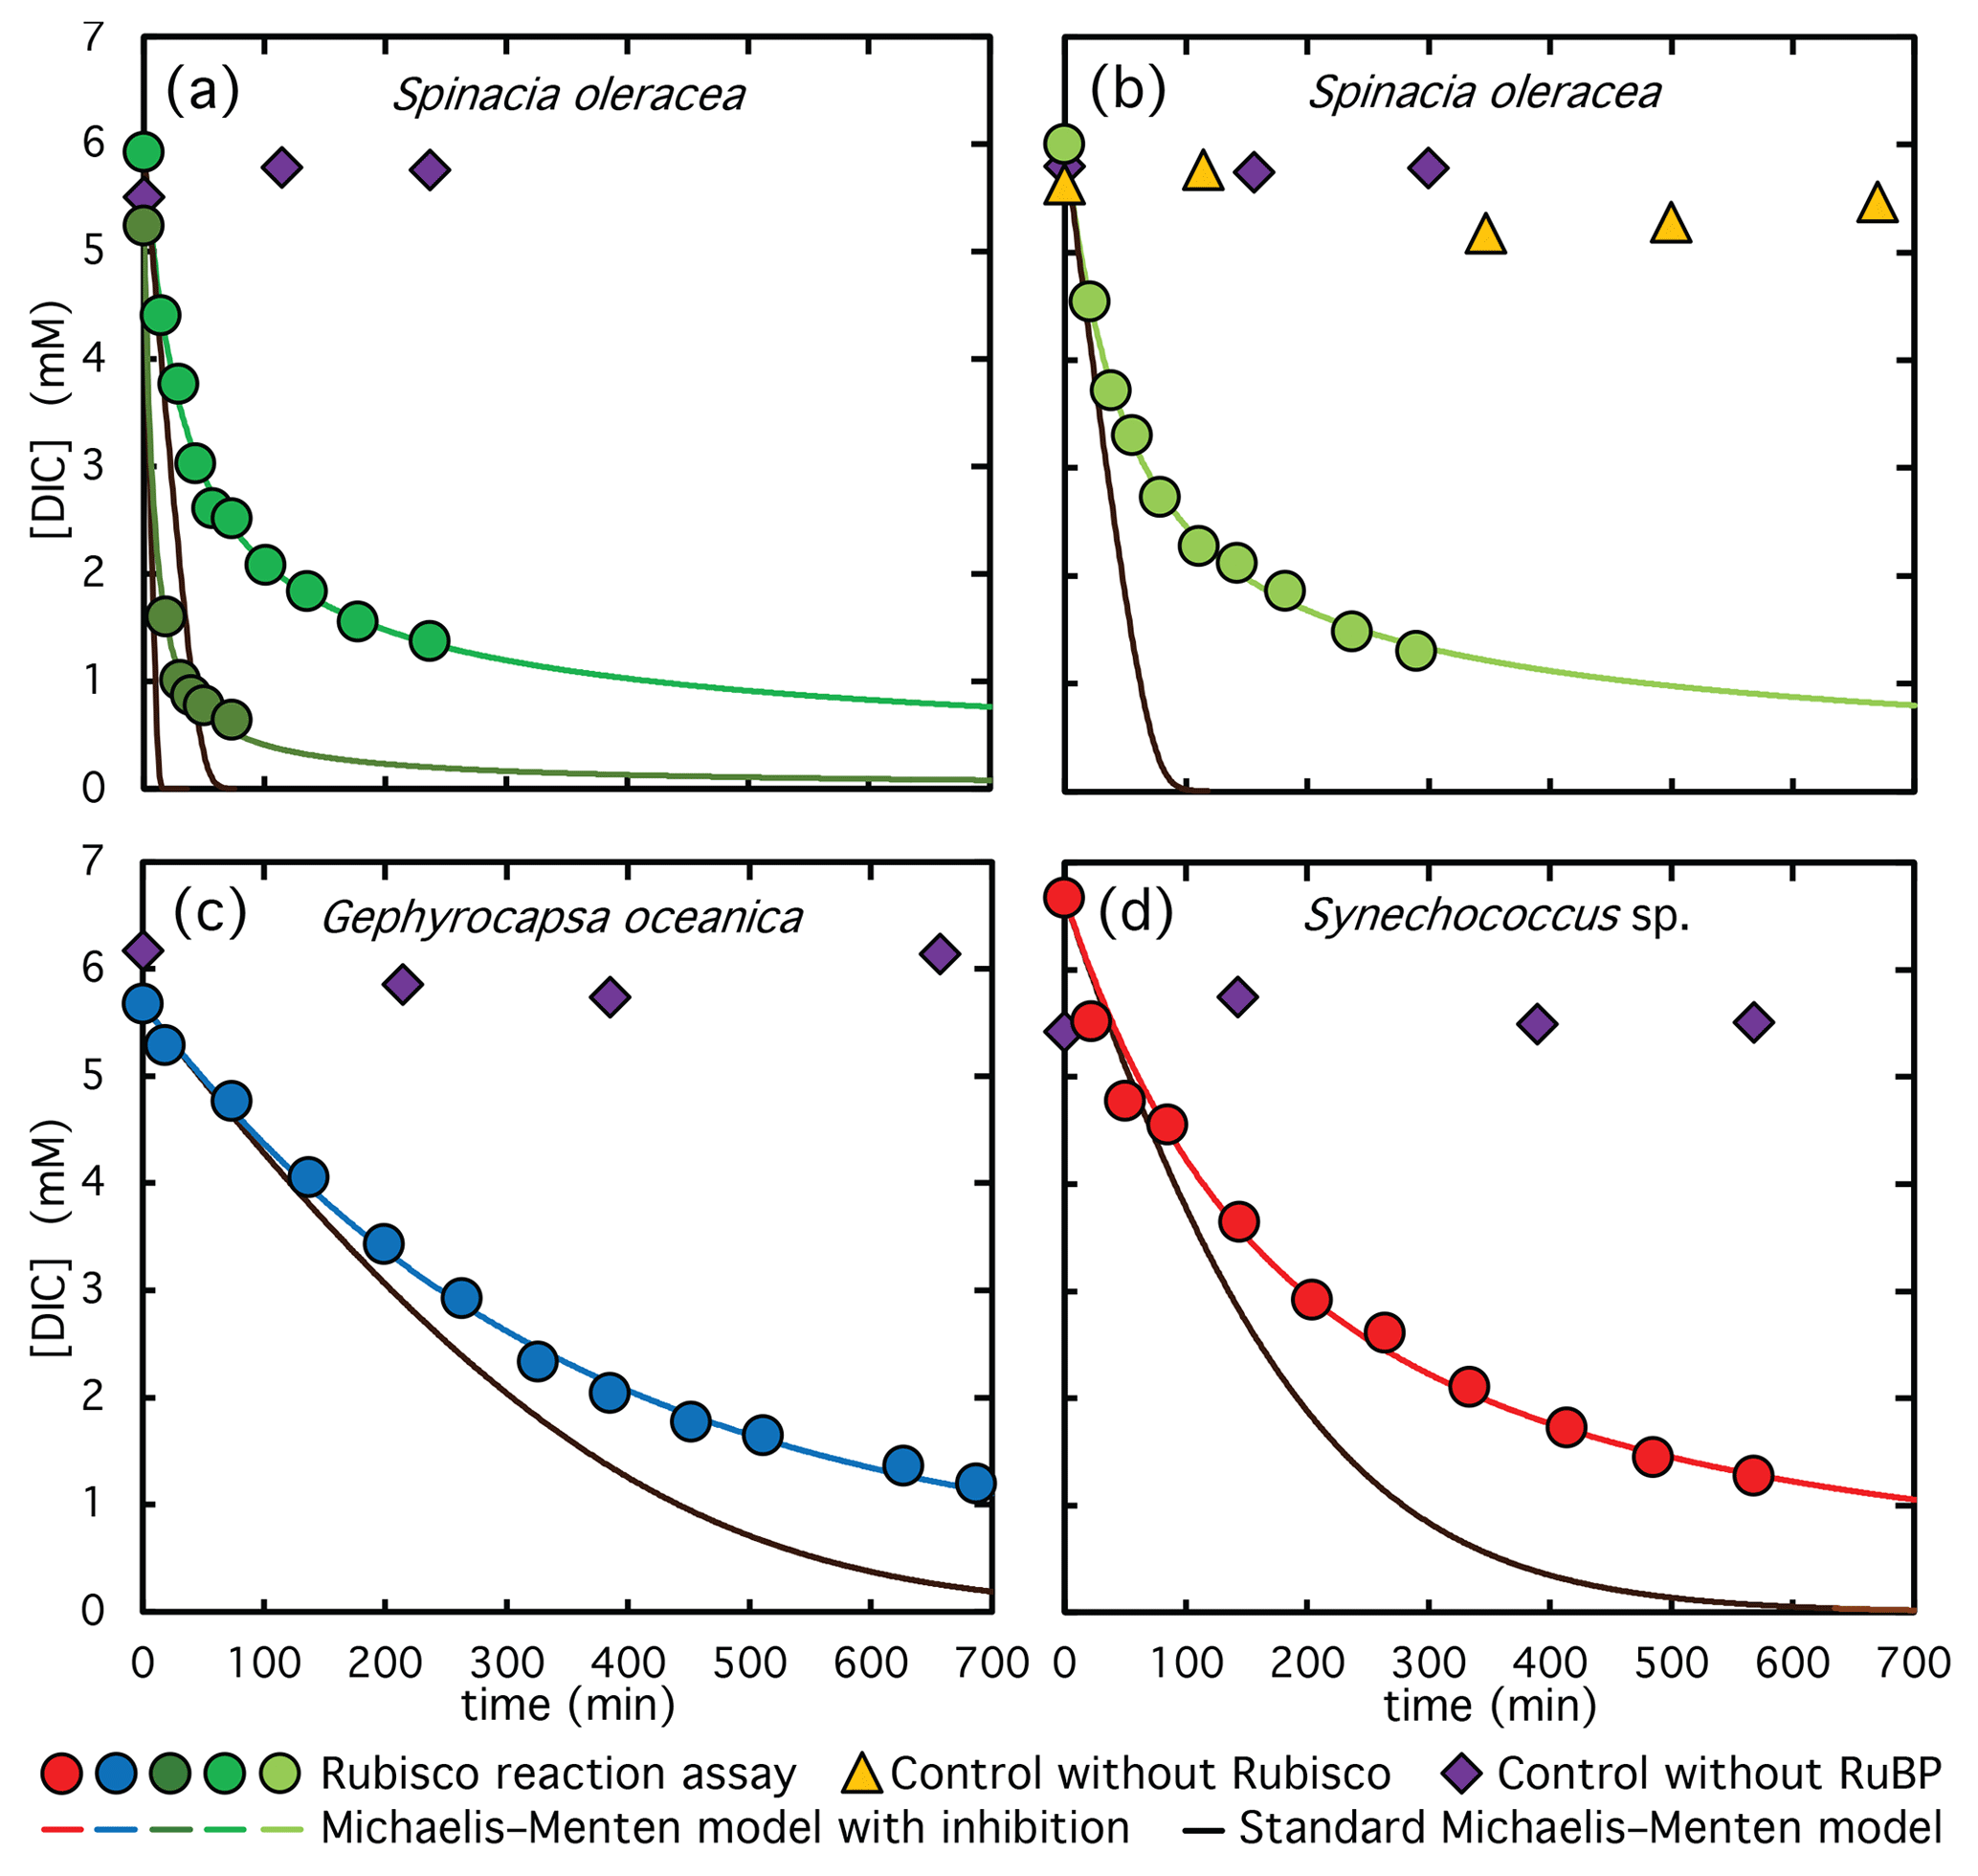
Figure 2DIC depletion during the course of CO2 fixation catalyzed by Rubisco from: (a) fully-purified S. oleracea extract, (b) semi-purified S. oleracea extract, (c) semi-purified G. oceanica extract, and (d) semi-purified Synechococcus sp. extract. Symbols represent measured DIC concentrations, lines represent modelled concentrations. Circles show DIC measurements from active reaction assays, violet diamonds represent control experiments without RuBP, and yellow triangles represent controls without Rubisco extract. Black lines correspond to fits using standard Michaelis-Menten kinetics, while the other lines incorporate competitive product inhibition by reaction by-products. Green and dark-green circles in panel (a) represent assays performed at two different Rubisco concentrations.
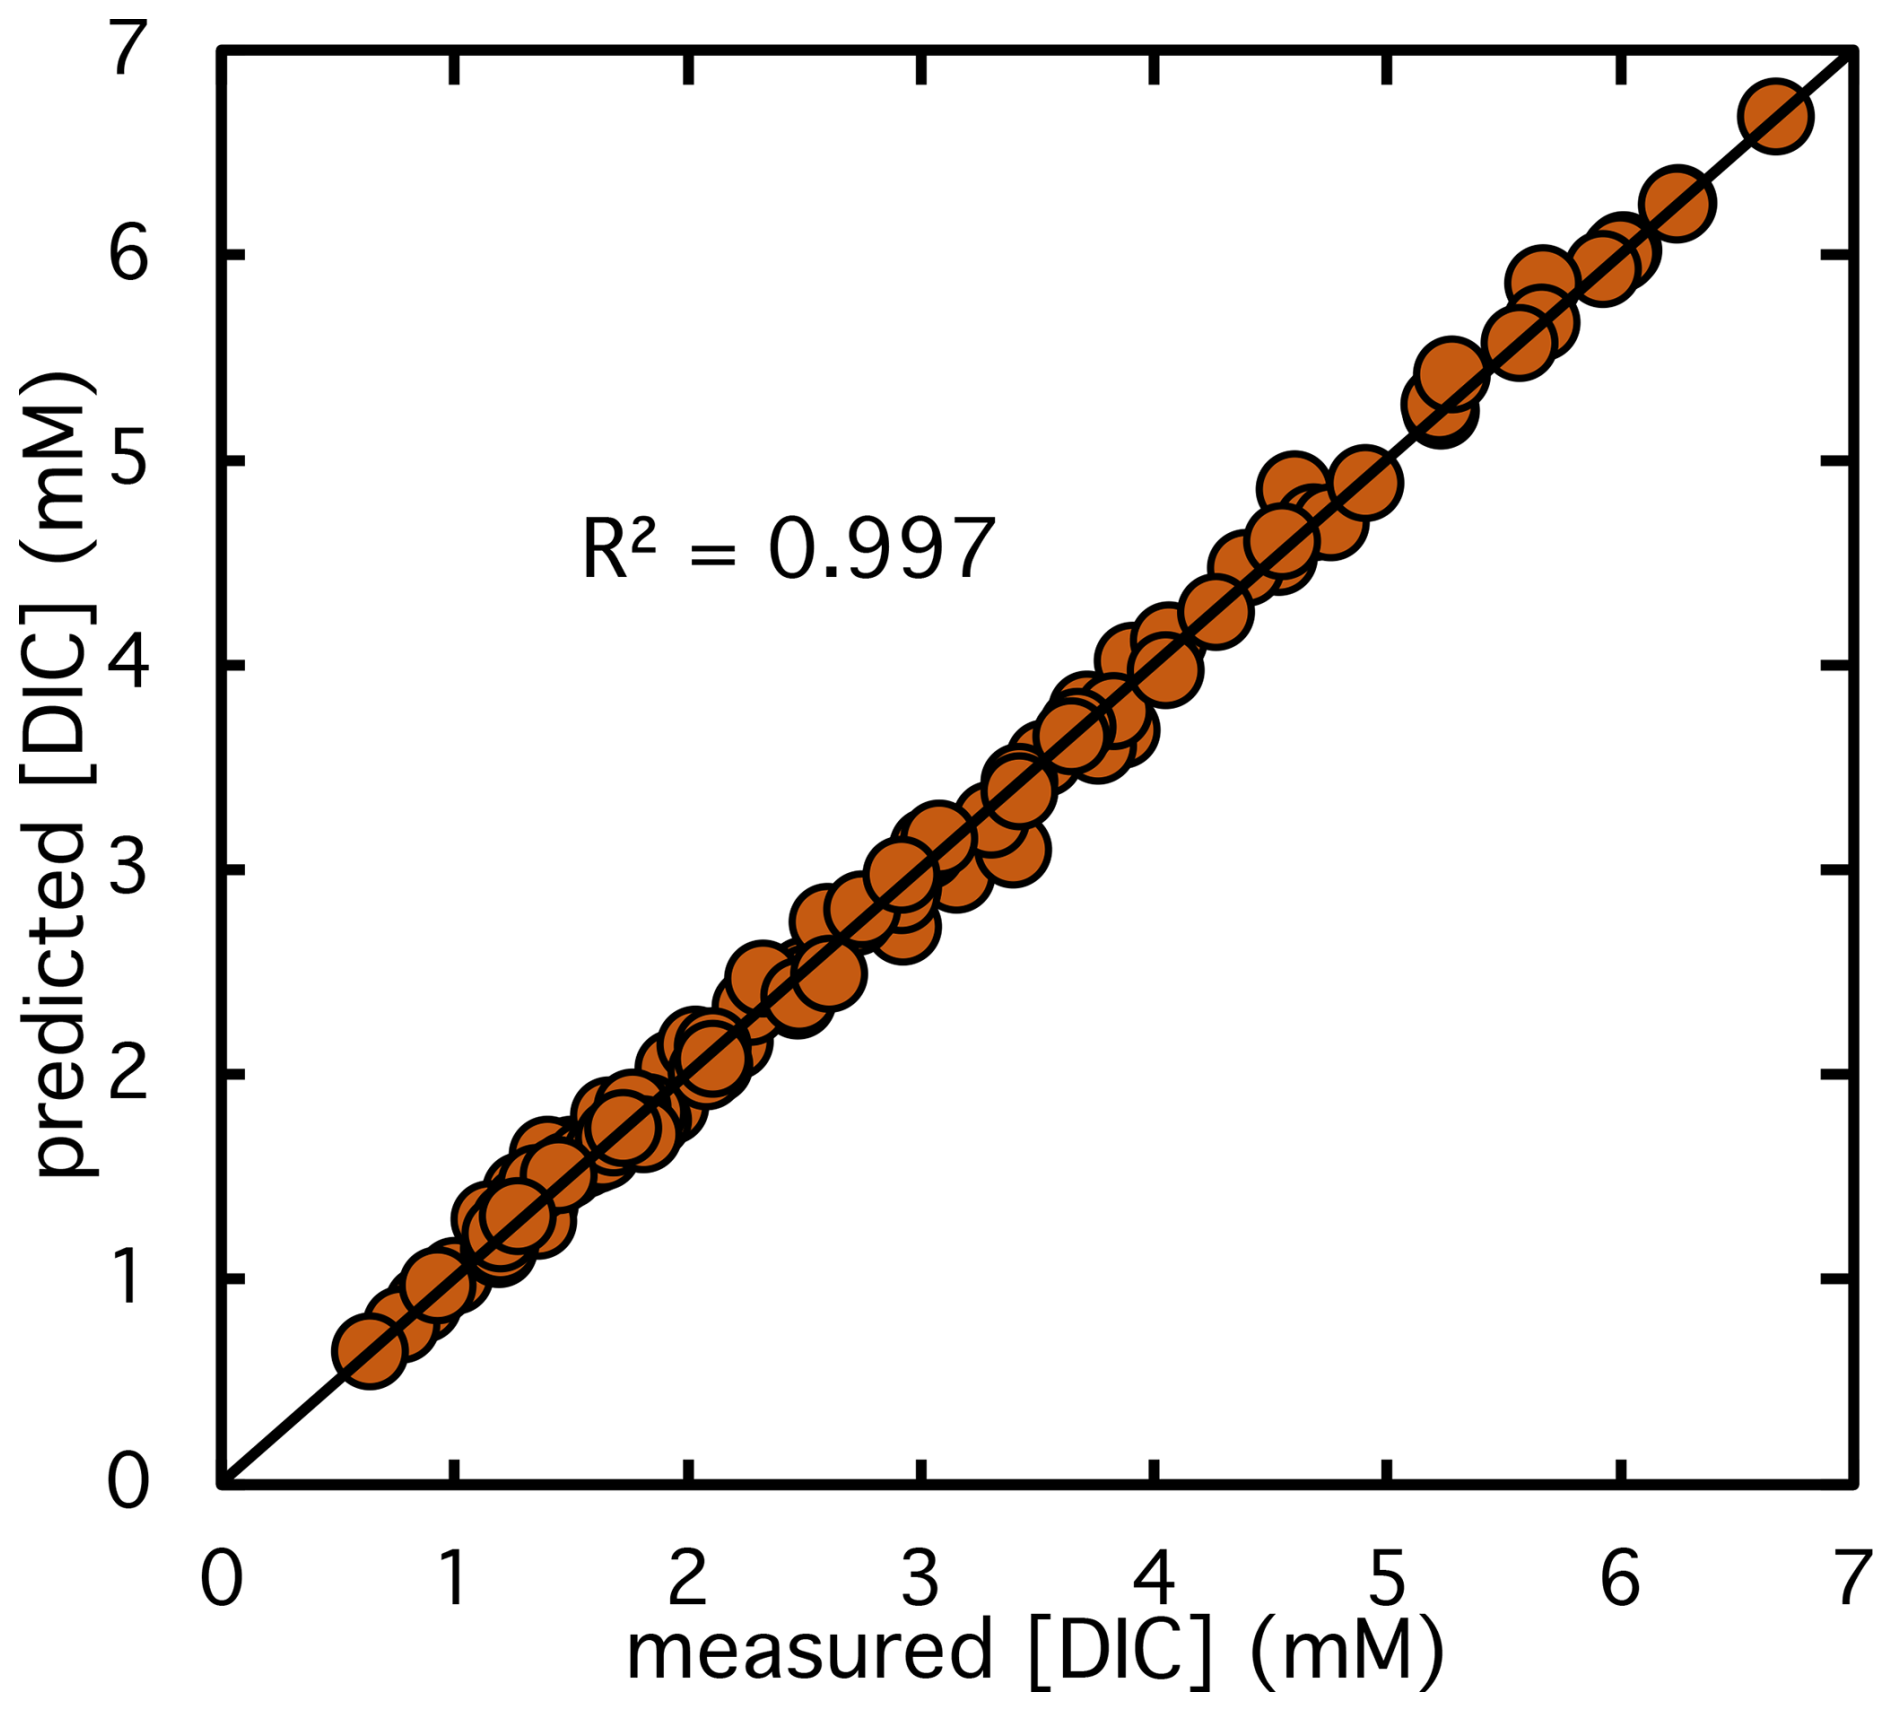
Figure 3Comparison of predicted versus experimentally measured DIC concentrations across all reaction assays. Each point represents a measurement of DIC concentration during a Rubisco catalyzed CO2 fixation reaction. The 1:1 diagonal line indicates perfect agreement between model predictions and observed values. Data include assays from S. oleracea, G. oceanica, and Synechococcus sp.
Detailed knowledge of reaction kinetics is essential for determining both the optimal timing of sample collection and the appropriate amount of enzyme to include in the assay. In the high-activity reaction shown in Fig. 2a (dark green color), approximately three times more Rubisco was used compared to the low-activity reaction (green color), resulting in approximately 90 % DIC depletion before the reaction significantly slowed (Table 1). In contrast, the lower Rubisco concentration led to a final DIC depletion of only 77 %. However, the time required to process each sample – approximately 7–8 min – limited the number of samples that could be collected during the high-activity assay. This restriction hindered accurate calculation of isotope enrichment factors, as the limited number of data points produced suboptimal results. To obtain robust estimates of carbon isotope enrichment, we aimed to collect approximately 10 samples and reach at least 70 % DIC depletion. This balance was successfully achieved in the low-activity assay shown in Fig. 2a, which provided high-quality data, as detailed in the following section. Based on these constraints, an active Rubisco concentration of approximately 70–80 µg mL−1 was found to be optimal. Significantly lower concentrations led to inadequate DIC fixation and unacceptably long reaction durations.
3.3 Comparison of Apollo-Picarro and GasBench Systems for isotope fractionation analysis
We simultaneously measured both the concentration and isotopic composition of DIC using the Apollo acidification system coupled to a Picarro cavity ring-down spectrometer (Apollo-Picarro system). To evaluate the accuracy of the isotope measurements from this setup, we also analyzed the isotope data using a more traditional method: the GasBench system coupled to a Delta V Plus isotope ratio mass spectrometer. Fully-purified Rubisco from S. oleracea was used for this comparison.
Depletion of DIC during CO2 fixation was accompanied by substantial 13C enrichment in the residual DIC pool, as shown in Fig. 4a and b for the GasBench and Apollo-Picarro systems, respectively. The δ13C values increased by up to +58 ‰ at 77 % substrate conversion. A strong linear correlation (R2>0.99) was observed in the regression analysis of the logarithm of carbon isotope ratio versus the logarithm of the remaining DIC concentration in both systems (Fig. 4c and d). Using Eqs. (2)–(4), we calculated ϵRubisco values summarized in Table 1. The ϵRubisco determined using the Apollo-Picarro system for both isotope and concentration measurements was 29.6±0.6 ‰, while a value of 30.4±0.5 ‰ was obtained when isotope ratios were measured with the GasBench system and concentrations with the Apollo–Picarro system. Although the latter value is slightly higher, the difference is not statistically significant (p>0.05).
Averaging the two systems yields an ϵRubisco of 30.0 ± 0.4 ‰. Previously published ϵRubisco values for CO2 fixation catalyzed by S. oleracea Rubisco range from 28.2 ‰ to 30.3 ‰ (Roeske and O'Leary, 1984; Guy et al., 1993; Scott et al., 2004b), and our results fall within this range, demonstrating excellent agreement with prior work. Control experiments processed identically to the reaction assays – Control 1 (without Rubisco extract) and Control 2 (without RuBP) – showed no significant changes in either DIC concentration or δ13C values over the duration of the experiment (Figs. 2a and 4a and b, violet and yellow symbols).
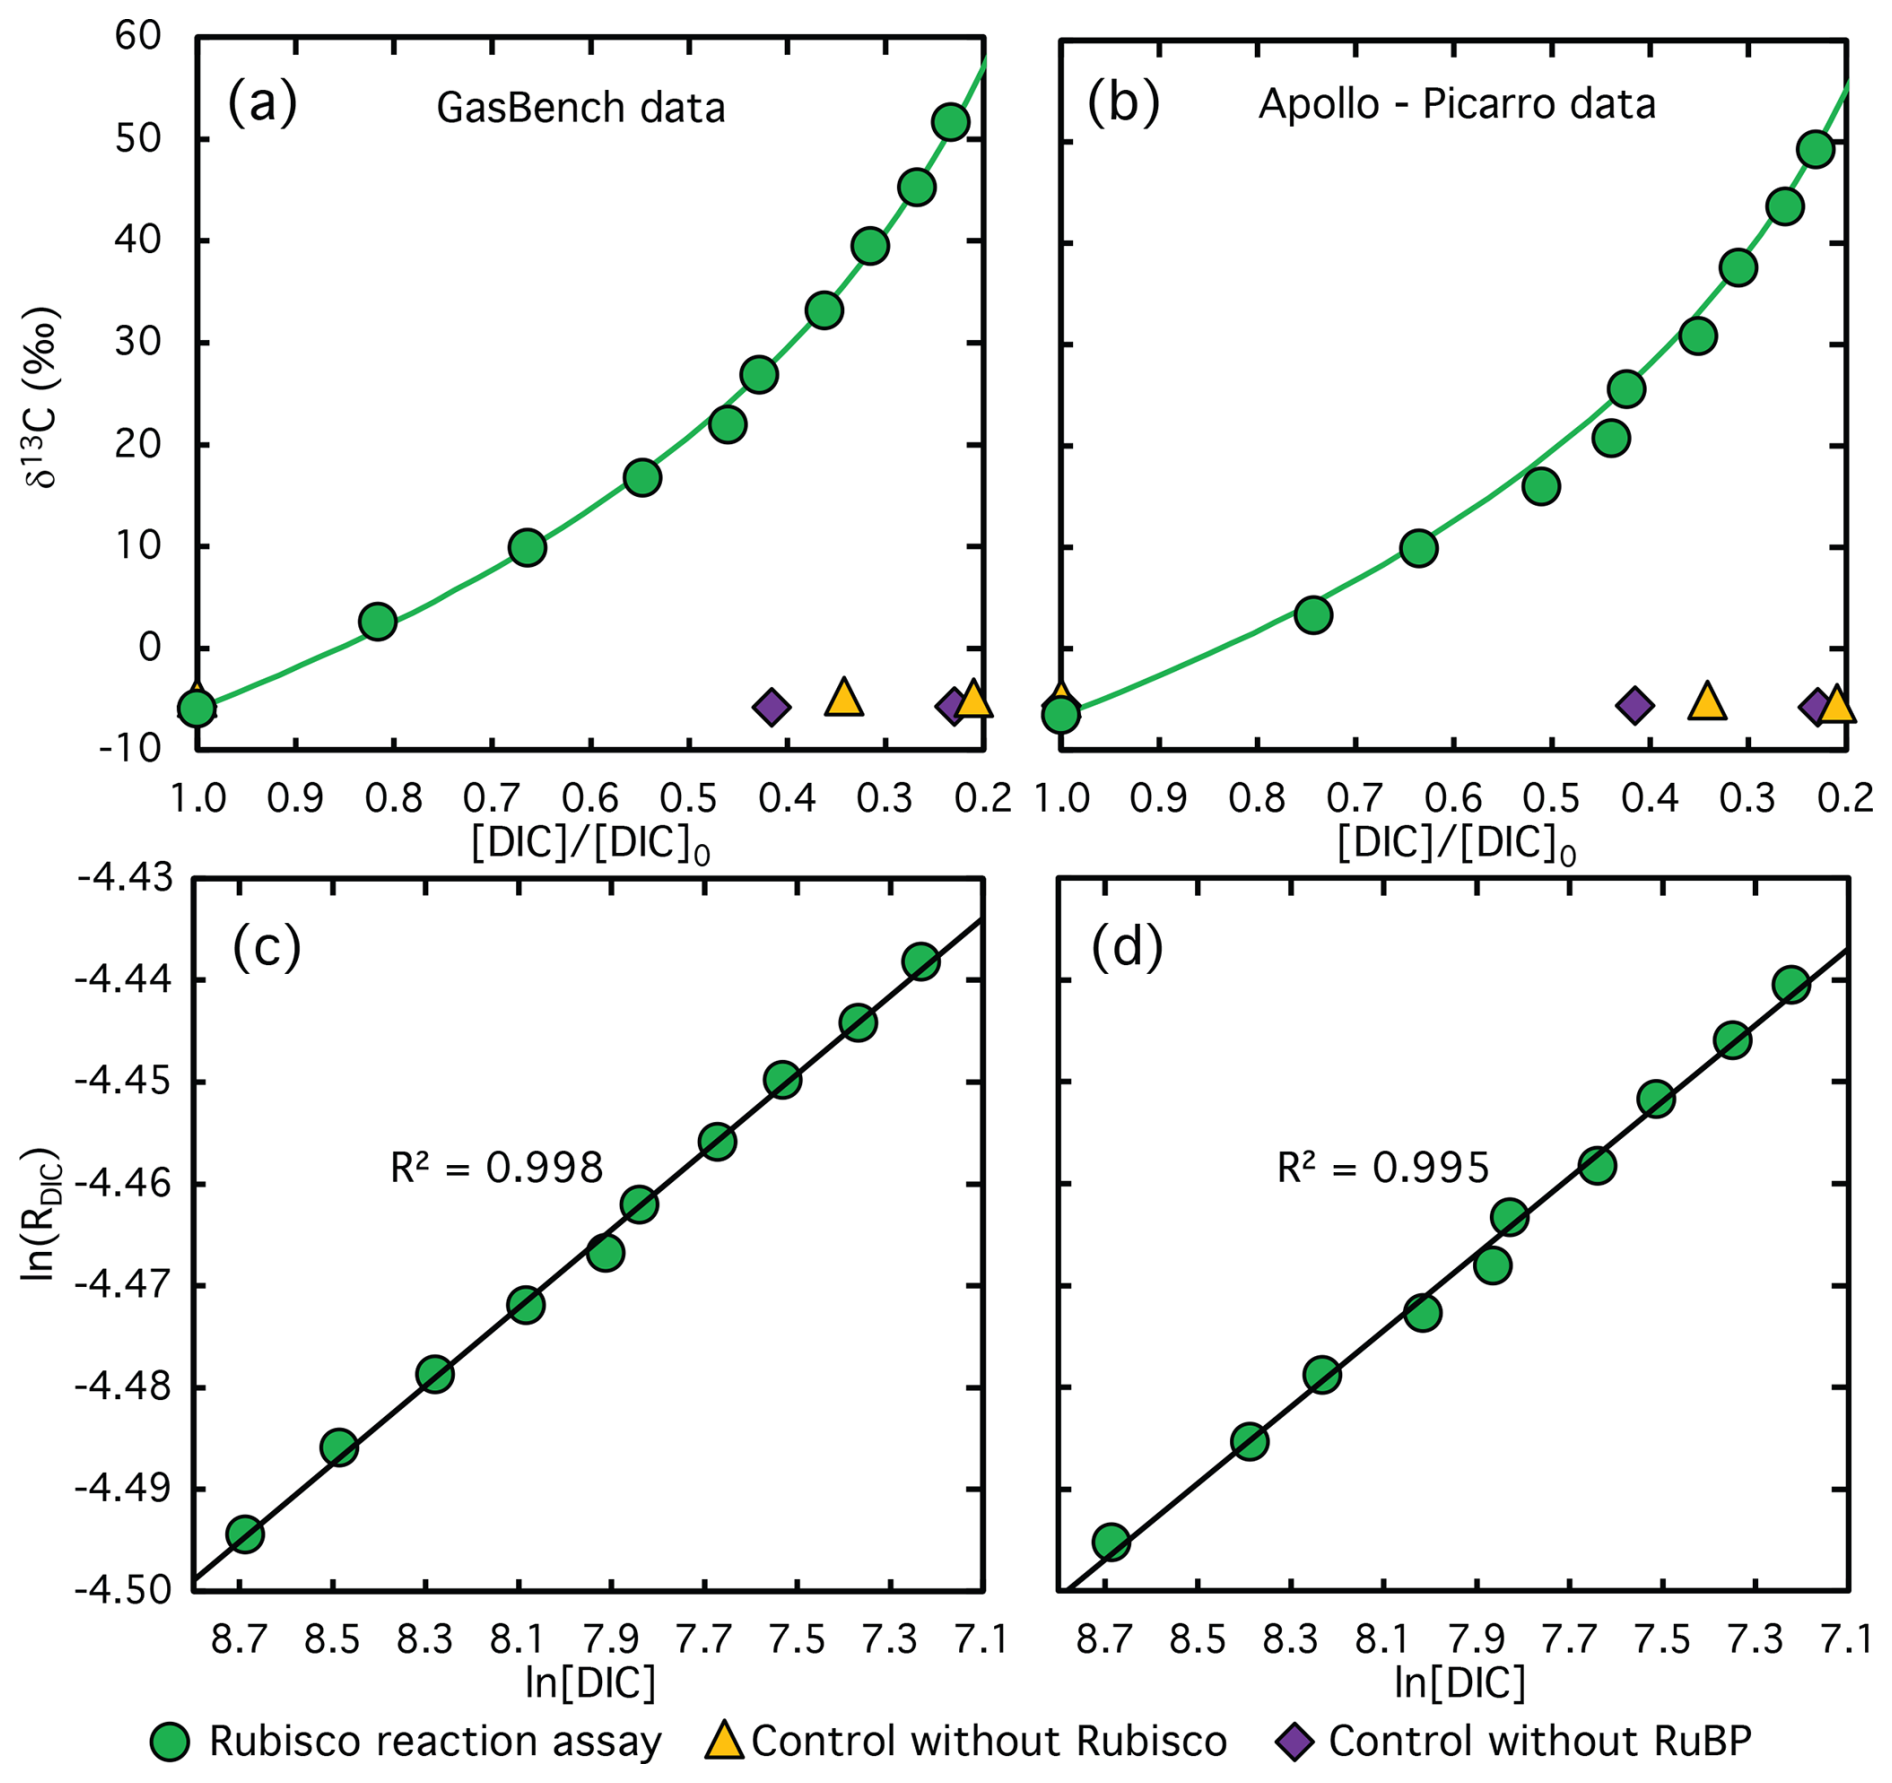
Figure 4Measured (symbols) and calculated (lines) δ13C values of DIC plotted against the remaining DIC fraction at different stages of the CO2 fixation reaction catalyzed by Rubisco from S. oleracea, using the GasBench system (a) and the Apollo-Picarro system (b). The corresponding logarithmically linearized plots with fitted lines used to calculate ϵRubisco values are shown in panels (c) and (d). Violet diamonds and yellow triangles indicate data from control experiments lacking RuBP and Rubisco extract, respectively. Note that no DIC was consumed in these control assays, the x-axis values reflect sampling time rather than the remaining DIC fraction, illustrating the stability of the carbon isotope composition over the course of the reaction.
Although the difference in ϵRubisco values between the isotope data obtained using the Apollo-Picarro system and the GasBench system is not statistically significant in the experiments presented here, the enrichment factors derived from the GasBench were consistently slightly higher than those from the Apollo-Picarro system (see Table 1). This discrepancy likely stems from differences in sample processing: samples analyzed using the GasBench were taken directly from the reaction assay, whereas those measured on the Apollo-Picarro system were first diluted with 2 mL of reaction buffer (110 mM EPPS) prior to injection to permit a larger injection volume, thereby improving measurement accuracy and precision. Despite pre-bubbling this buffer with N2 overnight, small amounts of DIC remained. We routinely measured the DIC content in the buffer and applied blank corrections to the concentration data. However, no correction could be applied to the isotope measurements, as the δ13C composition of the residual DIC was unknown. This DIC most likely originated from atmospheric CO2 and was therefore highly 13C-depleted relative to the reaction assay DIC pool, which became progressively enriched in δ13C as DIC was consumed. As a result, the introduction of trace DIC from the buffer into the increasingly δ13C-enriched assay sample led to a slight reduction in the measured δ13C values, causing a systematic underestimation of ϵRubisco values. This underscores the importance of thoroughly degassing all reaction buffers prior to use and continuously monitoring residual DIC levels throughout the experiment to ensure accurate isotope measurements.
Another potential source of discrepancy in ϵRubisco values between the Apollo-Picarro and GasBench systems arises from differences in reaction termination for concentration versus isotope measurements: GasBench samples are acidified instantaneously, whereas in the Apollo-Picarro acidification is delayed by approximately 3–4 min due to sample processing. Because DIC concentrations are measured on the Apollo-Picarro while isotopes are measured on the GasBench, this creates a temporal mismatch. We corrected for this by linear interpolation between the two nearest DIC measurements to estimate the DIC concentration at the time of isotope sampling. This correction is particularly critical during the initial phase of the reaction, when the rate of CO2 fixation is highest. Nonetheless, minor differences in sample handling and acidification dynamics may still contribute to small but systematic deviations in the ϵRubisco values derived from the two systems.
Our results demonstrate that the Apollo-Picarro system, which simultaneously measures DIC concentration and isotope composition, provides accurate and precise data. Isotope measurements from the GasBench system yielded essentially identical ϵRubisco values, confirming the reliability of the Apollo-Picarro results. While the GasBench was therefore not strictly necessary, we continued parallel analyses in subsequent experiments to provide independent validation and to serve as a backup in experiments where technical issues occurred with the Picarro. For completeness, ϵRubisco values from both systems are reported in Table 1.
Table 1Summary of total soluble protein ([Protein]) and Rubisco content ([Rubisco]), kinetic model parameters (vmax, kacc), and carbon isotope enrichment factors (ϵRubisco) for each reaction assay. Bold ϵRubisco values represent estimates compiled from all replicates using the Pitman estimator. Mean ϵRubisco value for fully purified S. oleracea is calculated from Replicates 2 and 3 only; Replicate 1 yielded insufficient data for a reliable estimate.
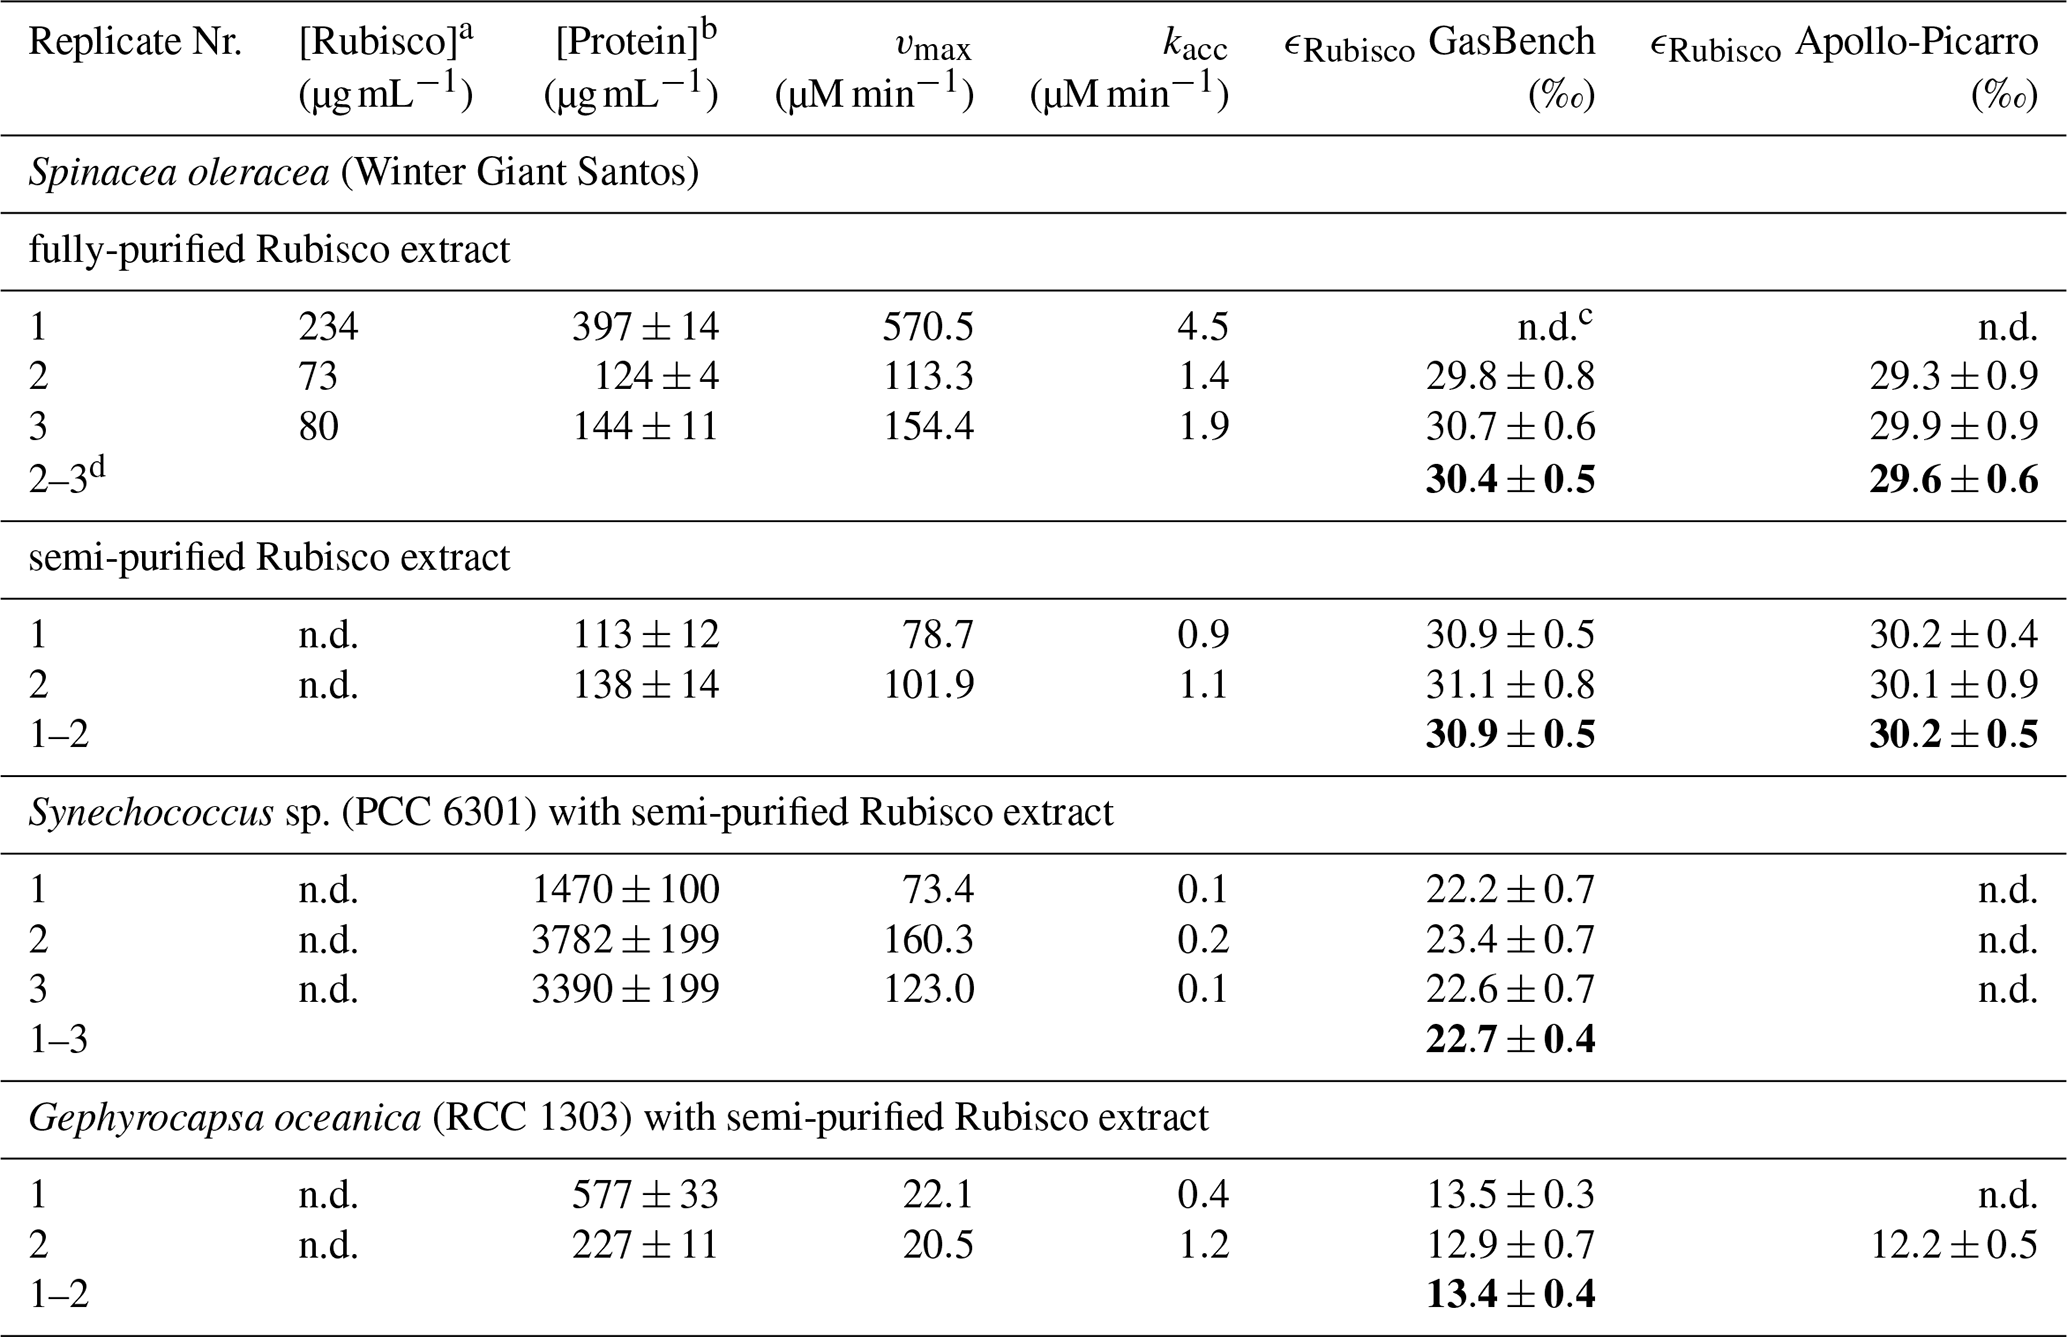
a active Rubisco concentration determined using the 14C-CABP binding method (Aguiló Nicolau et al., 2025). b Total protein concentration measured using the Bradford assay (Bradford, 1976). c n.d. = not determined. d Indicates which replicates were used to calculate ϵRubisco using the Pitman estimator.
3.4 Comparison of fully-purified and partially-purified Rubisco for isotope fractionation assays
While fully-purified Rubisco is ideal for in vitro isotope fractionation assays – ensuring that the observed isotopic fractionation arises solely from Rubisco activity – achieving such purity is technically demanding. The purification process is time-consuming, leads to substantial protein loss (see Sect. 3.1), and often compromises enzymatic activity. These challenges are manageable for S. oleracea, which is easy to cultivate and contains high Rubisco levels in its leaves, but they pose significant obstacles for organisms with lower cellular Rubisco content (Boller et al., 2011). To address this, we applied a simplified partial purification protocol (see Sect. 2) and conducted in vitro isotope fractionation assays using these extracts. In this section, we compare the results from partially-purified extracts with those obtained using fully-purified S. oleracea Rubisco (see previous section), in order to evaluate the reliability and limitations of using less purified enzyme preparations.
The reaction dynamics of in vitro CO2 fixation catalyzed by semi-purified Rubisco closely matched those observed with fully-purified Rubisco, as shown in Fig. 2b. Although reaction rates were slightly slower, they remained within a comparable range, as reflected in the fitted vmax values in Table 1. Model-derived product inhibitor accumulation rates were also marginally lower, likely reflecting the lower Rubisco concentration in the semi-purified assay, consistent with its reduced total protein content (Table 1). The decrease in DIC concentration during CO2 fixation was accompanied by substantial 13C enrichment in the residual DIC pool (Fig. A1), with δ13C values increasing by up to +60 ‰ at 78 % substrate conversion. The resulting ϵRubisco was 30.6 ± 0.3 ‰, based on the average of values obtained from GasBench and Apollo-Picarro measurements. This is statistically indistinguishable (p>0.05) from the value derived using fully-purified Rubisco ( ‰). A summary of these results is presented in Table 1, and the comparison is visualized in Fig. 5, which shows a log-log plot of δ13C versus remaining DIC concentration for all replicates from both purification methods.
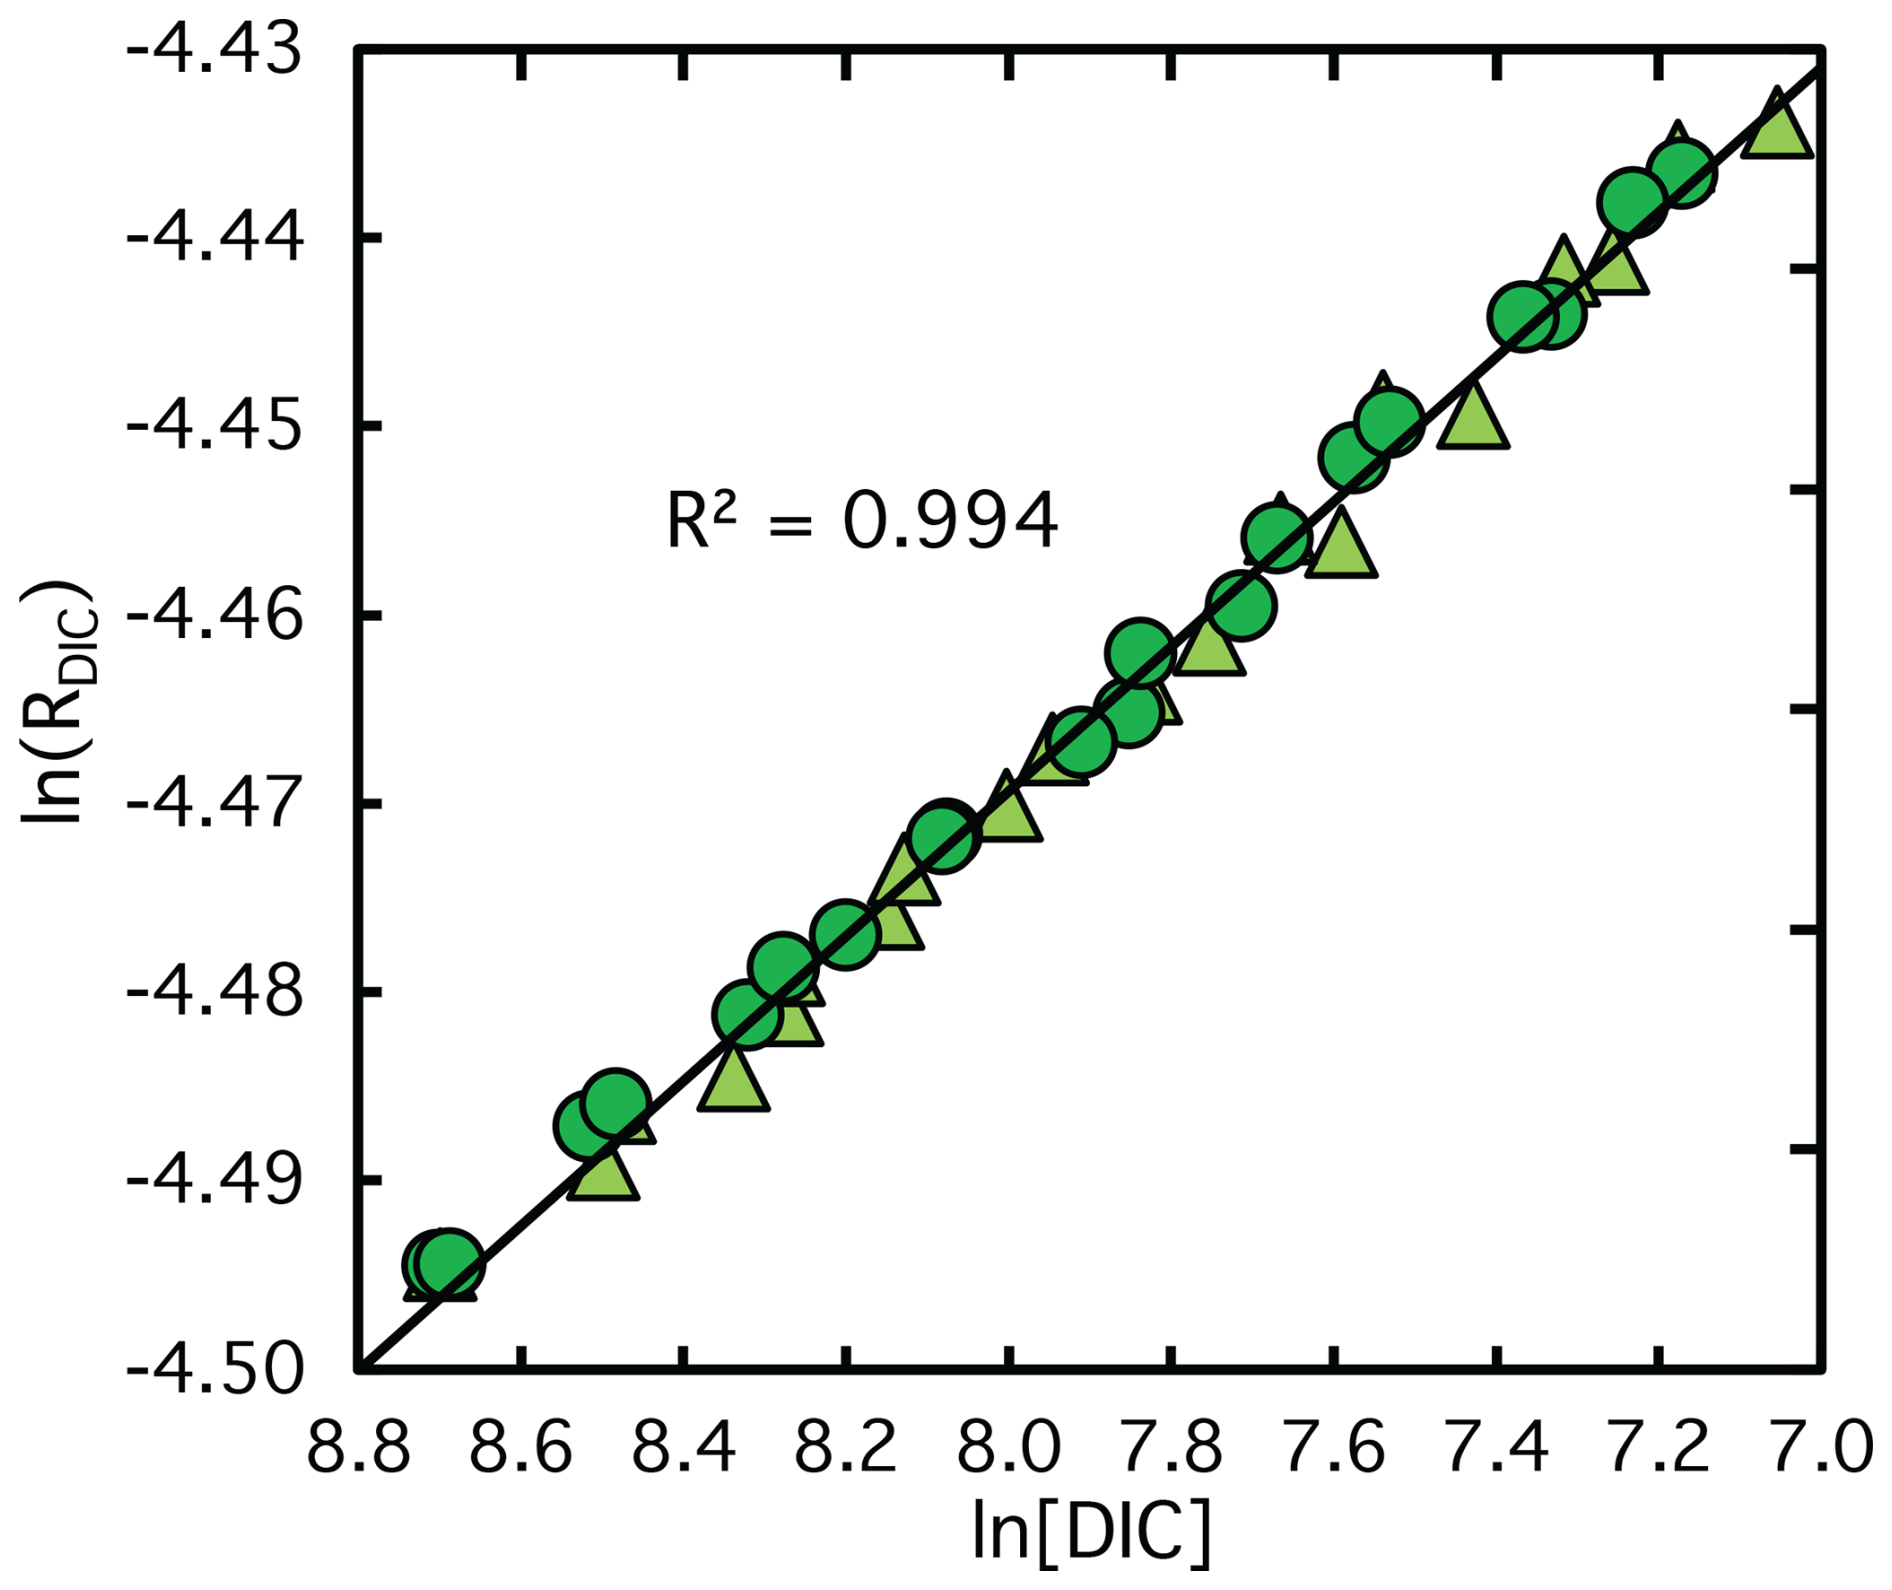
Figure 5Log–log plot of the carbon isotope ratio (lnRDIC) versus the natural logarithm of the remaining DIC concentration during CO2 fixation catalyzed by Rubisco from semi-purified (light green triangles) and fully-purified (green circles) S. oleracea. Data represent all replicate experiments. Linear regressions indicate no significant difference in isotope fractionation between the semi-purified and fully-purified Rubisco extracts.
These results demonstrate that Rubisco does not need to be fully-purified using a lengthy, labor-intensive protocol. Instead, accurate and precise isotopic fractionation factors (ϵRubisco) can be reliably obtained using a simple, rapid, and user-friendly partial purification method. However, to ensure that the observed isotope fractionation arises solely from Rubisco activity, rigorous control experiments must accompany each assay. We recommend two types of controls. First, for each newly prepared Rubisco extract and reaction setup, a control assay should be performed under identical conditions but without the addition of RuBP. This control ensures that no other enzymes in the extract are consuming DIC independently of RuBP, which could otherwise alter the δ13C of the DIC pool. Second, when freshly synthesized RuBP is used, an additional control should be conducted to rule out any influence of impurities introduced during RuBP synthesis on either DIC concentration or δ13C values. These precautions are critical for validating that the measured isotopic fractionation exclusively reflects the Rubisco-catalyzed carboxylation reaction. In our experiments with semi-purified Rubisco, control assays showed no DIC depletion (Fig. 2b) and no change in δ13C over time (Fig. A1).
The fact that Rubisco only requires partial purification – thereby avoiding the substantial biomass demands and activity losses associated with full purification – enabled us to apply the established protocol to determine the δ13C enrichment factor in additional species with lower cellular Rubisco content than S. oleracea, as demonstrated in the following section. Nevertheless, given potential differences in cellular composition and metabolite background among taxa, careful validation through appropriate controls remains essential, and the broader applicability of the method should be verified on a species-by-species basis.
3.5 Application of isotope fractionation measurement to non-model Rubisco enzymes
Using the improved methodology developed here, we determined two additional ϵRubisco values to test its applicability to phylogenetically diverse species beyond the model plant S. oleracea. To this end, we selected two aquatic microorganisms: Synechococcus sp., representing cyanobacteria, and G. oceanica, a coccolithophore.
The results showed that Rubisco from G. oceanica exhibited significantly lower CO2 fixation rates, whereas Rubisco from Synechococcus sp. performed comparably to S. oleracea, as shown in Fig. 2c and d and the corresponding vmax values in Table 1. Despite the lower reaction rates, substantially higher amounts of total soluble protein were required in both assays (Table 1), reflecting the relatively low cellular Rubisco abundance in these species compared to S. oleracea (Losh et al., 2013).
In addition, our kinetic model accurately reproduced the experimentally observed DIC depletion for Rubisco from G. oceanica and Synechococcus sp., with RMS errors of 0.06 ± 0.03 mM and 0.05 ± 0.01 mM, respectively (blue and red line in Fig. 2b and c), consistent with the results obtained for S. oleracea. Yet, Rubisco from these two species appeared less susceptible to product inhibition. For G. oceanica, the rate of inhibitory by-product accumulation was comparable to that in S. oleracea (see Table 1); however, unlike the Form IB Rubisco of S. oleracea and Synechococcus, the inhibitory constant used for G. oceanica was taken from a Form ID Rubisco – specifically that of Galdieria sulphuraria – and is nearly 20 times higher (Pearce, 2006). This suggests that the effective inhibitor is much weaker, likely explaining the reduced inhibition. In contrast, for Synechococcus sp., the observed accumulation rates of the inhibitory by-product XBP were very low (see Table 1), consistent with previous reports (Pearce, 2006), and likely account for the minimal inhibition observed in our assays. Indeed, earlier studies indicate that such by-products are generally non-inhibitory under substrate-saturated conditions in Synechococcus and other Rubisco forms, including Form ID (Pearce, 2006). Additional mechanisms, such as enhanced inhibitor release (Pearce, 2006), may mitigate inhibition. Although the mild inhibition detected in our Synechococcus sp. and G. oceanica assays cannot be fully explained, it may reflect a gradual decline from CO2-saturated conditions as the reactions progressed.
The reduced sensitivity to product inhibition (in addition to higher kcat values) in these Rubisco forms allowed us to perform assays with smaller amounts of extracted Rubisco compared to S. oleracea, while still achieving sufficient DIC depletion without substantial slowing of the reaction. However, in some cases, the reaction times extended considerably, lasting up to 12 h (see Fig. 2c).
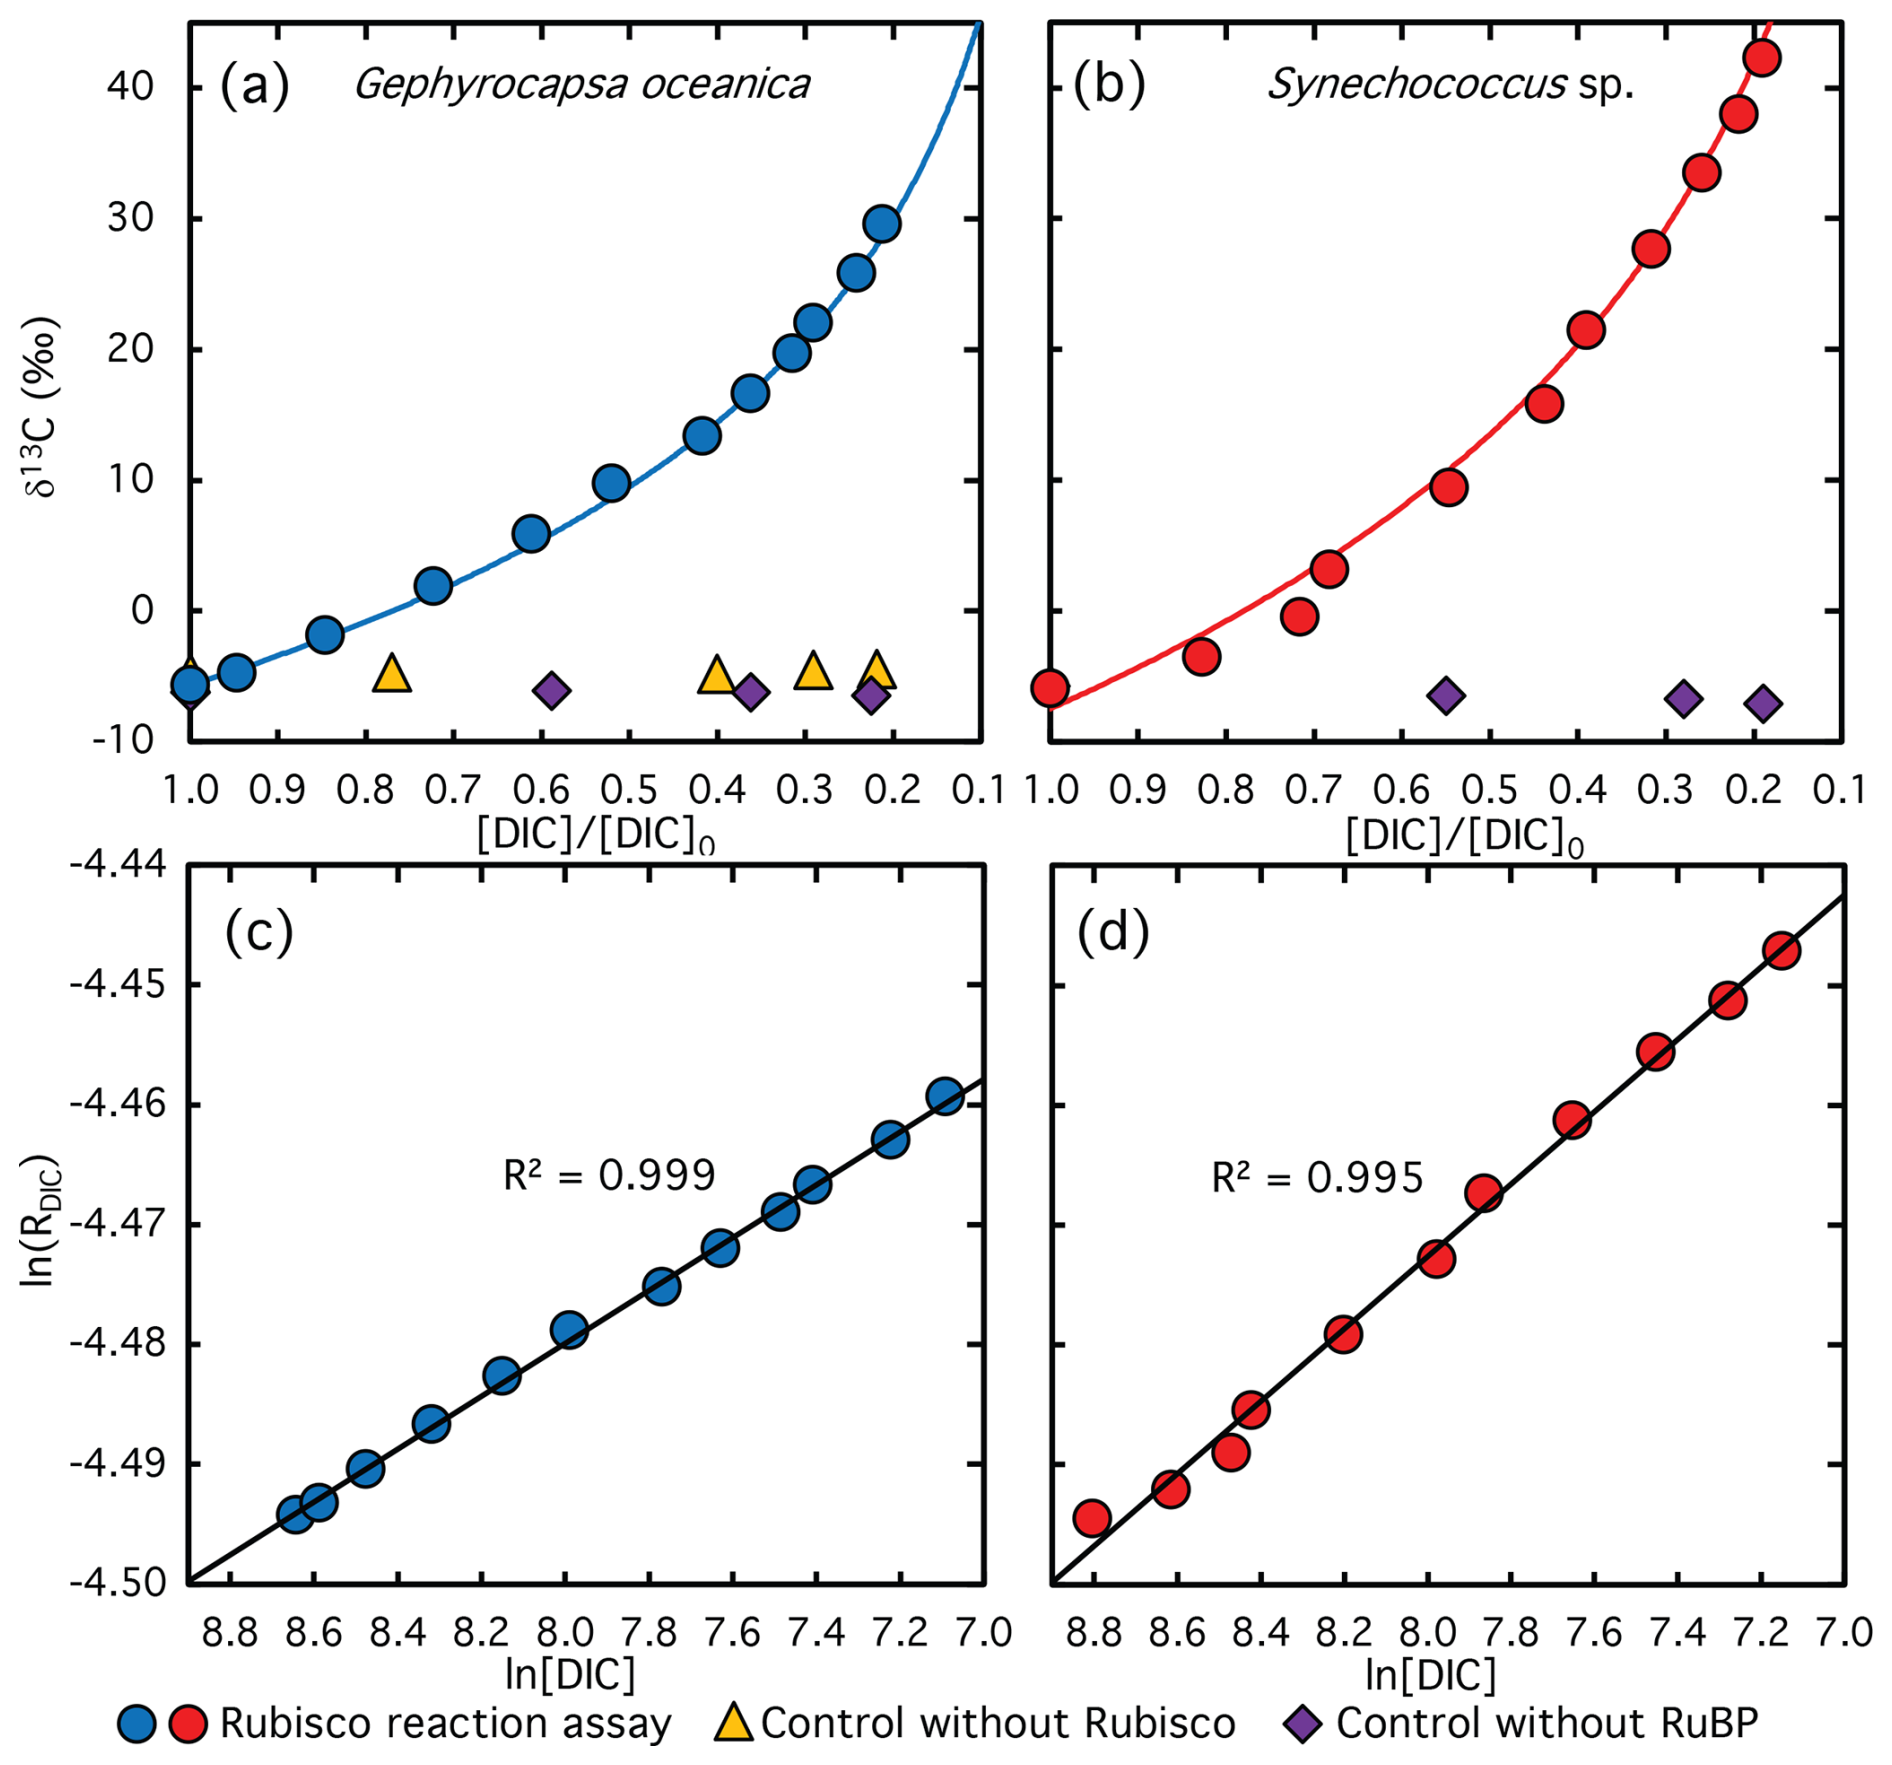
Figure 6Measured (symbols) and calculated (lines) δ13C values of DIC plotted against the remaining DIC fraction during CO2 fixation catalyzed by Rubisco from G. oceanica (a) and Synechococcus sp. The corresponding logarithmically linearized plots with fitted lines used to calculate ϵRubisco values are shown in panels (c) and (d). Violet diamonds and yellow triangles indicate data from control experiments lacking RuBP and Rubisco extract, respectively. Note that no DIC was consumed in these control assays, the x-axis values reflect sampling time rather than the remaining DIC fraction, illustrating the stability of the carbon isotope composition over the course of the reaction.
The carbon isotope signature of DIC during the reaction assays with G. oceanica and Synechococcus sp. Rubisco is shown as a function of the remaining DIC fraction in Fig. 6a and b, respectively. The corresponding logarithmically linearized plots are presented in Fig. 6c and d and exhibit strong linear correlations (R2>0.99). Rubisco from G. oceanica was associated with only moderate 13C enrichment, with δ13C values increasing by up to +35 ‰ at 79 % substrate conversion. This led to an ϵRubisco value of 13.1±0.3 ‰ (average of Apollo-Picarrro and GasBench values), which is significantly lower than that of S. oleracea Rubisco, but falls within a similar range as the low fractionation reported for the coccolithophore Emiliania huxleyi (11.1 ‰; 95 % CI: 9.8 ‰–12.6 ‰) (Boller et al., 2011). In contrast, the assay with Synechococcus sp. Rubisco exhibited substantially higher 13C enrichment, resulting in an ϵRubisco value of 22.7±0.4 ‰. This value is several ‰ lower than that of S. oleracea Rubisco but virtually identical to previously reported values for Synechococcus sp. Rubisco (22.0 ‰) (Guy et al., 1993).
Due to the high protein concentrations in these reaction assays, we encountered technical challenges in measuring DIC concentration and isotope composition using the Apollo-Picarro system. Upon injection, proteins in the DIC samples are denatured in the acidification chamber. This denaturation exposes hydrophobic regions of the proteins, which act as surfactants, adsorbing at air–water interfaces, reducing surface tension, and stabilizing foam (Delahaije and Wierenga, 2022). As a result, this foam is subsequently carried into the transfer lines of the Picarro system, disrupting gas flow making accurate measurements impossible. To mitigate this issue, we introduced an additional filtration step for G. oceanica and Synechococcus sp. Rubisco assays taking care to minimize the samples exposure to air. Specifically, samples were filtered using a 50 kDa Amicon Ultra-4 centrifugal filter unit (UFC8010, Merck, USA), effectively removing a substantial portion of the proteins from the DIC solution prior to injection. To confirm that this filtration step did not alter DIC concentration or isotope composition, we performed test experiments using S. oleracea with and without the centrifugation step and determined the corresponding ϵRubisco values. No significant differences were observed (p>0.05, data not shown).
3.6 Isotopic fractionation, specificity, and evolutionary constraints
Form IB Rubisco of higher plants and Synechococcus sp., has the largest number of determinations of ϵRubisco of any Rubisco form (4 taxa; Fig. 7) and define a range from 22.7 ‰ to 30 ‰; our new result from coccolithophore G. oceanica provides a third determination for form 1D Rubisco and underscores the significantly lower Rubisco fractionation of coccolithophores and diatoms (11.1 ‰ to 18.5 ‰). Transition state theory of Rubisco carboxylation suggests that isotopic fractionation correlates positively with enzyme specificity (Sc/o) (Tcherkez et al., 2006). Because both CO2 and O2 are relatively featureless, selectivity is thought to arise in the transition state (Tcherkez et al., 2006). Variations in the transition state affect both Rubisco’s selectivity and its isotopic fractionation, because more product-like carboxylation transition states, which correspond to higher specificity, feature shorter O-C bond lengths to the C-2 atom of RuBP. These shorter bonds are higher in energy and vibrational frequency, leading to larger kinetic isotope effects (Tcherkez et al., 2006; Tcherkez and Farquhar, 2005).
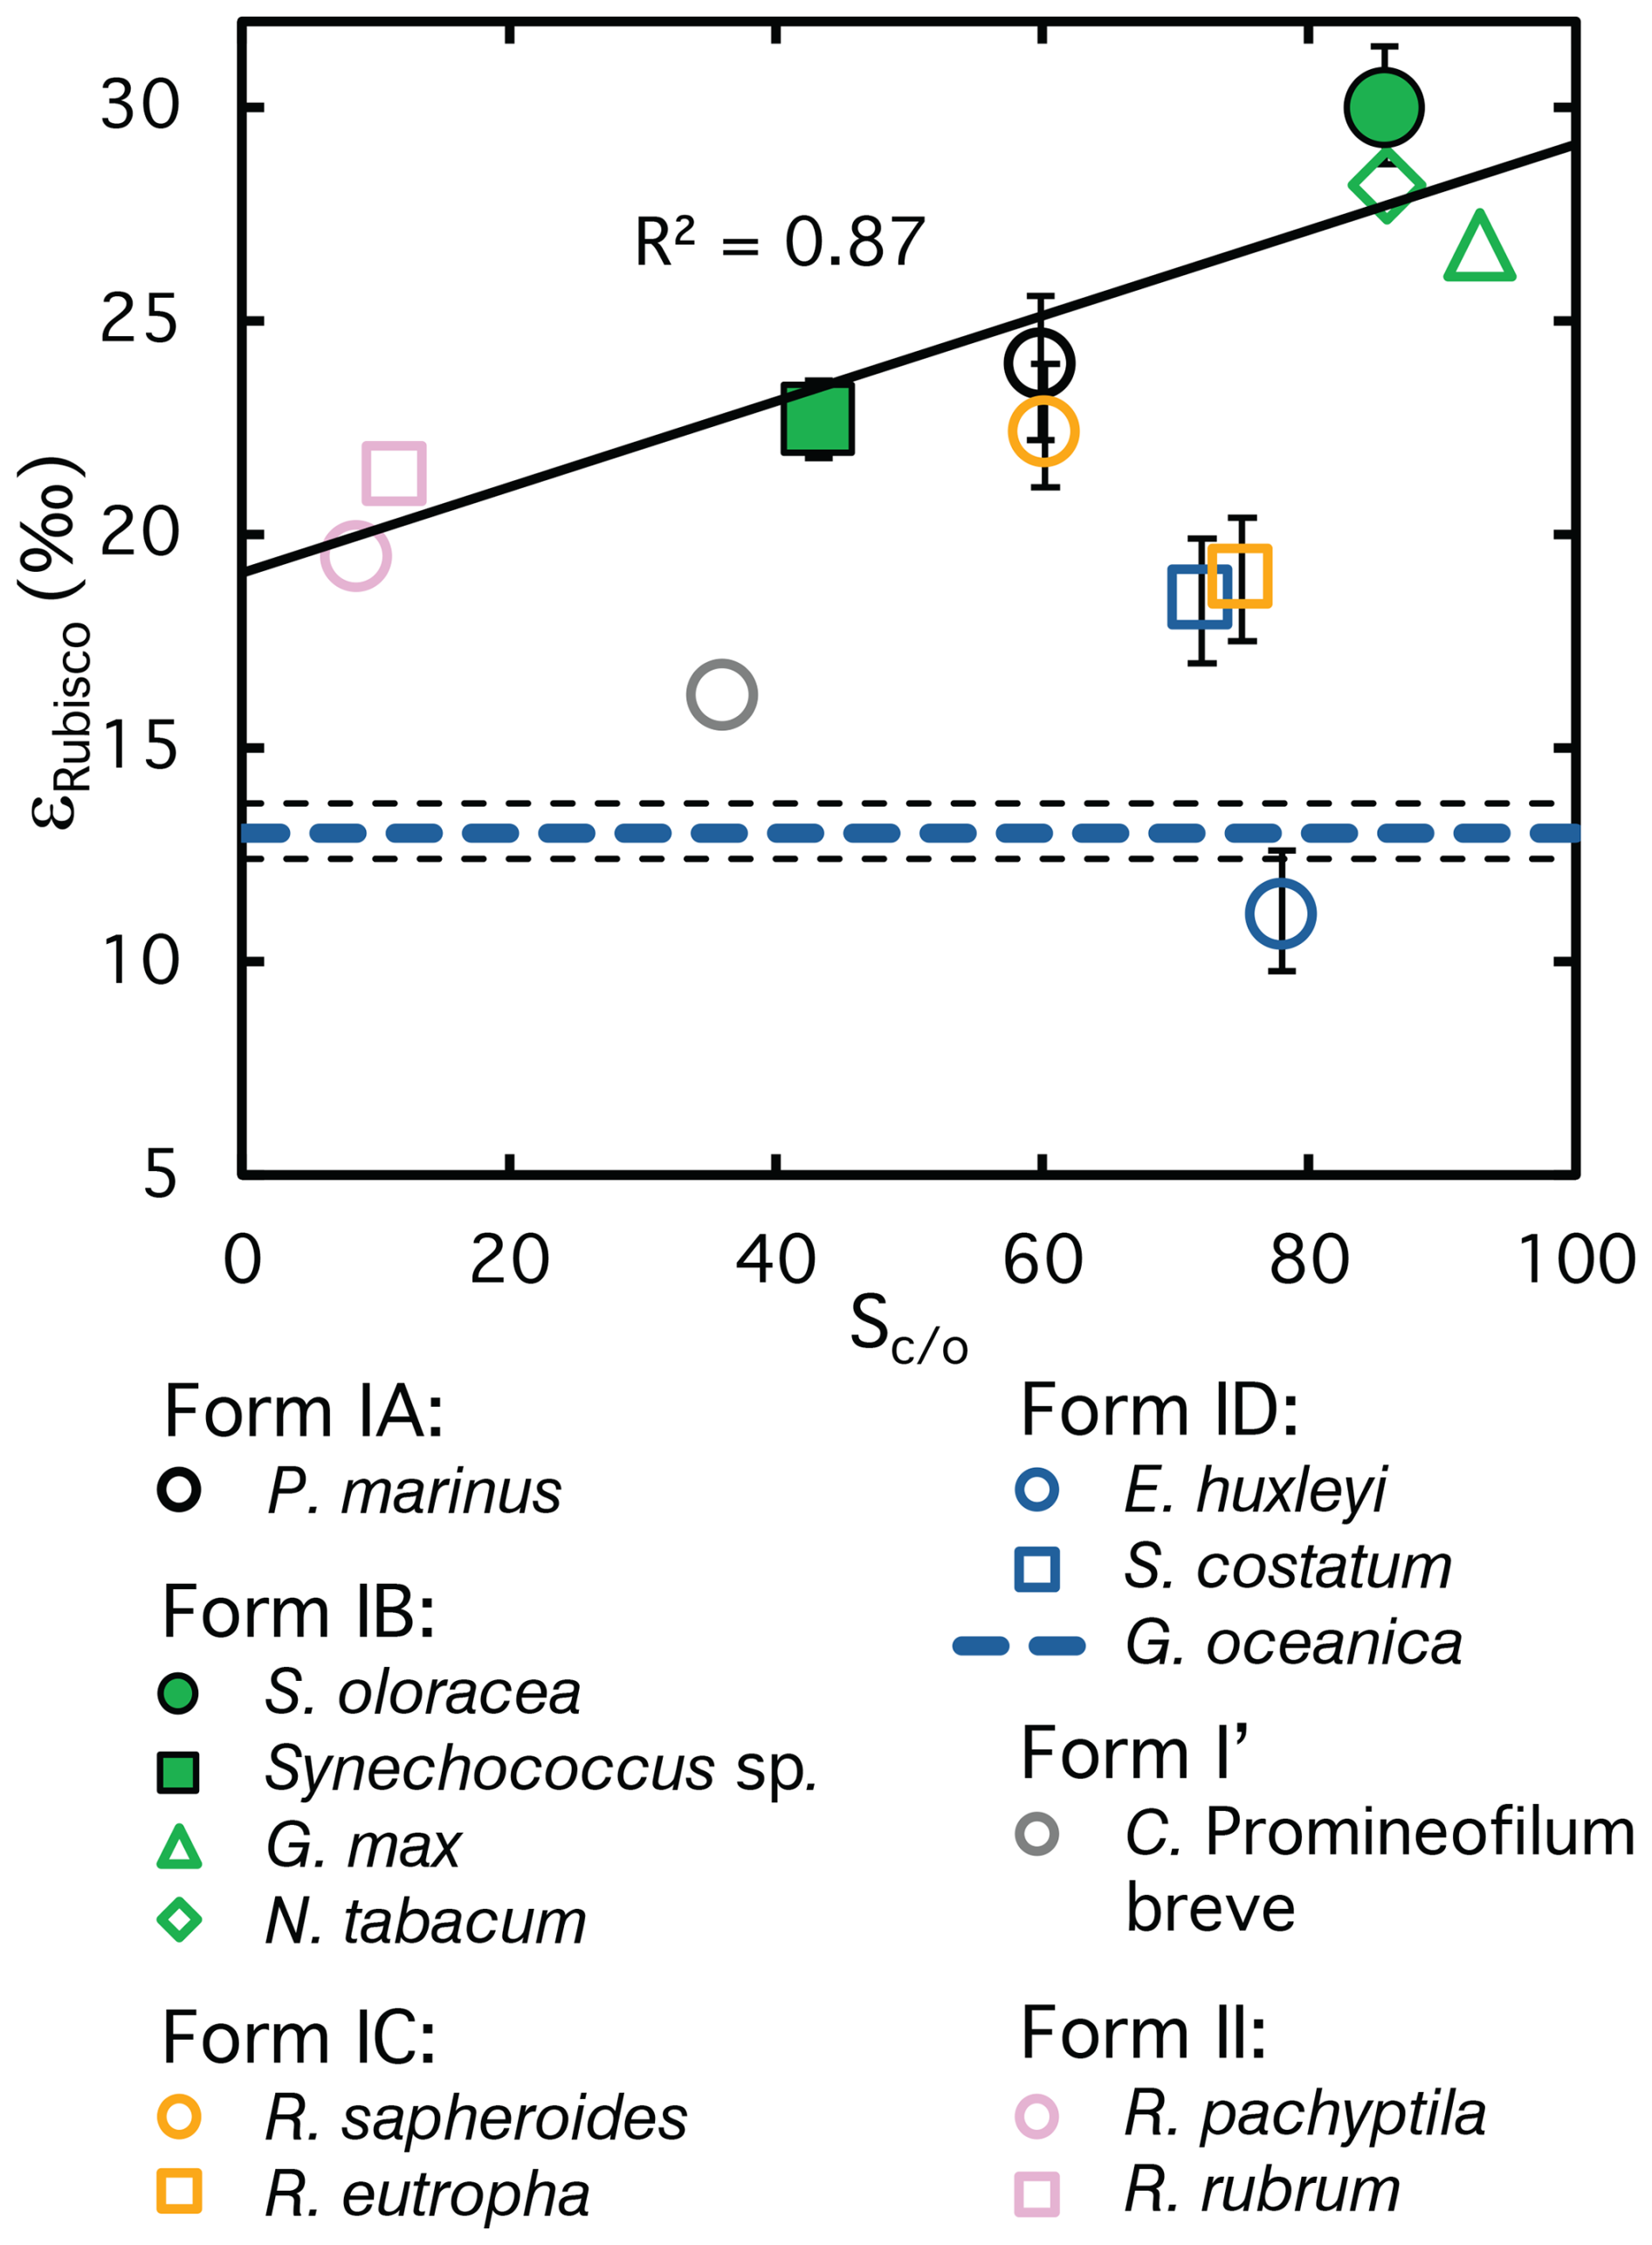
Figure 7Isotope fractionation (ϵRubisco) versus CO2/O2 selectivity (Sc/o) of Rubisco for species where both parameters have been reported. A positive correlation is evident for Forms IA, IB, and II, which fall along a common trend line, suggesting that ϵRubisco and Sc/o may be linked in these groups. By contrast, Forms IC and ID deviate from this relationship, indicating that no universal correlation exists across all Rubisco lineages. Error bars represent 95 % confidence intervals where available. Full symbols highlight the ϵRubisco values measured in this study. The coccolithophore G. oceanica, for which Sc/o is unknown, is represented by a dashed line ±95 % confidence interval. References for ϵRubisco and Sc/o are listed in Table A1.
Across the limited dataset where both parameters have been measured, a positive correlation between ϵRubisco and Sc/o has indeed been observed, most clearly for Form IB Rubiscos, with the few available data for Forms IA and II appearing to follow the same trend (Fig. 7, Table A1). However, Forms ID Rubisco, deviates from this pattern. The lower ϵRubisco range of diatoms and coccolithophores does not correspond to lower Sc/o compared to Form IB Rubisco, and G. oceanica – for which no published Sc/o data exist – exhibits such a low ϵRubisco that even with a correspondingly low specificity it would fall outside the broader trend defined by Form IB, IA, and II (Fig. 7, dashed line, Table A1). As more measurements accumulate across phylogenetically diverse Rubisco families, it is becoming increasingly clear that no universal correlation exists between isotopic fractionation and specificity. Instead, different Rubisco lineages may follow distinct evolutionary trajectories, with isotope effects shaped by lineage-specific structural and mechanistic constraints. Recent studies that explicitly compare Rubisco kinetic properties with evolutionary origin support this interpretation, whereas other work suggests that phylogenetic effects may play a secondary role relative to biochemical constraints (Bouvier et al., 2021; Tcherkez and Farquhar, 2021; Bouvier and Kelly, 2023). We note that additional biochemical and kinetic mechanisms affecting ϵRubisco have been proposed (e.g., Tcherkez, 2013; Tcherkez et al., 2013; Bathellier et al., 2020), and a full evaluation of these hypotheses – including measurements of oxygen kinetic isotope effects – should be considered in future studies.
These observations highlight the need to expand the dataset of ϵRubisco values beyond the handful of land plants and model organisms studied to date. Progress in this area has long been constrained by technical and experimental challenges, but our protocol now offers a rapid, reliable, and broadly applicable means of determining fractionation factors across diverse lineages, including those that dominate the geological record. With this approach, it becomes possible to test whether family-specific correlations between ϵRubisco and Sc/o exist, and to systematically examine the role of environmental variables such as temperature, which strongly modulates Sc/o in higher plants (Galmés et al., 2015, 2016). Finally, these advances will also clarify how variation in ϵRubisco translates into lineage- and environment-specific isotopic “signatures” preserved in the sedimentary archive, providing a stronger foundation for interpreting the carbon isotope record.
In summary, we show that Rubisco isotopic fractionation factors can be measured with high accuracy and precision using a simple and rapid partial purification protocol, provided that appropriate controls are included. A newly developed kinetic model, which accounts for inhibition by side products, further strengthens experimental design by guiding the choice of enzyme concentration and sampling schedule, ensuring both high CO2 fixation and reliable ϵRubisco estimates. The isotope measurements obtained with the GasBench system yielded essentially the same ϵRubisco values as the Apollo-Picarro system, confirming the reliability of the latter. Because the Apollo–Picarro simultaneously measures DIC concentration and isotope composition, it provides a simple and cost-effective means of obtaining robust isotope fractionation factors. Moreover, our method enables reliable determination of ϵRubisco across a phylogenetically broad set of species, including those with relatively low cellular Rubisco content. The resulting ϵRubisco values are both precise and accurate, and they align well with previously published estimates for the same or closely related taxa. Even with only three species tested, we captured a wide range of ϵRubisco (13.1 ‰–30 ‰), nearly spanning the full spectrum reported in the literature (11.1 ‰–30.0 ‰) (Boller et al., 2011; Guy et al., 1993). This range underscores the versatility of our approach for probing Rubisco fractionation across diverse lineages.
Together, these advances provide a foundation for expanding ϵRubisco measurements across taxa, opening the way to new insights into the mechanistic basis of isotope discrimination and strengthening the use of carbon isotope records as tracers of biological and environmental change in Earth’s history.
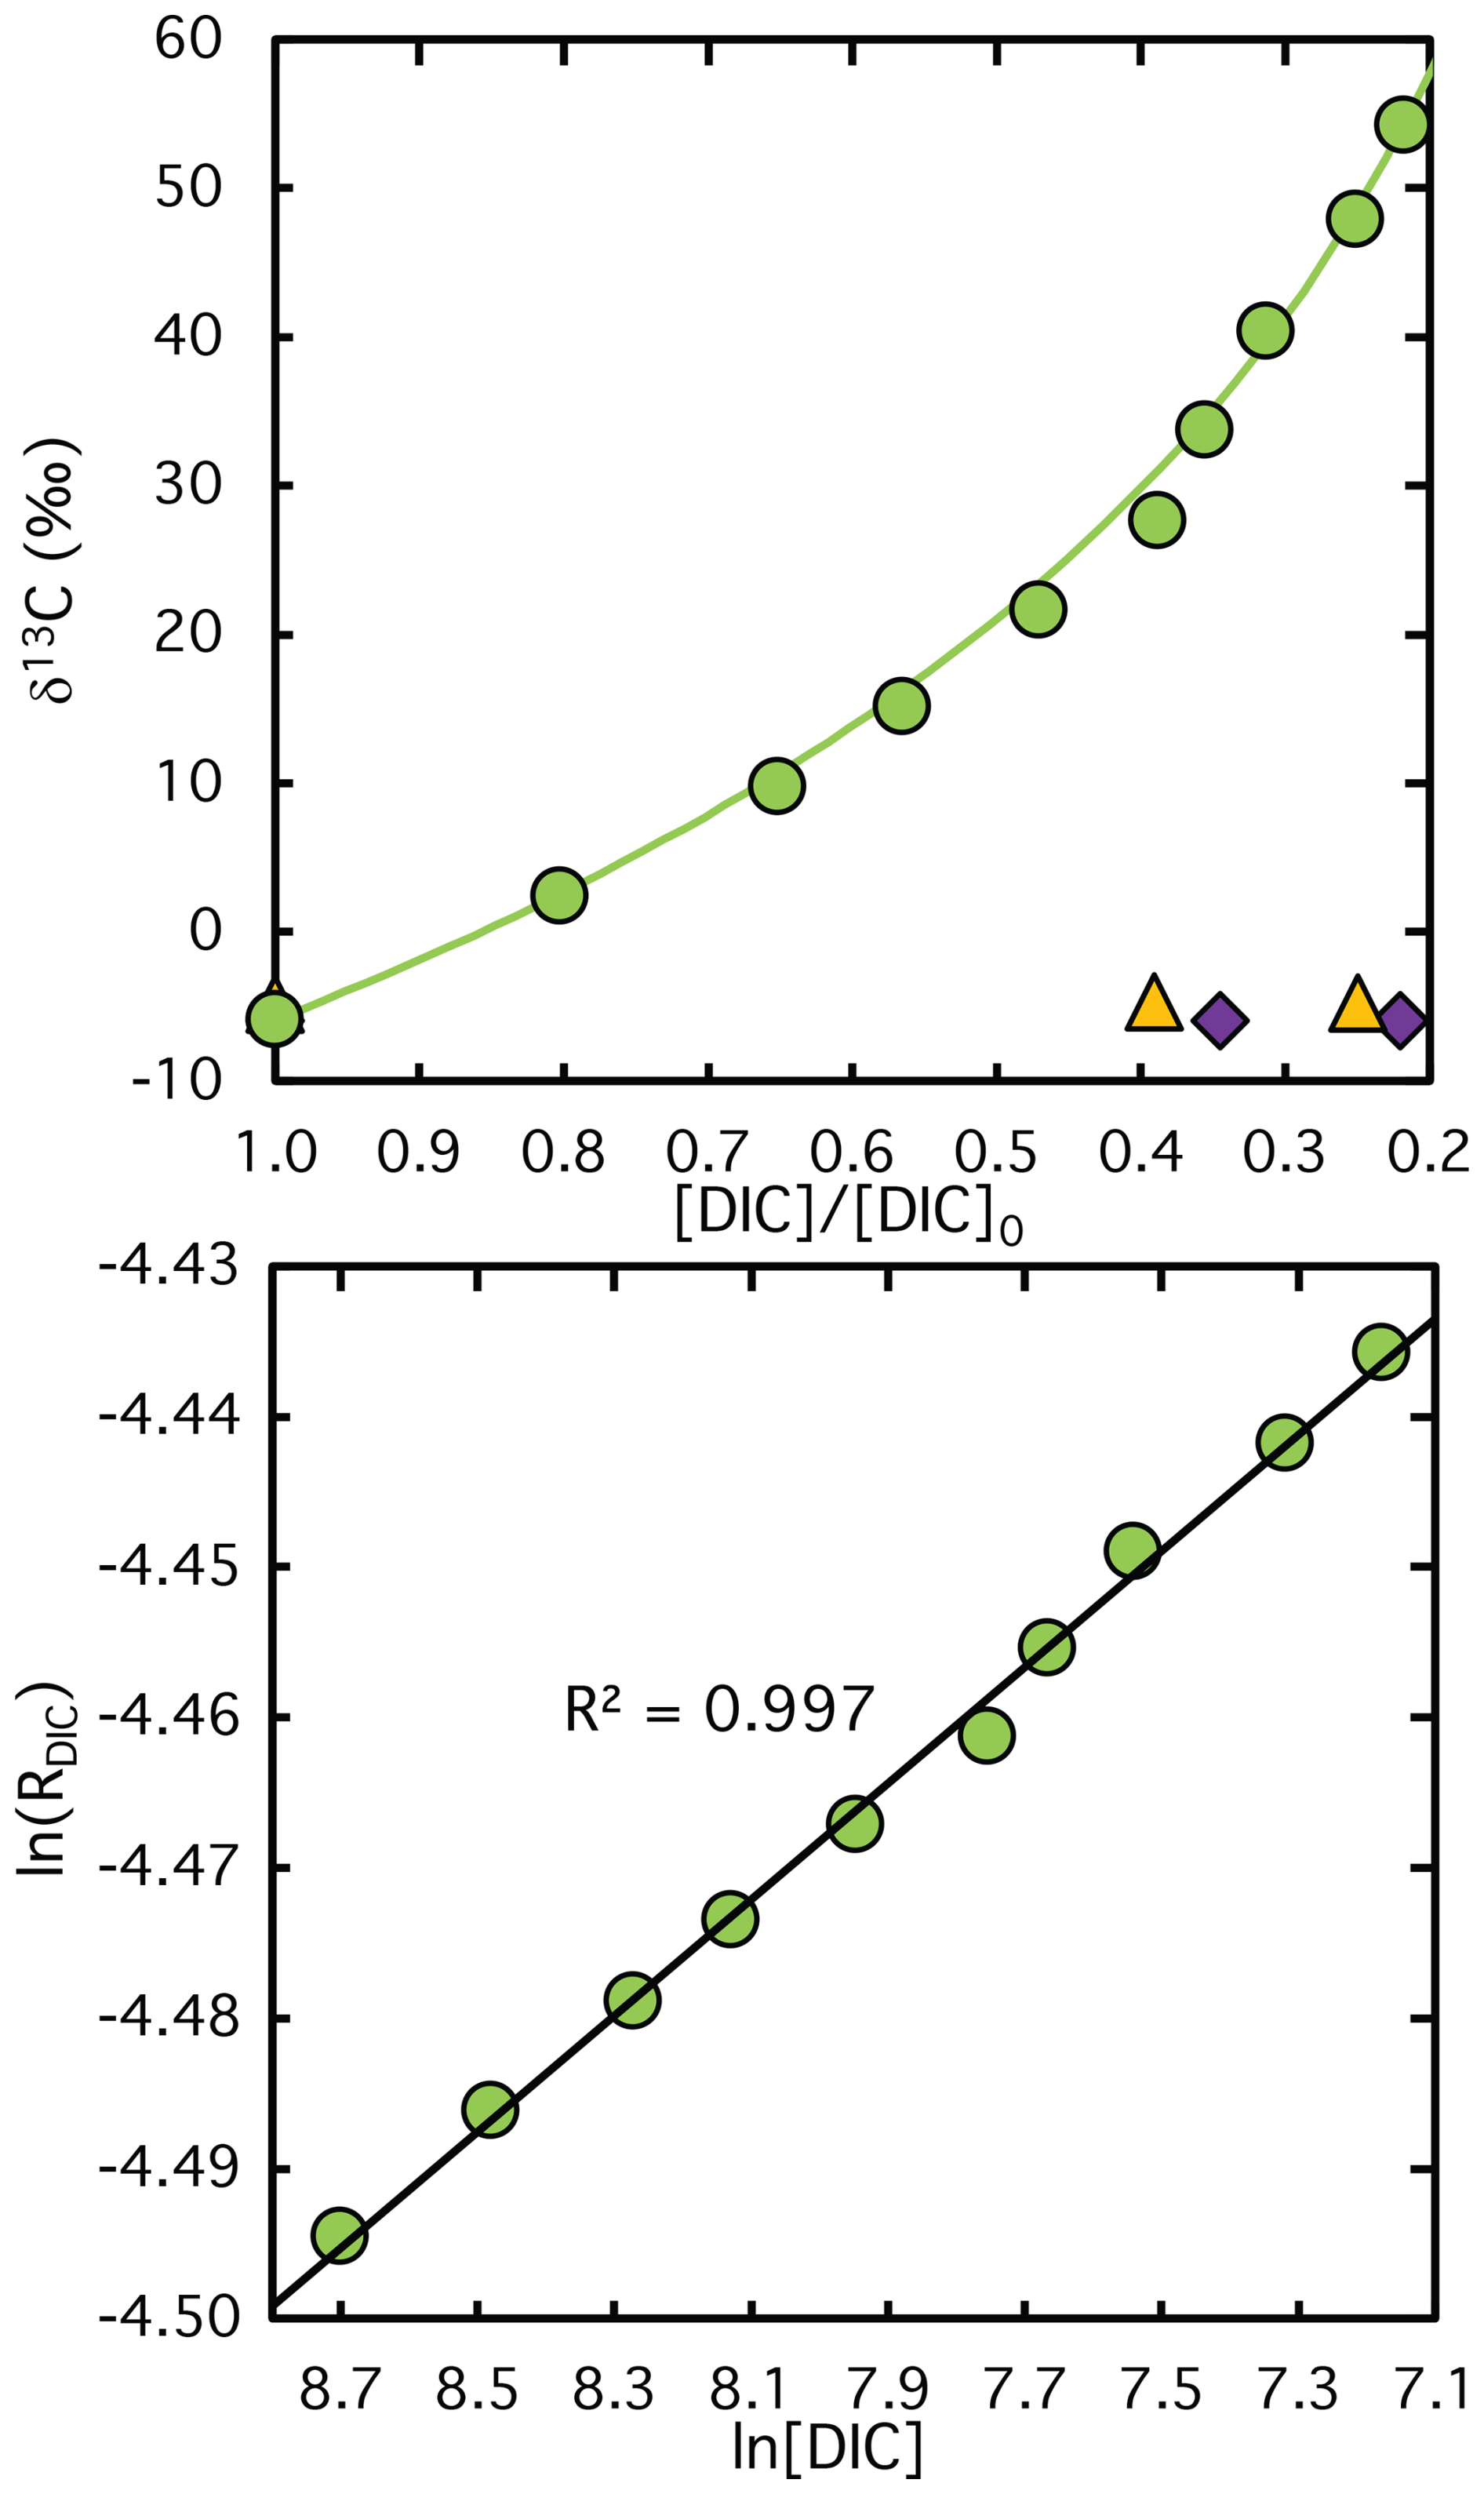
Figure A1Measured (symbols) and calculated (lines) δ13C values of DIC plotted against the remaining DIC fraction during CO2 fixation catalyzed by Rubisco from semi-purified S. oleracea extract. The corresponding logarithmically linearized plots with fitted lines used to calculate ϵRubisco values are shown in the lower panel. Violet diamonds and yellow triangles indicate data from control experiments lacking RuBP and Rubisco extract, respectively. Note that no DIC was consumed in these control assays, the x-axis values reflect sampling time rather than the remaining DIC fraction, illustrating the stability of the carbon isotope composition over the course of the reaction.
Table A1Compilation of ϵRubisco and Sc/o values for species where both parameters have been reported, along with corresponding references. Sc/o values from Iñiguez et al. (2020) represent averages calculated from multiple studies listed and cited therein. To the best of our knowledge, this compilation includes all published ϵRubisco values for which corresponding measurements are available at the time of writing.
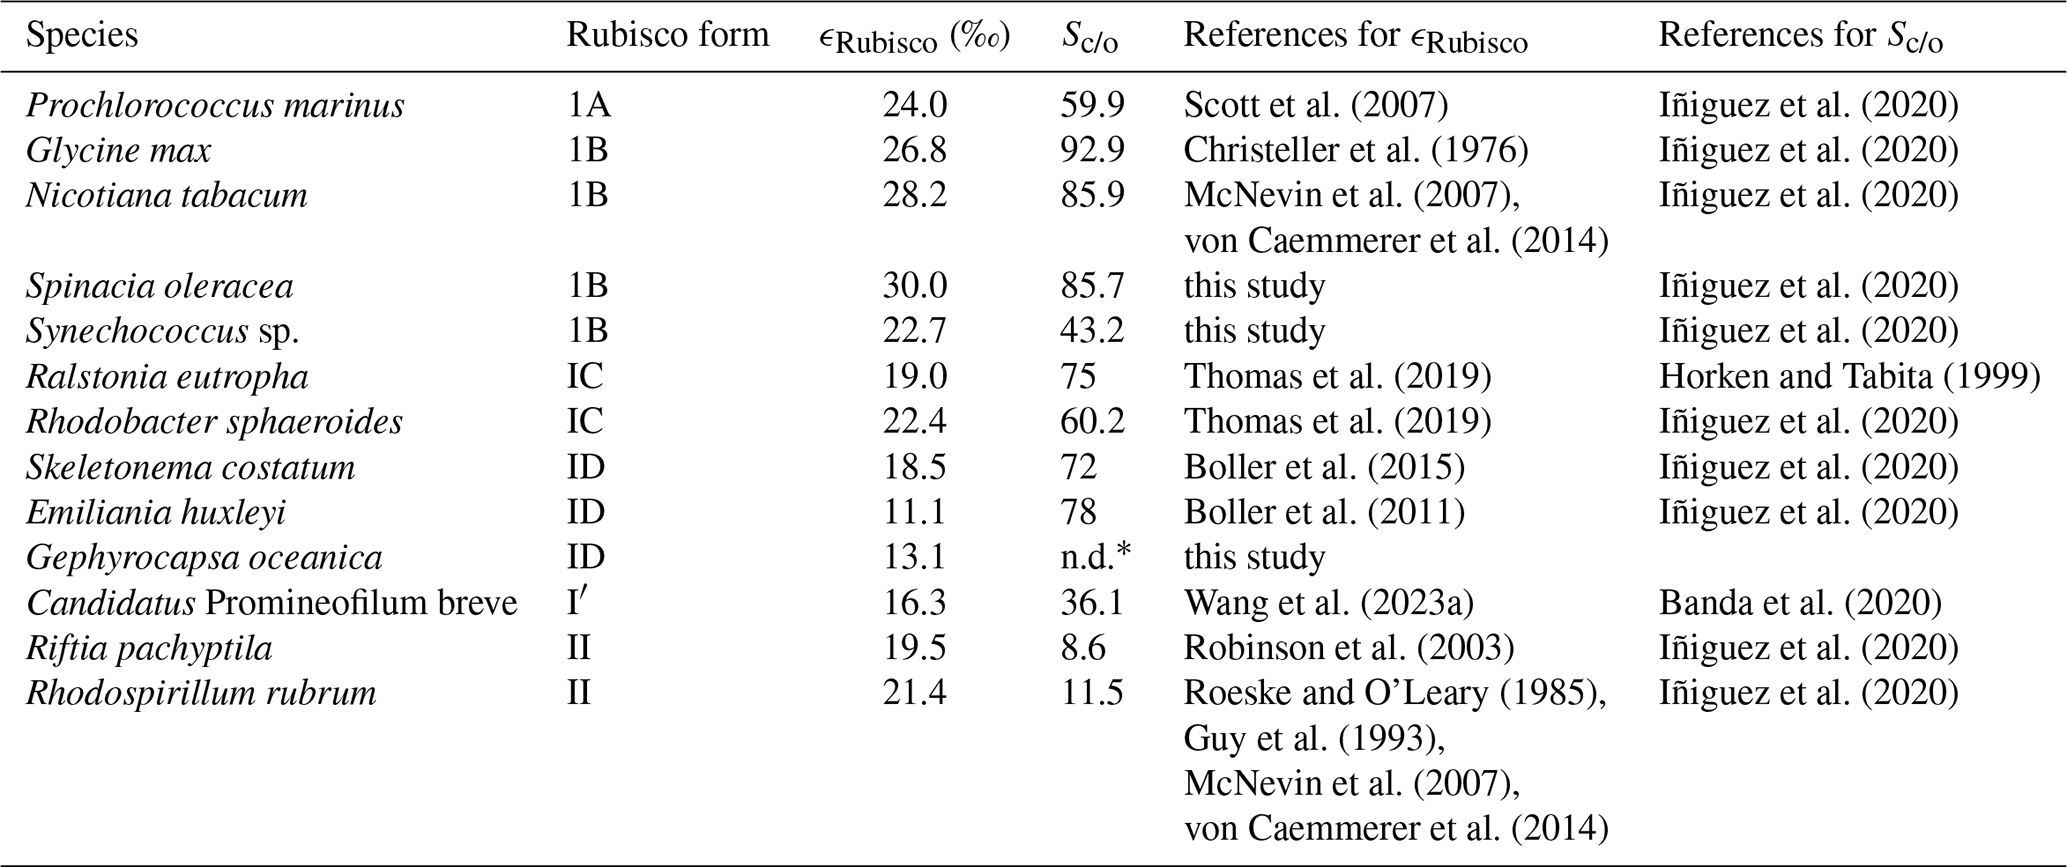
* n.d. = not determined
All data supporting the findings of this study are provided within the manuscript. Qualitative SDS-PAGE analyses of semi-purified and fully purified S. oleracea Rubisco extracts are shown in Fig. 1. Time-resolved DIC concentration data for each studied species are presented in Fig. 2. The comparison of δ13C measurements obtained using the GasBench system and the Apollo–Picarro system is shown in Fig. 4. The δ13C data underlying the determination of ϵRubisco for purified and semi-purified S. oleracea are shown in Figs. 5 and A1, and the corresponding δ13C data for Gephyrocapsa oceanica and Synechococcus sp. are presented in Fig. 6. All relevant kinetic parameters and derived ϵRubisco values are summarized in Table 1. A compilation of published ϵRubisco values together with those obtained in this study is presented in Fig. 7 and Table A1.
HS and JG conceived the idea for the manuscript. RW and PA developed the experimental design, which was executed by RW, PA, and MJ. RW analyzed the data and prepared the tables and figures. RW and PA wrote the manuscript, and all authors reviewed and edited the manuscript thoroughly.
The contact author has declared that none of the authors has any competing interests.
Publisher's note: Copernicus Publications remains neutral with regard to jurisdictional claims made in the text, published maps, institutional affiliations, or any other geographical representation in this paper. The authors bear the ultimate responsibility for providing appropriate place names. Views expressed in the text are those of the authors and do not necessarily reflect the views of the publisher.
We thank Stewart E. Bishop at ETH Zürich and Capó-Bauçà Sebastià at Universitat de les Illes Balears–INAGEA for their technical support as well as Joy Schrepfer for helping with culturing G. oceanica. We thank Trinidad Garcia for technical help and organization of the radioisotope facilities at the Serveis Cientifico-Tècnics (UIB). We thank OpenAI's ChatGPT (GPT-5) for assistance with language editing and phrasing.
This work was financially supported by an ETH Zurich Research Grant (project code: ETH-03 19-1) funded to Heather Stoll, and by the Spanish Ministry of Sciences, Innovation and Universities, the Spanish State Research Agency and the European Regional Development Funds (project UNRAVENAR, PID2023-148523NB-I00) funded to Jeroni Galmés. Pere Aguiló-Nicolau was supported by a pre-doctoral grant from the Government of the Balearic Islands (FPI-CAIB). Technical instrumentation used for plant growth and Rubisco extraction and purification was supported by Platform HiTech-INAGEA (SINCO 2022/18198) funded by Conselleria d’Educaci i Universitat (Govern de les Illes Balears) and FEDER 2021-2027.
This paper was edited by Jack Middelburg and reviewed by Kathleen Scott and three anonymous referees.
Aguiló-Nicolau, P., Galmés, J., Fais, G., Capó-Bauçà, S., Cao, G., and Iñiguez, C.: Singular adaptations in the carbon assimilation mechanism of the polyextremophile cyanobacterium Chroococcidiopsis thermalis, Photosynthesis Research, 156, 231–245, https://doi.org/10.1007/s11120-023-01008-y, 2023. a
Aguiló Nicolau, P., Wijker, R. S., Iñiguez, C., Capó-Bauçà, S., Stoll, H. M., and Galmés, J.: Diversity in rubisco kinetics and CO2-concentrating mechanisms among cyanobacterial lineages, bioRxiv [preprint], https://doi.org/10.64898/2025.12.30.696979, 2025. a, b, c, d, e
Amaral, J., Lobo, A. K. M., Carmo-Silva, E., and Orr, D. J.: Purification of Rubisco from Leaves, Springer US, New York, NY, 417–426, ISBN 978-1-0716-3790-6, https://doi.org/10.1007/978-1-0716-3790-6_22, 2024. a
Banda, D. M., Pereira, J. H., Liu, A. K., Orr, D. J., Hammel, M., He, C., Parry, M. A. J., Carmo-Silva, E., Adams, P. D., Banfield, J. F., and Shih, P. M.: Novel bacterial clade reveals origin of form I Rubisco, Nature Plants, 6, 1158–1166, https://doi.org/10.1038/s41477-020-00762-4, 2020. a
Bar-On, Y. M. and Milo, R.: The global mass and average rate of rubisco, Proceedings of the National Academy of Sciences, 116, 4738–4743, https://doi.org/10.1073/pnas.1816654116, 2019. a
Bathellier, C., Tcherkez, G., Lorimer, G. H., and Farquhar, G. D.: Rubisco is not really so bad, Plant, Cell & Environment, 41, 705–716, https://doi.org/10.1111/pce.13149, 2018. a
Bathellier, C., Yu, L.-J., Farquhar, G. D., Coote, M. L., Lorimer, G. H., and Tcherkez, G.: Ribulose 1,5-bisphosphate carboxylase/oxygenase activates O2 by electron transfer, Proceedings of the National Academy of Sciences, 117, 24234–24242, https://doi.org/10.1073/pnas.2008824117, 2020. a
Bauwe, H., Hagemann, M., Kern, R., and Timm, S.: Photorespiration has a dual origin and manifold links to central metabolism, Current Opinion in Plant Biology, 15, 269–275, https://doi.org/10.1016/j.pbi.2012.01.008, 2012. a
Berg, I. A.: Ecological aspects of the distribution of different autotrophic CO2 fixation pathways, Applied and Environmental Microbiology, 77, 1925–1936, https://doi.org/10.1128/AEM.02473-10, 2011. a
Boller, A. J., Thomas, P. J., Cavanaugh, C. M., and Scott, K. M.: Low stable carbon isotope fractionation by coccolithophore RubisCO, Geochimica et Cosmochimica Acta, 75, 7200–7207, https://doi.org/10.1016/j.gca.2011.08.031, 2011. a, b, c, d, e, f, g
Boller, A. J., Thomas, P. J., Cavanaugh, C. M., and Scott, K. M.: Isotopic discrimination and kinetic parameters of RubisCO from the marine bloom-forming diatom, Skeletonema costatum, Geobiology, 13, 33–43, https://doi.org/10.1111/gbi.12112, 2015. a, b, c, d
Bouvier, J. W. and Kelly, S.: Response to Tcherkez and Farquhar: Rubisco adaptation is more limited by phylogenetic constraint than by catalytic trade-off, Journal of Plant Physiology, 287, 154021, https://doi.org/10.1016/j.jplph.2023.154021, 2023. a
Bouvier, J. W., Emms, D. M., Rhodes, T., Bolton, J. S., Brasnett, A., Eddershaw, A., Nielsen, J. R., Unitt, A., Whitney, S. M., and Kelly, S.: Rubisco adaptation is more limited by phylogenetic constraint than by catalytic trade-off, Molecular Biology and Evolution, 38, 2880–2896, https://doi.org/10.1093/molbev/msab079, 2021. a
Bradford, M. M.: A rapid and sensitive method for the quantitation of microgram quantities of protein utilizing the principle of protein-dye binding, Analytical Biochemistry, 72, 248–254, https://doi.org/10.1016/0003-2697(76)90527-3, 1976. a, b
Capó-Bauçà, S., Galmés, J., Aguiló-Nicolau, P., Ramis-Pozuelo, S., and Iñiguez, C.: Carbon assimilation in upper subtidal macroalgae is determined by an inverse correlation between Rubisco carboxylation efficiency and CO2 concentrating mechanism effectiveness, New Phytologist, 237, 2027–2038, https://doi.org/10.1111/nph.18623, 2023. a
Christeller, J. T., Laing, W. A., and Troughton, J. H.: Isotope discrimination by ribulose 1,5-diphosphate carboxylase: no effect of temperature or concentration, Plant Physiology, 57, 580–582, https://doi.org/10.1104/pp.57.4.580, 1976. a, b
Delahaije, R. J. B. M. and Wierenga, P. A.: Hydrophobicity enhances the formation of protein-stabilized foams, Molecules, 27, https://doi.org/10.3390/molecules27072358, 2022. a
Dickson, A. G.: Standards for ocean measurements, Oceanography, 23, 34–47, https://doi.org/10.5670/oceanog.2010.22, 2010. a
Estep, M. F., Tabita, F. R., Parker, P. L., and Van Baalen, C.: Carbon isotope fractionation by ribulose-1,5-bisophosphate carboxylase from various organisms 1, Plant Physiology, 61, 680–687, https://doi.org/10.1104/pp.61.4.680, 1978. a
Farquhar, G. D. and Cernusak, L. A.: Ternary effects on the gas exchange of isotopologues of carbon dioxide, Plant, Cell & Environment, 35, 1221–1231, https://doi.org/10.1111/j.1365-3040.2012.02484.x, 2012. a
Farquhar, G. D., Ehleringer, J. R., and Hubick, K. T.: Carbon isotope discrimination and photosynthesis, Annual Review of Plant Biology, 40, 503–537, https://doi.org/10.1146/annurev.pp.40.060189.002443, 1989. a
Galmés, J., Kapralov, M. V., Copolovici, L. O., Hermida-Carrera, C., and Niinemets, Ü.: Temperature responses of the Rubisco maximum carboxylase activity across domains of life: phylogenetic signals, trade-offs, and importance for carbon gain, Photosynthesis Research, 123, 183–201, https://doi.org/10.1007/s11120-014-0067-8, 2015. a
Galmés, J., Hermida-Carrera, C., Laanisto, L., and Niinemets, U.: A compendium of temperature responses of Rubisco kinetic traits: variability among and within photosynthetic groups and impacts on photosynthesis modeling, Journal of Experimental Botany, 67, 5067–5091, https://doi.org/10.1093/jxb/erw267, 2016. a, b
Garcia, A. K., Cavanaugh, C. M., and Kacar, B.: The curious consistency of carbon biosignatures over billions of years of Earth-life coevolution, The ISME Journal, 15, 2183–2194, https://doi.org/10.1038/s41396-021-00971-5, 2021. a
Guy, R. D., Fogel, M. L., and Berry, J. A.: Photosynthetic fractionation of the stable isotopes of oxygen and carbon, Plant Physiology, 101, 37–47, https://doi.org/10.1104/pp.101.1.37, 1993. a, b, c, d, e, f, g
Hermida-Carrera, C., Kapralov, M. V., and Galmés, J.: Rubisco catalytic properties and temperature response in crops, Plant Physiology, 171, 2549–2561, https://doi.org/10.1104/pp.16.01846, 2016. a, b
Horken, K. M. and Tabita, F.: Closely related form I ribulose bisphosphate carboxylase/oxygenase molecules that possess different CO2/O2 substrate specificities, Archives of Biochemistry and Biophysics, 361, 183–194, https://doi.org/10.1006/abbi.1998.0979, 1999. a
Iñiguez, C., Capó-Bauçà, S., Niinemets, Ü., Stoll, H., Aguiló-Nicolau, P., and Galmés, J.: Evolutionary trends in RuBisCO kinetics and their co-evolution with CO2 concentrating mechanisms, The Plant Journal, 101, 897–918, https://doi.org/10.1111/tpj.14643, 2020. a, b, c, d, e, f, g, h, i, j, k
Kane, H., Viil, J., Entsch, B., Paul, K., Morell, M., and Andrews, T.: An improved method for measuring the CO2/O2 specificity of ribulosebisphosphate carboxylase-oxygenase, Functional Plant Biology, 21, 449–461, https://doi.org/10.1071/PP9940449, 1994. a
Keller, M. D., Selvin, R. C., Claus, W., and Guillard, R. R. L.: Media for the culture of oceanic ultraphytoplankton, Journal of Phycology, 23, 633–638, https://doi.org/10.1111/j.1529-8817.1987.tb04217.x, 1987. a
Kester, D. R., Duedall, I. W., Connors, D. N., and Pytkowicz, R. M.: Preparation of artifical seawater, Limnology and Oceanography, 12, 176–179, https://doi.org/10.4319/lo.1967.12.1.0176, 1967. a
Losh, J. L., Young, J. N., and Morel, F. M. M.: Rubisco is a small fraction of total protein in marine phytoplankton, New Phytologist, 198, 52–58, https://doi.org/10.1111/nph.12143, 2013. a
McNevin, D. B., Badger, M. R., Kane, H. J., and Farquhar, G. D.: Measurement of (carbon) kinetic isotope effect by Rayleigh fractionation using membrane inlet mass spectrometry for CO2-consuming reactions, Functional Plant Biology, 33, 1115–1128, https://doi.org/10.1071/FP06201, 2006. a
McNevin, D. B., Badger, M. R., Whitney, S. M., von Caemmerer, S., Tcherkez, G. G., and Farquhar, G. D.: Differences in carbon isotope discrimination of three variants of D-ribulose-1,5-bisphosphate carboxylase/oxygenase reflect differences in their catalytic mechanisms, Journal of Biological Chemistry, 282, 36068–36076, https://doi.org/10.1074/jbc.M706274200, 2007. a, b
Mook, W., Bommerson, J., and Staverman, W.: Carbon isotope fractionation between dissolved bicarbonate and gaseous carbon dioxide, Earth and Planetary Science Letters, 22, 169–176, https://doi.org/10.1016/0012-821X(74)90078-8, 1974. a
O'Leary, M. H.: Carbon isotope fractionation in plants, Phytochemistry, 20, 553–567, https://doi.org/10.1016/0031-9422(81)85134-5, 1981. a
Park, R. and Epstein, S.: Carbon isotope fractionation during photosynthesis, Geochimica et Cosmochimica Acta, 21, 110–126, https://doi.org/10.1016/S0016-7037(60)80006-3, 1960. a
Pearce, F. G.: Catalytic by-product formation and ligand binding by ribulose bisphosphate carboxylases from different phylogenies, Biochemical Journal, 399, 525–534, https://doi.org/10.1042/BJ20060430, 2006. a, b, c, d, e, f, g, h
Prywes, N., Phillips, N. R., Tuck, O. T., Valentin-Alvarado, L. E., and Savage, D. F.: Rubisco function, evolution, and engineering, Annual Review of Biochemistry, 92, 385–410, https://doi.org/10.1146/annurev-biochem-040320-101244, 2023. a
Robinson, J. J., Scott, K. M., Swanson, S. T., O'Leary, M. H., Horken, K., Tabita, F. R., and Cavanaugh, C. M.: Kinetic isotope effect and characterization of form II RubisCO from the chemoautotrophic endosymbionts of the hydrothermal vent tubeworm Riftia pachyptila, Limnology and Oceanography, 48, 48–54, https://doi.org/10.4319/lo.2003.48.1.0048, 2003. a
Roeske, C. A. and O'Leary, M. H.: Carbon isotope effects on enzyme-catalyzed carboxylation of ribulose bisphosphate, Biochemistry, 23, 6275–6284, https://doi.org/10.1021/bi00320a058, 1984. a, b, c
Roeske, C. A. and O'Leary, M. H.: Carbon isotope effect on carboxylation of ribulose bisphosphate catalyzed by ribulose bisphosphate carboxylase from Rhodospirillum rubrum, Biochemistry, 24, 1603–1607, https://doi.org/10.1021/bi00328a005, 1985. a, b
Ruuska, S., Andrews, T. J., Badger, M. R., Hudson, G. S., Laisk, A., Price, G. D., and Caemmerer, S. V.: The interplay between limiting processes in C3 photosynthesis studied by rapid-response gas exchange using transgenic tobacco impaired in photosynthesis, Functional Plant Biology, 25, 859–870, https://doi.org/10.1071/PP98079, 1998. a
Scott, K., Lu, X., Cavanaugh, C., and Liu, J.: Optimal methods for estimating kinetic isotope effects from different forms of the Rayleigh distillation equation, Geochimica et Cosmochimica Acta, 68, 433–442, https://doi.org/10.1016/S0016-7037(03)00459-9, 2004a. a, b
Scott, K. M., Schwedock, J., Schrag, D. P., and Cavanaugh, C. M.: Influence of form IA RubisCO and environmental dissolved inorganic carbon on the δ13C of the clam-chemoautotroph symbiosis Solemya velum, Environmental Microbiology, 6, 1210–1219, https://doi.org/10.1111/j.1462-2920.2004.00642.x, 2004b. a, b, c, d, e
Scott, K. M., Henn-Sax, M., Harmer, T. L., Longo, D. L., Frame, C. H., and Cavanaugh, C. M.: Kinetic isotope effect and biochemical characterization of form IA RubisCO from the marine cyanobacterium Prochlorococcus marinus MIT9313, Limnology and Oceanography, 52, 2199–2204, https://doi.org/10.4319/lo.2007.52.5.2199, 2007. a
Staub, R.: Ernährungsphysiologisch-autökologische Untersuchungen an der planktischen Blaualge Oscillatoria rubescens DC, Schweizerische Zeitschrift für Hydrologie, 23, 82–198, https://doi.org/10.1007/BF02505618, 1961. a
Tcherkez, G.: Modelling the reaction mechanism of ribulose-1,5-bisphosphate carboxylase/oxygenase and consequences for kinetic parameters, Plant, Cell & Environment, 36, 1586–1596, https://doi.org/10.1111/pce.12066, 2013. a
Tcherkez, G. and Farquhar, G. D.: Carbon isotope effect predictions for enzymes involved in the primary carbon metabolism of plant leaves, Functional Plant Biology, 32, 277–291, https://doi.org/10.1071/FP04211, 2005. a, b, c
Tcherkez, G. and Farquhar, G. D.: Rubisco catalytic adaptation is mostly driven by photosynthetic conditions – Not by phylogenetic constraints, Journal of Plant Physiology, 267, 153 554, https://doi.org/10.1016/j.jplph.2021.153554, 2021. a
Tcherkez, G. G. B., Farquhar, G. D., and Andrews, T. J.: Despite slow catalysis and confused substrate specificity, all ribulose bisphosphate carboxylases may be nearly perfectly optimized, Proceedings of the National Academy of Sciences, 103, 7246–7251, https://doi.org/10.1073/pnas.0600605103, 2006. a, b, c
Tcherkez, G. G. B., Bathellier, C., Stuart-Williams, H., Whitney, S., Gout, E., Bligny, R., Badger, M., and Farquhar, G. D.: D2O solvent isotope effects suggest uniform energy barriers in ribulose-1,5-bisphosphate carboxylase/oxygenase catalysis, Biochemistry, 52, 869–877, https://doi.org/10.1021/bi300933u, 2013. a
Thomas, P. J., Boller, A. J., Satagopan, S., Tabita, F. R., Cavanaugh, C. M., and Scott, K. M.: Isotope discrimination by form IC RubisCO from Ralstonia eutropha and Rhodobacter sphaeroides, metabolically versatile members of “Proteobacteria” from aquatic and soil habitats, Environmental Microbiology, 21, 72–80, https://doi.org/10.1111/1462-2920.14423, 2019. a, b, c, d, e
von Caemmerer, S., Tazoe, Y., Evans, J. R., and Whitney, S. M.: Exploiting transplastomically modified Rubisco to rapidly measure natural diversity in its carbon isotope discrimination using tuneable diode laser spectroscopy, Journal of Experimental Botany, 65, 3759–3767, https://doi.org/10.1093/jxb/eru036, 2014. a, b, c
Wang, R. Z., Liu, A. K., Banda, D. M., Fischer, W. W., and Shih, P. M.: A bacterial form I’ Rubisco has a smaller carbon isotope fractionation than its form I counterpart, Biomolecules, 13, https://doi.org/10.3390/biom13040596, 2023a. a, b, c, d
Wang, R. Z., Nichols, R. J., Liu, A. K., Flamholz, A. I., Artier, J., Banda, D. M., Savage, D. F., Eiler, J. M., Shih, P. M., and Fischer, W. W.: Carbon isotope fractionation by an ancestral rubisco suggests that biological proxies for CO2 through geologic time should be reevaluated, Proceedings of the National Academy of Sciences, 120, e2300466120, https://doi.org/10.1073/pnas.2300466120, 2023b. a, b, c, d, e
Whelan, T., Sackett, W. M., and Benedict, C. R.: Enzymatic fractionation of carbon isotopes by phosphoenolpyruvate carboxylase from C4 plants, Plant Physiology, 51, 1051–1054, https://doi.org/10.1104/pp.51.6.1051, 1973. a
Wong, W. W., Benedict, C. R., and Kohel, R. J.: Enzymic fractionation of the stable carbon isotopes of carbon dioxide by ribulose-1,5-bisphosphate carboxylase, Plant Physiology, 63, 852–856, https://doi.org/10.1104/pp.63.5.852, 1979. a
Yokota, A. and Kitaoka, S.: Correct pK values for dissociation constant of carbonic acid lower the reported Km values of ribulose bisphosphate carboxylase to half, Presentation of a nomograph and an equation for determining the pK values, Biochemical and Biophysical Research Communications, 131, 1075–1079, https://doi.org/10.1016/0006-291X(85)90200-1, 1985. a
Zeebe, R. E. and Wolf-Gladrow, D. (Eds.): Chapter 1 Equilibrium, in: CO2 in seawater: Equilibrium, kinetics, isotopes, Elsevier Oceanography Series, Elsevier, vol. 65, 1–84, https://doi.org/10.1016/S0422-9894(01)80002-7, 2001. a