the Creative Commons Attribution 4.0 License.
the Creative Commons Attribution 4.0 License.
 | 12 Mar 2026
Spatial heterogeneity of GHG dynamics across an estuarine ecosystem
Nicolas-Xavier Geilfus
Bruno Delille
Anna Villnäs
Alf Norkko
Coastal ecosystems are critical components of the global carbon cycle, exerting a disproportionate influence on the carbon budget despite their limited spatial extent. Although they have gained more attention in the past decade, detailed studies of GHG dynamics across the land-ocean continuum, including shallow-water estuaries, remain relatively scarce even though they are active sources of the three most potent greenhouse gases (GHGs): carbon dioxide (CO2), methane (CH4), and nitrous oxide (N2O). Such shallow coastal ecosystems are highly heterogeneous, shaped by strong physical, biogeochemical, and biological gradients. Together with the spatial variation in coastal biodiversity, these gradients significantly influence carbon cycling at both local and global levels. However, large uncertainties persist due to limited measurements, emphasizing the need for improved constraints on GHG budgets.
Surface seawater partial pressure of CO2 (pCO2), CH4, and N2O concentrations, along with seawater physical and biogeochemical properties, and air-sea gas exchange, were measured at 21 sites in southwest Finland (Baltic Sea). Sampling progressed from estuarine inner bays to the outer archipelago, covering diverse soft-sediment habitats, from sheltered to exposed areas, across a salinity gradient. Seawater pCO2 and N2O concentrations ranged from undersaturated (160 ppm and 9 nmol L−1, respectively) to supersaturated (2521 ppm and 25 nmol L−1, respectively), compared to the atmosphere, resulting in an uptake of −36 and −0.0021 mmol m−2 d−1, and a release up to 220 and 0.0383 mmol m−2 d−1, respectively. CH4 concentrations were consistently supersaturated (19 to 469 nmol L−1) compared to the atmosphere, resulting in a net source to the atmosphere from 0.014 to 1.39 mmol m−2 d−1.
Freshwater input from the Karjaanjoki River and its mixing with seawater shaped the overall spatial patterns of GHGs. However, deviations from this salinity-driven control were seen in sheltered sites within the archipelago, where elevated pCO2 and CH4 concentrations likely reflected biological processes, including enhanced organic matter respiration and methanogenesis in warm, late-summer shallow waters, where limited oxidation favoured CH4 accumulation. At exposed and semi-sheltered sites, mixing processes exerted greater control, resulting in lower GHG concentrations. Our results show that both physical mixing and biological processes influence coastal GHG dynamics, with benthic ecosystems potentially playing a key but still poorly constrained role. The overall budget of air–sea GHG exchanges was dominated by CO2 fluxes, with CH4 consistently acting as a source, and N2O alternating between source and sink. High environmental variability in shallow coastal systems leads to strong fluctuations in the balance between GHG production and consumption, which needs to be considered when evaluating their role in the global carbon budget.
- Article
(5384 KB) - Full-text XML
-
Supplement
(494 KB) - BibTeX
- EndNote


Coastal ecosystems are increasingly recognized as critical components of the global carbon cycle (Bauer et al., 2013). Although covering only about 7 % of the oceanic area, they play a disproportionately large role in biogeochemical cycling due to their location at the land–sea interface (Gattuso et al., 1998; Wollast, 1998). These environments act as hubs of exchange across biomes (Resplandy et al., 2024), contributing to the global oceanic uptake of anthropogenic carbon by absorbing carbon dioxide (CO2) from the atmosphere and either burying, transforming, or releasing the carbon that land ecosystems deliver to coastal waters (Regnier et al., 2022). Due to intense inputs of nutrients and carbon from land and open ocean at continental margins, combined with high rates of biological production and degradation, coastal waters are among the most biogeochemically active regions of the biosphere (Wollast, 1998). Shallow coastal waters such as mangroves, salt marshes, and seagrass meadows effectively sequester large amounts of atmospheric carbon through vegetation growth and long-term sediment accumulation, making significant contributions to long-term carbon storage (Lovelock and Duarte, 2019; Macreadie et al., 2021; Mcleod et al., 2011). These so-called “blue carbon” ecosystems have been proposed as nature-based solutions for short-term climate change mitigation (Hoegh-Guldberg et al., 2019; Lovelock and Duarte, 2019).
Vegetated blue carbon ecosystems exemplify the value of healthy habitats in long-term carbon storage. Still, they cover a small part of the coastal oceans (thebluecarboninitiative.org), and measurements from other key habitats remain scarce and largely neglected in carbon cycling budgets (James et al., 2024). Estuarine areas are characterized by strong physical and chemical gradients and host transitional biodiversity that bridges terrestrial and marine ecosystems (Elliott and Whitfield, 2011) and are recognized as hot spots for carbon cycling and GHG exchange with the atmosphere (Borges et al., 2005; 2016; Cai et al., 2013; Frankignoulle et al., 1998; Humborg et al., 2019; Rosentreter et al., 2021a). The global oceans absorb roughly 25 % of anthropogenic CO2 emissions annually (Watson et al., 2020). While coastal waters contribute to this sink by taking up atmospheric CO2 (Chen and Borges, 2009; Regnier et al., 2022), many nearshore systems like estuaries have been recognized as net heterotrophic ecosystems with negative net ecosystem production (Gattuso et al., 1998; Testa et al., 2012), leading to the production and release of both CO2 and methane (CH4) (Abril and Borges, 2005; Bonaglia et al., 2025; Borges et al., 2018). Despite their small size, emissions from near-shore ecosystems such as estuaries could nearly balance the carbon uptake by marginal seas (Borges et al., 2005; Chen and Borges, 2009). Global CO2 emissions from estuaries range from 0.1 to 0.6 PgC yr−1 (Borges et al., 2018), an amount equivalent to 5 %–30 % of the oceanic CO2 sink of ∼ 2 PgC yr−1 (Le Quéré et al., 2016), while CH4 emissions range from 1 to 7 Tg yr−1, mainly driven by organic matter accumulation, anaerobic decomposition in sediments, and production in submerged plants (Borges et al., 2018; Rosentreter et al., 2018). However, CH4 emissions are probably underestimated due to difficulties in accounting for ebullition and gas flaring (Borges et al., 2016; Humborg et al., 2019). The complexity of these pathways, combined with a lack of systematic, high-resolution, and long-term measurements, hampers robust global assessments of coastal CH4 emissions (Roth et al., 2022). Besides CO2 and CH4, coastal ecosystems are important but poorly constrained sources of nitrous oxide (N2O), a potent greenhouse gas with a global warming potential 273 times higher than CO2 over 100 years (IPCC 2023). N2O is primarily produced via nitrification (ammonia oxidation) and denitrification (nitrate reduction) in sediments and water columns and is controlled by the availability of dissolved inorganic nitrogen and oxygen (Bange, 2006). Eutrophication and hypoxia, often driven by excess nutrient and organic matter inputs, have been shown to promote N2O emissions (Murray et al., 2015; Brase et al., 2017). Coastal ecosystems are recognized as significant sources of N2O to the atmosphere (Bange, 2006; Cheung et al., 2025; Resplandy et al., 2024), where denitrification, especially in sediments and on particles, often dominates N2O production, even in well-oxygenated waters (Wan et al., 2023). However, coastal estimates remain uncertain due to sparse measurements and high spatial heterogeneity (Wan et al., 2023). Given the strong warming potential of N2O, understanding its fluxes from estuaries is essential for a complete picture of coastal greenhouse gas dynamics and for determining how these emissions, together with those of CH4 (with a warming potential of 27; IPCC, 2023), offset the coastal uptake of CO2 (Resplandy et al., 2024; Rosentreter et al., 2018; Roth et al., 2023). Such offsets directly influence the net climate mitigation potential of coastal ecosystems, thereby questioning their ability to mitigate rising atmospheric GHG concentrations and associated radiative effects (Kristensen et al., 2025; Williamson and Gattuso, 2022).
We investigate the dynamics of CO2, CH4, and N2O (GHGs) along a salinity gradient and across contrasting coastal habitats within an estuary. We combined detailed field measurements of surface seawater physical and biogeochemical properties with both in situ measurements and calculated estimates of air–sea GHG exchange. This approach enabled us to capture spatial variability and examine the roles of physical drivers and biological processes in the observed changes in GHG concentrations. In doing so, we aim to quantify the contribution of the studied coastal ecosystems to GHG emissions and to provide additional data to improve both regional and global estimates of GHG emissions from the coastal ocean.
2.1 Study area
This study was conducted within a 30 km radius of the Tvärminne Zoological Station (TZS), located at the southwestern tip of mainland Finland. The study area encompasses the coastal waters extending from the cities of Hanko, Tammisaari, and Pohja (Fig. 1), where the coastal environment is characterized by strong spatial heterogeneity due to the intricate bathymetry and geomorphology of the archipelago system (Asmala and Scheinin, 2024) and enhanced human impact. The studied area receives substantial freshwater from the Karjaanjoki river (in Pohja, runoff 0.59 km3 yr−1, Räike et al., 2012), delivering relatively large amounts of allochthonous carbon and nutrients to the system, resulting in eutrophication and elevated concentrations of organic carbon in the water column across the inner archipelago area (Fleming-Lehtinen et al., 2015). Sampling sites (N=21) were selected to encompass a wide range of soft-sediment habitats (e.g., including both vegetated and non-vegetated sediments with grain size ranging from coarse sand to clay, silt, and mud) and to represent a spatial gradient (50 km) from the outer to innermost archipelago. We used the classification by Lammerant et al. (2025), who categorize sampling sites based on their salinity and sediment characteristics to indicate the degree of exposure to environmental forces. Exposed sites (sites 1–4 and 17–21) are likely to experience stronger wave, wind, and current energy, as well as higher water exchange, compared to sheltered sites. Sites within Pojo Bay (sites 1–4) are broadly open to the bay and are directly influenced by wind and water input from the Karjaajoki River and the archipelago. Therefore, those are included with the exposed sites. The sheltered sites (sites 5 and 7–11) are more enclosed and likely to have limited water circulation. Semi-sheltered sites fall between exposed and sheltered environments (sites 6 and 12–16).
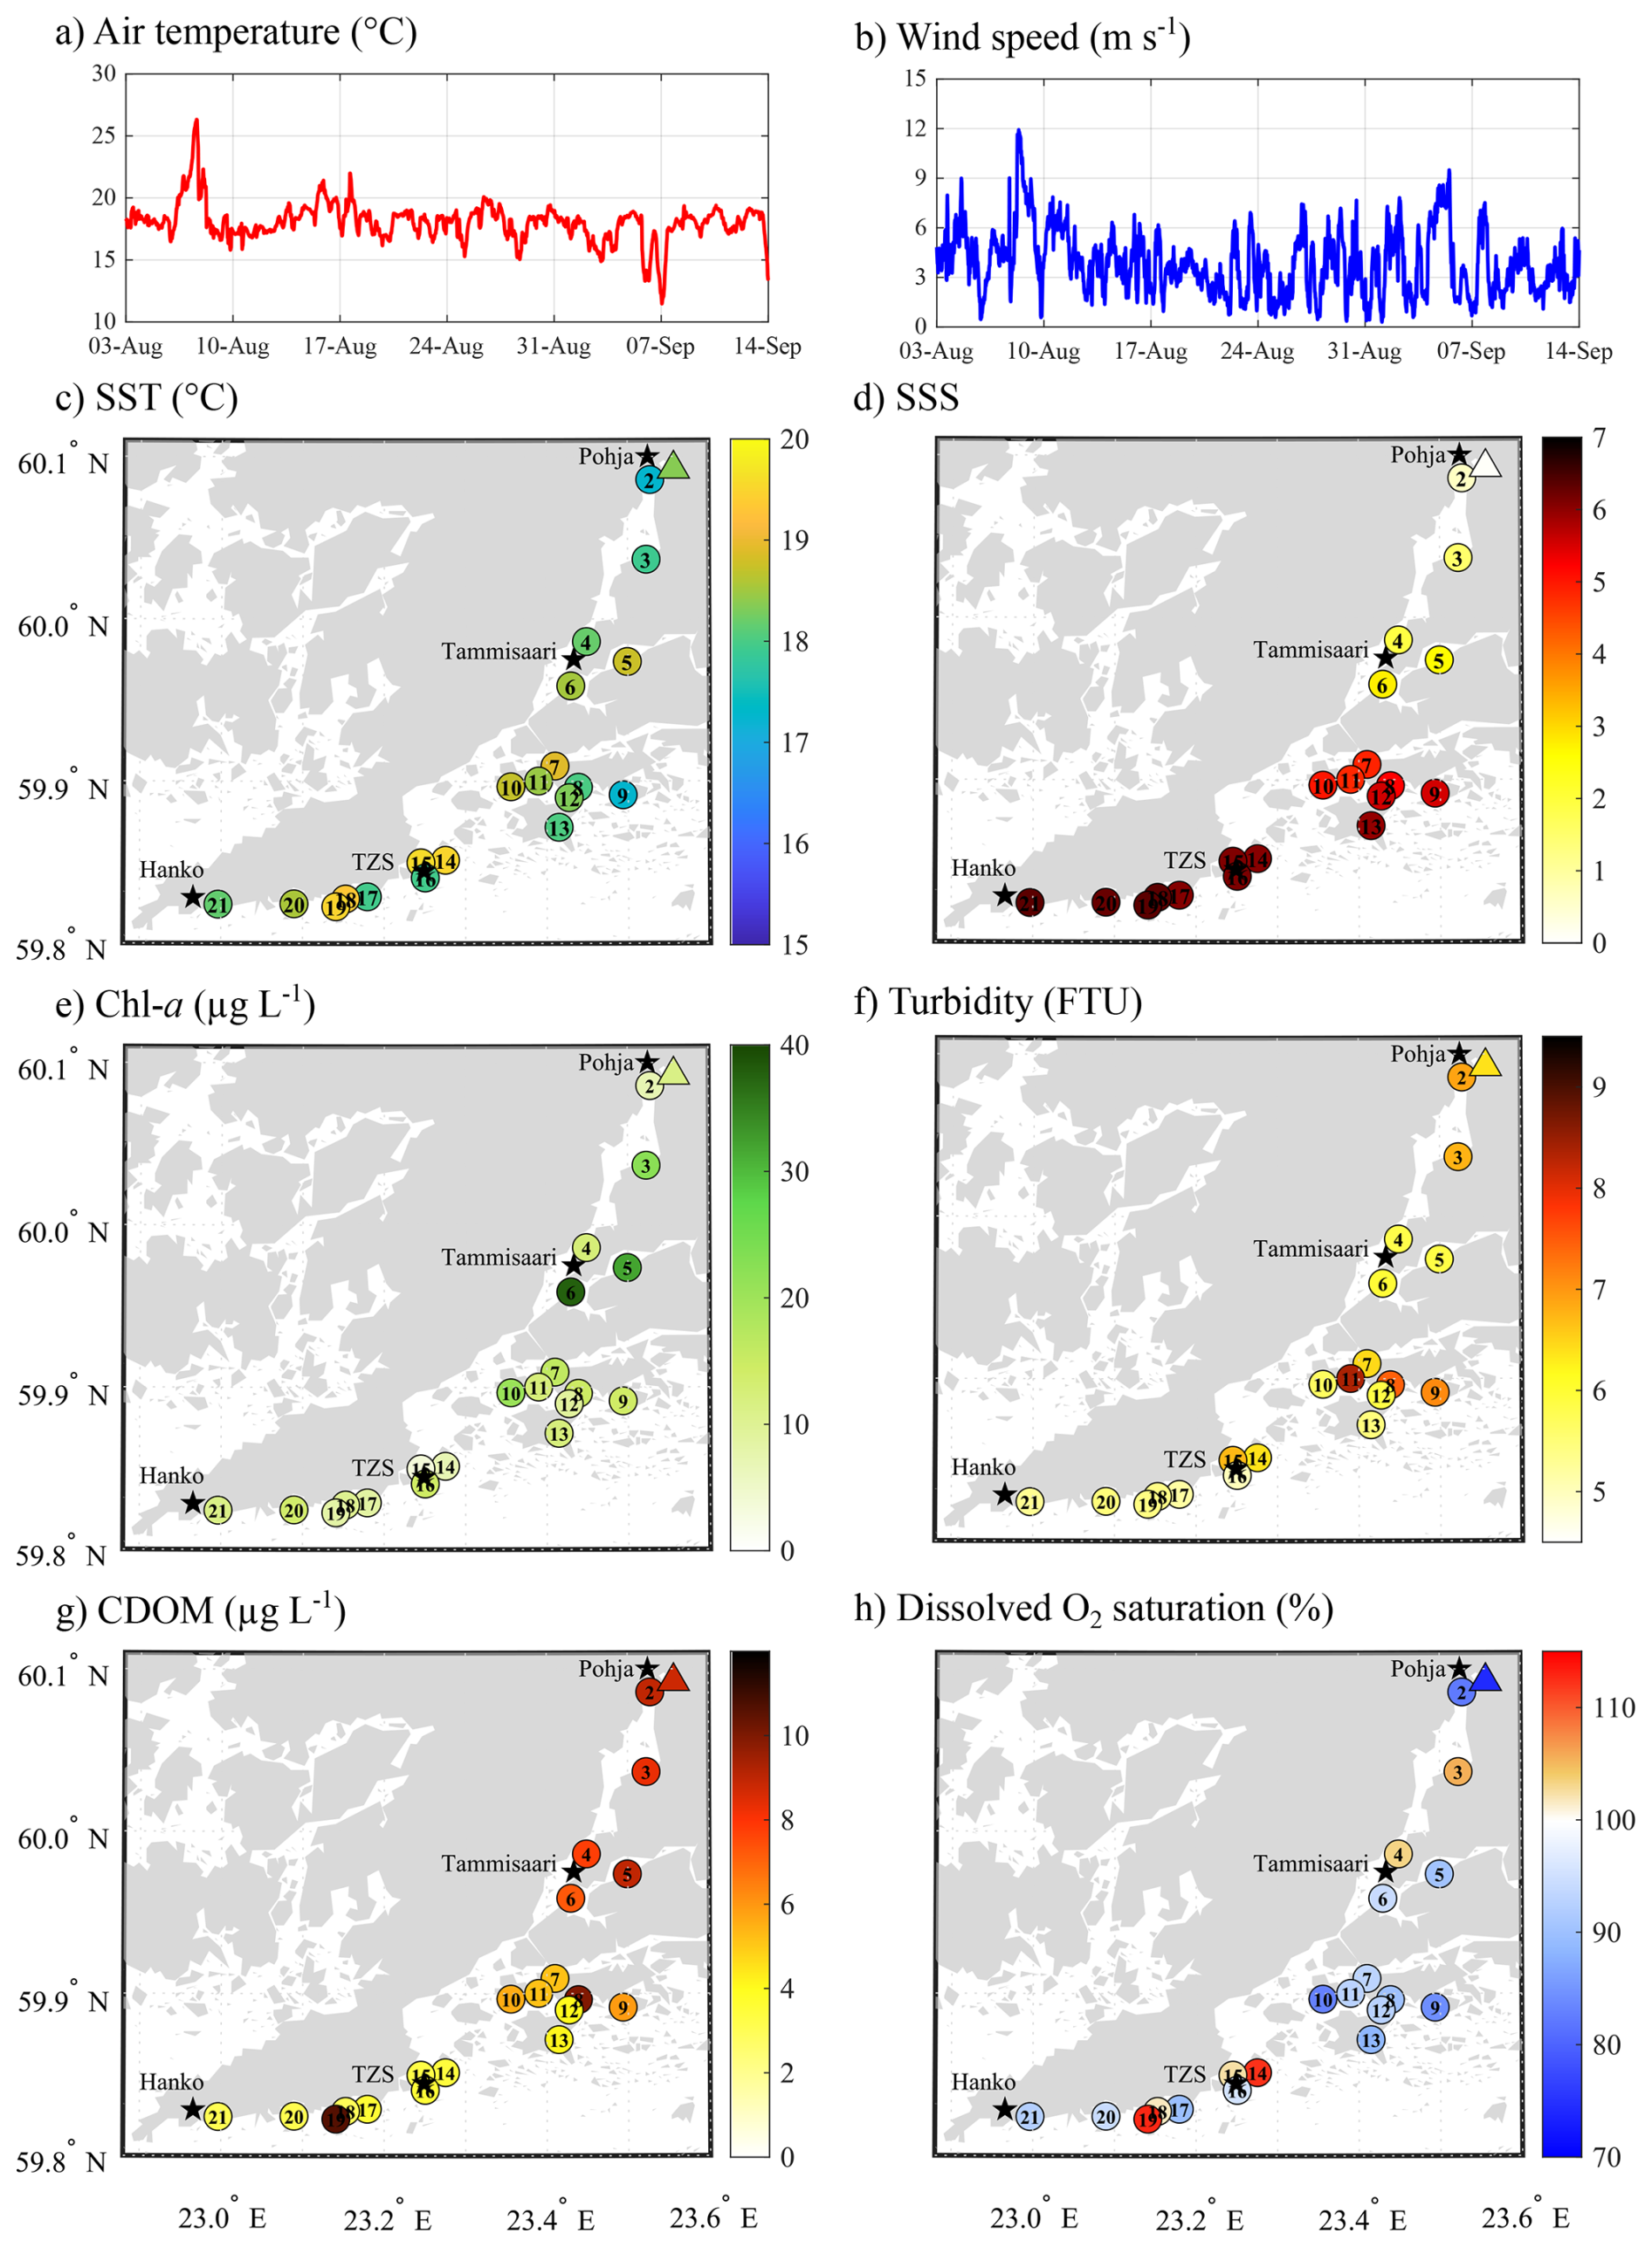
Figure 1Atmospheric conditions: (a) air temperature (°C) and (b) wind speed (m s−1) recorded at the ICOS station FI-Tvm established at the Tvärminne Zoological Station. Spatial variation of (c) surface seawater temperature (SST, °C), and (d) salinity (SSS), (e) chlorophyll a (chl a, µg L−1) concentration, (f) turbidity (FTU), (g) coloured dissolved organic matter (CDOM, µg L−1), and (h) dissolved oxygen saturation (%) across the sampling area. Triangles represent the surface water conditions at the mouth of the Karjaanjoki River.
Exposed and semi-sheltered sites in the outer archipelago (between Hanko and TZS, sites no. 14–21, Fig. 1) are characterized by sandy sediments (96.2 %–100 % sand) with low organic matter content (0.3 %–1.3 %). These sites host both marine and freshwater plant species (Gustafsson and Norkko, 2019; Lammerant et al., 2025), and their faunal biomass is dominated by bivalves and polychaetes (Gammal et al., 2019; Mäkelin et al., 2024). Sheltered and semi-sheltered sites within the archipelago (sites no. 5–13) are characterized by sediments containing high proportions of clay/silt (20.8 %–64.3 %) and organic matter (2.4 %–13.2 %; Lammerant et al., 2025). At these sites, fast-growing fresh- and brackish-water macrophytes are often found, while faunal biomass is dominated by gastropods (Mäkelin et al., 2024). In Pojoviken Bay, the 14 km inlet between Tammisaari and Pohja (sites no. 1–4), dense vegetation occurs down to ∼ 2 m depth but becomes sparse at greater depths (> 3 m) due to light limitation (Lammerant et al., 2025). Deeper sites are characterized by high organic matter content (> 13 %) in the sediment and low faunal biomass (Gammal et al., 2019). Sampling was conducted from 14 August to 12 September 2023. Sites were visited once during the study period, with sampling conducted every two to three days, depending on weather conditions and boat availability.
2.2 Sampling procedure
Physical and biogeochemical properties of surface seawater, including the partial pressure of dissolved CO2 (pCO2) and CH4 concentration, were measured in situ using a custom-built flow-through system. Seawater, from a depth of 50 cm, was pumped onboard using a submersible pump and directed into two separate flow-through systems.
The first water flow (3 L min−1) was dedicated to gas extraction using a double showerhead equilibrator (Sunburst) equipped with a temperature probe (Hex fitting thermistor, ThermX, 0.1 °C accuracy) and a barometric pressure sensor (BARO-A-4V, All Sensors). From the equilibrator, a continuous air flow (2 L min−1) circulated in a closed loop to an infrared gas analyser (IRGA, LI-COR, LI-7810). The analyser measured the dry mole fractions of CO2 and CH4, denoted as xCO2 and xCH4, respectively, as the gas passed through a Peltier cooler to remove the excess water before entering the IRGA. Both gas concentration and temperature were recorded every second until an equilibrium was reached. Equilibration between the seawater and gas phases was monitored in real time using a laptop connected to the IRGA. Equilibrium was considered reached when both CO2 and CH4 concentrations stabilized at a clear plateau. Depending on the concentration gradient between sites, this equilibration period could vary substantially. While CO2 typically reached equilibrium within a few minutes, CH4 required longer times (up to 45 min) to reach a stable plateau. The measured xCO2 (in ppm) was later converted into pCO2 (in µatm) and corrected for in situ temperature using the Matlab CO2SYS v3 (Sharp et al., 2023). Surface seawater CH4 concentration (in nmol L−1) was computed from xCH4 (in ppm), in situ temperature, salinity, and the solubility coefficients from Wiesenburg and Guinasso (1979). The IRGA was factory-calibrated, and standard gases for CO2 (150, 420, and 1500 ppm) and CH4 (1, 20, and 150 ppm) were passed through the IRGA both before and after deployment. The data were corrected for potential drift.
The second water flow (2 L min−1) was directed through a thermosalinograph (SeaBird, TSG045), a fluorometer for chlorophyll a (chl a), turbidity, and phycocyanin concentrations (Chelsea, TriLux), a fluorometer for coloured dissolved organic matter (CDOM, Chelsea, UviLux), and an optode for dissolved oxygen concentration and saturation (Aanderaa 4531). Each sensor was factory-calibrated before deployment, and data were logged at 1 s intervals until equilibrium for xCO2 and xCH4 was reached (up to 45 min). A 5 s average was then recorded.
Discrete surface water samples were collected for total alkalinity (TA), dissolved inorganic carbon (DIC), methane (CH4), and nitrous oxide (N2O) concentration using a peristaltic pump (Cole Palmer, Masterflex Environmental Sampler) equipped with Tygon tubing. Seawater samples were collected into 12 mL gas-tight vials (Exetainers, Labco High Wycombe, UK) for DIC, 60 mL borosilicate vials for TA, and 60 mL serum bottles for dissolved CH4 and N2O concentrations. Samples were preserved by adding 1 % of the sample volume of a saturated mercuric chloride (HgCl2) solution. Samples were stored in the dark at room temperature until analysis.
Air-sea exchanges of CO2 and CH4 were measured using the accumulation chamber technique (Frankignoulle, 1988). The chamber consists of a polyethylene container (internal diameter: 34 cm, height: 14 cm, total volume = 11.4 L) connected in a closed loop to the IRGA with 1.5 m long Tygon tubing, which allows the chamber to move freely on the water surface. The air partial pressure of CO2 (pCO2) and CH4 (pCH4) within the chamber was recorded every second for 10 min. The flux was computed from the slope of the linear regression of pCO2 and pCH4 against time (R2>0.99) following the method of Frankignoulle (1988), accounting for the air volume enclosed within the chamber. The uncertainty of the flux calculation, based on the standard error on the regression slope, was approximately 3 % on average. Before conducting the chamber measurements, the IRGA baseline was established by flushing atmospheric air through the analyser. Based on these measurements, we estimated average mixing ratios of 406 ppm for CO2 and 2.05 ppm for CH4 during the survey. Reported fluxes represent the mean of two to three individual chamber measurements performed at each site. Direct measurements of N2O air-sea exchanges were not possible during our survey. Therefore, the air-sea exchange of N2O, as well as CO2 and CH4 (i.e., FX, where X represents N2O, CO2, or CH4, respectively) was parameterized using the bulk formula:
where k (m s−1) is the gas transfer velocity, K0 (mol m−3 atm−1) is the temperature and salinity dependent gas solubility determined from Weiss (1974) for CO2, Wiesenburg and Guinasso (1979) for CH4, and Weiss and Price (1980) for N2O, and pX(sw) and pX(atm) are the measured partial pressure of gas in the surface seawater and the air, respectively.
This approach strongly relies on selecting an appropriate parameterization for the gas transfer velocity, k. Numerous theoretical, laboratory, and field studies established that k depends on a variety of parameters, including capillary and breaking waves, boundary layer stability, air bubbles, surfactant surface films, evaporation and condensation, precipitation, water currents (including tides), as well as turbulence at the air-water interface (Borges et al., 2004). The parameterization of k is most often expressed as a function of wind speed. This relationship is well established for the open ocean, where wind stress is the main source of turbulence (e.g., Wanninkhof, 2014). In estuarine environments, significant regression functions between k and wind speed have also been reported (Borges et al., 2004; Raymond et al., 2000). However, such formulations have been proven to be site-specific and may not fully account for other controlling processes, such as turbulence at the air-water interface (Borges et al., 2004). Since no k-wind relationship has been developed for our study area, we adopted the formulation proposed for the Randers fjord by Borges et al. (2004), as its physical characteristics, particularly tidal amplitude and freshwater discharge, are most comparable to those of our site:
where u is the wind speed (m s−1) and Sc(balt) is the Schmidt number at the sampling site, based on local temperature, salinity, and gas molecules. Sc(balt) is extrapolated from freshwater and seawater (S=35) coefficients from Wanninkhof (2014) for the salinity observed at the sampling site (Roth et al., 2023).
Wind speed (in m s−1, METEK, uSonic-3 Scientific) and air temperature (in °C, Vaisala, HMP155) were measured at the 3.2 and 2 m height, respectively, above sea level at the newly established Integrated Carbon Observation System (ICOS) coastal site at TZS (ICOS code FI-Tvm; Fig. 1). Daily averaged wind speed, extrapolated to a height of 10 m using the relationship from Hsu et al. (1994), assuming a near-neutral atmospheric stability conditions, was used to calculate the air-sea exchanges of GHGs. Atmospheric concentrations of CO2 and CH4 were measured at each site before the air-sea flux measurements. For N2O, we used the monthly average atmospheric concentration of 0.3367 ppm, measured at Pallas-Sammaltunturi, GAW Station, Finland (PAL, https://gml.noaa.gov/dv/iadv/graph.php?code=PAL&program=ccgg&type=ts, last access: October 2025).
The recorded data from the IRGA for both seawater and air-sea flux measurements were filtered to remove measurements taken during the transition period between stations and when switching between ambient air and seawater measurements, as the IRGA requires time to respond to sharp concentration changes. Additionally, data affected by improper functioning (i.e., seawater flow < 1.5 L min−1) were discarded.
2.3 Sample analysis
TA was determined by Gran titration (Gran, 1952) using an AS-ALK2 titration system (Apollo SciTech), where a 15 mL sample was titrated with a standard 0.1 M HCl solution. DIC was measured on a DIC analyser (Apollo SciTech) by acidification of a 0.75 mL subsample with 1 mL 10 % H3PO4, and quantification of the released CO2 with a non-dispersive infrared CO2 analyser (LI-COR, LI-7000). Results were then converted from µmol L−1 to µmol kg−1 based on sample density, calculated from salinity and temperature at the time of the analysis. Accuracies of ±3 and ±2 µmol kg−1 were determined for TA and DIC, respectively, from routine analysis of certified reference materials (A.G. Dickson, Scripps Institution of Oceanography, San Diego, CA, USA).
Discrete seawater samples for CH4 and N2O concentrations were measured via the headspace equilibrium technique (25 mL N2 headspace in 60 mL serum bottles) and measured with a gas chromatograph (SRI 8610C) with flame ionization detection, and electron capture detection calibrated with mixtures (Air Liquide) of 1.0, 10, and 30 ppm CH4 and 0.2, 1.0, and 6.0 ppm N2O. The measurement precision was 8 % for CH4 and 4 % for N2O.
3.1 Atmospheric forcing and seawater physical properties
During the survey period, atmospheric temperatures remained relatively stable, averaging 18.0 °C (SD = 1.5, n=1989; Fig. 1a). A short warm event occurred on the 7 August, when the air temperature peaked at 26.3 °C. In contrast, short cold spells were observed on 5 and 7 September, with temperatures dropping to 13.7 and 11.5 °C, respectively. With relatively stable atmospheric temperature, surface seawater temperature (SST) showed limited variation, ranging from 17.2 to 19.5 °C (mean = 18.4 °C, SD = 0.66, n=21; Fig. 1c). The Karjaanjoki River, being the main source of freshwater input to the area, created a pronounced salinity gradient, from nearly fresh surface seawater salinity (SSS = 0.07) at the river mouth (in Pohja) to a SSS of 6.36 in Hanko (Fig. 1d).
3.2 Seawater biogeochemical properties
Surface seawater chlorophyll a (chl a) concentration ranged from 3.7 to 37.7 µg L−1 (mean = 14.4, SD = 8.1, n=21, Fig. 1e), with the highest concentration observed in the sheltered bay around Tammisaari (S5 and S6). Turbidity ranged from 5.0 to 8.4 FTU (mean = 6.1, SD = 0.8, n = 21, Fig. 1f), with the highest values observed in sheltered bays within the archipelago (S8, S9, and S11). Coloured dissolved organic matter (CDOM) ranged from 3.0 to 10.6 µg L−1 (mean = 5.9, SD = 2.6, n = 21, Fig. 1g) and exhibited a salinity-driven gradient, with the highest concentrations observed towards Pohja and the lowest towards Hanko. However, one site in the archipelago (S8) and near Hanko (S19) exhibited elevated CDOM concentrations compared to other locations in their respective area, reaching up to 10.0 and 10.6, respectively. Dissolved oxygen (DO) saturation levels ranged from 74.3 % to 112.7 % (mean = 94.1, SD = 9.6, n = 21, Fig. 1h), with most of the sites undersaturated in O2, excepted for two sites closed by Tammisaari (S3 and S4) and four sites in closed vicinity of TZS (S14, S15, S18, and S19).
Surface water pCO2 ranged from strong undersaturation (160 ppm) to a significant supersaturation relative to the atmosphere (406 ppm) at S2 (1702 ppm) and up to 2521 ppm at the river mouth (triangle on Fig. 2a). Surface water was consistently supersaturated with respect to CH4 (from 636 to 14 609 %, data not shown) compared to the atmosphere, with concentrations ranging from 19 to 469 nmol L−1 (Fig. 2b). Undersaturated pCO2 (from 160 to 403 ppm) and low CH4 concentrations (from 19 to 34 nmol L−1) were mostly observed at open sites between TZS and Hanko (S14 to S21), except for S17, where pCO2 and CH4 reached 485 ppm and 48 nmol L−1, respectively. Seawater pCO2 and CH4 concentrations increased across the archipelago and Pojoviken Bay, reaching their maximal values at the mouth of the Karjaanjoki River. Local lows were observed in Pojoviken Bay (S3 and S4), where pCO2 was undersaturated (192 and 238 ppm, respectively), and CH4 concentrations were relatively low (83 and 67 nmol L−1, respectively). N2O concentration ranged from 9 to 25 nmol L−1, with saturation level ranging from 93 % to 255 %. Higher concentrations and maximum saturation were observed at the mouth of the Karjaanjoki River (Fig. 2c). South of Tammisaari, surface waters were either undersaturated in N2O (S8, S13, and S16) or close to the atmospheric equilibrium (S6 and S12, data not shown). TA and DIC ranged from 668 to 1631 and from 720 to 1550 µmol kg−1, respectively, with minimum TA and DIC concentration measured at the mouth of the Karjaanjoki River. Both TA and DIC exhibited conservative behaviour with changes in salinity (Fig. 3a).
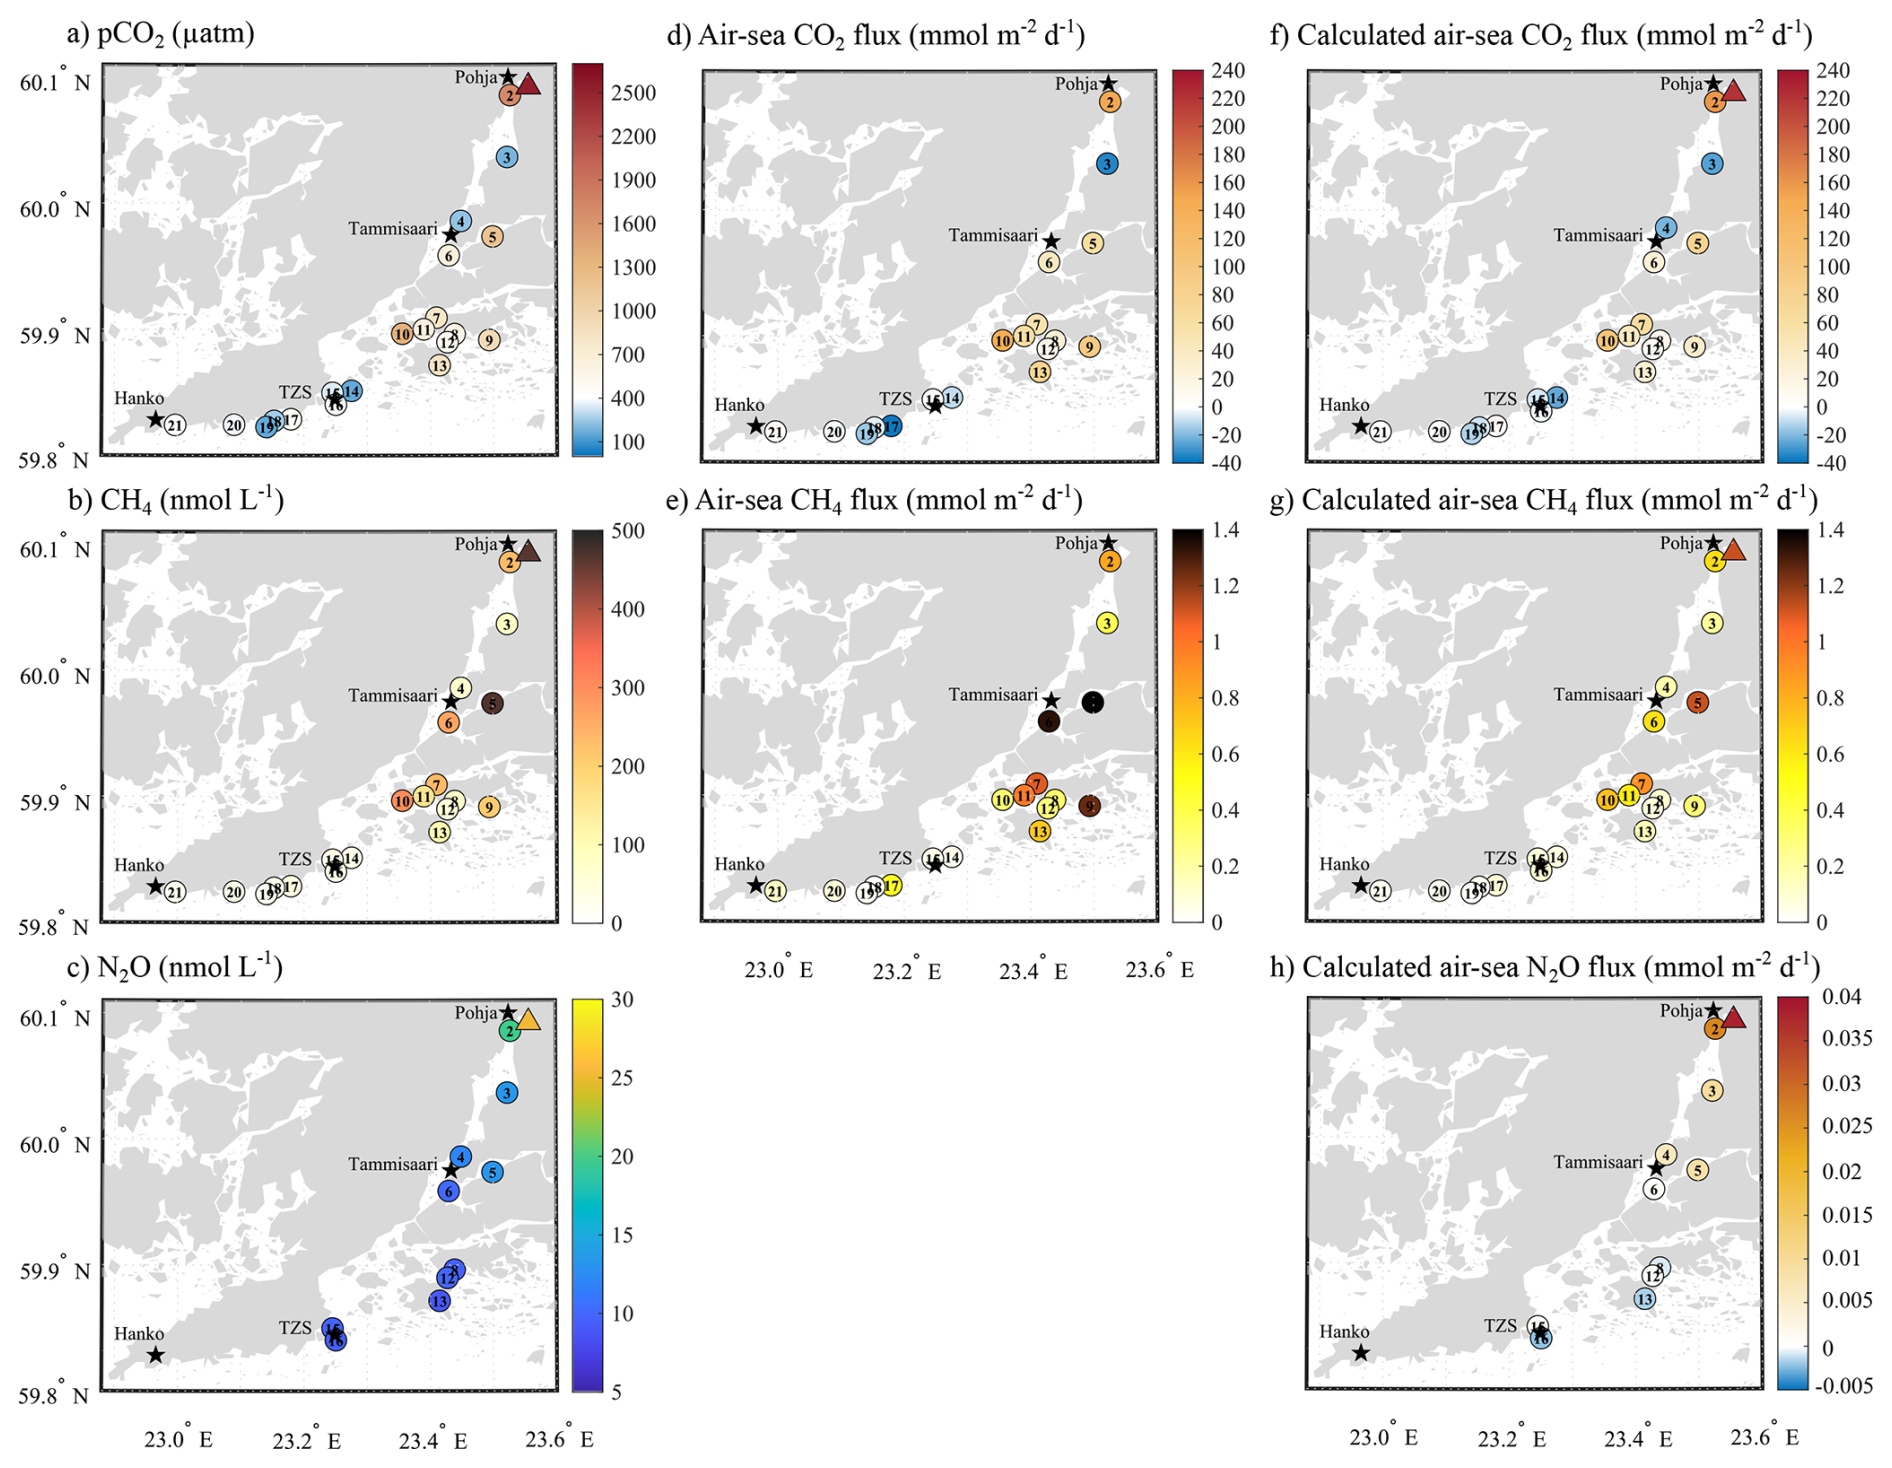
Figure 2Left column presents the spatial variation of surface seawater (a) pCO2 (µatm), (b) CH4 (nmol L−1), and (c) N2O concentration (nmol L−1). The middle column presents measured air-sea fluxes of (d) CO2 (mmol m−2 d−1) and (e) CH4 (mmol m−2 d−1). The right column presents the calculated air-sea fluxes of (f) CO2 (mmol m−2 d−1), (g) CH4 (mmol m−2 d−1), and (h) N2O (mmol m−2 d−1). Positive values indicate a release from the sea to the atmosphere, while negative values represent an uptake by the sea. Triangles represent the surface water conditions at the mouth of the Karjaanjoki River.
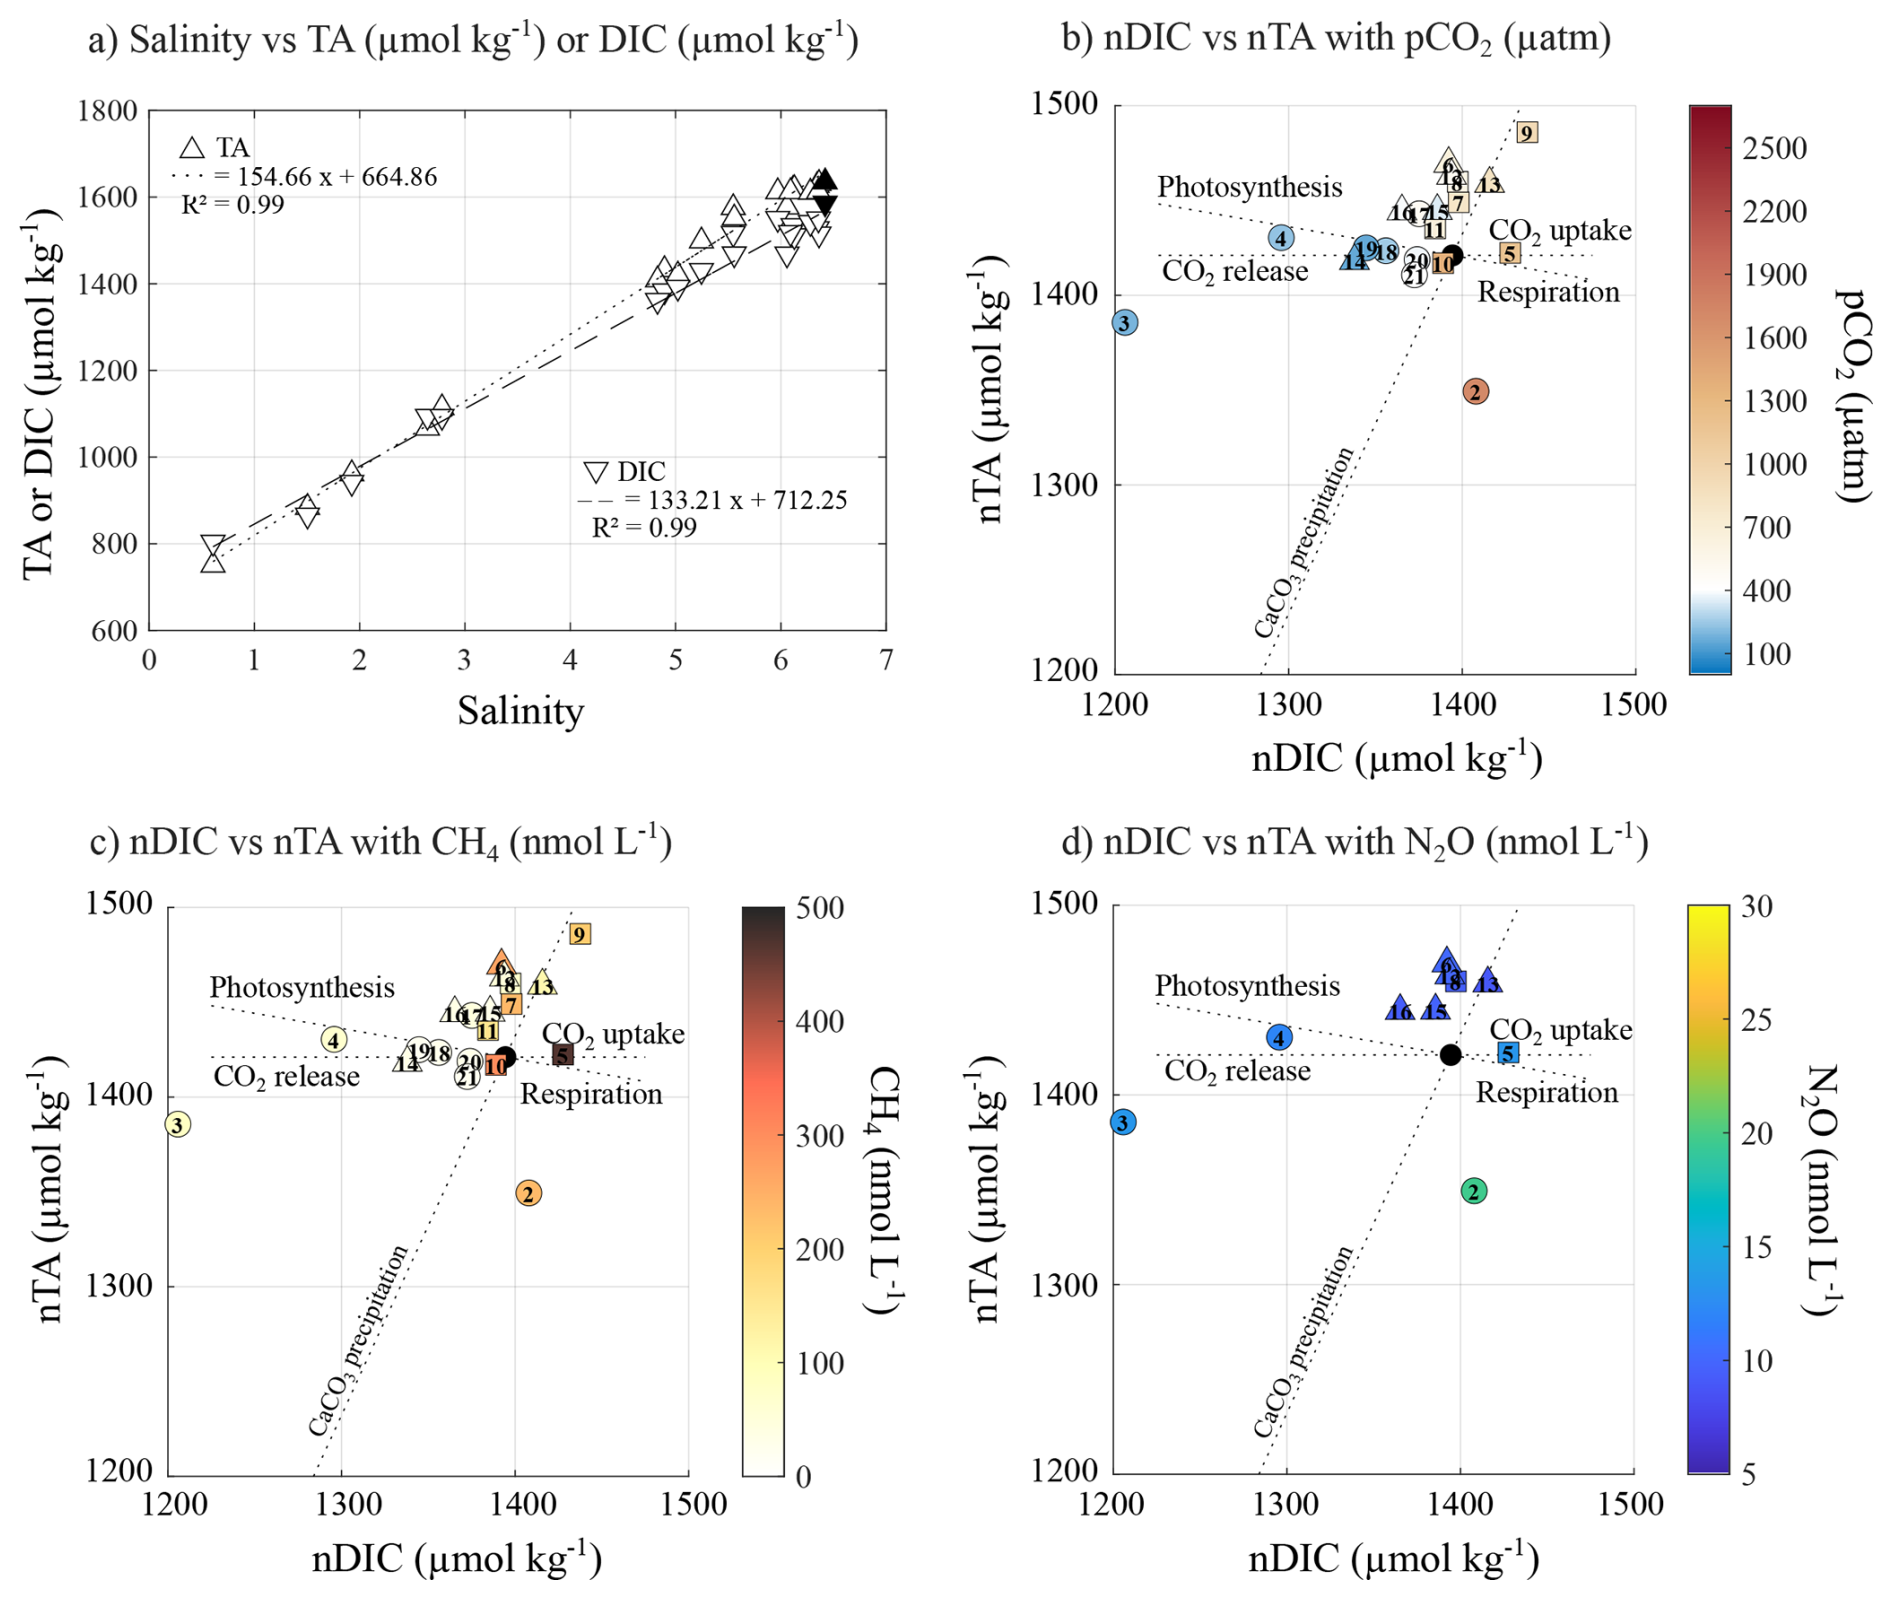
Figure 3(a) Relationship between salinity, TA (µmol kg−1, circles) and DIC (µmol kg−1, squares). Relationship between nDIC and nTA, and their association with (b) pCO2 (µatm), (c) CH4 (nmol L−1), and (d) N2O (nmol L−1) concentrations. Black symbols represent the seawater endmember. Exposed and semi-sheltered sites are represented by circles, while sheltered sites are represented by square symbols.
3.3 Air-sea GHG flux densities
The area presented contrasts in terms of sink and source of CO2 and N2O, but was clearly a source of CH4. Measured air-sea CO2 flux densities ranged from −36 to 150 mmol m−2 d−1, where negative values indicate net uptake of atmospheric CO2 (Fig. 2d). In contrast, the study area acted as a net source of CH4 to the atmosphere, with flux densities ranging from 0.014 to 1.39 mmol m−2 d−1 (Fig. 2e). Overall, the calculated fluxes showed a similar trend in term of pattern and range compared to the observed values, ranging from −26.4 to 220.3 mmol m−2 d−1 for CO2 (Fig. 2f) and from 0.03 to 1.1 mmol m−2 d−1 for CH4 (Fig. 2g). Calculated fluxes of N2O ranged from −0.0021 to 0.0383 mmol m−2 d−1, with sites in the archipelago and towards TZS acting as a slight sink of N2O (Fig. 2h).
3.4 Statistical analysis
The Kendall's τ coefficient has been calculated to investigate the correlation between surface water pCO2, CH4, and N2O concentration, as well as between physical and biogeochemical parameters and all three GHGs (Fig. 4). Surface pCO2 and CH4 concentrations show a moderate (τ=0.5636) and statistically significant (p=0.0165) positive relationship (Fig. 4a), suggesting that processes driving high pCO2, such as respiration and organic matter degradation, are likely also contributing to elevated CH4 levels. N2O is not correlated with pCO2 and shows a moderate correlation with CH4 (τ=0.4182), although this relationship is only marginally significant (p=0.0866). Among the tested biogeochemical variables, SSS and O2 saturation show strong, significant negative correlations with pCO2 and CH4 (Fig. 4b). N2O is only strongly negatively correlated with salinity (, p=0.00013) and shows a marginal correlation with CDOM (τ=0.4545, p=0.060). CDOM is positively correlated with CH4 (τ=0.4952, p=0.0013) while chl a is moderately and significantly correlated with CH4 (τ=0.4095, p=0.009). SST and turbidity show weak and non-significant relationships with the three gases.
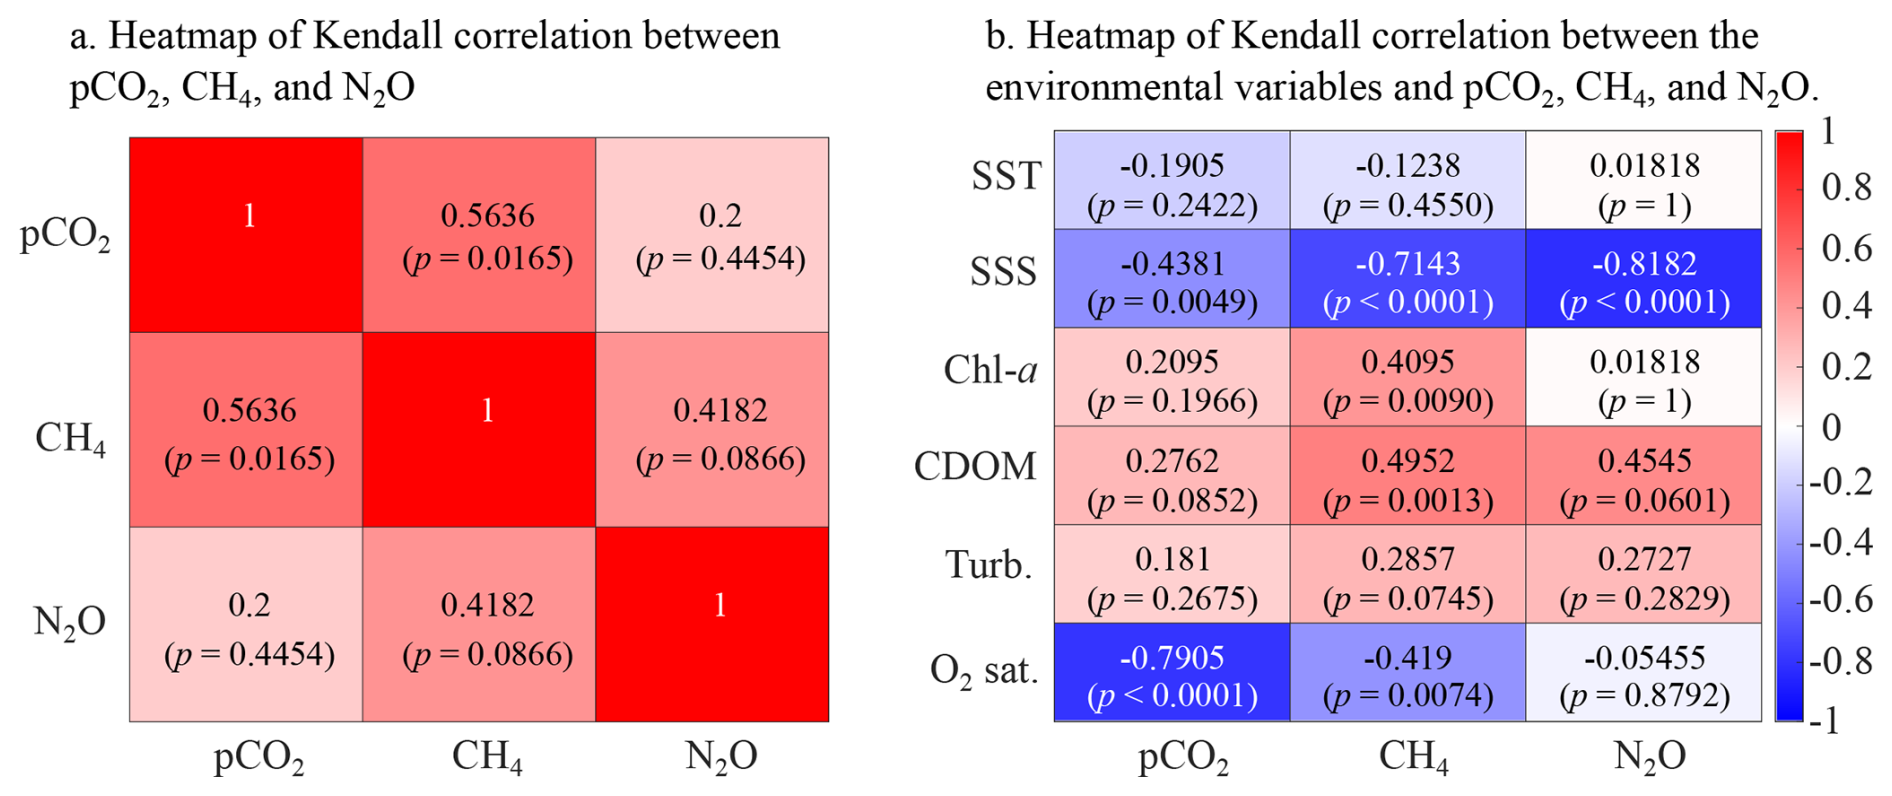
Figure 4Heatmap of Kendall correlation coefficient (a) between surface water pCO2, CH4, and N2O concentration, and (b) between main seawater biogeochemical properties (SST, SSS, chl a concentration, colored dissolved organic carbon, turbidity, and O2 saturation) and pCO2, CH4, and N2O concentration.
Surface water pCO2, CH4, and N2O concentrations showed significant spatial variation, spanning several orders of magnitude (Fig. 2). Humborg et al. (2019) reported pCO2 and CH4 levels following the salinity gradient driven by the Karjaanjoki River, with values reaching up to 1583 µatm and 70 nmol L−1, respectively. However, these measurements were conducted in the deeper part of the archipelago's main channel, and they did not explore Pojoviken Bay. In contrast, our study focused on shallow (< 4 m depth) nearshore ecosystems. Asmala and Scheinin (2024) observed a similar range of pCO2 and CH4 concentrations across a 2000 km2 coastal region surrounding the Hanko Peninsula, with the large magnitude of both gases associated with excessive organic matter loads, elevated primary production, trapping and accumulation of allochthonous organic matter, and sedimentary conditions favourable to CH4 production. Focusing on nearshore shallow (< 4 m depth) coastal habitats around the island of Askö (Sweden, northern Baltic Sea), Roth et al. (2023) reported strong spatial variability in surface water pCO2 and CH4 concentrations and emphasized that their dynamics were highly habitat-specific. The N2O concentrations we observed were in the same range as those observed by Aalto et al. (2021) in the same area, with concentrations ranging from 25 to 50 nmol L−1 within Pojoviken Bay and from 10 to 30 nmol L−1 within the archipelago. Aalto et al. (2021) reported that higher N2O concentrations were associated with higher nitrate concentrations and inputs of allochthonous carbon, while lower N2O concentrations were associated with efficient internal recycling of N.
4.1 Salinity gradient
The Karjaanjoki river is the main source of freshwater into the studied area, delivering large amounts of allochthonous carbon and nutrients to the system (Fleming-Lehtinen et al., 2015). Changes in SSS have been suggested to strongly influence the concentration of all three GHGs (Fig. 4b), with terrestrial runoff likely contributing to elevated CH4 concentrations in the area (Asmala and Scheinin, 2024). At a first glimpse, only N2O exhibited a strong relationship with salinity (R2=0.95), while pCO2 (R2=0.58) and CH4 (R2=0.39) exhibited weaker correlations (Fig. 5, dotted black line). However, when focusing on exposed and semi-sheltered sites, the correlation with salinity strengthened considerably, reaching values up to 0.79 for pCO2, 0.94 for CH4, and 0.96 for N2O (Fig. 5, dashed red line). The impact of water mixing on surface-water pCO2 can be assessed by estimating the variation in pCO2 resulting only from the physical mixing of Karjaanjoki River water (S=0, TA = 668 µmol kg−1, DIC = 720 µmol kg−1) with a seawater endmember (black symbols in Fig. 3, S=6.42, TA = 1635 µmol kg−1, DIC = 1586 µmol kg−1). The seawater endmember was collected on 18 September 2023 at 59.77393° N, 23.2607167° E, about 7.5 km south of TZS. This calculation excludes the effects of biological activity, gas exchange, and potential precipitation or dissolution of calcium carbonate. Assuming that changes in SSS reflect a mixing ratio between the Karjaanjoki River and the seawater endmembers and based on the observed linear relationships between salinity and both TA and DIC (Fig. 3a), representing conservative mixing between the two water masses, TA and DIC can be estimated based on salinity. The estimated TA and DIC are then used to compute pCO2 (blue dashed line, Fig. 5a) using CO2SYS v3 (Sharp et al., 2023), applying the carbonic acid dissociation constants (K1 and K2) of Millero et al. (2006) and the KHSO4 formulation of Dickson (1990). While TA and DIC behaved conservatively during mixing, pCO2 exhibited a pronounced nonlinear response, similar to the one observed for exposed and semi-sheltered sites (Fig. 5a). Such behaviour has already been reported in estuaries (Abril et al., 2021; Cai et al., 2013). This suggests that the input of CO2, CH4, and N2O supersaturated water from the Karkaanjoki River is a major source for all three GHGs across the study area, with dilution playing a dominant role in GHG dynamics at exposed and semi-sheltered sites. While changes in SSS appear to explain most of the variability observed in pCO2, CH4, and N2O concentrations, deviations from the expected salinity-driven pattern, such as those observed within the archipelago, at sheltered sites, likely reflect additional local processes.
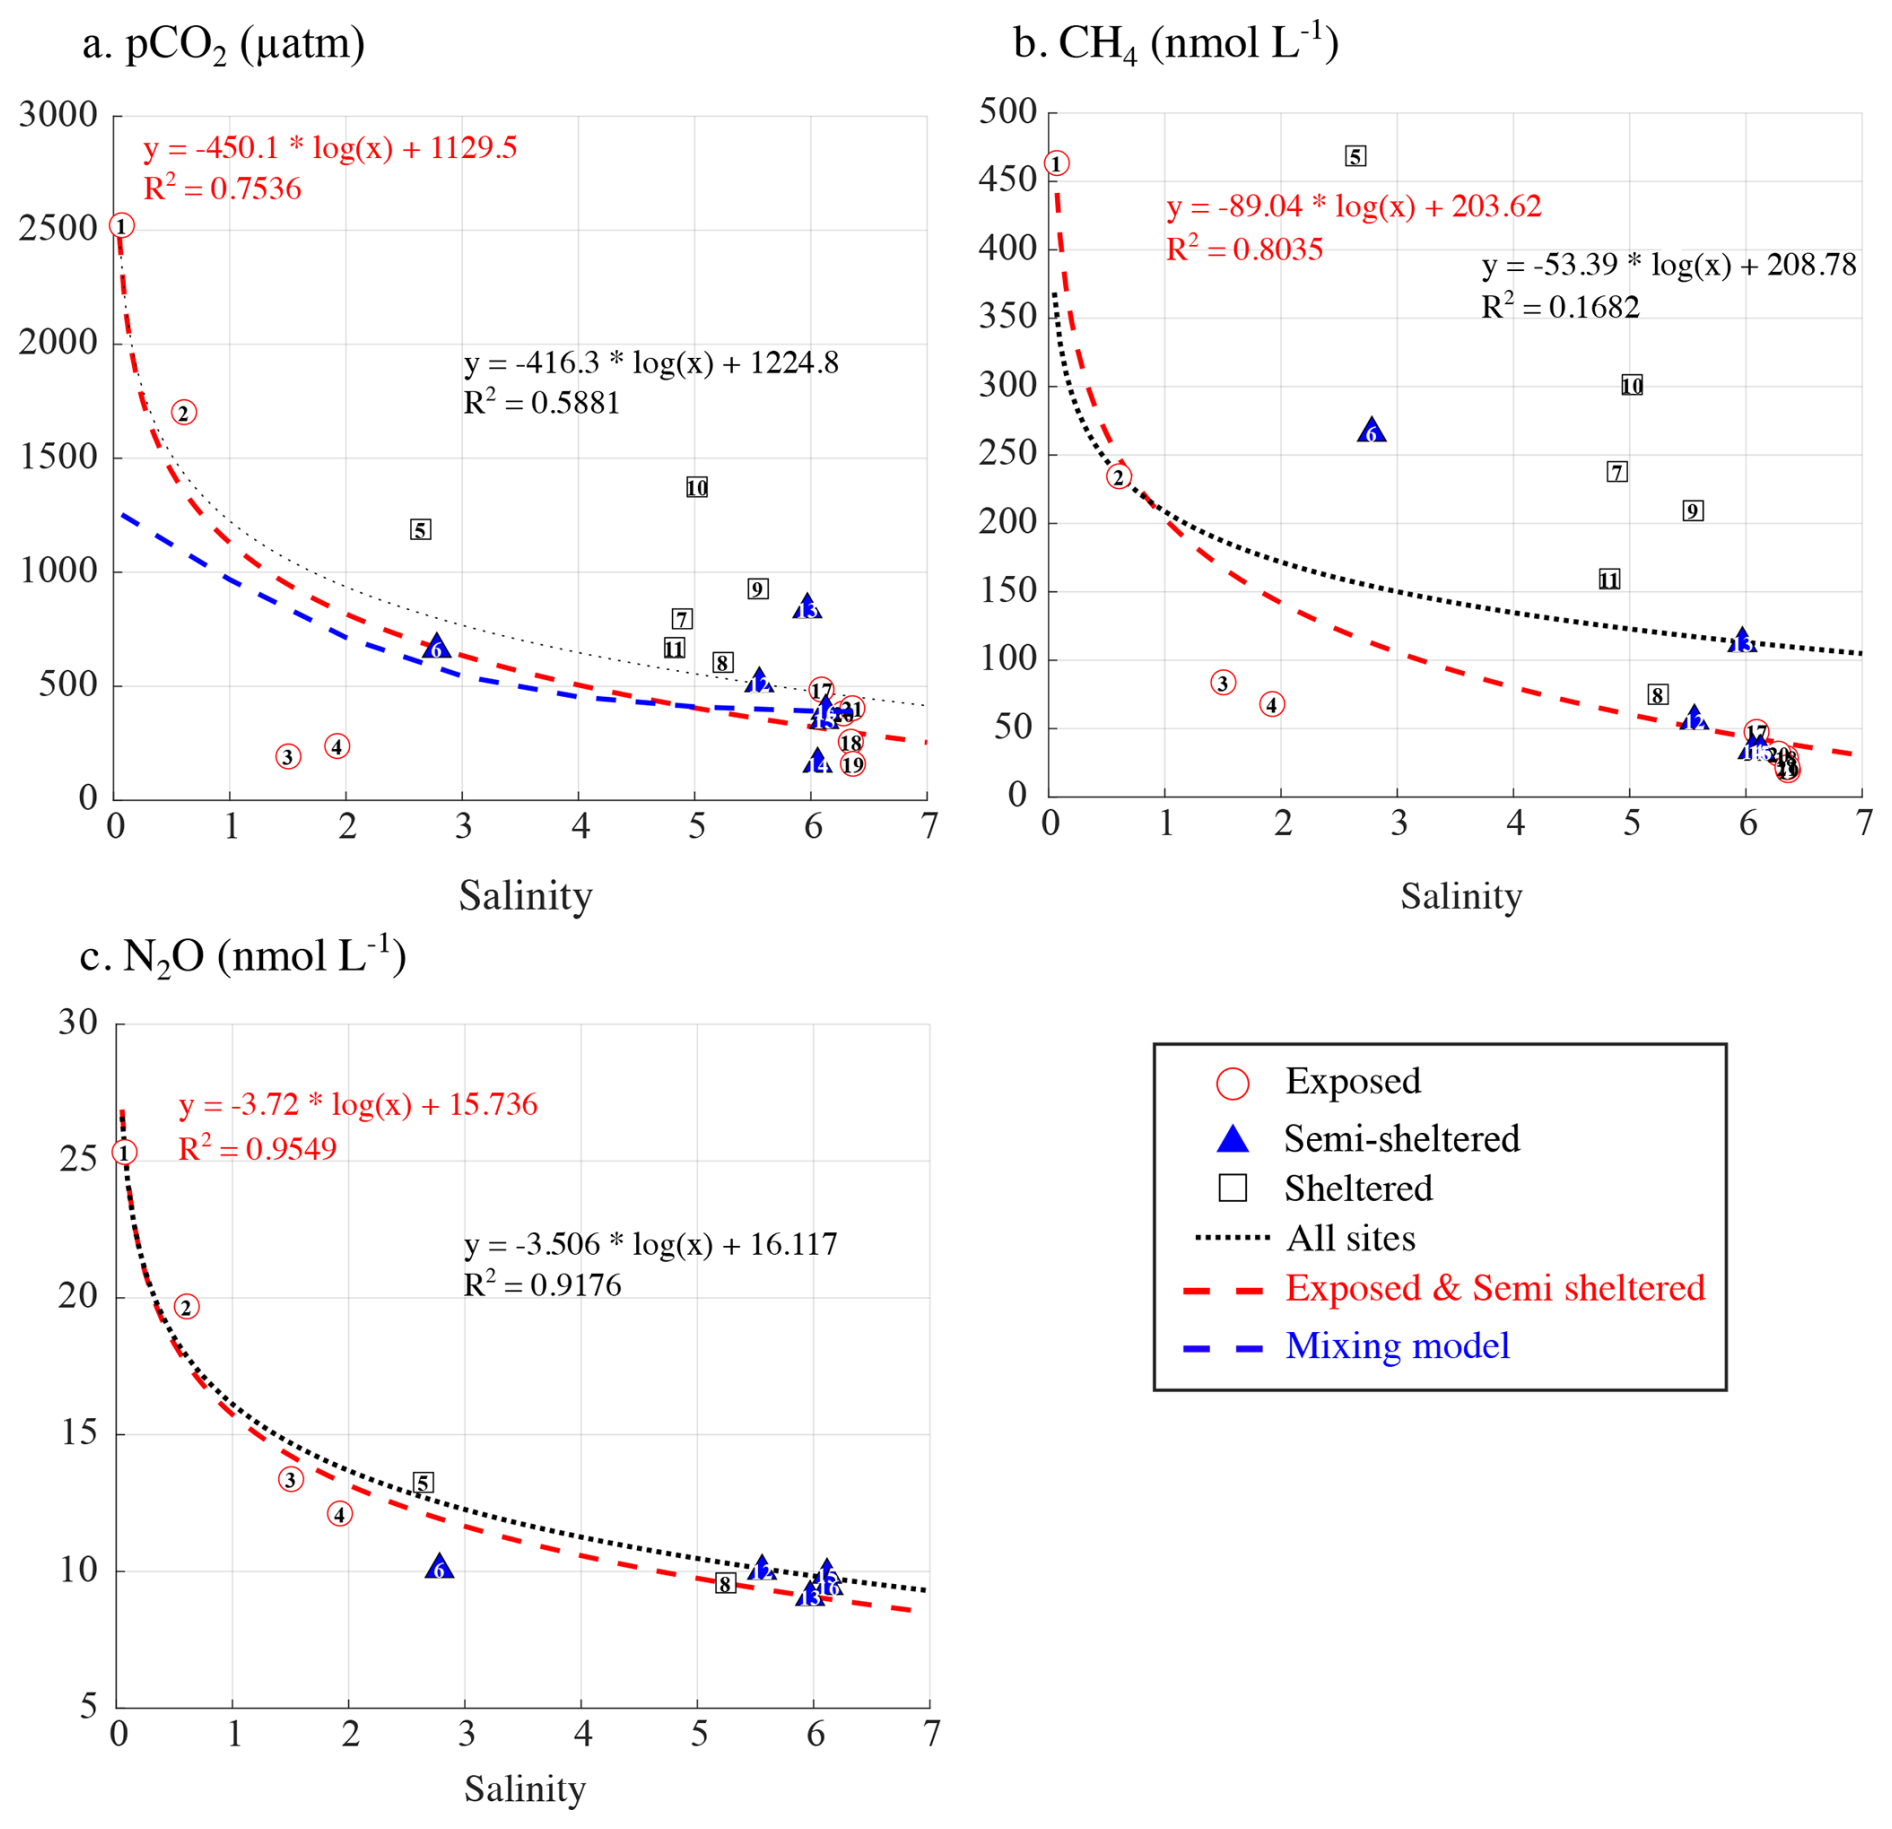
Figure 5Relationship between surface seawater salinity and (a) pCO2 (µatm), (b) CH4 (nmol L−1), and (c) N2O (nmol L−1) concentrations. In each panel, the dotted line represents the regression across all sites, while the red dashed line shows the regression limited to exposed and semi-sheltered sites. The blue line in panel (a) represents the estimated pCO2 resulting only from the mixing of the Karjaanjoki River water (S=0) with seawater (S=6.42).
4.2 Biological drivers
Many processes affecting the carbonate system are best described by examining the associated changes in DIC and TA (Zeebe and Wolf-Gladrow, 2001). However, most of the changes in TA and DIC in surface seawater appeared to be driven by salinity changes, with estimated endmember (S=0) values of 662 and 712 µmol kg−1 for TA and DIC, respectively (Fig. 3a). These estimates closely match the measured TA and DIC at the mouth of the Karjaanjoki River (668 and 720 µmol kg−1, respectively). Therefore, to discard the impact of freshwater inputs, TA and DIC were normalized to the average surface seawater salinity of 5 (denoted as nTA and nDIC, respectively) using the normalization of Friis et al. (2003). In Fig. 3b, c, and d, the dotted lines illustrate the expected responses of TA and DIC to different biogeochemical processes. Biological activity (photosynthesis/respiration) affects both TA and DIC in a ratio of −0.16 (Lazar and Loya, 1991), air-sea exchange of CO2 only affects DIC, and the precipitation-dissolution of calcium carbonate affects TA and DIC in a 2:1 ratio. However, the effect of calcifying primary producers in the carbon pool can be neglected in the Baltic Sea, except in the benthic zone (Tyrrell et al., 2008). The sampling sites are compared to the seawater endmember (S=6.42, TA = 1635 µmol kg−1, DIC = 1586 µmol kg−1, black symbol in Fig. 3). Figure 3b and c, show how exposed sites, undersaturated in pCO2 and low CH4 concentrations, follow the theoretical trend of photosynthesis and CO2 release. However, an uptake of CO2 was both measured and estimated for those sites (Fig. 2), suggesting that gas exchange as release towards the atmosphere could not explain the observed changes in the carbonate system. In contrast, sheltered sites, with supersaturated pCO2 and elevated CH4 concentrations, were more scattered around the theoretical respiration line and CO2 uptake. Gas exchange, as CO2 uptake, can also be ruled out, as both measured and estimated air-sea fluxes pointed to a net release of CO2 into the atmosphere. Altogether, this suggests that biological processes – primary production at undersaturated pCO2 sites and respiration at supersaturated sites – mainly influence the carbonate system, while the direct role of air-sea exchange of CO2 appears to be minor in shaping the inorganic carbonate dynamics across the study area. The similar pattern observed for both pCO2 and CH4 concentrations illustrated the positive relationship between the two gases (Fig. 4), where processes responsible for higher pCO2, such as respiration and/or organic matter degradation, also contribute to higher CH4 concentrations (Reeburgh, 2007). No clear pattern could be observed between the nTA : nDIC ratio and N2O concentration, as expected by the poor Kendall's coefficient of correlation (Fig. 4).
Elevated chl a concentrations (up to 37.7 µg L−1, Fig. 1) in surface seawater were reported across the studied area. Chl a measurements are typically considered as a proxy for pelagic primary production (Cloern et al., 2014). Therefore, elevated chl a could indicate active photosynthesis production, resulting in pelagic O2 production and pelagic CO2 uptake. To investigate the relationship between photosynthetic activity and surface water pCO2, CH4, and N2O concentrations, apparent oxygen utilization (AOU), calculated as the difference between oxygen saturation and measured oxygen concentration, was examined with chl a concentrations. However, no clear relationship was observed between chl a and AOU, and negative AOU values, indicative of net photosynthesis, were associated with relatively low chl a concentrations within the observed range (Fig. 6a). These negative AOU values corresponded to undersaturated pCO2 and low CH4 concentrations (Fig. 6b, c). In contrast, positive AOU values, representing net respiration, were associated with supersaturated pCO2 and elevated CH4 concentrations, both of which increased with higher AOU. A strong correlation exists between AOU and surface water pCO2 (Fig. 6b), which improves when focusing on exposed and semi-sheltered sites (red dashed line), suggesting that primary production strongly affects the carbonate system, as already indicated by the nDIC: nTA ratio (Fig. 3). Primary production could take place either in the pelagic or the benthic realm. However, the lack of correlation between chl a and AOU and the low chl a concentration associated with negative AOU suggests that pelagic primary production may not be solely responsible for the observed changes in pCO2. Pelagic primary production may be limited by the shallow water column, which restricts phytoplankton biomass and its productivity at the time, as this study was conducted at the end of the summer bloom (Uth et al., 2024). The correlation between AOU and CH4 is weaker than for CO2 (R2=0.51, black dotted line) but improves significantly when only exposed and semi-sheltered sites are considered (R2=0.78, red dashed line). O2 depletion, associated with supersaturated pCO2 and high CH4 concentration, could be related to organic matter degradation, as large amounts of carbon are turned over during the summer (Attard et al., 2019). However, here as well, limited phytoplankton biomass in the shallow water column could restrict the impact of the pelagic realm on CH4 concentration. N2O exhibited a clear positive correlation with AOU (R2>0.7). This correlation is known to reflect the coupling between O2 consumption (from organic matter remineralization) and microbial nitrogen cycling processes that produce N2O (Kock et al., 2016; Carrasco et al., 2017).
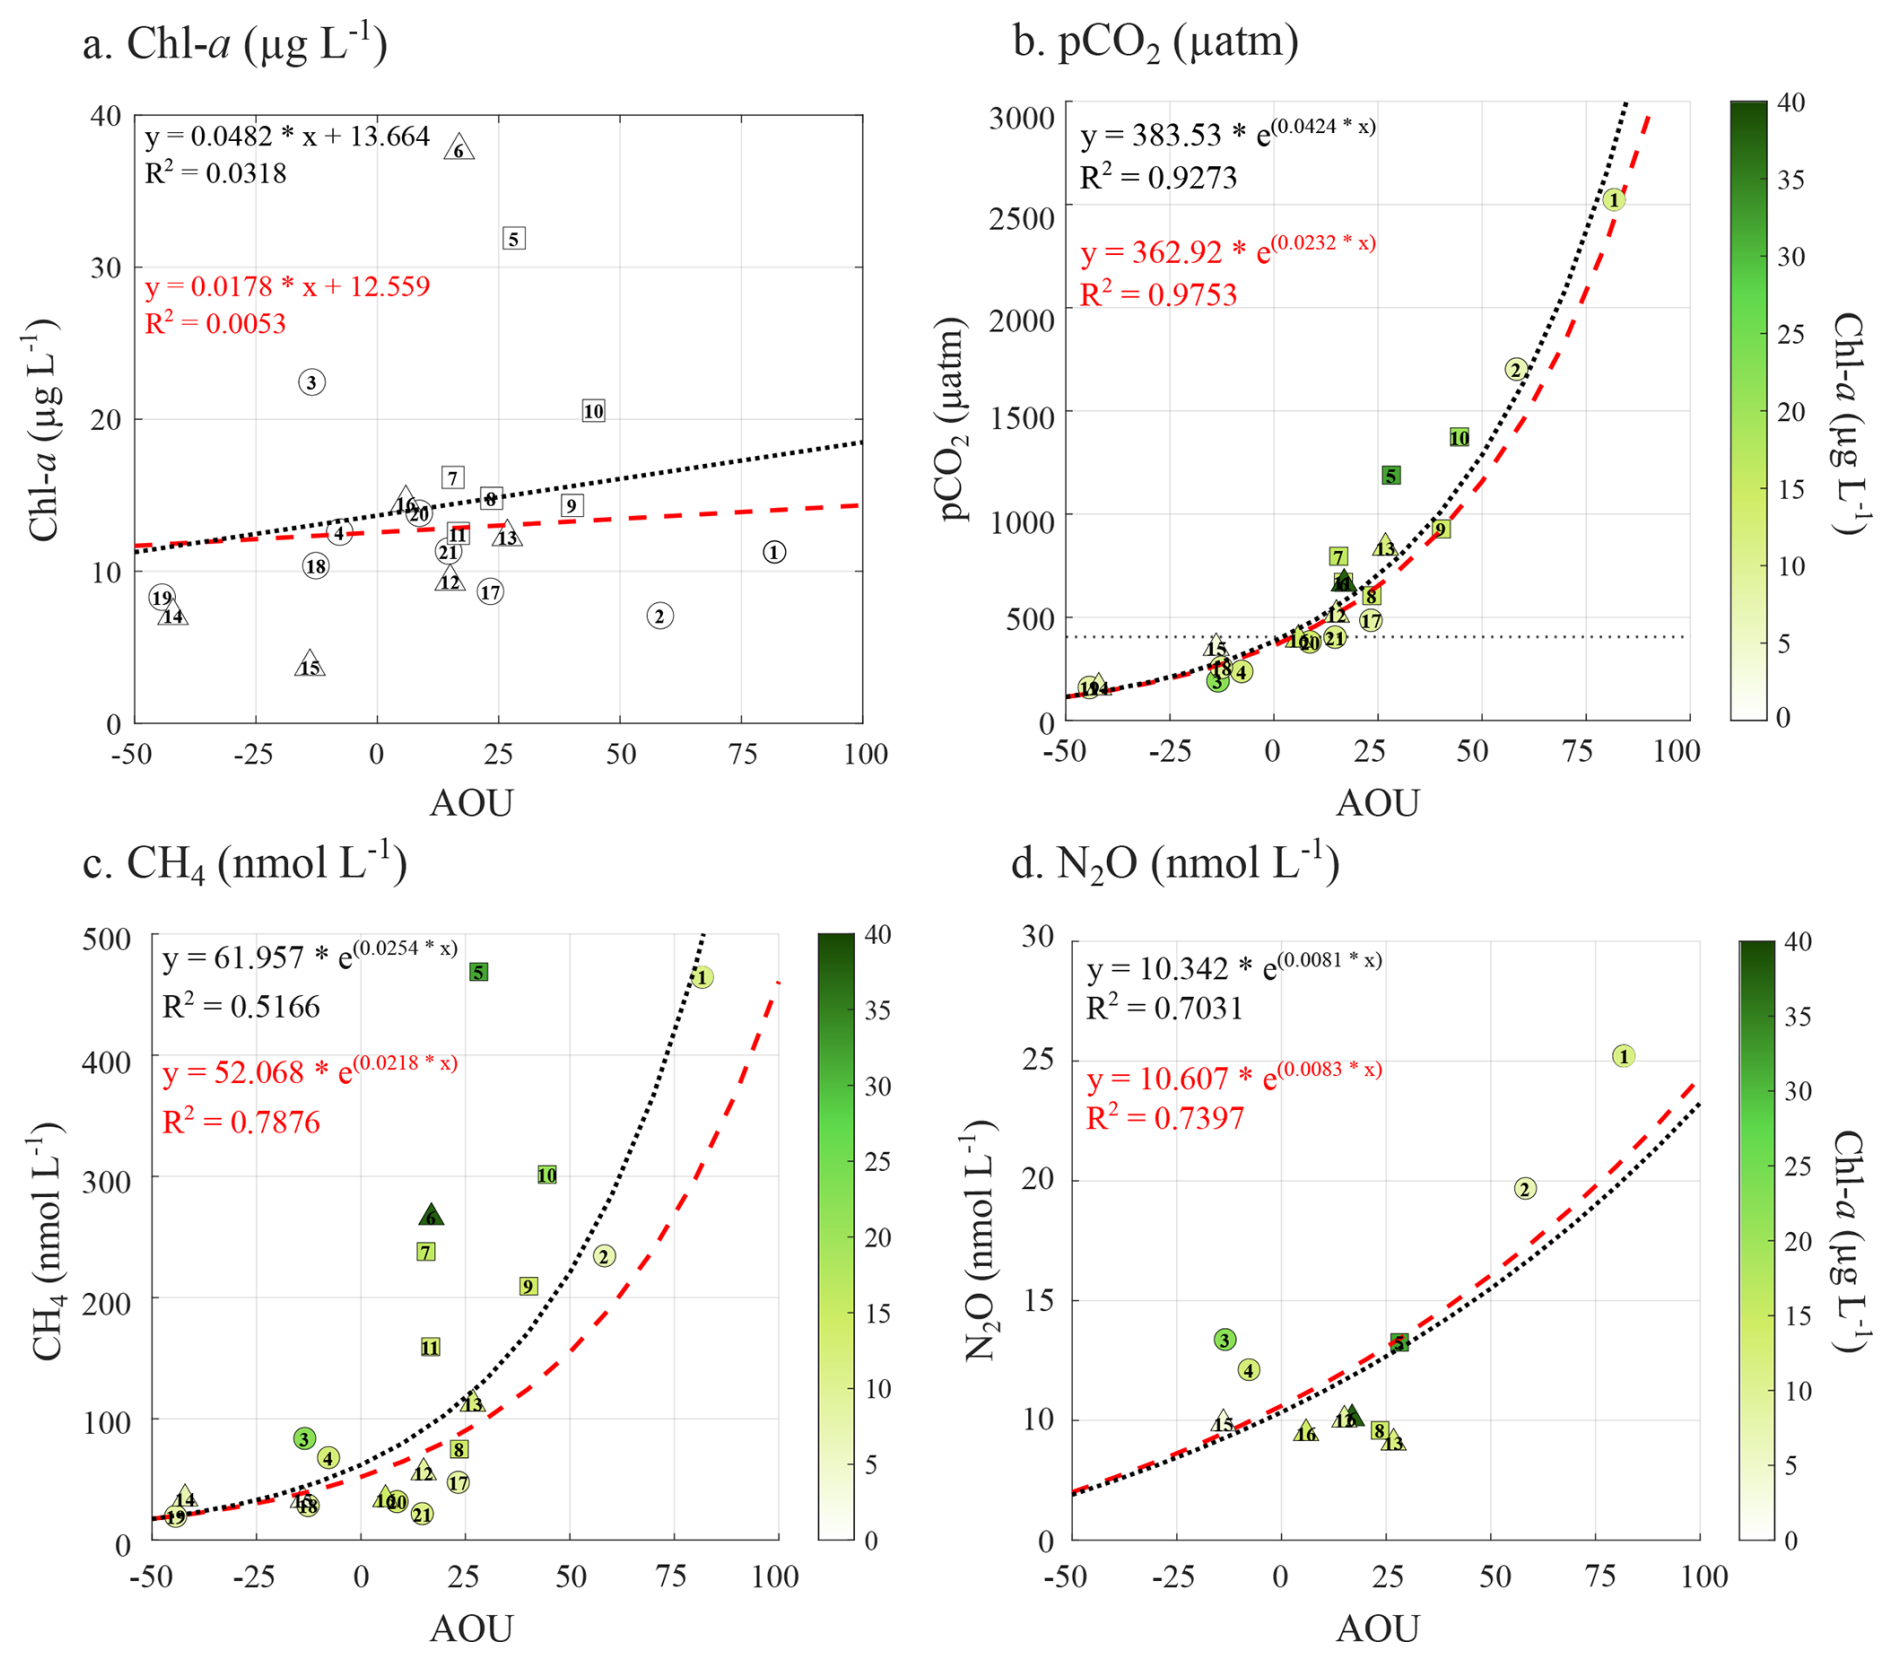
Figure 6Relationship between the apparent oxygen utilization (AOU) and (a) surface water Chl a concentration (µg L−1), (b) surface water pCO2 (in µatm), (c) CH4 (nmol L−1), and (d) N2O (nmol L−1) associated with the Chl a concentration (µg L−1). In each panel, the dotted line represents the regression across all sites, while the red dashed line shows the regression limited to exposed and semi-sheltered sites. Exposed and semi-sheltered sites are represented by circles, while sheltered sites are represented by square symbols.
Therefore, the absence of a correlation between chl a and AOU, despite AOU correlating with all three GHGs, suggests that pelagic processes alone cannot explain the observed changes in GHG concentrations. Instead, processes beyond the pelagic realm, such as benthic community production and organic-matter degradation, are likely contributing to the observed surface-water pCO2, CH4, and N2O concentrations (e.g. Roth et al., 2022, 2023).
4.3 Exposed and semi-sheltered vs sheltered sites
The inputs of freshwater supersaturated in CO2, CH4, and N2O represent a major source of GHGs to the study area. Freshwater mixing with seawater appears to control the concentration of all three GHGs at exposed and semi-sheltered sites, as much of the variability in surface seawater concentrations can be explained by salinity. In sheltered sites of the archipelago, deviations from the salinity-driven pattern indicate the influence of additional processes. Biological activity is likely the key driver, with pCO2 undersaturation associated with primary production and pCO2 supersaturation linked to respiration. However, pelagic production alone is unlikely to be the main contributor to the observed changes. Benthic processes such as benthic community metabolism (i.e., the balance between production and respiration), organic matter degradation, and sediment-water interactions are likely to contribute to both CO2 and CH4 dynamics (Attard et al., 2019; Roth et al., 2023). For CH4, riverine inputs and subsequent dilution largely determine large-scale patterns, whereas elevated concentrations at sheltered sites within the archipelago reflect localized production and limited oxidation. Large amounts of carbon are turned over in habitats from the studied area during the summer months (Attard et al., 2019), and macrophyte tissue may become a direct component of local sediment organic matter pools, which favour local CH4 production (Roth et al., 2022; Wallenius et al., 2021). Anoxic degradation of organic-rich sediments (methanogenesis), exacerbated by warm late-summer waters (Roth et al., 2022; Yvon-Durocher et al., 2014), combined with short water residence times that limit oxidation in both sediment and the overlying water column (Reeburgh, 2007), creates favourable conditions for CH4 production. Due to the sheltered nature of the sites and limited water exchange, the produced CH4 can accumulate. Similarly, enhanced respiration of organic carbon in shallow ecosystems elevates CO2 concentrations (Humborg et al., 2019). While macrophyte growth during summer can draw down pCO2 through photosynthetic CO2 uptake, the subsequent decomposition of deposited tissues may instead enhance CO2 and CH4 release. Spatial variability of N2O mirrors the findings of Aalto et al. (2021), who linked higher N2O concentrations near the Karjaanjoki River to higher nitrate inputs and allochthonous carbon inputs. They suggested that the ratio between nitrate and autochthonous organic carbon controls the balance between N-removing denitrification and N-recycling through Dissimilatory Nitrate Reduction to Ammonium (DNRA), as well as the end-product of denitrification (Aalto et al., 2021). Within the archipelago, where riverine influence is limited, DNRA can produce significant amounts of bioavailable ammonium, enhancing nitrogen recycling between sediments and surface water, especially in summer, when autochthonous biomass production and sedimentation are highest.
4.4 Air-sea flux densities
Given the strong spatial variability observed in GHG concentrations across the study area, strong variations were also observed in the corresponding air-sea fluxes. At exposed sites between Hanko and TZS, where surface seawater was undersaturated in CO2 and low in CH4 concentration, an uptake of atmospheric CO2 associated with small releases of CH4 was observed. In contrast, within the archipelago and across Pojoviken Bay, where surface waters were supersaturated in CO2 and exhibited elevated CH4 concentrations, releases of both CO2 and CH4 were observed. Sites 3 and 4 represented exceptions, being the only locations undersaturated in CO2, thus acting as a CO2 sink. Daily CH4 emissions of ≥ 0.1 mmol m−2 across all habitats are comparable to, or even higher than, CH4 fluxes reported from similar (Lundevall-Zara et al., 2021; Roth et al., 2023) or other vegetated coastal ecosystems (Al-Haj and Fulweiler, 2020; Rosentreter et al., 2021a). Regarding N2O, Pojoviken Bay is estimated to act as a source to the atmosphere. In sheltered sites of the archipelago and exposed sites near TZS, N2O concentrations close to or slightly below atmospheric equilibrium result in small emissions and occasional uptake, respectively. Our estimated air-sea exchanges overall mirrored the spatial trends of chamber-based fluxes and exhibited a similar range of air-sea exchange. Both chamber-based and estimated fluxes may underestimate the air-sea fluxes, as possible ebullition events are not considered. Humborg et al. (2019) suggested that air-sea CH4 flux is likely dominated by frequent bubbling from the sediment. This process could be dominant in shallow coastal environments, as shallow seafloor depth promotes a short residence time for CH4 in the water column, which prevents its potential for full oxidation, which, in contrast, been observed in the deep open ocean (Reeburgh, 2007). Bubbling was, however, not observed during our chamber-based measurements (a comparison between chamber-based fluxes and estimated air-sea exchange can be found in Fig. S1 in the Supplement).

Figure 7Air-sea fluxes of (a) CO2 (g m−2 d−1), and CO2-equivalent fluxes of (b) CH4 (g m−2 d−1), and (c) N2O (g m−1 d−1) estimated using their respective sustained-flux warming potential (SGWPs) over a 100-year time horizon (CH4=27; N2O = 273, relative to CO2=1, IPCC 2023), and (d) the overall budget for all three GHGs (g m−2 d−1).
The overall contribution of the study area to atmospheric GHG budgets can be assessed by combining the air-sea flux of CO2 with the CO2-equivalent fluxes of CH4 and N2O. These equivalents are calculated using their respective sustained-flux global warming potential (SGWP), as a greenhouse gas metric to describe the relative radiative impact of a standardized amount of gas over a defined time horizon. Specifically, over a 100-year time horizon, the SGWP of CH4 and N2O is 27 and 273 times, respectively, greater than that of CO2 (IPCC 2023), on a mass basis, based on:
where the CO2−eq flux of X (CH4 or N2O), , is the product of the flux of the gas (F(X)) and its respective SGWP (i.e., 27 or 273) over the time horizon of 100 years. As direct measurements of air-sea N2O fluxes were not available at the time, and to ensure consistency across all three gases, we chose to use the estimated fluxes rather than the chamber-based measurements.
Overall, the study area acted as a net source of GHGs to the atmosphere, with an average release of 1.6 g of CO2−eq m−2 d−1 over the study period, and ranging from −1.0 g of CO2−eq m−2 d−1 at S14 to 10.6 g of CO2−eq m−2 d−1 at the mouth of the Karjaanjoki River (Fig. 7d). Exposed sites between Hanko and TZS generally acted as GHGs sink, primarily due to the substantial CO2 uptake compensating for CH4 emissions. An exception was S21, where the small uptake of CO2 (−0.008 g of CO2 m−2 d−1) was offset by the release of CH4 (0.016 g of CO2−eq m−2 d−1), resulting in a net source. In Pojoviken Bay, the river mouth and S2 were acting as a strong source of GHGs to the atmosphere, with N2O fluxes in the same order of magnitude as those of CH4. However, S3 and S4, both sites undersaturated in pCO2, remained net GHG sinks, despite releasing similar amounts of CH4 and N2O. In the archipelago, all sheltered sites remained a net source of GHGs to the atmosphere. If, from a climate mitigation perspective, it may seem sufficient to focus on CO2 (as Fig. 7a and d are pretty similar), as in the blue carbon approach, it has been shown that CO2 uptake can be offset by CH4 emissions (Roth et al., 2023). Our findings demonstrate that, if CH4 matters in coastal, nearshore environments, so does N2O, since N2O fluxes are not only of the same order of magnitude as CH4 fluxes but can either reinforce the warming effect of CH4 or partially counterbalance it.
Shallow coastal ecosystems are highly heterogeneous, with their spatial structure and temporal dynamics of benthic communities shaping ecosystem functions (Snelgrove et al., 2014). This heterogeneity drives strong spatial variability in coastal biogeochemical processes, which exert an important influence on the carbon cycle at both local and global scales (Ward et al., 2020). Yet, despite their importance, identifying the locations and processes regulating coastal CO2, CH4, and N2O fluxes remains uncommon, and global estimates still fail to capture the heterogeneous and dynamic nature of these environments (Rosentreter et al., 2021b). In particular, northern temperate coastal habitats are poorly represented in current GHG budgets (Resplandy et al., 2024), despite their relative importance: shallow waters (< 5 m) in the Baltic Sea cover ∼ 30 000 km2 (HELCOM, 2013), an area comparable to 20 % of the global distribution of mangroves (Bunting et al., 2018) or seagrass meadows (McKenzie et al., 2020).
Across the study area, freshwater inputs from the Karjaanjoki River and subsequent mixing with seawater largely determined the overall spatial patterns of surface water pCO2, CH4, and N2O concentrations. However, important deviations from this salinity-driven control were observed at the local scale. In sheltered sites within the archipelago, elevated CH4 concentrations and supersaturated pCO2 likely reflected biological processes, including enhanced organic matter respiration and methanogenesis in warm, late-summer shallow waters and sediments, where limited oxidation favoured CH4 accumulation. By contrast, at semi-sheltered and exposed sites, mixing processes exerted stronger control, leading to lower GHG concentrations. N2O patterns followed riverine influence with higher concentrations near the river mouth associated with inputs of allochthonous carbon and elevated nitrate availability, and lower concentrations within the archipelago reflecting reduced riverine input and active nitrogen recycling between sediments and surface waters (Aalto et al., 2021). Together, these results underline the dual importance of large-scale physical mixing and local biological processes in shaping the spatial heterogeneity of GHG dynamics. Our findings suggest that benthic ecosystems likely play a pivotal role in regulating GHG dynamics, especially in shallow coastal environments, not only through production but also through consumption pathways, which remain insufficiently constrained in current budgets (Rodil et al., 2021; Roth et al., 2022; Wallenius et al., 2021).
When translated into CO2−eq, air–sea GHG fluxes were dominated by CO2, while CH4 and N2O contributed comparably but in different ways. CH4 consistently acted as a source, whereas N2O partially offset the CH4 release through uptake. This interaction highlights that the balance between production and consumption processes, especially within different seafloor habitats, is critical for understanding coastal contributions to the global carbon budget. There is a critical need to quantify CH4 and N2O exchanges more accurately and to deepen our understanding of the environmental and management factors that control their production and consumption. This would help make global estimates less sensitive to statistical assumptions and reduce uncertainties in blue carbon potential estimates (Rosentreter et al., 2021a).
While coastal ecosystems are often recognized as CO2 sinks, recent work shows that they are also significant sources of CH4 and N2O that can offset a substantial portion of the climate benefit of taking up CO2 (Rosentreter et al., 2021a; Roth et al., 2023; Resplandy et al., 2024). Given their extent, northern temperate coastal ecosystems represent a relevant but overlooked source of GHGs, with the potential to amplify the global ocean carbon budget by increasing net greenhouse gas emissions to the atmosphere. Our results highlight the urgent need for research that integrates GHG with biodiversity, benthic–pelagic interactions, and microbial processes, and that resolves temporal variability across seasonal cycles. Such knowledge is essential to improve predictions of how coastal ecosystems will mediate carbon–climate feedback under future environmental change.
The data are available from the Bolin Centre Database at https://doi.org/10.17043/coastclim-geilfus-2026-spatial-ghg-1 (Geilfus et al., 2026).
The supplement related to this article is available online at https://doi.org/10.5194/bg-23-1931-2026-supplement.
NXG, AN, and AV designed the hypothesis field sampling. Field measurements were carried out by NXG and AV, while laboratory and data analyses were performed by NXG and BD. NXG prepared the manuscript with input from all co-authors. All authors approved the final version of the manuscript for submission.
The contact author has declared that none of the authors has any competing interests.
Views and opinions expressed are, however, those of the authors only and do not necessarily reflect those of the European Union or CINEA. Neither the European Union nor the granting authority can be held responsible for them. BD is a research associate at the F.R.S-FNRS.
Publisher's note: Copernicus Publications remains neutral with regard to jurisdictional claims made in the text, published maps, institutional affiliations, or any other geographical representation in this paper. The authors bear the ultimate responsibility for providing appropriate place names. Views expressed in the text are those of the authors and do not necessarily reflect the views of the publisher.
This study was supported by the Jane and Aatos Erkko Foundation (AN, NXG), Walter and Andrée de Nottbeck Foundation (NXG), and the Sophie von Julin's Foundation (AN, AV) and utilized research infrastructure facilities at Tvärminne Zoological Station, University of Helsinki, as part of FINMARI (Finnish Marine Research Infrastructure Consortium). This project also received infrastructure funding from the European Union – NextGenerationEU instrument and is funded by the Research Council of Finland under grant number 345495. This is a publication from the Centre for Coastal Ecosystem and Climate Change Research (https://www.coastclim.org, last access: 9 March 2026). We thank Kurt Spence for his assistance with field work.
The authors would also like to thank Truong An Nguyen, Damian Leonardo Arévalo Martinez, and an anonymous reviewer for their constructive comments and suggestions, which significantly improved the quality of the manuscript.
CH4 and N2O measurements were supported by GreenFeedBack RIA (Greenhouse gas fluxes and earth system feedback) funded by the European Union's HORIZON research and innovation program under grant agreement no. 101056921.
Open-access funding was provided by the Helsinki University Library.
This paper was edited by Ji-Hyung Park and reviewed by Truong An Nguyen, Damian Leonardo Arévalo-Martínez, and one anonymous referee.
Aalto, S. L., Asmala, E., Jilbert, T., and Hietanen, S.: Autochthonous organic matter promotes DNRA and suppresses N2O production in sediments of the coastal Baltic Sea, Estuar. Coast. Shelf. Sci., 255, 107369, https://doi.org/10.1016/j.ecss.2021.107369, 2021.
Abril, G. and Borges, A. V.: Carbon Dioxide and Methane Emissions from Estuaries, in: Greenhouse Gas Emissions – Fluxes and Processes: Hydroelectric Reservoirs and Natural Environments, edited by: Tremblay, A., Varfalvy, L., Roehm, C., and Garneau, M., Springer Berlin Heidelberg, Berlin, Heidelberg, 187–207, https://doi.org/10.1007/978-3-540-26643-3_8, 2005.
Abril, G., Libardoni, B. G., Brandini, N., Cotovicz, L. C., Medeiros, P. R. P., Cavalcante, G. H., and Knoppers, B. A.: Thermodynamic uptake of atmospheric CO2 in the oligotrophic and semiarid São Francisco estuary (NE Brazil), Mar. Chem., 233, 103983, https://doi.org/10.1016/j.marchem.2021.103983, 2021.
Al-Haj, A. N. and Fulweiler, R. W.: A synthesis of methane emissions from shallow vegetated coastal ecosystems, Glob. Change Biol., 26, 2988–3005, https://doi.org/10.1111/gcb.15046, 2020.
Asmala, E. and Scheinin, M.: Persistent hot spots of CO2 and CH4 in coastal nearshore environments, Limnol. Oceanogr. Lett., 9, 119–127, https://doi.org/10.1002/lol2.10370, 2024.
Attard, K. M., Rodil, I. F., Glud, R. N., Berg, P., Norkko, J., and Norkko, A.: Seasonal ecosystem metabolism across shallow benthic habitats measured by aquatic eddy covariance, Limnol. Oceanogr. Lett., 4, 79–86, https://doi.org/10.1002/lol2.10107, 2019.
Bange, H. W.: Nitrous oxide and methane in European coastal waters, Estuar. Coast. Shelf. Sci., 70, 361–374, https://doi.org/10.1016/j.ecss.2006.05.042, 2006.
Bauer, J. E., Cai, W. J., Raymond, P. A., Bianchi, T. S., Hopkinson, C. S., and Regnier, P. A. G.: The changing carbon cycle of the coastal ocean, Nature, https://doi.org/10.1038/nature12857, 2013.
Bonaglia, S., Cheung, H. L. S., Politi, T., Vybernaite-Lubiene, I., McKenzie, T., Santos, I. R., and Zilius, M.: Eutrophication and urbanization enhance methane emissions from coastal lagoons, Limnol. Oceanogr. Lett., 10, 140–150, https://doi.org/10.1002/lol2.10430, 2025.
Borges, A. V., Delille, B., Schiettecatte, L.-S., Gazeau, F., Abril, G., and Frankignoulle, M.: Gas transfer velocities of CO2 in three European estuaries (Randers Fjord, Scheldt, and Thames), Limnol. Oceanogr., 49, 1630–1641, https://doi.org/10.4319/lo.2004.49.5.1630, 2004.
Borges, A. V., Delille, B., and Frankignoulle, M.: Budgeting sinks and sources of CO2 in the coastal ocean: Diversity of ecosystems counts, Geophys. Res. Lett., 32, https://doi.org/10.1029/2005GL023053, 2005.
Borges, A. V., Champenois, W., Gypens, N., Delille, B., and Harlay, J.: Massive marine methane emissions from near-shore shallow coastal areas, Sci. Rep., 6, 27908, https://doi.org/10.1038/srep27908, 2016.
Borges, A. V., Abril, G., and Bouillon, S.: Carbon dynamics and CO2 and CH4 outgassing in the Mekong delta, Biogeosciences, 15, 1093–1114, https://doi.org/10.5194/bg-15-1093-2018, 2018.
Brase, L., Bange, H. W., Lendt, R., Sanders, T., and Dähnke, K.: High Resolution Measurements of Nitrous Oxide (N2O) in the Elbe Estuary, Front. Mar. Sci., 4, https://doi.org/10.3389/fmars.2017.00162, 2017.
Bunting, P., Rosenqvist, A., Lucas, R. M., Rebelo, L.-M., Hilarides, L., Thomas, N., Hardy, A., Itoh, T., Shimada, M., and Finlayson, C. M.: The Global Mangrove Watch – A New 2010 Global Baseline of Mangrove Extent. Remote Sens. 10, 1669, https://doi.org/10.3390/rs10101669, 2018.
Cai, W.-J., Arthur Chen, C. T., and Borges, A.: Carbon dioxide dynamics and fluxes in coastal waters influenced by river plumes, in: Biogeochemical Dynamics at Major River-Coastal Interfaces: Linkages with Global Change, edited by: Bianchi, T. S., Allison, M. A., and Cai, W.-J., Cambridge University Press, Cambridge, 155–173, https://doi.org/10.1017/CBO9781139136853.010, 2013.
Carrasco, C., Karstensen, J., and Farias, L.: On the Nitrous Oxide Accumulation in Intermediate Waters of the Eastern South Pacific Ocean, Front. Mar. Sci., 4, https://doi.org/10.3389/fmars.2017.00024, 2017.
Chen, C.-T. A. and Borges, A. V: Reconciling opposing views on carbon cycling in the coastal ocean: Continental shelves as sinks and near-shore ecosystems as sources of atmospheric CO2, Deep-Sea Res. Pt. II, 56, 578–590, https://doi.org/10.1016/j.dsr2.2009.01.001, 2009.
Cheung, H. L. S., Zilius, M., Politi, T., Lorre, E., Vybernaite-Lubiene, I., Santos, I. R., and Bonaglia, S.: Nitrate-Driven Eutrophication Supports High Nitrous Oxide Production and Emission in Coastal Lagoons, J. Geophys. Res.-Biogeo., 130, e2024JG008510, https://doi.org/10.1029/2024JG008510, 2025.
Cloern, J. E., Foster, S. Q., and Kleckner, A. E.: Phytoplankton primary production in the world's estuarine-coastal ecosystems, Biogeosciences, 11, 2477–2501, https://doi.org/10.5194/bg-11-2477-2014, 2014.
Dickson, A. G.: Thermodynamics of the dissociation of boric acid in synthetic seawater from 273.15 to 318.15 K, Deep-Sea Res. Pt. A, 37, 755–766, https://doi.org/10.1016/0198-0149(90)90004-F, 1990.
Elliott, M. and Whitfield, A. K.: Challenging paradigms in estuarine ecology and management, Estuar. Coast. Shelf. Sci., 94, 306–314, https://doi.org/10.1016/j.ecss.2011.06.016, 2011.
Fleming-Lehtinen, V., Räike, A., Kortelainen, P., Kauppila, P., and Thomas, D. N.: Organic Carbon Concentration in the Northern Coastal Baltic Sea between 1975 and 2011, Estuar. Coasts, 38, 466–481, https://doi.org/10.1007/s12237-014-9829-y, 2015.
Frankignoulle, M.: Field measurements of air-sea CO2 exchange, Limnol. Oceanogr., 33, 313–322, https://doi.org/10.4319/lo.1988.33.3.0313, 1988.
Frankignoulle, M., Abril, G., Borges, A., Bourge, I., Canon, C., Delille, B., Libert, E., and Théate, J.-M.: Carbon Dioxide Emission from European Estuaries, Science, 282, 434–436, https://doi.org/10.1126/science.282.5388.434, 1998.
Friis, K., Körtzinger, A., and Wallace, D. W. R.: The salinity normalization of marine inorganic carbon chemistry data, Geophys. Res. Lett., 30, https://doi.org/10.1029/2002GL015898, 2003.
Gammal, J., Järnström, M., Bernard, G., Norkko, J., and Norkko, A.: Environmental Context Mediates Biodiversity–Ecosystem Functioning Relationships in Coastal Soft-sediment Habitats, Ecosystems, 22, 137–151, https://doi.org/10.1007/s10021-018-0258-9, 2019.
Gattuso, J.-P., Frankignoulle, M., and Wollast, R.: Carbon and Carbonate Metabolism in Coastal Aquatic Ecosystems, Annu. Rev. Ecol. Syst., 29, 405–434, 1998.
Geilfus, N.-X., Norkko, A., Villnäs, A., and Delille, B.: Spatial greenhouse gas dynamics, physical and biogeochemical properties of surface water, Baltic Sea, Finland, Aug–Sep 2023, Dataset version 1, Bolin Centre Database [data set], https://doi.org/10.17043/coastclim-geilfus-2026-spatial-ghg-1, 2026.
Gran, G.: Determination of the equivalence point in potentiometric titrations. Part II, Analyst, 77, 661–671, https://doi.org/10.1039/AN9527700661, 1952.
Gustafsson, C. and Norkko, A.: Quantifying the importance of functional traits for primary production in aquatic plant communities, J. Ecol., 107, 154–166, https://doi.org/10.1111/1365-2745.13011, 2019.
HELCOM: Red List of Baltic Sea underwater biotopes, habitats and biotope complexes, Baltic Sea Environmental Proceedings No. 138, https://helcom.fi/wp-content/uploads/2019/08/Red-List_Baltic-Sea-underwater-biotopes-habitats-and-biotope-complexes_BSEP138.pdf (last access: 9 March 2026), 2013.
Hoegh-Guldberg, O., Jacob, D., Taylor, M., Guillén Bolaños, T., Bindi, M., Brown, S., Camilloni, I. A., Diedhiou, A., Djalante, R., Ebi, K., Engelbrecht, F., Guiot, J., Hijioka, Y., Mehrotra, S., Hope, C. W., Payne, A. J., Pörtner, H.-O., Seneviratne, S. I., Thomas, A., Warren, R., and Zhou, G.: The human imperative of stabilizing global climate change at 1.5 °C, Science, 365, eaaw6974, https://doi.org/10.1126/science.aaw6974, 2019.
Hsu, S. A., Meindl, E. A., and Gilhousen, D. B.: Determining the Power-Law Wind-Profile Exponent under Near-Neutral Stability Conditions at Sea, J. Appl. Meteorol. Clim., 33, 757–765, https://doi.org/10.1175/1520-0450(1994)033<0757:DTPLWP>2.0.CO;2, 1994.
Humborg, C., Geibel, Marc. C., Sun, X., McCrackin, M., Mörth, C.-M., Stranne, C., Jakobsson, M., Gustafsson, B., Sokolov, A., Norkko, A., and Norkko, J.: High Emissions of Carbon Dioxide and Methane From the Coastal Baltic Sea at the End of a Summer Heat Wave, Front. Mar. Sci., 6, https://doi.org/10.3389/fmars.2019.00493, 2019.
IPCC: Sections, in: Climate Change 2023: Synthesis Report. Contribution of Working Groups I, II, and III to the Sixth Assessment Report of the Intergovernmental Panel on Climate Change, edited by: Lee, H. and Romero, J., IPCC, Geneva, Switzerland, 35–115, https://doi.org/10.59327/IPCC/AR6-9789291691647, 2023.
James, K., Macreadie, P. I., Burdett, H. L., Davies, I., and Kamenos, N. A.: It's time to broaden what we consider a “blue carbon ecosystem”, Glob. Change Biol., 30, e17261, https://doi.org/10.1111/gcb.17261, 2024.
Kock, A., Arévalo-Martínez, D. L., Löscher, C. R., and Bange, H. W.: Extreme N2O accumulation in the coastal oxygen minimum zone off Peru, Biogeosciences, 13, 827–840, https://doi.org/10.5194/bg-13-827-2016, 2016.
Kristensen, E., Flindt, M. R., and Quintana, C. O.: Predicting Climate Mitigation Through Carbon Burial in Blue Carbon Ecosystems – Challenges and Pitfalls, Glob. Change Biol., 31, e70022, https://doi.org/10.1111/gcb.70022, 2025.
Lammerant, R., Hölttä, J., Pykäri, J., Nishant, N., Villnäs, A., Wikström, S. A., Norkko, A., and Gustafsson, C.: Environmental gradients strongly affect functional composition and biomass C stocks within aquatic plant meadows, Ecosphere, 16, e70327, https://doi.org/10.1002/ecs2.70327, 2025.
Lazar, B. and Loya, Y.: Bioerosion of coral reefs-A chemical approach, Limnol. Oceanogr., 36, 377–383, https://doi.org/10.4319/lo.1991.36.2.0377, 1991.
Le Quéré, C., Andrew, R. M., Canadell, J. G., Sitch, S., Korsbakken, J. I., Peters, G. P., Manning, A. C., Boden, T. A., Tans, P. P., Houghton, R. A., Keeling, R. F., Alin, S., Andrews, O. D., Anthoni, P., Barbero, L., Bopp, L., Chevallier, F., Chini, L. P., Ciais, P., Currie, K., Delire, C., Doney, S. C., Friedlingstein, P., Gkritzalis, T., Harris, I., Hauck, J., Haverd, V., Hoppema, M., Klein Goldewijk, K., Jain, A. K., Kato, E., Körtzinger, A., Landschützer, P., Lefèvre, N., Lenton, A., Lienert, S., Lombardozzi, D., Melton, J. R., Metzl, N., Millero, F., Monteiro, P. M. S., Munro, D. R., Nabel, J. E. M. S., Nakaoka, S., O'Brien, K., Olsen, A., Omar, A. M., Ono, T., Pierrot, D., Poulter, B., Rödenbeck, C., Salisbury, J., Schuster, U., Schwinger, J., Séférian, R., Skjelvan, I., Stocker, B. D., Sutton, A. J., Takahashi, T., Tian, H., Tilbrook, B., van der Laan-Luijkx, I. T., van der Werf, G. R., Viovy, N., Walker, A. P., Wiltshire, A. J., and Zaehle, S.: Global Carbon Budget 2016, Earth Syst. Sci. Data, 8, 605–649, https://doi.org/10.5194/essd-8-605-2016, 2016.
Lovelock, C. E. and Duarte, C. M.: Dimensions of Blue Carbon and emerging perspectives, Biol. Lett., 15, 20180781, https://doi.org/10.1098/rsbl.2018.0781, 2019.
Lundevall-Zara, M., Lundevall-Zara, E., and Brüchert, V.: Sea-Air Exchange of Methane in Shallow Inshore Areas of the Baltic Sea, Front. Mar. Sci., 8, https://doi.org/10.3389/fmars.2021.657459, 2021.
Macreadie, P. I., Costa, M. D. P., Atwood, T. B., Friess, D. A., Kelleway, J. J., Kennedy, H., Lovelock, C. E., Serrano, O., and Duarte, C. M.: Blue carbon as a natural climate solution, Nat. Rev. Earth Environ., 2, 826–839, https://doi.org/10.1038/s43017-021-00224-1, 2021.
Mäkelin, S., Lewandowska, A. M., Rodil, I. F., Karlson, A. M. L., Humborg, C., and Villnäs, A.: Linking Resource Quality and Biodiversity to Benthic Ecosystem Functions Across a Land-to-Sea Gradient, Ecosystems, 27, 329–345, https://doi.org/10.1007/s10021-023-00891-9, 2024.
McKenzie, L. J., Nordlund, L. M., Jones, B. L., Cullen-Unsworth, L. C., Roelfsema, C., and Unsworth, R. K. F.: The global distribution of seagrass meadows, Environ. Res. Lett., 15, 74041, https://doi.org/10.1088/1748-9326/ab7d06, 2020.
Mcleod, E., Chmura, G. L., Bouillon, S., Salm, R., Björk, M., Duarte, C. M., Lovelock, C. E., Schlesinger, W. H., and Silliman, B. R.: A blueprint for blue carbon: toward an improved understanding of the role of vegetated coastal habitats in sequestering CO2, Front. Ecol. Environ., 9, 552–560, https://doi.org/10.1890/110004, 2011.
Millero, F. J., Graham, T. B., Huang, F., Bustos-Serrano, H., and Pierrot, D.: Dissociation constants of carbonic acid in seawater as a function of salinity and temperature, Mar. Chem., 100, 80–94, https://doi.org/10.1016/j.marchem.2005.12.001, 2006.
Murray, R. H., Erler, D. V, and Eyre, B. D.: Nitrous oxide fluxes in estuarine environments: response to global change, Glob. Change Biol., 21, 3219–3245, https://doi.org/10.1111/gcb.12923, 2015.
Räike, A., Kortelainen, P., Mattsson, T., and Thomas, D. N.: 36 year trends in dissolved organic carbon export from Finnish rivers to the Baltic Sea, Sci. Total Environ., 435–436, 188–201, https://doi.org/10.1016/j.scitotenv.2012.06.111, 2012.
Raymond, P. A., Bauer, J. E., and Cole, J. J.: Atmospheric CO2 evasion, dissolved inorganic carbon production, and net heterotrophy in the York River estuary, Limnol. Oceanogr., 45, 1707–1717, https://doi.org/10.4319/lo.2000.45.8.1707, 2000.
Reeburgh, W. S.: Oceanic Methane Biogeochemistry, Chem. Rev., 107, 486–513, https://doi.org/10.1021/cr050362v, 2007.
Regnier, P., Resplandy, L., Najjar, R. G., and Ciais, P.: The land-to-ocean loops of the global carbon cycle, Nature, 603, 401–410, https://doi.org/10.1038/s41586-021-04339-9, 2022.
Resplandy, L., Hogikyan, A., Müller, J. D., Najjar, R. G., Bange, H. W., Bianchi, D., Weber, T., Cai, W.-J., Doney, S. C., Fennel, K., Gehlen, M., Hauck, J., Lacroix, F., Landschützer, P., Le Quéré, C., Roobaert, A., Schwinger, J., Berthet, S., Bopp, L., Chau, T. T. T., Dai, M., Gruber, N., Ilyina, T., Kock, A., Manizza, M., Lachkar, Z., Laruelle, G. G., Liao, E., Lima, I. D., Nissen, C., Rödenbeck, C., Séférian, R., Toyama, K., Tsujino, H., and Regnier, P.: A Synthesis of Global Coastal Ocean Greenhouse Gas Fluxes, Global Biogeochem. Cy., 38, e2023GB007803, https://doi.org/10.1029/2023GB007803, 2024.
Rodil, I. F., Attard, K. M., Gustafsson, C., and Norkko, A.: Variable contributions of seafloor communities to ecosystem metabolism across a gradient of habitat-forming species, Mar. Environ. Res., 167, 105321, https://doi.org/10.1016/j.marenvres.2021.105321, 2021.
Rosentreter, J. A., Maher, D. T., Erler, D. V, Murray, R., and Eyre, B. D.: Factors controlling seasonal CO2 and CH4 emissions in three tropical mangrove-dominated estuaries in Australia, Estuar. Coast. Shelf. Sci., 215, 69–82, https://doi.org/10.1016/j.ecss.2018.10.003, 2018.
Rosentreter, J. A., Borges, A. V, Deemer, B. R., Holgerson, M. A., Liu, S., Song, C., Melack, J., Raymond, P. A., Duarte, C. M., Allen, G. H., Olefeldt, D., Poulter, B., Battin, T. I., and Eyre, B. D.: Half of global methane emissions come from highly variable aquatic ecosystem sources, Nat. Geosci., 14, 225–230, https://doi.org/10.1038/s41561-021-00715-2, 2021a.
Rosentreter, J. A., Al-Haj, A. N., Fulweiler, R. W., and Williamson, P.: Methane and Nitrous Oxide Emissions Complicate Coastal Blue Carbon Assessments, Global Biogeochem. Cy., 35, e2020GB006858, https://doi.org/10.1029/2020GB006858, 2021b.
Roth, F., Sun, X., Geibel, M. C., Prytherch, J., Brüchert, V., Bonaglia, S., Broman, E., Nascimento, F., Norkko, A., and Humborg, C.: High spatiotemporal variability of methane concentrations challenges estimates of emissions across vegetated coastal ecosystems, Glob. Change Biol., 28, 4308–4322, https://doi.org/10.1111/gcb.16177, 2022.
Roth, F., Broman, E., Sun, X., Bonaglia, S., Nascimento, F., Prytherch, J., Brüchert, V., Lundevall Zara, M., Brunberg, M., Geibel, M. C., Humborg, C., and Norkko, A.: Methane emissions offset atmospheric carbon dioxide uptake in coastal macroalgae, mixed vegetation and sediment ecosystems, Nat. Commun., 14, 42, https://doi.org/10.1038/s41467-022-35673-9, 2023.
Sharp, J. D., Pierrot, D., Humphreys, M. P., Epitalon, J.-M., Orr, J. C., Lewis, E. R., and Wallace, D. W. R.: CO2SYSv3 for MATLAB (Version v3.2.1), Zenodo [code], https://doi.org/10.5281/zenodo.3950562, 2023.
Snelgrove, P. V. R., Thrush, S. F., Wall, D. H., and Norkko, A.: Real world biodiversity–ecosystem functioning: a seafloor perspective, Trends Ecol. Evol., 29, 398–405, https://doi.org/10.1016/j.tree.2014.05.002, 2014.
Testa, J. M., Kemp, W. M., Hopkinson Jr., C. S., and Smith, S. V: Ecosystem Metabolism, Estuarine Ecology, 381–416, https://doi.org/10.1002/9781118412787.ch15, 2012.
Tyrrell, T., Schneider, B., Charalampopoulou, A., and Riebesell, U.: Coccolithophores and calcite saturation state in the Baltic and Black Seas, Biogeosciences, 5, 485–494, https://doi.org/10.5194/bg-5-485-2008, 2008.
Uth, C., Asmala, E., and Lewandowska, A. M.: Phytoplankton community composition as a driver of annual autochthonous organic carbon dynamics in the northern coastal Baltic Sea, Mar. Ecol. Prog. Ser., 745, 13–24, 2024.
Wallenius, A. J., Dalcin Martins, P., Slomp, C. P., and Jetten, M. S. M.: Anthropogenic and Environmental Constraints on the Microbial Methane Cycle in Coastal Sediments, Front. Microbiol., 12, https://doi.org/10.3389/fmicb.2021.631621, 2021.
Wan, X. S., Sheng, H.-X., Liu, L., Shen, H., Tang, W., Zou, W., Xu, M. N., Zheng, Z., Tan, E., Chen, M., Zhang, Y., Ward, B. B., and Kao, S.-J.: Particle-associated denitrification is the primary source of N2O in oxic coastal waters, Nat. Commun., 14, 8280, https://doi.org/10.1038/s41467-023-43997-3, 2023.
Wanninkhof, R.: Relationship between wind speed and gas exchange over the ocean revisited, Limnol. Oceanogr.-Meth., 12, 351–362, https://doi.org/10.4319/lom.2014.12.351, 2014.
Ward, M., Saura, S., Williams, B., Ramírez-Delgado, J. P., Arafeh-Dalmau, N., Allan, J. R., Venter, O., Dubois, G., and Watson, J. E. M.: Just ten percent of the global terrestrial protected area network is structurally connected via intact land, Nat. Commun., 11, 4563, https://doi.org/10.1038/s41467-020-18457-x, 2020.
Watson, A. J., Schuster, U., Shutler, J. D., Holding, T., Ashton, I. G. C., Landschützer, P., Woolf, D. K., and Goddijn-Murphy, L.: Revised estimates of ocean-atmosphere CO2 flux are consistent with ocean carbon inventory, Nat. Commun., 11, 4422, https://doi.org/10.1038/s41467-020-18203-3, 2020.
Weiss, R. F.: Carbon dioxide in water and seawater: the solubility of a non-ideal gas, Mar. Chem., 2, 203–215, https://doi.org/10.1016/0304-4203(74)90015-2, 1974.
Weiss, R. F. and Price, B. A.: Nitrous oxide solubility in water and seawater, Mar. Chem., 8, 347–359, https://doi.org/10.1016/0304-4203(80)90024-9, 1980.
Wiesenburg, D. A. and Guinasso Jr., N. L. : Equilibrium solubilities of methane, carbon monoxide, and hydrogen in water and sea water, J. Chem. Eng. Data, 24, 356–360, https://doi.org/10.1021/je60083a006, 1979.
Williamson, P. and Gattuso, J.-P.: Carbon Removal Using Coastal Blue Carbon Ecosystems Is Uncertain and Unreliable, With Questionable Climatic Cost-Effectiveness, Front. Climate, 4, https://doi.org/10.3389/fclim.2022.853666, 2022.
Wollast, R.: Evaluation and comparison of the global carbon cycle in the coastal zone and in the open ocean, The Sea, 10, 213–252, 1998.
Yvon-Durocher, G., Allen, A. P., Bastviken, D., Conrad, R., Gudasz, C., St-Pierre, A., Thanh-Duc, N., and del Giorgio, P. A.: Methane fluxes show consistent temperature dependence across microbial to ecosystem scales, Nature, 507, 488–491, https://doi.org/10.1038/nature13164, 2014.
Zeebe, R. and Wolf-Gladrow, D.: CO2 in Seawater: Equilibrium, kinetics, isotopes, Kinetics, Isotopes, Elsevier, Amsterdam, ISBN 0 444 50946 1, 2001.