the Creative Commons Attribution 4.0 License.
the Creative Commons Attribution 4.0 License.
 | 12 Mar 2026
Litter vs. Lens: Evaluating LAI from Litter Traps and Hemispherical Photos Across View Zenith Angles and Leaf Fall Phases
Teja Kattenborn
Julian Frey
Salim Soltani
Anna Göritz
Tom Jaksztat
Negin Katal
Leaf area index (LAI) is a key parameter for modeling ecosystem productivity, climate interactions, and hydrological processes, as well as monitoring vegetation health. Reliable assessment of LAI and its temporal dynamics is therefore essential for understanding forest functioning and seasonal phenology. Among available ground-based approaches, digital hemispherical photography (DHP) offers a practical, reproducible, and spatially flexible means to estimate LAI. Yet, it remains uncertain how robustly DHP can capture temporal LAI dynamics compared to direct reference methods. Here, we evaluate DHP-derived LAI time series with litter trap (LT)-derived LAI in a temperate deciduous broad-leaved forest. First, by comparing DHP-derived LAI estimates with LT-derived LAI across varying view zenith angles (VZA) ranging from 10 to 90°, we investigate how well both methods align. To evaluate whether factors other than the spatial footprint contributed to differences between DHP- and LT-derived LAI, we analyzed how VZA influenced canopy structure metrics (Gap Fraction, Clumping Index, G(θ)). Although these parameters changed with VZA and affected LAI estimation errors in a random forest model, the sampling radius derived from the VZA had the greatest effect on the errors. Using 15 sample locations, we found the highest average correlation (R2 = 0.88) at a VZA of 20°, suggesting that the litter traps capture a relatively narrow spatial footprint, consistent with the model analysis highlighting the dominant role of sampling radius.
To overcome uncertainties for individual litter traps attributed to varying site conditions, we applied a generalized linear mixed model. This location-specific calibration using the litter traps showed an significant increase of the correspondence to R2 = 0.97. Our results confirm that, when appropriately calibrated and acquired at an optimal VZA (20°), DHP provides reliable, high-resolution monitoring of seasonal LAI dynamics in deciduous forests, offering a valuable complement to remote-sensing products for ecosystem research and management.
- Article
(6147 KB) - Full-text XML
- BibTeX
- EndNote


Vegetation canopies regulate the exchange of energy, water, and carbon between the biosphere-atmosphere, thereby shaping climate dynamics and ecosystem functioning (Bonan, 2008). Given that leaves control the exchange of matter and energy at the vegetation–atmosphere interface, the leaf area index (LAI), defined as half the total leaf area per unit ground area, provides a fundamental measure of this interaction (Chen and Black, 1992). LAI plays a critical role in ecosystem productivity models as well as global models of climate and hydrology (Myneni et al., 2002). LAI is also estimated on large spatial and temporal scales from satellites to track plant phenology (Verger et al., 2016) and monitor vegetation health and productivity (Das et al., 2024). Therefore, various methods and tools have been designed to estimate LAI, which is typically measured using either direct or indirect techniques (Bréda, 2003; Fang et al., 2019).
Direct measurement of LAI remains methodologically challenging, restricting its precise quantification at local scales and complicating the validation and calibration of satellite-based LAI retrievals across broader geographic regions. Direct methods involve destructive sampling, requiring the collection and measurement of all leaf material within a defined ground area (Baret et al., 2010). While this approach provides highly accurate LAI values, it is labor-intensive, costly, and impractical for long-term monitoring or conservation-sensitive environments. Consequently, semi-direct and indirect methods are more commonly employed, as they allow for repeated and non-invasive LAI estimation.
The litter trap (LT) approach, which collects fallen leaves in containers of known ground area to estimate LAI as the ratio of leaf area to trap area, is considered as a semi-direct method because it relies on real leaf material but does not capture the entire canopy (Bréda, 2003; Jonckheere et al., 2004; Černỳ et al., 2019). For deciduous forest stands, LTs are widely regarded as one of the most accurate methods to estimate total LAI, where leaf fall occurs within a distinct period, allowing an accurate and exhaustive quantification of total leaf area over the season (Bréda, 2003; Gower et al., 1999). Although LTs are considered one of the most accurate methods for retrieving LAI, their applicability is limited in multiple aspects. Firstly, its application to estimate total LAI in evergreen or coniferous forests is limited because leaf shedding occurs continuously and asynchronously throughout the year, preventing the complete recovery of total leaf area (Chen et al., 1997). Secondly, LTs are not efficient for multitemporal analysis. This is because each sampling period requires emptying the traps and measuring the leaf surfaces, a process that is highly labor-intensive. Additionally, spatial representativeness of LTs often remains unknown and may vary with tree height, LT size and wind conditions (Schaefer et al., 2015).
An alternative non-destructive LAI retrieval is given by indirect optical measurement techniques because of their non-destructive, time-effective and flexible application. Optical LAI estimation methods can be broadly grouped into transmittance-based and gap-fraction-based approaches. Transmittance-based methods, such as PAR ceptometers, quantify the attenuation of photosynthetically active radiation (PAR) by measuring above- and below-canopy light fluxes (Schaefer et al., 2015). LAI is then derived using the Beer–Lambert law (Saitoh et al., 2012) (Eq. 1), relating light transmittance to leaf area through an extinction coefficient.
PAR-based methods assume that plant canopies are a homogeneous medium (Ω = 1). In complex canopies, the accuracy of PAR-based methods is thus constrained due to light scattering, foliage clumping, and saturation at high LAI values if this is not corrected using post-hoc gap fraction measurements (Yao et al., 2016). Accordingly PAR-based methods were found to be inadequate for LAI estimation in forests due to the complexity of canopy structure, including branches, stems, leaf clumping and leaf angle variation (Bréda, 2003; Chen and Black, 1992; Geng et al., 2021).
In contrast, gap-fraction-based methods infer LAI from the proportion of visible sky. Under the assumption of a homogeneous canopy (Ω = 1), light transmittance and gap fraction are equivalent and leaves are randomly distributed in space. With randomly distributed leaves, an effective LAI is obtained that is not corrected for clumping effects or woody elements. To correct for clumping, a clumping index (Ω<1) is applied (Eq. 2), allowing retrieval of the actual LAI (Fang, 2021).
Digital hemispherical photos (DHP) are the most common gap-fraction-based methods (Zou et al., 2020). DHP captures wide-angle images of the canopy from beneath using fisheye lenses. DHP improve on the limitations of PAR-based methods by allowing segmentation of the image into zenith rings and azimuth sectors, thereby enabling explicit estimation of gap fraction, leaf angle distribution, and the clumping index, which together enhance LAI estimation in structurally heterogeneous stands (Chianucci and Cutini, 2013). Such images can be taken at various sample points within the study area and provide detailed information on canopy gaps, leaf density, and stem distribution. Early DHP methods underestimated LAI by up to 44 %–70 % compared to LT references, primarily due to unaccounted canopy clumping effects (Jonckheere et al., 2004; Zhang et al., 2005). The introduction of modern clumping index corrections, such as the LXG method by Chianucci et al. (2019) and CLX approach by Leblanc et al. (2005), has significantly improved accuracy, reducing errors to 5 %–6 % compared to true LAI in deciduous forests (Chianucci et al., 2019).
While several studies have demonstrated multi-temporal or automated DHP acquisition for monitoring seasonal LAI dynamics (Brown et al., 2020), only a few have evaluated DHP-derived LAI directly with repeated litter-trap observations over an entire leaf-fall period. For example, Mussche et al. (2001) and Liu et al. (2015a) conducted such comparisons in deciduous and mixed forests, respectively, using analog or earlier-generation DHP methods. Here, we extend these efforts using modern DHP processing. This includes improved clumping correction, exposure control, and image binarization – to assess how well DHP-derived LAI captures temporal litter-trap dynamics throughout leaf-fall. We evaluated DHP-based LAI estimates with LAI derived from litter traps for deciduous broadleaved trees in a temperate forest using a multitemporal setting (8 repeated measurements in 4 months).
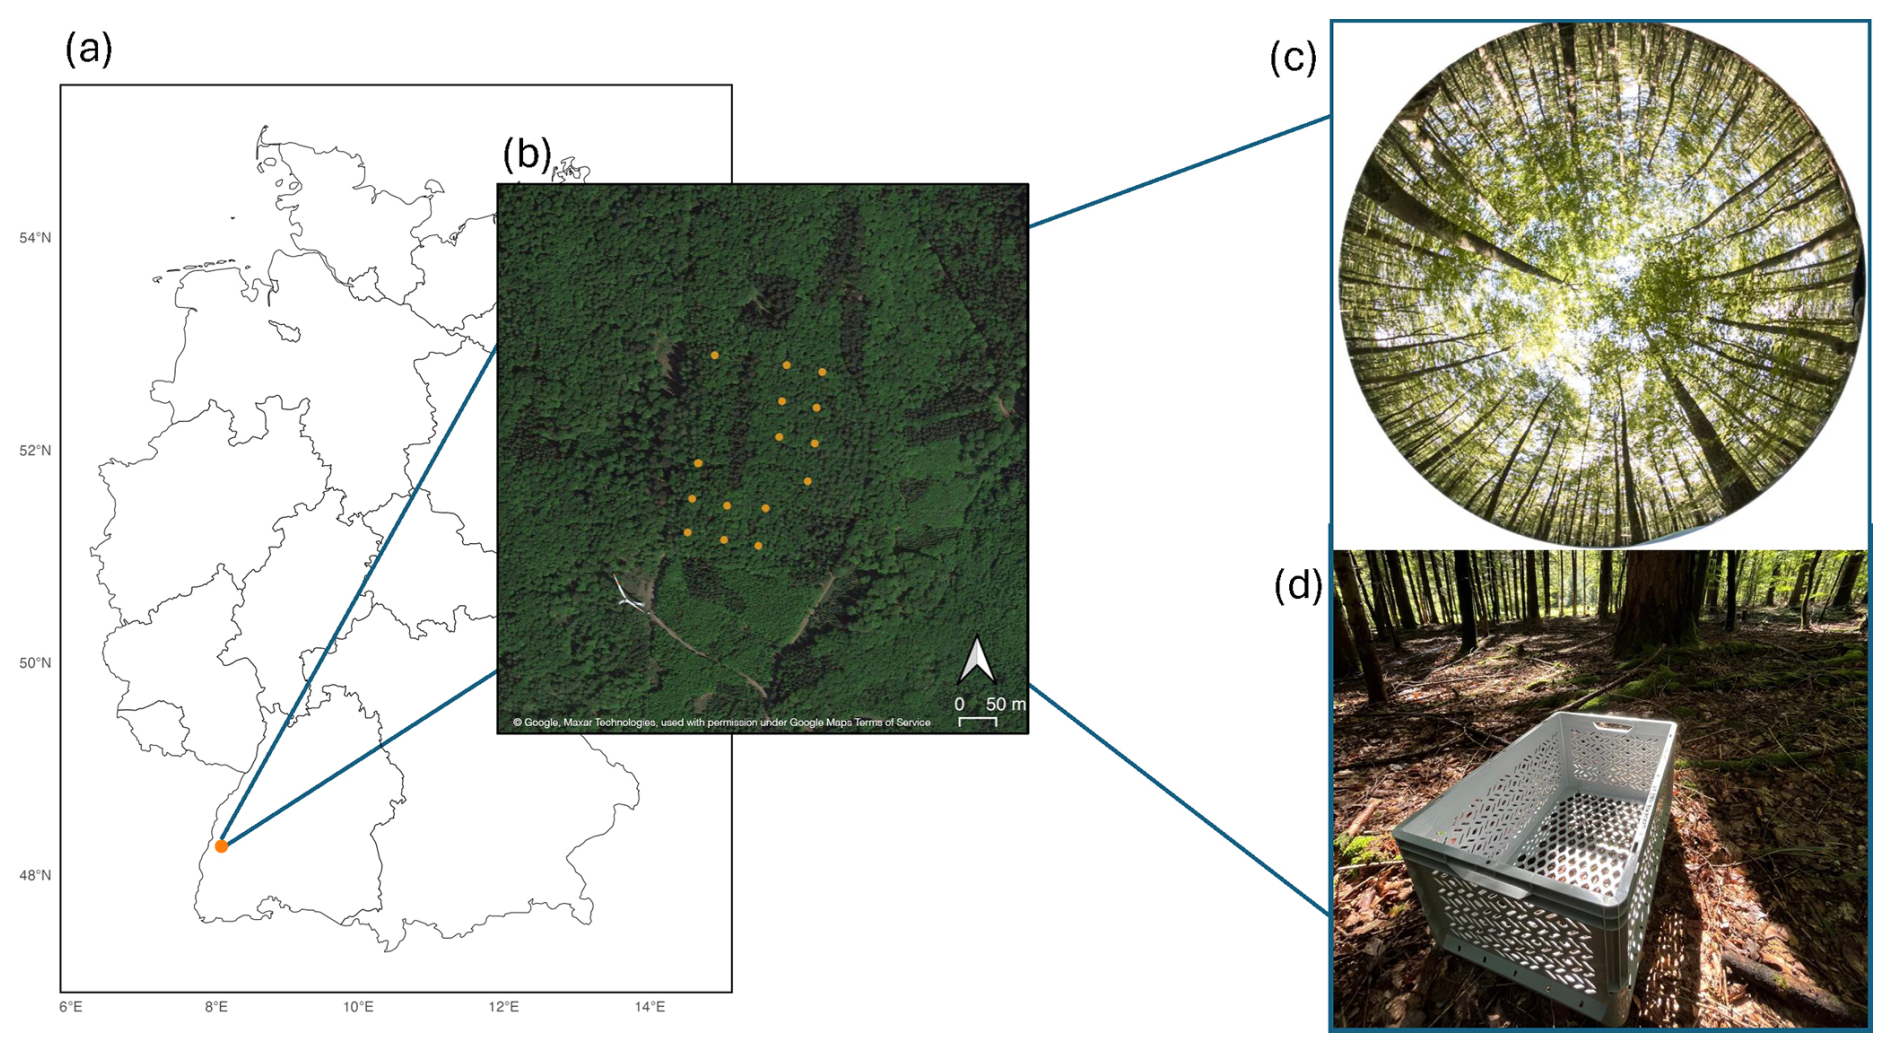
Figure 1(a) Geographical location of the study site in Germany, situated near Ettenheim at the ECOSENSE forest site (center coordinates: 48.2679° N, 7.8783° E). () Detailed map of the study area, illustrating the spatial distribution of sample points used for litter trap (LT) and digital hemispherical photography (DHP) overlaid on satellite imagery (©Google, Maxar Technologies, used in accordance with Google Maps/Earth Terms of Service: https://www.google.com/permissions/geoguidelines/, last access: 25 February 2026). (c) Representative DHP image captured prior to leaf fall. (d) Example of a litter trap installation at a sampling point.
Recent studies highlight persistent challenges in DHP-based LAI estimation, particularly regarding view zenith angle (VZA) selection and effects of stem density and canopy structure (Lee et al., 2023). Lee et al. (2023) demonstrated that larger zenith angles (> 60°) tend to overestimate gap fraction due to increased contributions from clumping effects and woody material, while narrower angles (< 30°) may underestimate LAI by missing critical canopy details. We evaluated DHP-derived LAI across different VZA against LT-derived LAI to determine the most suitable angular configuration for accurate DHP-based LAI estimation. In addition, we assessed potential confounding effects of canopy structure on VZA by correlating gap fraction (GF), clumping index (CI), and the projection function G(θ) with VZA.
Moreover, we show that systematic location-specific biases, e.g. due to the local canopy structure or woody components, can be overcome by a location-specific calibration of DHP-estimates with LT-derived LAI, ultimately improving the robustness of DHP-based LAI assessments.
2.1 Study site and data acquisition
The data was collected on the site of ECOSENSE project, a multiscale research initiative focused on quantifying and modeling spatio-temporal dynamics of ecosystem processes through sensor networks. The site is located in a mixed forest system dominated by beech with patches of conifer trees near Ettenheim, Germany (Werner et al., 2024; Tesch et al., 2025). The site is located at 48.2679° N, 7.8783° E with elevation ranging from around 450 to 520 (Fig. 1a). The basal area of the forest site is 30.9 m2 ha−1. The diameter at breast heights vary with a mean = 23 cm, median = 16 cm, standard deviation 15 cm and maximum of 76 cm.
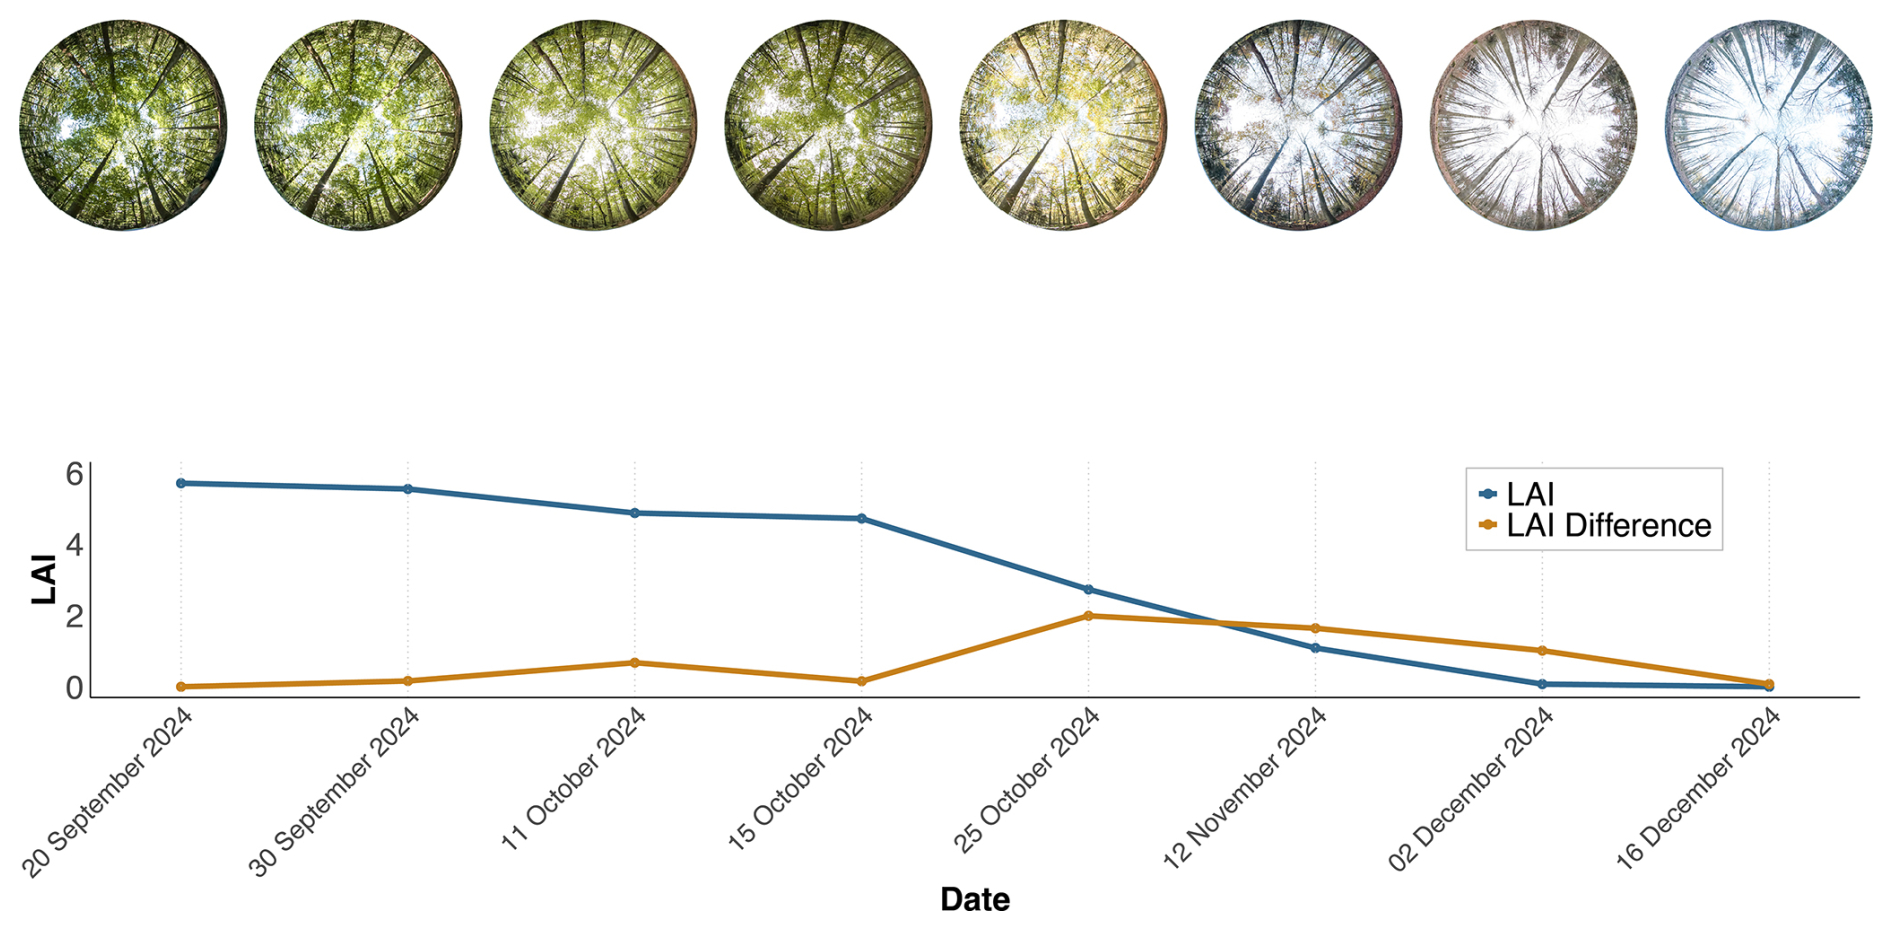
Figure 2Example of digital hemispherical photography (DHP) at a single sample point across all measurement dates. The blue line represents the cumulative litter trap (LT) LAI, and the brown line indicates the temporal rate of change (slope) of the blue curve, corresponding to the LAI difference between consecutive measurements. The cumulative LT LAI values start at 0 on 16 December 2024.
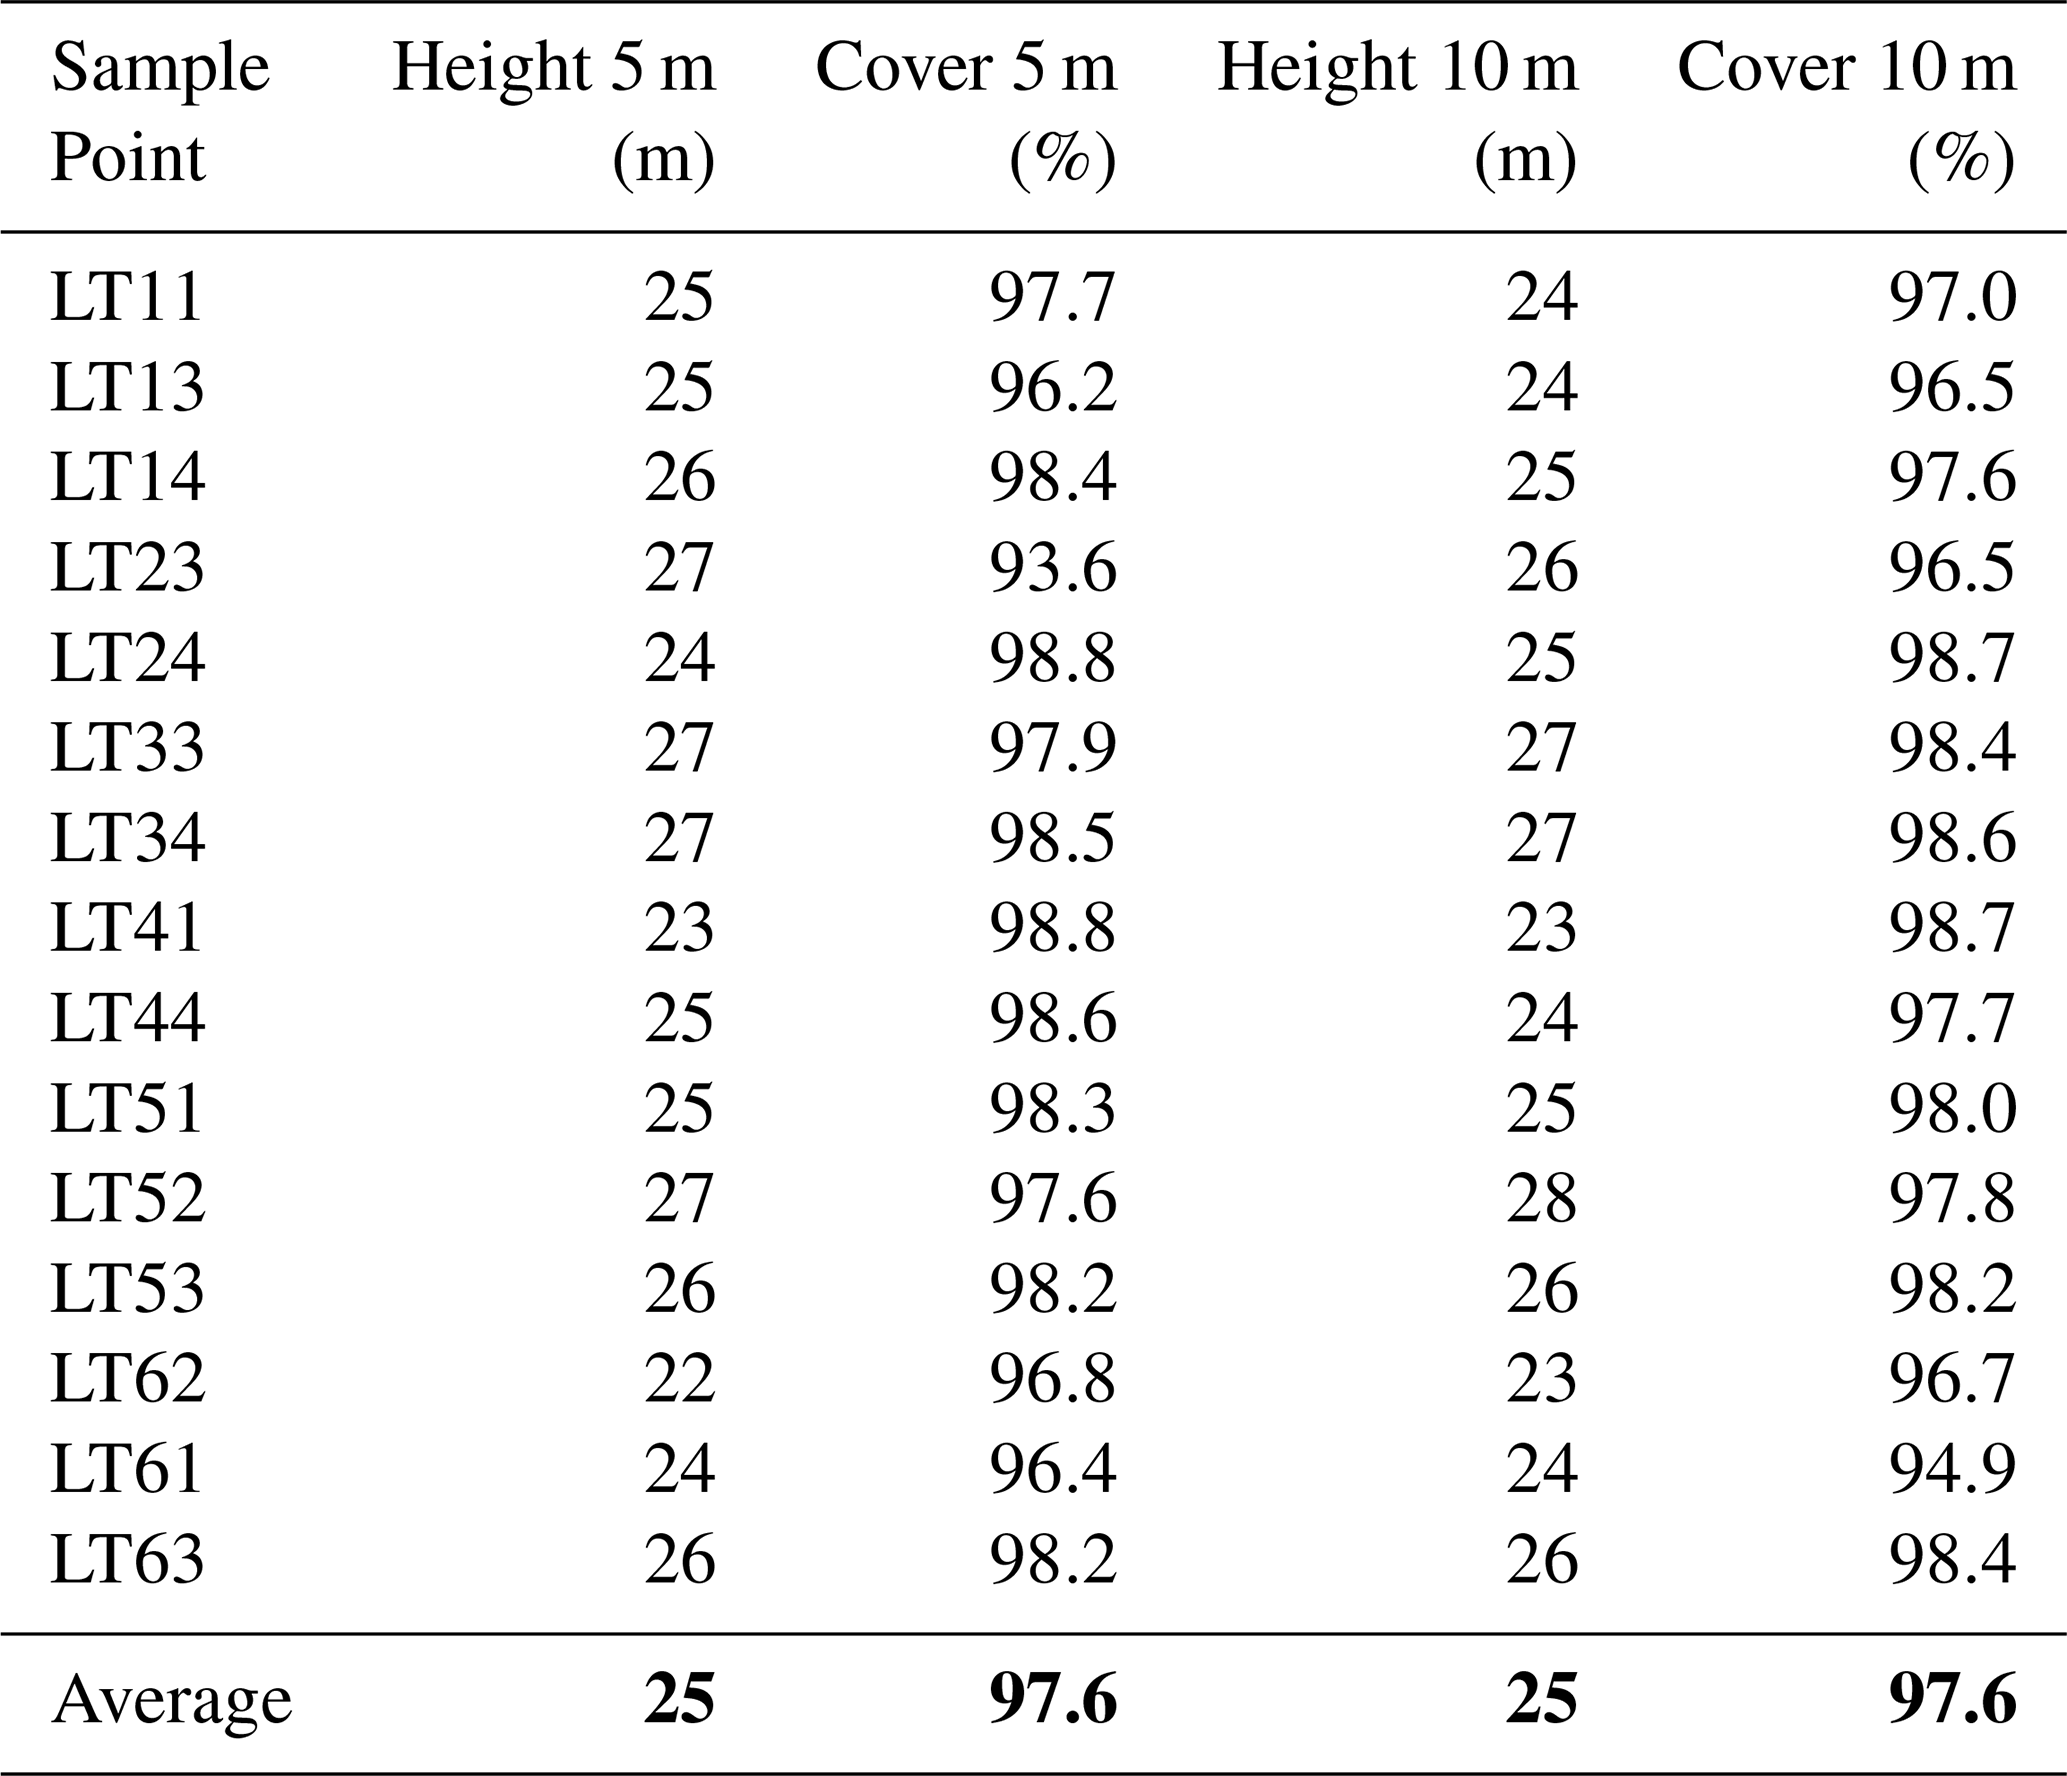
The sample points for DHP and LT measurements were setup in a regular grid of 50 m distance. Since litter traps are restricted to deciduous stands, sample points containing coniferous trees were excluded, resulting in 15 sample points (Fig. 1b). The average canopy coverage of the sample points amounts to 97.6 % and varies between 93.6 % to 98.8 % and average canopy heights of the sample points vary between 22 to 27 m (Fig. A3) . Multi-temporal LAI estimates with LTs and DHP were acquired before the start to the end of the leaf fall between 20 September to 16 December 2024 (Fig. 2).
2.2 LAI Derived from litter traps
At each sample point, a LT (40 cm × 60 cm × 30 cm) was installed to systematically collect leaf litter (Fig. 1d). All litter traps were placed directly on the ground surface. Each LT was equipped with a drainage fleece to prevent leaf loss and to minimize potential soil–fauna interference. No evidence of litter removal or seed predation was observed during the study period. The trap height of 30 cm was chosen to prevent the escape of leaves due to wind, ensuring accurate collection within the box. We used a surface area of 0.24 m2, as a compromise between efficiency and ensuring that enough leaf material was sampled. These design choices follow established best practices (Černỳ et al., 2019), ensuring that the data collected on leaf litterfall dynamics are reliable and that external factors have minimal influence on LAI estimation. For all sample points, LTs were emptied eight times in an approximately bi-weekly setting throughout the leaf fall phase (Fig. 2), resulting in a high-resolution time series.
Many studies estimate leaf area from LTs by determining the specific leaf area (SLA) of subsamples and scaling these values to the total collected biomass (Bréda, 2003; Gower et al., 1999). However, this approach introduces uncertainties due to species-specific and seasonal variability in SLA. To minimize these sources of error, we directly measured the area of all collected leaves by scanning them from photographs.
We systematically arranged all collected leaves from LTs at each time step on a 2 m × 1 m white background. The leaves were carefully pressed flat using a Plexiglass sheet to minimize distortions caused by folds or other deformations that could affect the accuracy of leaf area measurements. Subsequently, photographs were taken from a top-down perspective using a Sony Alpha 7 camera equipped with a 35 mm lens. The images were automatically rectified orthographically using ArUco markers placed in the corner of the white background (Fig. A1). The leaves were identified using pixel-wise segmentation, applying grayscale thresholding (threshold value: 240) to generate a binary mask that effectively distinguished leaf regions from the background (Fig. A1) (Ghazal et al., 2019). The total leaf area was calculated by summing the detected pixels and converting them to m2. These values were then summed over time. For each subsequent sampling period, the LT leaf area was calculated by subtracting the cumulative LT leaf area of all previous sampling periods from the total and dividing it by the LT area (Fig. 2).
2.2.1 Digital hemispherical photos
DHPs were acquired using a Canon 700D equipped with a Sigma 4.5 mm lens ensuring a 180° field of view (FOV). To maintain consistency across all measurements, camera settings were standardized throughout the study. The camera was carefully leveled using a bubble level to ensure precise image alignment across the time steps. Photographs were taken at breast height (1.3 m) (Schaefer et al., 2015) with a fixed azimuth angle and oriented to the local zenith. One DHP was captured per sample point around noon, coinciding with the emptying of the LTs (Fig. 2). The procedure resulted in the acquisition of 120 DHPs (Fig. 1c).
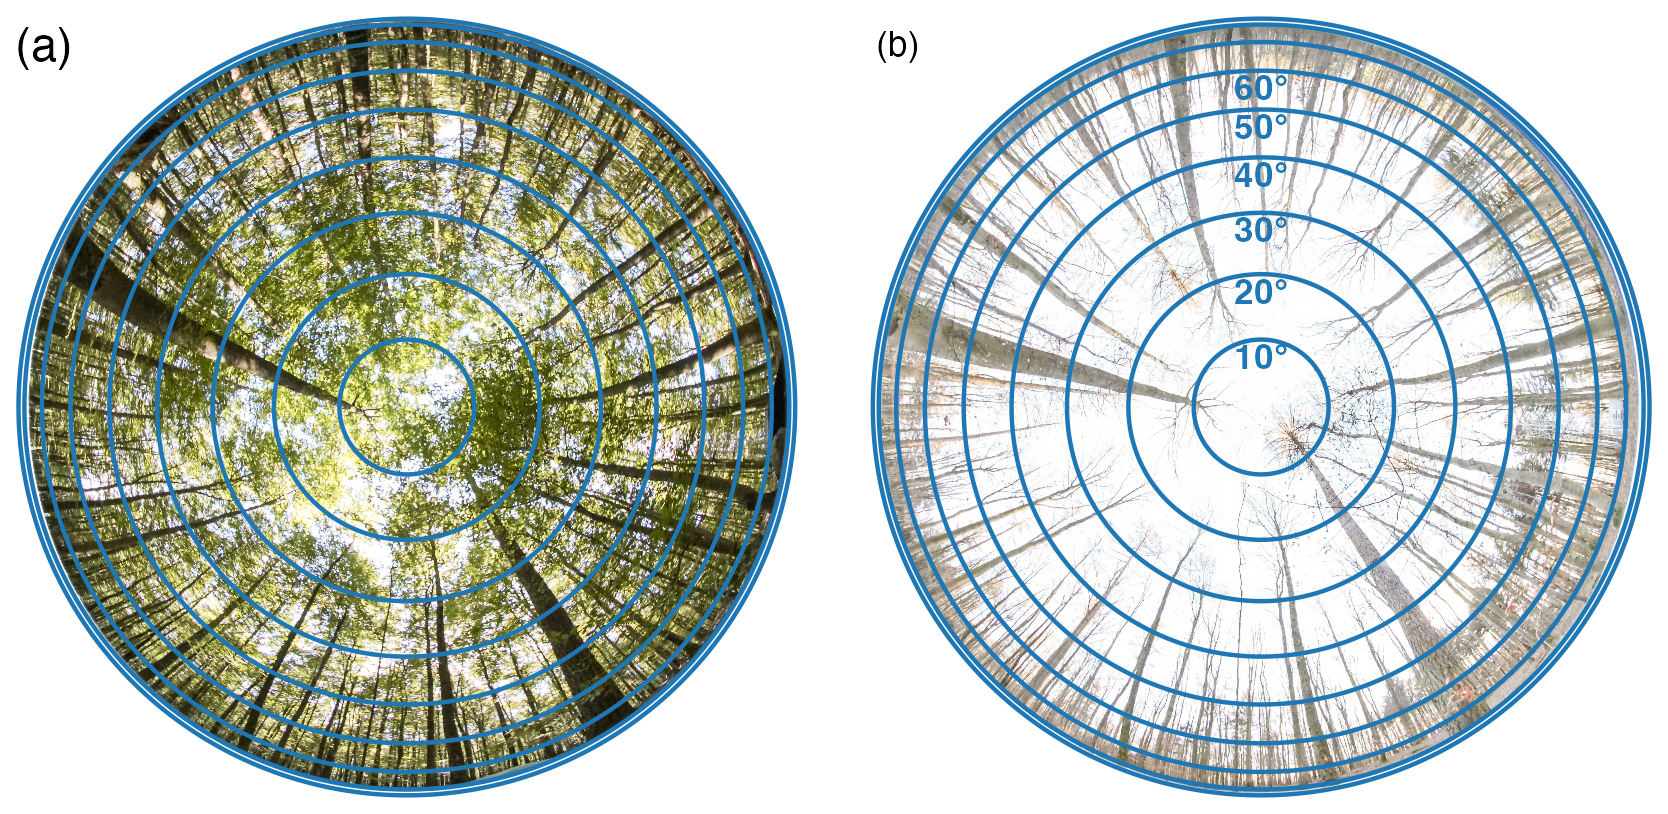
Figure 3Showcase of the area used for LAI calculation in hemispheR package at varying view zenith angles (VZA) ranges during leaf on (a) (20 September 2024) and leaf off state (b) (16 December 2024). The VZA ranges always start from 0° to the end VZA shown in (b).
2.3 Data processing
2.3.1 DHP analyis
DHP methods estimate the gap fraction based on a binarization of sky and canopy pixels. For this, we used the Otsu method from Otsu et al. (1975), which is effective for canopy images with fisheye lens. This method determines the optimal threshold for image binarization by analyzing pixel intensity distribution (Tian et al., 2024). It calculates the within-class variance for all possible thresholds and selects the one that minimizes it, ensuring the best separation between foreground and background (Pueschel et al., 2012; Grotti et al., 2020). Light interception, gap fraction and hence LAI estimates highly depend on the leaf angle distribution (Utsugi et al., 2006; Pisek et al., 2013; de Mattos et al., 2020). Therefore, we utilized the hemispheR package (Chianucci and Macek, 2023) in R to process hemispherical canopy images, which enables estimation and correction of the mean leaf angle. In hemispheR package, mean leaf angle is derived by fitting a theoretical ellipsoidal leaf distribution model to observed gap fraction data, optimizing the leaf inclination parameter to best match measured values (Chianucci and Macek, 2023).
The DHP-based LAI retrieval was performed with five zenith rings and eight azimuth segments (Fig. A2). Chianucci et al. (2015) demonstrated that segmenting zenith rings into multiple azimuth sections accounts for non-random foliage distribution and improves estimation of clumping. Additionally, Chianucci and Cutini (2013) found that finer segmentation enhances gap fraction calculations, which is particularly important in dense canopies. While the optimal configuration remains uncertain, this setting represents a practical middle ground for reliable canopy structure assessment.
We evaluated various clumping indices implemented in hemispheR package to improve the accuracy of LAI estimation. The effective LAI (LAIe) represents a simplified measure of LAI based on the average gap fraction, without accounting for clumping effects. It serves as the baseline for applying clumping indices. Actual LAI (L) incorporates clumping at larger scales by averaging the logarithms of gap fractions. The clumping index LX is defined as the ratio of LAIe to L, providing a basic correction for canopy aggregation. On the other hand, the LXG method, where “L” stands for Lang, “X” for Xiang (referencing the original LX method), and “G” for gap size, combines the finite-length averaging approach with gap size distribution analysis to provide a more robust clumping correction (Chianucci et al., 2019; Leblanc et al., 2005). The resulting methods LXG1 and LXG2 are included in HemispheR by Chianucci et al. (2019) and improve upon the LX clumping index by integrating ordered weighted gap fraction averaging, which accounts for gap size distribution, reducing sensitivity to spatial scale and canopy density. LXG1 assigns greater weight to smaller gaps, while LXG2 emphasizes larger gaps more progressively, leading to better alignment with semi-direct leaf area measurements. This makes LXG1 and LXG2 particularly useful for heterogeneous canopies. Since DHP primarily measures plant area index, we subtracted the last measurement of DHP-derived LAI, where only woody material was present, from all sample acquisition dates (Zhu et al., 2018; Fang, 2021; Liu et al., 2015b). This approach allowed us to isolate LAI values without the influence of woody material, ensuring a more accurate assessment of foliage contribution.
2.4 Comparing LAI derived from DHP and LT
We compared the LT-derived LAI with DHP-derived LAI estimates obtained with varying VZA of the photographs. In this study, the term VZA refers to the range from 0° to the specified VZA value. Specifically, a VZA of 20° represents the range 0–20°, while a VZA of 30° corresponds to 0–30°, and so forth for all VZA values. This definition applies throughout the study whenever VZA is mentioned (Fig. 3). Additionally, we tried the Hinge-angle method which assumes that canopy gaps are more evenly distributed around 57.5°, minimizing the impact of clumping and leaf distribution irregularities (Chen and Black, 1992; Weiss et al., 2004; Wilson, 1963). The Hinge-angle method was implemented in hemispheR using a small ring range of 55 to 60°, which limits the calculation of clumping due to the insufficient number of rings and segments for a comprehensive assessment. We compared the LT and DHP-derived LAI using all combinations of clumping methods, including no clumping, and VZA. The agreement for each site and across the time series was assessed using absolute error, slope, and coefficient of determination (R2), derived from a linear regression model.
Furthermore, we evaluated the ability of DHP to represent actual LAI for different leaf fall phases using the best-fitting VZA and clumping indices. To classify the phases we investigated the temporal patterns into three phases: onset, peak, and end of leaf fall, using a breakout calculation with the segmented package (Muggeo, 2008) in R (Fig. 6). This approach identified breakpoints based on significant changes in LAI values.
In addition to the direct comparison between DHP- and LT-derived LAI, we examined potential confounding effects related to the VZA. Specifically, we tested whether canopy structural metrics (gap fraction (GF), clumping index (CI) and G(θ)) were correlated with VZA. To evaluate the relative influence of these factors compared to the influence of the spatial footprint on LAI estimation accuracy, we applied a random forest model (Breiman, 2001) with absolute error as the response variable and GF, CI, G(θ), and the sampling radius as predictors (Eq. 3).
The corresponding sampling radius for each VZA was calculated geometrically from the camera height (hc) and mean canopy height (hcanopy) using the upper limit of the respective VZA range (θvza):
Random forest models (Breiman, 2001) were implemented using the randomForest package in R (Liaw and Wiener, 2002).
2.5 Location-specific calibration
We evaluated a location-specific calibration of DHP-based LAI estimates using the LT-derived LAI to evaluate if local biases can be overcome for an efficient and accurate long-term monitoring. We implemented the location-specific calibration using a generalized linear mixed model (GLMM). Since the data were not normally distributed and exhibited left skewness, the GLMM was particularly well-suited for handling these distributional characteristics. Additionally, by including a random intercept, we aimed to minimize the influence of sample point-specific errors and capture the underlying location-specific differences more accurately. Specifically, we applied a GLMM with an inverse Gaussian distribution and a log link function using the glmer function from the lme4 package (Bates et al., 2015). This approach allowed us to incorporate LAI values adjusted for the LXG1 clumping index, further refining our location-specific calibration. The following equation describes the GLMM used in the analysis:
This formulation incorporates a random intercept for each individual sample point, recognizing that each sample point may have its own unique random influences (such as local variations in tree density, tree sizes, or growth conditions) while preserving the overall relationship between LT and DHP derived LAI across different leaf fall phases as fixed effects. The interaction between leaf fall phase and DHP LAI allows for phase-specific slopes, capturing differences in the relationship between DHP and LT LAI across different stages of leaf fall. The location-specific calibration aims to reduce local biases caused by stand heterogeneity and should not be considered a universal correction applicable to other forest types. All analysis was done in R programming language version 4.2.2 (R Core Team, 2022).
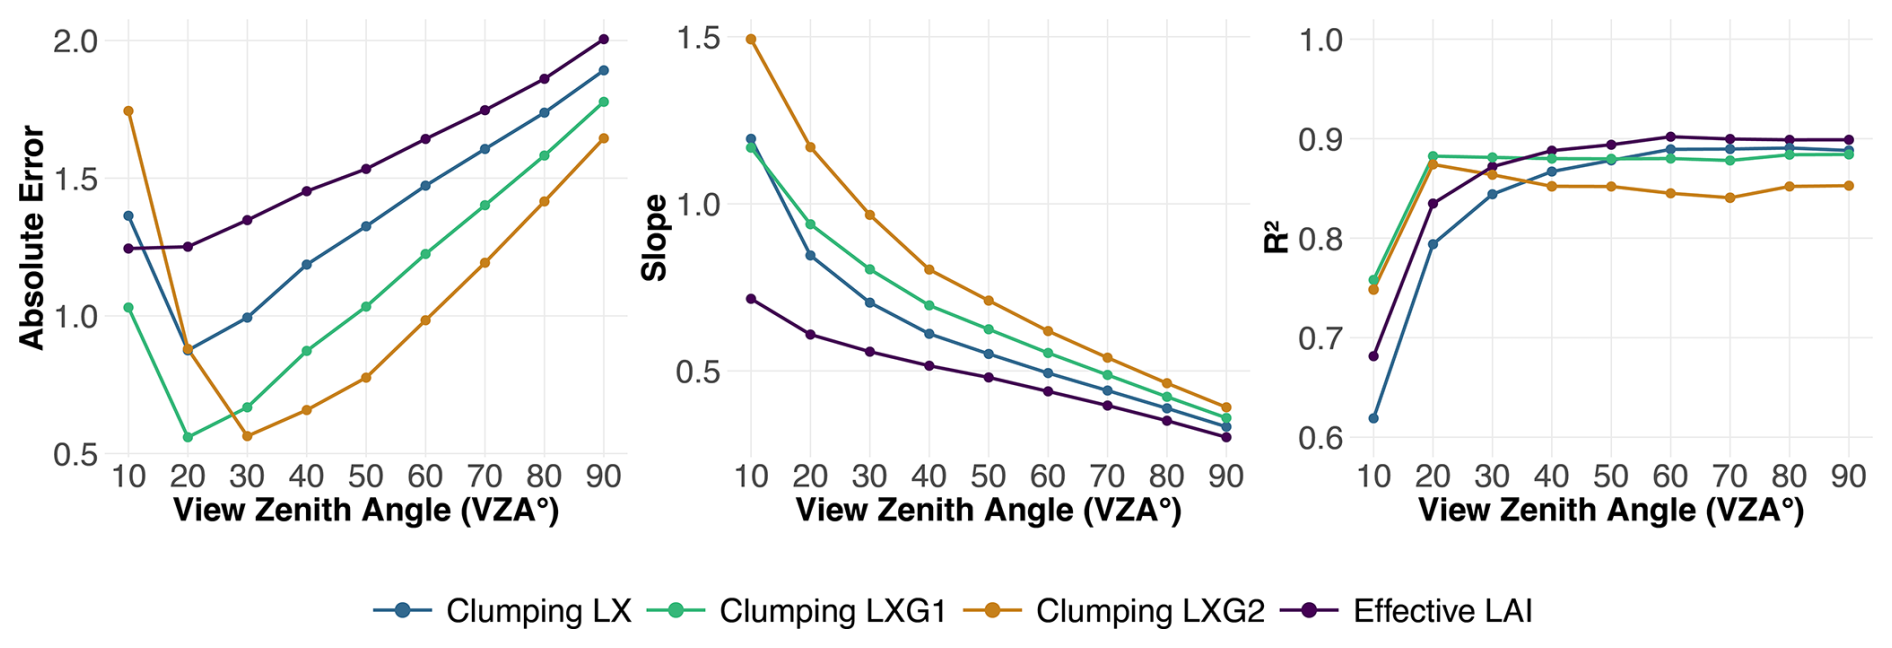
Figure 4Absolute error, slope, and R2 for DHP-derived LAI versus LT-derived LAI across all clumping indices (effective LAI without clumping) and view zenith angles (VZA) from 10 to 90°. The slope is derived from the linear regression between DHP-derived LAI and LT-derived LAI, indicating how the DHP estimates compare to the LT reference. The absolute error is calculated as the mean residual from the 1:1 line, representing the deviation of DHP estimates from the ideal agreement with LT-derived LAI. R2 quantifies the strength of this relationship. Data points represent computed values at each VZA, with lines connecting them to illustrate trends across different clumping indices.
3.1 Spatial footprint of litter traps
We determined the spatial footprint represented by LT using different combinations of VZA and clumping indices. The Hinge method consistently demonstrated a lower R2 value and a reduced slope (0.3), as well as a higher absolute error (1.73), compared to the optimal combination of the clumping method and VZA. Consequently, it was excluded from further analysis. VZA between 20 and 50° exhibited the lowest absolute error, with a minimum at 20° for LXG1 (0.574), corresponding to 6 % of the highest measured LAI for this clumping index. The slope between LT and DHP-based LAI gradually decreased with increasing view zenith angle. The lowest systematic bias was observed between 20 and 30°, where slopes were closest to 1. At 10°, there was a tendency for overestimation, while for VZA above 30°, LAI estimates increasingly underestimated true values. LXG1 showed the least systematic bias at 20° (slope = 0.942). In contrast, R2 showed a strong increase from 10 to 30°, after which it remained at a high level. The maximum R2 was observed for effective LAI at 60° (0.885), with similar peak values for LXG1 (0.884), LX (0.875), and LXG2 (0.872) (Fig. 4).
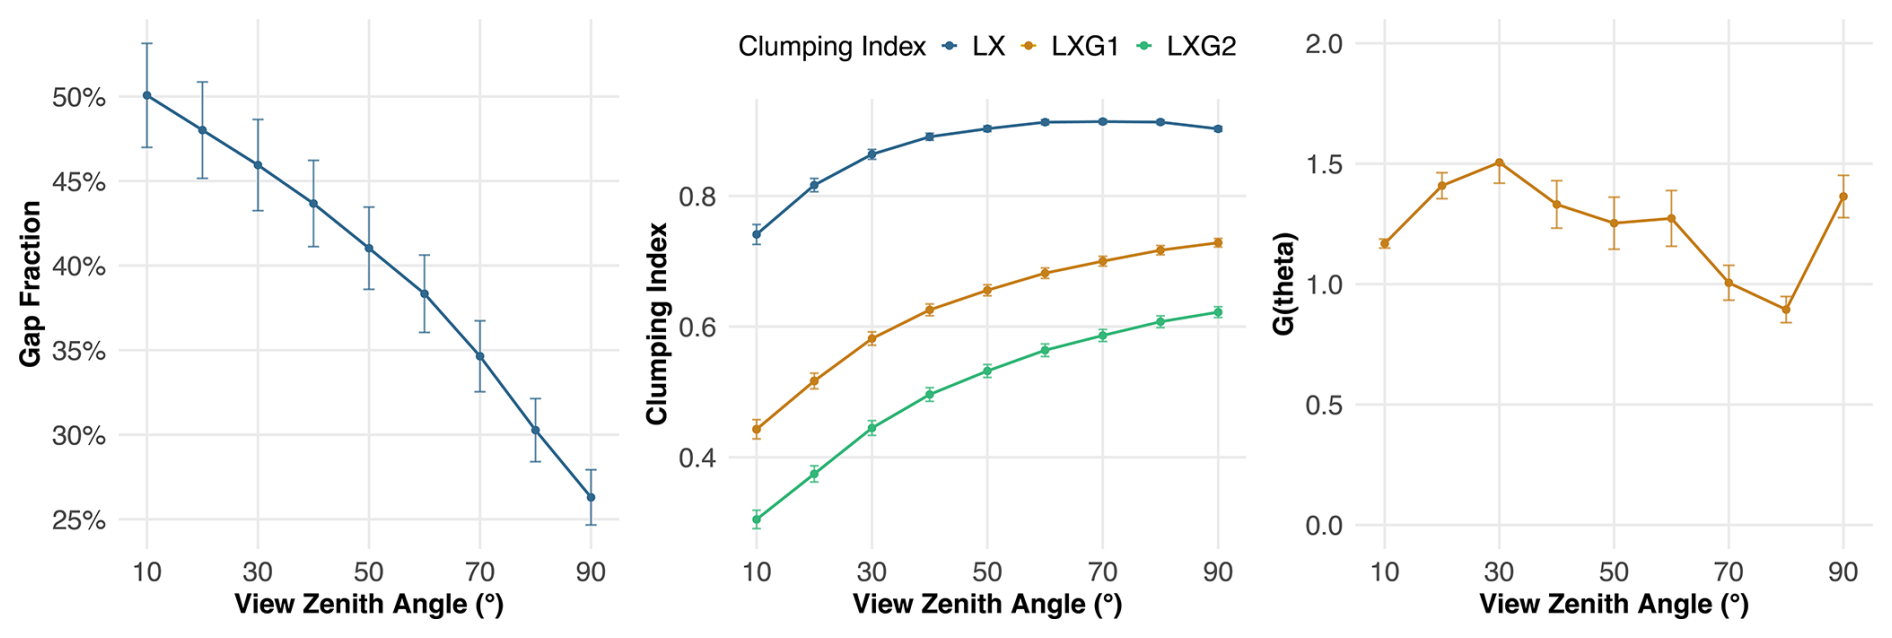
Figure 5Canopy structural parameters (gap fraction, clumping index, and projection function G(θ)) across view zenith angles (VZA). The relationship illustrates how canopy optical properties change with increasing VZA, showing potential confounders for DHP LAI estimation.
We observed that lower VZA values were associated with stronger agreement between DHP- and LT-derived LAI (Fig. 4). Other canopy structure parameters such as gap fraction decreased VZA, while clumping index increased with VZA and the projection function G(θ) showed no consistent trend across the range VZA (Fig. 5). To quantify the relative influence of these parameters on LAI estimation error, we applied a random forest model with absolute error as the response variable and GF, CI, G(θ), and sampling radius as predictors (Eq. 3). The model revealed that the sampling radius had the highest variable importance (52.96), followed by the clumping index (40.26), gap fraction (39.20), and G(θ) (37.95).
3.2 DHP-derived LAI estimation over time
To assess the ability of DHP to accurately predict temporal LAI dynamics, the mean values from all plots for the LT were compared to the mean values from all plots for DHP using the LXG1 clumping index, which exhibited the closest to 1:1 slope with minimal error (Fig. 4). The comparison reveals that the temporal trends of DHP-derived LAI and LT-derived LAI are similar, with the mean values closer together at the end of the time series and an increased spread at the onset of leaf fall. Moreover, the 5th–95th percentile range is broader at the start of leaf fall with a slight underestimation and becomes narrower towards the end of leaf fall (Fig. 6).
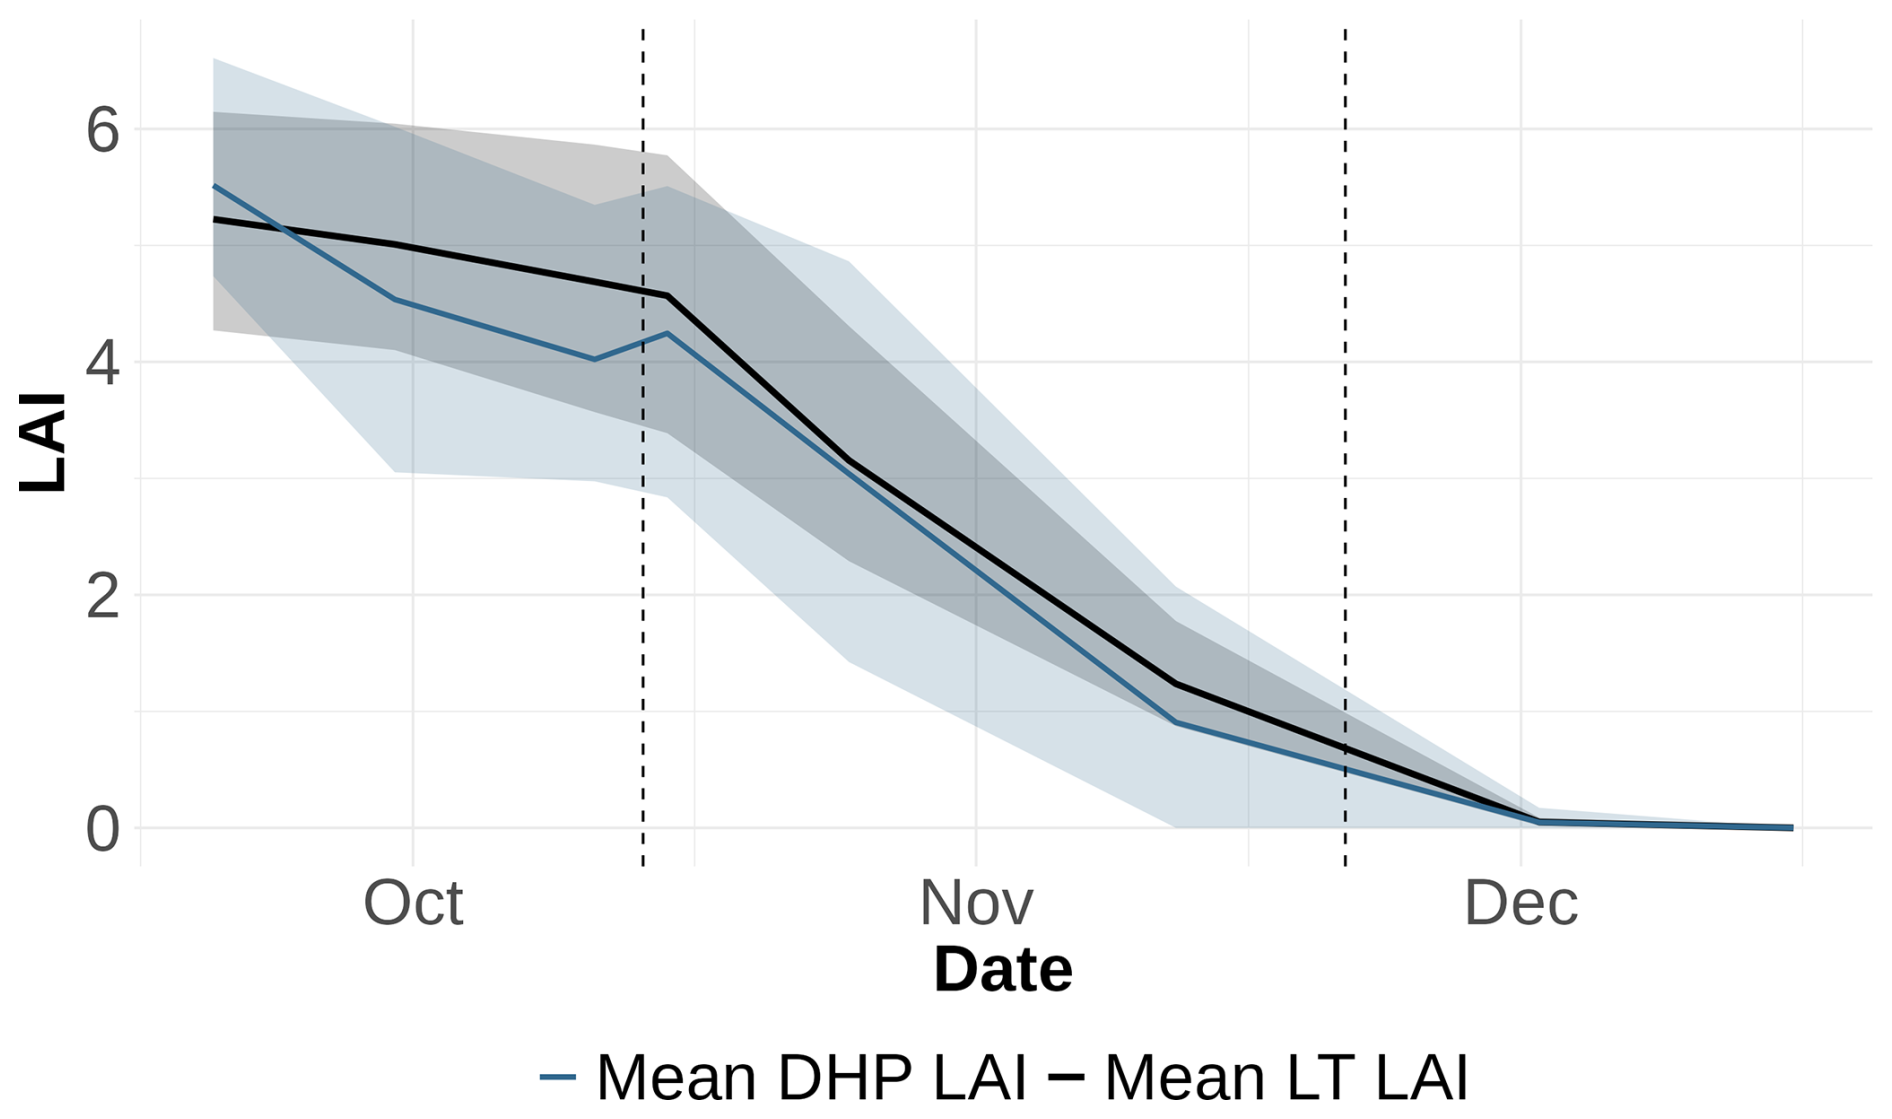
Figure 6Comparison of LT LAI and DHP LAI (estimated with VZA 20° and clumping index LXG1) over time for all sample points, showing the mean values and the 5th to 95th percentile for each time point. The solid black line represents the mean of actual LAI for all sample points, while the blue line shows the mean of DHP LAI for all sample points. The shaded regions indicate the 5th–95th percentile range for both LT LAI and DHP LAI, highlighting the variation and the spread of the data over time. Dashed vertical lines represent breakpoints identified in the segmented regression analysis, marking significant shifts in LAI trends.
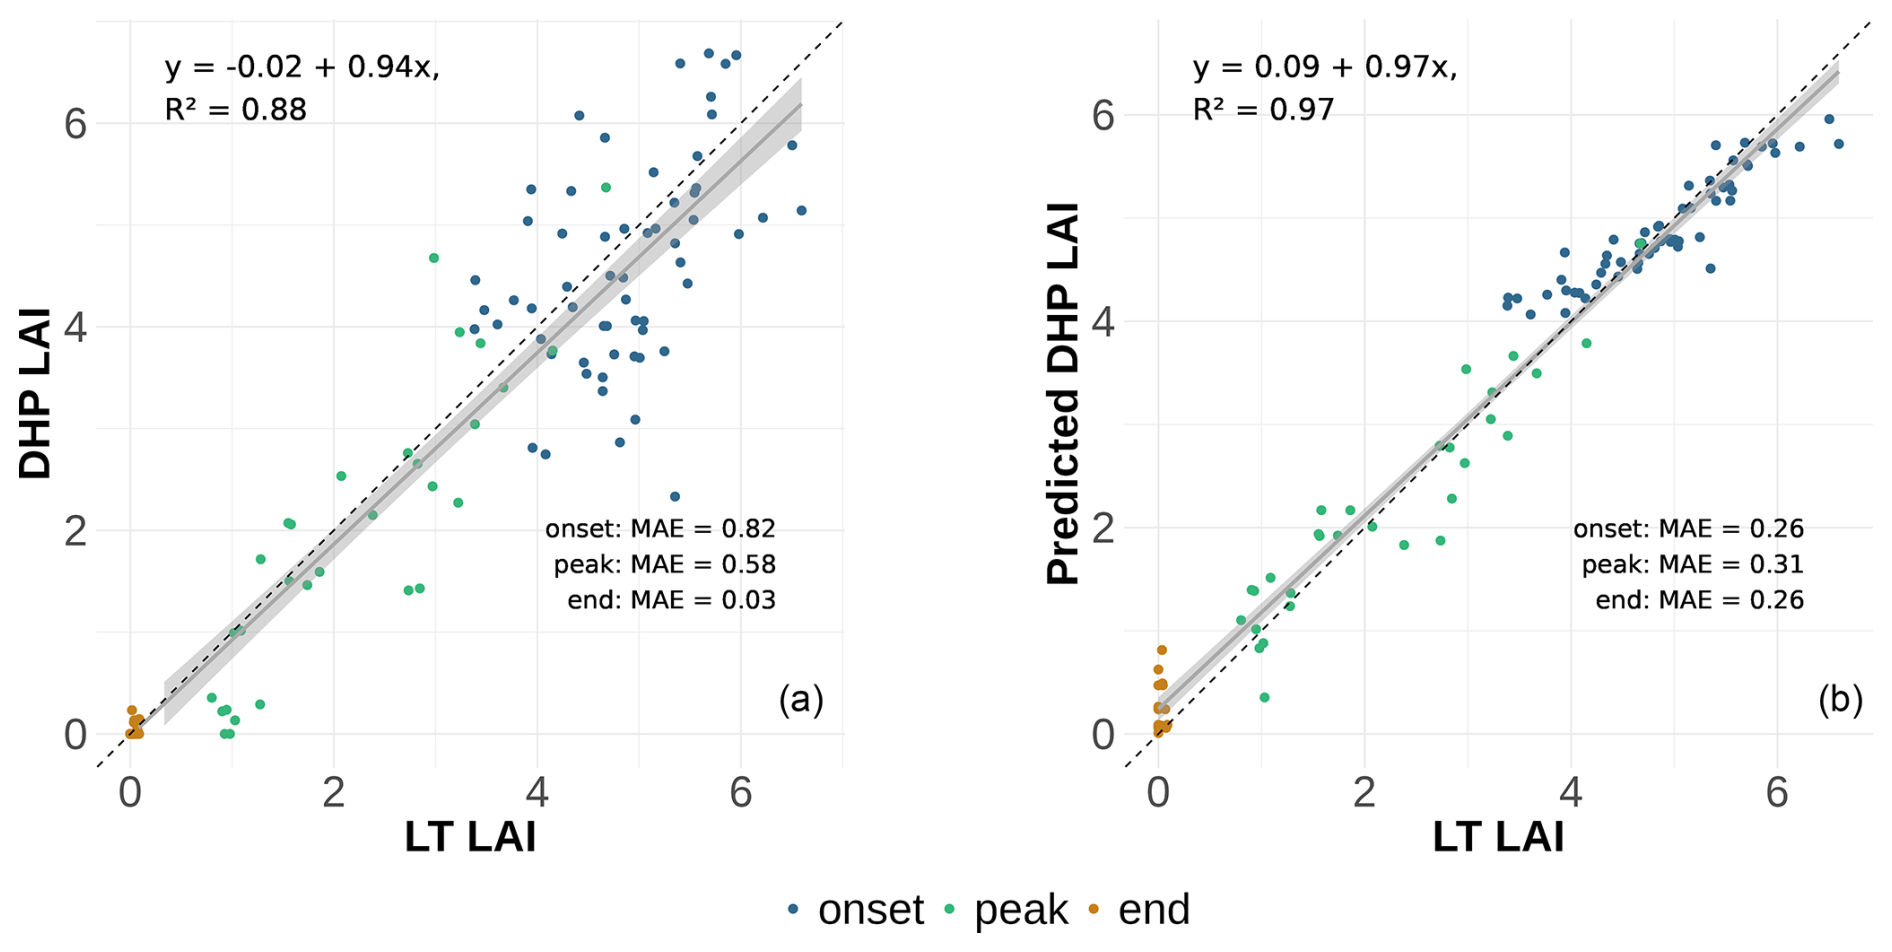
Figure 7(a) DHP-derived LAI using the clumping Index LXG1 for a View Zenith Angle of 20° against LT LAI. The sample points are colored according to the phase of leaf fall. The breakpoints for the leaf fall phases were determined using a breakpoint analysis and are shown in Fig. 4. Mean absolute errors (MAE) for each phase are displayed within the plot. (b) predicted LAI of the GLMM against the LT LAI, illustrating the improved accuracy of the location-specific calibration.
In order to further investigate the LAI estimation over time, we set up three phases (onset, peak and end) of the leaf fall to assess those phases separately (Fig. 6). We analyzed the differences of leaf fall phases based on the LXG1 LAI (with clumping). The analysis shows almost no systematic over- or underestimation (Fig. 7).
3.3 Location-specific calibration
We selected the LXG1 clumping index for the site specific calibration because it produced the lowest absolute error while maintaining almost no systematic over- or underestimation with high correlation in comparison to LXG2 which had higher systematic over-/underestimation with similar correlation. At a VZA of 20°, the site-specific calibration reduced the mean absolute error (MAE) by 52 %, from 0.574 to 0.275, demonstrating a substantial improvement in accuracy. The greatest error reduction within the phases was observed during the onset phase, where MAE decreased by 68 % from 0.81 to 0.26. The systematic over- underestimation and correlation stayed at a similar level with a slope increase of 0.03 and an increase in R2 from 0.88 to 0.97 (marginal R2=0.94, conditional R2=0.97) (Fig. 7).
4.1 Spatial footprint and influence of zenith angle
Our findings demonstrate that the spatial footprint of LTs corresponds well with specific VZA ranges, enhancing our understanding of LAI estimation using DHP. By correlating LT-derived LAI with DHP-derived LAI across multiple VZA ranges (0–10 to 0–90° in 10° increments), we identified an optimal VZA range (20°) for DHP analysis. The Hinge Angle method, which has shown strong performance in other studies (Liu et al., 2021), did not align as well with LT-derived LAI in our dataset and was therefore less suitable for our analysis, although no clumping index was applied with the implementation using HemispheR. Instead, clumping indices proved crucial in improving DHP accuracy, particularly at lower VZA values, where they helped reduce LAI underestimation compared to effective LAI without clumping corrections (Fig. 4). Among the tested clumping indices, LXG1 exhibited the best performance, as it is particularly effective in accounting for smaller canopy gaps and performing well in dense broadleaf forests (Chianucci et al., 2019; Chianucci and Macek, 2023).
We observed that the correlation between DHP- and LT-derived LAI was highest at lower VZA values (< 30°) and declined with increasing VZA. This trend corresponds to reduced compensation of clumping effects and a decrease of gap fraction with increasing VZA (Fig. 5). However, the random forest model indicates that the spatial footprint, represented by the sampling radius, shows the strongest influence on absolute error. While clumping and gap fraction also contribute, as reflected by their variable importance, the spatial footprint remains the dominant factor. These findings suggest that the LTs are best represented at a VZA around 20°, supporting previous recommendations to use a VZA range of 20–40° for DHP-based LAI estimation in temperate forests (Lee et al., 2023).
In contrast to our results of an ideal VZA range around 0–20°, Liu et al. (2015c) recommended a VZA range of 30–60°. At 30–60° VZA, we observe an underestimation of LAI, which suggests that further investigation into the impact of VZA range on estimated LAI from DHP would be valuable. Our finding that LAI underestimation increased with higher VZA values is consistent with previous research attributing this effect to larger canopy gaps and overestimated openness (Geng et al., 2021). We show that decreasing clumping correction influences the underestimation at higher VZA. Also note that a small VZA range offers to resolve spatial LAI variation within small spatial gradients. Such focused areas are well-suited for validating LAI products from high-resolutions satellite data, which often have spatial resolutions around 10–30 m (e.g. Sentinel-2 or Landsat data). As shown by our results, the choice of clumping index remains critical, as effective LAI values without clumping corrections showed significant underestimation and higher absolute error. Here, the best performing index was the LXG1. This clumping index is similar to the CLX index (Liu et al., 2015c), which incorporates gap fraction averaging as a core principle and has shown good results for seasonality. The key difference between the two indices is that LXG1 focuses on refining weighting functions for segment-based calculations, while CLX emphasizes gap fraction averaging.
Overall, our findings emphasize the importance of carefully selecting VZA ranges and incorporating canopy structure corrections in DHP-based studies. While VZA is often underemphasized in DHP research, our results demonstrate that it has a substantial impact on absolute error and systematic bias, and strongly influences the estimation of clumping effects and gap fraction. Future studies should prioritize VZA optimization and clumping index selection to enhance the accuracy of DHP-derived LAI estimates.
4.2 Temporal representation of DHP-derived LAI
Our results demonstrate that DHP with LXG1 effectively captured seasonal LAI trends, accurately reflecting variations throughout the leaf fall. Discrepancies decreased throughout the leaf fall period, ultimately resulting in no discrepancies at the final sampling period due to the imposed value of 0 for both DHP and LT LAI. This reduction results from subtracting woody material from the PAI like previously done from Zhu et al. (2018), ensuring that only the LAI is analyzed. The fraction of woody material is known to be the main cause of error in deciduous stands shown Zhu et al. (2018). As we substracted the LAI from the final time step after the leaf fall, showing only woody material, our results are not affected by systematic overestimation. In addition, we observe higher variability in the onset phase due to the increased structural complexity of fully developed canopies, leading to greater variability in LAI estimates due to the heterogeneous light environment and mutual shading effects, which cannot be fully accounted for by clumping alone (Liu et al., 2015c).
4.3 Location-specific calibration using a generalized linear mixed model
To address local variability in DHP-derived LAI estimates, we implemented a location-specific calibration using a generalized linear mixed model. This model incorporated the LXG1-adjusted LAI as a fixed effect, with individual sample points included as random intercepts to account for spatial heterogeneity. The LXG1 clumping index was selected based on its superior performance in minimizing systematic error across all VZA configurations (Fig. 4).
Importantly, we integrated the leaf fall phase as an interaction term, allowing the model to adjust slope parameters depending on the temporal dynamics of leaf fall. This phase-specific correction significantly improved model fit, particularly during the early stages of leaf fall where variability in canopy structure is highest. At a VZA of 20°, the calibrated model reduced the absolute error by 52 %, with the largest improvements observed during the onset phase, particularly for LAI values between 4 and 6 (Fig. 7).
These results underscore the value of combining DHP-derived LAI with LT reference data in a mixed-effects modeling framework. By explicitly modeling spatial and temporal sources of variation, the approach enhances the robustness and accuracy of LAI estimation across different forest conditions. This location-specific model can be extended to similar temperate deciduous forests, provided that data collection includes temporal labeling of leaf fall phase. Notably, since the leaf fall phases align with distinct LAI value ranges, phase classification could also be approximated directly from observed LAI trends in future applications.
4.4 Challenges and future perspectives
Fisheye imagery is particularly sensitive to sky conditions and exposure settings, which can alter gap fraction retrieval and thereby bias LAI estimates (Grotti et al., 2020; Chianucci, 2020). Most images in this study were acquired under diffuse or moderately bright conditions using fixed settings ( , s exposure), with visual inspection by experienced operators to minimize overexposure. Nevertheless, occasional variations in illumination and exposure could have influenced canopy–sky classification, particularly under high-contrast sky conditions. While we attempted to maintain consistent settings, logistical constraints prevented complete standardization across sampling dates. Despite these potential limitations, the consistency of DHP–LT correlations across measurement dates suggests that exposure variability introduced only minor bias in our dataset. Future applications should consider capturing and processing RAW fisheye images and aperture priority mode with −1 EV exposure compensation. This ensures linear radiometric scaling and reduces sensitivity to overexposed images.
The parameterization of azimuthal segments and zenith rings influences clumping index calculations, as these parameters define foliage distribution patterns and serve as the basis for clumping correction (Chianucci and Macek, 2023). However, determining optimal parameterization remains challenging. In later leaf fall stages, a reduced number of azimuth segments may be sufficient, as increased canopy openness diminishes the need for detailed segmentation (Liu et al., 2015b).
LT data are primarily suitable for deciduous forest stands, as they accurately capture seasonal leaf shedding but do not effectively represent evergreen canopies (Jonckheere et al., 2004). In this study, sample points containing conifer trees were excluded due to the lack of validation data for DHP. While DHP methods are highly reliable for deciduous forests, they can also be adapted for coniferous stands. However, an alternative validation approach is required, as LT-based LAI estimation is unsuitable for conifers, given that litter traps primarily capture fallen foliage and do not account for retained needles.
Future research should explore allometric approaches for validating DHP-derived LAI in evergreen forests. One promising method involves deriving LAI for individual branches through direct, destructive measurement, and subsequently upscaling these estimates to the entire canopy by counting branches per tree (Flynn et al., 2023; Badea, 2011). This upscaling can be assisted by structural data from Terrestrial Laser Scanning (TLS) or photogrammetry, which allows for the detailed quantification of branching architecture. Such an approach provides a non-destructive, yet scalable reference for validating DHP in coniferous stands and could greatly enhance LAI estimation in evergreen-dominated ecosystems.
This study demonstrates that DHP-based LAI when adjusted with the LXG1 clumping Index (Chianucci et al., 2019), closely aligns with LT-based LAI in temperate deciduous forest canopies. The strongest agreement between the two methods was observed at 20° VZA (R2 = 0.88), indicating that LT-derived LAI captures the variability of LAI within a realtively small spatial footprint. While strong agreement was also observed for VZA values above 20°, higher zenith angles showed increased underestimation and error. The spatial footprint at around 20° VZA is further supported by an attribution method (random forest), which identified the sampling radius as the most influential factor affecting LAI estimation error. Additionally, canopy metrics such as the clumping index and gap fraction also contributed to the observed differences with less variable importance. These findings highlight that VZA plays a major role in LAI estimation and should receive greater attention in future DHP-based studies. DHP-based LAI estimation over time showed a tendency to underestimate LT LAI in the beginning of leaf fall, with higher variability in the sample points, which is influenced by the structural complexity of a fully developed canopy. To address these limitations, we applied a GLMM that incorporated LXG1-adjusted LAI, which significantly improved location-specific precision in DHP-based LAI estimation. Overall, this study provides a robust framework for improving DHP-based LAI assessments, reducing both measurement error and the need for labor-intensive LT collection. However, DHP calibration remains a challenge for coniferous forests, where needle retention and canopy structure introduce additional complexities. Future research should focus on developing and validating calibration approaches for DHP in coniferous stands. Expanding these methodologies will enhance the applicability of DHP-based LAI estimation across diverse forest ecosystems.
A1 LT Leaf Area
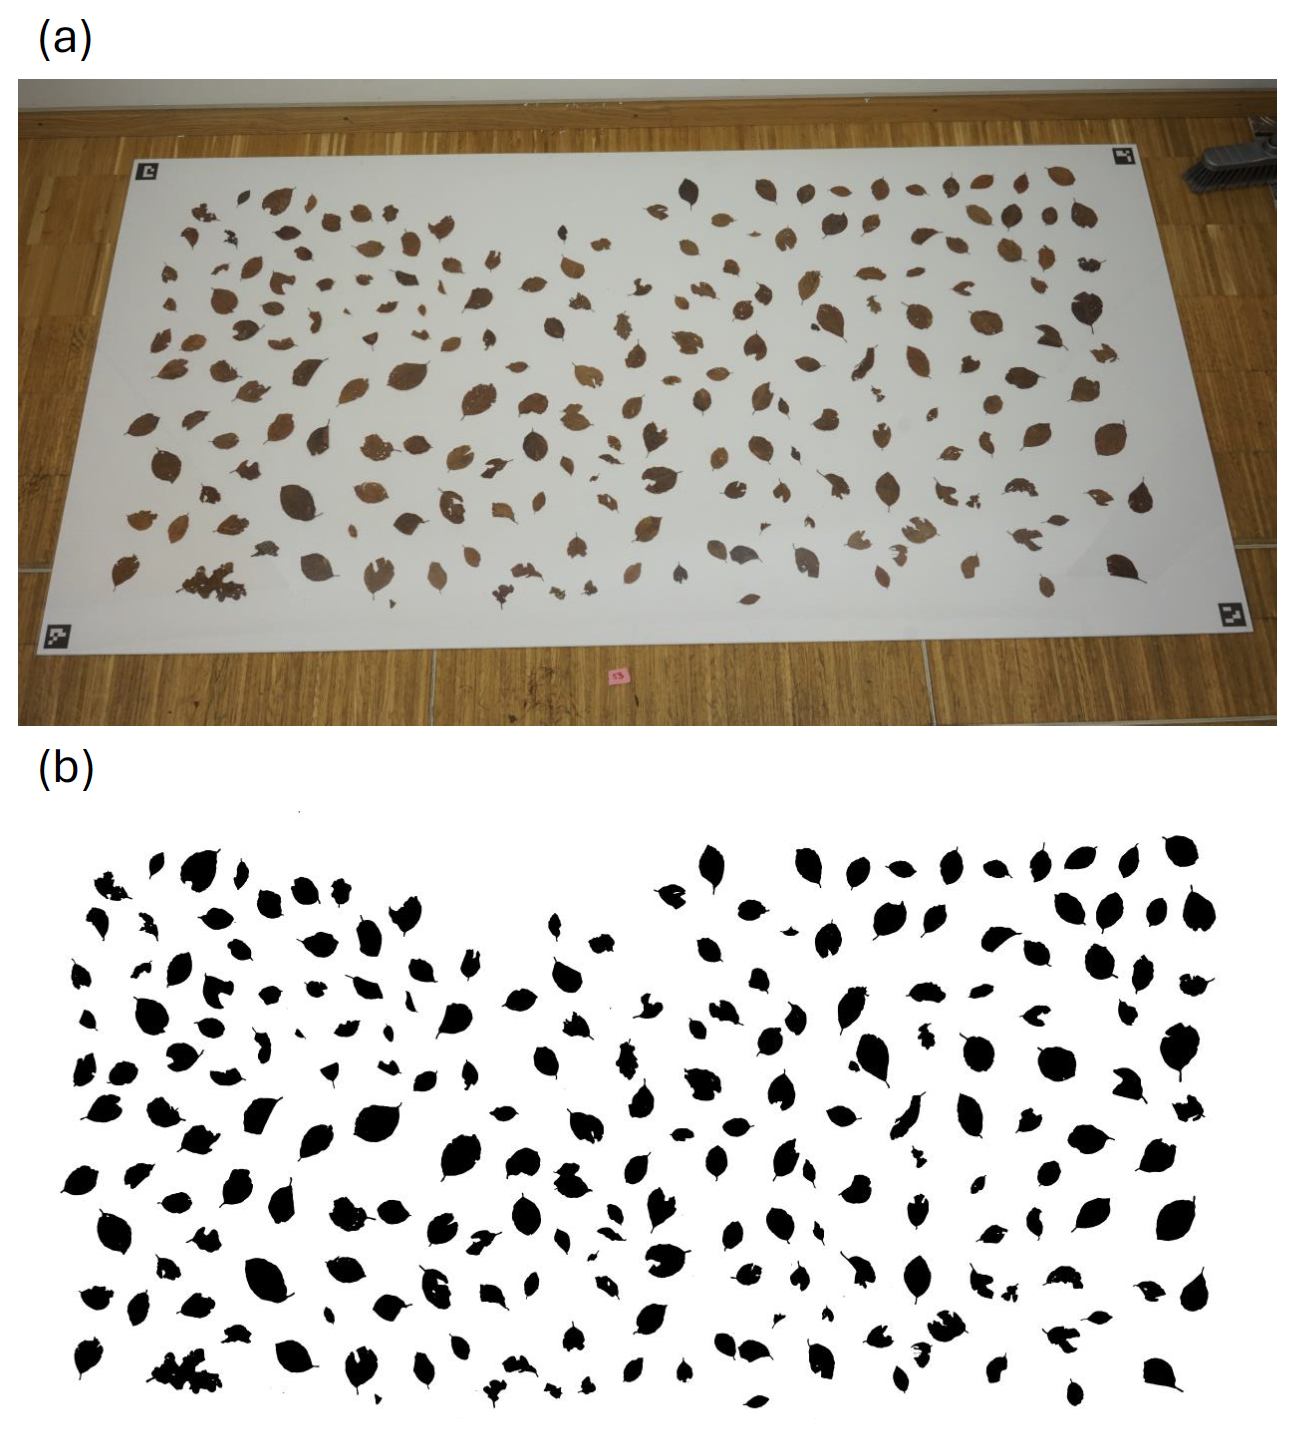
Figure A1Leaf area measurement process from litter traps. (a) shows the original image of the collected leaves, spread out on a 2 m × 1 m background and pressed flat with a Plexiglass sheet to reduce deformations. (b) demonstrates the rectified image with the binary mask of the leaves, generated by applying grayscale thresholding (240) for pixel-wise segmentation. The mask separates the leaf regions from the background.
A2 hemispheR
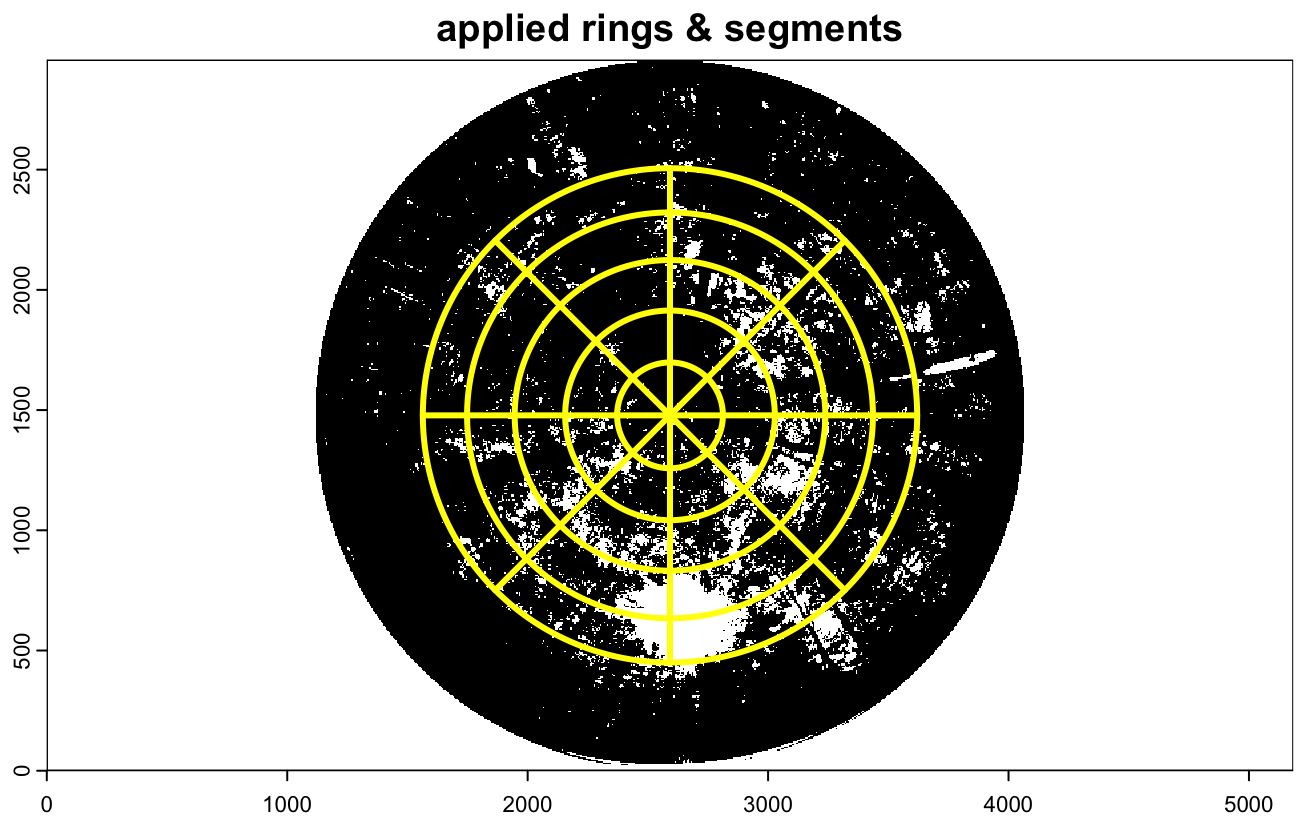
Figure A2This is an example illustrating the different zenith rings and azimuth segments using one of the VZA ranges used. In this case it is 0–60°.
A3 canopy cover and mean height
Table A1Sample Point Data for Mean Height and Canopy Cover. These statistics were derived from a drone-based LiDAR point cloud (DJI Matrice equiped with an L2 flown at 60 m height). The statistics were derived from a canopy height model and buffers at 5 and 10 m radius around the sample points. The last row displays the average of all sample points for the corresponding column.
The code used in this study is available under Zenodo: https://doi.org/10.5281/zenodo.18785222 (Lotz et al., 2026).
SL, TK and TJ contributed to the conceptulization. SL, NK and TK prepared the first draft. SL, TJ, SS and TK contributed to the data acquisition. SL, TK, JF and TJ contributed to the methodology. SL and AG contributed to data analysis. NK and TK contributed to supervision. SL, NK and TK contributed to the original draft preperation. SL contributed to visualization and formal analysis. TK contributed to funding acquisition and resource acquisition. All authors contributed to review and editing.
The contact author has declared that none of the authors has any competing interests.
Publisher's note: Copernicus Publications remains neutral with regard to jurisdictional claims made in the text, published maps, institutional affiliations, or any other geographical representation in this paper. The authors bear the ultimate responsibility for providing appropriate place names. Views expressed in the text are those of the authors and do not necessarily reflect the views of the publisher.
The study was funded by the German Research Foundation (DFG) under the project UAV-mounted dual-wavelength LiDAR for leaf water content retrieval (LeafH2O, project-no. 541018379) and the collaborative Research Centre ECOSENSE (SFB1537). Further funding was received from the Eva Mayr-Stihl Foundation, XR Future Forests Lab at the Faculty of Environment and Natural Resources, University of Freiburg. The authors are grateful for data provided by Matthias Gassilloud and field campaign support by Markus Quinten.
This research has been supported by the Deutsche Forschungsgemeinschaft (grant no. SFB1537).
This open-access publication was funded by the University of Freiburg.
This paper was edited by Paul Stoy and reviewed by two anonymous referees.
Badea, O.: Further development and implementation of an EU-level forest monitoring system, 126, 3–10, ISSN 2067-1962 1583-7890, 2011. a
Baret, F., de Solan, B., Lopez-Lozano, R., Ma, K., and Weiss, M.: GAI estimates of row crops from downward looking digital photos taken perpendicular to rows at 57.5 zenith angle: Theoretical considerations based on 3D architecture models and application to wheat crops, Agricultural and Forest Meteorology, 150, 1393–1401, 2010. a
Bates, D., Mächler, M., Bolker, B., and Walker, S.: Fitting linear mixed-effects models using lme4, Journal of Statistical Software, 67, 1–48, 2015. a
Bonan, G. B.: Forests and climate change: forcings, feedbacks, and the climate benefits of forests, Science, 320, 1444–1449, 2008. a
Bréda, N. J.: Ground-based measurements of leaf area index: a review of methods, instruments and current controversies, Journal of Experimental Botany, 54, 2403–2417, 2003. a, b, c, d, e
Breiman, L.: Random Forests, Machine Learning, 45, 5–32, https://doi.org/10.1023/A:1010933404324, 2001. a, b
Brown, L. A., Ogutu, B. O., and Dash, J.: Tracking forest biophysical properties with automated digital repeat photography: A fisheye perspective using digital hemispherical photography from below the canopy, Agricultural and Forest Meteorology, 287, 107944, https://doi.org/10.1016/j.agrformet.2020.107944, 2020. a
Černỳ, J., Pokornỳ, R., Haninec, P., and Bednář, P.: Leaf area index estimation using three distinct methods in pure deciduous stands, Journal of Visualized Experiments, 150, e59757, https://doi.org/10.3791/59757, 2019. a, b
Chen, J. M. and Black, T. A.: Defining leaf area index for non-flat leaves, Plant Cell & Environment, 15, 421–429, 1992. a, b, c
Chen, J. M., Rich, P. M., Gower, S. T., Norman, J. M., and Plummer, S.: Leaf area index of boreal forests: Theory, techniques, and measurements, Journal of Geophysical Research: Atmospheres, 102, 29429–29443, 1997. a
Chianucci, F.: An overview of in situ digital canopy photography in forestry, Canadian Journal of Forest Research, 50, 227–242, 2020. a
Chianucci, F. and Cutini, A.: Estimation of canopy properties in deciduous forests with digital hemispherical and cover photography, Agricultural and Forest Meteorology, 168, 130–139, 2013. a, b
Chianucci, F. and Macek, M.: hemispheR: an R package for fisheye canopy image analysis, Agricultural and Forest Meteorology, 336, 109470, 2023. a, b, c, d
Chianucci, F., Macfarlane, C., Pisek, J., Cutini, A., and Casa, R.: Estimation of foliage clumping from the LAI-2000 Plant Canopy Analyzer: effect of view caps, Trees, 29, 355–366, 2015. a
Chianucci, F., Zou, J., Leng, P., Zhuang, Y., and Ferrara, C.: A new method to estimate clumping index integrating gap fraction averaging with the analysis of gap size distribution, Canadian Journal of Forest Research, 49, 471–479, 2019. a, b, c, d, e, f
Das, P., Rahimzadeh-Bajgiran, P., Livingston, W., McIntire, C. D., and Bergdahl, A.: Modeling forest canopy structure and developing a stand health index using satellite remote sensing, Ecological Informatics, 84, 102864, https://doi.org/10.1016/j.ecoinf.2024.102864, 2024. a
de Mattos, E. M., Binkley, D., Campoe, O. C., Alvares, C. A., and Stape, J. L.: Variation in canopy structure, leaf area, light interception and light use efficiency among Eucalyptus clones, Forest Ecology and Management, 463, 118038, https://doi.org/10.1016/j.foreco.2020.118038, 2020. a
Fang, H.: Canopy clumping index (CI): A review of methods, characteristics, and applications, Agricultural and Forest Meteorology, 303, 108374, https://doi.org/10.1016/j.agrformet.2021.108374, 2021. a, b
Fang, H., Baret, F., Plummer, S., and Schaepman-Strub, G.: An overview of global leaf area index (LAI): Methods, products, validation, and applications, Reviews of Geophysics, 57, 739–799, 2019. a
Flynn, W. R. M., Owen, H. J. F., Grieve, S. W. D., and Lines, E. R.: Quantifying vegetation indices using terrestrial laser scanning: methodological complexities and ecological insights from a Mediterranean forest, Biogeosciences, 20, 2769–2784, https://doi.org/10.5194/bg-20-2769-2023, 2023. a
Geng, J., Yuan, G., Chen, J. M., Lyu, C., Tu, L., Fan, W., Tian, Q., Wu, Z., Tao, T., Yu, M., Zhu, Y., Huang, J., Xu, K., Li, J., and Wang, S.: Error analysis of LAI measurements with LAI-2000 due to discrete view angular range angles for continuous canopies, Remote Sensing, 13, 1405, https://doi.org/10.3390/rs13071405, 2021. a, b
Ghazal, M., Mahmoud, A., Shalaby, A., and El-Baz, A.: Automated Framework for Accurate Segmentation of Leaf Images for Plant Health Assessment, Environ. Monit. Assess., 191, 491, https://doi.org/10.1007/s10661-019-7615-9, 2019. a
Gower, S. T., Kucharik, C. J., and Norman, J. M.: Direct and indirect estimation of leaf area index, fPAR, and net primary production of terrestrial ecosystems, Remote Sensing of Environment, 70, 29–51, https://doi.org/10.1016/S0034-4257(99)00056-5, 1999. a, b
Grotti, M., Calders, K., Origo, N., Puletti, N., Alivernini, A., Ferrara, C., and Chianucci, F.: An Intensity, Image-Based Method to Estimate Gap Fraction, Canopy Openness and Effective Leaf Area Index from Phase-Shift Terrestrial Laser Scanning, Agr. Forest Meteorol., 280, 107766, https://doi.org/10.1016/j.agrformet.2019.107766, 2020. a, b
Jonckheere, I., Fleck, S., Nackaerts, K., Muys, B., Coppin, P., Weiss, M., and Baret, F.: Review of Methods for in Situ Leaf Area Index Determination, Agr. Forest Meteorol., 121, 19–35, https://doi.org/10.1016/j.agrformet.2003.08.027, 2004. a, b, c
Leblanc, S. G., Chen, J. M., Fernandes, R., Deering, D. W., and Conley, A.: Methodology comparison for canopy structure parameters extraction from digital hemispherical photography in boreal forests, Agricultural and Forest Meteorology, 129, 187–207, 2005. a, b
Lee, J., Cha, S., Lim, J., Chun, J., and Jang, K.: Practical LAI Estimation with DHP Images in Complex Forest Structure with Rugged Terrain, Forests, 14, 2047, https://doi.org/10.3390/f14102047, 2023. a, b, c
Liaw, A. and Wiener, M.: Classification and Regression by randomForest, R News, 2, 18–22, https://CRAN.R-project.org/doc/Rnews/ (last access: 25 February 2026), 2002. a
Liu, J., Li, L., Akerblom, M., Wang, T., Skidmore, A., Zhu, X., and Heurich, M.: Comparative Evaluation of Algorithms for Leaf Area Index Estimation from Digital Hemispherical Photography through Virtual Forests, Remote Sens., 13, 3325, https://doi.org/10.3390/rs13163325, 2021. a
Liu, Z., Wang, C., Chen, J. M., Wang, X., and Jin, G.: Empirical models for tracing seasonal changes in leaf area index in deciduous broadleaf forests by digital hemispherical photography, Forest Ecology and Management, 351, 67–77, 2015a. a
Liu, Z., Wang, C., Chen, J. M., Wang, X., and Jin, G.: Empirical Models for Tracing Seasonal Changes in Leaf Area Index in Deciduous Broadleaf Forests by Digital Hemispherical Photography, Forest Ecol. Manag., 351, 67–77, https://doi.org/10.1016/j.foreco.2015.05.005, 2015b. a, b
Liu, Z., Wang, X., Chen, J. M., Wang, C., and Jin, G.: On Improving the Accuracy of Digital Hemispherical Photography Measurements of Seasonal Leaf Area Index Variation in Deciduous Broadleaf Forests, Can. J. Forest Res., 45, 721–731, https://doi.org/10.1139/cjfr-2014-0351, 2015c. a, b, c
Lotz, S., Soltani, S., Jaksztat, T., and Kattenborn, T.: Data and scripts for manuscript Litter vs. Lens: Evaluating LAI from Litter Traps and Hemispherical Photos Across View Zenith Angles and Leaf Fall Phases, Zenodo [data set and code], https://doi.org/10.5281/zenodo.18785222, 2026. a
Muggeo, V. M. R.: Segmented: An R Package to Fit Regression Models with Broken-Line Relationships, R news, 8, 20–25, 2008. a
Mussche, S., Samson, R., Nachtergale, L., Schrijver, A. d., Lemeur, R., and Lust, N.: A comparison of optical and direct methods for monitoring the seasonal dynamics of leaf area index in deciduous forests, Finnish Society of Forest Science, ISSN (Print): 0037-5330, ISSN (Electronic): 2242-4075, 2001. a
Myneni, R., Hoffman, S., Knyazikhin, Y., Privette, J., Glassy, J., Tian, Y., Wang, Y., Song, X., Zhang, Y., Smith, G., Lotsch, A., Friedl, M., Morisette, J., Votava, P., Nemani, R., and Running, S.: Global Products of Vegetation Leaf Area and Fraction Absorbed PAR from Year One of MODIS Data, Remote Sens. Environ., 83, 214–231, https://doi.org/10.1016/S0034-4257(02)00074-3, 2002. a
Otsu, N. et al.: A threshold selection method from gray-level histograms, Automatica, 11, 23–27, 1975. a
Pisek, J., Sonnentag, O., Richardson, A. D., and Mõttus, M.: Is the Spherical Leaf Inclination Angle Distribution a Valid Assumption for Temperate and Boreal Broadleaf Tree Species?, Agr. Forest Meteorol., 169, 186–194, https://doi.org/10.1016/j.agrformet.2012.10.011, 2013. a
Pueschel, P., Buddenbaum, H., and Hill, J.: An Efficient Approach to Standardizing the Processing of Hemispherical Images for the Estimation of Forest Structural Attributes, Agr. Forest Meteorol., 160, 1–13, https://doi.org/10.1016/j.agrformet.2012.02.007, 2012. a
R Core Team: R: A Language and Environment for Statistical Computing, R Foundation for Statistical Computing, Vienna, Austria, https://www.R-project.org/ (last access: 25 February 2026), 2022. a
Saitoh, T. M., Nagai, S., Noda, H. M., Muraoka, H., and Nasahara, K. N.: Examination of the Extinction Coefficient in the Beer–Lambert Law for an Accurate Estimation of the Forest Canopy Leaf Area Index, Forest Sci. Technol., 8, 67–76, https://doi.org/10.1080/21580103.2012.673744, 2012. a
Schaefer, M., Farmer, E., Soto-Berelov, M., Woodgate, W., and Jones, S.: Overview of ground based techniques for estimating LAI, in: AusCover Good Practice Guidelines: A technical handbook supporting calibration and validation activities of remotely sensed data products, TERN AusCover, 88–118, ISBN 978-0-646-94137-0, 2015. a, b, c
Tesch, J., Kühnhammer, K., Wagner, D., Christen, A., Dormann, C., Frey, J., Grote, R., Kattenborn, T., Sulzer, M., Wallrabe, U., Weiler, M., Werner, C., Baghbani, S., Brzozon, J., Comella, L. M., Dedden, L., Dumberger, S., Frey, Y., Gassilloud, M., Gerach, T., Göritz, A., Haberstroh, S., Klüppel, J., Kremer, L., Kreuzwieser, J., Lee, H., Maack, J., Müller, J., Prucker, O., Rajak, S. K., Rühe, J., Rupitsch, S. J., Schack-Kirchner, H., Scharinger, C., Shinde, U., Steinmann, T., Stock, C., and Strack, J.: The ECOSENSE forest: A distributed sensor and data management system for real-time monitoring of ecosystem processes and stresses, EGUsphere [preprint], https://doi.org/10.5194/egusphere-2025-4979, 2025. a
Tian, J., Liu, X., Zheng, Y., Xu, L., Huang, Q., and Hu, X.: Improving Otsu Method Parameters for Accurate and Efficient in LAI Measurement Using Fisheye Lens, Forests, 15, 1121, https://doi.org/10.3390/f15071121, 2024. a
Utsugi, H., Araki, M., Kawasaki, T., and Ishizuka, M.: Vertical Distributions of Leaf Area and Inclination Angle, and Their Relationship in a 46-Year-Old Chamaecyparis Obtusa Stand, Forest Ecol. Manag., 225, 104–112, https://doi.org/10.1016/j.foreco.2005.12.028, 2006. a
Verger, A., Filella, I., Baret, F., and Peñuelas, J.: Vegetation Baseline Phenology from Kilometric Global LAI Satellite Products, Remote Sens. Environ., 178, 1–14, https://doi.org/10.1016/j.rse.2016.02.057, 2016. a
Weiss, M., Baret, F., Smith, G., Jonckheere, I., and Coppin, P.: Review of Methods for in Situ Leaf Area Index (LAI) Determination, Agr. Forest Meteorol., 121, 37–53, https://doi.org/10.1016/j.agrformet.2003.08.001, 2004. a
Werner, C., Wallrabe, U., Christen, A., Comella, L., Dormann, C., Göritz, A., Grote, R., Haberstroh, S., Jouda, M., Kiese, R., Koch, B., Korvink, J., Kreuzwieser, J., Lang, F., Müller, J., Prucker, O., Reiterer, A., Rühe, J., Rupitsch, S., Schack-Kirchner, H., Schmitt, K., Stobbe, N., Weiler, M., Woias, P., and Wöllenstein, J.: ECOSENSE - Multi-scale Quantification and Modelling of Spatio-Temporal Dynamics of Ecosystem Processes by Smart Autonomous Sensor Networks, Research Ideas and Outcomes, 10, e129357, https://doi.org/10.3897/rio.10.e129357, 2024. a
Wilson, J. W.: Estimation of foliage denseness and foliage angle by inclined point quadrats, Australian Journal of Botany, 11, 95–105, 1963. a
Yao, W., Kelbe, D., Leeuwen, M., Romanczyk, P., and Aardt, J.: Towards an Improved LAI Collection Protocol via Simulated and Field-Based PAR Sensing, Sensors, 16, 1092, https://doi.org/10.3390/s16071092, 2016. a
Zhang, Y., Chen, J. M., and Miller, J. R.: Determining digital hemispherical photograph exposure for leaf area index estimation, Agricultural and Forest Meteorology, 133, 166–181, 2005. a
Zhu, X., Skidmore, A. K., Wang, T., Liu, J., Darvishzadeh, R., Shi, Y., Premier, J., and Heurich, M.: Improving Leaf Area Index (LAI) Estimation by Correcting for Clumping and Woody Effects Using Terrestrial Laser Scanning, Agr. Forest Meteorol., 263, 276–286, https://doi.org/10.1016/j.agrformet.2018.08.026, 2018. a, b, c
Zou, J., Hou, W., Chen, L., Wang, Q., Zhong, P., Zuo, Y., Luo, S., and Leng, P.: Evaluating the impact of sampling schemes on leaf area index measurements from digital hemispherical photography in Larix principis-rupprechtii forest plots, Forest Ecosystems, 7, 52, https://doi.org/10.1186/s40663-020-00262-z, 2020. a