the Creative Commons Attribution 4.0 License.
the Creative Commons Attribution 4.0 License.
 | 08 Apr 2026
Modeling the impact of drainage on peatland CO2 and CH4 fluxes and its underlying drivers
Liyang Liu
Philippe Ciais
Thu Hang Nguyen
Chunjing Qiu
Elodie Salmon
Aram Kalhori
Christophe Guimbaud
Matthias Peichl
Joshua L. Ratcliffe
Koffi Dodji Noumonvi
Xuefei Li
Peatland drying is an important process affecting greenhouse gas (GHG) emissions. Ditching of peat for drainage to plant forest has been a widespread management practice in the Nordic countries, and drying increasingly occurs also from climate change induced drought. Previously published meta-analyses from literature suggest that drainage increases soil CO2 emissions by enhancing oxic decomposition in aerated upper layers while suppressing CH4 emissions. However, these data do not elucidate short-term variations of GHG fluxes during drainage and usually only regress GHG emissions as a function of the annual mean water table. Here we developed a new parameterization of peat drainage in a land surface model that represents peat processes and fluxes of CO2 and CH4, by adding a machine-learning module to predict the daily water table depths from simulated soil moisture in the upper soil layers and a ditch that receives drainage water. Because peatland pre-drainage GHG emissions vary between sites and influence subsequent changes following drainage, idealized simulations were performed for virtual drainage applied to a collection of 10 pristine sites, where the model parameters are calibrated against observed GHG fluxes. Different drainage intensities are simulated by prescribing lower water table depths from setting the ditch depth from 5–80 cm below the initial water surface. The resulting GHG flux changes across sites are compared with meta-analysis data from northern sites and show realistic results with a reduced CO2 sink and reduced CH4 emissions. Additional comparison with continuous flux data collected in the UK for different sites associated with increasing drainage levels also shows good model performance. Overall, using GWP100 to compare the effect of CH4 vs. CO2 flux changes, our model simulations suggest only small net GHG emission changes in CO2-equivalent GHG emissions under drainage scenarios over multi-decadal timescales, yet with differences between sites. Over time, simulated emission factors of CO2 flux decrease because of exhaustion of labile soil organic substrate for decomposition, while reductions in CH4 emissions are amplified due to decreased availability of material for anoxic decomposition. The sensitivities of CO2 flux changes to increased water table depth changes are primarily controlled by initial CO2 and CH4 fluxes, initial soil carbon content, peat vegetation community, air temperature and initial water table depth. The influence of peat vegetation on the GHG flux sensitivities in the model occurs via differing lability of soil organic carbon pools, with moss-dominated sites having a lower sensitivity due to their longer peat turnover time. Nonetheless, our calibrated global model remains limited in its ability to mechanistically represent drained peatland systems, particularly regarding extrapolation and representation of dynamic soil and hydrological processes. Our model-simulated sensitivities of GHG fluxes to drainage can be approximated by linear regressions using site-level variables, which, despite the limitations, may offer a simplified, exploratory tool for estimating drainage effects.
- Article
(14670 KB) - Full-text XML
- BibTeX
- EndNote


In peatlands, organic matter does not fully decompose due primarily to the lack of oxygen in the soil caused by waterlogged conditions. Peatlands have therefore accumulated a large amount of carbon over time, ∼450 Gt (Joosten, 2009; Page et al., 2011), though they also emit a significant amount of methane (CH4) from anaerobic decomposition – commonly 5–80 in northern peatlands according to Blodau (2002). However, since the last few centuries, drainage of peatlands has become widespread for various purposes, such as commercial forestry (Arnold et al., 2005), farming (Kiew et al., 2020; Qiu et al., 2021), livestock grazing (Conchedda and Tubiello, 2020; Nieveen et al., 2005), and peat extraction for fuel (Schilstra and Gerding, 2004; Sirin et al., 2010). When peatlands are drained, increased oxygen levels in the soil promote aerobic decomposition of organic matter, leading to higher CO2 emissions into the atmosphere and reduced CH4 emissions (Holden, 2005; Rydin and Jeglum, 2013; Evans et al., 2021).
Field studies have been conducted to assess the impact of recent drainage on peatlands' contemporary greenhouse gas (GHG) emissions. Monitoring of recently drained sites using chambers (e.g., Furukawa et al., 2005; Laine et al., 2009; Martikainen et al., 1995; Munir et al., 2015; Strack and Waddington, 2007; Swails et al., 2022) and eddy covariance flux towers (Tikkasalo et al., 2025; Tong et al., 2024) have been performed to measure GHG fluxes, but the amount of data is still scarce, limited to few sites and short-term duration (mostly <10 years). When a site is being monitored which has been drained for a century, contemporary monitoring data observe the effect of drainage in the present, but as a consequence of biophysical and biochemical changes in the past. Apart from such contemporary diachronic observations of GHG fluxes at sites that have been drained in the past, only few studies based on peat coring have actually been able to assess the impact of historic drainage.
In addition, meta-analyses gathering data from various sites and methods (Couwenberg et al., 2010; Maljanen et al., 2010; Prananto et al., 2020) have been combined with empirical upscaling models of drainage-induced GHG fluxes (Evans et al., 2021; Huang et al., 2021b) across diverse geographic regions, peatland types and conditions. Meta-analyses consistently suggest that post-drainage peat decomposition causes long-term legacy CO2 emissions, persisting decades after drainage (Couwenberg et al., 2010; Huang et al., 2021b; Zou et al., 2022). Concurrently, meta-analyses show that CH4 emissions are reduced and N2O emissions can be increased during drainage (Zou et al., 2022; Tikkasalo et al., 2025), the latter of which applies to N-rich sites.
Previous studies also showed that the mean water table level (WTL) under drained conditions controls the response of emissions, but there may be distinct WTL thresholds for each gas and for each peatland. For instance, Zou et al. (2022) found in their meta-analysis that CO2 and N2O emissions only increase significantly when WTL is lowered by more than 30 cm below the soil surface. On the other hand, CH4 emissions are suppressed when WTL is lowered to 5 cm below the soil surface, and then remain low for deeper WTL. Overall, using 100 year Global Warming Potential (GWP100) across multiple sites to compare CH4 and N2O with CO2, Zou et al. (2022) showed that net CO2-equivalent emissions are reduced by drainage when the WTL depth drops from being above the surface in inundated peat to 5 cm below the soil surface because of the predominant role of CH4 reductions. When the WTL depth is below this typical threshold, net CO2-equivalent emissions can increase with drainage from the increase of CO2 emissions, offsetting the reduction of CH4 emissions. However, those meta-analysis studies do not separate well site-specific responses, do not describe systematic effects of different initial conditions and initial water table depth during drainage. Due to the dominance of short-term drained experiments, data from meta-analysis do not offer a complete assessment of net climate effects caused by distinct decadal changes of CO2, CH4 and N2O fluxes.
Another approach involves the use of process-based models, which can simulate the processes co-controlling CH4 and CO2 emissions by coupling water, thermal, and greenhouse gas biochemistry processes and drainage (Huang et al., 2021a; Kwon et al., 2022). Models are versatile, capable of simulating at various time scales and can be tailored to specific site conditions, though their reliance on generic parameterizations means they cannot always be precisely calibrated for individual sites (Liu et al., 2025). Yet, process-based models tend to be complex, and interpreting their results can therefore be challenging. Although process-based models have been increasingly applied to studying ecosystem GHG fluxes over the past decade, the majority of existing models are not specifically designed for peatlands (Mozafari et al., 2023), and their use in simulating peatland drainage was impossible. New peat-enabled land surface models have been applied at sites and over large regions using gridded simulations (Qiu et al., 2021) to study GHG fluxes of northern peatlands in response to climate changes and rising atmospheric CO2, but the impact of drainage on GHG emissions has not been fully incorporated in these models. For instance, Qiu et al. (2021) used the ORCHIDEE-PEAT model to simulate peatland CO2 flux changes for the historical conversion of northern peatlands to croplands and found a large cumulative loss of 70 PgC, but they prescribed to their model direct changes from peatland to cropland instead of considering a realistic transient drainage period when the WTL is lowered and the peatland becomes altered for instance with soil compaction, followed by crop or pasture cultivation. Further, they did not study the effect of CH4 emissions reduction after conversion to agriculture. Kwon et al. (2022) used a version of the same model that include CH4 processes (Salmon et al., 2022) for simulating the effect of drier conditions at six Arctic peatland sites and found that lowering the water level by 10 cm reduced the CO2 sink by 13±15 and decreased CH4 emissions by 4±4 leading to reduced accumulation of carbon over the next hundred years. For temperate peat sites, Evans et al. (2021) further showed from data that long-term water table drawdowns at most sites led to net carbon loss.
To our knowledge, there has not been any systematic modeling of the effect on GHG emissions of anthropogenic drainage of peatlands using land surface models that can simulate both CO2 and CH4 fluxes. One difficulty is that climate and pre-drainage fluxes and water levels are generally not measured continuously at sites subject to drainage, which prevents the calibration of models before the perturbation. In this study, we use the ORCHIDEE-PEAT, a land surface model developed to include peat processes for CO2 and CH4 fluxes to address this research gap. Our strategy is to provide idealized simulations to model virtual drainage conditions at 10 peatland sites in temperate and boreal regions (one in the US, one in Canada, one in Japan, and others in Europe) which are presently not subjected to intentional drainage using ditches. All the sites have continuous CO2 observations from eddy covariance and 8 sites also have CH4 flux observations from flux chambers. All the sites have continuous local hourly climate data used as model input and local water table depth measurements are also available at most sites. This set of well-observed sites allows us to calibrate the model before drainage. The changes of CO2 and CH4 emissions for different drainage intensities will be simulated by prescribing increasingly deeper water table depths. These drainage simulations will then be evaluated against meta-analysis results from northern temperate and boreal peatland sites (Huang et al., 2021b; Zou et al., 2022) and against a detailed set of flux measurements conducted across the UK by Evans et al. (2021) for different water table depths.
We performed idealized site simulations with virtual drainage in the future under current climate conditions, with different prescribed water table depths, as an exploratory modeling effort to investigate how peatland drainage processes can be represented within a land surface model and to identify key mechanisms, sensitivities, and structural challenges associated with drainage, rather than aiming to provide fully validated predictive estimates of drainage impacts. Based on these simulations, we address the following questions: (1) what are the changes of CO2 and CH4 fluxes in response to drainage if we would drain even more peatlands and how do they compare with observations, (2) how do fluxes change as a function of drainage duration, (3) what is the modeled sensitivity of flux changes to water table depth, (4) what factors affect the sensitivity at each site in the model, (5) what is the net climate effect of CO2 and CH4 flux changes induced by drainage using the GWP100 metrics to compare CH4 and with CO2. There are other metrics such as GWP* (Lynch et al., 2020) and SGWP (Neubauer and Megonigal, 2015), but we use here the GWP100 as it is used by the UNFCCC and national inventories for comparing the two gases. In the following, we present the model and its modifications for simulating drainage (Sect. 2), the model performances for simulating baseline CO2 and CH4 fluxes and water table depth before drainage, and the results of idealized changes in fluxes during the drainage phase (Sect. 3). First, we compare the modeled flux changes to meta-analysis results and field measurements to evaluate the model results, ensuring that they fall within plausible ranges. Then, we simulate emission factors defined by the increase of CO2 emissions and the decrease of CH4 emissions over time for various durations of drainage. Finally, we analyze the sensitivities of CO2 and CH4 flux changes per unit of water table lowering in comparison with independent observations and analyze the factors that explain why the model has different sensitivities between sites. A discussion of our results, the model limitations for soil carbon dynamics and hydrological processes, and perspectives for future large-scale simulations are given in Sect. 4.
2.1 Peatland enabled land surface model
ORCHIDEE-PEAT is a land surface model (https://orchidee.ipsl.fr/, last access: 27 March 2026) with a module specifically developed for peatland. In general, the model comprises two main components: (1) Energy and water balance, and (2) Vegetation and soil carbon cycle. In each model grid cell defining the spatial unit of simulation, the water balance is simulated individually for each soil tile containing a different type of vegetation, while the energy balance is simulated for the whole grid cell (Xi et al., 2024). The soil hydrology is simulated using 11 vertical layers, considering incoming rainfall or snowfall, soil water evaporation, water infiltration in the soil profile every half-hour, surface runoff and drainage (also called subsurface runoff in similar models). One soil tile is specifically designated for peat with distinct soil hydrological parameters. To ensure that this peat soil tile keeps a high water content, bottom drainage is excluded and surface runoff from non-peat soil tiles is given to the peat soil tile at each time step, with a slab water layer that can be created above the peat soil surface of maximum thickness 10 cm. The vegetation and soil carbon cycle component calculates biogeochemical and biophysical variables for each plant function type (called PFT). A peatland tile can contain one or more specific PFTs that grow on it, with the possibility to prescribe a fraction of mosses, graminoids (= grasses + sedges) and shrubs.
The peatland percentage at a site is defined by the total fraction of peatland PFTs in the grid cell where the site is located. A more detailed description about the model can be found in Qiu et al. (2018, 2019). In addition, an improved routine for methane simulation for peatland was integrated into the model based on Salmon et al. (2022). This enables this study to analyze CO2 fluxes and CH4 emissions. The CO2 flux represented by Net Ecosystem Exchange (NEE) is calculated as the algebraic sum of gross primary productivity (GPP, negative sign), autotrophic respiration (AR, positive sign), and heterotrophic respiration (HR, positive sign). A simplification is that lateral export of Dissolved Organic Carbon (DOC) and erosion removal of Particulate Organic Carbon (POC) are not represented. Methane produced in the soil layers is transported to the soil surface via plant-mediated transport, ebullition, and diffusion (positive sign), and methanotrophy is simulated in each soil layer from the modeled O2 concentration.
Meteorological forcings used as input for the model (including precipitation, air temperature, air humidity, pressure, solar radiation, and windspeed) are extracted from the collection of CRUJRA forcing datasets (Friedlingstein et al., 2022). The 6 h time resolution of CRUJRA data is automatically interpolated to 30 min (default time step) by the ORCHIDEE model.
2.2 Site description and simulation protocol
The idealized future drainage simulations will be implemented for 10 currently undisturbed peatland sites in temperate and boreal regions briefly described in Table A1 (Appendix A). The vegetation composition (graminoids, shrubs, and mosses) is taken from the literature when available; otherwise, it is estimated visually from satellite images.
The ORCHIDEE-PEAT model was first run for 100 years to reach the equilibrium state of soil thermal and hydrological conditions, followed by 10 000 years of spin-up to accumulate soil carbon with a fast module that computes only soil carbon changes from daily litter input and soil climate archived from the first simulation (Qiu et al., 2018), using repeated forcing data and a pre-industrial atmospheric CO2 concentration of 285 ppm. An additional 100 year simulation was then conducted before flux observations (Table A1) to simulate biogeochemical processes under observed atmospheric CO2 concentrations. The model was then calibrated for each site under present-day conditions following Liu et al. (2025), here calibrating the parameters controlling CH4 fluxes in addition to CO2 fluxes for sites that have CH4 flux observation. For CO2 fluxes, parameters governing photosynthesis rates, stomatal conductance, autotrophic respiration, soil organic carbon oxic decomposition rate and its sensitivity to temperature (Table B1 in Appendix B) were calibrated. For CH4, we calibrated parameters driving the methane production, oxidation, and transport (Table B1). The calibration was performed using the ORCHIDEE data assimilation system (ORCHIDAS, Peylin et al., 2016), a Bayesian statistical framework, employing a genetic algorithm to minimize a cost function between observation and simulated outcomes (Tarantola, 2005), i.e. here between observed and simulated daily NEE, and daily CH4 emission simultaneously. For sites without CH4 flux observations, only CO2 parameters can be calibrated, while parameters related to CH4 processes were assigned using the average calibrated values from all sites with available CH4 flux observations. After the calibration, to quantify the uncertainty from parameter values under current conditions affecting future predictions, we performed 10 Monte Carlo simulations by varying the temperature dependence of heterotrophic respiration (Q10) and the oxygen deficit enhancement of methanogenesis (O2m), which were found to be most influential controlling CH4 emissions (Liu et al., 2025; Morel et al., 2019). Parameter uncertainty was then quantified as ±1 standard deviation across these 10 simulations.
Pre-drainage simulations were run for each site over a period of 100 years. We then simulate five virtual idealized drainage scenarios for each site over a subsequent 50 year future period in which the water table remains at its initial level to define a baseline and varies each day from hydrological balance simulations (no drainage), or is prescribed at 5, 10, 20, and 50 cm below the initial/baseline water level. For the 150 years of simulations, 6-hourly climate forcings of the flux-observed years are used by randomly selecting years. The same years are used for the undisturbed and drained simulations to ensure that the resulting differences in fluxes are not caused by differences in climate.
2.3 Reconstruction of baseline water table
Performing drainage simulations requires a good representation of the baseline water table (WTD) before drainage. This is not straightforward in a model like ORCHIDEE where the numerical discretization of the soil into layers is coarser with increasing depth, e.g. a layer has thickness of 25 cm at 50 cm below the surface, which does not allow to position the water table in this layer accurately, i.e. the model can capture broad seasonal WTD trends, but often struggles to reproduce short-term fluctuation. Therefore, we developed a machine learning module, separate from the ORCHIDEE model, to simulate the accurate position of the water table as a function of simulated soil moisture in the soil layers, which leverages the WTD observation data that we have for 8 out of 10 sites. It is expected to reconstruct a continuous and more detailed WTD time series that aligns better with measured data, including finer temporal dynamics.
The module is trained to gap-fill the daily baseline water table observed at 8 sites and it is used to reproduce the missing water table measurements at 2 sites (CZ-Wet, DE-Akm; Table A1). Because the water table is closely related to soil moisture, our strategy is to extract the simulated soil moisture of all the layers to train a model defined by WTD =f(SM). Simulated soil moisture and observed water table time series are sampled by 7 d blocks to make up the training dataset for the model, with soil moistures as inputs and water table as output. Firstly, for a site where observed water table data is available but with missing values, its own training dataset is divided into an ratio for training and testing, then the missing data are filled. This process is referred to as self-reconstruction. Secondly, a multi-site training dataset is created using all the sites that have water table observation with a training/testing ratio of for four sites in Sweden and for the remaining. The contribution of each Swedish site to the total training subset is reduced due to their proximity to each other, which potentially results in the over-representation of their relationships between water table and soil moisture when training the machine learning model. Once this multi-site model has been trained, it will take the simulated soil moisture (from ORCHIDEE-PEAT) of water-table-unknown sites as input to derive the baseline water table for these sites as output. In this study, we used a Support Vector Regression (SVR) model (Smola and Schölkopf, 2004) to learn and reconstruct the relationship between soil moisture and water table, because of its advantages such as robustness to outliers and effectiveness in high-dimensional space (Mohammed Rashid et al., 2022).
2.4 Peatland drainage by ditching
In order to simulate the effect of drainage on CO2 and CH4 fluxes, we assume that the water table is lowered by draining into ditches. We introduce into the model a new module with a ditch of which depth is the same as the desired lowered maximum water table depth (e.g., if the lowest water table under drainage is 40 cm, then ditch depth is 40 cm). In addition, runoff from other soil tiles to peat is assumed to be excluded during drainage implementation, reducing water supply to peat. Note that the simulated water table fluctuates continuously throughout the year from variable incoming rainfall, and so does the ditch water level. The difference in the hydrology simulations with and without drainage is shown in Fig. 1 and described below.
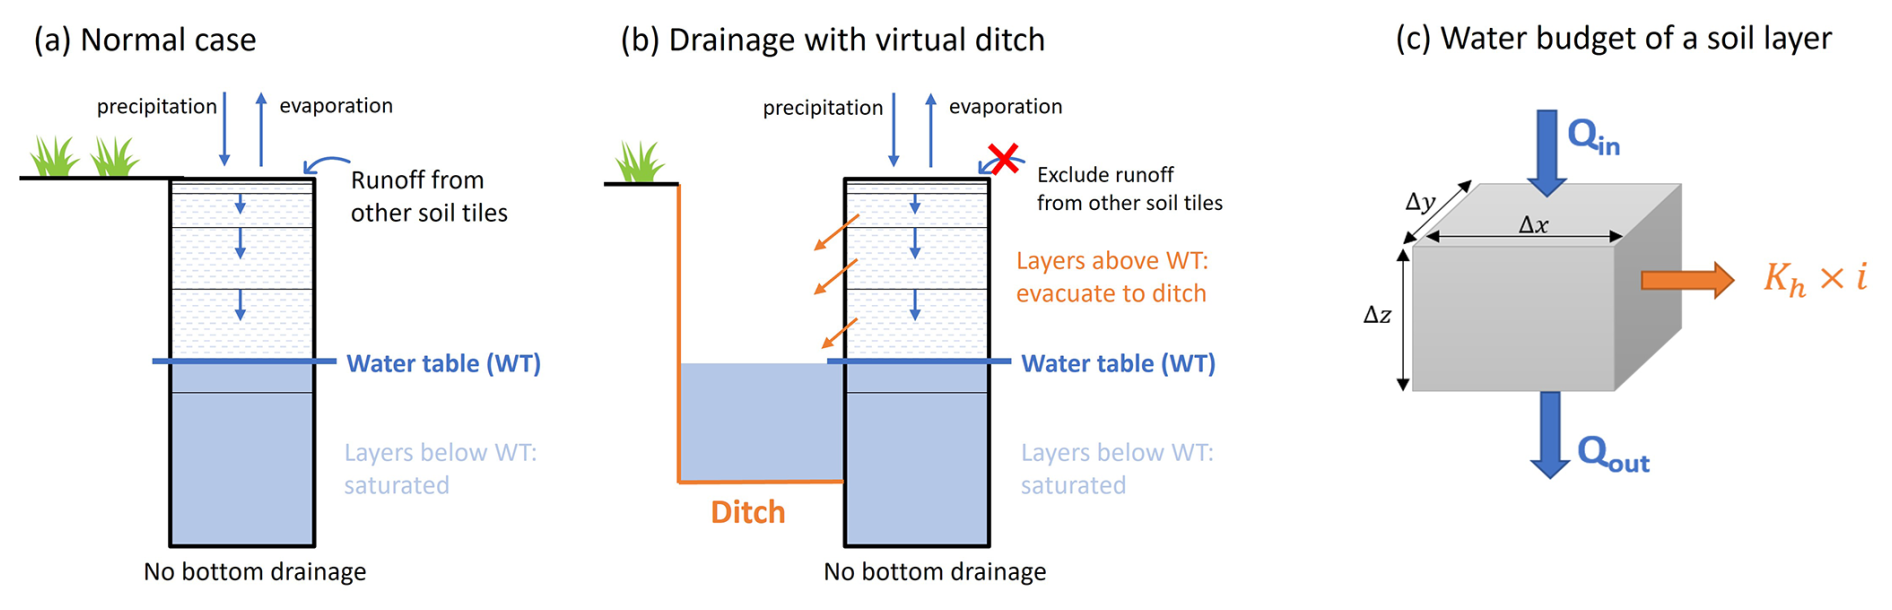
Figure 1Illustration of drainage by ditch simulation in the ORCHIDEE-PEAT model: (a) Soil column without a ditch, showing vertical water fluxes and horizontal delivery from the runoff of adjacent soil tiles without peat. (b) Soil column with a ditch, incorporating lateral water loss to the ditch (orange) and suppression of runoff from other tiles. (c) Water budget of a soil layer, with lateral output fluxes due to drainage into the ditch highlighted in orange. The dimension of the volume of soil is defined by Δx, Δy and Δz. Qin and Qout are inward and outward water fluxes and Kh is the horizontal hydraulic conductivity and i is the hydraulic gradient.
In the ORCHIDEE model, each soil column is separated into layers. We set soil layers below the water table to be saturated (θ=θs). Above the water table, in a volume of soil with horizontal dimension Δx, Δy and thickness Δz, without drainage, water flows through the soil in the vertical dimension from the infiltration of rainfall events and runoff given by other soil tiles in the same grid (Fig. 1a, blue arrows), a flux Qin entering and a flux Qout leaving the layer across the cross-section area ΔxΔy (Fig. 1c). These vertical fluxes are functions of hydraulic conductivity and diffusivity (Kv [m s−1] and Dv [m2 s−1], respectively, with v for vertical) which are functions of soil moisture (θt+Δt).
With drainage, a new horizontal flux across the cross-section area ΔyΔz is added to represent water running out of the soil to the ditch (Fig. 1c, orange arrow). Assuming that ditches are placed perpendicularly to the flow of groundwater, this additional drainage flux is a function of horizontal hydraulic conductivity (Kh) and hydraulic gradient (i). The change of moisture in a time step Δt is given by:
Removing ΔxΔy in both sides, Eq. (1) becomes:
with Δx now playing a role as ditch spacing. Using a numerical method with boundary conditions at top layer where and at bottom layer where , a tridiagonal matrix system is constructed to solve θt+Δt (Ducharne et al., 2018). Note that in the ORCHIDEE model, vertical water fluxes are simulated only in the downward direction – from the surface layer to lower soil layers. Upward water movement due to capillary forces is not currently represented in the model. Lateral subsurface water fluxes are also not represented.
3.1 Simulation before drainage
The results of the model calibration under present conditions are shown in Fig. 2, with CO2 fluxes (Net Ecosystem Exchange, NEE) and CH4 emissions calibration for sites that have observations of both fluxes (Fig. 2a–h), and CO2-only calibration for other sites (Fig. 2i and j). The CH4 fluxes of all eight sites were well simulated, with RMSE ranging from 0.017–0.025 . The calibrations of NEE also showed good performance, with RMSE smallest at Sweden sites (from 0.585–0.691 ).
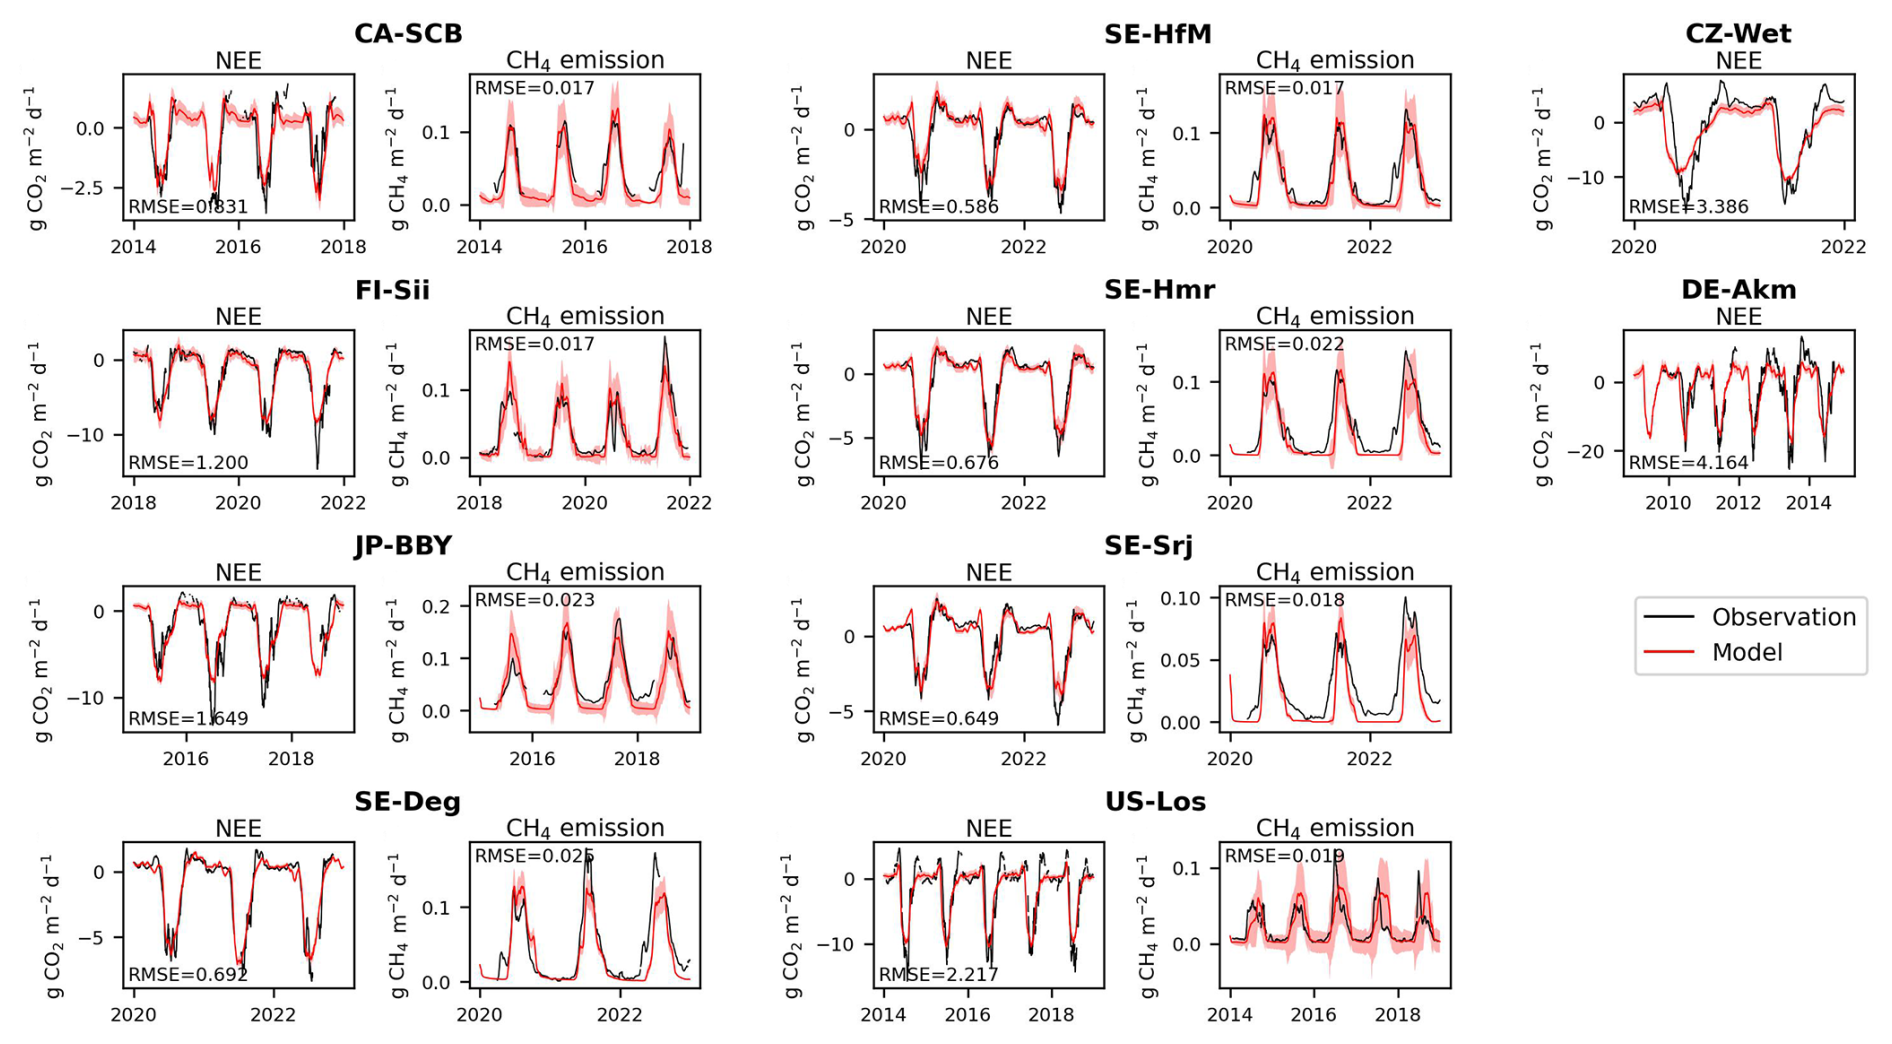
Figure 2Comparison of model simulations after calibration with observed net ecosystem exchange CO2 fluxes (NEE) and CH4 emissions. Sites in (a)–(h) measured both fluxes and in (i), (j) only NEE. The red shadings in each plot represent the uncertainty (±1 standard deviation across 10 Monte Carlo simulations; see Methods) in the simulated NEE or CH4 emission induced by parameter uncertainty.
Figure 3 presents the reconstruction of water table depth from soil moisture with the SVR model trained for individual sites (Fig. 3a–h, left column). The RMSE of modelled and observed water table depth ranged from 2.76 cm (FI-Sii) to 6.11 cm (US-Los) and the model captured in general the seasonal variations very well, though less so the short-term variations. At the Swedish sites, the peat is frozen between mid-October to early May, during which time the WTD is not fluctuating in reality. However, due to the lack of WTD measurements during these frozen periods, the self-reconstructed WTD from the SVR model for these times were accepted as the best available approximation. With the SVR model trained using all the sites together, SVR was less effective because it must compromise the patterns between all the sites: RMSE increased up to 6.76 cm but still captures the main seasonal variations. The water table depth reconstructed using SVR trained from all other sites and applied at the two sites where direct WTD observations were missing including CZ-Wet, DE-Akm (Fig. 3i and j, right column) was used in this study as the baseline water table depth.
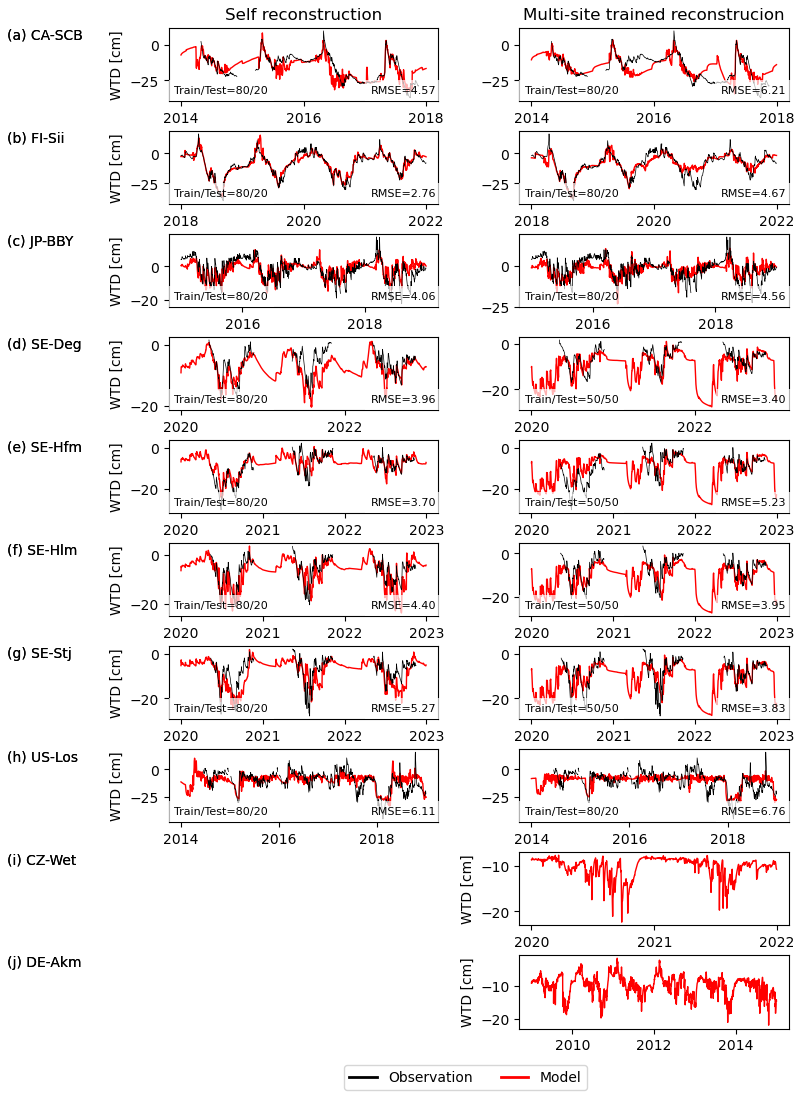
Figure 3Water table depth reconstruction with a machine learning model trained on observations and using modelled soil moisture in all soil layers within the top 2 m below the surface (red) compared with observed values (black).
3.2 Drainage simulation: changes of CO2, CH4 fluxes, soil water and oxygen after few years
Drainage reduced the water content in the soil and increased oxygen concentration (Fig. 4). With more oxygen in the soil and less moisture, heterotrophic respiration was increased. On the contrary, methane production was suppressed in aerated soil, leading to less methane emission when the water table gets deeper. Figure 4 presents the monthly average of soil water content, oxygen, NEE and CH4 emissions during the first three years after drainage, for different WTD levels. It shows that the inclusion of a ditch in the model could lower soil moisture effectively and that flux simulation responded as expected with decreased NEE uptake or NEE switching to a net CO2 source, and decreased CH4 emissions. Note that there could be a slight inconsistency between the pre- and during-drainage simulations. In the pre-drained simulation, soil moisture was calculated by the model, whereas in the drainage simulation, all the soil column below the ditch depth was forced to be saturated, which introduces a different water content of the deep layers. For instance, a deep layer that was near-saturated in the pre-drainage simulation was set to become saturated in the drainage simulation. The impact of this inconsistency on gas fluxes, however, was small because deep layers did not contribute much to changes in CH4 and CO2 fluxes (they contain less labile organic carbon) and they were already near-saturation or at full saturation before drainage. The 50 year time series of NEE and CH4 emissions are shown in Fig. C1 (Appendix C).
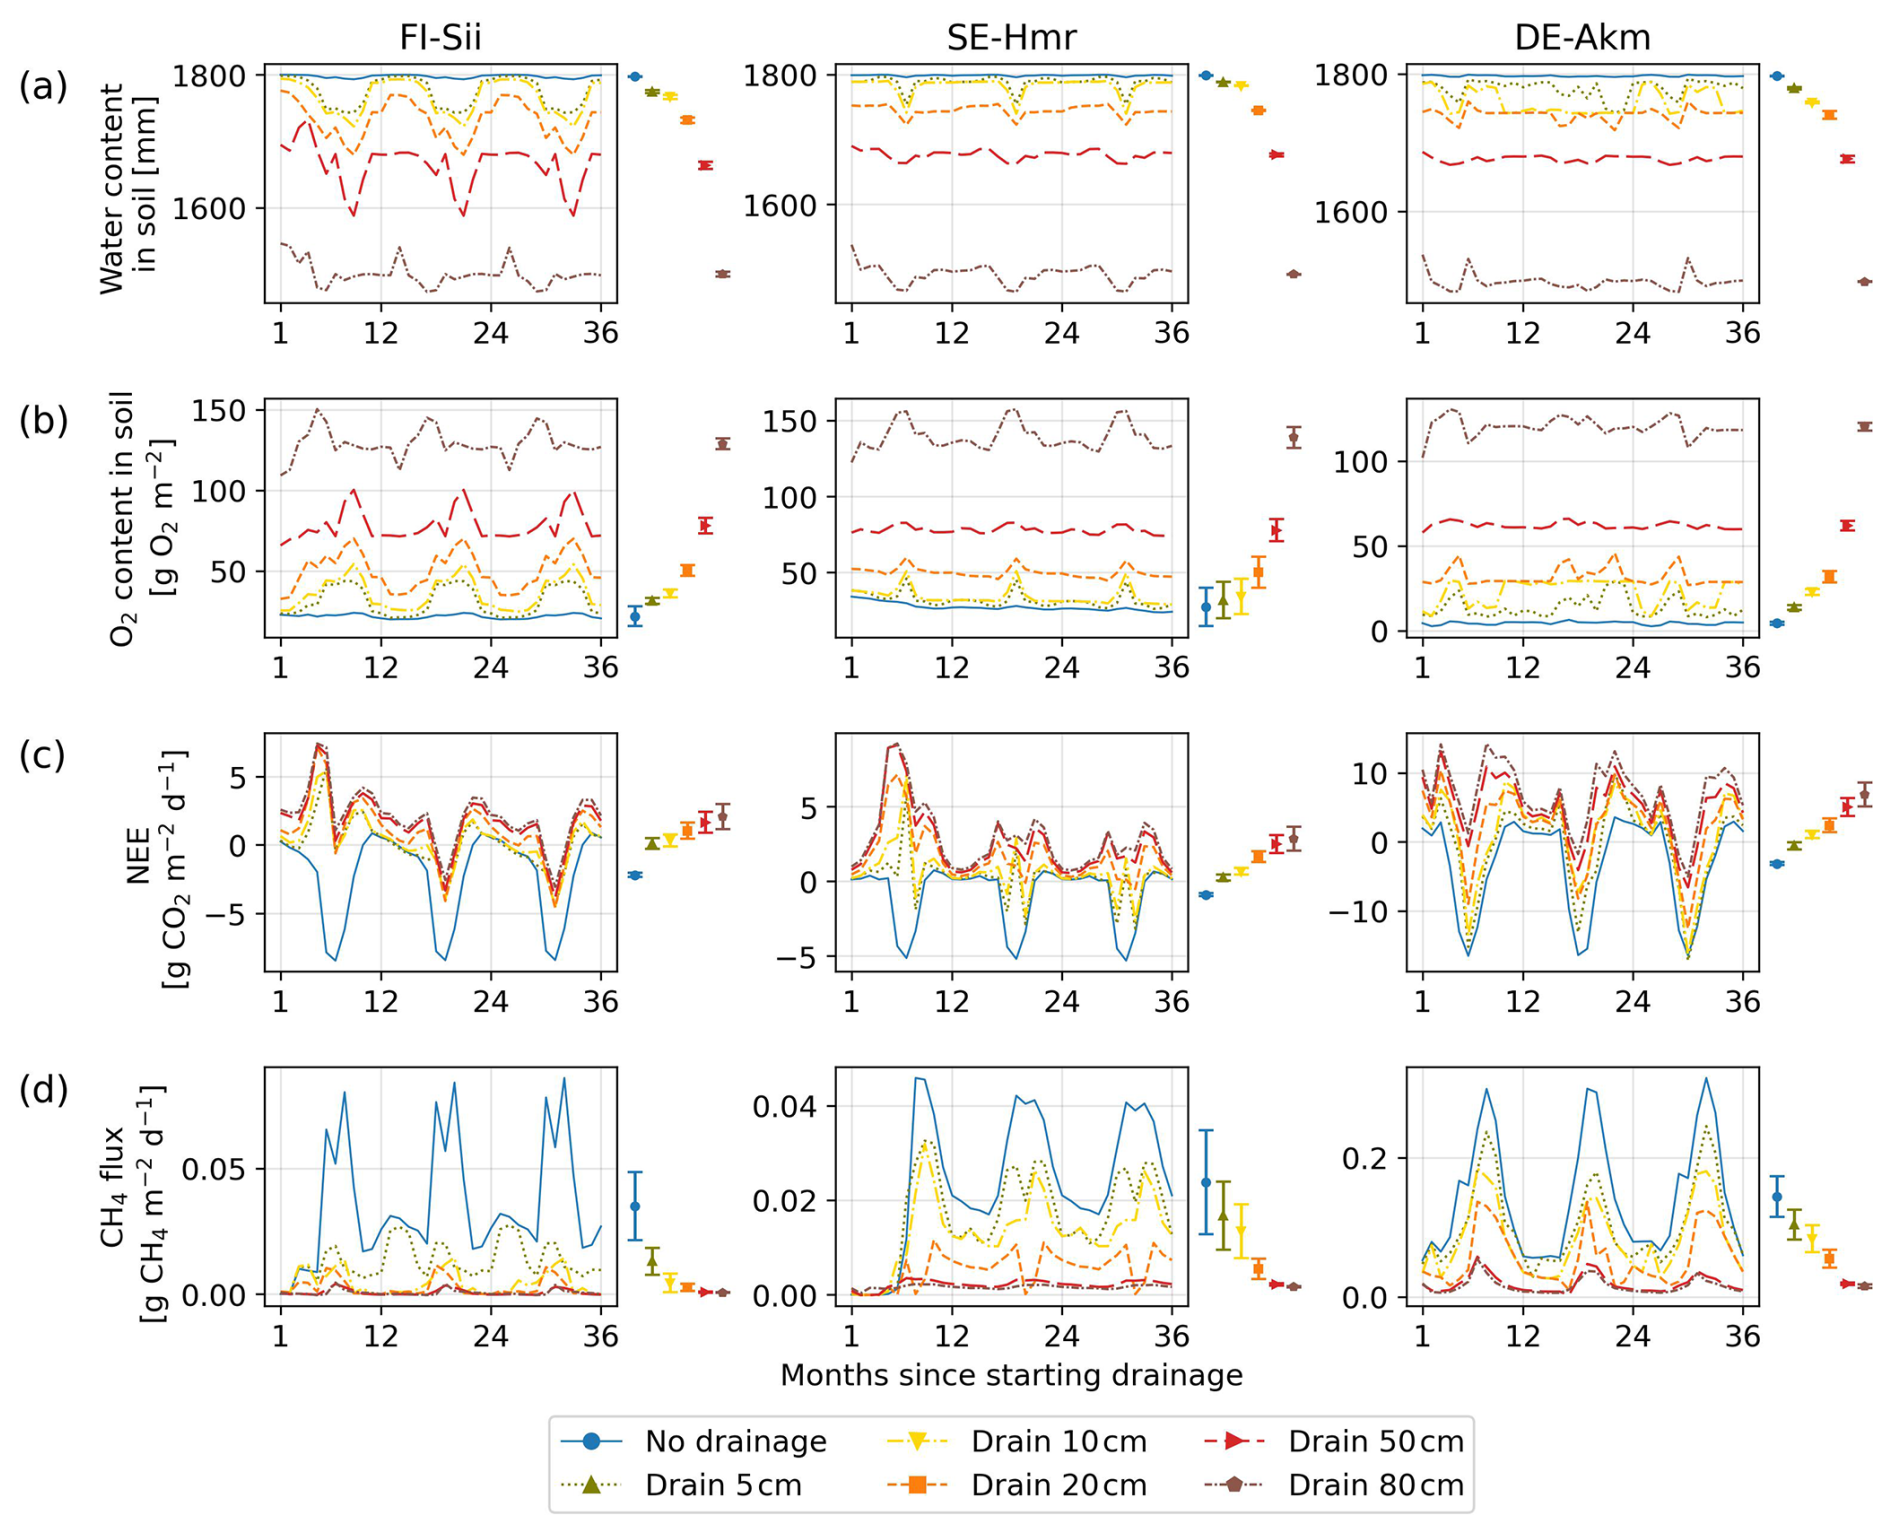
Figure 4Simulated changes at three sites of (a) soil water content in the whole profile (2 m), (b) soil oxygen content, (c) Net Ecosystem Exchange of CO2 and (d) methane emissions. Different colors indicate different water table depths below the original water level at each site. The coloured bars on the right of each panel summarize parameter uncertainty, quantified as ±1 standard deviation of the simulated time-mean fluxes computed over the full 50 year drainage simulation from 10 Monte Carlo runs. The coloured dots indicate the time–mean flux simulated using the calibrated parameter set. Note that when a flux (e.g. CH4) is close to zero, the corresponding parameter-induced uncertainty also approaches zero.
3.3 Long-term changes of CO2 and CH4 fluxes, diagnosed by emission factors after up to 50 years
Figure 5 shows the average emission factor (EF) across all peatland sites for 50 years since starting the idealized drainage scenarios. The EF is defined by the average GHG flux per unit of area over a given period of time under drainage minus the flux at the same site under undisturbed conditions. Qiu et al. (2021) implemented similar calculations using the ORCHIDEE-PEAT model for estimating carbon emission factors after peatland cultivation. Their emission factors calculated over two decades following conversion of peatland to cropland was 16 as a median, ranging from 5 to more than 50 . Our estimates are lower than their values, with a median of 2.56 (95 % CI: 0.35–10.71) for 80 cm drainage (Fig. 5). Our lower median EF values than Qiu et al. (2021) are because deep soil layers remain saturated in our simulations, preserving their carbon from decomposition, while Qiu et al. (2021) assumed that the entire soil profile became drained and under-saturated when converting to cropland.
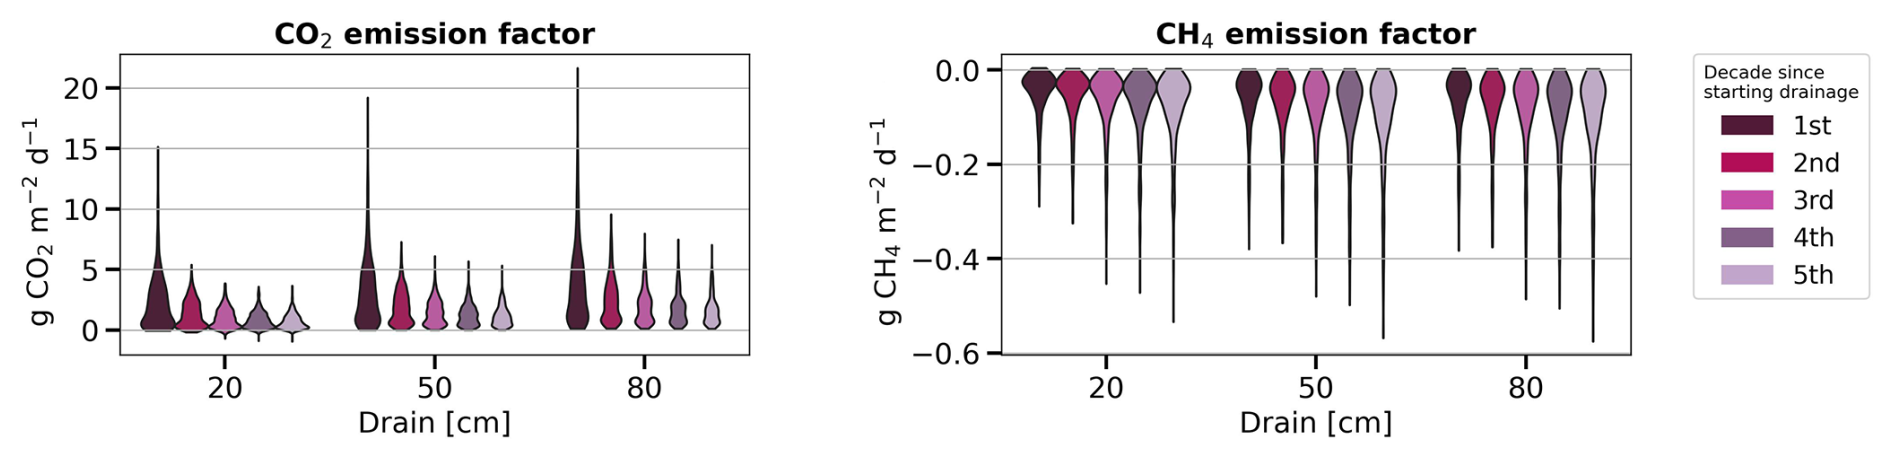
Figure 5Evolution of modelled emission factors (a) for CO2 fluxes and (b) for CH4 emissions for five decades after drainage, displayed for three drainage depths. Negative values in the right plot indicate less CH4 emissions in the drained condition than in the undrained condition.
Regarding the temporal variation of emission factors, we found a decrease in CO2 EF between the first and the fifth decade (Fig. 5) from 3.82 (0.36–12.76) down to 1.65 (0.29–4.57) for 80 cm drainage, a similar trend than the findings of Qiu et al. (2021). As GPP and autotrophic respiration (AR) was found to be little affected during the drainage period (Fig. C2f and g), the change in emission factor over time was primarily driven by the increase of heterotrophic respiration (HR) under drainage compared to undrained conditions (Fig. C2e). HR includes one part from litter and one from soil. In the early decade, the decomposition of litter accelerated in the case of drainage, leading to the quick decrease in litter amount (Fig. C2a). Later, the reduced availability of litter for decomposition caused the heterotrophic respiration from litter in drained peatlands to approach the same levels than in undrained peatlands (Fig. C2b) where litter accumulated gradually, or decomposed at a much slower rate, and maintained a stable and low heterotrophic respiration rate. On the other hand, while SOC in undrained peatlands accumulated gradually, SOC in drained peatlands increased rapidly in the early decades due to a large input of carbon from litter but then slowed down as litter carbon input declined (Fig. C2c). Consequently, the difference in soil heterotrophic respiration (HR) between drained and undrained peatlands narrowed over time (Fig. C2d). These declining trends of both soil and litter HR in drained peatlands explain why the simulated EF decreased by time. A small decreasing trend in EF over time following drainage was determined experimentally by Truskavetskii (2014) based on soil measurements from chronosequence data. Rojstaczer and Deverel (1993) reported a trend in the subsidence of organic soil over time using periodic leveling surveys, suggesting decreased EF as well, although our model did not explicitly include subsidence and compaction effects. For CH4 emissions, on the contrary, the decrease of EF amplifies with time, going from −0.07 in the first decade down to −0.10 in the last decade in the case of 80 cm drainage as shown in Fig. 5 (negative EF in this Figure indicating less CH4 emissions in the drained than in the undrained).
3.4 Comparison of simulated greenhouse gas flux changes with observations
To evaluate our drainage simulation results for GHG fluxes, we used observed changes of CO2 and CH4 fluxes collected from multiple sources through two meta-analyses of drained wetlands experiments (Huang et al., 2021b; Zou et al., 2022), the network of field flux measurements collected in Europe by Evans et al. (2021), and measurement collected in the dataset of Ecosystem Services publicly provided by the WET HORIZONS project (https://www.wethorizons.eu/resources/#database, last access: 27 March 2026). Water table depths were provided along with the fluxes in both meta-analysis studies, while in Evans et al. (2021), an “effective” water table depth was used, defined as the smaller value between the measured water table depth and the measured peat depth. The data collected by Huang et al. (2021b) provided measurements of undisturbed fluxes at control sites, as well as 77 measurements of fluxes after <1 year, 42 after 1–10 years, and 78 after >10 years of drainage. Since measurements taken within 10 years of drainage seem to dominate, we compared 10 years average values of our simulation with these data. Figure 6a and b shows the distribution of simulated and observed NEE and CH4 fluxes for different water table levels, regardless of the site and drainage level, excluding CH4 fluxes from CZ-Wet and DE-Akm, which were not calibrated during the pre-drainage period. Overall, our simulation results lie within the large range of the observed data, although our modeled CH4 emissions are in the upper range of the observed distribution. In Evans et al. (2021), a linear relationship was obtained between effective water table depth and net ecosystem production (NEP, the sum of NEE and biomass removal). Retaining only sites within boreal and temperate zones from their study (the yellow points in Fig. 6a and b), we found that our model, despite its simplified hydrology, can reproduce such a strong linear correlation between effective WTD and NEE (, R2=0.66, p<0.001). Our results (the red points in Fig. 6a and b) were in good agreement with Evans et al. (2021), yet a smaller slope between WTD and NEE was obtained in the model (, R2=0.64, p<0.001). Meta-analysis data mixing different sites, experiment duration and conditions showed a weak correlation (R2=0.04 in Huang et al., 2021b, and R2=0.18 in Zou et al., 2022), suggesting that the Evans et al. (2021) field measurements with continuous flux and WTD records at the same site may be a better benchmark of the model results.
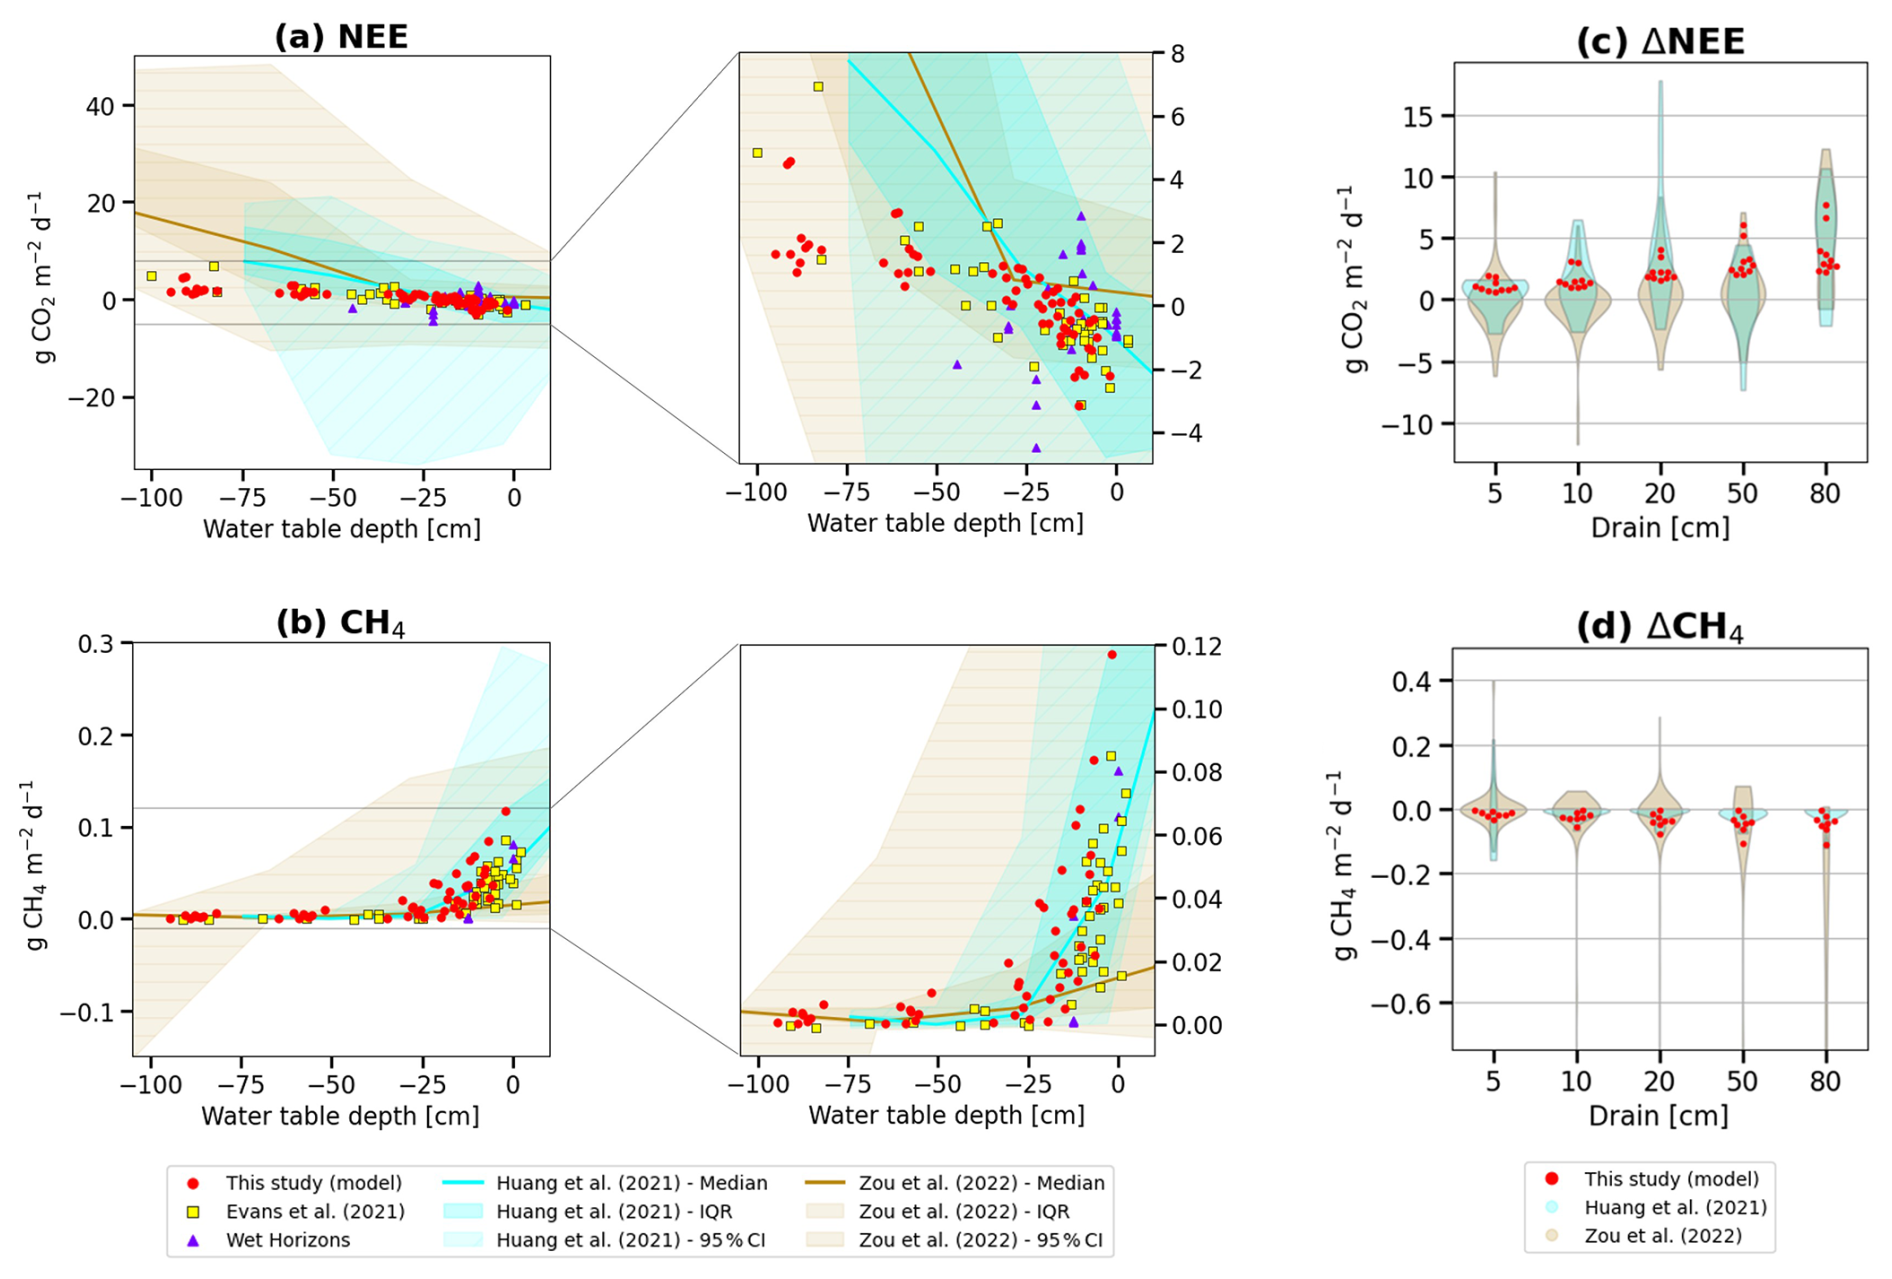
Figure 6Simulated fluxes of (a) Net ecosystem exchange of CO2 and (b) CH4 emissions for different water table levels below the original water surface (red points) compared with meta-analysis observations from Huang et al. (2021b) (cyan) and Zou et al. (2022) (brown), and with field measurements from Evans et al. (2021) (yellow) and WET HORIZONS project (purple). The darkest color shading represents ±1 standard deviation across observed sites, and the lightest shading indicates the minimum–maximum range of the observations. (c) Modeled (red dots) and observed distributions of NEE changes (ΔNEE) for different water table depths of drainage, compared with meta-analysis results, and (d) same for CH4 emissions changes (ΔCH4). For consistency with observational datasets, model results were averaged over the first 10 years of simulations, corresponding to the period during which most post-drainage observations were collected.
The distributions of the changes of fluxes compared to no drainage are presented in Fig. 6c and d for different drainage levels (ΔWTD). For this comparison, we kept only samples for 5, 10, 20, 50, and 80 cm (±10 %) drainage levels in the reference data. The numbers of measurements for each drainage level differs and different drainage levels can include different peatland sites and types. The results indicate that the modeled distribution of ΔNEE falls within the observed distributions from Huang et al. (2021b) and Zou et al. (2022), although all of our simulations show positive ΔNEE values ranging from 0 to 7.70 , i.e., more CO2 is emitted or less CO2 absorbed after peatlands are drained, whereas the meta-analysis data exhibit either increases or decreases of NEE (−7.33 to 17.80 in Huang et al., 2021b, and −11.75 to 12.26 g in Zou et al., 2022). For methane, all ΔCH4 values are negative in our model, ranging from −0.11 to 0 , i.e. less CH4 is emitted when peat is drained, while the meta-analysis data shows a negative median value of the distribution, yet with negative or positive changes of ΔCH4 (−0.16 to 0.22 in Huang et al., 2021b, −1.27 to 0.40 in Zou et al., 2022). These discrepancies mainly come from the fact that the meta-analysis studies took into account emission variations for different WTDs which can come from natural climate, microtopographic conditions and laboratory experiments, while our study focuses on ditch drainage conditions. For example, Huang et al. (2021b) included a comparison between a lawn with near-surface WTD and an adjacent hollow filled with water, which gave a negative ΔNEE because the hollows leached dissolved or particulate organic carbon, facilitating oxidation, thus releasing more CO2 than the lawn (Villa et al., 2019). A decrease in NEE may also result from anomalously cold weather, which can reduce respiration more significantly at the drained site than at the undrained site (Renou-Wilson et al., 2016), given that dry soil is more susceptible to air temperature fluctuations, and low temperatures inhibit soil decomposition. Additionally, inconsistencies in the data may contribute to their large range of ΔNEE, as they include different drainage levels and varying durations. Potential errors in the meta-analysis studies, such as inconsistencies in data collection, may also play a role in estimating negative ΔNEE or positive ΔCH4; for instance, our inspection of meta-analysis data found cases where emission data reported for different depths were from different locations.
3.5 Sensitivity of GHG emissions changes to lowered water table depth
In this section, we analyzed the sensitivity of GHG fluxes defined by the change of NEE or CH4 emission per cm of lowered WTD computed from our simulations, for different starting WTD levels at the same site, after 10 years of drainage. For the observations, we calculated the sensitivities from changes in GHG emissions reported by Huang et al. (2021b) and Zou et al. (2022) and changes in WTD between 5 and 80 cm. The distributions of the resulting sensitivities are shown in Fig. C3. Averaged across all sites, the modeled mean NEE sensitivity (0.07 ; 95 %CI: 0.01 to 0.28) is close to the observation-based values derived from the data of Huang et al. (2021b; 0.12 ; −0.23 to 0.67), but higher than the data of Zou et al. (2022), although within their 95 % confidence interval (0.01 ; −0.37 to 0.43). The simulated methane emission sensitivity (−1.43 ; −6.73 to 0.0) is also comparable to the empirical values (−1.82 ; −15.75 to 0.17 of Huang et al., 2021b, and −1.71 ; −19.47 to 5.02 of Zou et al., 2022). Kwon et al. (2022) used ORCHIDEE for 100 years drainage simulations at six arctic peatland sites with WTD lowered by 5 to 50 cm and reported average sensitivities of 0.01±0.02 for NEE, and of for CH4 emissions. Our modeled NEE sensitivity is more positive and our modeled CH4 emission sensitivity is slightly more negative than Kwon et al. (2022), despite using almost the same model. This may be attributed to the fact that we did simulation across a larger range of climate while Kwon et al. (2022) only simulated drainage of arctic wet peatlands where winter respiration is absent and high rainfall and snowmelt inputs maintain relatively more stable hydrological conditions, thus their NEE and CH4 emissions are less sensitive to lowered WTD.
Instead of fitting a linear regression between all the flux changes and all the WTD changes in the simulations (for Fig. 6c and d), we calculated the sensitivity as the change of flux divided by the change of WTD () for each possible pair of flux and negative water tables changes, i.e. when WTD becomes deeper, like in Huang et al. (2021b). The “starting” water table depth in the x axis of Fig. 7 is the shallower WTD in ΔWTD used to calculate sensitivities. This starting water table level can be taken from a drained simulation, and thus differs from the “initial” water table which corresponds to undisturbed conditions. The results shown in Fig. 7 indicate that the more shallow is the starting WTD, the higher are the sensitivities of NEE and CH4 emissions fluxes when the WTD is further lowered. This is because when drainage is applied to a site with a shallow starting water table, it affects upper soil layers that were previously saturated and causes large emissions changes. Conversely, if drainage is applied to a site with a deep starting water table, upper layers that were already exposed to oxygen experience minimal change and deeper layers dry out but the SOC that they contain decomposes more slowly (they contain more slow and passive carbon with slower turnover time in the model), resulting in a smaller sensitivity of fluxes. The sensitivities of NEE is a non-linear function of starting WTD (non-linear AIC linear AIC , with AIC definition in Appendix C). CH4 emissions sensitivity also depends on a non-linear manner of the starting WTD (non-linear AIC linear AIC for CH4 emission) and tends to saturate when drainage starts from a deep water table. The sensitivity of CH4 emissions increases from negative values to almost zero when the starting WTD is deeper than ≈40 cm.
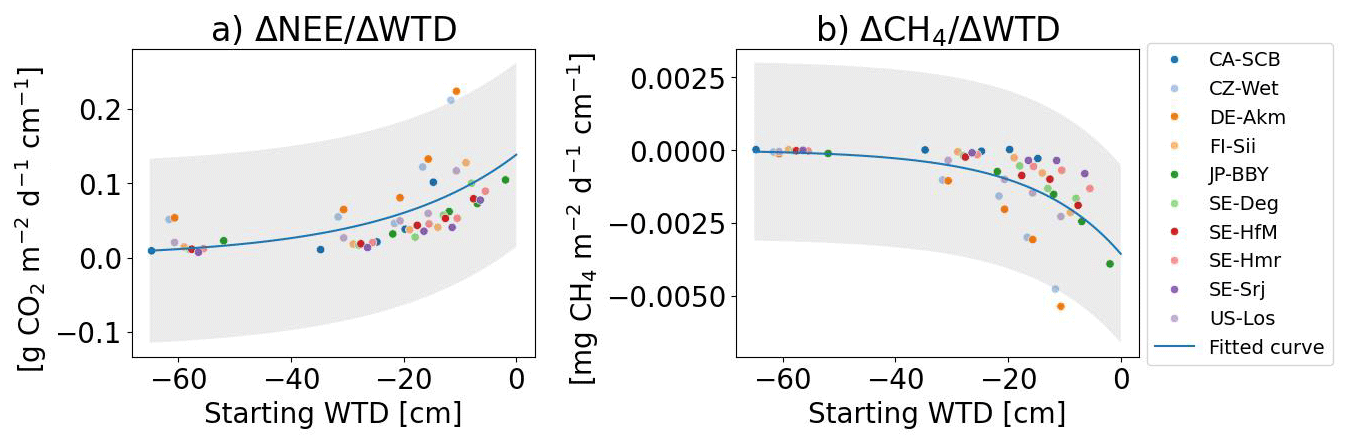
Figure 7Sensitivities of (a) net ecosystem exchange () and (b) CH4 emissions () to water table depth as a function of the starting water table depth. The starting water table depth is the upper value in ΔWTD used to calculate sensitivities by dividing Δflux by ΔWTD for all possible negative values of ΔWTD. The analysis is performed based on results from the first 10 years of drainage simualtions. The gray shadings represent 95 % CI of the regression.
3.6 Factors controlling the sensitivity of GHG emissions to water table depth across sites
Figure 8 shows the simulated sensitivities () of the 10 sites after 10 years of drainage, together with other model variables that could plausibly explain their values. For clarity, the sensitivities are shown in rank from the highest to the lowest for NEE (Fig. 8a). The regression between sensitivities and each of the selected model variables (Fig. 8c–h) are shown in Fig. 9.
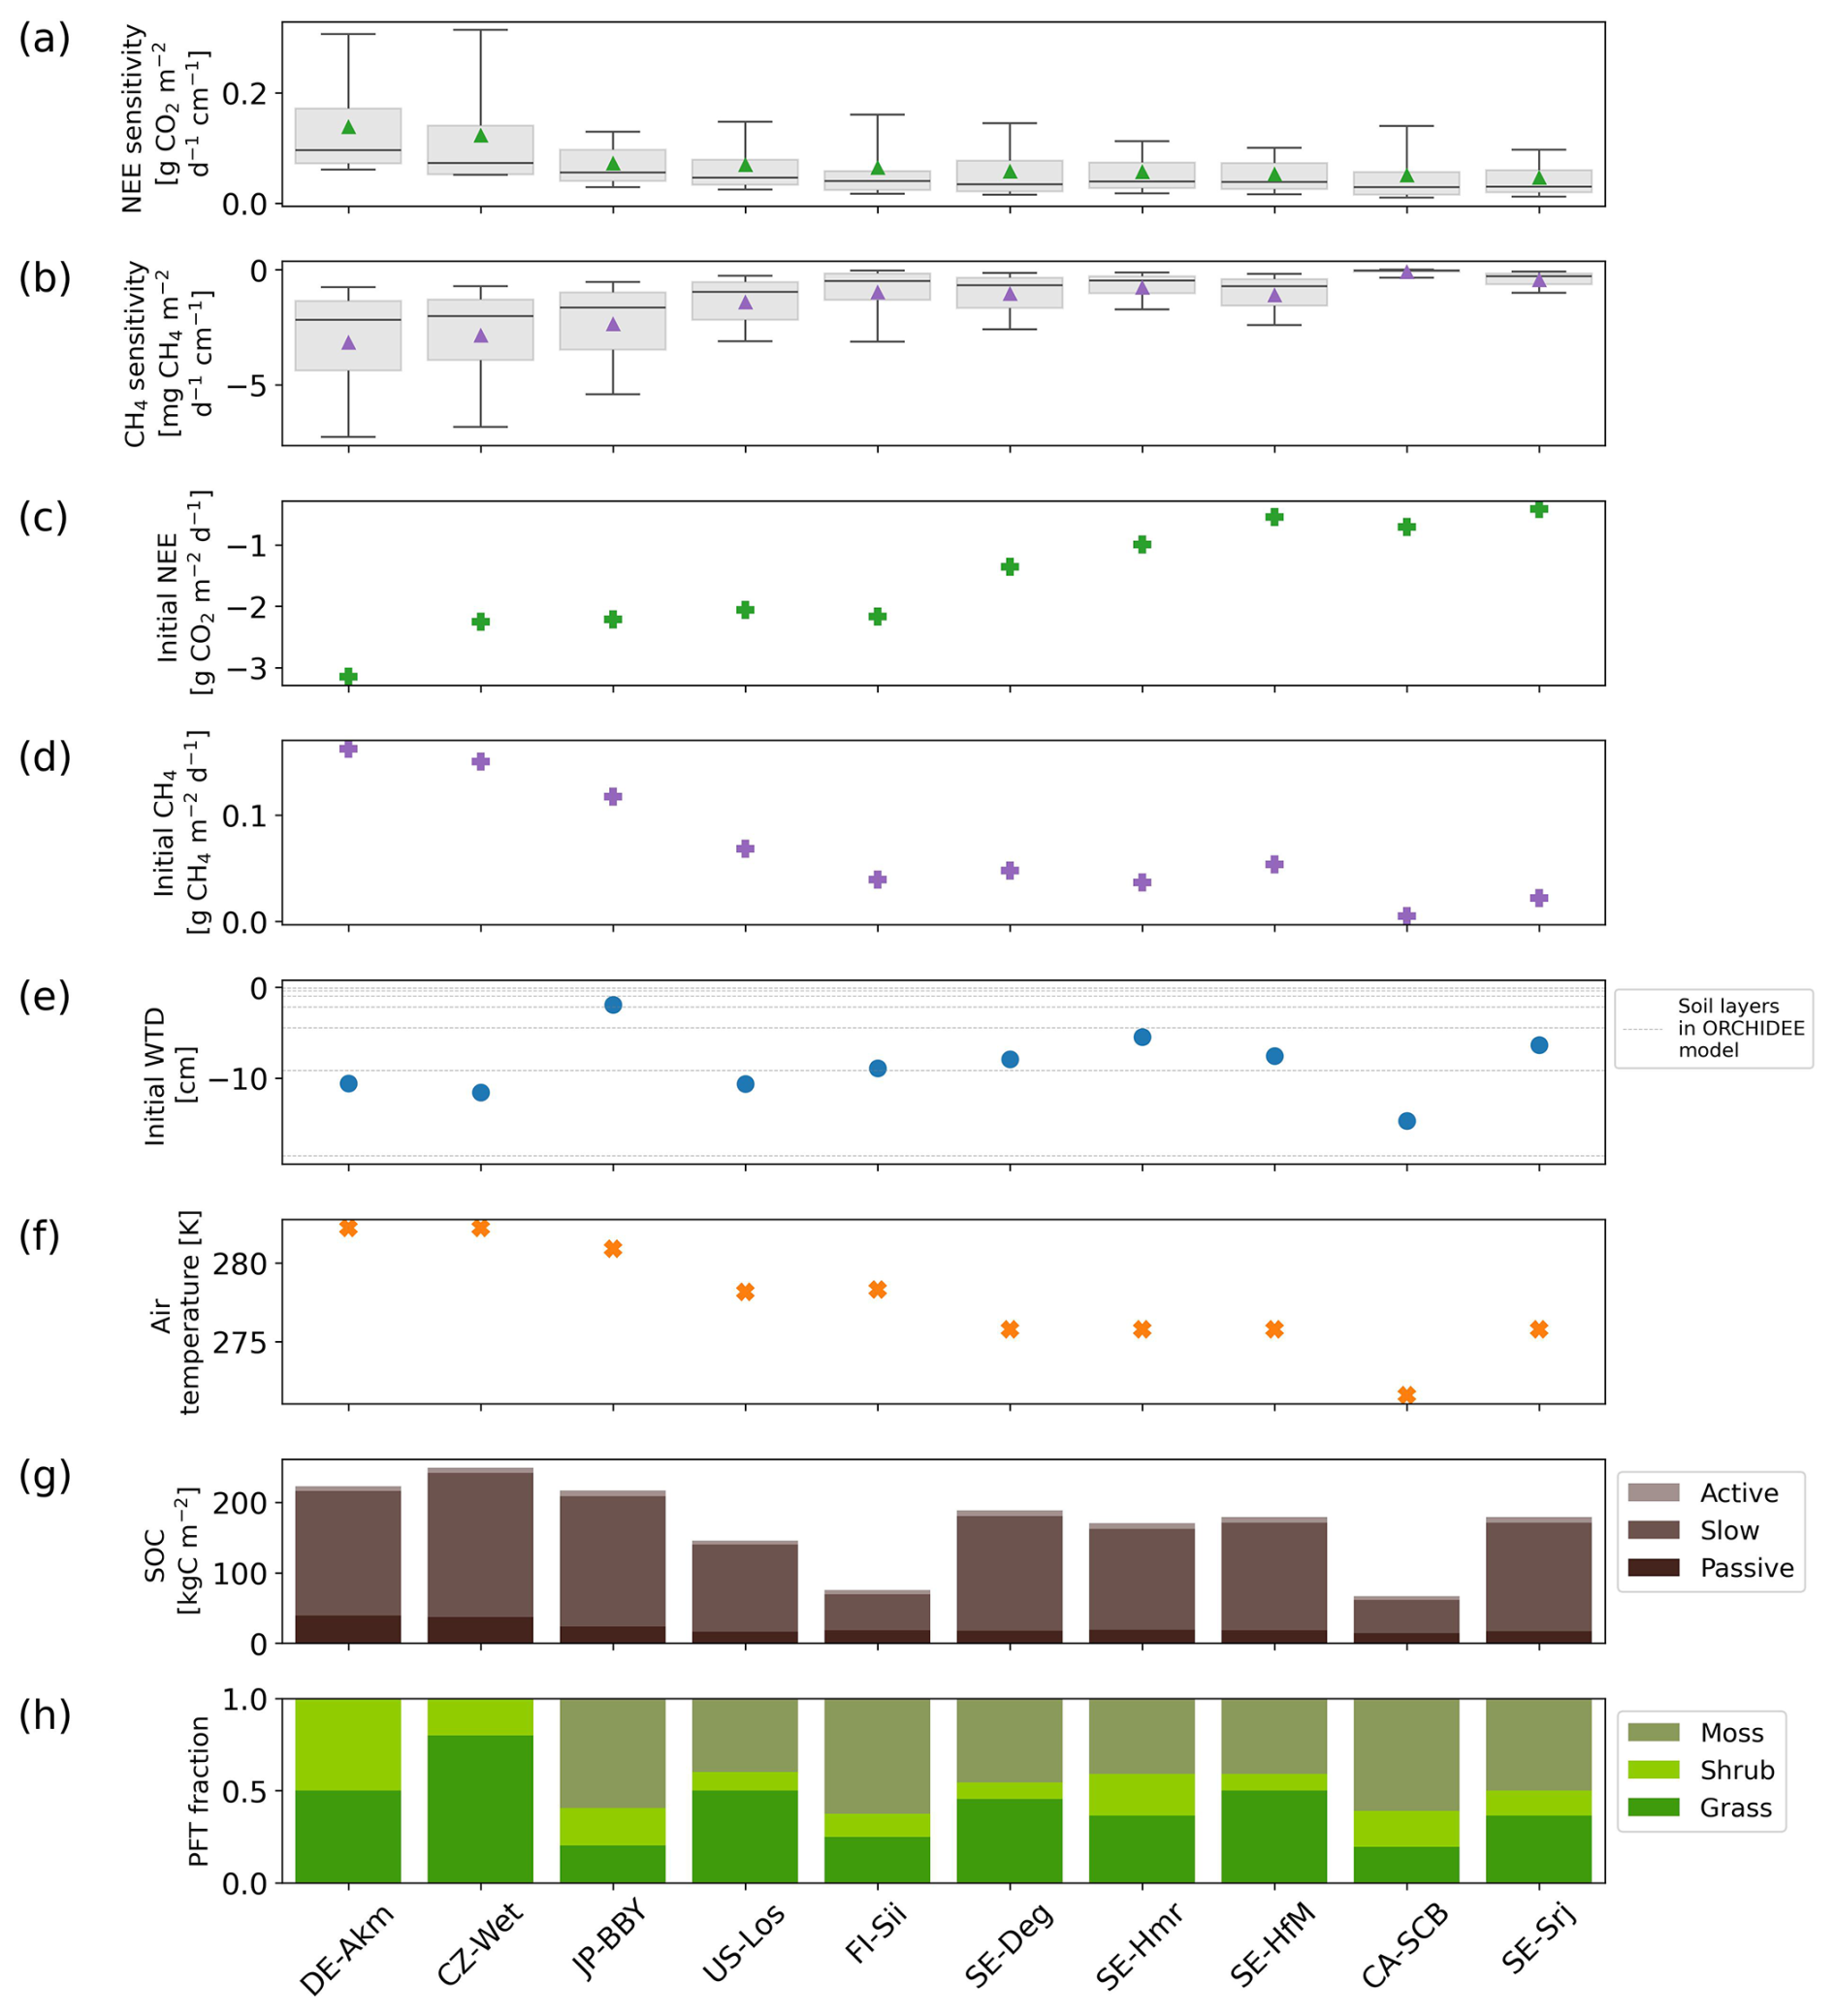
Figure 8Summary of site-level sensitivities and explanatory variables used to analyze the drivers of drainage responses. (a) Sensitivity of NEE to water table drawdown at each site, expressed as the change in flux per centimeter of deeper water table depth (); positive values indicate reduced CO2 uptake or net emissions with deeper WTD, (b) same as (a), but for CH4 emissions (); negative values indicate reduced CH4 emissions with deeper WTD. (c) Initial NEE, (d) initial CH4 emissions prior to drainage Additional modeled variables examined for their role in explaining the sensitivities include (e) initial water table depth prior to drainage (negative values indicate water table below the surface), (f) annual mean air temperature, (g) modeled soil organic carbon density (SOC), calculated as the sum of active, slow, and passive pools over the full soil column, and (h) peatland vegetation composition including peatland graminoids, shrubs, mosses. All statistics are based on modeled results from the first 10 years of drainage simulations, consistent with the temporal window used for sensitivity analysis.
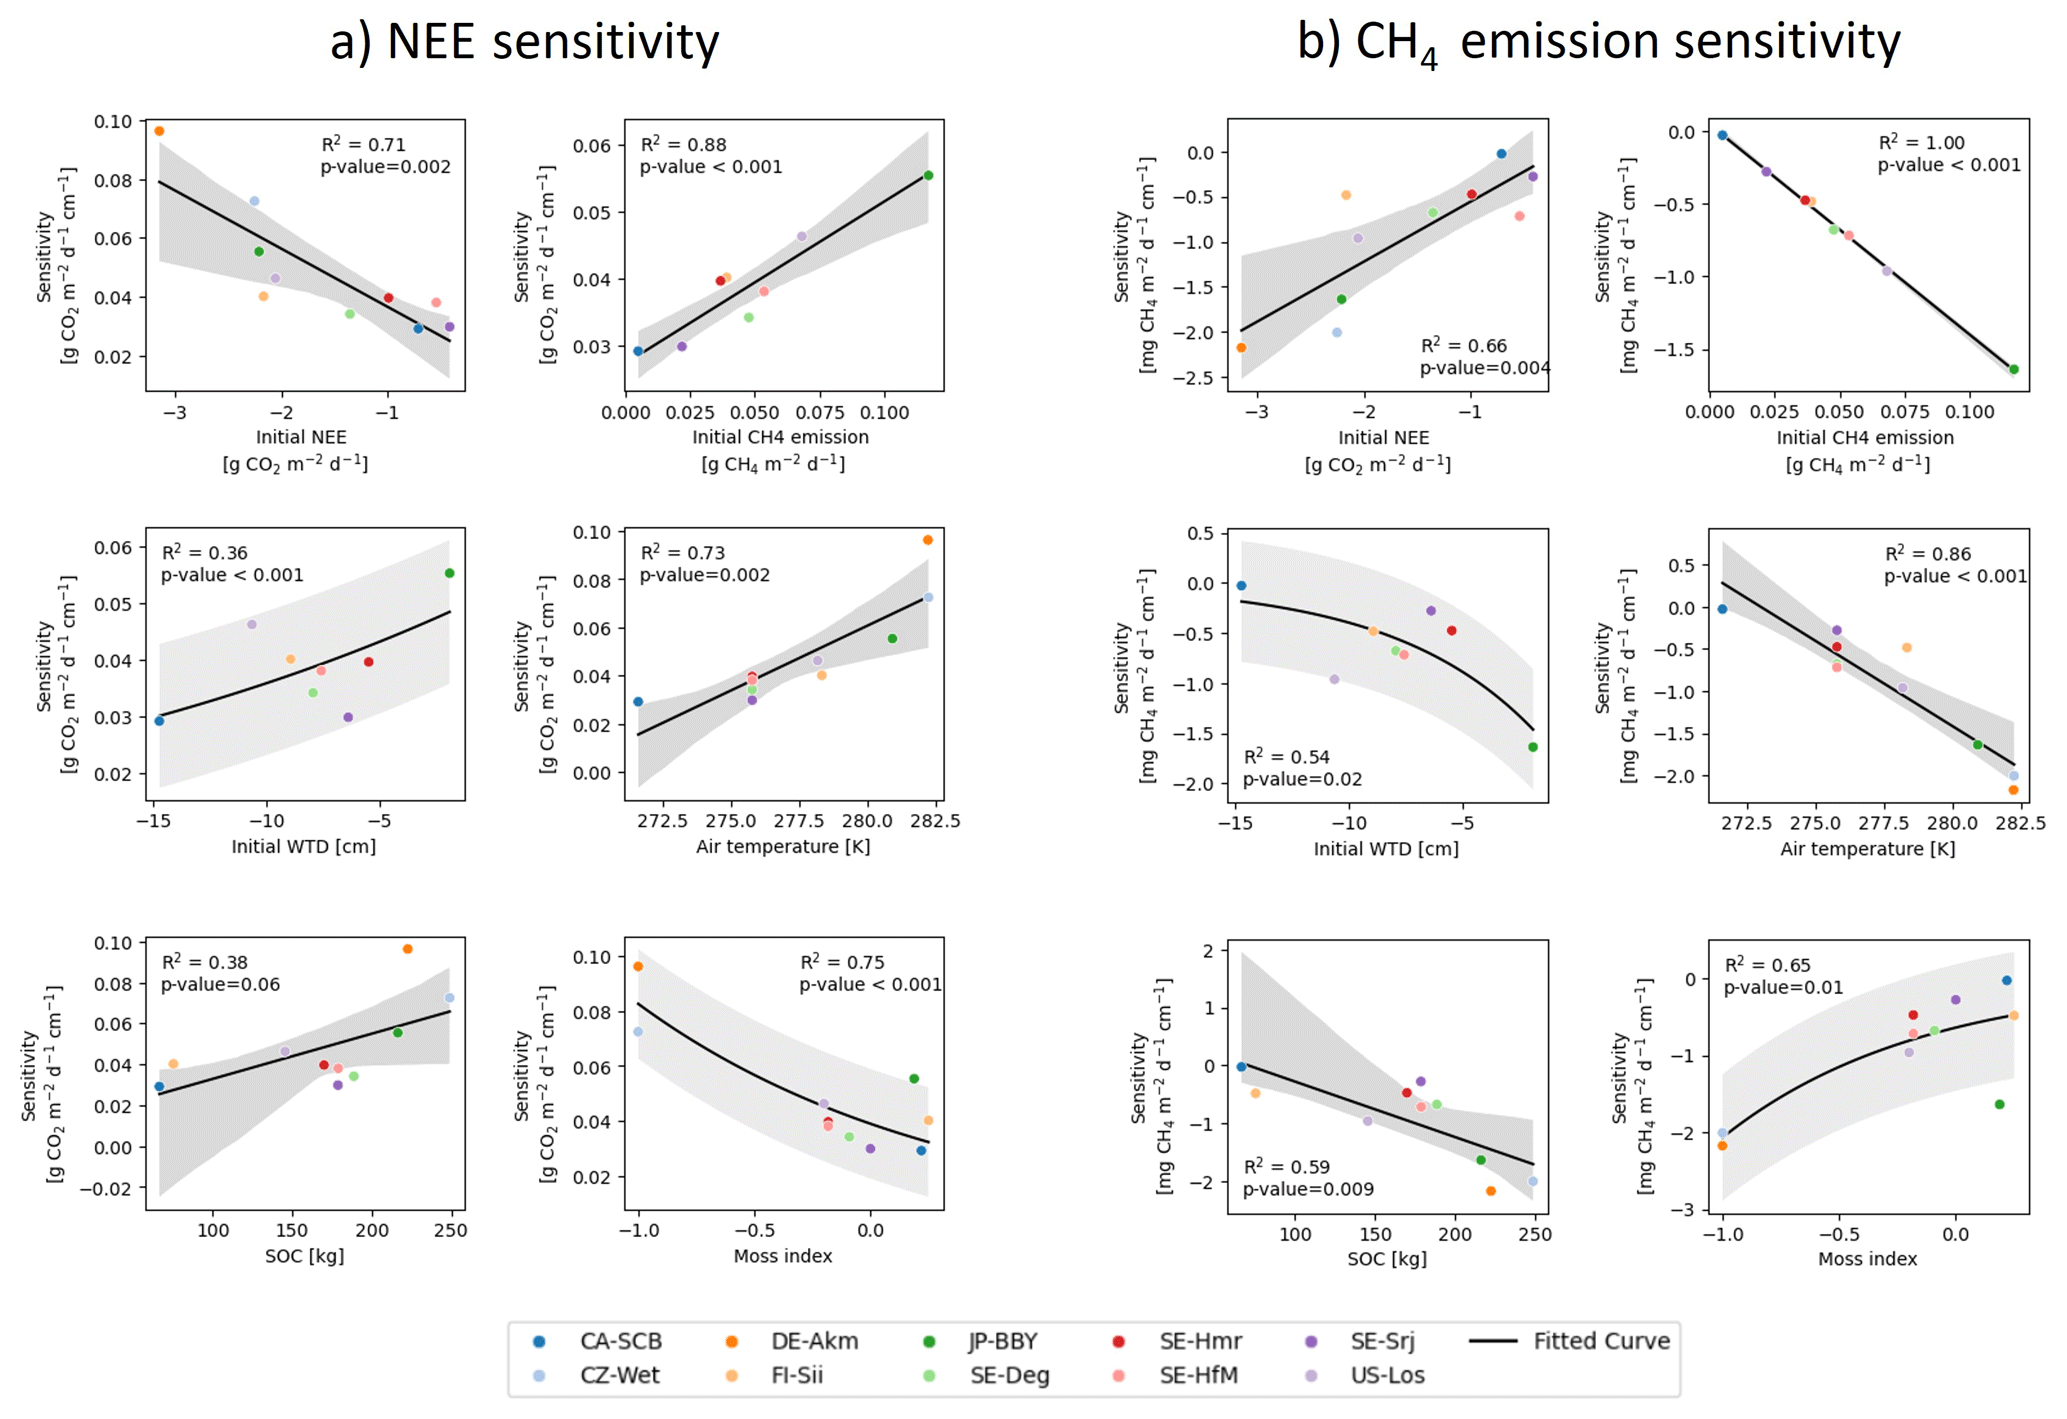
Figure 9Relationships between the sensitivities of (a) net ecosystem exchange (NEE) and (b) CH4 emissions to water table drawdown and selected site-level variables, including initial NEE, initial CH4 emissions, initial water table depth (WTD), air temperature, soil organic carbon content (SOC), and the moss index (MI). Solid lines show fitted regression relationships across sites, and gray shaded areas indicate the 95 % confidence interval of the fitted regression. The moss index represents the relative cover fraction of mosses compared to vascular plants. The analysis is based on modeled results from the first 10 years of drainage simulations.
Firstly, we analyzed whether the sensitivities depend on the magnitude of the initial fluxes, based on the hypothesis that a site with a higher baseline flux before drainage would experience more drastic changes during drainage. Among all sites, DE-Akm and CZ-Wet had the highest sensitivities of NEE (0.14 and 0.12 , respectively, Fig. 8a). These two sites, along with JP-BBY, also exhibited the greatest CH4 emissions sensitivities (−3.17, −2.85, and −2.37 , Fig. 8b). These sites were all characterized by the largest initial CO2 sinks and CH4 emissions before drainage. Conversely, the site with the smallest pre-drainage CH4 emissions, CA-SCB, had the smallest CH4 sensitivities. SE-Srj has the smallest NEE sensitivities with the smallest initial NEE. Overall, we found that the CH4 sensitivities show a very strong linear relationship with initial CH4 emissions (R2=1, p<0.001) across sites. Similarly, the NEE sensitivities are correlated with the initial NEE, but the relationship is weaker (R2=0.71, p=0.002) (Fig. 9, top row).
Secondly, we examined if the vegetation composition of each site affects the sensitivities when the site is drained. To quantify this response, we calculated a moss index (MI) defined by the ratio so that it is equal to −1 in absence of moss and to 1 with full moss cover, and found a negative correlation between MI and NEE sensitivity (R2=0.75, p<0.001), and a positive correlation between MI and CH4 emission sensitivity (R2=0.65, p=0.01) (Fig. 9a and b, last items). We identified two mechanisms in the model that explain this response of sensitivities to the moss fraction. The first mechanism is that a higher moss fraction is associated with less decomposable organic carbon. Among the three types of peatland vegetation, soil organic carbon decomposes the slowest for mosses and the fastest for shrubs, with residence times of 2 years for moss, 1 year for grass/sedges, and 200 d only for shrubs at >30°, for the active soil organic carbon pool of the model. Accordingly, we found that the sites with higher fractions of shrubs and lower fractions of mosses display higher sensitivities of NEE to drainage (Fig. 8). The methane emission sensitivities depend on vegetation cover in a different way. Peatland sites with mosses have shallower effective root depths (1–5 cm), reducing plant-mediated methane transport in the model, and the opposite is true for grasses/sedges and shrubs (root depth ≈30–50 cm). Most of the sites in this study have an initial mean WTD already below 5 cm, i.e. deeper than the depth at which mosses typically facilitate methane transport. When the WTD gets deeper, plant-mediated transport of methane by moss is thus not strongly affected in our model. Sites with more mosses (e.g. CA-SCB) therefore show smaller methane emission sensitivities. The second mechanism is that the moss fraction regulates the initial amount of SOC, which partly explains the differences in sensitivities shown in Fig. 8. Note as well that moss-dominated sites have a higher potential for oxidation of CH4 due to a symbiosis between mosses and methanotrophic bacteria (Larmola et al., 2010), but our methanotrophy module does not simulate this effect. Sites dominated by shrubs and grasses/sedges (DE-Akm, CZ-Wet) accumulate more SOC before drainage. When drainage exposes the upper peat soil layers to oxygen, accelerating soil respiration and limiting methane production, these sites with larger initial SOC pools show a larger increase in CO2 emissions and a larger decrease of CH4 emissions compared to moss-dominated sites (CA-SCB, FI-Sii).
Thirdly, we analyzed how the sensitivities depend on the initial WTD across all the sites. We found that the shallower the initial water table, the higher the sensitivities of NEE and CH4 emissions. This result is qualitatively consistent with the data shown in Fig. 7 where all sites are displayed together, but it additionally indicates that the site to site differences of sensitivities are partly explained by the variability of initial water table values (R2=0.36, p<0.001 for NEE; R2=0.54, p=0.02 for CH4 emissions) (Fig. 9a and b, middle left items). The initial WTD controls which soil layers are affected by drainage, which is in turn related to the amount and lability (active, slow, passive) of SOC exposed to oxygen, thereby influencing the sensitivities.
Finally, air temperature was also found to have a correlation with sensitivities. Sites in warmer climates tend to have more sensitive NEE (R2=0.73, p=0.002) and CH4 emission (R2=0.86, p<0.001) responses (Fig. 9a and b, middle right items). However, it remains uncertain whether these correlations are causal or reflect co-variations between temperature and other factors, given the small number of points in the regressions shown in Fig. 9.
3.7 Building an exploratory emulator of sensitivities for GHG accounting and decision support applications
It is impractical to run a complex, process-calibrated model like ORCHIDEE-PEAT for calculating the sensitivities of GHG fluxes to drainage over a whole region, for instance, to derive spatially variables emission factors that could be used in GHG accounting studies (IPCC Guidelines Tier 3, Eggleston, 2006) and decision support tools or meta-models like (e.g. FAO, 2021). Therefore, following the analysis of the driving factors of the sensitivities in the previous section (Fig. 9), we developed an emulator of the model sensitivities based on multilinear regressions. Given the limited number of sites and the acknowledged limitations of the underlying process-based model, the emulator presented here is intended as an exploratory, proof-of-concept approach rather than a fully validated predictive tool. To do so, we first fitted all possible regressions of the simulated sensitivities (SNEE and ) against the six variables as shown in Fig. 9, including initial NEE (NEEinit), initial CH4 emission (), initial water table (WTDinit in cm), soil organic carbon content (SOC in kg C m−2), air temperature (T in K), and moss index (MI). Then, the best regression model was selected based on the minimum corrected Akaike information criterion (AICc, Appendix C), constrained by the cutoff of variance inflation factor (VIF) >5 to avoid multicollinearity among predictors (Fig. C4):
To evaluate the robustness of the selected model, a leave-one-out cross-validation was performed. The model was re-fitted multiple times, each time excluding one site from the data, and the performance metrics (R2 and p-value) were recorded for the withheld site (Table C1). The small variation in R2 (+SD of R2) and p-value (+SD of p-value) among all re-fitted models suggests that the selected regression relationships are internally consistent across sites, within the limits of the available sample.
Furthermore, we calculated the product of the regression coefficients for each variable in Eq. (3) by their standard deviations between sites to quantify the “effect” of each variable on the sensitivity (Jung et al., 2017). For the sensitivity of NEE, the effect of NEEinit is −0.012, comparable to that of MI, at −0.011.
3.8 Combined effect of CO2 and CH4 changes
To assess the combined climate forcing of CO2 and CH4 flux changes due to drainage, we used the Global Warming Potential (GWP) metric to convert methane emissions into CO2-equivalents (IPCC AR6). Figure 10 shows the resulting CO2-equivalent flux changes averaged across the 10 sites for 20 and 50 year periods of drainage as a function of the WTD drawdown. We used GWP100=27 for the 50 year period and GWP20=79.7 (IPCC, 2023) shown in different colors in Fig. 10. At the site scale, the simulated CO2-equivalent flux changes exhibit substantial uncertainty, as reflected by the error bars in Fig. 10. These uncertainties arise from both parameter uncertainty and uncertainty associated with vegetation cover changes induced by drainage, the latter quantified as the range across alternative vegetation scenarios explored in Appendix D.
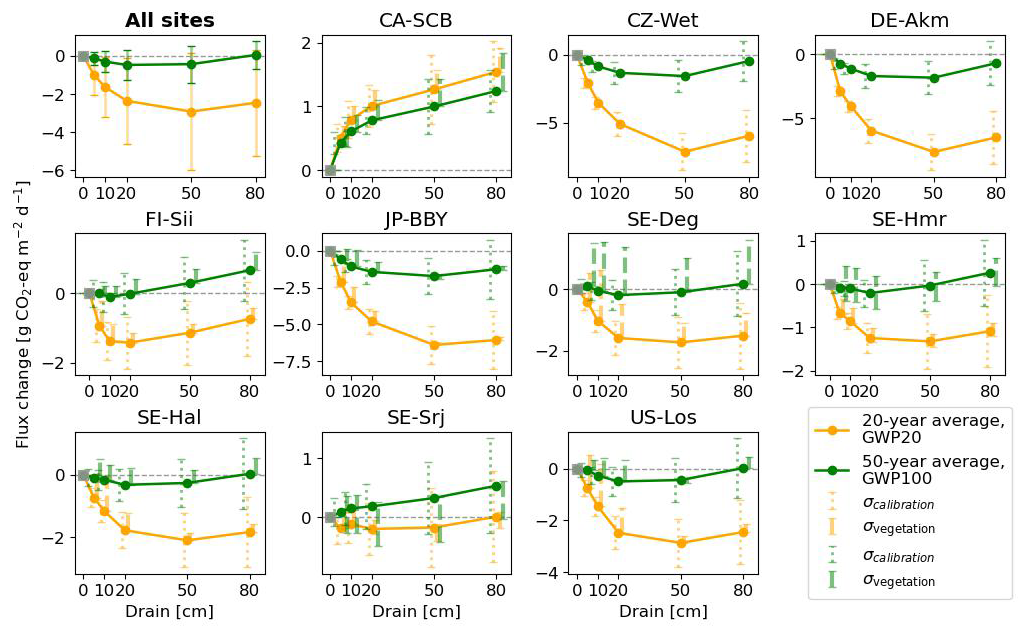
Figure 10Change in fluxes (relative to undrained) expressed as CO2-equivalents by drainage level (x axis), averaged over 20 and 50 years following the start of drainage. CH4 emissions were converted to CO2-equivalents using GWP20 for 20 year average (orange lines) and GWP100 for the 50 year average (green line). In the plot with all sites, the error bars parameter calibration uncertainty (σcalibration), quantified as ±1 standard deviation of the simulated time-mean CO2-equivalent fluxes over the full 50 year simulation period across 10 Monte Carlo runs, and vegetation scenario uncertainty (σvegetation), defined as the minimum–maximum range of simulated responses across alternative vegetation change scenarios (see Appendix D).
Averaging our model results for all 10 sites at 80 cm drainage leads to a slight warming of 0.05 g CO2-eq using GWP100 after 50 years of drainage, and to a cooling of −2.46 g CO2-eq using GWP20 after 20 years. In comparison, from the data collected by meta-analysis studies (Huang et al., 2021b; Zou et al., 2022), retaining only sites where both ΔNEE and ΔCH4 flux are available, we calculated for all sites a mean cooling effect of −5.46 g CO2-eq with a huge spread (95 % CI: −73.06 to 17.64) using GWP20, and a mean cooling of −0.06 g CO2-eq (−25.60 to 11.82) using GWP100, with the occurrence of cooling and warming effects being almost equal among all the sites (Fig. C5). This result is rather consistent with our model simulations. In contrast, pooling all sites and WTD levels together, thus combining ΔCO2 and ΔCH4 from different locations in an inconsistent manner, from the data of Zou et al. (2022) excluding their reported N2O emissions changes, a net cooling effect of −0.30 g CO2-eq using GWP100 was estimated. Similarly, using a GWP100 value of 25, Huang et al. (2021b) estimated across their sites a net warming effect of 0.033 g CO2-eq (0.009 to 0.057). This suggests that the averaging of sites from meta-analysis data can lead to assessing either a cooling or a warming, depending on whether only sites with both measured ΔCO2 and ΔCH4 are used, or all sites are used.
Our model simulations also show that different drainage periods and the choice of a different GWP time horizons lead to distinct warming or cooling effects (Fig. 10). For 9 sites out of 10 (i.e. except CA-SCB), however, we simulated a larger cooling on a 20 year horizon compared to a 100 year horizon, due to the stronger radiative forcing impact of reduced CH4 emissions in the short term. In addition, most of the sites show a larger radiative forcing change when the WTD is deeper, specifically a higher cooling from reduced CH4 emissions on a 20 year horizon. Secondly, the magnitude and the sign of changes, whether warming or cooling, varies significantly between sites. CA-SCB is the only site having warming effects (from 0.4 to 1.5 g CO2-eq ) regardless of time scales and drainage levels. On the other hand, CZ-Wet, DE-Akm, JP-BBY always have cooling effects (down to −6.5 g CO2-eq ) because their CH4 emissions are reduced more than their CO2 emissions are increased. Other sites have both warming and cooling effects depending on time scale considered and drainage level. Neutral effects on climate were observed in some cases, primarily when considering 50 years of drainage (green line), such as FI-Sii with a 20 cm drainage and US-Los at a 80 cm drainage level.
Uncertainty in our simulations involves several factors, typically coming from model calibration, our WTD reconstruction, and the omission of vegetation change during drainage and possible changes of soil structure including compaction. Our model represents an advance compared to the state of the art but remains limited in its ability to mechanistically represent drained peatland systems, particularly regarding extrapolation and representation of dynamic soil and hydrological processes. Some of the limitations are discussed below and raise caution in interpreting model outputs as representative of real-world conditions.
Firstly, two sites could not be calibrated with CH4 emission but only with NEE, due to a lack of CH4 measurements. A good simulation of methane processes is expected to improve CO2 emissions because the oxidation of methane in soil produces CO2 which contributes to the total NEE (CO2 from methanotrophy constitutes 8.21 % (95 % CI: 0.57 %–29.81 %) of heterotrophic respiration). For sites without CH4 calibration, CH4 parameters were currently taken from the average of calibrated parameters of other sites. Another solution that could be tried is to do multi-site calibration of CH4 and NEE for the sites with both observations where they are available, i.e. optimize a single set of parameters that best compromises between all sites, then take the resulting CH4 parameters for the sites that are not CH4-calibrated. Anyway, uncertainties still remain, as climate and environmental conditions vary between sites. Liu et al. (2025) showed that even multi-site calibration sometimes cannot significantly improve the performance of the model due to the inability of the model to consider all trait-climate correlations, with constant parameters used for traits instead.
Secondly, although we believe that our method to reconstruct WTD from soil moisture using a machine learning (ML) module is an interesting and viable solution for now, the training of a ML model to derive a function from few sites which is then applied to other sites where WTD is missing could be problematic if extrapolation is required out of the training range. We assumed that all peatland sites in this study share the same relationship between soil moisture and water table. However, peatlands in different locations can have different peat soil characteristics, along with varying environmental, terrain, and water supply conditions, so the assumption can inevitably be wrong in some places. One thing we can expect in the future is that when we have more water table data everywhere, this indirect reconstruction of WTD can work better.
Thirdly, changes in vegetation cover on peat soil caused by drainage have not been considered in this study due to the complexity of processes and lack of long term data. With water table drawdown and subsequent physical and chemical alterations, peat soils can become more favorable for certain plants (e.g., vascular plants) and less favorable for others (e.g., some Sphagnum mosses), potentially resulting in a shift in vegetation composition (Antala et al., 2022; Kokkonen et al., 2022). Peatland specialist species adapted to waterlogged conditions may even disappear after water table drawdown (Jassey et al., 2018), while woody species can invade newly available growing spaces (Kokkonen et al., 2019). Additionally, species turnover also depends on the type of peatland (e.g. bog/fen), particularly on hydrological and nutrient conditions prior to drainage (Kokkonen et al., 2022). Changes in plant composition should be incorporated into drainage simulations, as each PFT has unique photosynthetic capacity, respiration rates, and contributes litter of varying quality for decomposition, all of which would impact the carbon balance and CH4 emission. While it's straightforward to introduce in a model a new vegetation composition, simulating the dynamic changes in vegetation – such as determining the factors controlling moss disappearance and adjusting PFT fractions accordingly – remains challenging. Similarly, the model parameters, which were calibrated based on undisturbed fluxes, remained unchanged during the simulation of drainage scenarios, even though soil hydrological parameters such as water holding capacity and water conductivity are known to be affected by compaction during drainage. In order to address this limitation, to explore the potential impact of vegetation shifts, we conducted a sensitivity test with alternative peatland PFT compositions (Appendix D). The results show that vegetation shifts can indeed influence the net effect of drainage on GHG emissions: in some cases, it amplified the warming effect, while in others, it reversed a cooling effect into a net warming, or vice versa.
In the ditch drainage simulation, we assumed an ideal condition in which the drained peatland is effectively isolated from adjoining land and suppressed the runoff from other soil tiles to the peat soil tile. This is not always what happens in reality, there can still be runoff entering the peatland from adjoining land. However, this suppression helps to make the peat soil effectively dried in the model. With the limitation in representing the drainage complexity, the ditch drains water from the peat soil tile only, and not from other soil tiles. The runoff from other soil tiles to the peat soil tile that is suppressed in the model can be interpreted as accounting for the horizontal water flow from these tiles that should have also been drained by the ditch. We also assumed a uniform water table drawdown across the whole peatland and over the course of 50 years. However, in reality, the water table near the ditch can differ significantly from microscale effects, or to some extent, from the water table farther away from it. This depends on the hydraulic conductivity of peat materials, which varies with the degree of peat decomposition (Boelter, 1972). Also, a peatland over time may often recover back to the same water table depth after drainage, because subsidence and oxidation will bring the surface down close to the previous water table level (Hilbert et al., 2000; Waddington et al., 2015). Considering distance to ditch and subsidence effects would help move towards a more realistic simulation.
In the analysis of emission factors (EF), we explained their variation by a few processes related to litter and SOC. There are also other factors that can affect the change of EF by time (whether increasing or decreasing) but were not simulated or considered in the analysis. For example, peat bulk density and porosity can alter due to drainage. Investigating their behaviors could provide better insights into EF variations. A key limitation is that in the current ORCHIDEE model, certain soil characteristics (e.g. peat bulk density and porosity) are treated as constant. In field experiments, it was found that highly decomposed peat due to drainage can be more vulnerable to further breakdown by microbial decomposition (Säurich et al., 2019), which is influenced by both peat properties and nutrient status. Yet, our current model does not explicitly track the progressive degradation of individual SOC components or incorporate nutrient feedbacks to diagnose their corresponding reactivity. Decomposition could be calculated based only on fixed residence times for three carbon pools, which is a parameter calibrated under pre-drained conditions. Simulating peat properties and their feedbacks as dynamic variables would require further model development, for instance, adjusting over time the turnover times of carbon pools to simulate more realistic decomposition conditions.
We also need in future studies to take into account the emission of CH4 that is dissolved in water drained out, produced in-situ in the ditch, and diffused at the vertical cross-section surface of the ditch. According to Roulet and Moore (1995), a drainage ditch is a direct source of methane because (1) evacuated water transports CH4 from the surrounding peat into the ditch, and (2) CH4 production is favorable in the ditch where sediment is constantly saturated and warmed by direct solar radiation. Recent studies based on meta-analysis report an offset of drainage ditch to the methane reduction due to drainage, which is 18 % by Peacock et al. (2021), 12 (10–14) % by Gan et al. (2024). Roulet and Moore (1995) suggested that flow rate, depth, and morphology of the ditch can have an impact on its CH4 emission, and ditch spacing also plays a role in net CH4 emission of the landscape.
Finally, in our simulation protocol, the present climate conditions are recirculated over the whole time of future simulation in so-called idealized scenarios, but it is interesting for future studies to use climate conditions predicted for the future using climate change scenarios, for instance, with the Inter-Sectoral Impact Model Intercomparison Project (ISIMIP) database (Lange and Büchner, 2021). Using future climate forcing is simple, but then we will also need a corresponding forecast of climate induced future WTD changes for the baseline scenario, and here again our machine-learning model to compute undisturbed WTD from modeled soil moisture may not work for unseen future soil moisture conditions.
Despite these limitations, an independent comparison with field observations from a long-term drainage experiment conducted at a site near FI-Sii shows that the model reproduces the observed increase in ecosystem respiration and reduction in CH4 emissions under drained conditions reasonably well (Appendix E; Fig. E1). This comparison provides additional support that, within the limits discussed above, the model is able to capture key aspects of drainage-induced greenhouse gas flux responses under real-world conditions.
Overall, building on the results and limitations discussed above, this study demonstrates that implementing a peatland drainage module within a land surface model is feasible and yields physically consistent responses of CO2 and CH4 fluxes to water table drawdown across contrasting sites. At the same time, the results highlight key structural and process-level challenges that remain to be addressed, including dynamic vegetation shifts, evolving peat physical properties, lateral water and carbon fluxes, and improved representation of long-term post-drainage processes. Addressing these challenges represents a clear priority for future model development before such a framework can be applied for robust large-scale predictive assessments.
In this study, we addressed the difficult problem of estimating changes of CO2 and CH4 fluxes when peatlands are drained in the future. Insofar, most of the knowledge comes from empirical results that showed a general increase of CO2 emissions and a decrease of CH4 emissions during drainage. Yet, meta-analysis data group fluxes from different experiments, where CO2 and CH4 fluxes are not always measured simultaneously, and include different control conditions, thus showing a large spread of their results. We used a process model calibrated to match fluxes under pristine conditions before drainage from 10 sites individually and parameterized virtual drainage at each site with a new ditch module. The model was integrated forward for virtual drainage simulations at each site under the present climate with different prescribed water table depths. A summary of the answers to the research questions posed in the introduction is given below.
- 1.
What are the changes of CO2 and CH4 fluxes in response to drainage and how do they compare with observations? We found an increase of CO2 emissions or a decrease of CO2 sinks and a decrease of CH4 emissions from drainage, with a magnitude very similar to the observations in flux data collected by Evans et al. (2021) and within the range of meta-analysis results, although meta-analysis results have a huge variability. On average, we predict for the first decade of 50 cm drainage a reduction of the CO2 sink of 3.14 (0.23 to 10.97) and a decrease of CH4 emissions of −0.06 (−0.21 to 0.001).
- 2.
How do fluxes change as a function of drainage duration? We found that a longer drainage period leads to a diminishment of the increase of CO2 emissions, and to a strengthening of the CH4 emission reduction over time with longer drainage. The first result for CO2 is consistent with previous emission factors simulated for peat drained to croplands agriculture (Qiu et al., 2021). Such a model as presented here, if validated against real-world observations, can help provide time-dependent emission factors that may be useful for inventory calculations in the absence of long-term CH4 emission factor changes from measurements. It should be emphasized that model evaluation against observations is currently limited to the first decade following drainage, and that simulated changes over longer drainage durations represent model-based extrapolations that should be interpreted as exploratory scenarios rather than validated predictions.
- 3.
What is the modeled sensitivity of flux changes to water table depth? We found that the shallower the starting water table, the more positive the sensitivity of CO2 flux changes to WTD (more warming) and the greater is the sensitivity of CH4 reductions (more cooling from suppressed CH4 emissions).
- 4.
What factors affect the sensitivity at each site in the model? We found that, in the model world, the initial fluxes, initial water table depth, soil organic carbon, moss fraction and temperature are the key influential factors controlling the sensitivities across sites. These variables have strong covariations in the model, so their effect cannot be isolated individually. The emulator is constructed from sensitivities of modeled GHG fluxes to water table depth derived from the first 10 years following drainage, corresponding to the period over which the model has been evaluated against observations. This finding allowed us to propose an emulator of the modeled sensitivities that could be used to predict flux changes at other sites or over a region. Yet, this is only a model result and testing it against observations would be important in the future to use such an emulator approach for GHG accounting.
- 5.
What is the net climate effect of CO2 and CH4 flux changes induced by drainage using the GWP metrics to compare CH4 with CO2. Here we found that, averaged over all WTD depths, drainage during 20 years with radiative forcing calculated with GWP20 is projected by our model to induce a net cooling because the reduction of CH4 emissions dominates over changes of CO2 fluxes. Drainage during 50 years with GWP100 induces almost a net neutral effect. There is a large variability between sites even for the sign of the climate effect of drainage. This gives a more nuanced perspective than the current paradigm that drainage always warms the climate. Importantly, uncertainty in future vegetation, as illustrated by the sensitivity analysis in Appendix D, is not a minor sensitivity: different plausible vegetation scenarios can qualitatively change the assessed climate impact of drainage, including reversing the sign of the net climate effect, and therefore directly affect the interpretation of these results. However, our prediction of a net cooling using GWP20 differs from most previous meta-analysis results and should be interpreted with caution, because it relies on model-based projections extending well beyond the 20 year time horizon associated with the use of GWP20. This result seems at first glance opposite to meta-analysis results, even though our model simulations for flux changes were found to be consistent with these data. The data do not have very long drainage experiments, which may explain the differences with our predictions. However, when taking only sites from meta-analysis studies where both CO2 and CH4 fluxes changes were measured, a net cooling is found, consistent with our model-based projections.
Finally, although our study explicitly quantified uncertainties arising from parameter calibration and alternative vegetation trajectories, there remain “known unknown” uncertainties associated with potential future parameter shifts and unresolved model structural limitations. These include changes in organic matter decomposition induced by reduced phenolic compounds during dry conditions (as phenols normally inhibit microbial activity and therefore prevent the breakdown of organic matter) (Fenner and Freeman, 2011), shifts in the molecular composition and stability of soil organic carbon from microbe-, plant- and re-derived sources in response to drainage-induced soil warming and future elevated CO2 (Ofiti et al., 2023), and the suppression of dissolved organic carbon export during drainage (Rosset et al., 2022).
Future work should consider additional CH4 emissions from ditch water and shifts of vegetation composition during drainage. Furthermore, our results show that vegetation shifts represent a major source of systematic uncertainty in our predictions, and that different plausible future vegetation trajectories can reverse the sign of the simulated climate effects, thereby directly affecting the interpretation of our conclusions on net climate impacts. This model framework can be applied for regional historical simulations to improve on previous studies where drainage was not explicitly modeled but represented as an abrupt land cover change from peat to cropland, and where CH4 effects were ignored. It can also be applied to future rewetting scenarios of degraded peat to assess the net climate effect of this nature based solution.
Table A1The 12 peatland sites used in this study for virtual drainage simulations. Their locations were mapped in Fig. A1. A star (*) beside a site ID indicates flux and WTD observations sourced from the FLUXNET-CH4 database; otherwise, these observations are from the Wet Horizons project. The vegetation composition (graminoids, shrubs, and mosses) is taken from the literature when available; otherwise, it is estimated visually from satellite images.
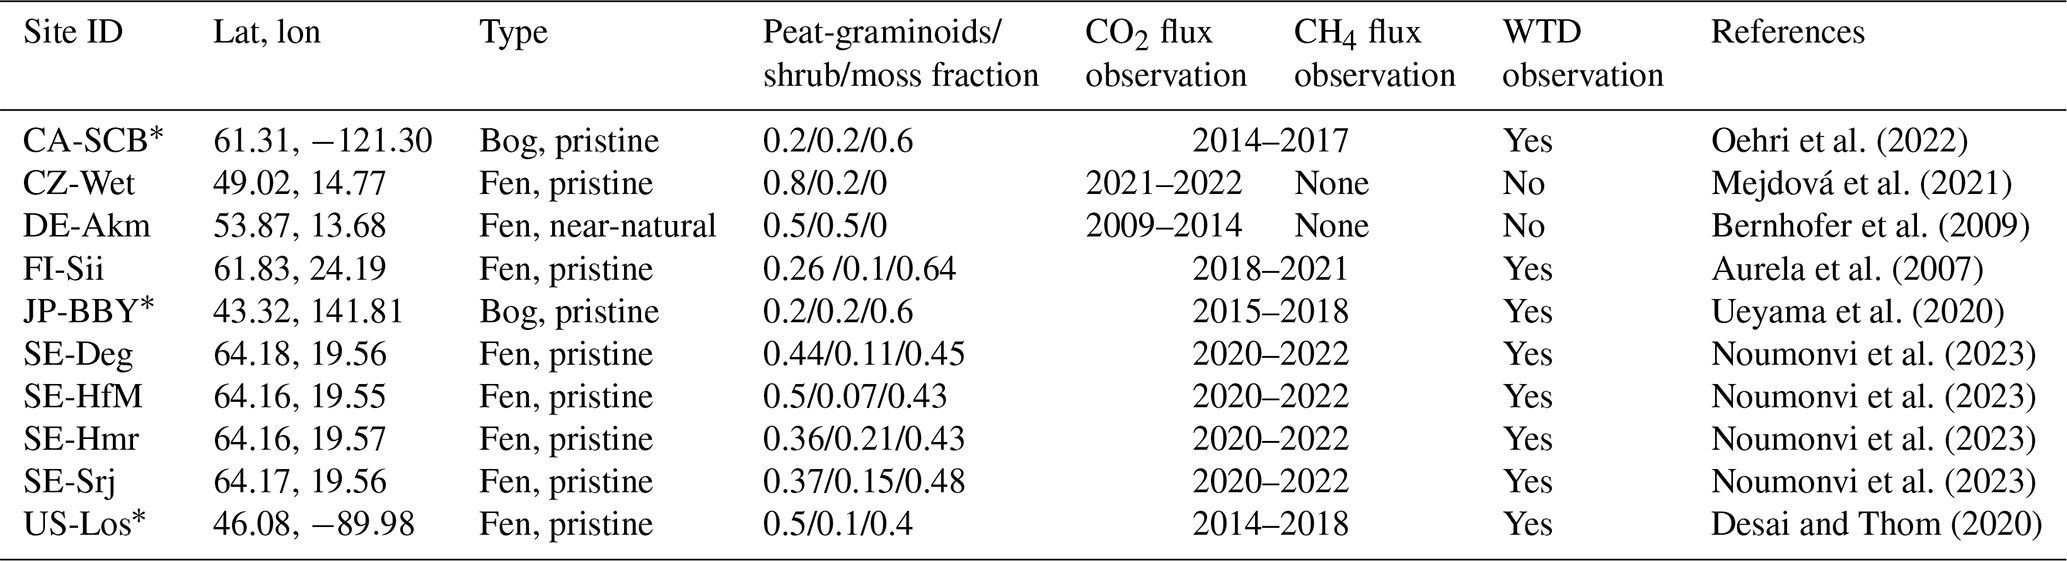
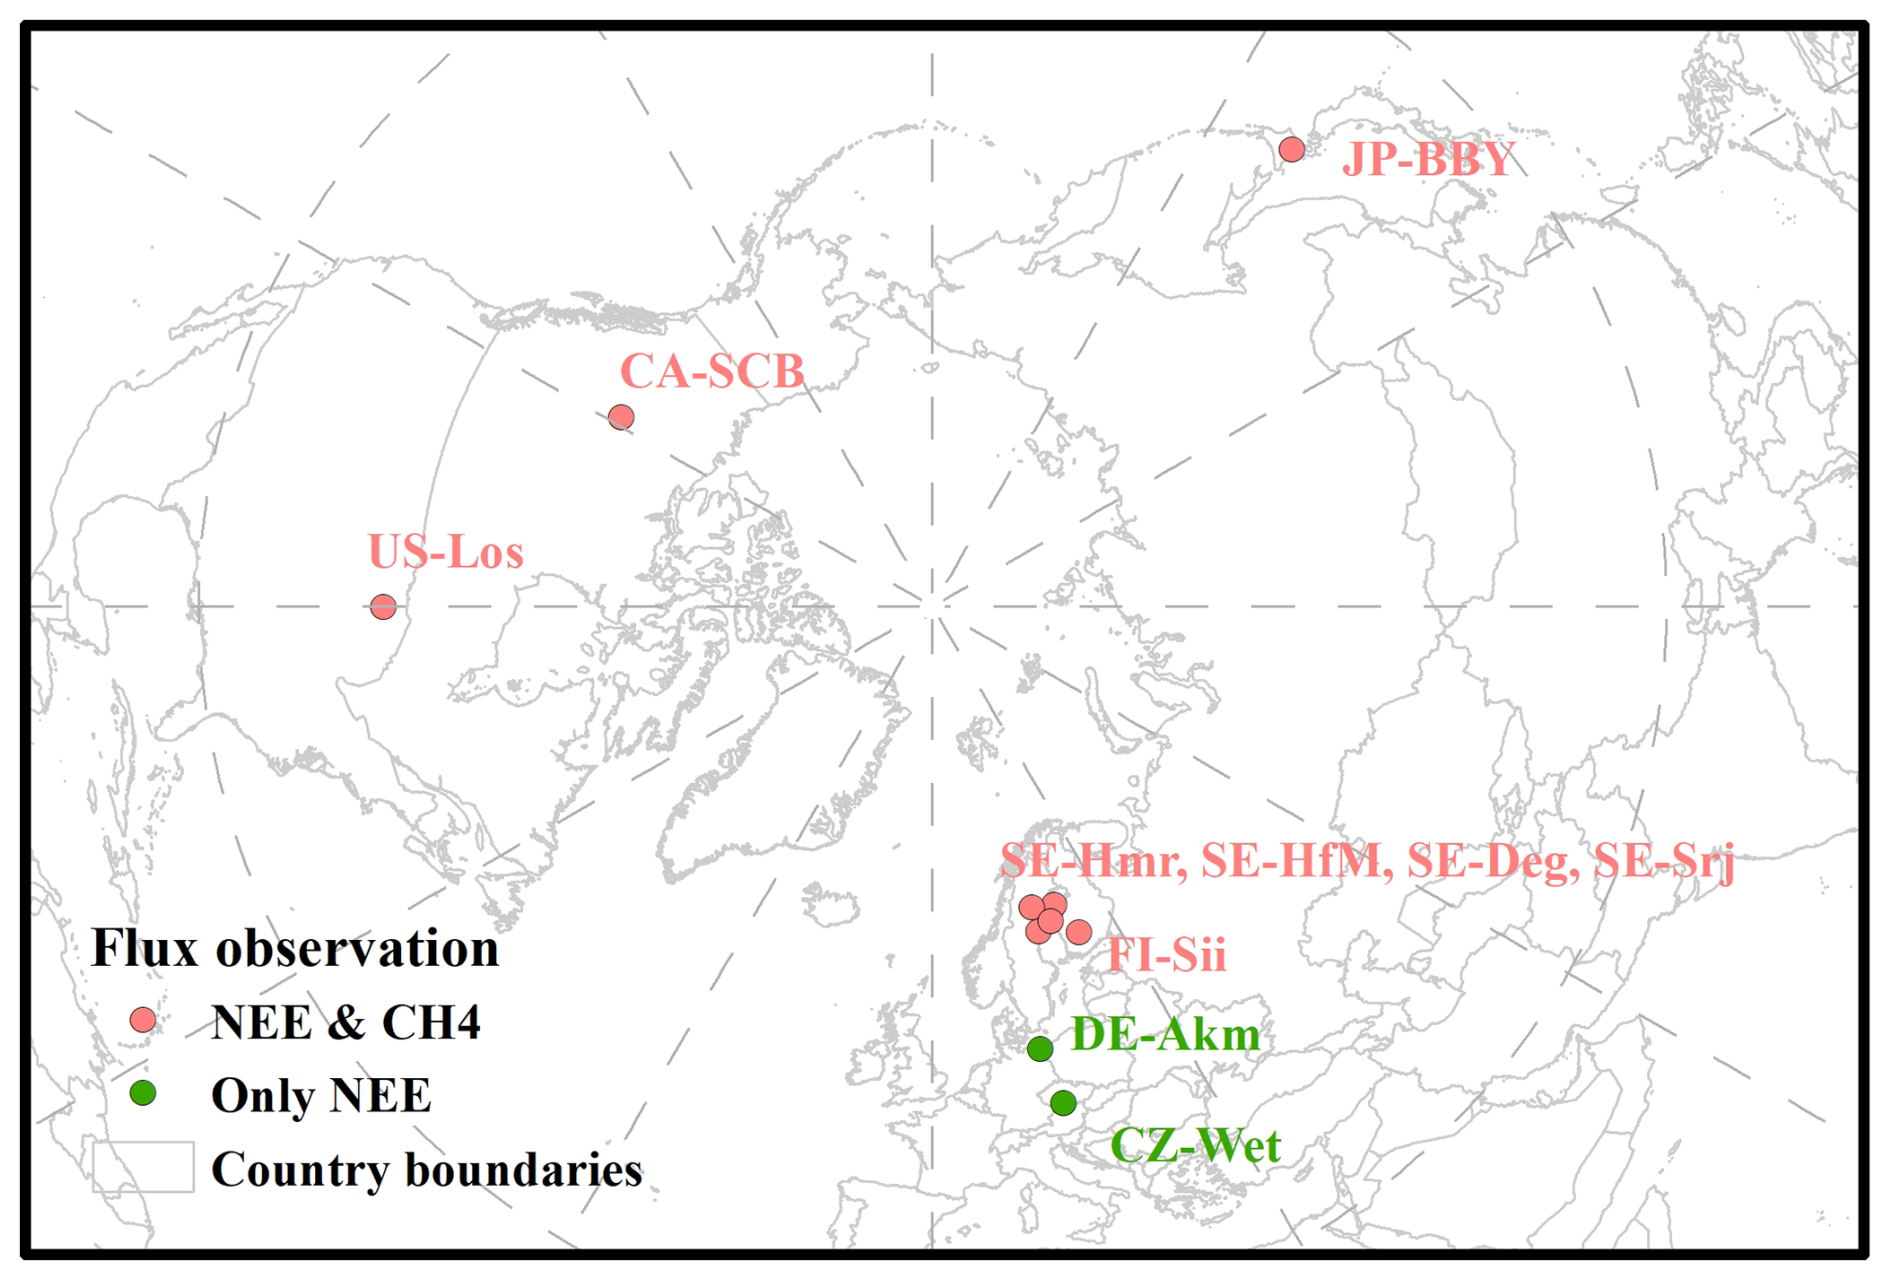
Figure A1Location of peatland sites. Figure contains public sector information licensed under the Open Government Licence v3.0.
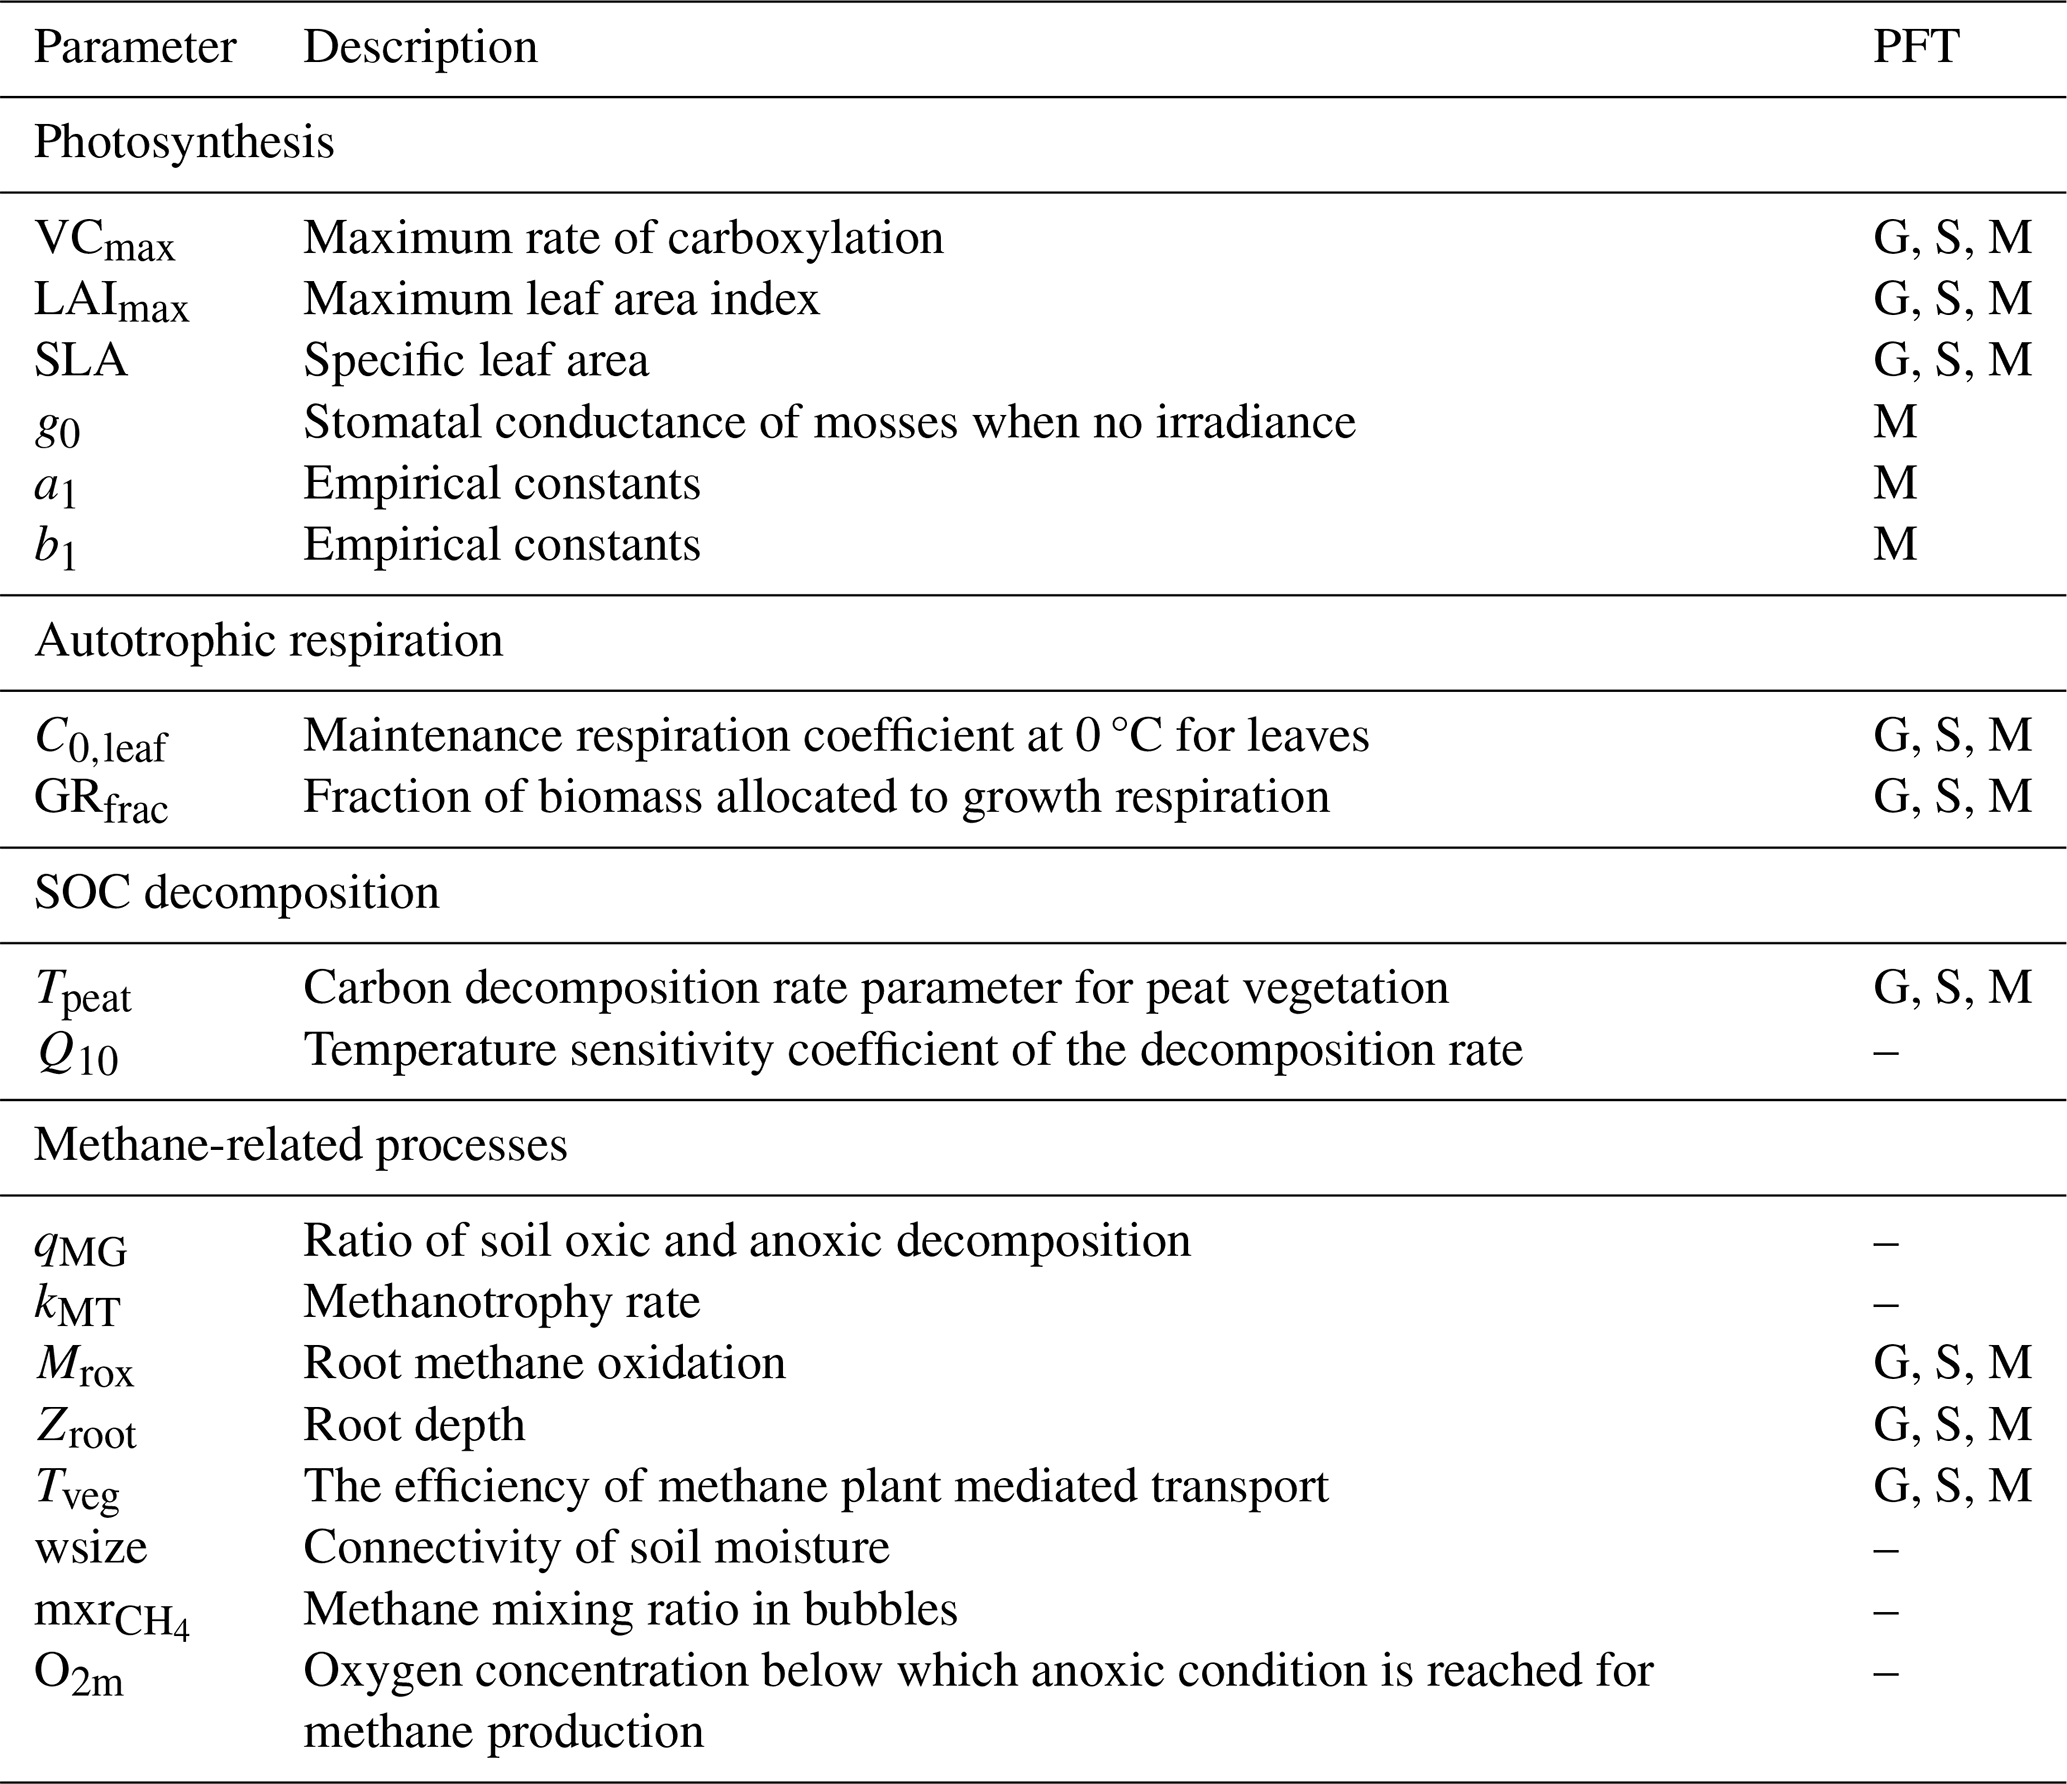
Table B1Parameters for model calibration. The PFT column uses G, S, and M to denote graminoids, shrubs, and mosses, respectively, and “–” for parameters that are independent of PFTs. For further details, refer to Liu et al. (2025) for parameters related to photosynthesis, autotrophic respiration, and SOC decomposition, and to Salmon et al. (2022) for methane-related processes.
The AIC (Akaike, 1974) is a statistical metric used to evaluate the relative quality of different models for a given dataset by estimating the trade-off between the goodness of fit and model complexity, with lower AIC values indicating a better trade-off. For each model, AIC is calculated by:
where K is the number of estimated parameters in the model and L is the maximum value of the likelihood function for the model, reflecting how well the model fits the data.
The corrected Akaike information criterion (AICc) adjusts the standard AIC to account for small sample sizes (e.g. 10 samples in Sect. 3.7 of this study), ensuring better reliability of model comparisons when the sample size (n) is relatively low compared to the number of model parameters (K). The formula for AICc is:
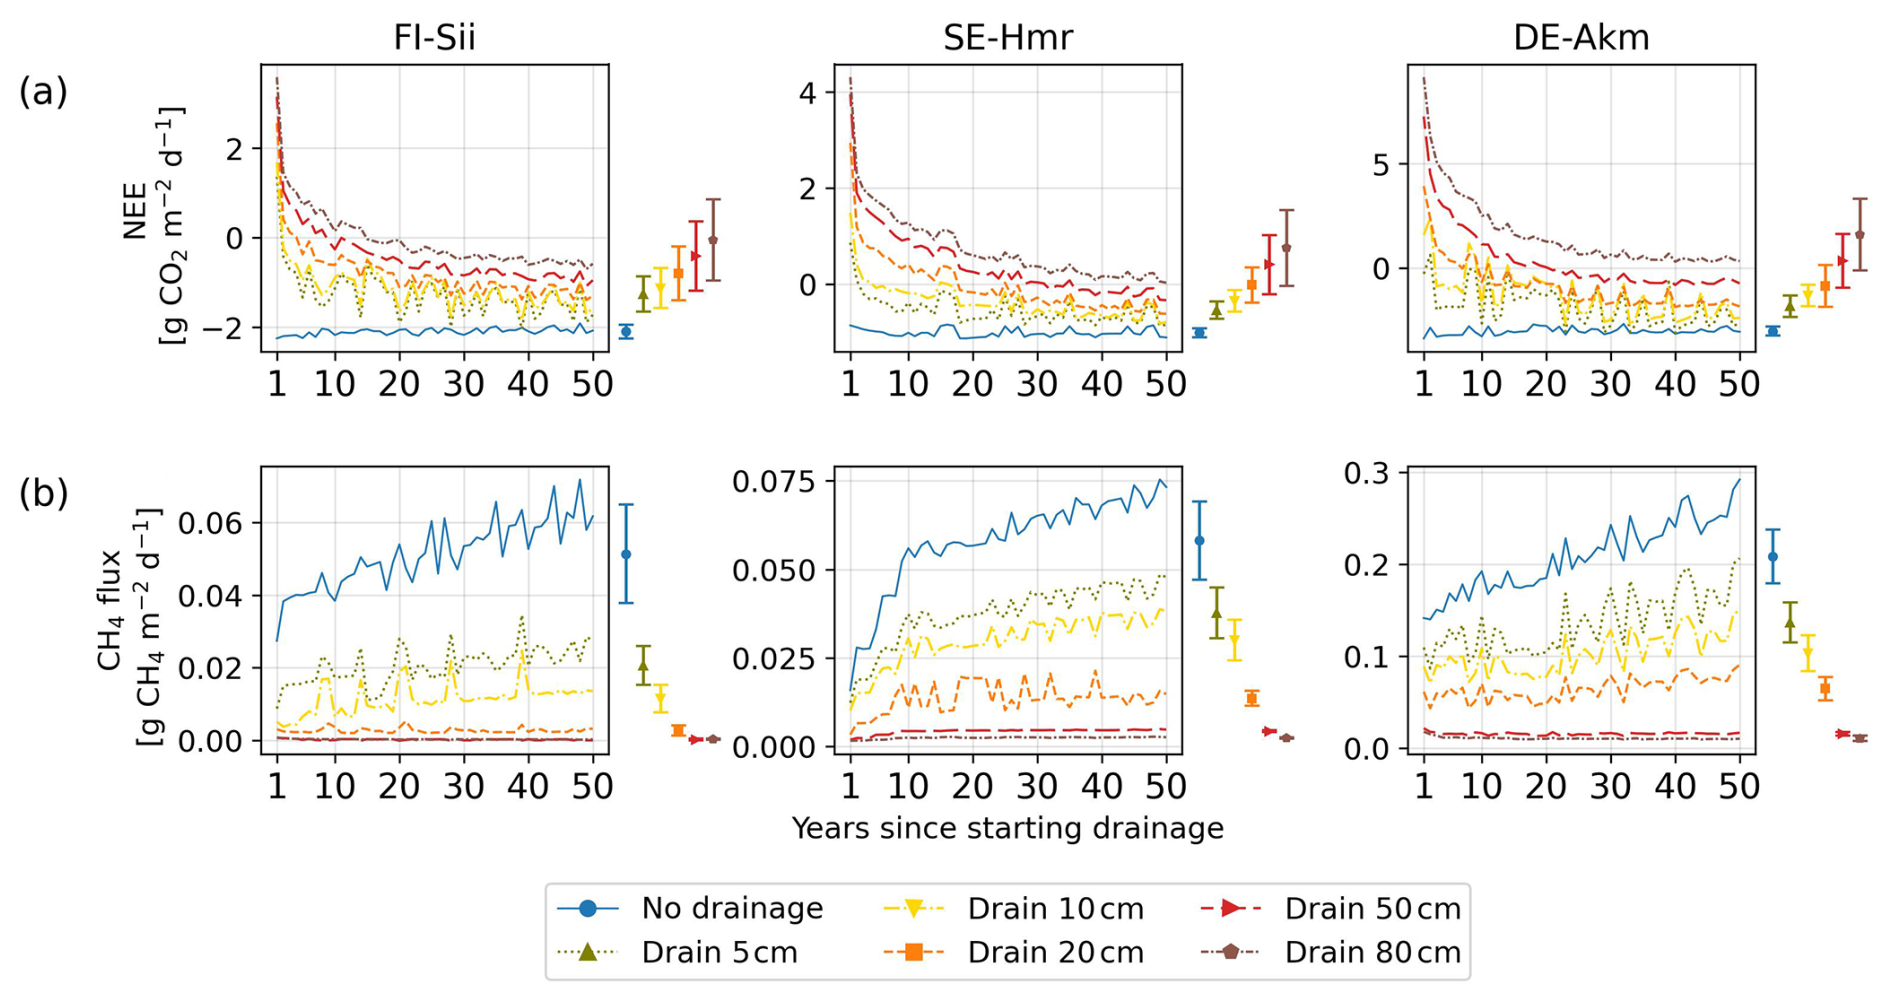
Figure C1Simulated time series of (a) net ecosystem exchange (NEE) of CO2 and (b) CH4 emissions over the 50 year simulation period at the same three sites as in Fig. 4. Different colors and line styles indicate different water table depths below the original water level at each site. The colored bar shown to the right of each panel summarizes uncertainty arising from parameter uncertainty, expressed as ±1 standard deviation of the simulated time-mean flux over the 50 year simulation period. The colored dots indicate the corresponding time-mean flux simulated using the calibrated parameter set. Note that when a flux (e.g. CH4) is close to zero, the corresponding parameter-induced uncertainty also approaches zero.
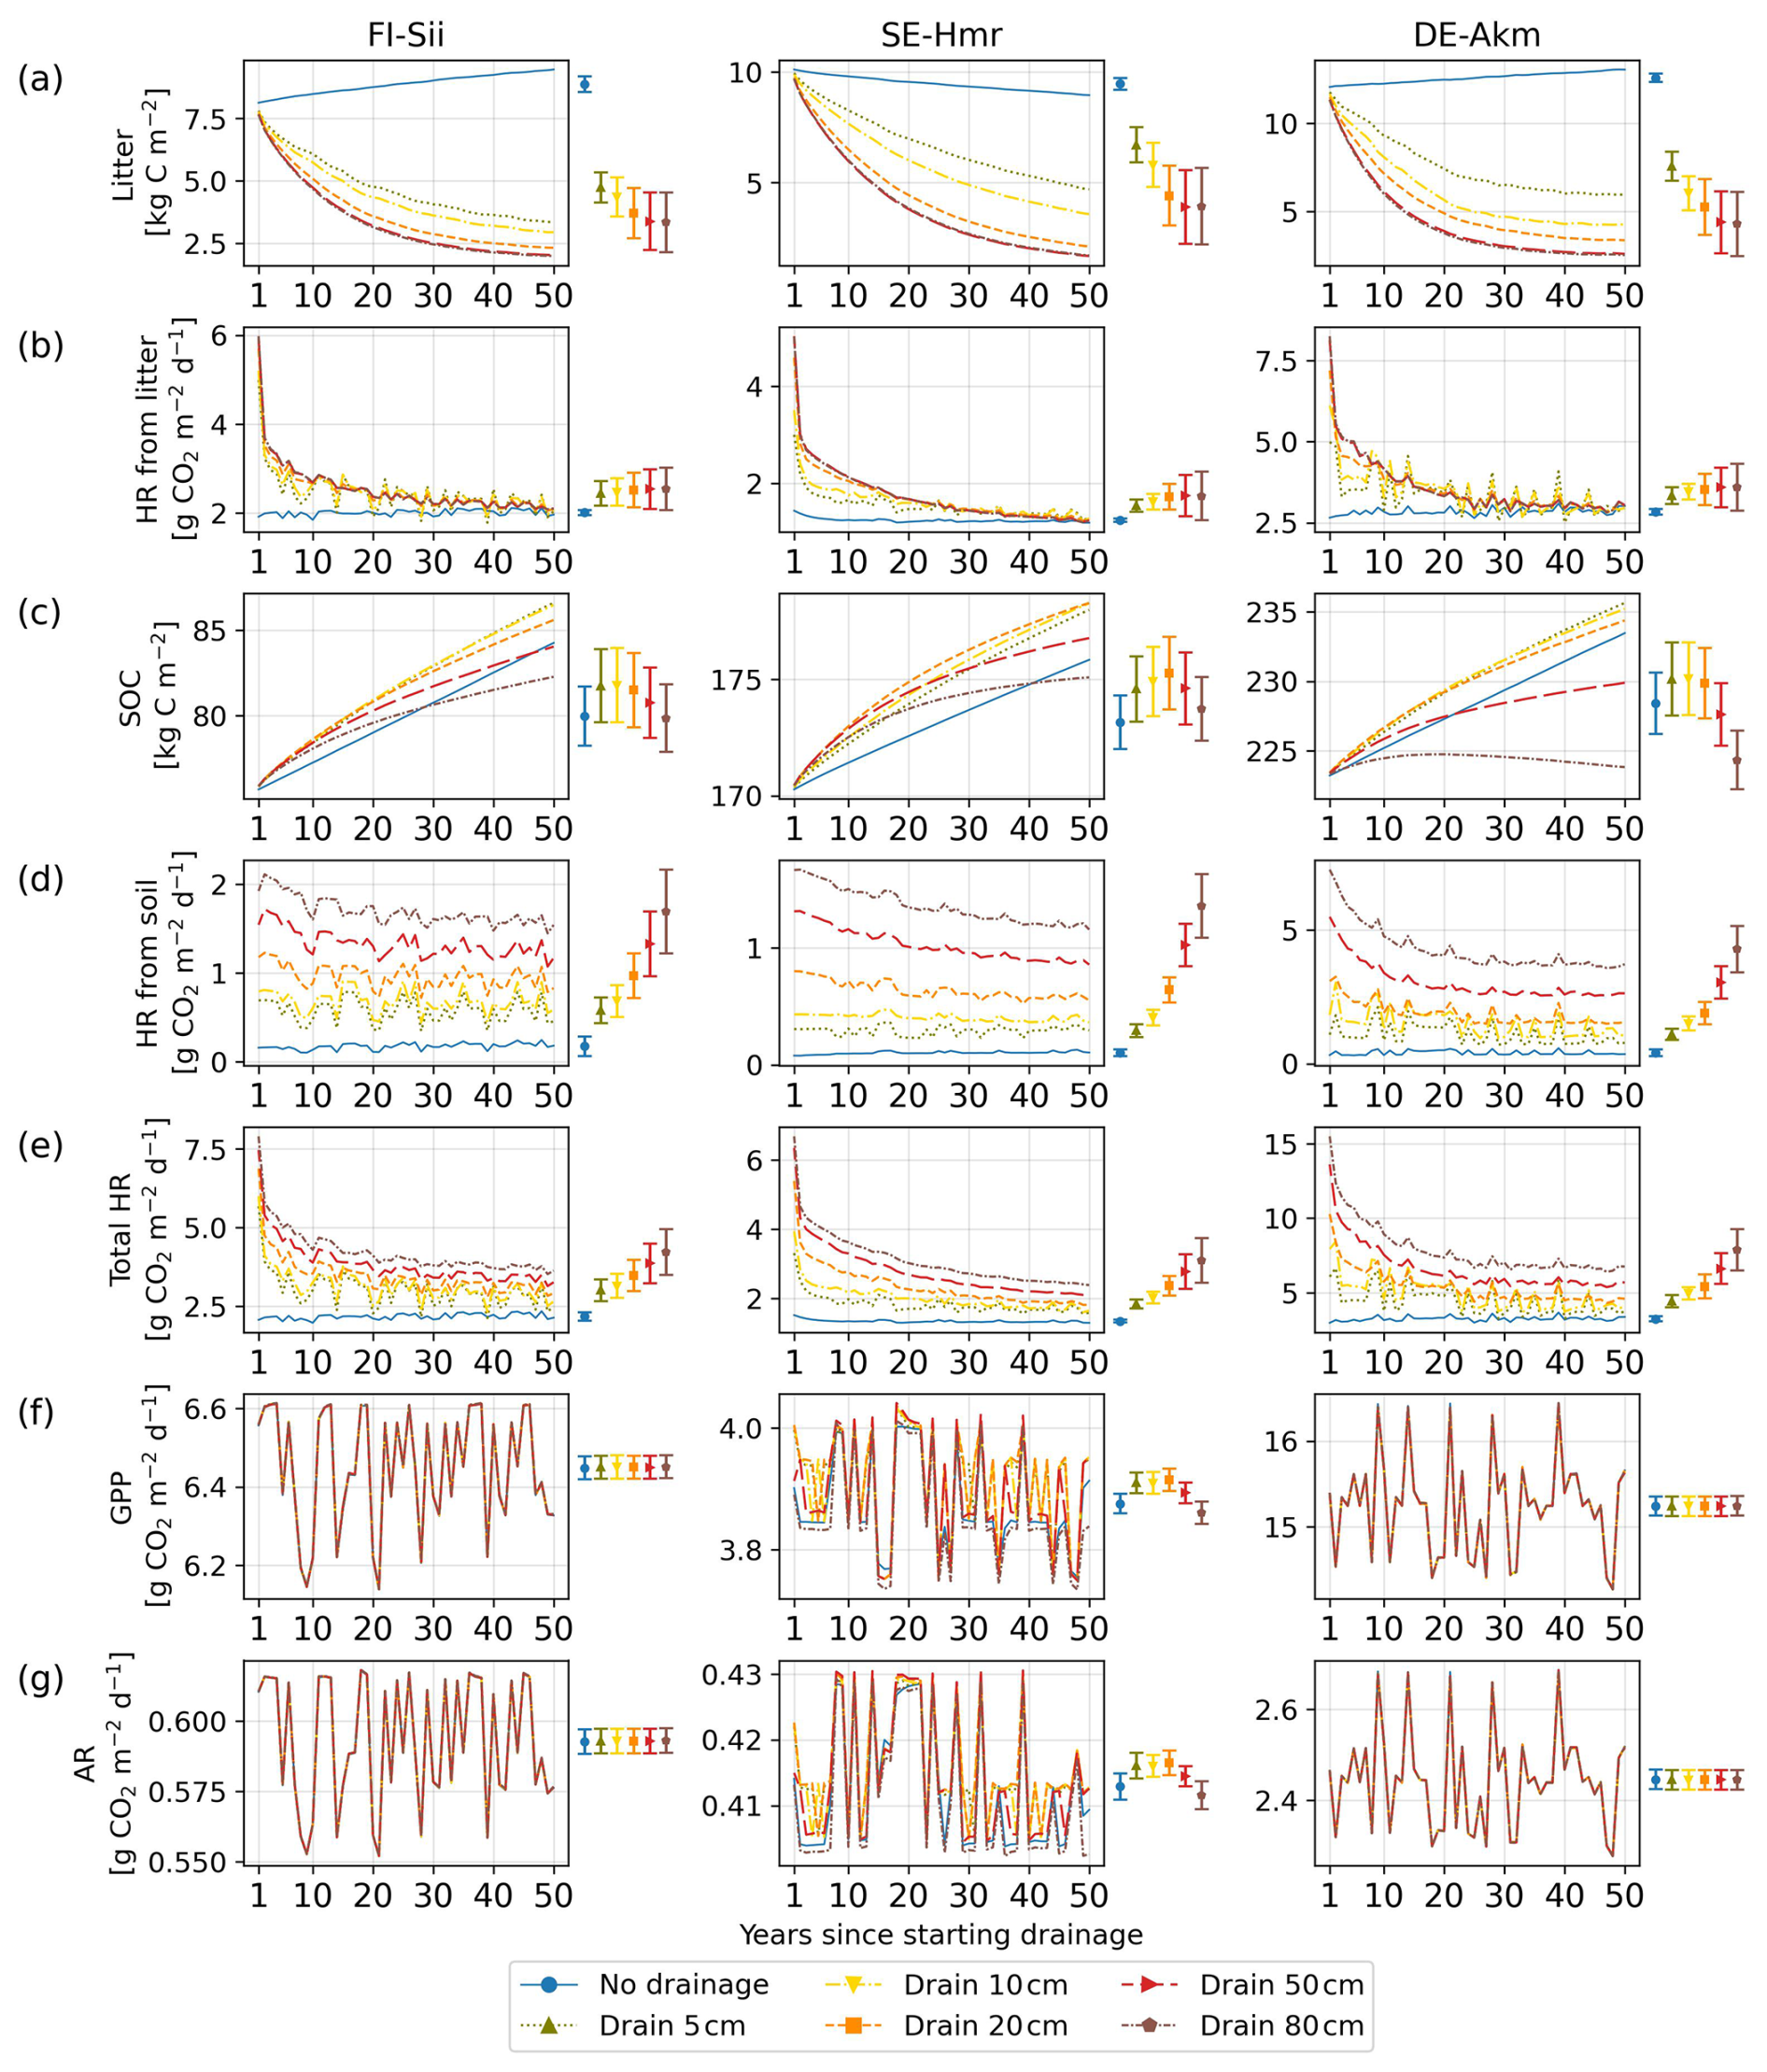
Figure C2Simulated changes in litter carbon and soil organic carbon (SOC) pools and associated heterotrophic respiration over the 50 year simulation period following the onset of drainage. Shown are (a) litter carbon, (b) heterotrophic respiration (HR) from litter, (c) soil organic carbon, (d) heterotrophic respiration from soil, (e) total heterotrophic respiration (sum of litter and soil components), (f) gross primary production (GPP), and (g) autotrophic respiration (AR) at three sites. Different colors and line styles indicate different water table depths below the original water level at each site. The coloured bars on the right of each panel summarize parameter uncertainty, quantified as ±1 standard deviation of the simulated time-mean fluxes computed over the full 50 year simulation from 10 Monte Carlo runs. The colored dots indicate the corresponding time-mean flux simulated using the calibrated parameter set. Note that when a flux (e.g. HR) is close to zero, the corresponding parameter-induced uncertainty also approaches zero.
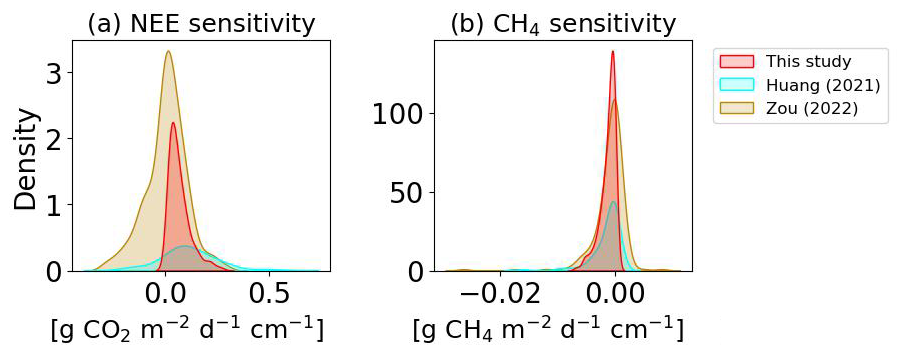
Figure C3Distribution of sensitivities of (a) net ecosystem exchange (NEE) and (b) CH4 emissions to water table drawdown across peatland sites. Results from this study are compared with reference datasets from Huang et al. (2021) and Zou et al. (2022). Sensitivities are expressed as changes in flux per centimeter of water table drawdown (). Modeled results are based on drainage simulations over the first 10 years, consistent with the temporal window used for sensitivity analysis in Figs. 7–9.
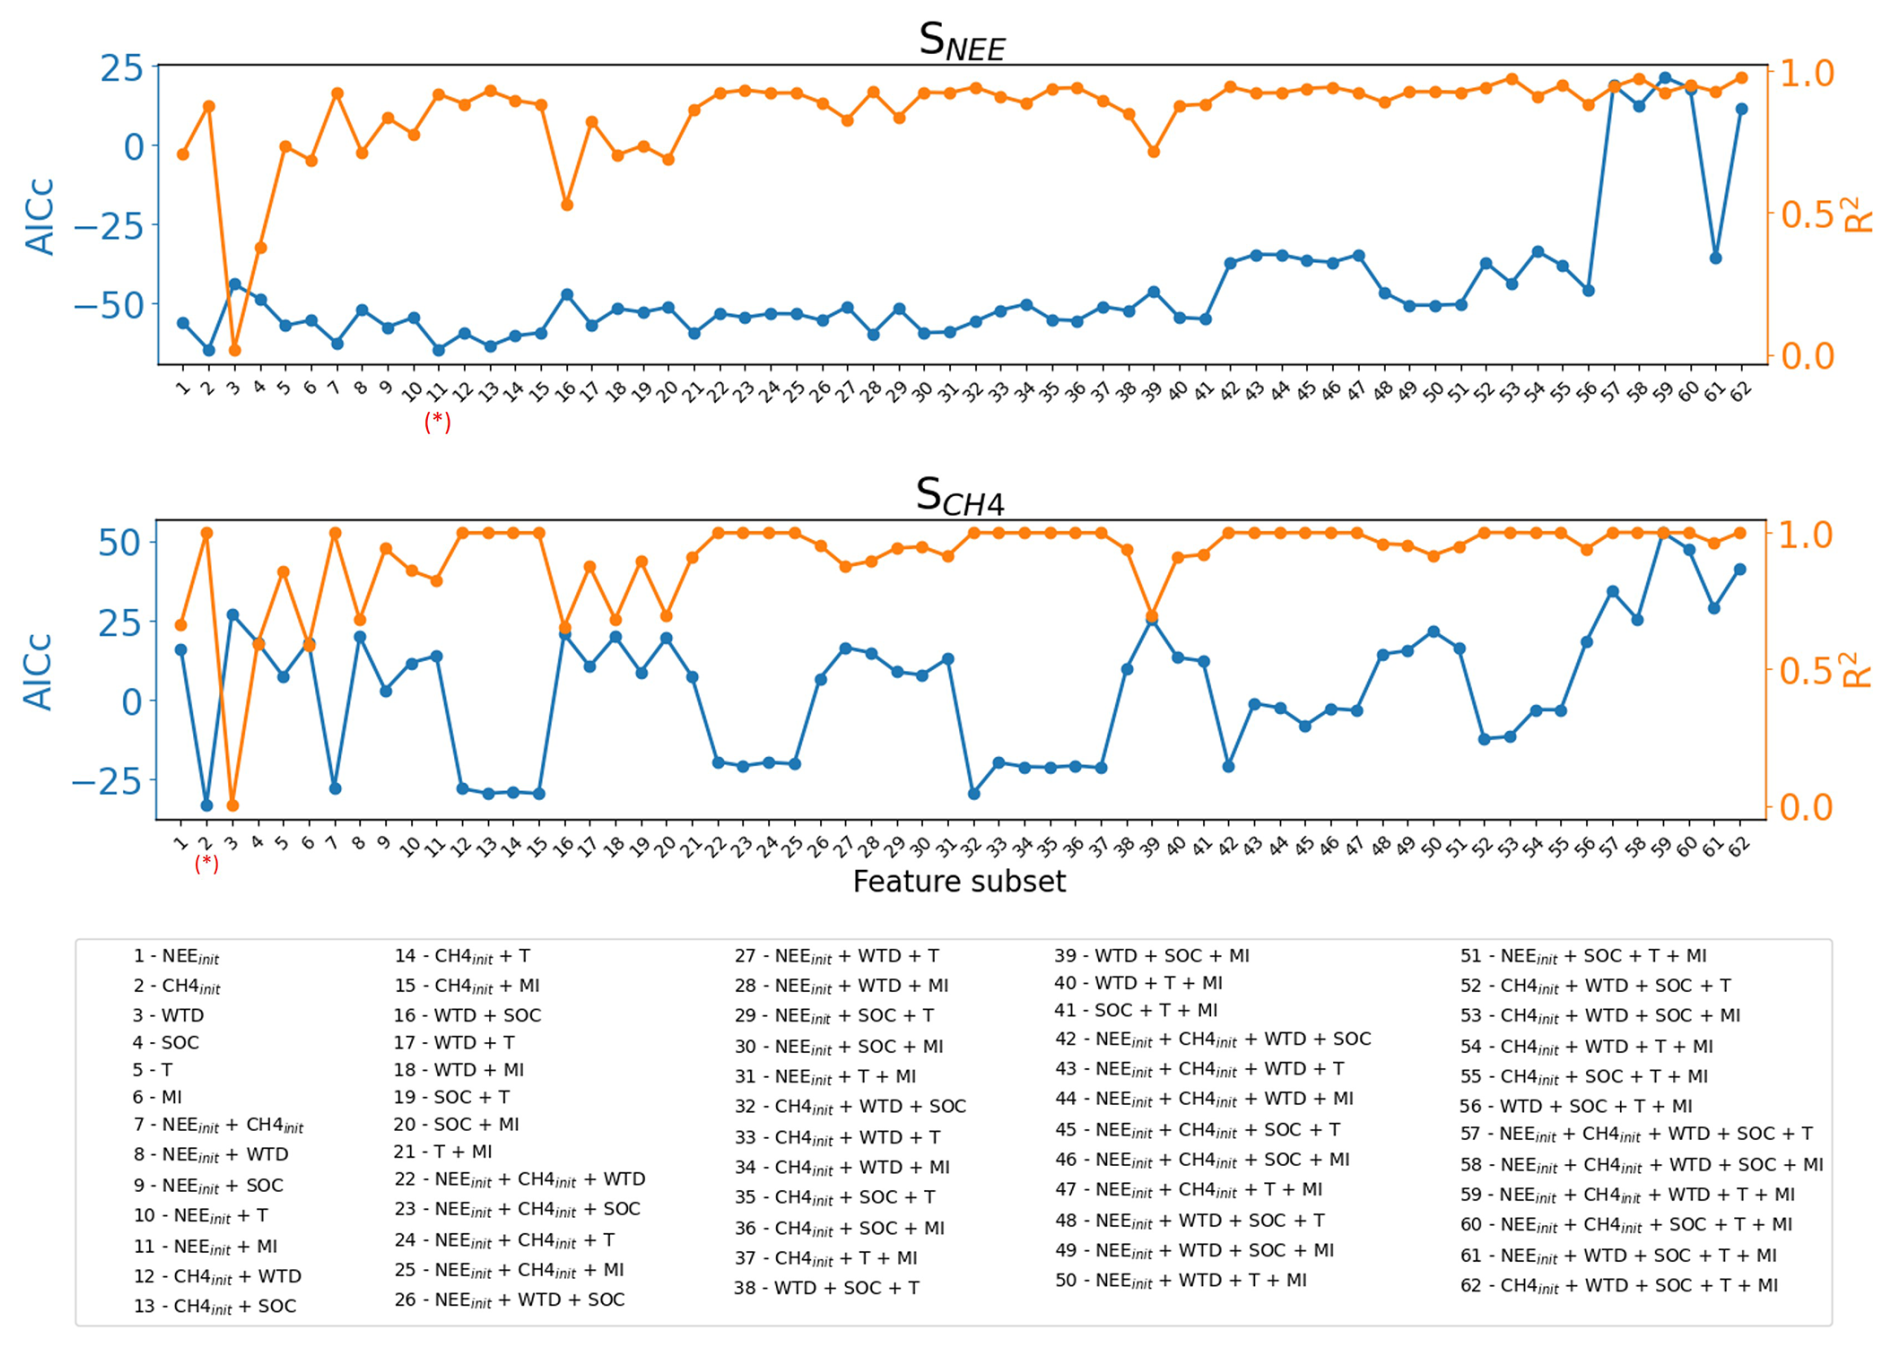
Figure C4Selection of explanatory variable subsets for the sensitivities of net ecosystem exchange (SNEE) and CH4 emissions (). For each possible subset of predictor variables, the corrected Akaike Information Criterion (AICc; blue lines, left axis) and the coefficient of determination (R2; orange lines, right axis) are shown. Lower AICc values indicate better model parsimony. The red star marks the variable subset selected for the exploratory emulator presented in Eqs. (3) and (4).
Table C1Coefficient of determination (R2) and p-values from leave-one-out fitting of Eqs. (3) and (4), with the site removed indicated in the first column.
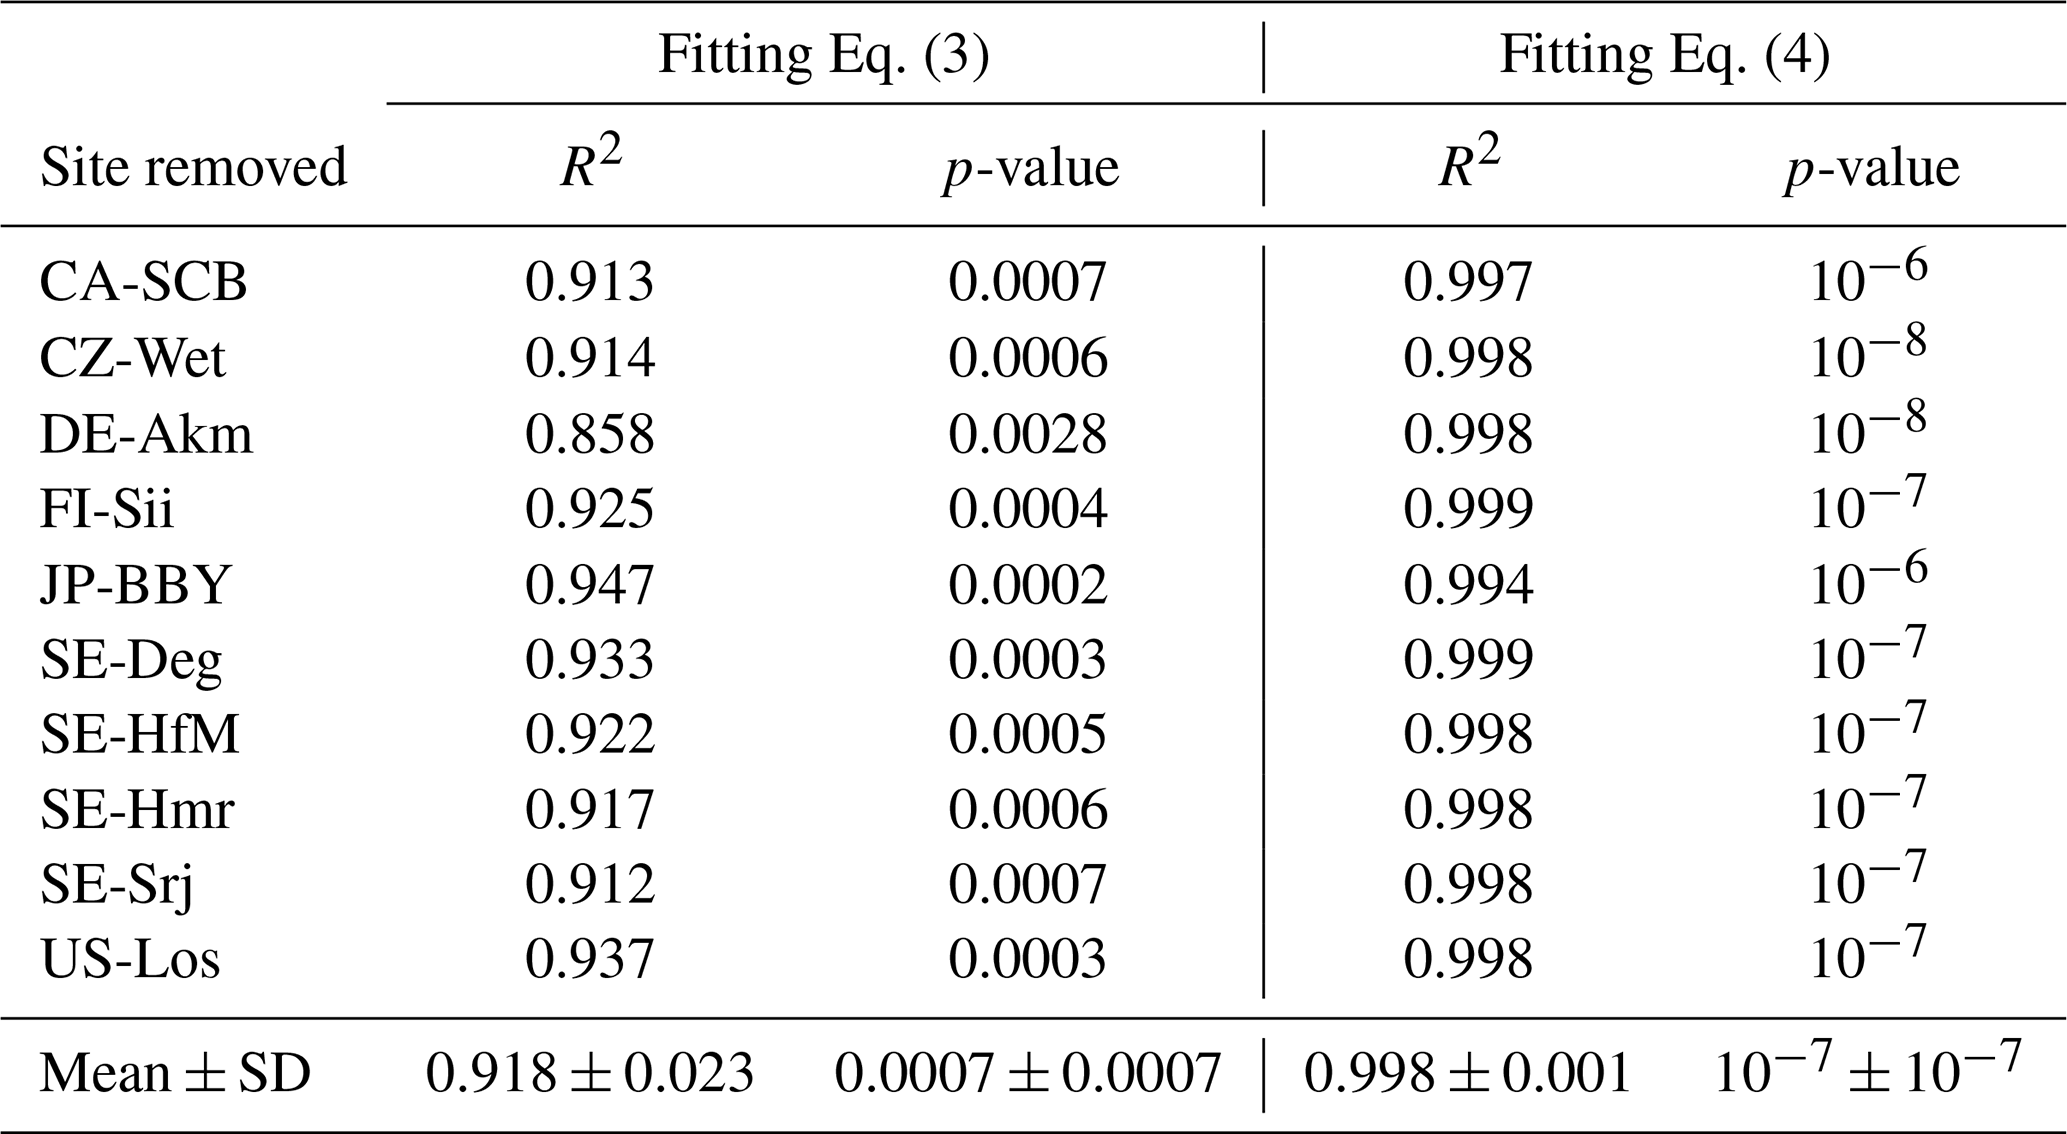
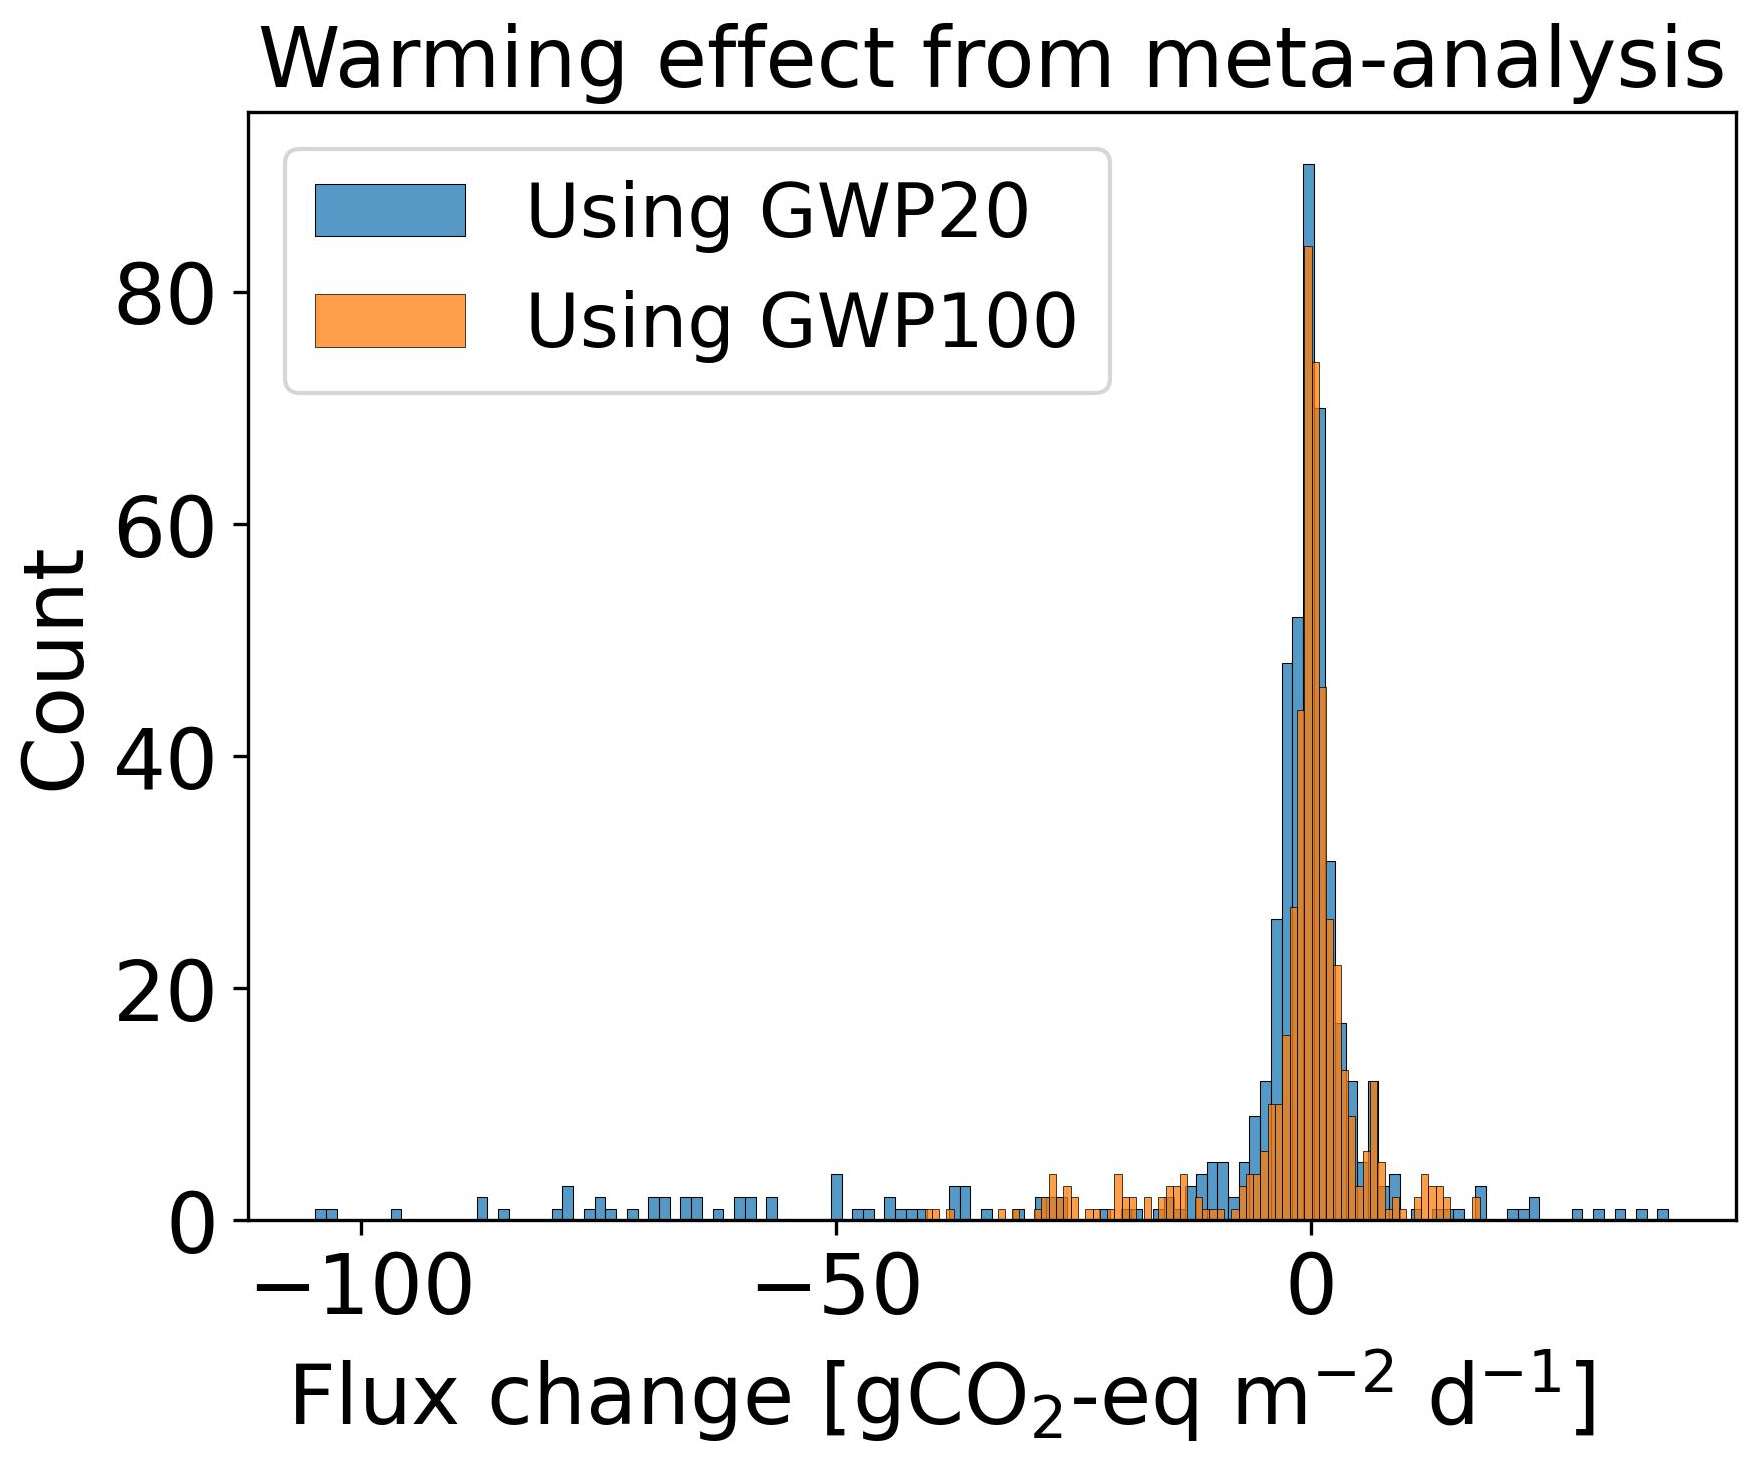
Site-level current vegetation composition was first adjusted to match available field observations, providing a realistic baseline for model initialization. However, the trajectory of vegetation change following peatland drainage remains highly uncertain, and no single future vegetation scenario can be considered more likely than others. To account for this uncertainty, we evaluated two alternative vegetation change scenarios in addition to the baseline scenario with unchanged plant functional types (PFTs). Results from these three vegetation scenarios were combined to form an ensemble, with the mean response reported in the main analysis and the minimum–maximum range used to quantify vegetation-related uncertainty. Two peatland vegetation change scenarios were applied to all sites, except CZ-Wet and DE-Akm, where mosses are absent from the PFT composition:
- 1.
After 10 years of drainage, 50 % of moss was replaced by grass and shrub; after 20 years, all moss was fully replaced by grass and shrub.
- 2.
After 10 years of drainage, 50 % of moss and grass was replaced by shrub; after 20 years, both moss and grass were entirely replaced by shrub.
The combined effects over 50 years using GWP100 (similar to Fig. 10) are shown in Fig. D1. At site CA-SCB, FI-Sii, and JP-BBY, both vegetation shifts had slight impacts – drainage still resulted in warming effect at CA-SCB and FI-Sii, and cooling effects at JP-BBY. The conversion of moss to other peatland PFTs had little impact at SE-Srj and US-Los, but led to significantly increased drainage-induced CO2-equivalent emission in SE-Deg, SE-Hmr, and SE-HfM (moving up from green to blue lines). The conversion of moss and grass to shrub caused more variations at these five sites (orange lines): drainage can cause a cooling effect instead of warming (e.g. at SE-Hmr, SE-Srj) or vice versa (e.g. at SE-Deg, SE-HfM). These results highlight the importance of accounting for vegetation dynamics in future modelling. Changes in CO2 and CH4 fluxes under the vegetation change scenarios (relative to the unchanged PFT scenario) are illustrated in Figs. D2 and D3 for the 80 cm drainage case, with the CO2-equivalent emission of the three vegetation scenarios shown in Fig. D4.
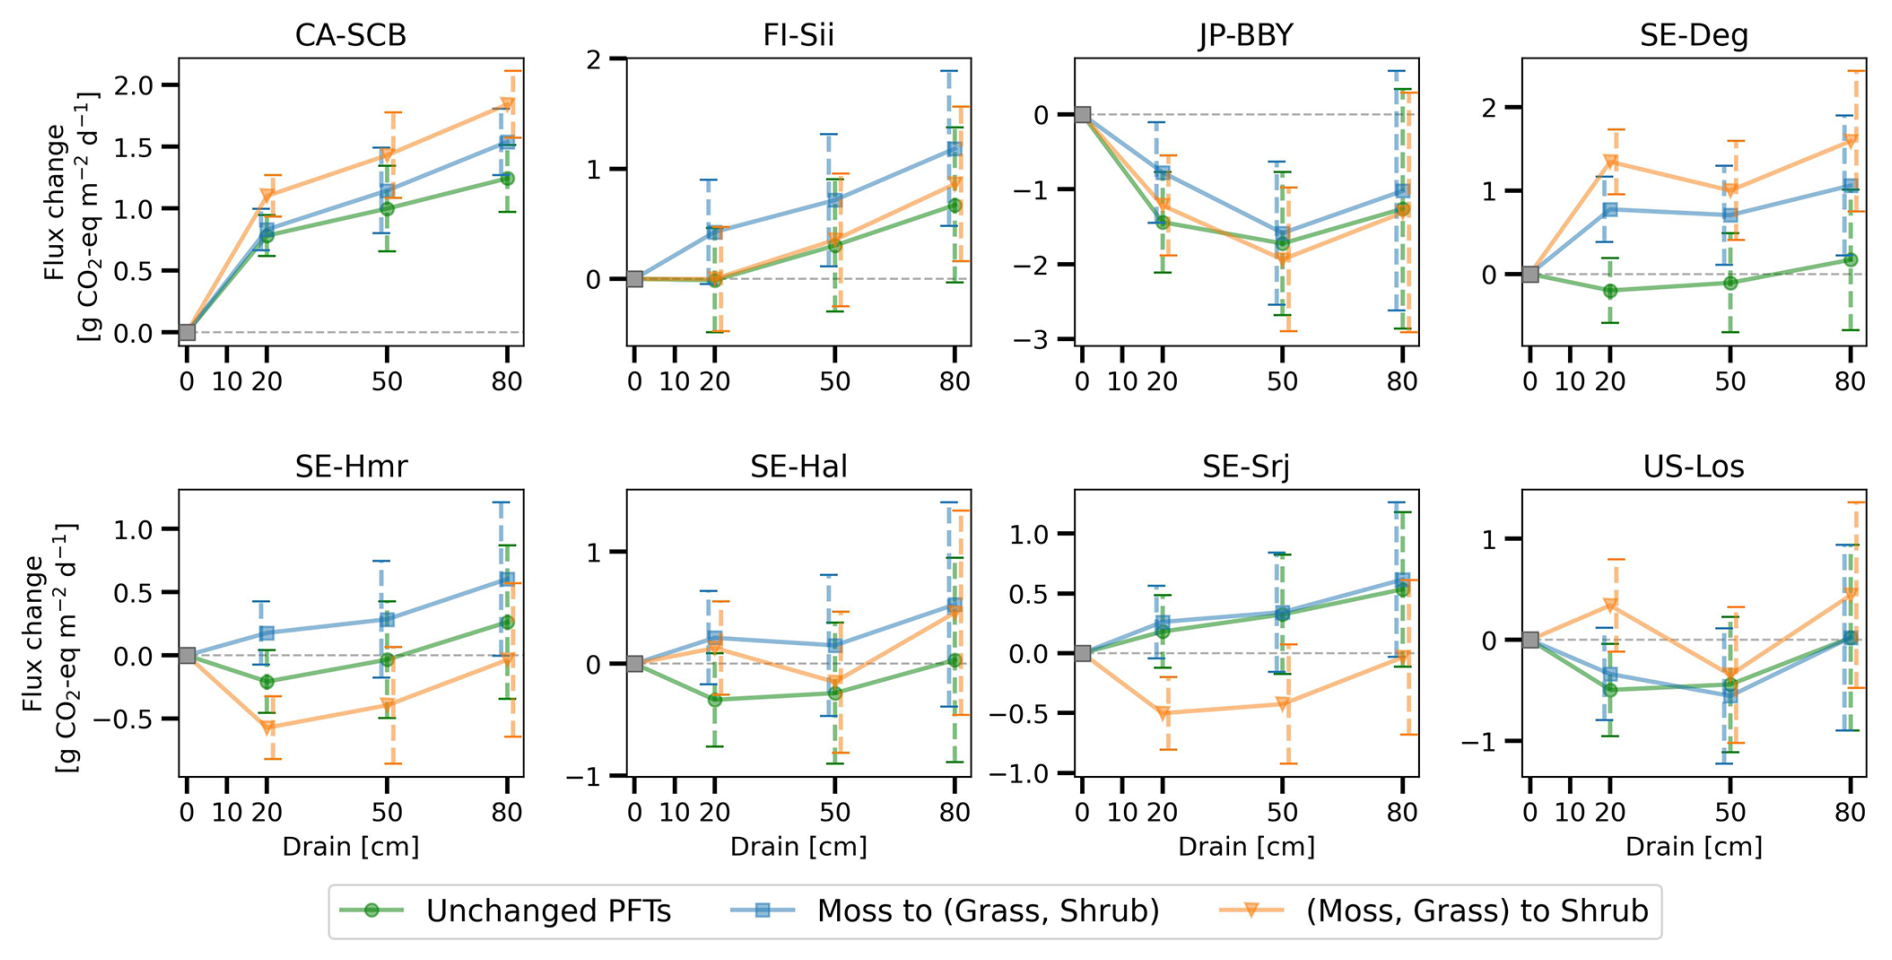
Figure D1Combined effect of drainage over a 50 year period evaluated using GWP100 under three vegetation scenarios: unchanged plant functional types (PFTs; green), conversion of moss to grass and shrubs (blue), and conversion of moss and grass to shrubs (orange). Error bars show parameter uncertainty (±1 standard deviation of 50 year time-mean CO2-equivalent fluxes across 10 Monte Carlo runs). Because all vegetation scenarios use the same baseline-calibrated parameter set and model structure, parameter uncertainty is identical across scenarios, whereas differences among curves reflect vegetation scenario uncertainty.
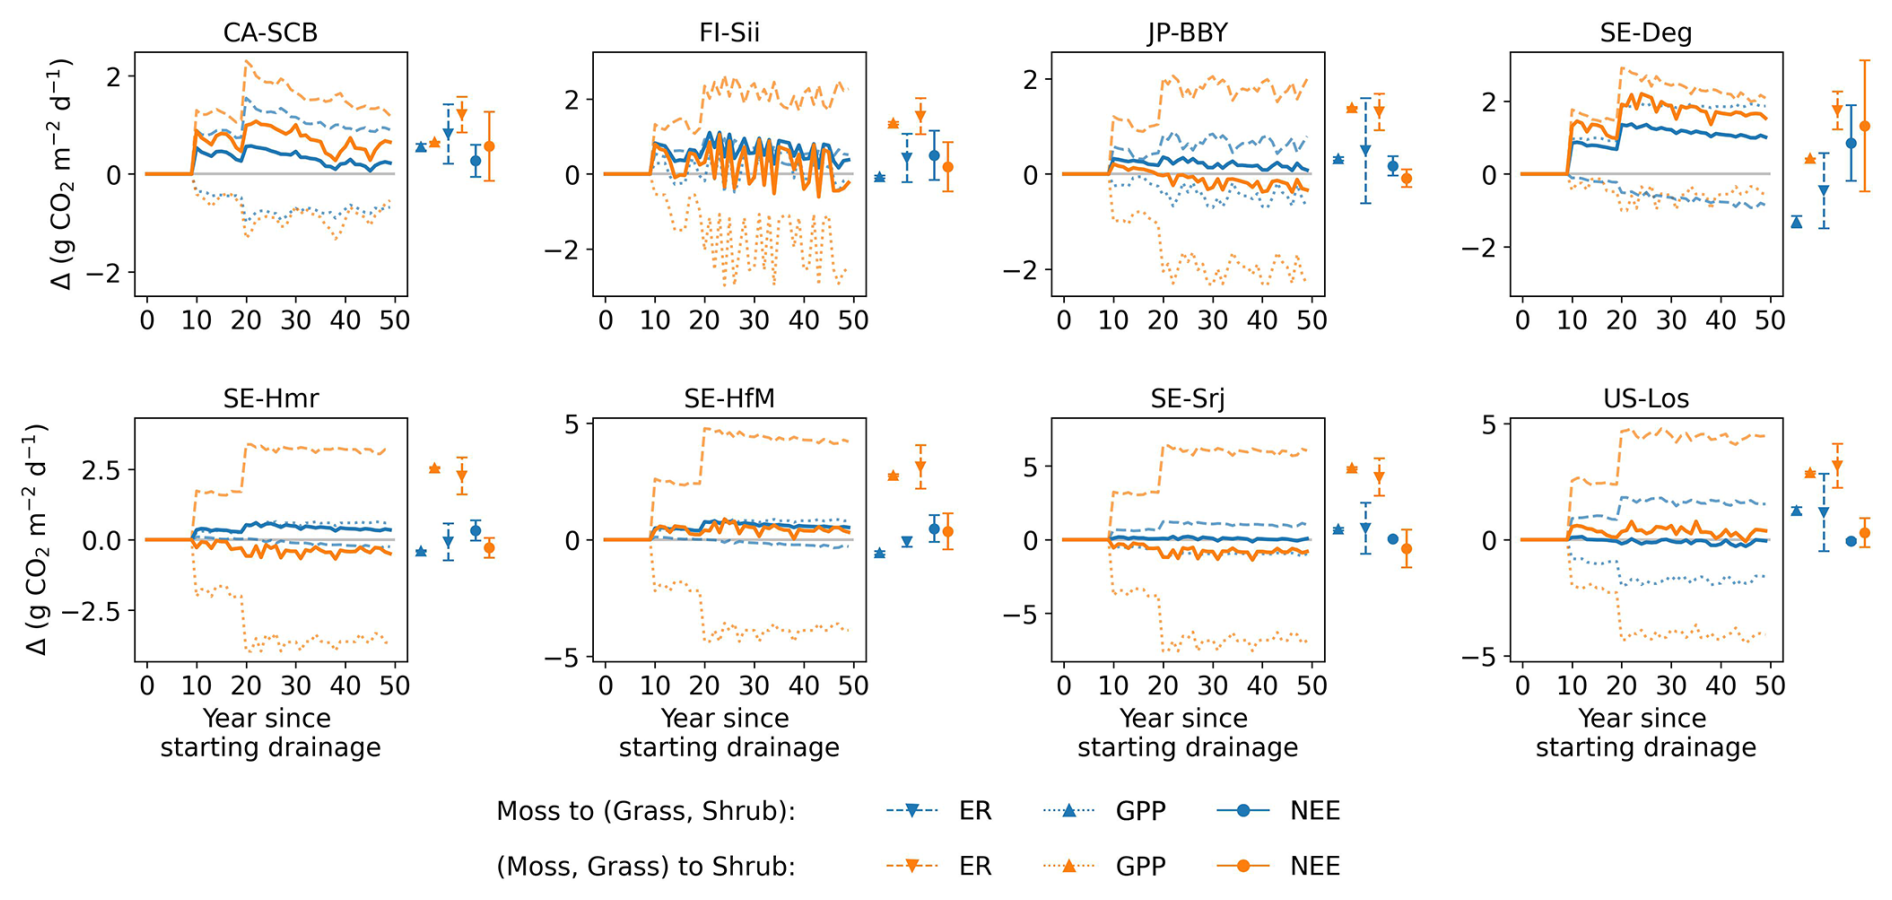
Figure D2Changes in gross primary production (GPP), ecosystem respiration (ER), and net ecosystem exchange (NEE) under two vegetation change scenarios, relative to the unchanged plant functional type (PFT) scenario, for the 80 cm drainage case. Results are shown for the conversion of moss to grass and shrubs and for the conversion of moss and grass to shrubs. All vegetation scenarios were simulated using the same baseline-calibrated parameter set and model structure; therefore, parameter uncertainty is identical across vegetation scenarios. The coloured bars shown to the right of each panel represent parameter uncertainty, quantified as ±1 standard deviation of the simulated time-mean fluxes over the full 50 year simulation period across 10 Monte Carlo runs. The colored dots indicate the corresponding time-mean flux simulated using the calibrated parameter set.
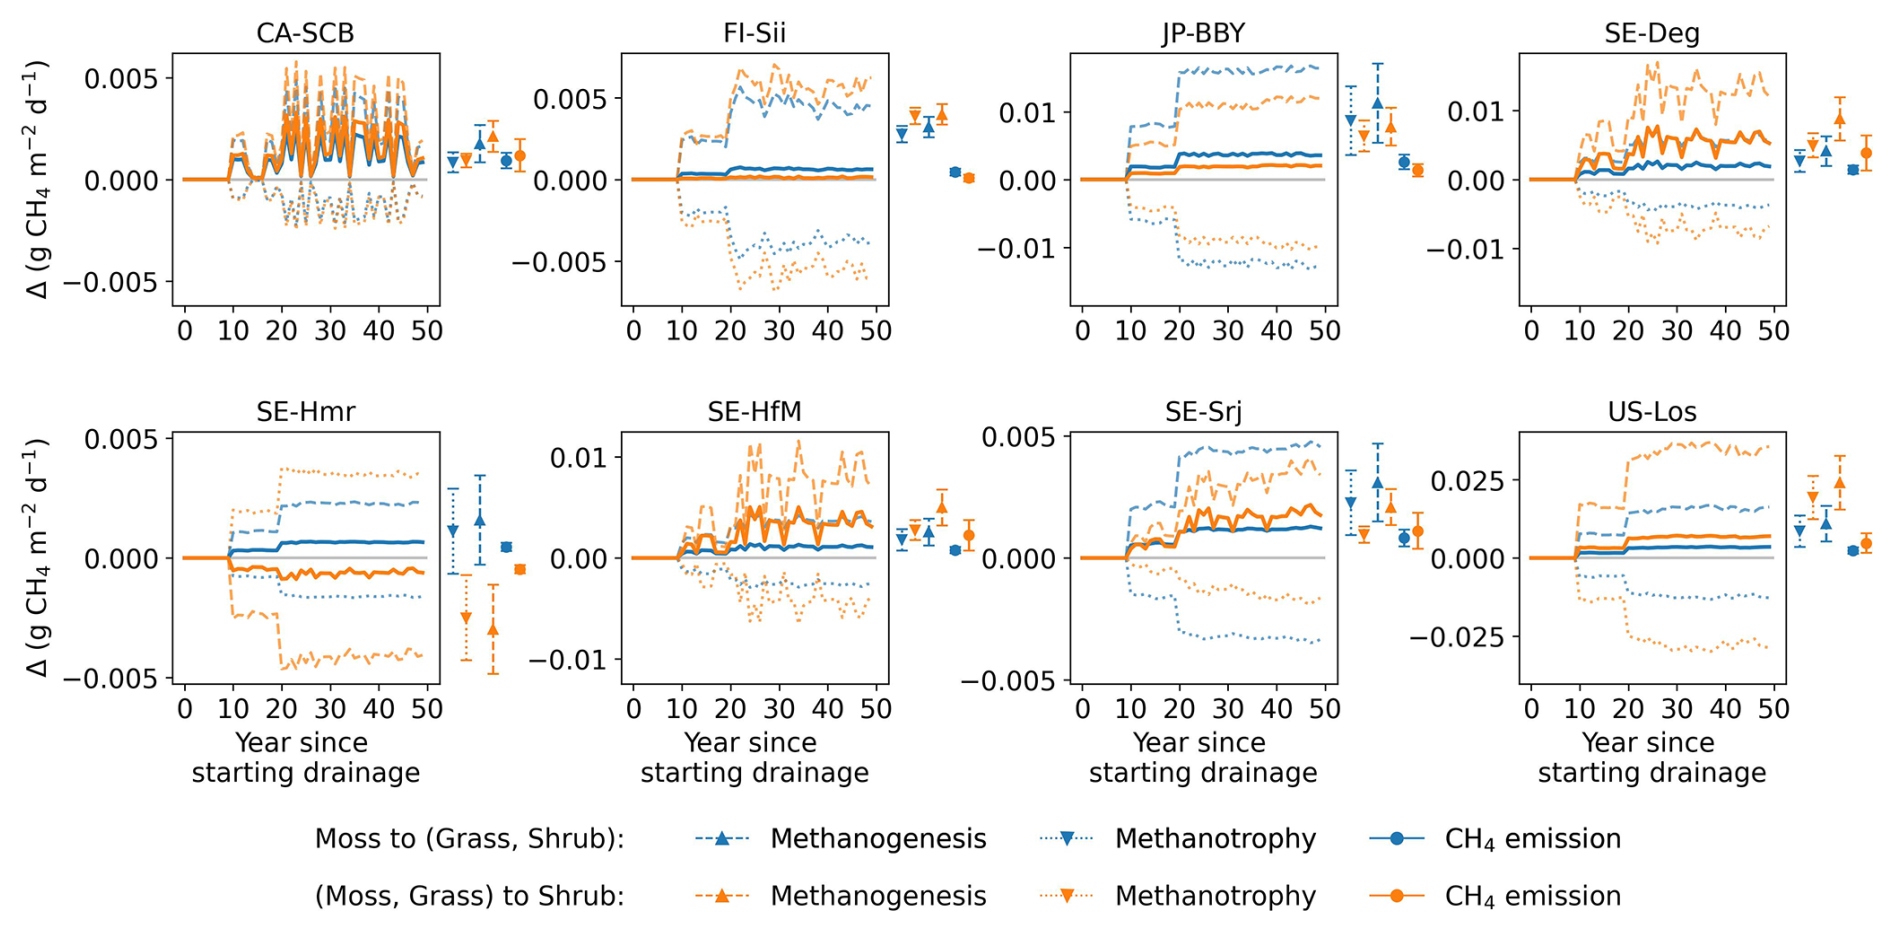
Figure D3Changes in methanogenesis, methane oxidation (methanotrophy), and net CH4 emissions under two vegetation change scenarios, relative to the unchanged plant functional type (PFT) scenario, for the 80 cm drainage case. Results are shown for the conversion of moss to grass and shrubs and for the conversion of moss and grass to shrubs. All vegetation scenarios were simulated using the same baseline-calibrated parameter set and model structure; therefore, parameter uncertainty is identical across vegetation scenarios. The coloured bars shown to the right of each panel represent parameter uncertainty, quantified as ±1 standard deviation of the simulated time-mean fluxes over the full 50 year simulation period across 10 Monte Carlo runs. The colored dots indicate the corresponding time-mean flux simulated using the calibrated parameter set.
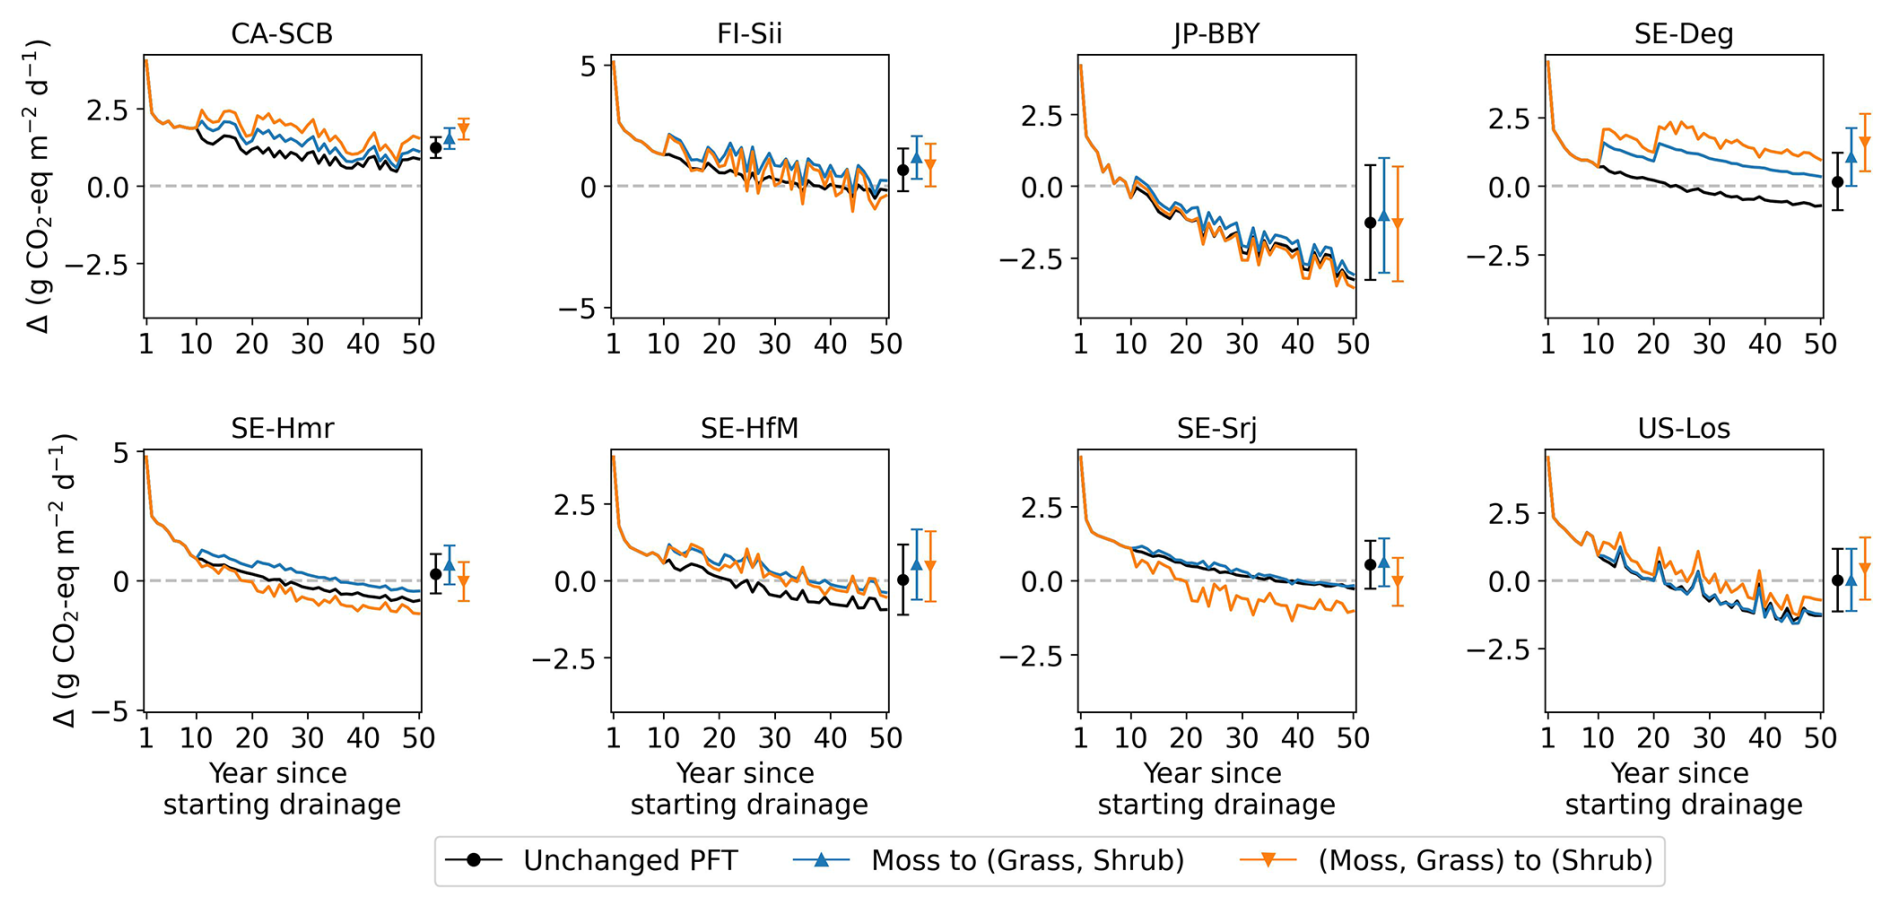
Figure D4CO2-equivalent emissions under two vegetation change scenarios for the 80 cm drainage case: unchanged plant functional types (PFTs), conversion of moss to grass and shrubs, and conversion of moss and grass to shrubs. All vegetation scenarios were simulated using the same baseline-calibrated parameter set and model structure; therefore, parameter uncertainty is identical across vegetation scenarios. The coloured bars shown to the right of each panel represent parameter uncertainty, quantified as ±1 standard deviation of the simulated time-mean CO2-equivalent fluxes over the full 50 year simulation period across 10 Monte Carlo runs. The colored dots indicate the corresponding time-mean flux simulated using the calibrated parameter set.
To demonstrate the reliability of the drainage model, we evaluated its performance against available field observations. Although paired drainage experiments with comprehensive and long-term flux measurements are rare, we compiled warm-season (1991) field observations of both ecosystem respiration (ER) and CH4 emissions from a site located near FI-Sii and conducted a dedicated simulation experiment. This site has experienced peatland drainage for approximately 40 years prior to the observation period (Nykänen et al., 1998; Kwon et al., 2022). During the 1991 measurement period, the drained treatment exhibited a water table depth (WTD) approximately 10 cm lower than that of the pristine (control) condition.
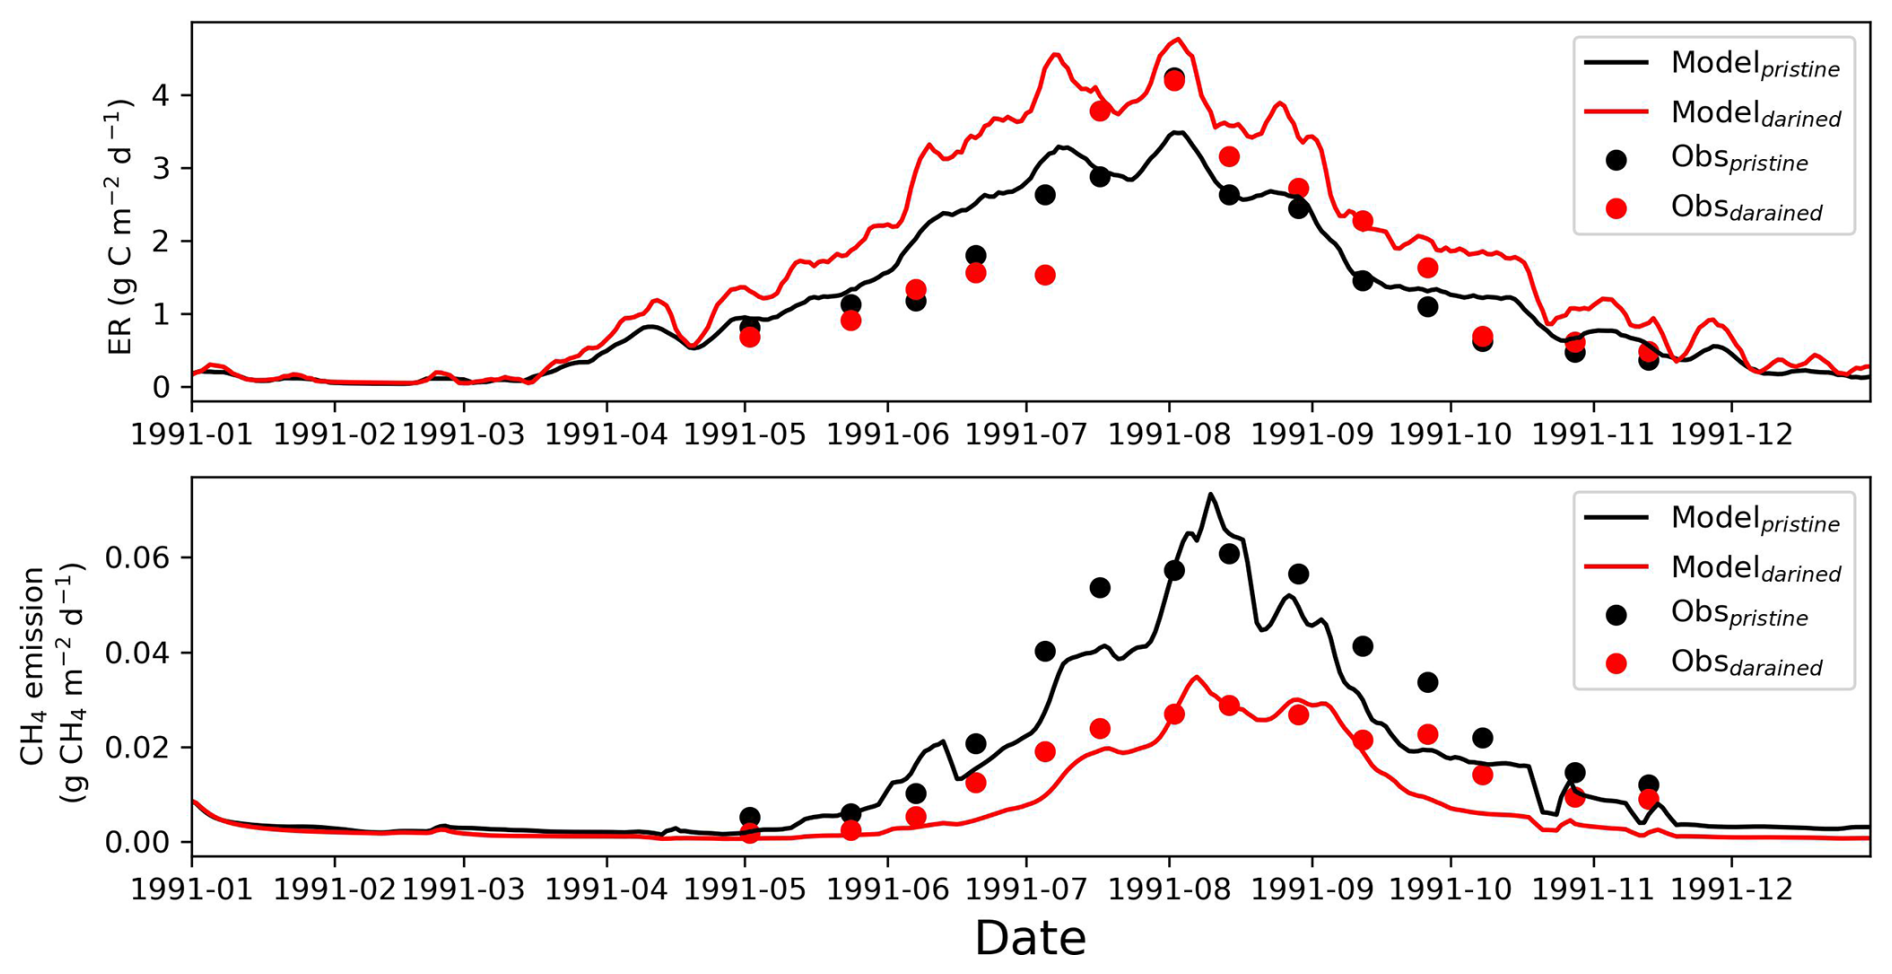
Figure E1Comparison of observed and modeled ecosystem respiration (ER) and CH4 emissions of a drainage experiment near the pristine peat site of FI-Sii. The drained conditions are in red, and the controls (pristine peat) are in black. Lines are our simulations, and dots are the observed fluxes.
Model parameters were first calibrated using observed fluxes from the pristine condition, following the calibration protocol described in the main text. The calibrated model was then applied to simulate the drainage scenario by prescribing a WTD that was approximately 10 cm lower than the pristine condition, consistent with the observed WTD difference during the 1991 campaign. A comparison between modeled and observed ER and CH4 emissions is shown in Fig. E1. The model reproduces the observed changes in fluxes between pristine and drained conditions reasonably well, particularly for CH4 emissions.
Overall, this experiment provides independent support that the model is capable of capturing drainage-induced changes in greenhouse gas fluxes under real-world conditions.
The data supporting this study and the model code are available at https://doi.org/10.5281/zenodo.19328877 (Liu, 2026).
PC – Conceptualization. THN and LL – Methodology, simulations, and formal analysis. YX, CQ, and ES contributed to simulations. AK, CG, MP, JLR, KDN, and XL provided site data. PC and THN wrote the manuscript, PC and LL revised the manuscript, all co-authors reviewed and edited it.
The contact author has declared that none of the authors has any competing interests.
Publisher's note: Copernicus Publications remains neutral with regard to jurisdictional claims made in the text, published maps, institutional affiliations, or any other geographical representation in this paper. The authors bear the ultimate responsibility for providing appropriate place names. Views expressed in the text are those of the authors and do not necessarily reflect the views of the publisher.
We thank the WET HORIZONS project for providing access to observational datasets used in this study. We also acknowledge helpful discussions within the LSCE research group.
This research was carried out in the framework of the European Union's Horizon Europe programme WET HORIZONS, grant agreement no. 101056848. E. Salmon is funded by the European Union's Horizon research and innovation program, HORIZON-CL5-2021-D1-01, GreenFeedback under grant agreement no. 101056921.
This paper was edited by Marijn Bauters and reviewed by four anonymous referees.
Akaike, H.: A new look at the statistical model identification, IEEE T. Automat. Contr., 19, 716–723, https://doi.org/10.1109/TAC.1974.1100705, 1974.
Antala, M., Juszczak, R., Van Der Tol, C., and Rastogi, A.: Impact of climate change-induced alterations in peatland vegetation phenology and composition on carbon balance, Sci. Total Environ., 827, 154294, https://doi.org/10.1016/j.scitotenv.2022.154294, 2022.
Arnold, K. V., Weslien, P., Nilsson, M., Svensson, B. H., and Klemedtsson, L.: Fluxes of CO2, CH4 and N2O from drained coniferous forests on organic soils, Forest Ecol. Manag., 210, 239–254, https://doi.org/10.1016/j.foreco.2005.02.031, 2005.
Aurela, M., Riutta, T., Laurila, T., Tuovinen, J.-P., Vesala, T., Tuittila, E.-S., Rinne, J., Haapanala, S., and Laine, J.: CO2 exchange of a sedge fen in southern Finland – the impact of a drought period, Tellus B, 59, 826, https://doi.org/10.1111/j.1600-0889.2007.00309.x, 2007.
Bernhofer, C., Grünwald, T., Moderow, U., Hehn, M., Eichelmann, U., Prasse, H., and Postel, U.: FLUXNET2015 DE-Akm Anklam, https://doi.org/10.18140/FLX/1440213, 2009.
Blodau, C.: Carbon cycling in peatlands, A review of processes and controls, Environ. Rev., 10, 111–134, https://doi.org/10.1139/a02-004, 2002.
Boelter, D. H.: Water table drawdown around an open ditch in organic soils, J. Hydrol., 15, 329–340, https://doi.org/10.1016/0022-1694(72)90046-7, 1972.
Conchedda, G. and Tubiello, F. N.: Drainage of organic soils and GHG emissions: validation with country data, Earth Syst. Sci. Data, 12, 3113–3137, https://doi.org/10.5194/essd-12-3113-2020, 2020.
Couwenberg, J., Dommain, R., and Joosten, H.: Greenhouse gas fluxes from tropical peatlands in south-east Asia, Glob. Change Biol., 16, 1715–1732, https://doi.org/10.1111/j.1365-2486.2009.02016.x, 2010.
Desai, A. and Thom, J.: FLUXNET-CH4 US-Los Lost Creek, https://doi.org/10.18140/FLX/1669682, 2020.
Ducharne, A., Ottlé, C., Maignan, F., Vuichard, N., Ghattas, J., Wang, F., Peylin, P., Polcher, J., Guimberteau, M., Maugis, P., Tafasca, S., Tootchi, A., Verhoef, A., and Mizuochi, H.: The hydrol module of ORCHIDEE: scientific documentation, IPSL, https://forge.ipsl.jussieu.fr/orchidee/raw-attachment/wiki/Documentation/eqs_hydrol_25April2018_Ducharne.pdf (last access: 27 March 2026), 2018.
Eggleston, H. S. (Ed.): 2006 IPCC guidelines for national greenhouse gas inventories, IGES, Hayama, Japan, https://www.ipcc-nggip.iges.or.jp/public/2006gl/ (last access: 27 March 2026), 2006.
Evans, C. D., Peacock, M., Baird, A. J., Artz, R. R. E., Burden, A., Callaghan, N., Chapman, P. J., Cooper, H. M., Coyle, M., Craig, E., Cumming, A., Dixon, S., Gauci, V., Grayson, R. P., Helfter, C., Heppell, C. M., Holden, J., Jones, D. L., Kaduk, J., Levy, P., Matthews, R., McNamara, N. P., Misselbrook, T., Oakley, S., Page, S. E., Rayment, M., Ridley, L. M., Stanley, K. M., Williamson, J. L., Worrall, F., and Morrison, R.: Overriding water table control on managed peatland greenhouse gas emissions, Nature, 593, 548–552, https://doi.org/10.1038/s41586-021-03523-1, 2021.
FAO: Peat-GHG tool: A greenhouse gas calculator for peatland management in Indonesia, FAO, Rome, Italy, https://openknowledge.fao.org/handle/20.500.14283/cb4570en (last access: 27 March 2026), 2021.
Fenner, N. and Freeman, C.: Drought-induced carbon loss in peatlands, Nat. Geosci., 4, 895–900, https://doi.org/10.1038/ngeo1323, 2011.
Friedlingstein, P., O'Sullivan, M., Jones, M. W., Andrew, R. M., Gregor, L., Hauck, J., Le Quéré, C., Luijkx, I. T., Olsen, A., Peters, G. P., Peters, W., Pongratz, J., Schwingshackl, C., Sitch, S., Canadell, J. G., Ciais, P., Jackson, R. B., Alin, S. R., Alkama, R., Arneth, A., Arora, V. K., Bates, N. R., Becker, M., Bellouin, N., Bittig, H. C., Bopp, L., Chevallier, F., Chini, L. P., Cronin, M., Evans, W., Falk, S., Feely, R. A., Gasser, T., Gehlen, M., Gkritzalis, T., Gloege, L., Grassi, G., Gruber, N., Gürses, Ö., Harris, I., Hefner, M., Houghton, R. A., Hurtt, G. C., Iida, Y., Ilyina, T., Jain, A. K., Jersild, A., Kadono, K., Kato, E., Kennedy, D., Klein Goldewijk, K., Knauer, J., Korsbakken, J. I., Landschützer, P., Lefèvre, N., Lindsay, K., Liu, J., Liu, Z., Marland, G., Mayot, N., McGrath, M. J., Metzl, N., Monacci, N. M., Munro, D. R., Nakaoka, S.-I., Niwa, Y., O'Brien, K., Ono, T., Palmer, P. I., Pan, N., Pierrot, D., Pocock, K., Poulter, B., Resplandy, L., Robertson, E., Rödenbeck, C., Rodriguez, C., Rosan, T. M., Schwinger, J., Séférian, R., Shutler, J. D., Skjelvan, I., Steinhoff, T., Sun, Q., Sutton, A. J., Sweeney, C., Takao, S., Tanhua, T., Tans, P. P., Tian, X., Tian, H., Tilbrook, B., Tsujino, H., Tubiello, F., van der Werf, G. R., Walker, A. P., Wanninkhof, R., Whitehead, C., Willstrand Wranne, A., Wright, R., Yuan, W., Yue, C., Yue, X., Zaehle, S., Zeng, J., and Zheng, B.: Global Carbon Budget 2022, Earth Syst. Sci. Data, 14, 4811–4900, https://doi.org/10.5194/essd-14-4811-2022, 2022.
Furukawa, Y., Inubushi, K., Ali, M., Itang, A. M., and Tsuruta, H.: Effect of changing groundwater levels caused by land-use changes on greenhouse gas fluxes from tropical peat lands, Nutr. Cycl. Agroecosys., 71, 81–91, https://doi.org/10.1007/s10705-004-5286-5, 2005.
Gan, D., Zhang, Z., Li, H., Yu, D., Li, Z., Long, R., Niu, S., Zuo, H., Meng, X., Wang, J., and Ma, L.: Ditch emissions partially offset global reductions in methane emissions from peatland drainage, Commun. Earth Environ., 5, 640, https://doi.org/10.1038/s43247-024-01818-5, 2024.
Hilbert, D. W., Roulet, N., and Moore, T.: Modelling and analysis of peatlands as dynamical systems, J. Ecol., 88, 230–242, https://doi.org/10.1046/j.1365-2745.2000.00438.x, 2000.
Holden, J.: Peatland hydrology and carbon release: why small-scale process matters, Philos. T. R. Soc. A, 363, 2891–2913, https://doi.org/10.1098/rsta.2005.1671, 2005.
Huang, X., Silvennoinen, H., Kløve, B., Regina, K., Kandel, T. P., Piayda, A., Karki, S., Lærke, P. E., and Höglind, M.: Modelling CO2 and CH4 emissions from drained peatlands with grass cultivation by the BASGRA-BGC model, Sci. Total Environ., 765, 144385, https://doi.org/10.1016/j.scitotenv.2020.144385, 2021a.
Huang, Y., Ciais, P., Luo, Y., Zhu, D., Wang, Y., Qiu, C., Goll, D. S., Guenet, B., Makowski, D., De Graaf, I., Leifeld, J., Kwon, M. J., Hu, J., and Qu, L.: Tradeoff of CO2 and CH4 emissions from global peatlands under water-table drawdown, Nat. Clim. Change, 11, 618–622, https://doi.org/10.1038/s41558-021-01059-w, 2021b.
Intergovernmental Panel On Climate Change (IPCC): Climate Change 2021 – The Physical Science Basis: Working Group I Contribution to the Sixth Assessment Report of the Intergovernmental Panel on Climate Change, 1st edn., Cambridge University Press, https://doi.org/10.1017/9781009157896, 2023.
Jassey, V. E. J., Reczuga, M. K., Zielińska, M., Słowińska, S., Robroek, B. J. M., Mariotte, P., Seppey, C. V. W., Lara, E., Barabach, J., Słowiński, M., Bragazza, L., Chojnicki, B. H., Lamentowicz, M., Mitchell, E. A. D., and Buttler, A.: Tipping point in plant–fungal interactions under severe drought causes abrupt rise in peatland ecosystem respiration, Glob. Change Biol., 24, 972–986, https://doi.org/10.1111/gcb.13928, 2018.
Joosten, H.: The Global Peatland CO2 Picture: peatland status and drainage related emissions in all countries of the world, Wetlands International, Ede, the Netherlands, https://www.wetlands.org/publications/the-global-peatland-co2-picture/ (last access: 27 March 2026), 2009.
Jung, M., Reichstein, M., Schwalm, C. R., Huntingford, C., Sitch, S., Ahlström, A., Arneth, A., Camps-Valls, G., Ciais, P., Friedlingstein, P., Gans, F., Ichii, K., Jain, A. K., Kato, E., Papale, D., Poulter, B., Raduly, B., Rödenbeck, C., Tramontana, G., Viovy, N., Wang, Y.-P., Weber, U., Zaehle, S., and Zeng, N.: Compensatory water effects link yearly global land CO2 sink changes to temperature, Nature, 541, 516–520, https://doi.org/10.1038/nature20780, 2017.
Kiew, F., Hirata, R., Hirano, T., Xhuan, W. G., Aries, E. B., Kemudang, K., Wenceslaus, J., San, L. K., and Melling, L.: Carbon dioxide balance of an oil palm plantation established on tropical peat, Agr. Forest Meteorol., 295, 108189, https://doi.org/10.1016/j.agrformet.2020.108189, 2020.
Kokkonen, N., Laine, A. M., Laine, J., Vasander, H., Kurki, K., Gong, J., and Tuittila, E.: Responses of peatland vegetation to 15 year water level drawdown as mediated by fertility level, J. Veg. Sci., 30, 1206–1216, https://doi.org/10.1111/jvs.12794, 2019.
Kokkonen, N., Laine, A. M., Männistö, E., Mehtätalo, L., Korrensalo, A., and Tuittila, E.-S.: Two Mechanisms Drive Changes in Boreal Peatland Photosynthesis Following Long-Term Water Level Drawdown: Species Turnover and Altered Photosynthetic Capacity, Ecosystems, 25, 1601–1618, https://doi.org/10.1007/s10021-021-00736-3, 2022.
Kwon, M. J., Ballantyne, A., Ciais, P., Qiu, C., Salmon, E., Raoult, N., Guenet, B., Göckede, M., Euskirchen, E. S., Nykänen, H., Schuur, E. A. G., Turetsky, M. R., Dieleman, C. M., Kane, E. S., and Zona, D.: Lowering water table reduces carbon sink strength and carbon stocks in northern peatlands, Glob. Change Biol., 28, 6752–6770, https://doi.org/10.1111/gcb.16394, 2022.
Laine, A. M., Byrne, K. A., Kiely, G., and Tuittila, E.-S.: The short-term effect of altered water level on carbon dioxide and methane fluxes in a blanket bog, Suo, 60, 65–83, 2009.
Lange, S. and Büchner, M.: ISIMIP3b bias-adjusted atmospheric climate input data (1.1), https://doi.org/10.48364/ISIMIP.842396.1, 2021.
Larmola, T., Tuittila, E.-S., Tiirola, M., Nykänen, H., Martikainen, P. J., Yrjälä, K., Tuomivirta, T., and Fritze, H.: The role of Sphagnum mosses in the methane cycling of a boreal mire, Ecology, 91, 2356–2365, https://doi.org/10.1890/09-1343.1, 2010.
Liu, L.: Data and model code for the paper titled “Modeling the impact of drainage on peatland CO2 and CH4 fluxes and its underlying drivers”, Zenodo [data set, code], https://doi.org/10.5281/zenodo.19328877, 2026.
Liu, L., Qiu, C., Xi, Y., Salmon, E., Kalhori, A., Artz, R. R. E., Guimbaud, C., Peichl, M., Ratcliffe, J. L., Noumonvi, K. D., López, E., Dusek, J., Markkanen, T., Sachs, T., Aurela, M., Nguyen, T.-H., Lohila, A., Mammarella, I., and Ciais, P.: Assessing CO2 Fluxes for European Peatlands in ORCHIDEE-PEAT With Multiple Plant Functional Types, J. Adv. Model. Earth Sy., 17, https://doi.org/10.1029/2025MS004940, 2025.
Lynch, J., Cain, M., Pierrehumbert, R., and Allen, M.: Demonstrating GWP*: a means of reporting warming-equivalent emissions that captures the contrasting impacts of short- and long-lived climate pollutants, Environ. Res. Lett., 15, 044023, https://doi.org/10.1088/1748-9326/ab6d7e, 2020.
Maljanen, M., Sigurdsson, B. D., Guðmundsson, J., Óskarsson, H., Huttunen, J. T., and Martikainen, P. J.: Greenhouse gas balances of managed peatlands in the Nordic countries – present knowledge and gaps, Biogeosciences, 7, 2711–2738, https://doi.org/10.5194/bg-7-2711-2010, 2010.
Martikainen, P. J., Nykänen, H., Alm, J., and Silvola, J.: Change in fluxes of carbon dioxide, methane and nitrous oxide due to forest drainage of mire sites of different trophy, Plant Soil, 168–169, 571–577, https://doi.org/10.1007/BF00029370, 1995.
Mejdová, M., Dušek, J., Foltýnová, L., Macálková, L., and Čížková, H.: Photosynthetic parameters of a sedge-grass marsh as a big-leaf: effect of plant species composition, Sci. Rep.-UK, 11, 3723, https://doi.org/10.1038/s41598-021-82382-2, 2021.
Mohammed Rashid, A., Midi, H., Dhhan, W., and Arasan, J.: Detection of outliers in high-dimensional data using nu-support vector regression, J. Appl. Stat., 49, 2550–2569, https://doi.org/10.1080/02664763.2021.1911965, 2022.
Morel, X., Decharme, B., Delire, C., Krinner, G., Lund, M., Hansen, B. U., and Mastepanov, M.: A new process-based soil methane scheme: evaluation over Arctic field sites with the ISBA land surface model, J. Adv. Model. Earth Sy., 11, 293–326, https://doi.org/10.1029/2018MS001329, 2019.
Mozafari, B., Bruen, M., Donohue, S., Renou-Wilson, F., and O'Loughlin, F.: Peatland dynamics: A review of process-based models and approaches, Sci. Total Environ., 877, 162890, https://doi.org/10.1016/j.scitotenv.2023.162890, 2023.
Munir, T. M., Perkins, M., Kaing, E., and Strack, M.: Carbon dioxide flux and net primary production of a boreal treed bog: Responses to warming and water-table-lowering simulations of climate change, Biogeosciences, 12, 1091–1111, https://doi.org/10.5194/bg-12-1091-2015, 2015.
Neubauer, S. C. and Megonigal, J. P.: Moving Beyond Global Warming Potentials to Quantify the Climatic Role of Ecosystems, Ecosystems, 18, 1000–1013, https://doi.org/10.1007/s10021-015-9879-4, 2015.
Nieveen, J. P., Campbell, D. I., Schipper, L. A., and Blair, I. J.: Carbon exchange of grazed pasture on a drained peat soil, Glob. Change Biol., 11, 607–618, https://doi.org/10.1111/j.1365-2486.2005.00929.x, 2005.
Noumonvi, K. D., Ågren, A. M., Ratcliffe, J. L., Öquist, M. G., Ericson, L., Tong, C. H. M., Järveoja, J., Zhu, W., Osterwalder, S., Peng, H., Erefur, C., Bishop, K., Laudon, H., Nilsson, M. B., and Peichl, M.: The Kulbäcksliden Research Infrastructure: a unique setting for northern peatland studies, Front. Earth Sci., 11, 1194749, https://doi.org/10.3389/feart.2023.1194749, 2023.
Nykänen, H., Alm, J., Silvola, J., Tolonen, K., and Martikainen, P. J.: Methane fluxes on boreal peatlands of different fertility and the effect of long-term experimental lowering of the water table on flux rates, Global Biogeochem. Cy., 12, 53–69, https://doi.org/10.1029/97GB02732, 1998.
Oehri, J., Schaepman-Strub, G., Kim, J.-S., Grysko, R., Kropp, H., Grünberg, I., Zemlianskii, V., Sonnentag, O., Euskirchen, E. S., Reji Chacko, M., Muscari, G., Blanken, P. D., Dean, J. F., di Sarra, A., Harding, R. J., Sobota, I., Kutzbach, L., Plekhanova, E., Riihelä, A., Boike, J., Miller, N. B., Beringer, J., López-Blanco, E., Stoy, P. C., Sullivan, R. C., Kejna, M., Parmentier, F.-J. W., Gamon, J. A., Mastepanov, M., Wille, C., Jackowicz-Korczynski, M., Karger, D. N., Quinton, W. L., Putkonen, J., van As, D., Christensen, T. R., Hakuba, M. Z., Stone, R. S., Metzger, S., Vandecrux, B., Frost, G. V., Wild, M., Hansen, B., Meloni, D., Domine, F., te Beest, M., Sachs, T., Kalhori, A., Rocha, A. V., Williamson, S. N., Morris, S., Atchley, A. L., Essery, R., Runkle, B. R. K., Holl, D., Riihimaki, L. D., Iwata, H., Schuur, E. A. G., Cox, C. J., Grachev, A. A., McFadden, J. P., Fausto, R. S., Göckede, M., Ueyama, M., Pirk, N., de Boer, G., Bret-Harte, M. S., Leppäranta, M., Steffen, K., Friborg, T., Ohmura, A., Edgar, C. W., Olofsson, J., and Chambers, S. D.: Vegetation type is an important predictor of the arctic summer land surface energy budget, Nat. Commun., 13, 6379, https://doi.org/10.1038/s41467-022-34049-3, 2022.
Ofiti, N. O. E., Schmidt, M. W. I., Abiven, S., Hanson, P. J., Iversen, C. M., Wilson, R. M., Kostka, J. E., Wiesenberg, G. L. B., and Malhotra, A.: Climate warming and elevated CO2 alter peatland soil carbon sources and stability, Nat. Commun., 14, 7533, https://doi.org/10.1038/s41467-023-43410-z, 2023.
Page, S. E., Rieley, J. O., and Banks, C. J.: Global and regional importance of the tropical peatland carbon pool, Glob. Change Biol., 17, 798–818, https://doi.org/10.1111/j.1365-2486.2010.02279.x, 2011.
Peacock, M., Audet, J., Bastviken, D., Futter, M. N., Gauci, V., Grinham, A., Harrison, J. A., Kent, M. S., Kosten, S., Lovelock, C. E., Veraart, A. J., and Evans, C. D.: Global importance of methane emissions from drainage ditches and canals, Environ. Res. Lett., 16, 044010, https://doi.org/10.1088/1748-9326/abeb36, 2021.
Peylin, P., Bacour, C., MacBean, N., Leonard, S., Rayner, P., Kuppel, S., Koffi, E., Kane, A., Maignan, F., Chevallier, F., Ciais, P., and Prunet, P.: A new stepwise carbon cycle data assimilation system using multiple data streams to constrain the simulated land surface carbon cycle, Geosci. Model Dev., 9, 3321–3346, https://doi.org/10.5194/gmd-9-3321-2016, 2016.
Prananto, J. A., Minasny, B., Comeau, L., Rudiyanto, R., and Grace, P.: Drainage increases CO2 and N2O emissions from tropical peat soils, Glob. Change Biol., 26, 4583–4600, https://doi.org/10.1111/gcb.15147, 2020.
Qiu, C., Zhu, D., Ciais, P., Guenet, B., Krinner, G., Peng, S., Aurela, M., Bernhofer, C., Brümmer, C., Bret-Harte, S., Chu, H., Chen, J., Desai, A. R., Dušek, J., Euskirchen, E. S., Fortuniak, K., Flanagan, L. B., Friborg, T., Grygoruk, M., Gogo, S., Grünwald, T., Hansen, B. U., Holl, D., Humphreys, E., Hurkuck, M., Kiely, G., Klatt, J., Kutzbach, L., Largeron, C., Laggoun-Défarge, F., Lund, M., Lafleur, P. M., Li, X., Mammarella, I., Merbold, L., Nilsson, M. B., Olejnik, J., Ottosson-Löfvenius, M., Oechel, W., Parmentier, F.-J. W., Peichl, M., Pirk, N., Peltola, O., Pawlak, W., Rasse, D., Rinne, J., Shaver, G., Schmid, H. P., Sottocornola, M., Steinbrecher, R., Sachs, T., Urbaniak, M., Zona, D., and Ziemblinska, K.: ORCHIDEE-PEAT (revision 4596), a model for northern peatland CO2, water, and energy fluxes on daily to annual scales, Geosci. Model Dev., 11, 497–519, https://doi.org/10.5194/gmd-11-497-2018, 2018.
Qiu, C., Zhu, D., Ciais, P., Guenet, B., Peng, S., Krinner, G., Tootchi, A., Ducharne, A., and Hastie, A.: Modelling northern peatland area and carbon dynamics since the Holocene with the ORCHIDEE-PEAT land surface model (SVN r5488), Geosci. Model Dev., 12, 2961–2982, https://doi.org/10.5194/gmd-12-2961-2019, 2019.
Qiu, C., Ciais, P., Zhu, D., Guenet, B., Peng, S., Petrescu, A. M. R., Lauerwald, R., Makowski, D., Gallego-Sala, A. V., Charman, D. J., and Brewer, S. C.: Large historical carbon emissions from cultivated northern peatlands, Sci. Adv., 7, eabf1332, https://doi.org/10.1126/sciadv.abf1332, 2021.
Renou-Wilson, F., Müller, C., Moser, G., and Wilson, D.: To graze or not to graze? Four years greenhouse gas balances and vegetation composition from a drained and a rewetted organic soil under grassland, Agr. Ecosyst. Environ., 222, 156–170, https://doi.org/10.1016/j.agee.2016.02.011, 2016.
Rojstaczer, S. and Deverel, S. J.: Time dependence in atmospheric carbon inputs from drainage of organic soils, Geophys. Res. Lett., 20, 1383–1386, https://doi.org/10.1029/93GL01339, 1993.
Rosset, T., Binet, S., Rigal, F., and Gandois, L.: Peatland Dissolved Organic Carbon Export to Surface Waters: Global Significance and Effects of Anthropogenic Disturbance, Geophys. Res. Lett., 49, e2021GL096616, https://doi.org/10.1029/2021GL096616, 2022.
Roulet, N. T. and Moore, T. R.: The effect of forestry drainage practices on the emission of methane from northern peatlands, Can. J. Forest Res., 25, 491–499, https://doi.org/10.1139/x95-055, 1995.
Rydin, H. and Jeglum, J. K.: The Biology of Peatlands, Oxford University Press, https://doi.org/10.1093/acprof:osobl/9780199602995.001.0001, 2013.
Salmon, E., Jégou, F., Guenet, B., Jourdain, L., Qiu, C., Bastrikov, V., Guimbaud, C., Zhu, D., Ciais, P., Peylin, P., Gogo, S., Laggoun-Défarge, F., Aurela, M., Bret-Harte, M. S., Chen, J., Chojnicki, B. H., Chu, H., Edgar, C. W., Euskirchen, E. S., Flanagan, L. B., Fortuniak, K., Holl, D., Klatt, J., Kolle, O., Kowalska, N., Kutzbach, L., Lohila, A., Merbold, L., Pawlak, W., Sachs, T., and Ziemblińska, K.: Assessing methane emissions for northern peatlands in ORCHIDEE-PEAT revision 7020, Geosci. Model Dev., 15, 2813–2838, https://doi.org/10.5194/gmd-15-2813-2022, 2022.
Säurich, A., Tiemeyer, B., Don, A., Fiedler, S., Bechtold, M., Amelung, W., and Freibauer, A.: Drained organic soils under agriculture – The more degraded the soil the higher the specific basal respiration, Geoderma, 355, 113911, https://doi.org/10.1016/j.geoderma.2019.113911, 2019.
Schilstra, A. J. and Gerding, M. A. W.: Peat Resources, in: Encyclopedia of Energy, Elsevier, 805–810, https://doi.org/10.1016/B0-12-176480-X/00567-2, 2004.
Sirin, A., Chistotin, M., Suvorov, G., Glagolev, M., Kravchenko, I., and Minaeva, T.: Drained peatlands used for extraction and agriculture: Biogeochemical status with special attention to greenhouse gas fluxes and rewetting, Geophys. Res. Abstr., EGU2010-11623, EGU General Assembly 2010, Vienna, Austria, 2010.
Smola, A. J. and Schölkopf, B.: A tutorial on support vector regression, Stat. Comput., 14, 199–222, https://doi.org/10.1023/B:STCO.0000035301.49549.88, 2004.
Strack, M. and Waddington, J. M.: Response of peatland carbon dioxide and methane fluxes to a water table drawdown experiment, Global Biogeochem. Cy., 21, 2006GB002715, https://doi.org/10.1029/2006GB002715, 2007.
Swails, E. E., Ardón, M., Krauss, K. W., Peralta, A. L., Emanuel, R. E., Helton, A. M., Morse, J. L., Gutenberg, L., Cormier, N., Shoch, D., Settlemyer, S., Soderholm, E., Boutin, B. P., Peoples, C., and Ward, S.: Response of soil respiration to changes in soil temperature and water table level in drained and restored peatlands of the southeastern United States, Carbon Balance Manage., 17, 18, https://doi.org/10.1186/s13021-022-00219-5, 2022.
Tarantola, A.: Inverse Problem Theory and Methods for Model Parameter Estimation, SIAM, Philadelphia, USA, 349 pp., 2005.
Tikkasalo, O.-P., Peltola, O., Alekseychik, P., Heikkinen, J., Launiainen, S., Lehtonen, A., Li, Q., Martínez-García, E., Peltoniemi, M., Salovaara, P., Tuominen, V., and Mäkipää, R.: Eddy-covariance fluxes of CO2, CH4 and N2O in a drained peatland forest after clear-cutting, Biogeosciences, 22, 1277–1300, https://doi.org/10.5194/bg-22-1277-2025, 2025.
Tong, C. H. M., Noumonvi, K. D., Ratcliffe, J., Laudon, H., Järveoja, J., Drott, A., Nilsson, M. B., and Peichl, M.: A drained nutrient-poor peatland forest in boreal Sweden constitutes a net carbon sink after integrating terrestrial and aquatic fluxes, Glob. Change Biol., 30, e17246, https://doi.org/10.1111/gcb.17246, 2024.
Truskavetskii, R. S.: Carbon budget of drained peat bogs in Ukrainian Polesie, Eurasian Soil Sci.+, 47, 687–693, https://doi.org/10.1134/S1064229314050238, 2014.
Ueyama, M., Hirano, T., and Kominami, Y.: FLUXNET-CH4 JP-BBY Bibai bog, FLUXNET-CH4 Community Product, https://doi.org/10.18140/FLX/1669646, 2020.
Villa, J. A., Mejía, G. M., Velásquez, D., Botero, A., Acosta, S. A., Marulanda, J. M., Osorno, A. M., and Bohrer, G.: Carbon sequestration and methane emissions along a microtopographic gradient in a tropical Andean peatland, Sci. Total Environ., 654, 651–661, https://doi.org/10.1016/j.scitotenv.2018.11.109, 2019.
Waddington, J. M., Morris, P. J., Kettridge, N., Granath, G., Thompson, D. K., and Moore, P. A.: Hydrological feedbacks in northern peatlands, Ecohydrology, 8, 113–127, https://doi.org/10.1002/eco.1493, 2015.
Xi, Y., Qiu, C., Zhang, Y., Zhu, D., Peng, S., Hugelius, G., Chang, J., Salmon, E., and Ciais, P.: Assessment of a tiling energy budget approach in a land surface model, ORCHIDEE-MICT (r8205), Geosci. Model Dev., 17, 4727–4754, https://doi.org/10.5194/gmd-17-4727-2024, 2024.
Zou, J., Ziegler, A. D., Chen, D., McNicol, G., Ciais, P., Jiang, X., Zheng, C., Wu, J., Wu, J., Lin, Z., He, X., Brown, L. E., Holden, J., Zhang, Z., Ramchunder, S. J., Chen, A., and Zeng, Z.: Rewetting global wetlands effectively reduces major greenhouse gas emissions, Nat. Geosci., 15, 627–632, https://doi.org/10.1038/s41561-022-00989-0, 2022.