the Creative Commons Attribution 4.0 License.
the Creative Commons Attribution 4.0 License.
 | 15 Apr 2026
Ecological and environmental controls on plant wax production and stable isotope fractionation in modern terrestrial Arctic vegetation
Elizabeth K. Thomas
Martha K. Raynolds
Helga Bültmann
Jonathan H. Raberg
Terrestrially-derived plant waxes and their compound-specific stable carbon (δ13C) and hydrogen (δ2H) isotope ratios are valuable tools for inferring past changes in vegetation and hydrology in sedimentary archives. Such inferences require knowing the ecological (i.e., plant growth form) and environmental (i.e., latitude, temperature, precipitation, relative humidity, elevation) mechanisms that govern the production of different plant wax carbon chain-lengths and the fractionation of their stable isotopes. These mechanisms, however, are uncertain in the Arctic, limiting our ability to infer past vegetation and hydrology changes. To address this, we produced terrestrial plant n-alkanoic acid and n-alkane abundance data along with n-alkanoic acid δ13C and δ2H data from a latitudinal environmental gradient along the Eastern Canadian Arctic (105 individuals), which we combined with published data from across the Arctic (additional 281 individuals). We compared this plant wax dataset to environmental parameters, including temperature, precipitation amount, relative humidity, latitude, and elevation, to assess the mechanisms that govern plant-wax production and isotope fractionation. We found that total plant wax concentrations and Average Chain-Length (ACL) were statistically different between vascular (trees, shrubs, forbs, ferns, graminoids) and non-vascular plants (mosses, liverworts) and lichens, whereas δ13C values and δ2H apparent fractionation relative to growing season precipitation δ2H often did not differ significantly between plant growth forms. Correlations between plant wax indices and mean of the months above freezing (MAF) environmental parameters were generally weak (r ≤ 0.4) and/or not significant (p ≥ 0.05). These results suggest that a fundamental assumption to paleoclimate research holds in the Arctic: for individual terrestrial plant taxa and plant communities, the abundance, ACL, and δ13C δ2H isotopic fractionation of both n-alkanoic acids and n-alkanes is independent of local environmental parameters. Instead, changes in terrestrially-derived sedimentary plant wax distributions reflect changes in plant taxa present through time, and changes in terrestrially-derived plant wax δ2H reflect changes in precipitation δ2H. Therefore, plant waxes can be used to infer past changes in climate and ecology.
- Article
(3783 KB) - Full-text XML
-
Supplement
(934 KB) - BibTeX
- EndNote


Anthropogenic activities are driving rapid climate change and associated environmental changes in the Arctic, which are projected to continue through the end of this century (IPCC, 2023). These changes include increasing temperatures, increasing precipitation amount, and altered precipitation seasonality, as well as the northward expansion of lower-latitude vegetation into Arctic tundra biomes (Bintanja and Selten, 2014; Box et al., 2019; Elmendorf et al., 2012). Plant waxes and their compound-specific stable isotopes are valuable tracers of past ecological and hydrological change in sedimentary archives (Liu et al., 2022; Sachse et al., 2012), providing crucial analogues for environmental changes observed today. Interpretations of changes in these proxies over time are often based on our understanding of plant waxes produced by modern vegetation across a wide range of plant types and growing conditions. However, these modern datasets and our understanding of factors like chemotaxonomy and environmental conditions that influence plant wax proxies are primarily derived from temperate and tropical vegetation (Bush and McInerney, 2013; Diefendorf and Freimuth, 2017; Gao et al., 2014; Sachse et al., 2006). Expanding these modern datasets into Arctic biomes will improve our ability to reconstruct past Arctic environmental change using sedimentary plant waxes.
Plant waxes, including n-alkanoic acid and n-alkane compounds, are straight-chain hydrocarbons (carbon chain-length ≥ 20) produced on the surfaces of plants to regulate moisture balance and ultraviolet light absorption (Eglinton and Hamilton, 1967; Post-Beittenmiller, 1996; Yeats and Rose, 2013). The distribution of plant wax carbon chain-lengths in modern terrestrial vegetation may be specific to different plant types (Baas et al., 2000; Bush and McInerney, 2013; Ficken et al., 2000; Liu et al., 2022). For example, in a synthesis of 87 geographically-diverse published datasets, Bush and McInerney (2013) demonstrated that Sphagnum mosses generally produce a greater portion of mid-chain C23 and C25 n-alkanes whereas trees, woody plants and grasses produce more long-chain C27, C29, and C31 n-alkanes. Liu et al. (2022) also found significant differences in plant wax chain-length distribution indices, such as Average Chain-Length (ACL) and C29 (C29 + C31) between globally-distributed woody and non-woody terrestrial vascular plants. However, this relationship may not be as robust in Arctic vegetation communities. In the Arctic, shrubs (e.g., Betula sp.) and graminoids (e.g., Carex sp.) produce a substantial portion of mid-chain n-alkanes and n-alkanoic acids (Berke et al., 2019; Dion-Kirschner et al., 2020; Hollister et al., 2022). These findings complicate the interpretation of Arctic plant wax chain-length distributions in sedimentary archives.
The ratios of modern plant wax compound-specific stable carbon (δ13C) and hydrogen (δ2H) isotopes also vary between plant growth forms. Terrestrial plant wax carbon is sourced from atmospheric CO2, with biosynthesis fractionating against the heavier isotope, 13C. The difference in carbon isotope fractionation between more 13C-depleted (lower δ13C values) C3 (more 13C-depleted) and more 13C-enriched (higher δ13C values) C4 (less 13C-depleted) photosynthetic pathways has been well documented, and is commonly used to reconstruct past vegetation change between these two broad plant community types (Cerling and Harris, 1999), although C4 plants do not occur at high latitudes. Diefendorf and Freimuth (2017) also noted variations in plant wax δ13C between growth forms within the same photosynthetic pathway: C3 trees are 13C-enriched compared to C3 shrubs and forbs.
Similarly, terrestrial plant wax hydrogen is sourced from meteoric water stored in the soil. This source water experiences fractionation during evaporation in soil and within the plant, and subsequently during biosynthesis (Sachse et al., 2012). The net apparent fractionation (ϵapp) between source water and plant wax δ2H values incorporates all of these fractionation processes as well as geographical variation in precipitation δ2H values. ϵapp also varies between plant growth forms sampled from the same locale, likely due to physiological differences in water use efficiency and metabolic pathways (Gao et al., 2014; Kahmen et al., 2013b; Saishree et al., 2023). Understanding these fractionation differences between plant types in both carbon and hydrogen stable isotope systems is critical for disentangling past vegetation change from other reconstructed climatic parameters.
Environmental factors, including temperature, total precipitation amount, and relative humidity, may also affect how individual plant taxa produce different plant wax chain-lengths and fractionate stable carbon and hydrogen isotopes. For example, positive relationships exist between ACL and mean annual temperature within certain Acer sp. and Juniperus sp. trees along the eastern United States (Tipple and Pagani, 2013). Similarly, the ACL of Acacia sp. and Eucalyptus sp. are significantly correlated to annual precipitation amount and relative humidity in northern Australia; though the former relationship was positive and the latter negative (Hoffmann et al., 2013). Plant wax δ13C has a negative relationship with precipitation amount across a global range of biomes (Diefendorf et al., 2010). Additionally, ϵapp in Chinese monocot and dicot plants also has negative relationships with annual precipitation amount (Liu et al., 2023).
Variations in plant wax data, both between plant growth forms and within individual taxa across environmental gradients, create more uncertainty in paleoclimate reconstructions when both taxonomic and environmental factors are not well constrained for a particular study area. For example, based on the findings described above, a change in ACL over time could represent either a change in the local plant community or a stable plant community responding to environmental change. Describing whether these plant wax indices respond to plant community and/or to environmental change along modern environmental gradients in the Arctic will provide clarity when interpreting sedimentary plant wax data.
The Eastern Canadian Arctic (ECA), including Baffin Island, Nunavut and Nunavik, northern Quebec, contains a strong latitudinal climate gradient within which environmental controls on plant wax production and stable isotope fractionation may be assessed. This gradient is heavily influenced by regional oceanic currents (Briner et al., 2006). The West Greenland Current delivers warm, saline, subarctic water from the lower latitudes in the North Atlantic up the southwest coast of Greenland and curls westward across Davis Strait and back down along southeastern Baffin Island towards Newfoundland and Labrador, creating a warmer, sub-Arctic climate in that region (Münchow et al., 2015). The Baffin Island Current brings cold, polar water from the Arctic Ocean through the Nares Strait and the Canadian Archipelago, then along the northeastern coast of Baffin Island, resulting in an arid, polar climate north of Davis Strait (Rudels, 2011). Modern sea ice extends out to the Labrador Sea during the early spring maximum and retreats north of Baffin Island past the Nares Strait during the late summer minimum (Akers et al., 2020). These conditions produce strong latitudinal temperature and precipitation gradients within the ECA, which are reflected in distinct bioclimate subzones (Fig. 1b) where sub-Arctic conifers and low Arctic shrub communities are limited to the south, and cryptogam-rich high Arctic tundra becomes the dominant vegetation community in the north (Walker et al., 2005).
In this study, we analyzed the chain-length distributions of plant wax n-alkanoic acids and n-alkanes along with the δ13C and δ2H of n-alkanoic acids from terrestrial vascular (trees, shrubs, forbs, ferns, graminoids) and non-vascular plants (mosses, liverworts) and lichens collected across the ECA. We combine this new dataset with a compilation of published modern Arctic plant wax datasets, which also spans substantial gradients in latitude, temperature, precipitation amount, relative humidity, and elevation while focusing the analysis to areas including and north of the boreal forest. We examined whether variations in Arctic terrestrial plant wax data were primarily driven by individual plant growth forms responding to their environmental conditions, or by differences in plant wax synthesis between growth forms. Evaluating these two potential drivers of modern Arctic plant wax variability is essential for assessing whether sedimentary plant waxes record or respond to past environmental change. In the context of this study, “recording” refers to plants not changing their plant wax production, or stable isotope fractionation (i.e., an individual always produces the same chain-length distributions and fractionates source water hydrogen isotopes to the same degree). Plants “responding” to their environment means the opposite, where different climate settings alter an individual's plant wax properties.
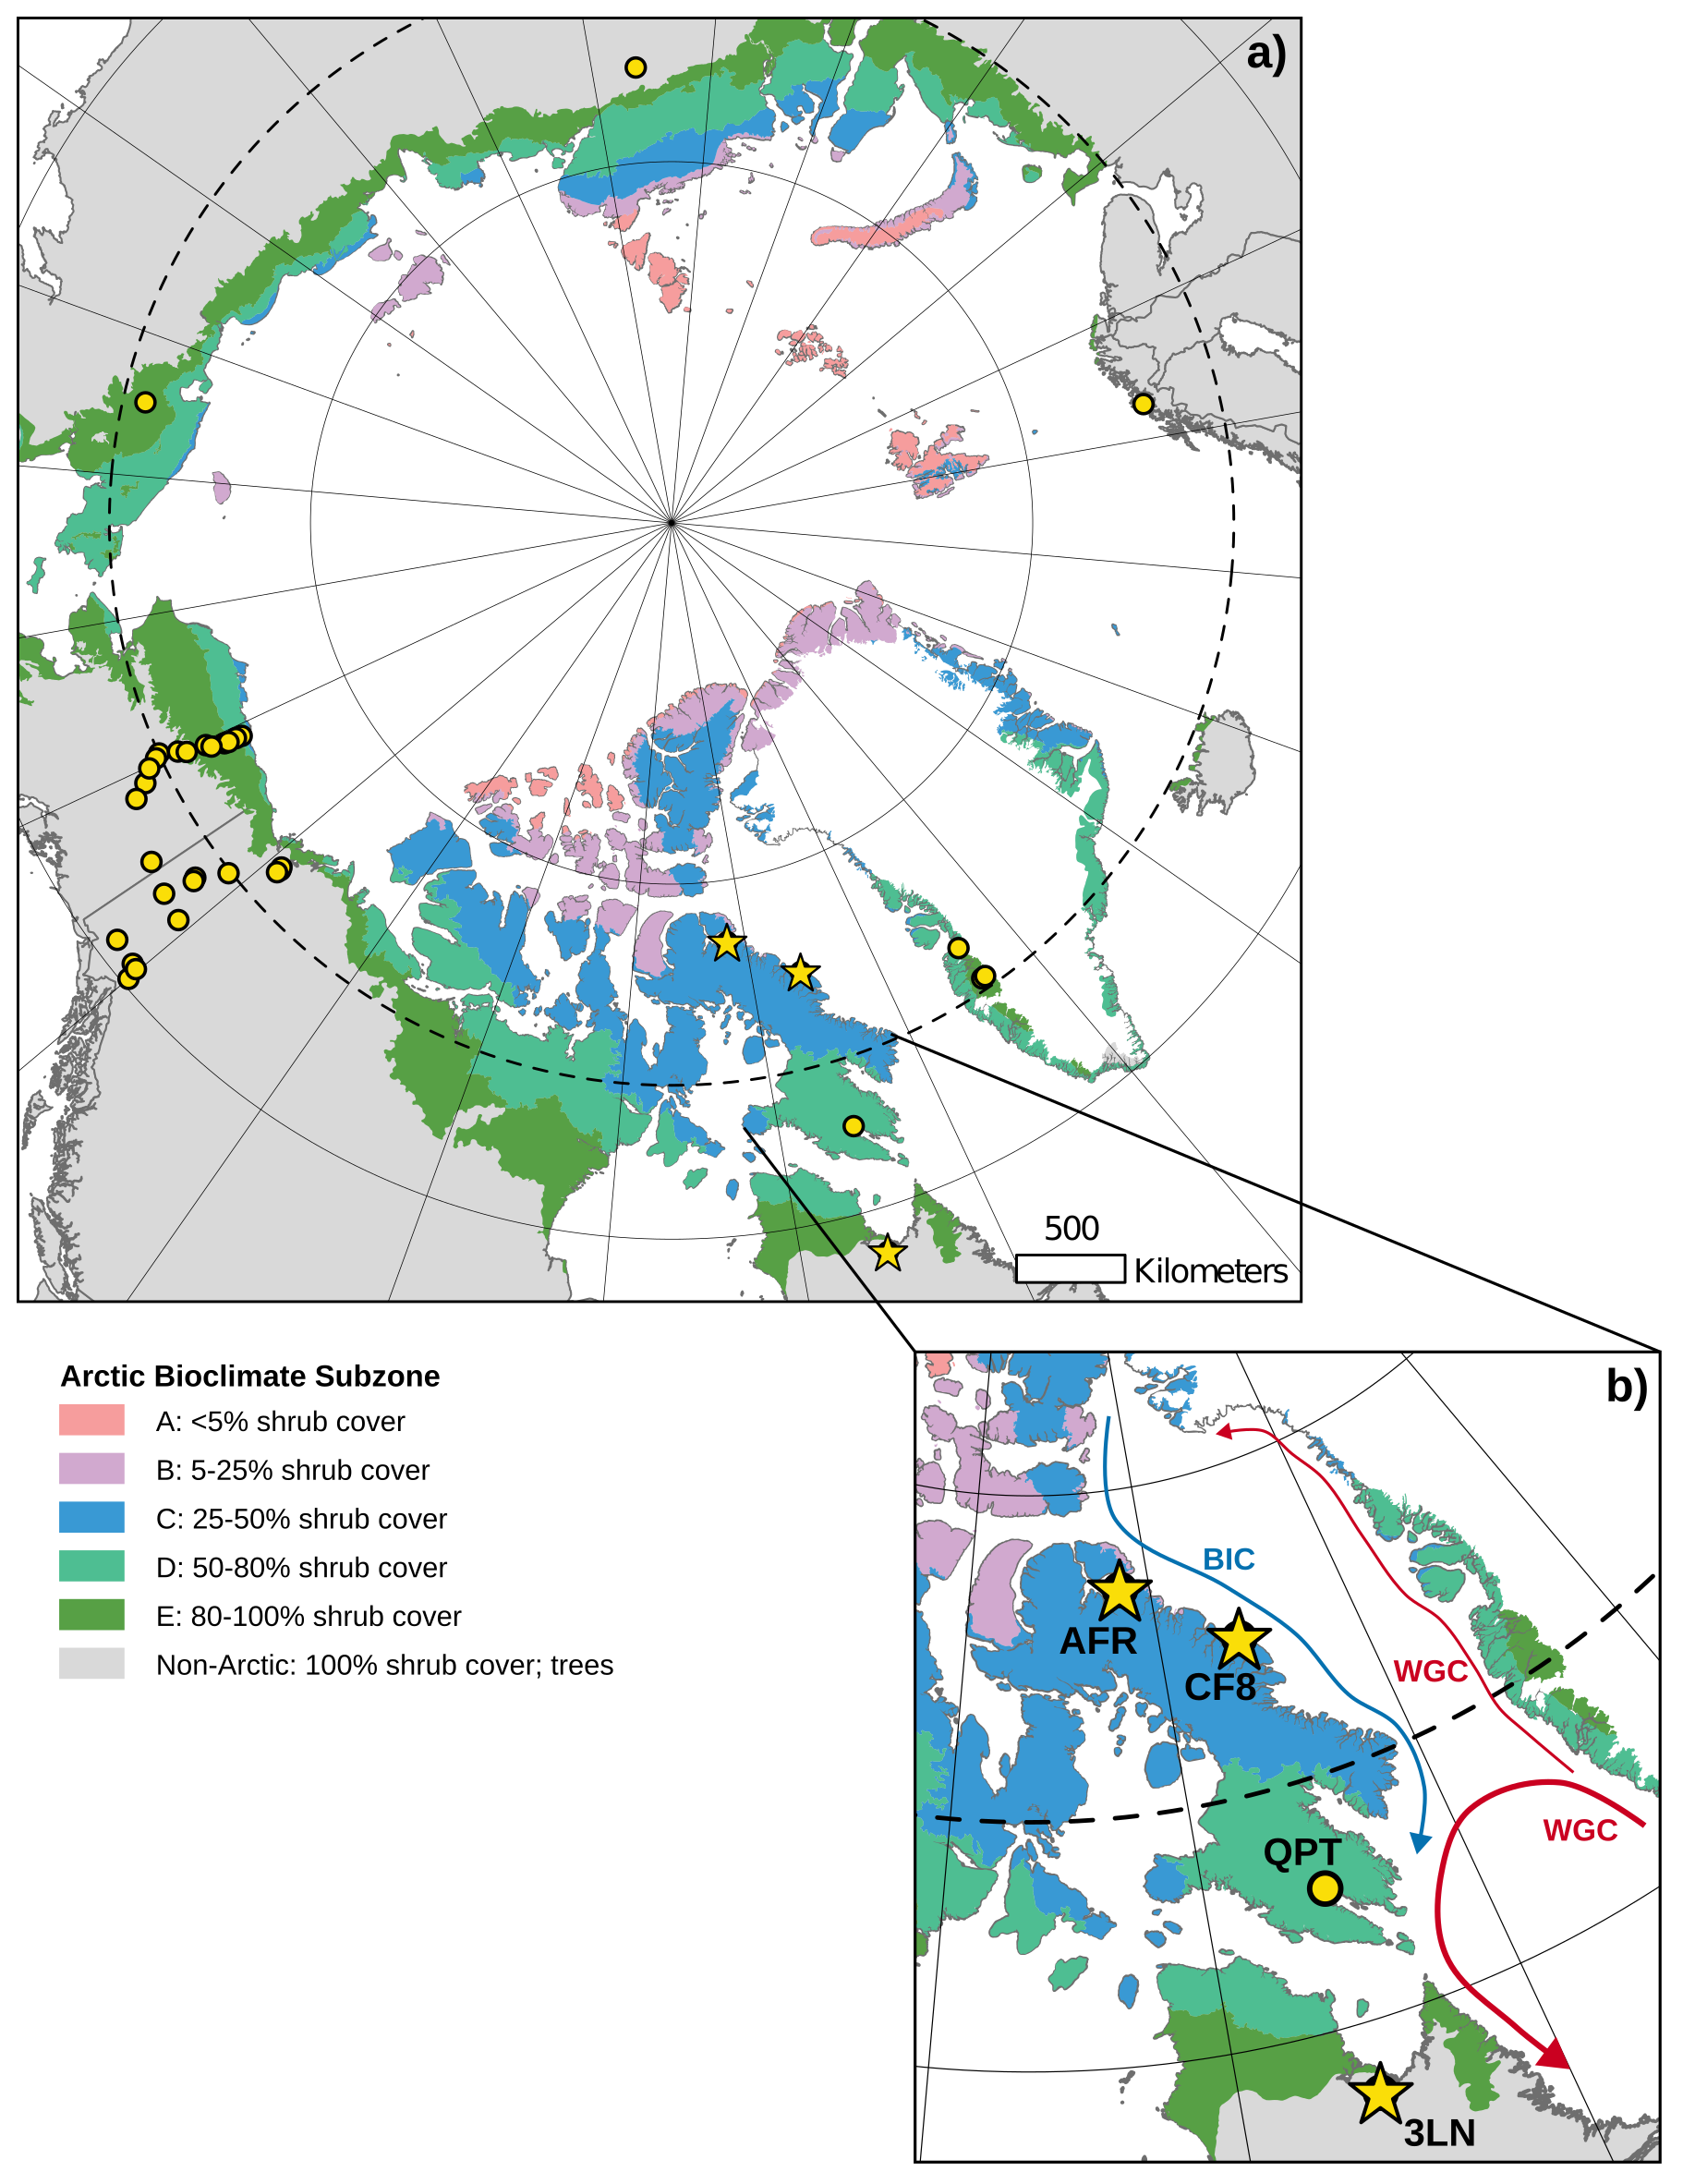
Figure 1(a) Map of the circumpolar Arctic showing terrestrial plant sampling location for this study (yellow stars) and compiled, published datasets (yellow circles). (b) Enhanced view of Eastern Canadian Arctic (ECA) sampling locations. The blue arrow shows the flow of relatively cold water in the Baffin Island Current (BIC) and the red arrows show the flow of relatively warm water in the West Greenland Current (WGC). Shaded regions in both panels represent different Arctic bioclimate subzones (A–E; Non-Arctic) as defined by the Circumpolar Arctic Vegetation Map (Walker et al., 2005).
2.1 Study Area: Eastern Canadian Arctic and High-Latitude Data Compilation
We collected 105 terrestrial plant samples for plant wax analysis across three lake catchments spanning 14 degrees of latitude in the ECA during summer field seasons in 2019 and 2021 (Fig. 1b). Lake Africa (AFR; Informal name; 72.42° N, 77.44° W; 895 m a.s.l.) is located in northern Baffin Island and represents our northernmost sampling location in this study. Due to its high elevation, AFR resides in bioclimate subzone A and its catchment is dominated by mats of liverworts, mosses, and lichen and contains only one vascular plant species, a grass, Phippsia algida. Lake CF8 (Informal name; 70.56° N, 68.95° W; 195 m a.s.l.) is located in the Clyde Foreland of northeastern Baffin Island and is characterized as bioclimate subzone C. While lichens and cryptogam mats are still the most common vegetation types in the catchment, prostrate dwarf shrubs (e.g., Cassiope tetragona) and graminoids (e.g., Luzula confusa) are also present (Thomas et al., 2023). Lake 3LN (Informal name; 58.10° N, 68.46° W; 61 m a.s.l.) is on the Canadian mainland in the Nunavik region of northern Quebec. In contrast to the previous two lakes, Lake 3LN is south of the tree line and is classified as a sub-Arctic bioclimate. The catchment contains a wide variety of vascular plant vegetation, including trees (Larix laricinia, Picea mariana), shrubs (e.g., Betula glandulosa, Rhododendron sp., Salix sp., Alnus viridis), and graminoids (e.g., Carex sp., Eriophorum sp.). Bryophytes are also present in wetter areas of the catchment and are dominated by Pleurozium schreberi and Sphagnum sp. We also include previously published terrestrial plant wax data from Lake Qaupat (QPT; 63.68° N, 68.20° W; 33 m a.s.l.) in southern Baffin Island for this ECA transect (Hollister et al., 2022). Positioned in bioclimate subzone D, the Lake QPT catchment is dominated by Betula glandulosa and Salix sp. shrubs, similar to Lake 3LN, but does not contain any trees. The ECA transects included 139 plant samples across seven major plant growth forms; trees (n = 6), shrubs (n = 43), forbs (n = 1), graminoids (n = 17), mosses (n = 36), liverworts (n = 18), and lichens (n = 18).
To expand the sample size and range of environmental conditions, we compiled published plant wax data from terrestrial plants from sampling sites across the entire Arctic; within the latitude range spanned by the ECA transect (Fig. 1a). Regions added in this compilation include: west Greenland (Berke et al., 2019; Dion-Kirschner et al., 2020; Thomas et al., 2016), northern Norway (Balascio et al., 2018), northern Russia (Wilkie et al., 2013; Zibulski et al., 2017), and Alaska/Yukon/Northwest Territories (Bakkelund et al., 2018; Daniels et al., 2017; O'Connor et al., 2020). This compilation increased the number of unique sampling/environmental locations to 36, increased the total plant wax sample count to 386, and added ferns to the list of plant growth forms in this study; trees (n = 18), shrubs (n = 183), forbs (n = 17), ferns (n = 15), graminoids (n = 52), mosses (n = 63), liverworts (n = 18), lichens (n = 20). Different studies reported different types of plant wax data, and most studies only reported one plant wax compound class and/or one stable isotope, which limits the sample size for some analyses of individual plant wax data types (Table S1). Compiled stable isotope data had to be accompanied by the concentration or relative abundance of each chain-length in order to calculate amount-weighted average values for each sample (Sect. 2.3).
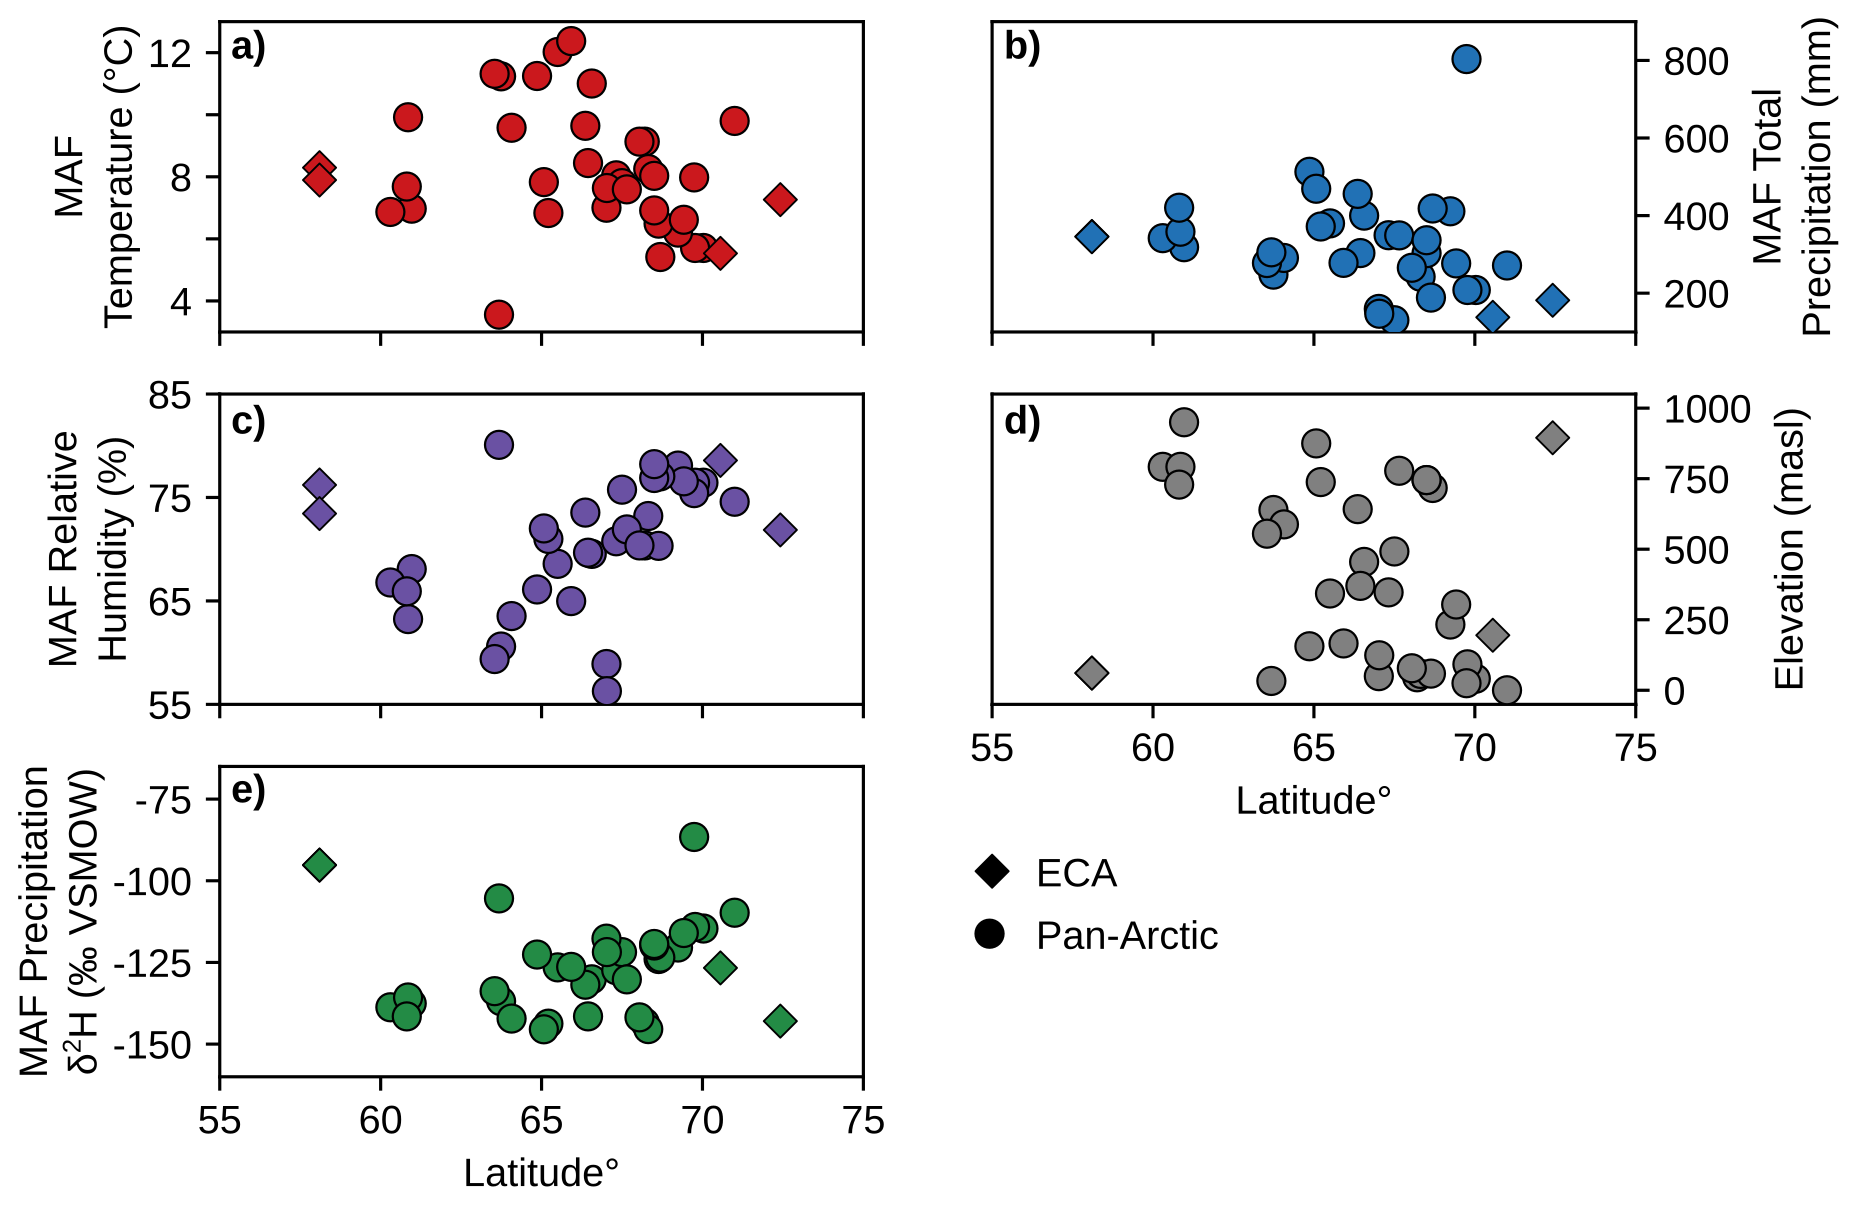
Figure 2Scatterplots of environmental parameters for the Months Above Freezing (MAF) for each unique pan-Arctic sampling location (Fig. 1) and sampling year. (a) Mean temperature. (b) Total precipitation amount. (c) Mean relative humidity % derived from dew point and temperature (Eq. 1). (d) Site elevation (meters above sea level; m a.s.l.) (e) Amount-weighted mean precipitation isotope δ2H values. ECA sampling sites from this study (AFR, CF8, 3LN) are plotted as diamonds and all other pan-Arctic sites are plotted as circles. Temperature, precipitation, and relative humidity data in panels (a)–(c) are sourced from ERA5 reanalysis (Hersbach et al., 2020). Precipitation δ2H in panel (e) is sourced from the Online Isotopes in Precipitation Calculator (Bowen and Revenaugh, 2003; Bowen et al., 2005).
2.2 Environmental Parameters and Precipitation Isotopes
We used ERA5 reanalysis (Hersbach et al., 2020) as our data source for climate parameters at each sampling location and sampling year, including monthly temperature (Fig. 2a), precipitation amount (Fig. 2b), and relative humidity (Fig. 2c). Plant waxes are produced yearly by individual plants, primarily during peak leaf flush in the early part of the growing season (Tipple et al., 2013), and therefore closely reflect the environmental conditions of the year they were sampled. The Arctic growing season, during which plant waxes are produced, is limited by the duration of temperatures above freezing (Bakkelund et al., 2018). Therefore, we express the growing season environmental conditions of each plant sample as the mean of the months above freezing (MAF) for individual sampling years. Because ERA5 data can be extracted for the grid cell containing each study site, they are preferable to station data, which in the ECA study area are few in number and all coastal, leading to discrepancies due to differences in distance, elevation, and other features (Gorbey et al., 2022). Since relative humidity (RH) is not directly provided by ERA5, we calculated it for each month using ERA5 temperature (T) and dew point temperature (Dp) in Eq. (1) (Alduchov and Eskridge, 1996). We also compared plant wax indices to sample site latitude and elevation (Bakkelund et al., 2018; O'Connor et al., 2020), which was reported in all compiled publications (Fig. 2d).
We calculated MAF average amount-weighted precipitation isotope δ2H (Fig. 2e) using monthly average δ2H from the Online Isotopes in Precipitation Calculator (OIPC; Bowen et al., 2005; Bowen and Revenaugh, 2003) and ERA5 precipitation amount. We justify our use of MAF precipitation δ2H based on several studies which show that shallow Arctic soil water, from which most terrestrial plants obtain their water, generally reflects growing season precipitation without the influence of 2H-depleted snowmelt (Chiasson-Poirier et al., 2020; Daniels et al., 2017; O'Connor et al., 2020; Sullivan and Welker, 2007). This is attributed to the soil still being frozen and impermeable during the snowmelt period, which causes the meltwater to be lost from the system as surface runoff (Woo, 2012). Additionally, variations in Arctic precipitation stable isotope ratios are primarily driven by seasonal changes in temperature and moisture sources, rather than amount-driven fractionation during individual precipitation events (Broadman et al., 2020; Cluett et al., 2021; Dansgaard, 1964; Putman et al., 2017).
2.3 Plant Wax Extraction, Quantification, and Stable Isotope Analysis
We extracted and quantified plant wax n-alkanoic acids and n-alkanes from 105 ECA plant samples using the standard methods of the University at Buffalo Organic and Stable Isotope Biogeochemistry Laboratory (Hollister et al., 2022). We measured n-alkanoic acid (C20 to C32) and n-alkane (C21 to C33) chain-length concentrations (µg g−1 dried plant) using a Trace 1310 Gas Chromatograph-Flame Ionized Detector (GC-FID), with dual AI 1310 autosamplers and 30 m HP-1MS fused silica columns. We derived chain-length concentrations from GC-FID peak areas using external calibration curves of C28 n-alkanoic acids and C29 n-alkanes. We also measured for sample recovery during the full extraction and instrumental analysis processes using internal monounsaturated cis-eicosenoic n-alkanoic acid (C20,1) and C36 n-alkane standards. We examined the overall distributions of plant wax chain-lengths by calculating the Average Chain-Length (ACL; Eqs. 2, 3) for each sample (Bray and Evans, 1961; Bush and McInerney, 2013). We calculated the Carbon Preference Index (CPI; Eqs. 4, 5) to describe the difference in production of even vs. odd and odd vs. even chain-lengths in n-alkanoic acids and n-alkanes, respectively (Marzi et al., 1993). CPI was not calculated for samples where the total abundance of chain-lengths in the denominator was equal to zero, either due to compounds being too small to quantify or not being reported in other publications (i.e., no odd-chain n-alkanoic acid data available).
We measured the compound-specific stable carbon (δ13C) and hydrogen (δ2H) isotope ratios of C22 through C28 even-chain n-alkanoic acid chain-lengths in a subset of the ECA plant samples using the methods described in Hollister et al. (2022). Stable isotope analysis was conducted in the University at Buffalo Organic and Stable Isotope Biogeochemistry Laboratory using a Thermo Delta V+ Isotope Ratio Mass Spectrometer (IRMS) with a split/splitless injector and a TriPlus RSH autosampler, connected to the IRMS via IsoLink II and Conflo IV with all samples and standards run in triplicate. Within each IRMS sequence, we ran standards of C20 and C28 n-alkanoic acids to calibrate sample δ13C results to the Vienna Pee Dee Belemnite (VPDB) scale and calibrate δ2H results to the Vienna Standard Mean Ocean Water (VSMOW) scale. These C20 and C28 standards were also used to correct for chromatogram peak size linearity. Additionaly, we used standards of C18 and C24 n-alkanoic acids to correct for instrument drift in each sequence. For δ2H analysis, we measured the H factor at the beginning of each IRMS sequence. Sequences run in the Fall of 2022 had H factors ranging from 4.873 ± 0.025 to 5.005 ± 0.038 (mean ± 1σ) and H factors in sequences run during the Summer of 2023 ranged from 3.400 ± 0.055 to 3.509 ± 0.016. We reported δ13C and δ2H uncertainty as the Standard Error of the Mean (SEM), accounting for uncertainty from instrument analysis and triplicate measurements of each sample. SEM uncertainty ranged from 0.1 ‰ to 0.6 ‰ with an average of 0.2 ± 0.1 ‰ for δ13C and 3.1 ‰ to 9.4 ‰ with an average of 4.2 ± 1.3 ‰ for δ2H. We calculated the net apparent δ2H fractionation (ϵapp) between amount-weighted precipitation δ2H values for the months above freezing and plant wax chain-length δ2H (Eq. 6). In Sect. 3, we report plant wax δ13C, δ2H, and ϵapp as the chain-length abundance-weighted averages of C22 through C28 for n-alkanoic acids and C23 through C29 for n-alkanes. Doing so allows us to robustly compare stable isotope values between samples by accounting for the variability in isotope values and concentrations of individual chain-lengths. Average values, hereafter, are expressed as the mean ± 1σ standard deviation.
2.4 Statistical Analyses of Plant Wax Data
We used Shapiro-Wilk tests to determine whether the values of plant wax indices within individual plant growth forms were normally distributed (Shapiro-Wilk test p-value ≥ 0.05). We then employed Mann-Whitney U tests to evaluate whether chain-length or stable isotope values of different plant groups were significantly different (Mann-Whitney U test p-value < 0.05). We also used Pearson correlations to evaluate linear relationships between plant wax chain-length and stable isotope indices vs. scalar environmental parameters (latitude, temperature, relative humidity, precipitation amount, elevation). To examine the potential influence of individual plant growth forms in this analysis, we perform multiple Pearson correlations for the same plant wax data type and set of environmental parameters while removing one growth form each time. We compared the resulting Pearson r-values to determine which growth form had the greatest impact on the correlation strength of the entire dataset when removed. For all statistical analyses, we used the averages of replicate species from the same location and sampling year (i.e., three Alnus viridis from Lake 3LN in 2021) to avoid overrepresentation of those samples (Table S2; Bakkelund et al., 2018; Hollister et al., 2022). We required each correlation to have a minimum of three observations per pair of variables. Shapiro-Wilk tests, Mann-Whitney U tests, and Pearson correlations were performed using the associated functions in the SciPy Python package v1.15.2 (Virtanen et al., 2020). These three statistical analyses were only performed on the pan-Arctic dataset due to the larger number of measurements per plant growth form and number of sampling sites for environmental comparisons.
We used Principal Component Analysis (PCA) to determine the primary modes of variability across all plant wax chain-length distributions (i.e., even-chain C20 to C32 n-alkanoic acids and odd-chain C21 to C33 n-alkanes). Plant wax chain-length relative abundance data naturally has a correlation bias because the relative abundances of all chain-lengths are constrained to a constant sum (Gloor et al., 2017). To address this, we apply a centered log-ratio (clr) transformation (Aitchison, 1982) on the plant wax chain-length data prior to PCA. Chain-length concentrations of 0 µg g−1 dry plant, either because chromatogram peaks were below the limit of detection or were not reported in other publications, were not compatible when calculating the sample’s geometric mean for clr (Martín-Fernández et al., 2003). We replaced concentration values of zero with a small number equal to where N is the number of plant wax chain-lengths used for PCA (Martín-Fernández et al., 2003). PCA was conducted using the decomposition.PCA() function from the Scikit-learn project (Pedregosa et al., 2011). We performed PCA on plant wax data from all ECA lakes (AFR, CF8, QPT, 3LN) and the pan-Arctic dataset.
3.1 Plant Wax Chain-Length Abundances
We quantified plant wax n-alkanoic acid chain-length concentrations in 103 plant samples and n-alkane chain-length concentrations in 101 samples from Lake AFR, CF8, and 3LN in the ECA. Two n-alkanoic acid samples and four n-alkane samples had concentrations that were below GC-FID detection. ECA plant wax chain-length concentrations, per gram of dried plant, were highly variable. Total n-alkanoic acid concentrations ranged from 1.3 to 13 839 µg g−1 with an average of 745 ± 1618 µg g−1 (Fig. 3a), and n-alkane concentrations ranged from 0.5 to 6553 µg g−1 with an average of 625 ± 1100 µg g−1 (Fig. 3b). Shrubs and mosses produced the greatest total concentrations of the two plant wax compounds among vascular and non-vascular growth forms, respectively. Liverworts produced the lowest total plant wax concentrations out of all growth forms. These patterns held true for the pan-Arctic data compilation, though forbs (only n = 1 for the ECA dataset) produced very high concentrations of n-alkanes. Average pan-Arctic total n-alkanoic acid and n-alkane concentrations were 549 ± 1139 and 854 ± 2072 µg g−1, respectively. Some plant growth forms had substantial differences between the total concentrations of each plant wax compound. For example, ECA trees produced an average of 1297 ± 934 µg g−1 n-alkanoic acids but only 47.9 ± 18.5 µg g−1 n-alkanes, while lichens produced 46.6 ± 54.4 µg g−1 n-alkanoic acids but 546 ± 888 µg g−1 n-alkanes. Shapiro-Wilk tests showed that all but one plant growth form in each compound class, shrub n-alkanoic acids and fern n-alkanes, were log-normally distributed (Table S3). Mann-Whitney U tests showed that total plant wax n-alkanoic acid and n-alkane concentrations of shrubs and lichens were significantly different from most other plant growth forms (Fig. 4a, b).
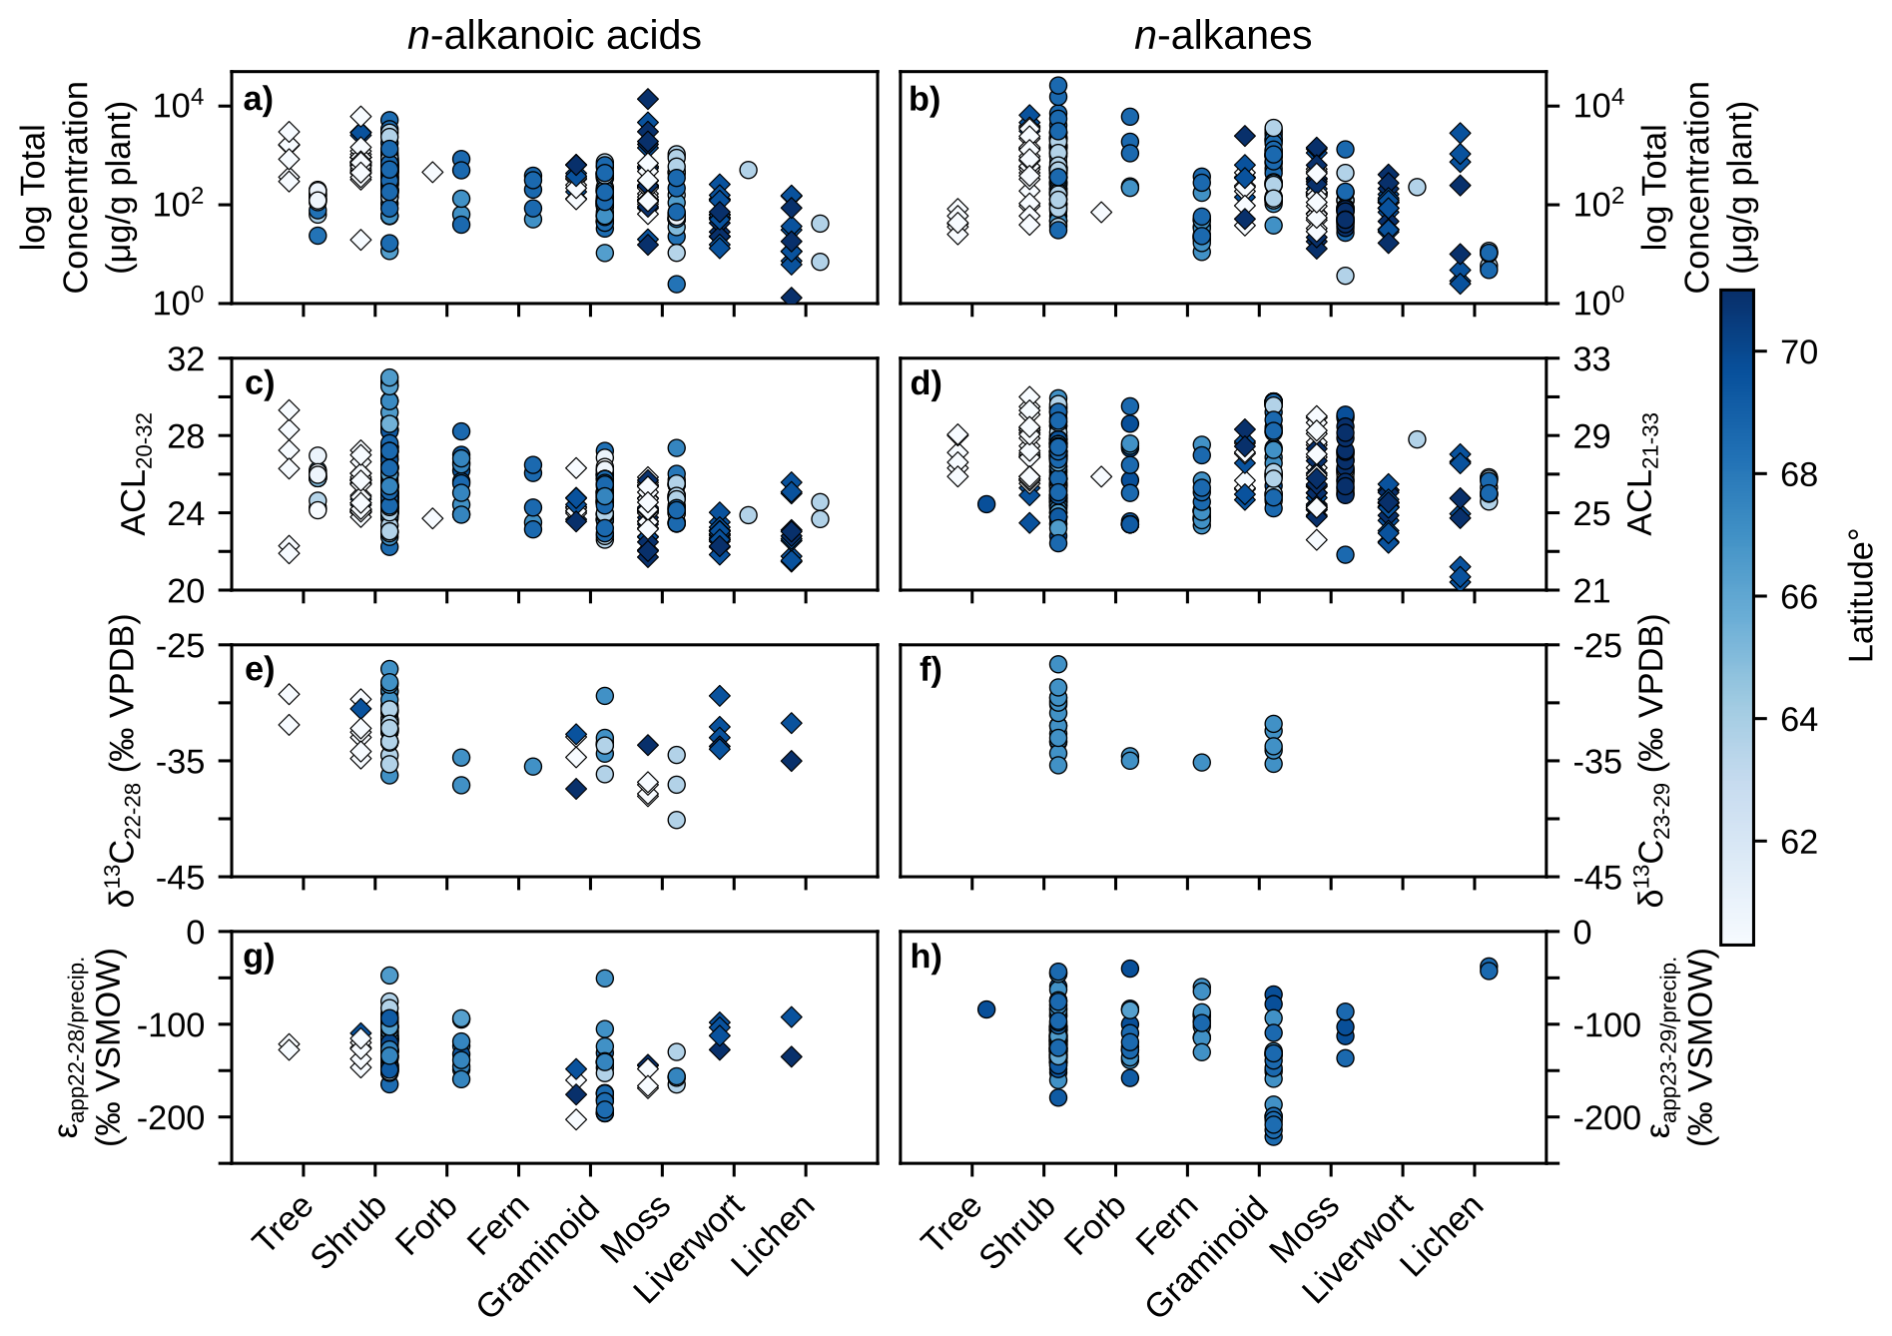
Figure 3Scatterplots of plant wax results from this study (diamonds) and the pan-Arctic data compilation (circles) grouped by plant growth form. Left column panels (a, c, e, g) contain n-alkanoic acid results, right column panels (b, d, f, h) contain n-alkane results. (a–b) Log total plant wax concentration. (c–d) Plant wax ACL. (e–f) Plant wax δ13C. (g–h) Plant wax ϵapp relative to amount-weighted MAF precipitation δ2H. Data points are shaded by sampling site latitude.
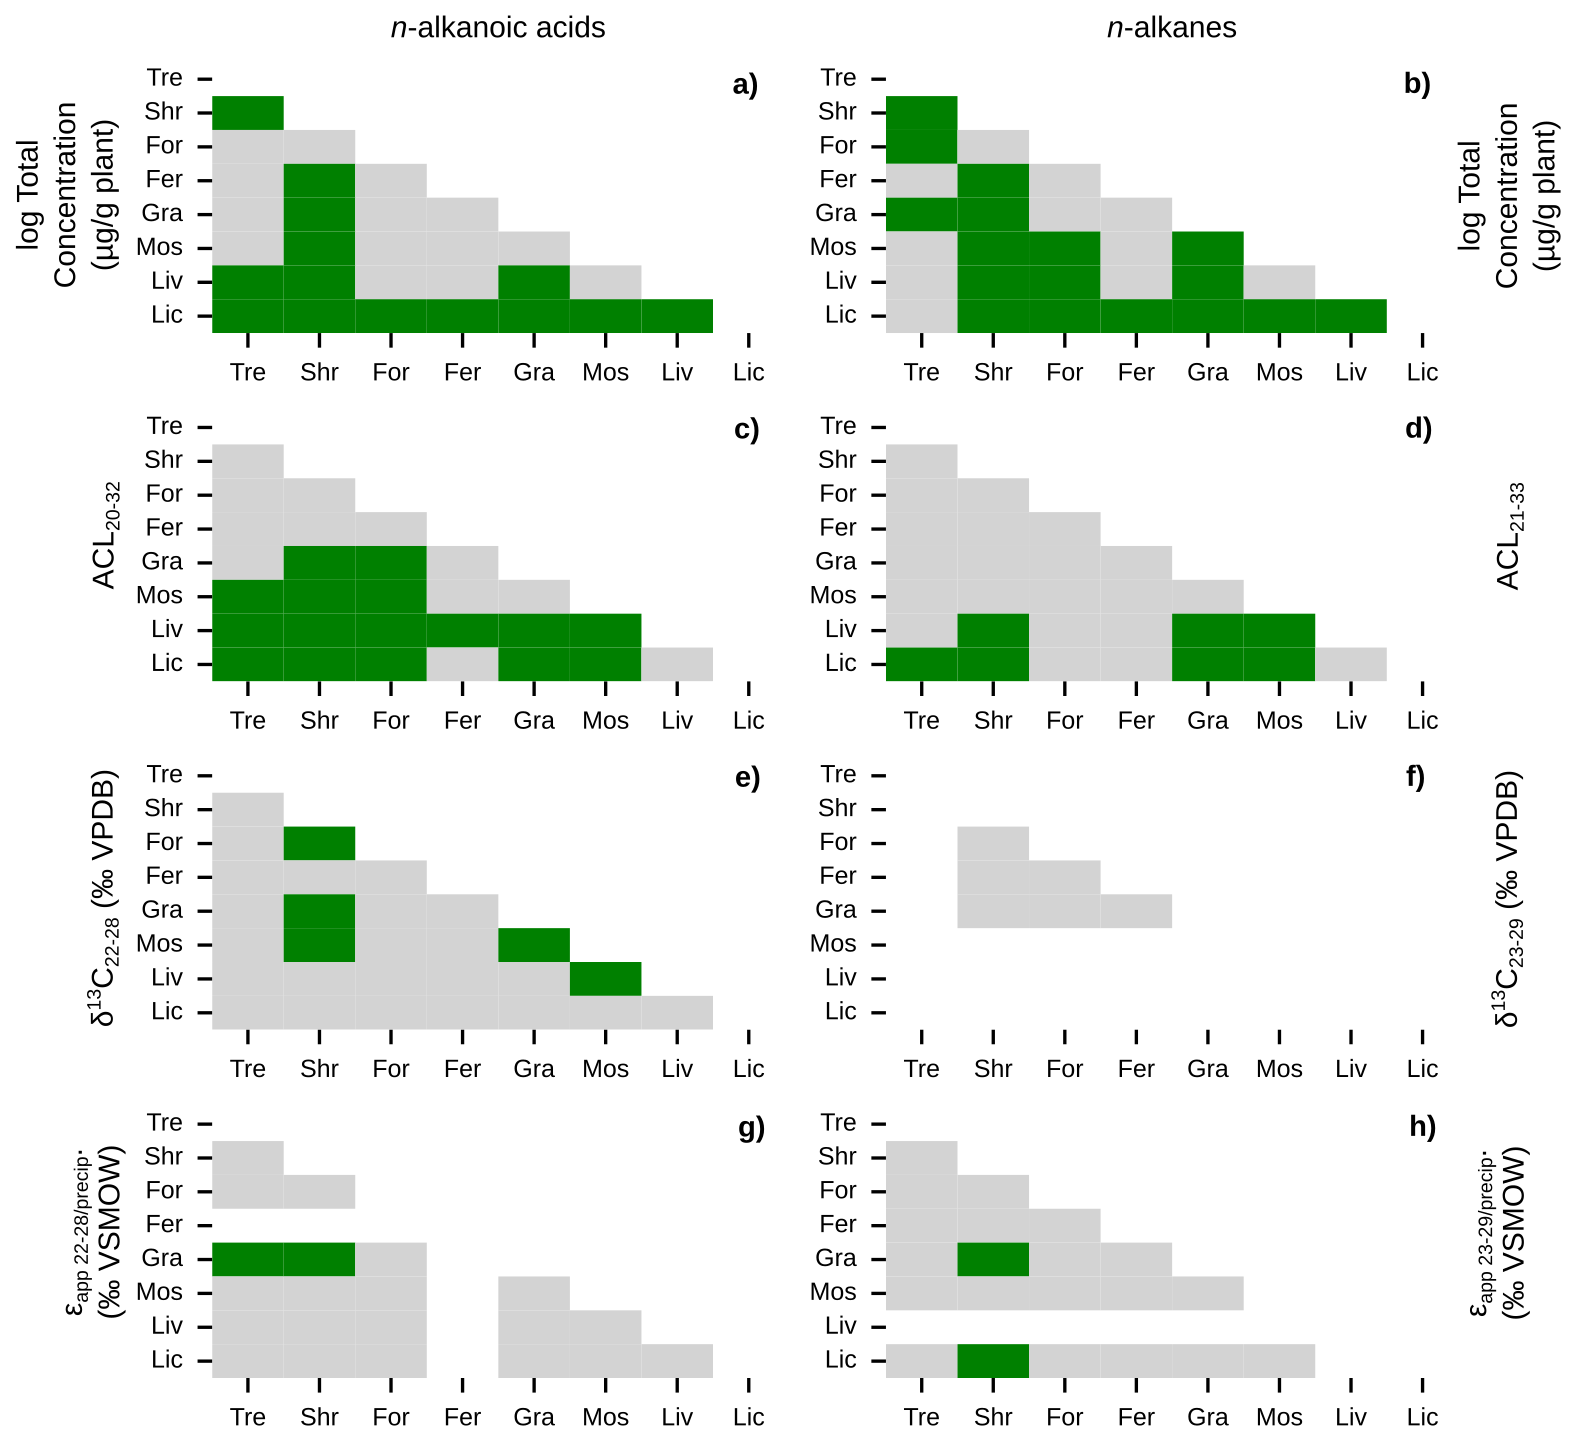
Figure 4Similarities of plant wax data between plant growth forms. Matrices of Mann-Whitney U test p-values between pan-Arctic plant wax indices of major plant growth forms (Tre = trees, Shr = shrubs, For = forbs, Fer = ferns, Gra = graminoids, Mos = mosses, Liv = liverworts, Lic = lichens). Left column panels (a, c, e, g) use plant wax n-alkanoic acid data and right column panels (b, d, f, h) use plant wax n-alkane data. (a–b) Total plant wax concentration. (c–d) Plant wax ACL. (e–f) Plant wax δ13C. (g–h) Plant wax ϵapp relative to MAF precipitation amount-weighted δ2H. Green cells represent p-values < 0.05, indicating the two datasets are significantly different from each other, grey cells represent p-values ≥ 0.05, and white cells indicate that there was no data to perform the test on.
We calculated ACL and CPI using the full range of plant wax chain-lengths measured; C20–C32 for n-alkanoic acids, C21–C33 for n-alkanes. ACL in ECA terrestrial plant wax n-alkanoic acid samples ranged from 21.5 to 29.3 with an average of 24.2 ± 1.5 (Fig. 3c), and n-alkane ACL ranged from 21.4 to 31.0 with an average of 26.9 ± 1.9 (Fig. 3d). Trees and shrubs produced the greatest proportion of longer chain-lengths, overall, for both compound classes while liverworts and lichens produced the most mid-chain waxes. However, some trees and shrubs, such as Picea mariana, Cassiope tetragona, and Betula glandulosa, did produce high relative abundances of mid-chain waxes. Average pan-Arctic n-alkanoic acid and n-alkane ACL were 24.9 ± 1.7 and 27.2 ± 1.9, respectively. Shrubs were the only plant growth form with a non-normal distribution of n-alkanoic acid ACL values, whereas only half of the plant growth forms had normally-distributed n-alkane ACL values (Fig. 3c, d). Liverwort and lichen ACL values were the most significantly different among plant growth forms (Fig. 4c, d). Distributions of n-alkanoic acid ACL in all non-vascular growth forms were significantly different from trees, shrubs, and forbs (Fig. 4c). CPI in ECA terrestrial plants was highly variable, ranging from 1.5 to 135 with an average of 12.7 ± 20.4 for n-alkanoic acids (Fig. S1a) and from 0.8 to 44.8 with an average of 5.0 ± 6.6 for n-alkanes (Fig. S1b). Trees and lichens had both the highest mean CPI values and variability in both the ECA and pan-Arctic datasets, while liverworts had the lowest CPI values overall. Within the pan-Arctic dataset, all n-alkanoic acid samples had CPI values ≥ 1 and 98 % were ≥ 2, while 93 % of n-alkane CPI values were ≥ 1 and 74 % were ≥ 2.
3.2 Plant Wax δ13C
We measured even-chain n-alkanoic acid (C22 through C28) δ13C in 25 ECA plants. Hereafter, we refer to δ13C results as the concentration-weighted average of those chain-lengths (C23 through C29 for n-alkanes in other datasets). ECA n-alkanoic acid δ13C ranged from −38.1 ‰ to −29.3 ‰ with an average of −33.5 ± 2.5 ‰ (Fig. 3e). Pan-Arctic n-alkanoic acid δ13C ranged from −40.1 ‰ to −27.1 ‰ with an average of −33.0 ± 2.6 ‰ and n-alkane δ13C ranged from −35.4 ‰ to −26.7 ‰ with an average of −32.2 ± 2.3 ‰. The range in ECA n-alkanoic acid δ13C between chain-lengths within an individual sample was an average of 3.2 ± 2.3 ‰, which was greater than the average ranges in pan-Arctic n-alkanoic acids (2.6 ± 1.9 ‰) and n-alkanes (1.3 ± 0.6 ‰). In both the ECA and pan-Arctic n-alkanoic acid datasets, trees were the most 13C-enriched and mosses were the most 13C-depleted. The pan-Arctic data compilation included n-alkane δ13C only for shrubs, forbs, ferns, and graminoids. Among these four growth forms, shrubs were the most 13C-enriched and ferns were the most 13C-depleted (Fig. 3f). Shapiro-Wilk tests were limited by many growth forms not having enough measurements (n<3) in each compound class. All growth forms that did have enough measurements were normally distributed (Table S1). Shrub and moss n-alkanoic acid δ13C were the most significantly different from other plant growth forms (Fig. 4e). No growth forms had significantly different distributions of n-alkane δ13C (Fig. 4f).
3.3 Plant Wax δ2H and ϵapp
We measured even-chain n-alkanoic acid δ2H, across the same chain-length range as δ13C, in 24 ECA plants. One sample that was first analyzed for δ13C did not have sufficient plant wax material remaining to also measure δ2H. Again, we refer to the δ2H and ϵapp results as the chain-length concentration-weighted average value in each plant sample. The individual sample range in ECA n-alkanoic acid δ2H between chain-lengths was an average of 31.5 ± 18.3 ‰, which was greater than the average range in pan-Arctic n-alkanoic acids (25.3 ± 14.3 ‰) and n-alkanes (17.0 ± 13.4 ‰). In the pan-Arctic dataset using all plant growth forms, we found that n-alkanoic acid δ2H had a weak, positive correlation (r = 0.25; p = 0.02) with MAF precipitation δ2H (Fig. S2a), while n-alkane δ2H had a moderate, positive correlation (r = 0.64; p<0.01) with MAF precipitation δ2H (Fig. S2b). When removing the data from Hollabåttjønnen Bog in northern Norway (Balascio et al., 2018), however, the correlation between n-alkane δ2H and precipitation δ2H became weakly negative and not statistically significant (r = −0.18; p = 0.13). Additionally, the two plant wax compound-specific δ2H datasets do not represent the same samples/sampling locations, with the lack of n-alkane δ2H from ECA plants as an example.
Since δ2H values of individual plants are partially determined by the δ2H of precipitation at each site, we normalize that large amount of variability in our datasets by comparing the ϵapp values between plant growth forms, instead. ECA n-alkanoic acid ϵapp ranged from −202.7 ‰ to −92.2 ‰ with an average of −135.7 ± 25.9 ‰ (Fig. 3g). Pan-Arctic n-alkanoic acid ϵapp ranged from −202.7 ‰ to −47.4 ‰ with an average of −130.2 ± 27.2 ‰, and n-alkane ϵapp ranged from −221.4 ‰ to −37.6 ‰ with an average of −117.0 ± 31.1 ‰. Graminoids had the most negative n-alkanoic acid ϵapp values in both the ECA and pan-Arctic datasets. Liverworts and lichens had the least negative n-alkanoic acid ϵapp values in the ECA dataset, which were also the only such samples of those growth forms in the pan-Arctic. This pattern of graminoids and lichens (no liverwort data available) having the most and least negative ϵapp values, respectively, was also true for pan-Arctic n-alkanes (Fig. 3h). Similar to δ13C, we were unable to perform Shapiro-Wilk and Mann-Whitney U tests on the δ2H of some growth forms due an insufficient number of measurements (Table S1, Fig. 4g, h). Most growth forms with enough ϵapp measurements were found to be normally distributed except for shrubs, despite having the most measurements available among all growth forms (Fig. 3g, h). Moss and lichen ϵapp distributions were the most significantly different from other growth forms in the n-alkanoic acid (Fig. 4g) and n-alkane (Fig. 4h) datasets, respectively. However, Mann-Whitney U tests with stable isotope data more often showed that measurement distributions within individual plant growth forms were not significantly different compared to tests with total plant wax concentration and ACL data.
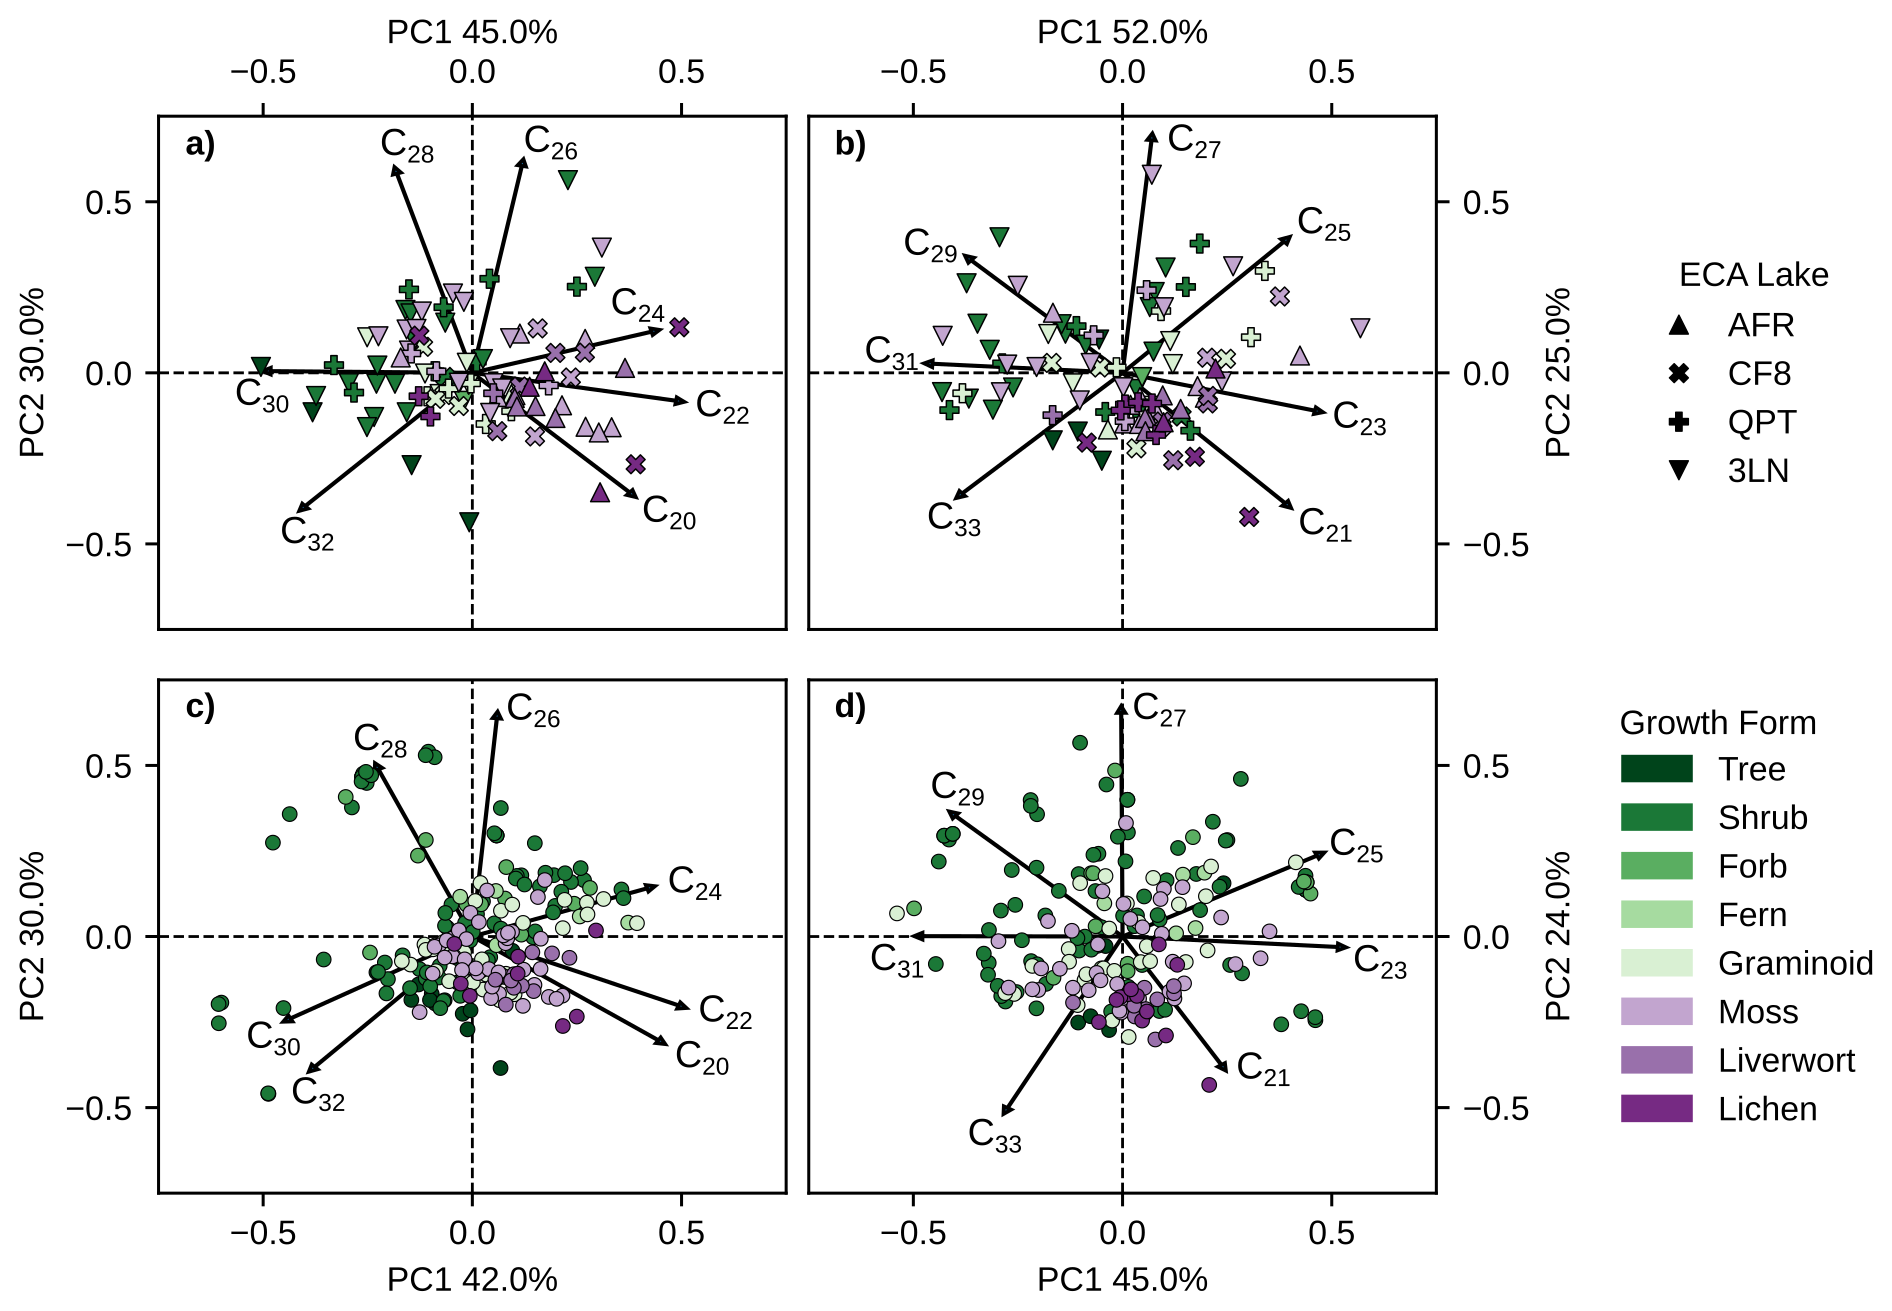
Figure 5PCA biplots of principal components 1 (x-axis) and 2 (y-axis) produced using clr-transformed relative abundances of different chain-lengths of (a) ECA n-alkanoic acids. (b) ECA n-alkanes. (c) Pan-Arctic n-alkanoic acids. (d) Pan-Arctic n-alkanes. Color legend represents major plant growth forms, vascular plants are green shades, non-vascular plants are purple shades. Plot shapes in panels (a) and (b) denote each ECA lake. Multiple samples of the same species from the same site were averaged together for PCA.
3.4 Principal Component Analysis
We performed PCA on plant wax n-alkanoic acid and n-alkane chain-length abundances using both the ECA lakes dataset and pan-Arctic data (Fig. 5). The first two principal components (PCs) in all analyses explained the majority of overall variance, ranging from 69 % to 77 % (Fig. S3a–d). The explained variance successively decreased substantially for the remaining PCs, 3–7, with each explaining no more than 14 % of the total variance. Eigenvectors for the four shortest chain-length plant waxes (C20–C26 C21–C27; n-alkanoic acids n-alkanes) always had positive loadings on PC1 (x-axis), and eigenvectors for the three longest chain-length plant waxes (C28–C32 C29–C33) had negative loadings. Generally, eigenvectors for the one to two shortest and longest chain-length had negative loadings on PC2 (y-axis) and eigenvectors for the remaining chain-length plant waxes had positive loadings. For interpreting the PCA scores of individual samples, PC1 scores reflect a greater abundance of mid-chain (positive) vs. long-chain (negative) waxes, and negative PC2 scores represent a greater abundance of the longest (C32 C33) and/or shortest (C20 C21) chain-lengths.
ECA vascular plants tended to produce more longer-chain n-alkanoic acids than non-vascular plants, resulting in them plotting more negatively on PC1 (Fig. 5a). This relationship partly covaries with sampling location, since non-vascular plants are more prevalent in the northern ECA sites (AFR, CF8) while vascular plants dominate southern ECA sites (QPT, 3LN). Pan-Arctic vascular plant n-alkanoic acid distributions were more variable, but were mostly absent from Quadrant IV containing the C20 and C22 loading factors (Fig. 5c). The majority of non-vascular pan-Arctic n-alkanoic acids had positive PC1 scores associated with shorter-chain length production and negative PC2 scores. ECA vascular plant n-alkanes also tended to have negative PC1 scores, while moss PC scores were highly variable (Fig. 5b). ECA liverwort and lichen n-alkane distributions were more tightly clustered than n-alkanoic acids, mostly plotting along the C21 loading factor. This pattern of high PC score variability among n-alkane distributions for all plant growth forms, except for liverworts and lichens, was also true for pan-Arctic n-alkane distributions (Fig. 5d).
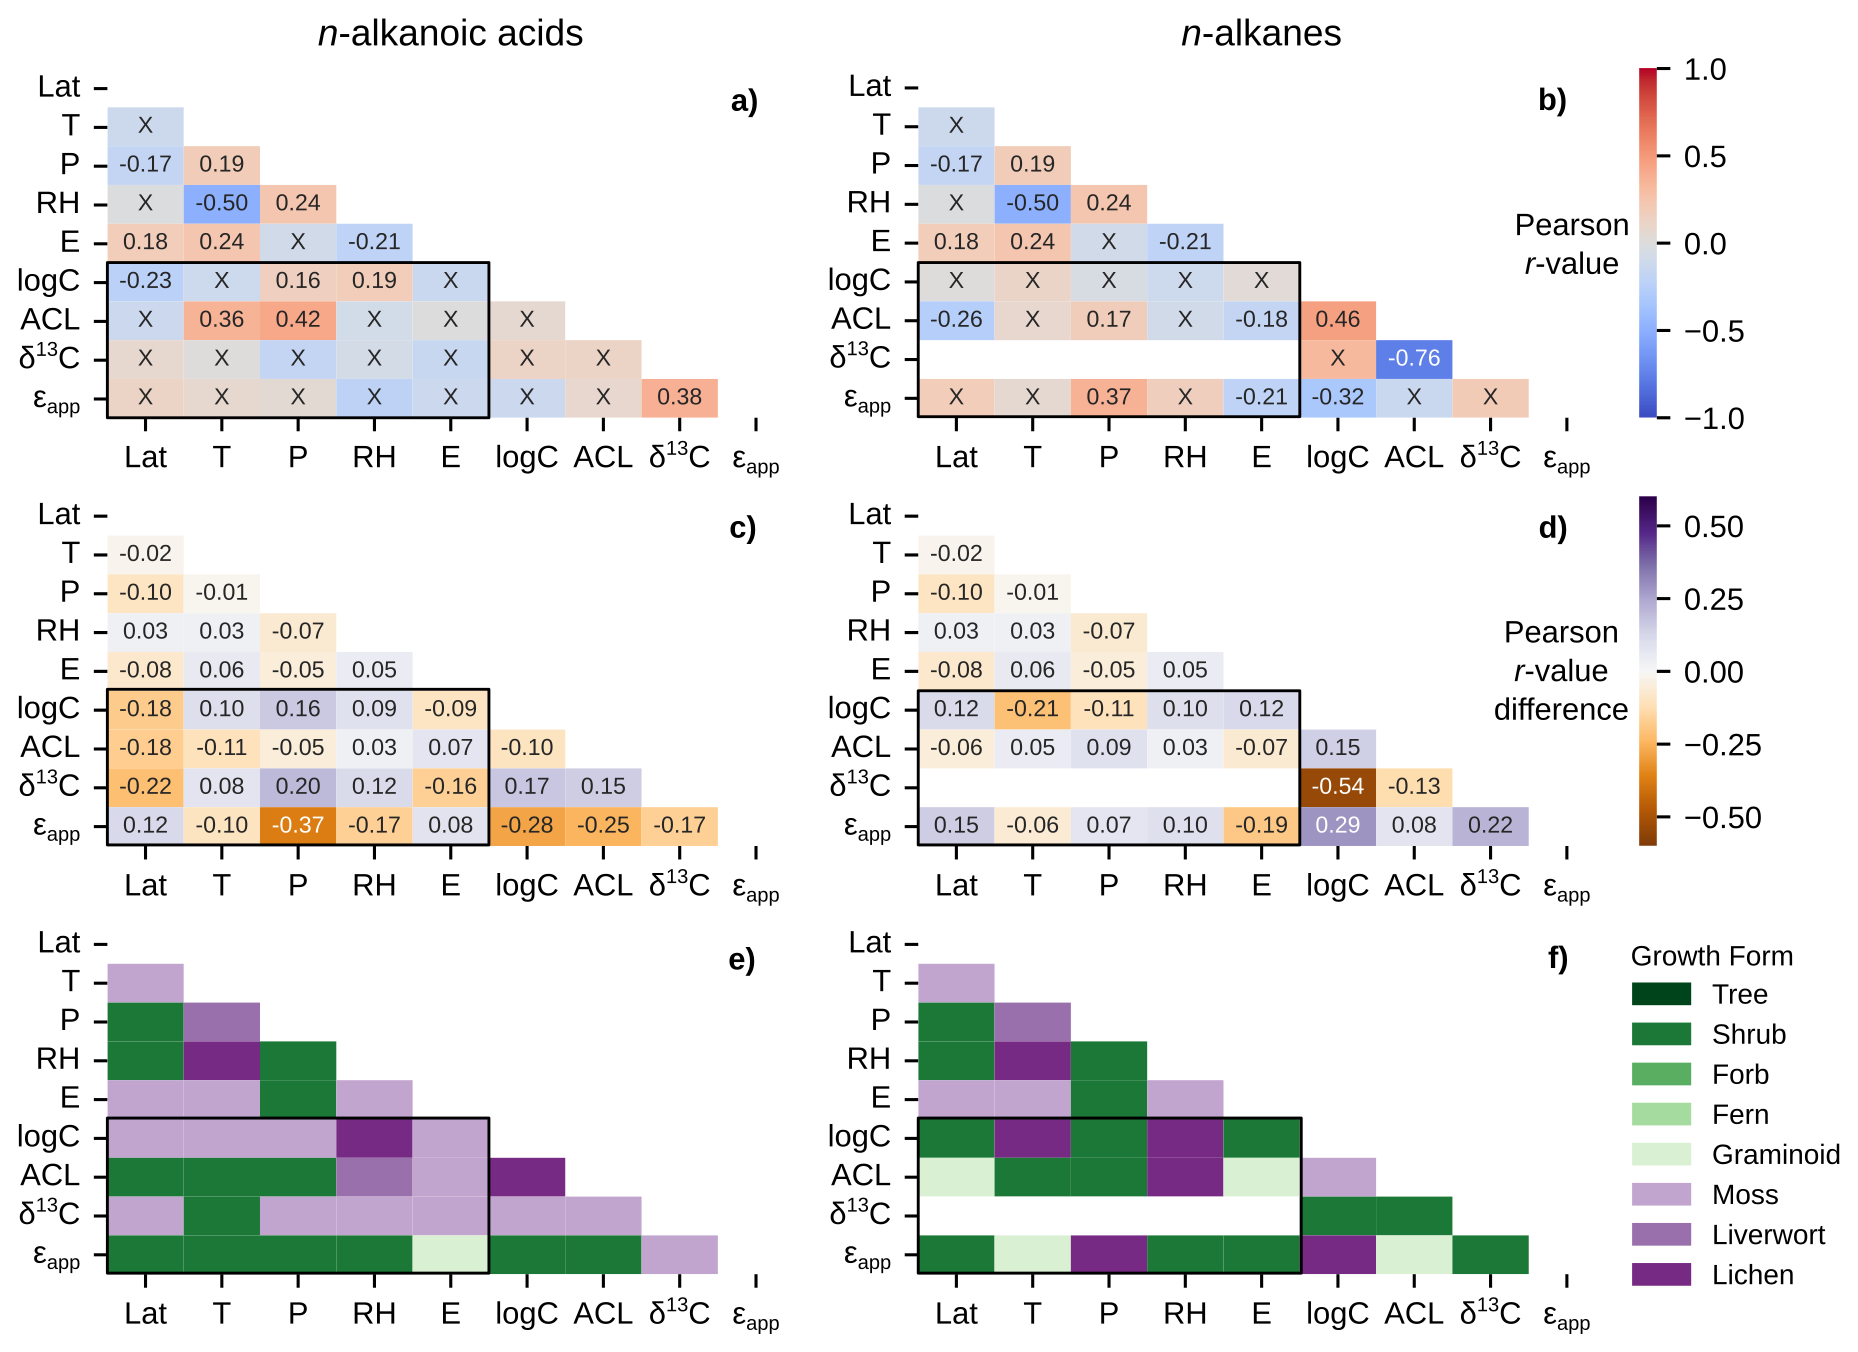
Figure 6Matrices of Pearson correlation results using environmental parameters (Lat = latitude; T = MAF temperature; P = MAF total precipitation amount; RH = MAF relative humidity; E = elevation) and chain-length amount-weighted plant wax indices from the pan-Arctic dataset, with black boxes highlighting the correlation tests between the two. Left column panels (a, c, e) use plant wax n-alkanoic acid data and right column panels (b, d, f) use plant wax n-alkane data. (a–b) Pearson correlation r-values with all plant growth forms included. “X” annotations indicate the correlation is not significant (p ≥ 0.05). (c–d) Maximum, positive or negative, Pearson r-value difference between the full dataset and tests removing one plant growth form at a time. (e–f) Plant growth form removed from the pan-Arctic dataset that is responsible for the values in panels (c) and (d).
3.5 Plant Waxes and Environmental Parameters
The sampling locations in the ECA and pan-Arctic datasets spanned a substantial range in MAF (growing season) environmental parameters across 14° latitude. Temperatures ranged from 3.6 to 12.4 °C (Fig. 2a), total precipitation ranged from 130.3 to 803.5 mm (Fig. 2b), relative humidity ranged from 56.3 % to 80.1 % (Fig. 2c), elevation ranged from 0 to 950 m a.s.l. (Fig. 2d), and OIPC-derived precipitation δ2H ranged from −145.5 ‰ to −86.6 ‰ (Fig. 2e). The transect of ECA sites (AFR, CF8, QPT, 3LN) also contained a wide range of precipitation δ2H values, but are generally characterized as being colder and drier compared to other sampling sites in the pan-Arctic dataset. We used sample site latitude, temperature, precipitation amount, relative humidity, and elevation in Pearson correlation tests with plant wax data. Correlations between individual environmental parameters (i.e., temperature vs. precipitation) were mostly weak ( ≤ 0.4), with the only correlation between temperature and relative humidity (r = −0.50) being of moderate ( ≤ 0.8) strength (Fig. 6a, b; outside of the black boxes).
Pearson correlations between plant wax n-alkanoic acid n-alkane data from all plant growth forms and environmental parameters yielded weak to moderate positive and negative linear relationships (Fig. 6a, b; black boxes), but with many of them not being statistically significant (p ≥ 0.05). The only significant relationships with n-alkanoic acid data were weak positive (r = 0.16, 0.19) correlations between total (log) concentration and precipitation amount and relative humidity, weak to moderate positive (r = 0.36, 0.42) correlations between ACL and temperature and precipitation amount, and a weak negative correlation (r = −0.23) between total concentration and latitude (Fig. 6a). There were no significant correlations between n-alkanoic stable isotope data and environmental parameters. Terrestrial plant n-alkane had a weak positive (r = 0.17) and weak negative (r = −0.26, −0.18) correlations between ACL and precipitation amount, latitude, and elevation, respectively (Fig. 6b). n-alkane ϵapp also had a weak positive (r = 0.37) correlation with precipitation amount. The δ13C values of n-alkanes were only reported in plants from a single study in west Greenland (Dion-Kirschner et al., 2020) sampled during a single year (2015), which prevented correlations with environmental parameters.
We repeated these Pearson correlations with the plant wax data of a single growth form removed each time (e.g., performed correlations with all trees removed, then all shrubs removed, etc.). This allowed us to assess the influence of different growth forms on each correlation via the change in magnitude and direction of the r-value each time (Fig. 6c, d) while tagging the growth form that caused the greatest change when removed (Fig. 6e, f). Pearson r-value changes ranged from −0.37 to 0.20 for the n-alkanoic acid dataset (Fig. 6c), with the removal of mosses and shrubs being responsible for each extreme, respectively (Fig. 6e). These two growth forms were most often responsible for the greatest change in r-value for plant wax vs. environmental correlations. Changes in n-alkane correlation r-values ranged from −0.21 to 0.15 (Fig. 6d) with lichens and shrubs being responsible for the extreme values and the most frequent changes in r-value (Fig. 6f). Liverwort and lichen removal also caused some of the largest r-value changes in the n-alkanoic acid dataset, while graminoid removal did the same for the n-alkane dataset.
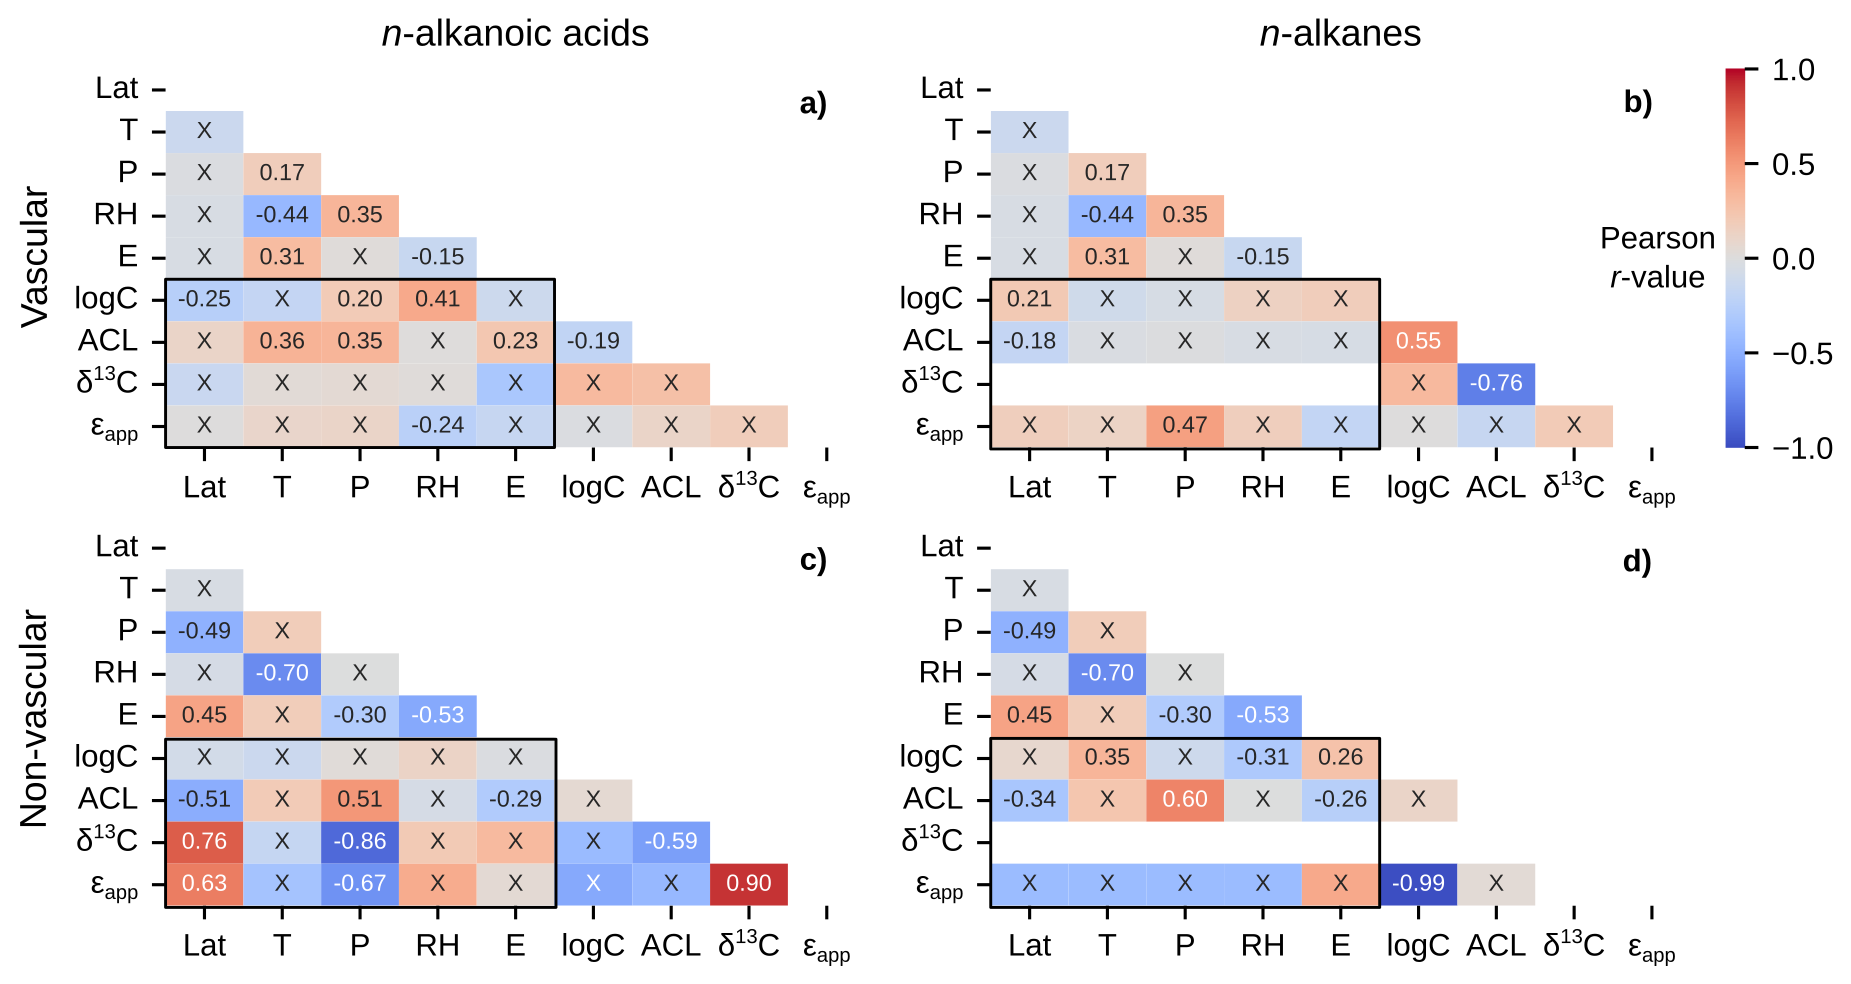
Figure 7Matrices of Pearson correlation results using environmental parameters (Lat = latitude; T = MAF temperature; P = MAF total precipitation amount; RH = MAF relative humidity; E = elevation) and chain-length amount-weighted plant wax indices from the pan-Arctic dataset, with black boxes highlighting the correlation tests between the two. Left column panels (a, c) use plant wax n-alkanoic acid data and right column panels (b, d) use plant wax n-alkane data. (a–b) Vascular plants (trees, shrubs, forbs, ferns, graminoids). (c–d) Non-vascular plants (mosses, liverworts, lichens). “X” annotations indicate the correlation is not significant (p ≥ 0.05).
To further dissect potential empirical relationships between plant wax data and environmental parameters, we investigate linear relationships between several subsets of the pan-Arctic data, including vascular and non-vascular plants (Fig. 7), individual plant growth forms (Fig. 8), and individual plant genera (Fig. 9). For all data subsets listed, the majority of correlations were not statistically significant, due to either high variability (very low r-value) in the plant wax data, low sample sizes, or a combination of the two.
Vascular plants reflected similar correlation patterns to the full dataset: Weak to moderate positive correlations with n-alkanoic acid concentration and ACL (Fig. 7a), and a moderate correlation between n-alkane ϵapp and precipitation amount (Fig. 7b). Non-vascular plant waxes revealed different relationships with environmental parameters. Both n-alkanoic acid and n-alkane ACL were moderately positively (r = 0.51, 0.60) correlated with precipitation amount, whereas n-alkanoic acid δ13C and ϵapp were both moderately to strongly negatively (r = -0.67, -0.86) correlated with precipitation amount (Fig. 7c, d). Additionally, non-vascular plant n-alkanoic acid ACL (r = -0.51), δ13C (r = 0.76), and ϵapp (r = 0.63) were all moderately correlated with latitude (Fig. 7c).
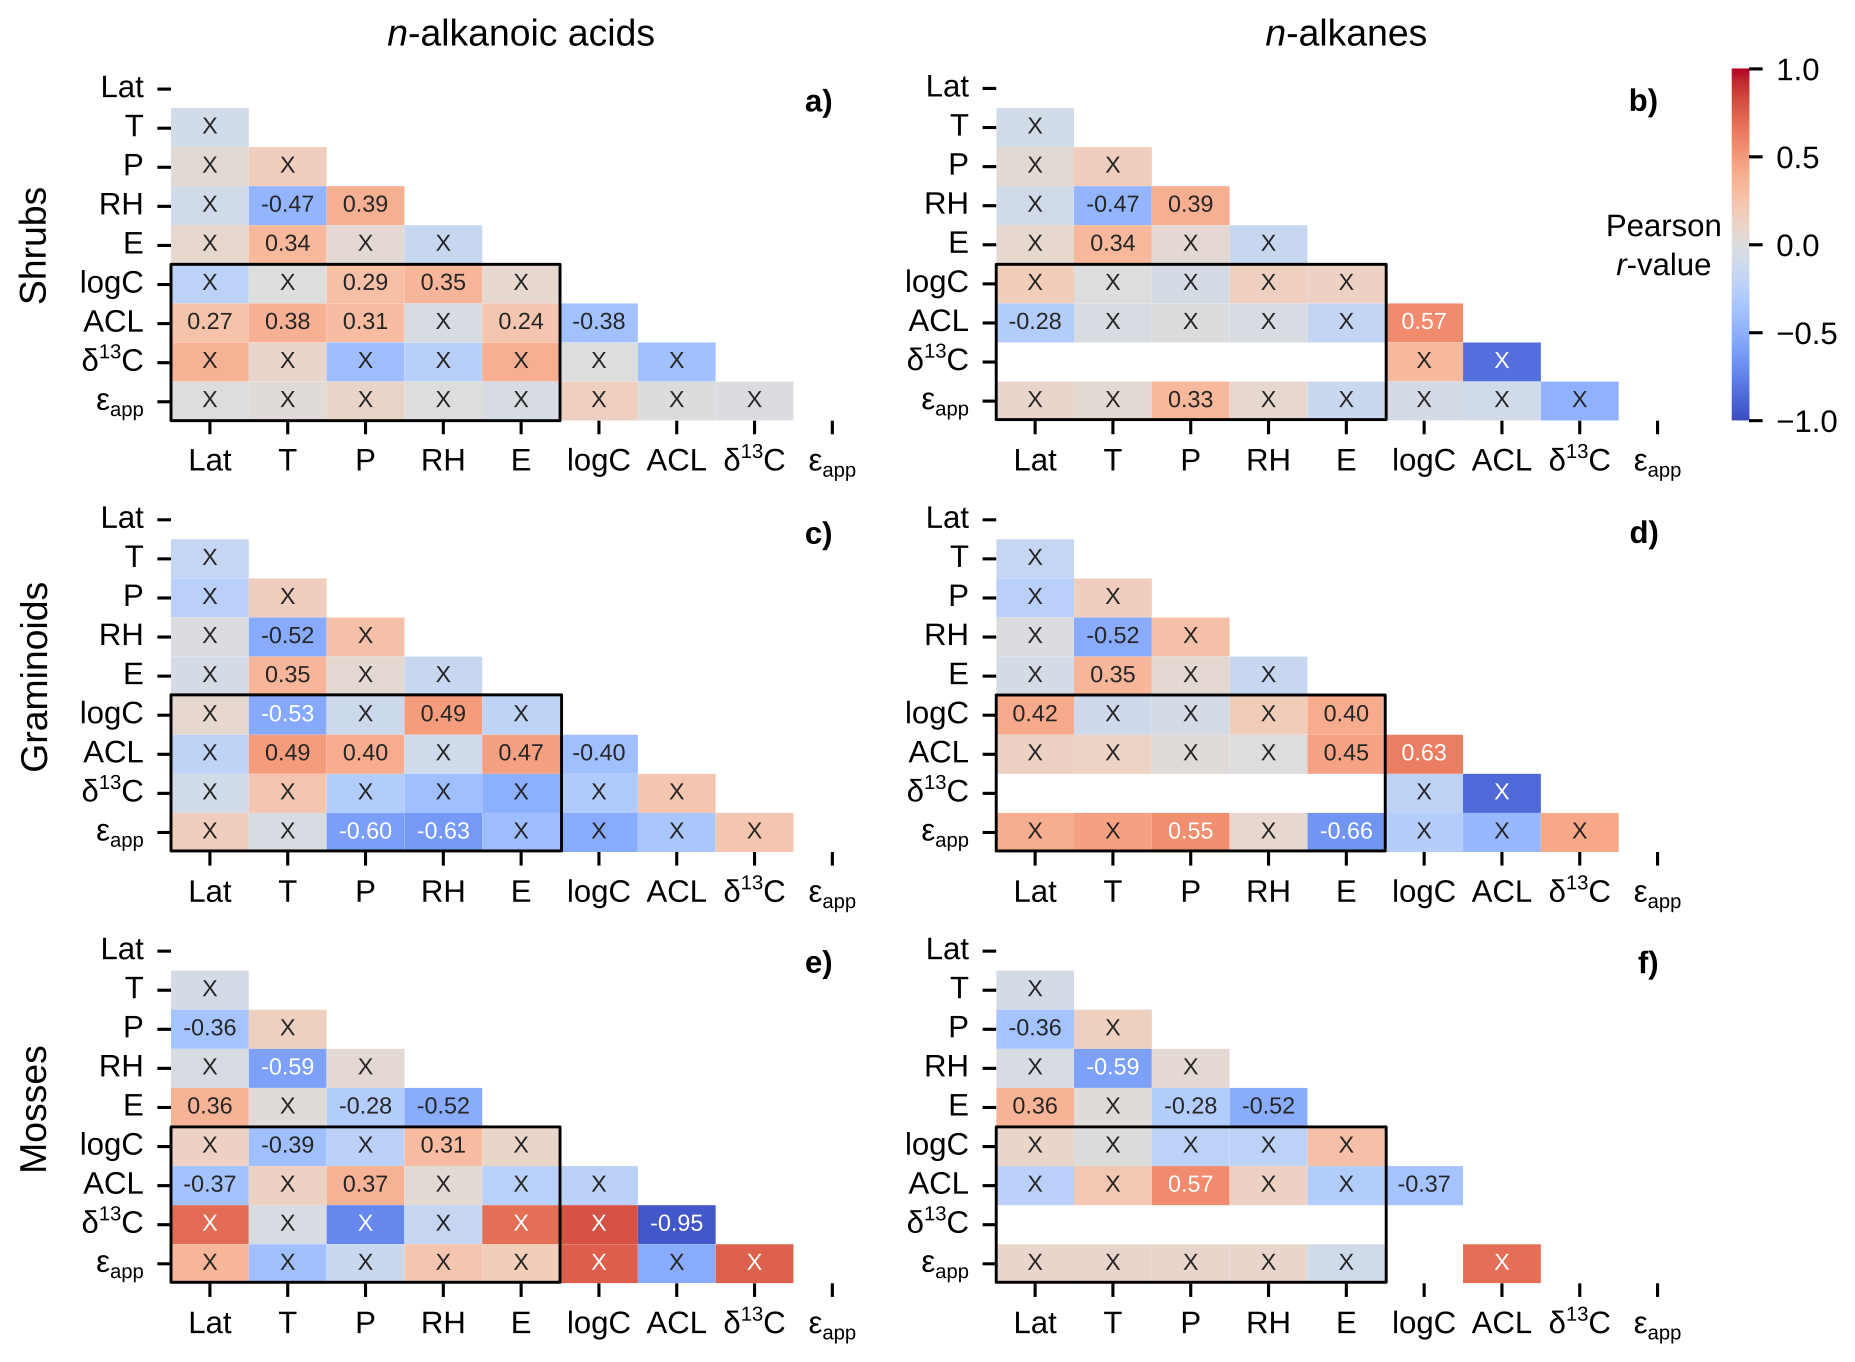
Figure 8Matrices of Pearson correlation results using environmental parameters (Lat = latitude; T = MAF temperature; P = MAF total precipitation amount; RH = MAF relative humidity; E = elevation) and chain-length amount-weighted plant wax indices of individual plant growth forms from the pan-Arctic dataset, with black boxes highlighting the correlation tests between the two. Left column panels (a, c, e) use plant wax n-alkanoic acid data and right column panels (b, d, f) use plant wax n-alkane data. (a–b) Shrubs. (c–d) Graminoids. (e–f) Mosses. “X” annotations indicate the correlation is not significant (p ≥ 0.05).
Shrubs, graminoids, and mosses contained the most plant wax measurements among plant growth forms, and spanned the greatest number of sampling locations/unique environmental data points. The shrub-only data subset, containing the most measurements among growth forms, maintained the correlation patterns present in the full pan-Arctic and vascular plant groupings but with a now-weak positive correlation between n-alkane ϵapp and precipitation amount (Fig. 8a, b). Graminoids displayed a number of moderate correlations not seen in other data subsets, including relationships between ϵapp and precipitation amount (r = −0.60, −0.55; n-alkanoic acids, n-alkanes), relative humidity (r = 0.63; n-alkanoic acids), and elevation (r = −0.66; n-alkanes). Graminoids also had a negative (r = −0.53) correlation between total n-alkanoic acid total concentration and temperature plus a positive correlation (r = 0.42) between total n-alkane concentration and latitude (Fig. 8c, d). Mosses had weakly negative correlations between n-alkanoic acid ACL and latitude (r = −0.37) and total concentration and temperature (r = −0.39), along with weakly positive correlations between total concentration and relative humidity (r = 0.31) and ACL and precipitation amount (r = 0.37) (Fig. 8e). The only significant correlation present in moss n-alkanes was a moderately positive (r = 0.57) correlation between ACL and precipitation amount (Fig. 8f).
Betula sp. contained the greatest number of measurements and unique sampling locations among all Arctic plant genera, and all but one (56 of 57) samples were from the Betula nana/glandulosa complex. We excluded the Betula pubescens sample from Hollabåttjønnen Bog (Balascio et al., 2018) in these correlations due to it being classified as a tree, not a shrub like Betula nana and Betula glandulosa. Salix sp. was the second most sampled genus, but contained a more diverse set of species (e.g., Salix glauca, Salix arctica, Salix pulchra, etc.). Salix sp. n-alkanoic acids showed several significant correlations with environmental parameters, including a notably strong positive (r = 0.96) relationship between δ13C and latitude (Fig. 9a). The only significant correlation for Salix sp. n-alkanes was a moderately negative (r = −0.47) relationship between ACL and elevation (Fig. 9b). Similarly, Betula sp. n-alkanoic acids only had one significant correlation between ACL and latitude (Fig. 9c). Betula sp. n-alkane ACL and ϵapp were moderately negatively (r = −0.73) and moderately positively (r = 0.70) correlated with precipitation amount (Fig. 9d).
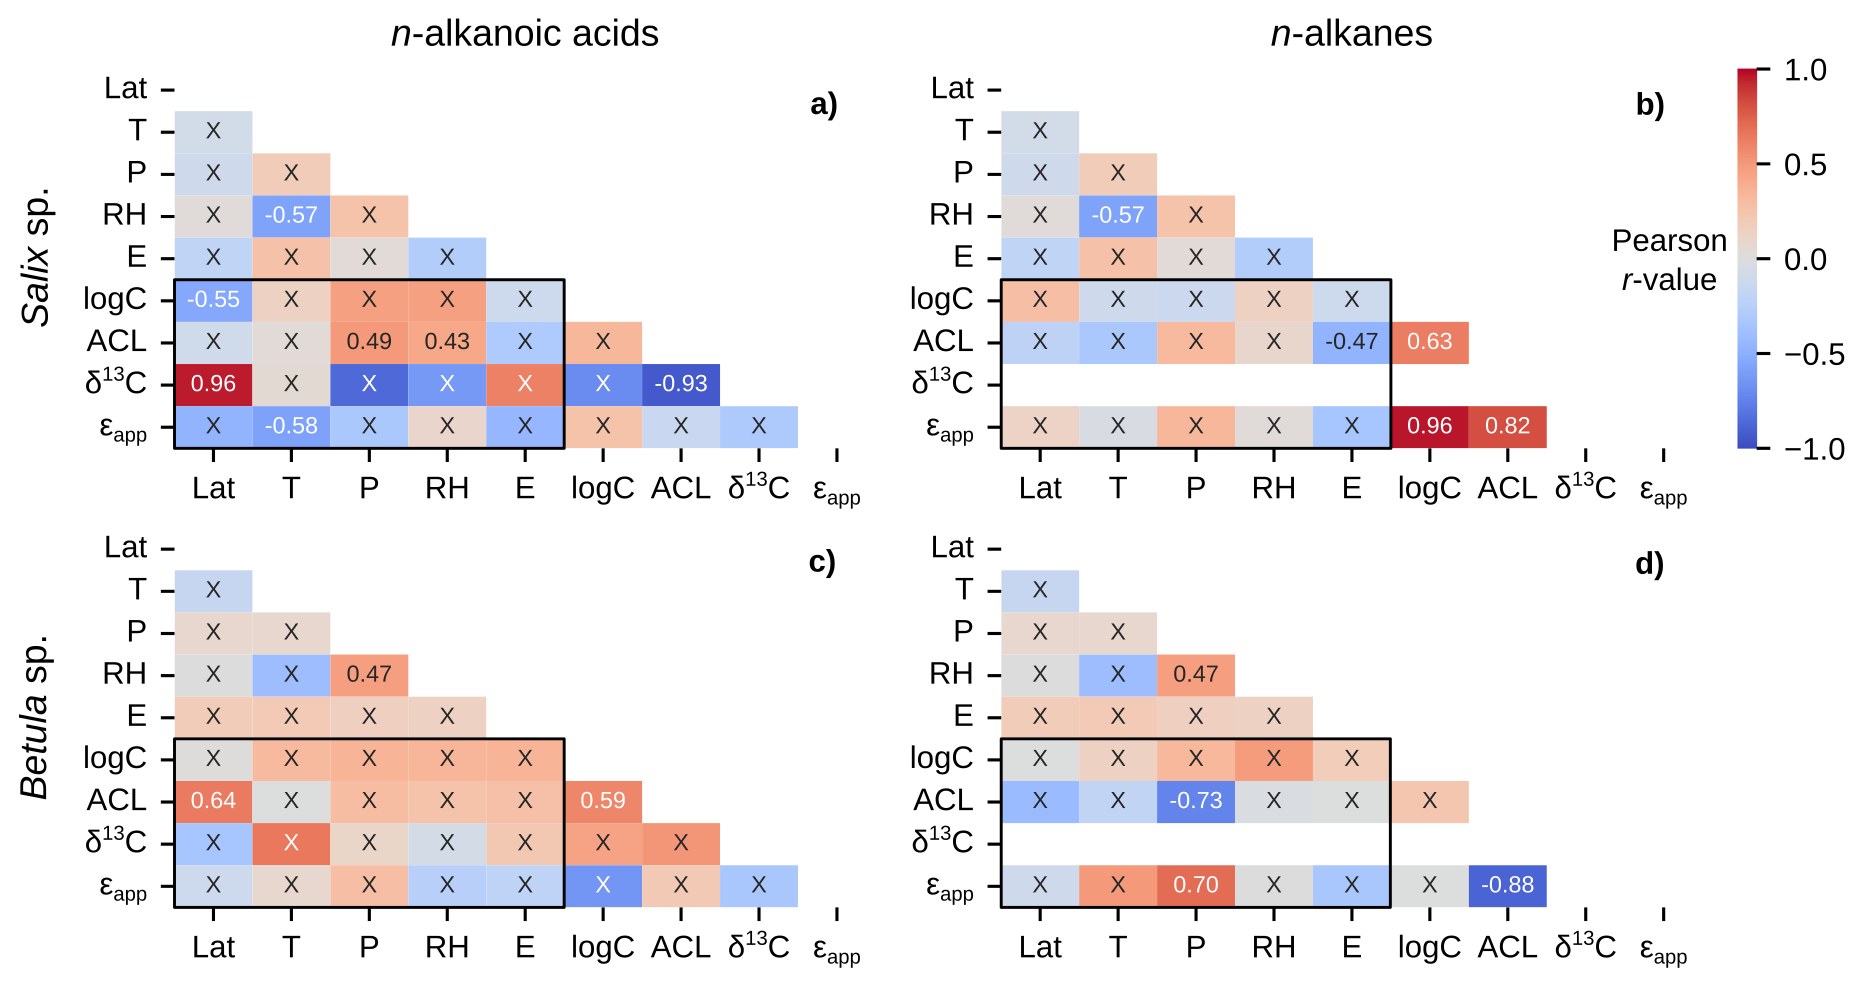
Figure 9Matrices of Pearson correlation results using environmental parameters (Lat = latitude; T = MAF temperature; P = MAF total precipitation amount; RH = MAF relative humidity; E = elevation) and chain-length amount-weighted plant wax indices of individual plant genera from the pan-Arctic dataset, with black boxes highlighting the correlation tests between the two. Left column panels (a, c) use plant wax n-alkanoic acid data and right column panels (b, d) use plant wax n-alkane data. (a–b) All plants within the Salix genus only. (c–d) Betula genus only. “X” annotations indicate the correlation is not significant (p ≥ 0.05).
In this section, we evaluated three facets of the results from each plant wax data type (total concentration, chain-length distribution, δ13C, δ2H ϵapp): (1) environmental correlations and their relationship to previously hypothesized mechanisms influencing plant wax production and stable isotope fractionation, (2) effects of plant growth forms, and (3) implications for using this proxy for Arctic paleoclimate reconstructions.
Weak correlations, overall, between environmental parameters across pan-Arctic sampling locations indicate that individual environmental controls on plant wax indices can be evaluated without much covarying influence of others (i.e., the effects of precipitation amount vs. temperature on ACL values). However, correlation tests with the removal of a single plant growth form reveal that some correlation strengths may be largely driven by the sample size and location of certain growth forms (Fig. 6e, f). Shrubs contain the greatest number of measurements and span the most unique sampling locations, so it is not surprising that their presence/absence has a greater effect on larger data subsets (vascular, all data). Mosses, liverworts, and lichens are more abundant in bioclimates A–C, which skews their sampling towards colder, drier sampling locations. Therefore, their presence/absence may have an “anchoring effect” on the cold/dry end of these environmental gradients.
Performing a large number of independent significance tests, 36 in each half-matrix for a given data subset for a single plant wax compound class, also has an inherent potential to yield some false positives. By using a 95 % confidence interval (p = 0.05), we expect that each set of tests contains ∼two false positives, or one in the subset of 20 tests between plant wax indices and environmental parameters. It is possible, therefore, that some comparisons which only produced one significant correlation between plant wax indices and environmental parameters, including moss n-alkanes (Fig. 8f), Salix sp. n-alkanes (Fig. 9b), and Betula sp. n-alkanoic acids (Fig. 9c) actually did not yield any significant correlations when accounting for the likelihood of false positives. In contrast, comparisons with two or more significant correlations are highly likely (> 95 % confidence) to reflect real patterns. In the following sections, therefore, we interpret significant correlations only where there are previously documented physiological and/or environmental mechanisms driving plant wax production.
4.1 Total Plant Wax Concentration
Plant wax production is often a response mechanism by individual plants to prevent water loss under stress (Burlett et al., 2025; Lewandowska et al., 2020): more water stress causes a higher total concentration of plant waxes. Hoffmann et al. (2013) demonstrated that total n-alkane concentrations in Eucalyptus sp. were negatively correlated with annual precipitation amount and relative humidity. However, we generally do not observe this relationship between terrestrial Arctic plants and MAF total precipitation amount or relative humidity. Cold summer temperatures and restricted soil drainage due to the presence of bedrock and permafrost minimize water limitations during the growing season in the Arctic (Gold and Bliss, 1995), the period during which plant wax synthesis occurs (Bakkelund et al., 2018; Tipple et al., 2013). The only exception was non-vascular plant n-alkanes, which had a weak negative correlation with relative humidity (Fig. 7d). In fact, the environmental correlations of moderate strength with total concentration were actually positive, as seen in vascular plant (r = 0.41) and graminoid (r = 0.49) n-alkanoic acid data subsets with relative humidity (Figs. 7a, 8c). Feakins et al. (2016) also suggested that total plant wax concentrations increased with elevation in tropical forest vegetation in response to decreasing temperatures and lower nutrient availability. However, this correlation for terrestrial Arctic plants was, at best, of weak strength in non-vascular (r = 0.26) and graminoid (r = 0.40) n-alkane data subsets (Figs. 7d, 8d). It is possible that any trends in total plant wax production were masked by the high measurement variability present in all plant growth forms: the average standard deviation for growth form-specific n-alkanoic acid concentrations was 572 and 891 µg g−1 for n-alkanes.
Shapiro-Wilk tests showing that total plant wax concentrations within individual plant growth forms were often log-normally distributed (Table S3) agreed with other large compilations of plant wax data from western Africa and the Tibetan Plateau (Garcin et al., 2014; Yang and Bowen, 2022). Some studies have demonstrated significant differences in total plant wax concentrations between plant types, notably that angiosperms produce more n-alkanes than gymnosperms (Bush and McInerney, 2013; Diefendorf et al., 2011). However, fewer such comparisons have been performed between the groupings of plant growth forms analyzed in this study. Shrubs have distributions of total n-alkanoic acid and n-alkane concentrations that are significantly different (Fig. 4a, b) and greater (Fig. 3a, b) than most other plant growth forms. This supports the hypothesis that waxes from these plants have greater potential to be strongly represented in Arctic sedimentary records (Dion-Kirschner et al., 2020; Hollister et al., 2022). The opposite may be the case for growth forms that produce relatively low plant wax concentration, including liverworts and lichens.
4.2 Chain-Length Distributions
The mechanisms behind a plant’s production of different plant wax carbon chain-lengths in response to environmental conditions is much less understood compared to the total production of these compounds. It has been suggested that plants produce longer chain-lengths, resulting in a greater ACL value, to combat water stress in warmer and/or drier growing conditions (Shepherd and Wynne Griffiths, 2006). These trends have been observed in plant n-alkane ACL across substantial temperature and aridity gradients in the eastern U.S. (Tipple and Pagani, 2013), central U.S. (Bush and McInerney, 2015), and Europe (Sachse et al., 2006). Therefore, we would expect terrestrial Arctic plant wax ACL to be positively correlated with temperature and negatively correlated with precipitation amount and relative humidity.
We do observe weak to moderate positive correlations between ACL and temperature in all plant n-alkanoic acids (r = 0.36; Fig. 6a), vascular plants (r = 0.36; Fig. 7a), shrubs (r = 0.38; Fig. 8a), and graminoids (r = 0.49; Fig. 8c), but not in any n-alkane data subsets. Nearly all significant correlations between ACL and precipitation amount and relative humidity were weakly to moderately positive, with the exception of Betula sp. n-alkane ACL (r = −0.73; Fig. 9d). Apart from that moderate correlation in Betula sp., the lack of significant correlations, otherwise, supports previous findings on Betula sp. that their plant wax distributions are highly variable but not governed by environmental variables (Weber and Schwark, 2020). While these results disagree with the assumed mechanisms behind plant wax chain-length production, Tipple and Pagani (2013) and Bush and McInerney (2015) also do not find ACL to have a significant relationship with water availability. Hoffmann et al. (2013) also showed that the ACL for different genera can have opposing positive and negative correlations to precipitation and relative humidity within the same environmental gradient. Such an effect may obfuscate plant wax relationships in individual taxa to environmental data when data are grouped at the growth form level and above.
Mann-Whitney U tests revealed that ACL values did not differ between vascular plant growth forms, while non-vascular plants, particularly liverworts and lichens, had unique ACL distributions relative to all other growth forms (Fig. 4c, d). These patterns were also seen in the PCA biplot space where non-vascular plants tended to cluster in Quadrant IV with the two shortest n-alkanoic acid (C20, C22) and n-alkane (C21, C23) chain-lengths (Fig. 5c, d). Trees, which had some of the highest average ACL values, mostly plotted in Quadrant III of the PCA biplots containing the two longest chain-lengths. This is in contrast to other sampled temperate and subtropical/arid biomes where tree ACL was shown to be lower than many shrubs and graminoids (Freimuth et al., 2019; Howard et al., 2018). Bush and McInerney (2013) found similar ACL patterns in n-alkanes from temperate plant species where vascular plant species had similar, highly variable ACL distributions while mosses had distinctly lower values. Interestingly, pan-Arctic moss n-alkane ACL values were not significantly different from vascular plants, whereas the Bush and McInerney (2013) trend held true for pan-Arctic n-alkanoic acids. These patterns in Arctic vegetation echo warnings from previous compilations of plant ACL values that chain-length distributions are not sufficient for fingerprinting different types of vascular plants (Bush and McInerney, 2013; Liu et al., 2022), but discerning changes between vascular and non-vascular plant wax sources may still be possible.
4.3 δ13C
The fractionation of stable carbon isotopes between the atmosphere and C3 plant waxes is strongly influenced by a plant's stomatal conductance in its leaves responding to water availability (Farquhar et al., 1982). In global compilations of plant samples, this mechanism is illustrated as negative correlations between plant wax n-alkane δ13C and temperature and precipitation amount (Diefendorf et al., 2010; Liu et al., 2022; Wang et al., 2025). Arctic plant wax n-alkanoic acid and n-alkane δ13C values all fell within the global range of variability (∼ −45 ‰ to −20 ‰) for C3 photosynthesizers (Diefendorf and Freimuth, 2017; Liu et al., 2022). However, the only significant correlation between δ13C and any environmental variable was a strongly negative (r = −0.86) relationship between non-vascular n-alkanoic acids and precipitation amount (Fig. 7c). Interestingly, mosses are the only growth form of the non-vascular plants that can have stomata within their structure, while liverworts and lichens do not (Renzaglia et al., 2020). Therefore, non-vascular plant 13C fractionation sensitivity to water availability in these growth forms is likely driven by other physiological factors.
Arctic plant wax δ13C data was limited to this study, Lake QPT in the ECA (Hollister et al., 2022), and west Greenland (Dion-Kirschner et al., 2020), so it is possible that significant correlations in vascular plants were not resolved due to a low measurement count across a smaller gradient of temperature and precipitation amount. This also applies to investigating differences in δ13C between plant growth forms. Shrubs had the most significantly difference distribution of n-alkanoic acid δ13C values based on Mann-Whitney U tests (Fig. 4e), but many growth forms did not have any measurements (Fig. 3e, f). The high degree of overlap in δ13C values between plant growth forms suggests that caution should be used when interpreting past terrestrial vegetation changes using sedimentary plant wax δ13C in the Arctic. This large overlap impacts the ability to construct unique δ13C-based vegetation endmembers for numerical modeling of plant wax sources (Yang and Bowen, 2022; Yu et al., 2024).
4.4 δ2H and ϵapp
Plant wax δ2H values and their associated ϵapp relative to their source water δ2H are controlled by multiple factors, including evaporative 2H-enrichment that occurs in the soil and plant's xylem prior to plant wax synthesis, as well as the biosynthetic fractionation factor (ϵbio) which heavily discriminates against the heavier 2H isotope (Sachse et al., 2012). O'Connor et al. (2020) found moderate positive correlations between ϵbio and temperature and precipitation amount along a north-south transect of Alaskan shrubs and forbs. However, disentangling the environmental controls on 2H fractionation pre- (evaporation) and post- (ϵbio) plant wax synthesis would require more measurements of plant leaf water, which are currently limited to only two other Arctic datasets/sampling locations (Berke et al., 2019; Daniels et al., 2017) in addition to the data from O'Connor et al. (2020).
If we assume ϵbio is constant for individual plants, increased evaporation results in a smaller absolute (less negative) ϵapp value (Kahmen et al., 2013a; Sachse et al., 2006). In this framework, environmental correlations with ϵapp values are expected to relate to evaporation potential: positive correlations with increasing temperature and negative correlations with increasing precipitation and relative humidity. However, the only cases in which these expected relationships were present in the pan-Arctic dataset were a moderately negative correlation between non-vascular n-alkanoic acid ϵapp and precipitation amount (r = −0.67; Fig. 7c) as well as moderately negative correlations between graminoid n-alkanoic acid ϵapp and precipitation amount (r = −0.60) and relative humidity (r = −0.63; Fig. 8c). A number of data subsets expressed opposite relationships than expected, including moderately positive correlations between n-alkane ϵapp in vascular plants (n = 0.47; Fig. 7c), graminoids (r = 0.55; Fig. 8d), and Betula sp. (r = 0.70; Fig. 9d). Liu et al. (2023) found weakly negative correlations between mean annual precipitation amount and terrestrial monocot (r = −0.36) and dicot (r = −0.38) n-alkane ϵapp across China. However, mean annual precipitation amounts in their sampling locations ranged from 30 to 1720 mm, with much more scatter in ϵapp values in the range of 30 to ∼ 600 mm of mean annual precipitation (Liu et al., 2023). It is possible that the ranges of MAF total precipitation amount, temperature, and relative humidity in the pan-Arctic dataset are not enough to drive consistent, significant changes in ϵapp (Feakins and Sessions, 2010). Though, it is also possible that some of the total ϵapp variability is lost by using spatially interpolated OIPC precipitation isotope δ2H values instead of in situ measurements (Feakins and Sessions, 2010; Gorbey et al., 2022).
Previous studies have also found positive correlations between ϵapp and latitude in Arctic vegetation, where latitude serves as a proxy for the daily length of daylight during the growing season (Shanahan et al., 2013; Yang et al., 2011). These correlations were supported by experimental results where increased light exposure promoted more plant evapotranspiration, causing ϵapp values to be more enriched (Yang et al., 2009). In the pan-Arctic dataset, the only data subset that showed a similar, positive correlation (r = 0.63) between ϵapp and latitude was non-vascular n-alkanoic acids (Fig. 7c). Based on their n-alkanoic acid ϵapp correlations between precipitation amount and latitude, it could be possible that non-vascular terrestrial Arctic plants are more sensitive to evaporation than vascular ones. However, this pattern is likely not robust since these correlations are not present in non-vascular n-alkanes (Fig. 7d) and also do not manifest in mosses (Fig. 8e, f), despite them being the most abundant non-vascular plant growth form in the pan-Arctic dataset.
Weak correlations between plant wax and precipitation δ2H illustrates the high variability in ϵapp at each sampling location (Fig. S2). The anomalously 2H-enriched values from Hollabåttjønnen Bog in northern Norway (Balascio et al., 2018) were likely caused by those plants using bog water (−60 ‰) that was much more 2H-enriched than our calculated amount-weighted MAF precipitation δ2H (−87 ‰) based on ERA5 reanalysis and the Online Isotopes in Precipitation calculator (Bowen and Revenaugh, 2003; Bowen et al., 2005; Hersbach et al., 2020). While such issues can occur when using this approach, it serves as a consistent data source and methodology for datasets where site-specific meteorological and precipitation isotope data were not collected nor available elsewhere. For example, this information was not collected at each ECA lake and there are large discrepancies in distance to the nearest weather and precipitation isotope monitoring stations (Gorbey et al., 2022). Additionally, Saishree et al. (2023) found high ϵapp variance (standard deviation > 20 ‰) in deciduous and evergreen trees growing in the same climate and irrigated with δ2H-controlled water. Therefore, high ϵapp variability within individual growth forms may also be a function of plant physiology, not just from discrepancies between measured and inferred plant source water. Saishree et al. (2023) and other studies (Chikaraishi and Naraoka, 2007; Feakins et al., 2016) also note the substantial variability we observe in plant wax δ2H and δ13C values between chain-lengths from the same sample and have attributed it to systemic changes in biosynthetic fractionation as plants produce different wax chain-lengths.
The lack of distinct distributions of ϵapp values between plant growth forms may be beneficial for reconstructing past Arctic hydrology. The only pattern consistent with other, globally-distributed plant wax ϵapp compilations was Arctic graminoids having the most negative values, on average, among growth forms (Gao et al., 2014; Sachse et al., 2012). Some studies report vegetation-corrected source water δ2H records based on ϵapp values of different plant types and their estimated contributions to the sediment (Feakins, 2013; Holtzman et al., 2025). Based on our results, calculating MAF precipitation δ2H using pan-Arctic ϵapp averages of −130.2 ± 27.2 ‰ for n-alkanoic acids and −117.0 ± 31.1 ‰ for n-alkanes may be sufficient in the absence of a paired vegetation record from the same site.
The goal of this study was to evaluate whether variability in terrestrial Arctic plant wax data is driven by environmental factors or physiological differences between plant growth forms. Overall, terrestrial Arctic plant waxes did not exhibit substantial empirical relationships to any of the environmental parameters tested in this study (latitude, temperature, precipitation amount, relative humidity, elevation). The majority of Pearson correlations were not statistically significant. Those that were significant were mostly classified as weak ( ≤ 0.4) and often contradicted previously proposed environmental drivers of plant wax data variability. A fundamental assumption of plant wax-based paleoclimate reconstructions is that each proxy is primarily recording one type of environmental or ecological change: e.g., changes in ACL over time represent changes in local vegetation composition, changes in δ2H represent changes in precipitation δ2H. Weak correlations suggest that the environmental ranges captured across the modern Arctic do not exert a strong influence on how plants synthesize different plant wax chain-lengths or fractionate stable carbon and hydrogen isotopes. Differences in plant growth forms appeared to affect the total concentration and chain-length distributions of plant waxes, while stable isotope δ13C and ϵapp variability were much more consistent between plant growth forms. Therefore, changes in plant wax distributions in paleoclimate records do likely reflect changes in terrestrial plant taxa present over time, and past changes in plant wax δ2H likely reflect changes in source water (precipitation) δ2H, both without a strong, confounding influence from other environmental parameters. These results from the modern Arctic help inform interpretations of past, terrestrially-derived plant waxes in Arctic depositional settings by reaffirming these fundamental assumptions about plant wax production and stable isotope fractionation in paleoclimate research.
The code used for analysis and producing figures for this study are available on Zenodo (Lindberg, 2025). The data produced and compiled for this study is available at the National Science Foundation Arctic Data Center (Lindberg et al., 2025).
The supplement related to this article is available online at https://doi.org/10.5194/bg-23-2503-2026-supplement.
KRL and EKT designed the study. MKR, HB, JHR, and KRL carried out the field sampling. EKT, MKR, and KRL funded the research. KRL conducted laboratory work for producing the data. KRL analyzed the data and provided interpretations of the results. KRL produced the Python code for data analysis and figure production. KRL wrote the manuscript with input from all co-authors.
The contact author has declared that none of the authors has any competing interests.
Publisher's note: Copernicus Publications remains neutral with regard to jurisdictional claims made in the text, published maps, institutional affiliations, or any other geographical representation in this paper. The authors bear the ultimate responsibility for providing appropriate place names. Views expressed in the text are those of the authors and do not necessarily reflect the views of the publisher.
We thank Owen C. Cowling, Nancy Leon, Haben Berhe, Caleb K. Walcott-George, and Emily Earl for their technical support. We also thank the PACEMAP (Predicting Arctic Change through Ecosystem MoleculAr Proxies) team for their insight and support.
We thank the Inuit communities of Baffin Island for allowing the PACEMAP team to conduct research on their land and for providing field work logistical support. We recognize that research at the University at Buffalo took place on unceded Haudenosaunee/Six Nations Confederacy land.
This research has been supported by the National Science Foundation (grant nos. ARCSS-1737716 and EAR-IF-1652274) and the Geological Society of America (grant no. 2022 Graduate Student Research Grant).
This paper was edited by Helge Niemann and reviewed by two anonymous referees.
Aitchison, J.: The statistical analysis of compositional data, J. Roy. Stat. Soc. B Met., 44, 139–160, https://doi.org/10.1111/j.2517-6161.1982.tb01195.x, 1982. a
Akers, P. D., Kopec, B. G., Mattingly, K. S., Klein, E. S., Causey, D., and Welker, J. M.: Baffin Bay sea ice extent and synoptic moisture transport drive water vapor isotope (δ18O, δ2H, and deuterium excess) variability in coastal northwest Greenland, Atmos. Chem. Phys., 20, 13929–13955, https://doi.org/10.5194/acp-20-13929-2020, 2020. a
Alduchov, O. A. and Eskridge, R. E.: Improved Magnus form approximation of saturation vapor pressure, J. Appl. Meteorol., 35, 601–609, https://doi.org/10.1175/1520-0450(1996)035<3C0601:IMFAOS>3E2.0.CO;2, 1996. a
Baas, M., Pancost, R., van Geel, B., and Damsté, J. S. S.: A comparative study of lipids in Sphagnum species, Org. Geochem., 31, 535–541, https://doi.org/10.1016/S0146-6380(00)00037-1, 2000. a
Bakkelund, A., Porter, T. J., Froese, D. G., and Feakins, S. J.: Net fractionation of hydrogen isotopes in n-alkanoic acids from soils in the northern boreal forest, Org. Geochem., 125, 1–13, https://doi.org/10.1016/j.orggeochem.2018.08.005, 2018. a, b, c, d
Balascio, N. L., D'Andrea, W. J., Anderson, R. S., and Wickler, S.: Influence of vegetation type on n-alkane composition and hydrogen isotope values from a high latitude ombrotrophic bog, Org. Geochem., 121, 48–57, https://doi.org/10.1016/j.orggeochem.2018.03.008, 2018. a, b, c, d
Berke, M. A., Sierra, A. C., Bush, R., Cheah, D., and O'Connor, K.: Controls on leaf wax fractionation and δ2H values in tundra vascular plants from western Greenland, Geochim. Cosmochim. Ac., 244, 565–583, https://doi.org/10.1016/j.gca.2018.10.020, 2019. a, b, c
Bintanja, R. and Selten, F.: Future increases in Arctic precipitation linked to local evaporation and sea-ice retreat, Nature, 509, 479–482, https://doi.org/10.1038/nature13259, 2014. a
Bowen, G. J. and Revenaugh, J.: Interpolating the isotopic composition of modern meteoric precipitation, Water Resour. Res., 39, https://doi.org/10.1029/2003WR002086, 2003. a, b, c
Bowen, G. J., Wassenaar, L. I., and Hobson, K. A.: Global application of stable hydrogen and oxygen isotopes to wildlife forensics, Oecologia, 143, 337–348, https://doi.org/10.1007/s00442-004-1813-y, 2005. a, b, c
Box, J. E., Colgan, W. T., Christensen, T. R., Schmidt, Niels Martin Lund, M., Parmentier, F.-J. W., Brown, R., Bhatt, U. S., Euskirchen, E. S., Romanovsky, V. E., Walsh, J. E., Overland, J. E., Wang, M., Corell, R. W., Meier, W. N., Wouters, B., Mernild, S., Mård, J., Pawlak, J., and Olsen, M. S.: Key indicators of Arctic climate change: 1971–2017, Environ. Res. Lett., 14, 045010, https://doi.org/10.1088/1748-9326/aafc1b, 2019. a
Bray, E. and Evans, E.: Distribution of n-paraffins as a clue to recognition of source beds, Geochim. Cosmochim. Ac., 22, 2–15, https://doi.org/10.1016/0016-7037(61)90069-2, 1961. a
Briner, J. P., Michelutti, N., Francis, D. R., Miller, G. H., Axford, Y., Wooller, M. J., and Wolfe, A. P.: A multi-proxy lacustrine record of Holocene climate change on northeastern Baffin Island, Arctic Canada, Quaternary Res., 65, 431–442, https://doi.org/10.1016/j.yqres.2005.10.005, 2006. a
Broadman, E., Kaufman, D. S., Henderson, A. C., Malmierca-Vallet, I., Leng, M. J., and Lacey, J. H.: Coupled impacts of sea ice variability and North Pacific atmospheric circulation on Holocene hydroclimate in Arctic Alaska, P. Natl. Acad. Sci. USA, 117, 33034–33042, https://doi.org/10.1073/pnas.2016544117, 2020. a
Burlett, R., Trueba, S., Bouteiller, X. P., Forget, G., Torres-Ruiz, J. M., Martin-StPaul, N. K., Parise, C., Cochard, H., and Delzon, S.: Minimum leaf conductance during drought: unravelling its variability and impact on plant survival, New Phytol., 246, 1001–1014, https://doi.org/10.1111/nph.70052, 2025. a
Bush, R. T. and McInerney, F. A.: Leaf wax n-alkane distributions in and across modern plants: Implications for paleoecology and chemotaxonomy, Geochim. Cosmochim. Ac., 117, 161–179, https://doi.org/10.1016/j.gca.2013.04.016, 2013. a, b, c, d, e, f, g, h
Bush, R. T. and McInerney, F. A.: Influence of temperature and C4 abundance on n-alkane chain length distributions across the central USA, Org. Geochem., 79, 65–73, https://doi.org/10.1016/j.orggeochem.2014.12.003, 2015. a, b
Cerling, T. E. and Harris, J. M.: Carbon isotope fractionation between diet and bioapatite in ungulate mammals and implications for ecological and paleoecological studies, Oecologia, 120, 347–363, https://doi.org/10.1007/s004420050868, 1999. a
Chiasson-Poirier, G., Franssen, J., Lafrenière, M., Fortier, D., and Lamoureux, S.: Seasonal evolution of active layer thaw depth and hillslope-stream connectivity in a permafrost watershed, Water Resour. Res., 56, e2019WR025828, https://doi.org/10.1029/2019WR025828, 2020. a
Chikaraishi, Y. and Naraoka, H.: δ13C and δD relationships among three n-alkyl compound classes (n-alkanoic acid, n-alkane and n-alkanol) of terrestrial higher plants, Org. Geochem., 38, 198–215, https://doi.org/10.1016/j.orggeochem.2006.10.003, 2007. a
Cluett, A., Thomas, E., Evans, S., and Keys, P.: Seasonal variations in moisture origin explain spatial contrast in precipitation isotope seasonality on coastal western Greenland, J. Geophys. Res.-Atmos., 126, e2020JD033543, https://doi.org/10.1029/2020JD033543, 2021. a
Daniels, W. C., Russell, J. M., Giblin, A. E., Welker, J. M., Klein, E. S., and Huang, Y.: Hydrogen isotope fractionation in leaf waxes in the Alaskan Arctic tundra, Geochim. Cosmochim. Ac., 213, 216–236, https://doi.org/10.1016/j.gca.2017.06.028, 2017. a, b, c
Dansgaard, W.: Stable isotopes in precipitation, Tellus, 16, 436–468, https://doi.org/10.3402/tellusa.v16i4.8993, 1964. a
Diefendorf, A. F. and Freimuth, E. J.: Extracting the most from terrestrial plant-derived n-alkyl lipids and their carbon isotopes from the sedimentary record: A review, Org. Geochem., 103, 1–21, https://doi.org/10.1016/j.orggeochem.2016.10.016, 2017. a, b, c
Diefendorf, A. F., Mueller, K. E., Wing, S. L., Koch, P. L., and Freeman, K. H.: Global patterns in leaf 13C discrimination and implications for studies of past and future climate, P. Natl. Acad. Sci. USA, 107, 5738–5743, https://doi.org/10.1073/pnas.0910513107, 2010. a, b
Diefendorf, A. F., Freeman, K. H., Wing, S. L., and Graham, H. V.: Production of n-alkyl lipids in living plants and implications for the geologic past, Geochim. Cosmochim. Ac., 75, 7472–7485, https://doi.org/10.1016/j.gca.2011.09.028, 2011. a
Dion-Kirschner, H., McFarlin, J. M., Masterson, A. L., Axford, Y., and Osburn, M. R.: Modern constraints on the sources and climate signals recorded by sedimentary plant waxes in west Greenland, Geochim. Cosmochim. Ac., 286, 336–354, https://doi.org/10.1016/j.gca.2020.07.027, 2020. a, b, c, d, e
Eglinton, G. and Hamilton, R. J.: Leaf Epicuticular Waxes: The waxy outer surfaces of most plants display a wide diversity of fine structure and chemical constituents, Science, 156, 1322–1335, https://doi.org/10.1126/science.156.3780.1322, 1967. a
Elmendorf, S. C., Henry, G. H. R., Hollister, R. D., Björk, R. G., Bjorkman, A. D., Callaghan, T. V., Collier, L. S., Cooper, E. J., Cornelissen, J. H. C., Day, T. A., Fosaa, A. M., Gould, W. M., Grétarsdóttir, J., Harte, J., Hermanutz, L., Hik, D. S., Hofgaard, A., Jarrad, F., Jónsdóttir, I. S., Keuper, F., Klanderud, K., Klein, J. A., Koh, S., Kudo, G., Lang, S. I., Loewen, V., May, J. L., Mercado, J., Michelsen, A., Molau, U., Myers-Smith, I. H., Oberbauer, S. F., Pieper, S., Post, E., Rixen, C., Robinson, C. H., Schmidt, N. M., Shaver, G. R., Stenström, A., Tolvanen, A., Totland, Ø., Troxler, T., Wahren, C.-H., Webber, P. J., Welker, J. M., and Wookey, P. A.: Plot-scale evidence of tundra vegetation change and links to recent summer warming, Nat. Clim. Change, 2, 453–457, https://doi.org/10.1038/nclimate1465, 2012. a
Farquhar, G. D., O'Leary, M. H., and Berry, J. A.: On the relationship between carbon isotope discrimination and the intercellular carbon dioxide concentration in leaves, Funct. Plant Biol., 9, 121–137, https://doi.org/10.1071/PP9820121, 1982. a
Feakins, S. J.: Pollen-corrected leaf wax D/H reconstructions of northeast African hydrological changes during the late Miocene, Palaeogeogr. Palaeocl., 374, 62–71, https://doi.org/10.1016/j.palaeo.2013.01.004, 2013. a
Feakins, S. J. and Sessions, A. L.: Controls on the D/H ratios of plant leaf waxes in an arid ecosystem, Geochim. Cosmochim. Ac., 74, 2128–2141, https://doi.org/10.1016/j.gca.2010.01.016, 2010. a, b
Feakins, S. J., Bentley, L. P., Salinas, N., Shenkin, A., Blonder, B., Goldsmith, G. R., Ponton, C., Arvin, L. J., Wu, M. S., Peters, T., et al.: Plant leaf wax biomarkers capture gradients in hydrogen isotopes of precipitation from the Andes and Amazon, Geochim. Cosmochim. Ac., 182, 155–172, https://doi.org/10.1016/j.gca.2016.03.018, 2016. a, b
Ficken, K. J., Li, B., Swain, D., and Eglinton, G.: An n-alkane proxy for the sedimentary input of submerged/floating freshwater aquatic macrophytes, Org. Geochem., 31, 745–749, https://doi.org/10.1016/S0146-6380(00)00081-4, 2000. a
Freimuth, E. J., Diefendorf, A. F., Lowell, T. V., and Wiles, G. C.: Sedimentary n-alkanes and n-alkanoic acids in a temperate bog are biased toward woody plants, Org. Geochem., 128, 94–107, https://doi.org/10.1016/j.orggeochem.2019.01.006, 2019. a
Gao, L., Edwards, E. J., Zeng, Y., and Huang, Y.: Major evolutionary trends in hydrogen isotope fractionation of vascular plant leaf waxes, PloS One, 9, e112610, https://doi.org/10.1371/journal.pone.0112610, 2014. a, b, c
Garcin, Y., Schefuß, E., Schwab, V. F., Garreta, V., Gleixner, G., Vincens, A., Todou, G., Séné, O., Onana, J.-M., Achoundong, G., et al.: Reconstructing C3 and C4 vegetation cover using n-alkane carbon isotope ratios in recent lake sediments from Cameroon, Western Central Africa, Geochim. Cosmochim. Ac., 142, 482–500, https://doi.org/10.1016/j.gca.2014.07.004, 2014. a
Gloor, G. B., Macklaim, J. M., Pawlowsky-Glahn, V., and Egozcue, J. J.: Microbiome datasets are compositional: and this is not optional, Front. Microbiol., 8, 2224, https://doi.org/10.3389/fmicb.2017.02224, 2017. a
Gold, W. G. and Bliss, L. C.: Water limitations and plant community development in a polar desert, Ecology, 76, 1558–1568, https://doi.org/10.2307/1938157, 1995. a
Gorbey, D., Thomas, E., Sauer, P., Raynolds, M., Miller, G., Corcoran, M., Cowling, O., Crump, S., Lovell, K., and Raberg, J.: Modern eastern Canadian Arctic lake water isotopes exhibit latitudinal patterns in inflow seasonality and minimal evaporative enrichment, Paleoceanogr. Paleocl., 37, e2021PA004384, https://doi.org/10.1029/2021PA004384, 2022. a, b, c
Hersbach, H., Bell, B., Berrisford, P., Hirahara, S., Horányi, A., Muñoz-Sabater, J., Nicolas, J., Peubey, C., Radu, R., Schepers, D., Simmons, A., Soci, C., Abdalla, S., Abellan, X., Balsamo, G., Bechtold, P., Biavati, G., Bidlot, J., Bonavita, M., De Chiara, G., Dahlgren, P., Dee, D., Diamantakis, M., Dragani, R., Flemming, J., Forbes, R., Fuentes, M., Geer, A., Haimberger, L., Healy, S., Hogan, R. J., Hólm, E., Janisková, M., Keeley, S., Laloyaux, P., Lopez, P., Lupu, C., Radnoti, G., de Rosney, P., Rozum, I., Vamborg, F., Villaume, S., and Thépaut, J.-N.: The ERA5 global reanalysis, Q. J. Roy. Meteor. Soc., 146, 1999–2049, https://doi.org/10.1002/qj.3803, 2020. a, b, c
Hoffmann, B., Kahmen, A., Cernusak, L. A., Arndt, S. K., and Sachse, D.: Abundance and distribution of leaf wax n-alkanes in leaves of Acacia and Eucalyptus trees along a strong humidity gradient in northern Australia, Org. Geochem., 62, 62–67, https://doi.org/10.1016/j.orggeochem.2013.07.003, 2013. a, b, c
Hollister, K. V., Thomas, E. K., Raynolds, M. K., Bültmann, H., Raberg, J. H., Miller, G. H., and Sepúlveda, J.: Aquatic and terrestrial plant contributions to sedimentary plant waxes in a modern Arctic lake setting, J. Geophys. Res.-Biogeo., 127, e2022JG006903, https://doi.org/10.1029/2022JG006903, 2022. a, b, c, d, e, f, g
Holtzman, H., Thomas, E. K., Erb, M., Marshall, L., Castañeda, I. S., Kaufman, D., McKay, N. P., and Melles, M.: Early Holocene atmospheric circulation changes over northern Europe based on isotopic and biomarker evidence from Kola Peninsula, Paleoceanogr. Paleocl., 40, e2024PA005076, https://doi.org/10.1029/2024PA005076, 2025. a
Howard, S., McInerney, F., Caddy-Retalic, S., Hall, P., and Andrae, J.: Modelling leaf wax n-alkane inputs to soils along a latitudinal transect across Australia, Org. Geochem., 121, 126–137, https://doi.org/10.1016/j.orggeochem.2018.03.013, 2018. a
IPCC: Climate change 2023: Synthesis report, summary for policymakers. Contribution of working groups I, II and III to the sixth assessment report of the intergovernmental panel on climate change, in: Climate Change 2023: Synthesis Report, edited by: Lee, H. and Romero, J., 35–115, https://doi.org/10.59327/IPCC/AR6-9789291691647, 2023. a
Kahmen, A., Hoffmann, B., Schefuß, E., Arndt, S. K., Cernusak, L. A., West, J. B., and Sachse, D.: Leaf water deuterium enrichment shapes leaf wax n-alkane δD values of angiosperm plants II: Observational evidence and global implications, Geochim. Cosmochim. Ac., 111, 50–63, https://doi.org/10.1016/j.gca.2012.09.004, 2013a. a
Kahmen, A., Schefuß, E., and Sachse, D.: Leaf water deuterium enrichment shapes leaf wax n-alkane δD values of angiosperm plants I: Experimental evidence and mechanistic insights, Geochim. Cosmochim. Ac., 111, 39–49, https://doi.org/10.1016/j.gca.2012.09.003, 2013b. a
Lewandowska, M., Keyl, A., and Feussner, I.: Wax biosynthesis in response to danger: its regulation upon abiotic and biotic stress, New Phytol., 227, 698–713, https://doi.org/10.1111/nph.16571, 2020. a
Lindberg, K.: Arctic terrestrial plant wax code and data v1.0.2, Zenodo [code], https://doi.org/10.5281/zenodo.17924824, 2025. a
Lindberg, K., Thomas, E., Raynolds, M., Bültmann, H., and Raberg, J.: Plant wax n-alkanoic acid and n-alkane carbon chain-length distributions and stable carbon and hydrogen isotope ratio data from terrestrial Arctic vegetation (2003–2021), Arctic Data Center [data set], https://doi.org/10.18739/A20P0WS80, 2025. a
Liu, H., Wang, S., Wang, H., Cao, Y., Hu, J., and Liu, W.: Apparent fractionation of hydrogen isotope from precipitation to leaf wax n-alkanes from natural environments and manipulation experiments, Sci. Total Environ., 877, 162970, https://doi.org/10.1016/j.scitotenv.2023.162970, 2023. a, b, c
Liu, J., Zhao, J., He, D., Huang, X., Jiang, C., Yan, H., Lin, G., and An, Z.: Effects of plant types on terrestrial leaf wax long-chain n-alkane biomarkers: Implications and paleoapplications, Earth-Sci. Rev., 235, 104248, https://doi.org/10.1016/j.earscirev.2022.104248, 2022. a, b, c, d, e, f
Martín-Fernández, J. A., Barceló-Vidal, C., and Pawlowsky-Glahn, V.: Dealing with zeros and missing values in compositional data sets using nonparametric imputation, Math. Geol., 35, 253–278, https://doi.org/10.1023/A:1023866030544, 2003. a, b
Marzi, R., Torkelson, B., and Olson, R.: A revised carbon preference index, Org. Geochem., 20, 1303–1306, https://doi.org/10.1016/0146-6380(93)90016-5, 1993. a
Münchow, A., Falkner, K. K., and Melling, H.: Baffin island and west Greenland current systems in northern Baffin bay, Prog. Oceanogr., 132, 305–317, https://doi.org/10.1016/j.pocean.2014.04.001, 2015. a
O'Connor, K. F., Berke, M. A., and Ziolkowski, L. A.: Hydrogen isotope fractionation in modern plants along a boreal-tundra transect in Alaska, Org. Geochem., 147, 104064, https://doi.org/10.1016/j.orggeochem.2020.104064, 2020. a, b, c, d
Pedregosa, F., Varoquaux, G., Gramfort, A., Michel, V., Thirion, B., Grisel, O., Blondel, M., Prettenhofer, P., Weiss, R., Dubourg, V., Vanderplas, J., Passos, A., Cournapeau, D., Brucher, M., Perrot, M., and Duchesney, É.: Scikit-learn: Machine learning in Python, J. Mach. Learn. Res., 12, 2825–2830, 2011. a
Post-Beittenmiller, D.: Biochemistry and molecular biology of wax production in plants, Annu. Rev. Plant Biol., 47, 405–430, https://doi.org/10.1146/annurev.arplant.47.1.405, 1996. a
Putman, A. L., Feng, X., Sonder, L. J., and Posmentier, E. S.: Annual variation in event-scale precipitation δ2H at Barrow, AK, reflects vapor source region, Atmos. Chem. Phys., 17, 4627–4639, https://doi.org/10.5194/acp-17-4627-2017, 2017. a
Renzaglia, K. S., Browning, W. B., and Merced, A.: With over 60 independent losses, stomata are expendable in mosses, Front. Plant Sci., 11, 567, https://doi.org/10.3389/fpls.2020.00567, 2020. a
Rudels, B.: Volume and freshwater transports through the Canadian Arctic Archipelago–Baffin Bay system, J. Geophys. Res.-Ocean., 116, https://doi.org/10.1029/2011JC007019, 2011. a
Sachse, D., Radke, J., and Gleixner, G.: δD values of individual n-alkanes from terrestrial plants along a climatic gradient–Implications for the sedimentary biomarker record, Org. Geochem., 37, 469–483, https://doi.org/10.1016/j.orggeochem.2005.12.003, 2006. a, b, c
Sachse, D., Billault, I., Bowen, G. J., Chikaraishi, Y., Dawson, T. E., Feakins, S. J., Freeman, K. H., Magill, C. R., McInerney, F. A., van der Meer, M. T. J., Polissar, P., Robins, R. J., Sachs, J. P., Schmidt, H.-L., Sessions, A. L., White, J. W. C., West, J. B., and Kahman, A.: Molecular paleohydrology: interpreting the hydrogen-isotopic composition of lipid biomarkers from photosynthesizing organisms, Annu. Rev. Earth Pl. Sci., 40, 221–249, https://doi.org/10.1146/annurev-earth-042711-105535, 2012. a, b, c, d
Saishree, A., Managave, S., Sarangi, V., and Sanyal, P.: Experimental evidence suggests dominance of species effect on the variability in hydrogen isotope fractionation between leaf wax compounds and source water, Org. Geochem., 183, 104656, https://doi.org/10.1016/j.orggeochem.2023.104656, 2023. a, b, c
Shanahan, T. M., Hughen, K. A., Ampel, L., Sauer, P. E., and Fornace, K.: Environmental controls on the 2H/1H values of terrestrial leaf waxes in the eastern Canadian Arctic, Geochim. Cosmochim. Ac., 119, 286–301, https://doi.org/10.1016/j.gca.2013.05.032, 2013. a
Shepherd, T. and Wynne Griffiths, D.: The effects of stress on plant cuticular waxes, New Phytol., 171, 469–499, https://doi.org/10.1111/j.1469-8137.2006.01826.x, 2006. a
Sullivan, P. F. and Welker, J. M.: Variation in leaf physiology of Salix arctica within and across ecosystems in the High Arctic: test of a dual isotope (Δ13C and Δ18O) conceptual model, Oecologia, 151, 372–386, https://doi.org/10.1007/s00442-006-0602-1, 2007. a
Thomas, E. K., Briner, J. P., Ryan-Henry, J. J., and Huang, Y.: A major increase in winter snowfall during the middle Holocene on western Greenland caused by reduced sea ice in Baffin Bay and the Labrador Sea, Geophys. Res. Lett., 43, 5302–5308, https://doi.org/10.1002/2016GL068513, 2016. a
Thomas, E. K., Cluett, A. A., Erb, M. P., McKay, N. P., Briner, J. P., Castañeda, I. S., Corcoran, M. C., Cowling, O. C., Gorbey, D. B., Lindberg, K. R., Prince, K. K., and Salacup, J.: Early Holocene Laurentide ice sheet retreat influenced summer atmospheric circulation in Baffin Bay, Geophys. Res. Lett., 50, e2023GL103428, https://doi.org/10.1029/2023GL103428, 2023. a
Tipple, B. J. and Pagani, M.: Environmental control on eastern broadleaf forest species' leaf wax distributions and D/H ratios, Geochim. Cosmochim. Ac., 111, 64–77, https://doi.org/10.1016/j.gca.2012.10.042, 2013. a, b, c
Tipple, B. J., Berke, M. A., Doman, C. E., Khachaturyan, S., and Ehleringer, J. R.: Leaf-wax n-alkanes record the plant–water environment at leaf flush, P. Natl. Acad. Sci. USA, 110, 2659–2664, https://doi.org/10.1073/pnas.1213875110, 2013. a, b
Virtanen, P., Gommers, R., Oliphant, T. E., Haberland, M., Reddy, T., Cournapeau, D., Burovski, E., Peterson, P., Weckesser, W., Bright, J., van der Walt, S. J., Brett, M., Wilson, J., Millman, K. J., Mayorov, N., Nelson, A. R. J., Jones, E., Kern, R., Larson, E., Carey, C. J., Polat, İ., Feng, Y., Moore, E. W., VanderPlas, J., Laxalde, D., Perktold, J., Cimrman, R., Henriksen, I., Quintero, E. A., Harris, C. R., Archibald, A. M., Ribeiro, A. H., Pedregosa, F., van Mulbregt, P., and SciPy 1.0 Contributors: SciPy 1.0: fundamental algorithms for scientific computing in Python, Nature methods, 17, 261–272, https://doi.org/10.1038/s41592-019-0686-2, 2020. a
Walker, D. A., Raynolds, M. K., Daniëls, F. J. A., Einarsson, E., Elvebakk, A., Gould, W. A., Katenin, A. E., Kholod, S. S., Markon, C. J., Melnikov, E. S., Moskalenko, N. G., Talbot, S. S., Yurtsev, B. A., and The other members of the CAVM Team: The circumpolar Arctic vegetation map, J. Veg. Sci., 16, 267–282, https://doi.org/10.1111/j.1654-1103.2005.tb02365.x, 2005. a, b
Wang, Y., Liu, Z., Zhang, M., Dai, G., and Huang, X.: Temperature dominates leaf wax n-alkane carbon isotope composition of terrestrial C3 angiosperms in humid zones, Geochim. Cosmochim. Ac., 396, 42–50, https://doi.org/10.1016/j.gca.2025.01.045, 2025. a
Weber, J. and Schwark, L.: Epicuticular wax lipid composition of endemic European Betula species in a simulated ontogenetic/diagenetic continuum and its application to chemotaxonomy and paleobotany, Sci. Total Environ., 730, 138324, https://doi.org/10.1016/j.scitotenv.2020.138324, 2020. a
Wilkie, K., Chapligin, B., Meyer, H., Burns, S., Petsch, S., and Brigham-Grette, J.: Modern isotope hydrology and controls on δD of plant leaf waxes at Lake El'gygytgyn, NE Russia, Clim. Past, 9, 335–352, https://doi.org/10.5194/cp-9-335-2013, 2013. a
Woo, M.-k.: Permafrost hydrology, Springer Science & Business Media, https://doi.org/10.1007/978-3-642-23462-0, 2012. a
Yang, D. and Bowen, G. J.: Integrating plant wax abundance and isotopes for paleo-vegetation and paleoclimate reconstructions: a multi-source mixing model using a Bayesian framework, Clim. Past, 18, 2181–2210, https://doi.org/10.5194/cp-18-2181-2022, 2022. a, b
Yang, H., Pagani, M., Briggs, D. E., Equiza, M., Jagels, R., Leng, Q., and LePage, B. A.: Carbon and hydrogen isotope fractionation under continuous light: implications for paleoenvironmental interpretations of the High Arctic during Paleogene warming, Oecologia, 160, 461–470, https://doi.org/10.1007/s00442-009-1321-1, 2009. a
Yang, H., Liu, W., Leng, Q., Hren, M. T., and Pagani, M.: Variation in n-alkane δD values from terrestrial plants at high latitude: Implications for paleoclimate reconstruction, Org. Geochem., 42, 283–288, https://doi.org/10.1016/j.orggeochem.2011.01.006, 2011. a
Yeats, T. H. and Rose, J. K.: The formation and function of plant cuticles, Plant Phys., 163, 5–20, https://doi.org/10.1104/pp.113.222737, 2013. a
Yu, X., Zhang, M., Yang, G., Zeng, L., Chen, X., Lü, X., and Huang, X.: Aquatic plants dominate the sources of long-chain n-alkanes in floodplain lakes in the middle and lower reaches of the Yangtze River, Chem. Geol., 648, 121967, https://doi.org/10.1016/j.chemgeo.2024.121967, 2024. a
Zibulski, R., Wesener, F., Wilkes, H., Plessen, B., Pestryakova, L. A., and Herzschuh, U.: C N ratio, stable isotope (δ13C, δ15N), and n-alkane patterns of brown mosses along hydrological gradients of low-centred polygons of the Siberian Arctic, Biogeosciences, 14, 1617–1630, https://doi.org/10.5194/bg-14-1617-2017, 2017. a