the Creative Commons Attribution 4.0 License.
the Creative Commons Attribution 4.0 License.
 | 21 Apr 2026
Technical note: Development of an extraction protocol and colorimetric analysis for alginate in marine sediment
Sota Nakazato
Takashi Kawahara
Reiji Ichii
Shingo Akita
Akira Inoue
Masaki Fujita
Hideyuki Kurihara
Mitsuhiro Nakaya
Atsushi Ooki
In this study, we developed a novel extraction method for alginate, a major organic component derived from brown algae, in marine sediments and evaluated its applicability for quantitative analysis. Alginate analytical methods have been established in food chemistry: we modified these techniques to apply them to marine sediments, which are characterized by the cation composition (e.g., Ca, Mg, Fe) and humic substance-like high-molecular-weight organic compounds. By modifying the protocol through the addition of EDTA-2Na and the omission of ethanol precipitation, we improved the extraction efficiency of alginate from marine sediments, as demonstrated by spike recovery tests where recoveries of Na+-Alg significantly increased from 38.7 % with the conventional method to 64.7 %–82.6 %. Enzymatic degradation tests using alginate lyase confirmed that a portion of the extracted uronic acids from marine sediments (at least 34 %) was derived from alginate, verifying its presence in the natural samples. Using this modified method, alginate contents in sediment samples from coastal waters around Hokkaido, Japan, were quantified as 6.11–26.0 mg m−2 in Funka Bay, 39.0–41.3 mg m−2 in Hakodate Bay, 11.8–14.7 mg m−2 off Cape Esan, and 58.3–74.1 mg m−2 off Muroran. However, these values may be overestimated due to the presence of other uronic acids; therefore, they should be interpreted with caution rather than being directly equated with absolute alginate content.
- Article
(1153 KB) - Full-text XML
-
Supplement
(878 KB) - BibTeX
- EndNote


The role of marine plants in promoting carbon sequestration in the ocean interior, and hence their role in mitigating global warming, has attracted increasing attention. The carbon sequestration potential of marine plants, particularly seaweeds, mangroves, and salt marshes, is collectively referred to as “blue carbon” (Nellemann et al., 2009). Recently, the contribution of macroalgae to blue carbon has gained attention as an effective approach to reducing atmospheric CO2 levels (Hill et al., 2015). Recent studies using environmental DNA, collection of macroalgal debris with trawls, and stable carbon isotope analyses have provided evidence for the transport of organic matter derived from macroalgae to the deep ocean (Miyajima et al., 2022; Wei et al., 2012; Fischer and Wiencke, 1992). Among the three major groups of macroalgae – brown, red, and green – brown algae account for approximately half of the total macroalgal biomass and are the dominant group, particularly in temperate and subpolar coastal oceans (Cai et al., 2021; Steneck et al., 2002). Brown algae contain a polysaccharide, alginate, which is composed of uronic acids and accounts for 20 %–30 % of their dry weight (Usov et al., 2001). In this study, we focused on alginate as a major organic component derived from brown algae.
Uronic acids are monosaccharides characterized by a terminal carboxyl group (–COOH); four primary types with distinct stereochemical configurations – glucuronic, galacturonic, mannuronic, and guluronic acids – are commonly reported in the marine environment (Bergamaschi et al., 1999), where they form various polysaccharides through glycosidic linkages. Alginate is a linear polysaccharide composed of two epimeric uronic acid residues, β-D-mannuronic acid [M] and α-L-guluronic acid [G], which form various block structures (MM, GG, and MG blocks) (Yang et al., 2011). Although also produced by certain bacteria, alginate is primarily derived from the cell walls and intercellular matrix of brown algae (Szekalska et al., 2016), which is considered to be predominant source in the marine environment from a biomass perspective. Another major uronic-acid-containing polysaccharide is pectin, primarily composed of polymerized galacturonic acid (Gerschenson, 2017). Pectin is produced by a wide range of terrestrial and marine plants, including several types of phytoplankton that contribute significantly to marine primary production (Domozych et al., 2007). Both alginate and pectin form gels through ionic interactions between their carboxy groups and polyvalent cations (Ca2+, Cu2+, and Fe3+), whereas monovalent cations such as Na+ and K+ promote solubilization. In particular, alginate forms significantly more rigid and mechanically stable gels through the “egg-box” model compared to the weaker structures formed by pectin (Grant et al., 1973; Fang et al., 2008).
In brown algae cells, alginate primarily exists as various alginate salts (e.g., Ca2+, Na+, Mg2+, and K+), with these cations derived from seawater (Usov and Zelinsky, 2013). While brown algae are considered a significant source of organic carbon, direct evidence of their contribution to carbon transport into the deep ocean remains limited. Although analytical methods for alginate have been established for food samples (Kawasaki et al., 1998), their application to marine sediments can be hampered by the complex matrix, including the cation composition, the trace levels of alginate present, and the coexistence of other polyuronic acids like pectin. Particularly in the pore water of ocean sediments, high concentrations of iron ions interact with alginate to form stable, insoluble iron (III) alginate (Fe3+-Alg) gel, which can significantly inhibit extraction efficiency (Klinkhammer, 1980; Menakbi et al., 2016). In this study, our aim was to develop a novel method for quantifying alginate in marine sediment, based on conventional food analysis techniques, and to apply this method to samples collected from the continental shelf to the shelf slope.
2.1 Sediment sample collection
Ocean sediment was collected in December 2023 and March, August, October, and December 2024 from the seafloor of Funka Bay, Hokkaido, Japan (Fig. 1). Funka Bay is a semi-enclosed bay with a maximum depth of 96 m, and brown algae inhabit the shore of the bay. In the bay, subarctic water dominates from early spring (March) to middle summer (August), and subtropical water enters in autumn (September–November) (Ohtani and Kido, 1980). Sediment samples were collected using a grab sampler with a mouth area of 900 cm2 (30 cm × 30 cm). The surface layer (0–1 cm depth) of the soft mud sediment was collected in a plastic bag and stored in a freezer (−20 °C). Additional ocean sediment samples were collected in June 2024 from Hakodate Bay (30 m depth; soft mud sediment) and from the continental shelf slope in the coastal Pacific off Hokkaido (off Cape Esan; 300 m depth; sandy mud sediment), and in February 2025 from off the coast of Muroran (off Muroran; 20 m depth; soft mud sediment), using the same procedure, equipment, and storage conditions as those used for Funka Bay ones.
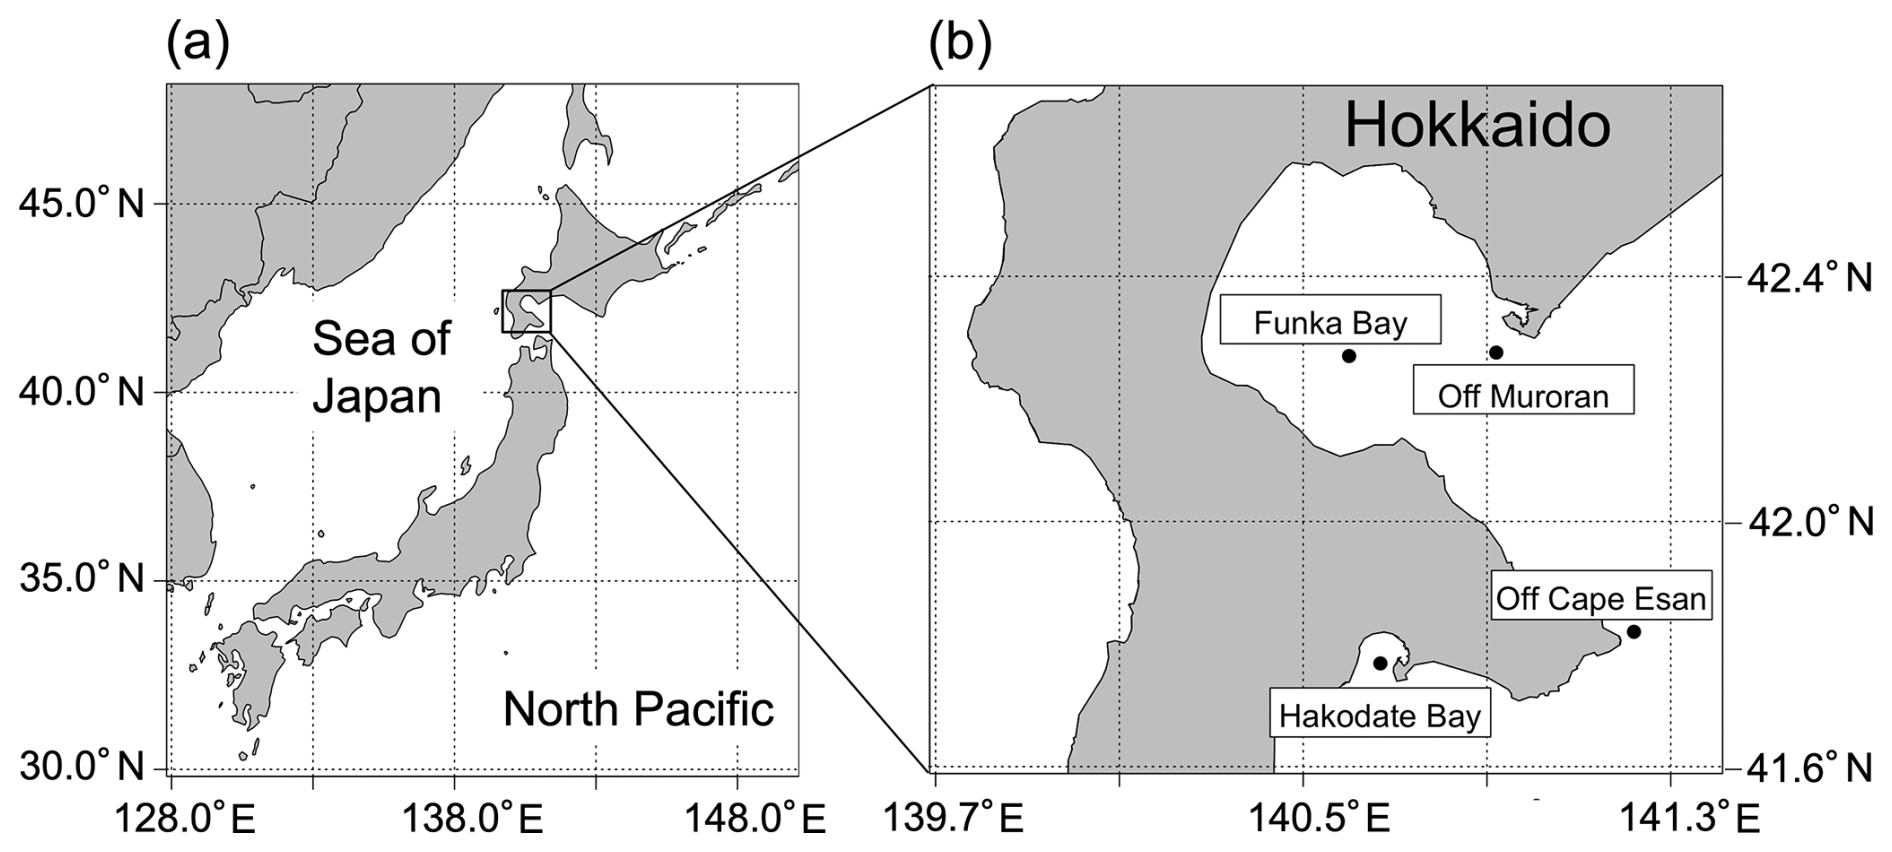
Figure 1Sampling sites in Funka Bay, Hakodate Bay, off Cape Esan, and off Muroran. (a) Geography of Japan's islands; (b) sampling sites around Hokkaido.
2.2 Colorimetric analysis of alginate by the m-hydroxydiphenyl method
Estimation of alginate content is commonly conducted using colorimetric methods that quantify uronic acids because of their simplicity and ease of application. These methods typically rely on the formation of colored complexes between uronic acids and specific reagents, such as carbazole and m-hydroxydiphenyl (Kumar and Kumar, 2017). We measured alginate in the extracted sample with a colorimetric method, the m-hydroxydiphenyl method, following the procedure of Hung and Santschi (2001). Hung and Santschi (2001) used sulfamate to reduce the interference of browning neutral carbohydrates; however, it has been reported that addition of sulfamate can suppress the color development of uronic acids (Filisetti-Cozzi and Carpita, 1991). Given the potential reduction in color development when measuring trace amounts of alginate in marine sediments, in this study, the sulfamate addition was omitted from the original protocol of Hung and Santschi (2001) to improve sensitivity. Two reagents were used in the colorimetric analysis of alginate.
Reagent A: a 75 mmol L−1 sodium tetraborate decahydrate (Wako, Osaka, Japan, purity ≥ 99 %) was prepared in concentrated sulfuric acid (H2SO4, Wako, purity ≥ 95 %).
Reagent B: 1.5 g L−1 3-phenylphenol (Sigma-Aldrich, St. Louis, USA, purity 85 %) was prepared in 5.0 g L−1 sodium hydroxide (NaOH, Wako, purity ≥ 97 %) solutions. The reagent B container was covered with aluminum foil and stored in a refrigerator.
A 0.80 mL aliquot of sample solution was pipetted into a centrifuge tube, then 4.8 mL of reagent A was added to the tube. The sample was manually mixed in an ice-water bath for 1 min to cool it to room temperature (25 °C). Subsequently, the tube was heated at 100 °C for 10 min in a boiling water bath (7.0 L) and was then immediately cooled in the ice-water bath. After cooling to room temperature, 60 µL of reagent B was added to the tube and mixed gently. After 5 min, the absorbance was measured at 525 nm with a 1 cm cell using a spectrophotometer (U-2900, HITACHI, Tokyo, Japan). This colorimetric assay was performed simultaneously on six samples within a single measurement run.
Standard solutions (0, 10, 20, 40, 60, and 100 µg mL−1) were freshly prepared for each analysis using a sodium alginate reagent (Na+-Alg, 500–600 cP, Wako, 1st grade) and Milli-Q water. A calibration curve for Na+-Alg (0–100 µg mL−1) is shown in Fig. 2a. The regression equation we obtained was “”. Several blank samples (Milli-Q water added with Reagents A and B) were also measured (n=5). We determined the lower limit of quantification as a sample absorbance equal to 10 times the standard deviation of the blank sample (SD = 0.00040, n=5), which corresponds to 0.0040 abs (= 10-fold SD) and 0.74 µg mL−1. To confirm the quantitative accuracy near the lower limit, a calibration curve for low concentrations of alginate (0, 1.0, 2.0, 4.0, 6.0, and 10 µg mL−1) was prepared (Fig. 2b). The regression equation for low concentrations was “”. The slopes of the calibration curve differed depending on the concentration range; thus, we used separate regression equations for the low (0–10 µg mL−1) and high (10–100 µg mL−1) concentration ranges.
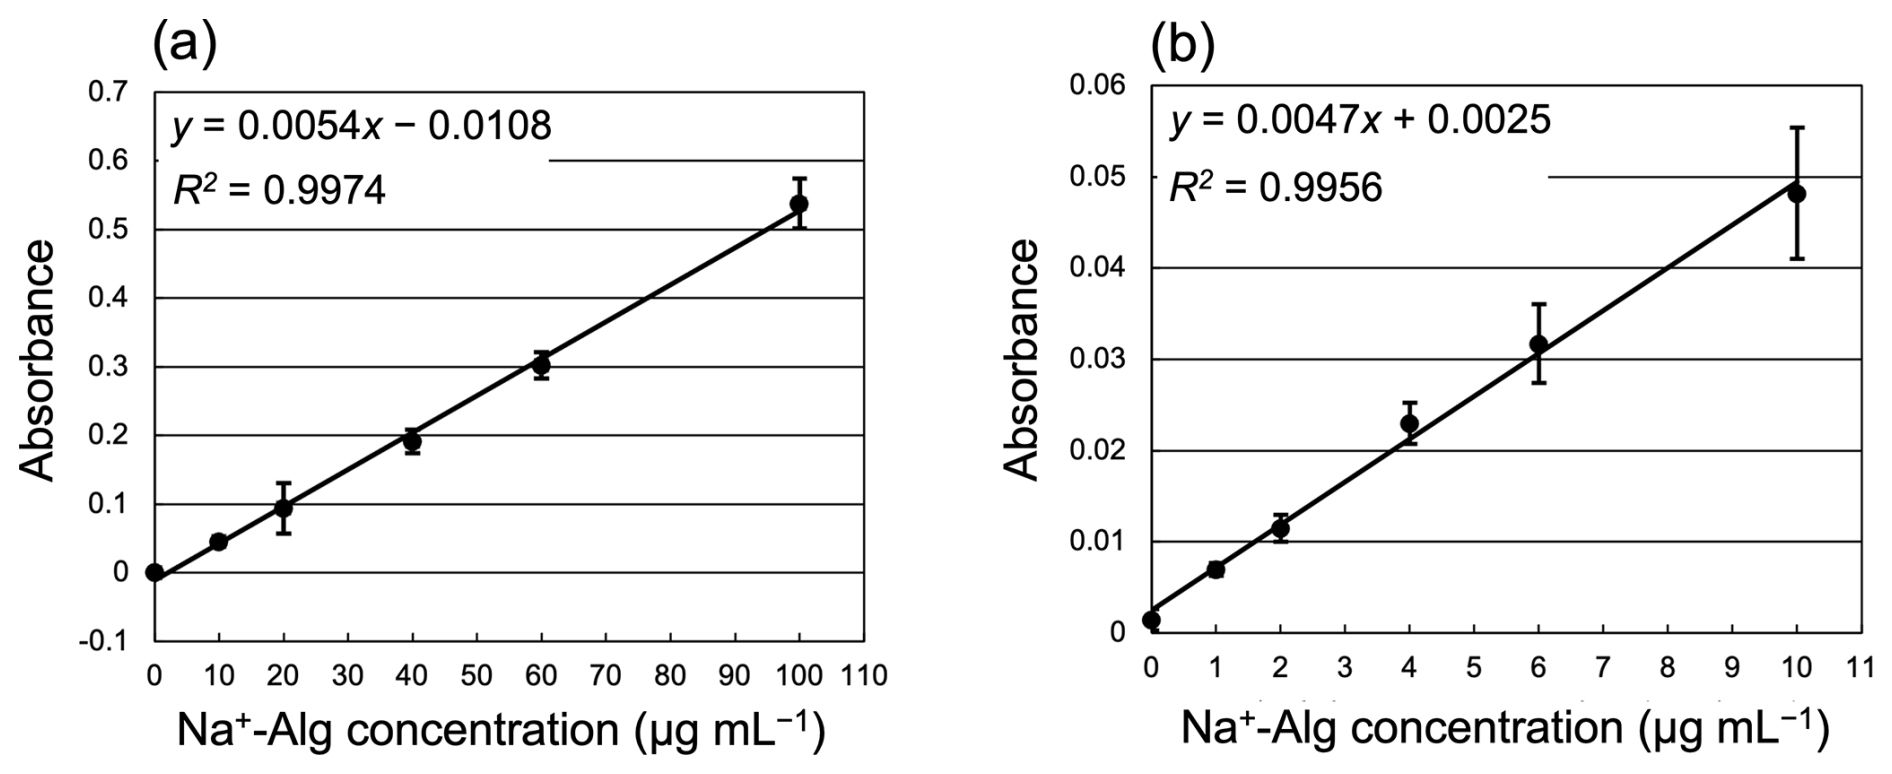
Figure 2Calibration curves of Na+-Alg measurement by the colorimetric method. (a) High concentrations (10–100 µg mL−1, n=5); (b) low concentrations (0–10 µg mL−1, n=4). Error bars indicate one standard deviation.
2.3 Alginate extraction by a conventional food chemistry protocol
We prepared three sediment samples, each with a wet weight of 300 g, from muddy sediment rich in organic material collected from Funka Bay (Fig. 1) in December 2023. The weight of 300 g corresponds approximately to the amount of sediment material obtained from the upper 0–1 cm layer using a grab sampler. The test samples (n=3) were treated by the conventional alginate extraction method used in food chemistry (Kawasaki et al., 1998; Udagawa et al., 2013), as follows (Steps 1–7).
Preparation of test sediment samples
To prepare test samples, 500 mL of Milli-Q water and 20 mL of a 10 g L−1 sodium alginate (Na+-Alg) solution containing 200 mg of Na+-Alg were added to 300 g of each sediment sample (n=3) in a beaker, followed by stirring for 5 min. These samples were labeled “sediment + Na+-Alg 200 mg”. The resulting suspensions were stored overnight (12 h) at 4 °C to allow the added Na+-Alg to transform into naturally occurring alginate forms, such as magnesium alginate (Mg2+-Alg), Ca2+-Alg, and Fe3+-Alg gel. Although previous studies have not clearly identified the chemical forms of alginate in marine sediments, we hypothesized that ion exchange would occur between Na+-Alg and Mg2+, Ca2+ or Fe3+ ions, all of which are abundant in seawater and the pore water of ocean sediments (Masuzawa and Kitano, 1983; Klinkhammer, 1980). The rationale for the selective interaction of Fe3+ – but not Fe2+ – with alginate to form a gel is discussed in Sect. 3.2.1. After this treatment, alginate in the samples was presumed to exist as a mixture of gelled forms (Ca2+-Alg and Fe3+-Alg) and soluble salts (Na+-Alg and Mg2+-Alg).
Step 1 Enzymatic treatment to remove cellulose, lipids, proteins, and pectin
To remove impurities such as soluble sugars, proteins, and pectin from the sediment sample, enzymatic treatment was employed. A total of 0.80 g of each of the following four enzymes was sequentially added to the sediment suspension: amylase (KOKULASE™, Mitsubishi Chemical, Tokyo, Japan); cellulase (SCLASE™C, Mitsubishi Chemical); protease (KOKULASE™P Granule, Mitsubishi Chemical); and pectinase (SCLASE™N, Mitsubishi Chemical). Each enzymatic reaction was performed for 30 min under optimized conditions according to the manufacturer's specifications: amylase at 27 °C and pH 6.0; cellulase at 50 °C and pH 6.0; protease at 50 °C and pH 5.5; and pectinase at 38 °C and pH 4.2. A hot stirrer was used to maintain the reaction temperature during stirring. The pH of each reaction suspension was adjusted as necessary by adding 1.0 mol L−1 hydrochloric acid (HCl) and 3.0 mol L−1 NaOH solution. Following this enzymatic treatment, alginate in the suspension sample was presumed to exist as a mixture of gelled forms (Ca2+-Alg and Fe3+-Alg) and soluble salts (Na+-Alg and Mg2+-Alg). Pectin in the sample was presumed to have been enzymatically degraded into monosaccharides, primarily galacturonic acid.
Step 2 Gelation of Na+-Alg and acidification to remove non-targeted compounds
To convert soluble alginate (Na+-Alg and Mg2+-Alg) into Ca2+-Alg gel in the sediment suspension, 100 mL of 100 g L−1 calcium chloride (CaCl2, Wako, purity ≥ 95 %) solution was added to the sample and stirred for 5 min. Subsequently, approximately 15 mL of 5.0 mol L−1 HCl was added to adjust the pH to 1.0, and the suspension was kept overnight at room temperature (25 °C). After the reaction, the resulting approximately 900 mL suspension was divided into eight 45 mL centrifuge tubes and centrifuged (3500 rpm, 10 min, 2380 × g). The supernatant from each tube was carefully removed, and 40 mL of 0.10 mol L−1 HCl was added to each tube. The tubes were manually shaken to ensure thorough mixing, followed by centrifugation to remove the acidified supernatant. This acid treatment and the subsequent removal of the supernatant served to eliminate polyvalent cations (e.g., Ca2+ and Mg2+), acid-soluble phenolic compounds, and easily degradable polysaccharides such as fucoidans from the sediment sample (Bertagnolli et al., 2014). During this process, a portion of the Ca2+-Alg was presumed to have undergone ion exchange with H+, forming insoluble H+-Alg (McHugh et al., 2001). Following this step, alginate in the sediment sample was presumed to exist as a mixture of gelled forms (Ca2+-Alg and Fe3+-Alg) and protonated alginate (H+-Alg) in a gelatinous form. Pectin was presumed to have been removed with the supernatant, because depolymerized pectin is generally considered unable to form stable gel networks through Ca2+ crosslinking.
Step 3 Alkaline extraction to dissolve alginate gel
Most of the sediment containing alginate gels in each tube was transferred to a single beaker using a spoon. To recover any remaining precipitate in tubes, all eight tubes were rinsed with 500 mL of 10 g L−1 sodium bicarbonate (NaHCO3, Wako, purity ≥ 99.5 %) solution, and the rinse solution was collected into a beaker. The resulting suspension in the beaker was heated to 60 °C with continuous stirring for 1.5 h, followed by reaction overnight at room temperature to convert the alginate gel to Na+-Alg. Following this step, alginate in the suspension sample was presumed to exist primarily as soluble Na+-Alg; however, if Fe3+-Alg was not soluble under the alkaline conditions (pH 8.0) of the NaHCO3 solution, it may have remained in a gel form, as described in Sect. 3.2.1.
Step 4 Gelation of Na+-Alg into Ca2+-Alg
The pH of the suspension was adjusted to 5.0 by adding an appropriate volume of 1.0 mol L−1 HCl. After centrifugation, the supernatant was collected into a beaker. Subsequently, 100 mL of 300 g L−1 CaCl2 solution was added to the supernatant, and the mixture was kept overnight at room temperature to convert soluble Na+-Alg to Ca2+-Alg gel. Following centrifugation, the supernatant was removed, and the resulting precipitate was retained in the tubes. Then, an excess amount of Ca2+ was added to completely react with the CO ions derived from the previously added NaHCO3 solution, thereby ensuring efficient ion exchange between Na+-Alg and Ca2+. After this step, alginate in the precipitate sample was presumed to exist as Ca2+-Alg (gel form).
Step 5 Hydrochloric acid washing to remove oligosaccharides
Twenty milliliters of 0.10 mol L−1 HCl was added to each centrifuge tube containing the precipitates. The tubes were manually shaken to ensure thorough mixing, followed by centrifugation to remove the acidified supernatant. This acid-washing treatment was repeated until oligosaccharides were no longer detected in the supernatant. To verify the presence of oligosaccharides, the phenol-sulfuric acid colorimetric method was employed: 1.0 mL of the supernatant was transferred to a centrifuge tube, to which 1.0 mL of 50 g L−1 phenol (Wako, purity ≥ 99 %) solution was added and mixed. Subsequently, 5.0 mL of H2SO4 was quickly added and mixed thoroughly. After 10 min, the appearance of a yellow color in the solution, indicating the presence of oligosaccharides, was monitored. If color was observed, an additional round of acid-washing treatment was performed. When the solution remained colorless, confirming the absence of detectable oligosaccharides, the acid-washing treatment was terminated. The precipitates from each centrifuge tube were then collected into a single beaker using a spoon. After this HCl treatment, alginate in the precipitate sample was presumed to exist as a mixture of Ca2+-Alg (gel form) and H+-Alg (gelatinous form).
Step 6 Collection of Na+-Alg
One hundred milliliters of 10 g L−1 NaHCO3 solution was added to a beaker containing the precipitates. The suspension was then heated to 60 °C with continuous stirring for 1.5 h, followed by reaction overnight at room temperature to convert Ca2+-Alg to Na+-Alg. After centrifugation, the supernatant was collected into a clean beaker. Following this step, alginate in the solution sample was expected to exist as soluble Na+-Alg. This extract solution appeared dark brown, likely due to the presence of residual phenolic compounds (McHugh, 1987).
Step 7 Ethanol precipitation to remove residual non-targeted compounds
To remove non-targeted compounds soluble in organic solvents, such as pigmentation, fats, and phenolic compounds, 400 mL of ethanol (Wako, purity: 99.5 %) was added to the beaker containing the extract solution (Saji et al., 2022; Trica et al., 2019). The ethanol–water mixture was kept overnight at room temperature to precipitate alginate, because alginate is insoluble in ethanol (Gomez et al., 2009). The resulting precipitate was collected by filtration using a polycarbonate membrane filter (Nuclepore, Whatman, Maidstone, UK; pore size: 10 µm, diameter: 47 mm). The filter with the retained precipitate was transferred to a beaker and air-dried overnight at room temperature. Subsequently, 100 mL of 10 g L−1 NaHCO3 solution was added to the beaker containing the dried filter, and the mixture was stirred for 1.0 h. The solution was then kept overnight at room temperature to ensure complete dissolution of Na+-Alg. After centrifugation, the supernatant was recovered; however, it exhibited a slight brown coloration. To reduce the coloration and ensure compatibility with colorimetric analysis, the supernatant was diluted 20-fold with Milli-Q water and analyzed colorimetrically as described in Sect. 2.2. However, if trace amounts of Na+-Alg are soluble in ethanol, significant loss may occur during the extraction of trace levels of Na+-Alg from ocean sediment, as described in Sect. 3.2.2.
2.4 Collection of phytoplankton aggregates
In the marine environment, phytoplankton are the dominant primary producers, and thus a substantial proportion of the organic matter deposited on the seafloor is presumed to originate from them. Phytoplankton are also known to produce uronic acids, including glucuronic acid derived from structural polysaccharides and galacturonic acid derived from pectin, both of which are constituents of the cell wall (Bergamaschi et al., 1999; Gügi et al., 2015; Domozych et al., 2007). To ensure the accuracy of the modified alginate extraction protocol described in Sect. 3.2.3, it was necessary to confirm that polyuronic acids other than alginate are not detected from phytoplankton aggregate samples by the modified extraction protocol.
Phytoplankton aggregates were collected from the water column in Funka Bay (Hokkaido, Japan, Fig. 1) during the peak of the spring phytoplankton bloom in March of 2018, 2019, and 2021. Sampling was conducted using a plankton net with a mouth area of 707 cm2 (mesh size: 300 µm; mouth diameter: 30cm) towed from near the seafloor (87m depth) to the surface. During the bloom, the chlorophyll-a concentrations in the water reached approximately 20 µg L−1. It has been reported that approximately half of the annual primary production in Funka Bay occurs during the spring bloom, with a substantial portion of diatom aggregates sinking and being deposited on the seafloor (Kudo et al., 2000). We assumed that the amount of phytoplankton aggregates collected by the plankton net corresponded to the sedimented amount of polyuronic acids derived from phytoplankton on the seafloor surface within the same area (30cm diameter). The collected phytoplankton samples (n= 3) were processed using the modified extraction protocol (described in Sect. 3.2.3) and analyzed colorimetrically (as described in Sect. 2.2) to evaluate the detectability of polyuronic acids derived from the phytoplankton samples.
2.5 Verification of alginate assisted with alginate-degrading enzyme
Colorimetric methods estimate alginate content by quantifying uronic acids; however, these methods may also detect uronic acids derived from sources other than alginate, potentially leading to overestimation. To verify that the extracted material from the ocean sediment was alginate, we employed an alginate lyase to confirm its presence through enzymatic degradation. The alginate lyase used in this study was HULK (NIPPON GENE, Tokyo, Japan), which is the most effective enzyme for formation of oligosaccharide from only alginate polymers.
HULK most preferably degrades MM blocks, by splitting glycosyl linkages of the alginate chain via the β-elimination mechanism (Inoue et al., 2014). When alginate is present in the extract solution, the enzymatic reaction catalyzed by HULK proceeds to degrade the alginate polymer into di- and trisaccharides. The addition of Ca2+ to di- and trisaccharides derived from alginate does not induce gelation, because these low-molecular-weight fragments lack the chain length required for effective crosslinking with Ca2+. Therefore, if the extract solution was treated with HULK and subsequently subjected to Ca2+ addition, a significant reduction in calcium-induced precipitation would indicate that the original extract had contained an amount of alginate.
The analytical sample was 75mL of the solution extracted from 1.8kg of sediment collected off Muroran (Fig. 1), prepared by using the modified extraction protocol (described in Sect. 3.2.3).
The extract solution appeared dark brown, similar in color to algal extracts rich in polyphenols as reported by Andriamanantoanina and Rinaudo (2010), suggesting the possible presence of polyphenols in the sample. It has been reported that polyphenols can form complexes with carbohydrates such as alginates and proteins, thereby inhibiting enzymatic activity, and that the inhibition of alginate degradation by alginate lyase is correlated with the concentration of soluble polyphenols (Moen et al., 1997). Therefore, it is essential to remove polyphenols from the sample prior to enzymatic degradation.
2.5.1 Bleaching treatment
Bleaching treatment has been reported to effectively remove pigments from alginate extracts derived from dark brown algae, which are presumed to be rich in polyphenols, although direct quantification was not performed in that study (Andriamanantoanina and Rinaudo, 2010). Therefore, in the present study, bleaching treatment was applied to reduce the polyphenol content in the extract solution.
Three hundred and seventy-five milliliters of 24 mL L−1 sodium hypochlorite (NaClO, Wako) solution was added to 75 mL of extract solution in a beaker and stirred for 20 min. Subsequently, 188 mL of Milli-Q water was added, followed by neutralization with 0.05 mol L−1 HCl. Then, 20 mL of 300 g L−1 CaCl2 was added, and the mixture was kept overnight at room temperature to convert soluble Na+-Alg to Ca2+-Alg gel. The following day, the precipitate was collected by centrifugation and transferred to a clean beaker. Forty milliliters of 10 g L−1 NaHCO3 solution was added to the precipitate, and the suspension was heated to 60 °C with continuous stirring for 1.5 h, followed by reaction overnight at room temperature to convert Ca2+-Alg to Na+-Alg. Finally, the supernatant was collected by centrifugation. To reduce the coloration of the extract solution as much as possible, this bleaching process was repeated six times with appropriate adjustments to the reagent quantities (Table 1). After the final bleaching step, the volume of the sample was reduced to 15 mL. The same procedure was also applied to 75 mL of 10 µg mL−1 Na+-Alg solution.
Table 1Reagent quantities used in each repetition of the bleaching treatment
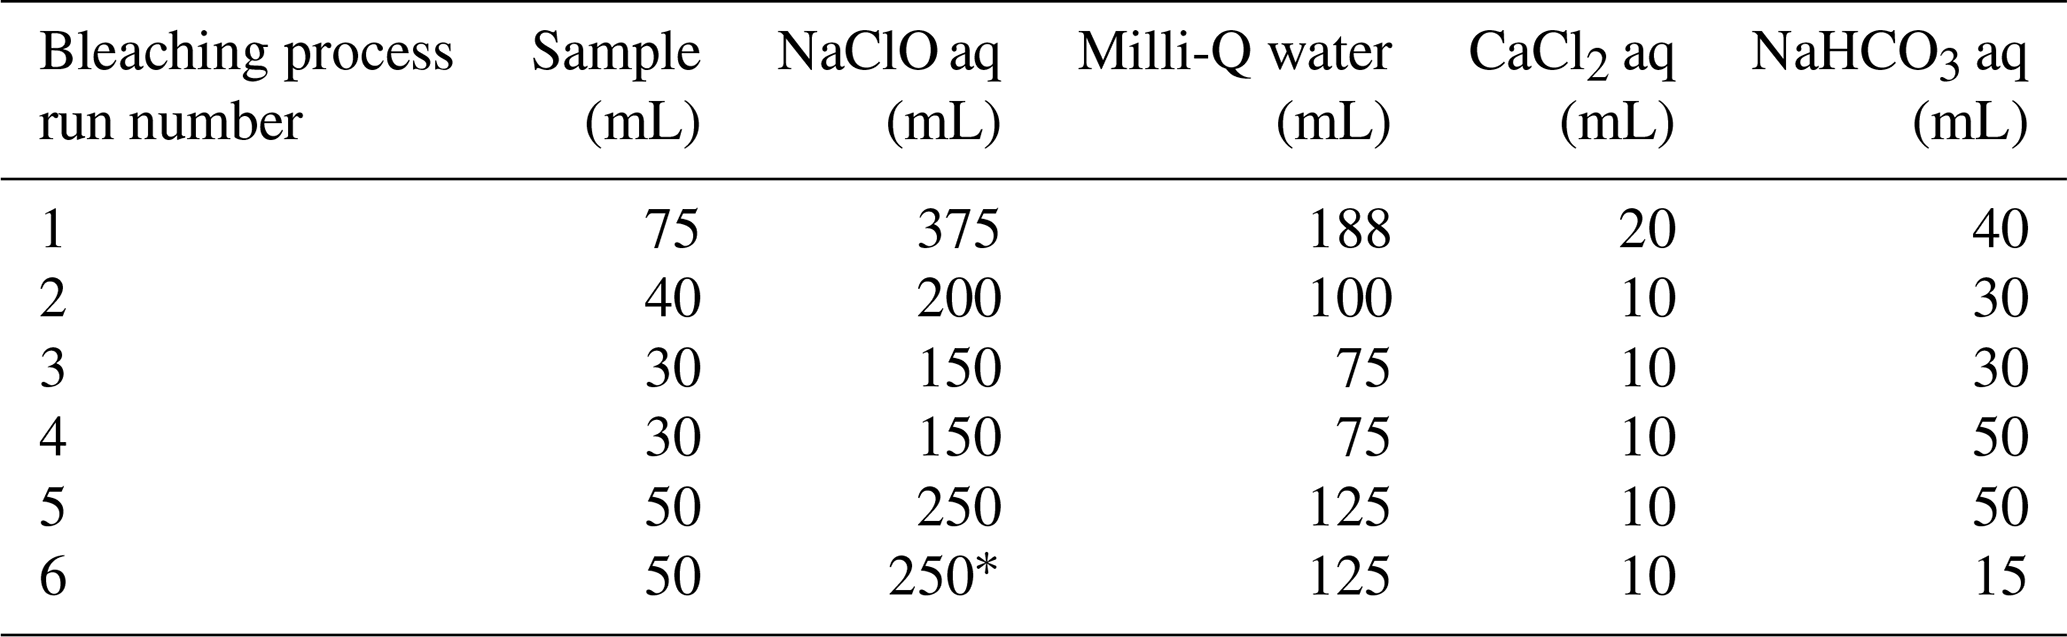
* NaClO concentration was 36 mL L−1 for this experimental run only; the concentration in all other runs was 24 mL L−1.
2.5.2 Enzymatic degradation of alginate
To prepare the buffer solution for adjusting pH and salinity, 1.0 mL of 1.0 mol L−1 Tris-HCl (pH 7.5, NIPPON GENE), 1.0 mL of 1.0 mol L−1 Tris-HCl (pH 8.0, NIPPON GENE), 3.0 mL of 5.0 mol L−1 sodium chloride (NaCl, Wako, purity ≥ 99.5 %) solution, and 5.0 mL of Milli-Q water were combined in a tube and thoroughly mixed. For the enzymatic reaction, 5.0 mL of Milli-Q water, 0.80 mL of the prepared buffer solution, 2.0 mL of the bleached extract solution, and 0.40 mL of alginate lyase (HULK) were sequentially added to a centrifuge tube with gentle mixing after each addition. This enzymatic degradation experiment was performed in triplicate using the same sample (n=3). In parallel, a control experiment was performed without the addition of alginate lyase. In this case, 5.0 mL of Milli-Q water, 0.80 mL of the prepared buffer solution, 2.0 mL of the bleached extract solution, and 0.40 mL of Milli-Q water instead of alginate lyase were sequentially added to a centrifuge tube with gentle mixing after each addition. The control experiment was also conducted in triplicate (n=3).
The same enzymatic experiment was performed on the bleached Na+-Alg standard solution (n=1). In addition, a blank sample (n=1) was prepared as a control using water in place of the extract solution: specifically, 5.0 mL of Milli-Q water, 0.80 mL of the buffer solution, 2.0 mL of Milli-Q water, and 0.40 mL of alginate lyase (HULK) were sequentially added to a centrifuge tube with gentle mixing. The mixtures were centrifuged (3500 rpm, 1 min, 2380 × g) to remove residual water from the inner wall surface and subsequently incubated in an incubator (SLI-220, EYELA, Tokyo, Japan) at 30 °C for one week. After incubation, the pH of each mixture was adjusted to 4.0 using 1.0 mol L−1 HCl. Subsequently, 10 mL of 300 g L−1 CaCl2 was added, and the mixtures were kept overnight at room temperature to convert Na+-Alg remaining in the mixture to Ca2+-Alg.
On the following day, the resulting precipitates were collected by filtration using polycarbonate membrane filters (Nuclepore, Whatman; pore size 0.40 µm, diameter 47 mm). At this stage, the oligomerized alginate produced by alginate lyase was expected to remain in the filtrate, because it does not form crosslinks in the presence of Ca2+. Each filter containing the precipitate was transferred into a separate tube, to which 5.0 mL of 20 g L−1 NaHCO3 solution was added. The tubes were then incubated in a 60 °C water bath for 1.5 h with gentle shaking every 10 min, followed by reaction overnight at room temperature to convert Ca2+-Alg to Na+-Alg. The supernatants were collected by centrifugation (3500 rpm, 10 min, 2380 × g), and analyzed colorimetrically as described in Sect. 2.2.
3.1 Spike recovery of alginate using the conventional food chemistry method
Table 2 shows the yield of alginate extracted from the sediment sample and the corresponding spike recovery based on the conventional extraction method as used in food chemistry. The spike recovery of Na+-Alg from the sample was found to be 36.8 %–40.7 %. These results suggest that the conventional extraction approach is not suitable for efficient recovery of alginate from ocean sediment.
Table 2Spike recovery of added Na+-Alg from ocean sediment by using the food extraction methoda
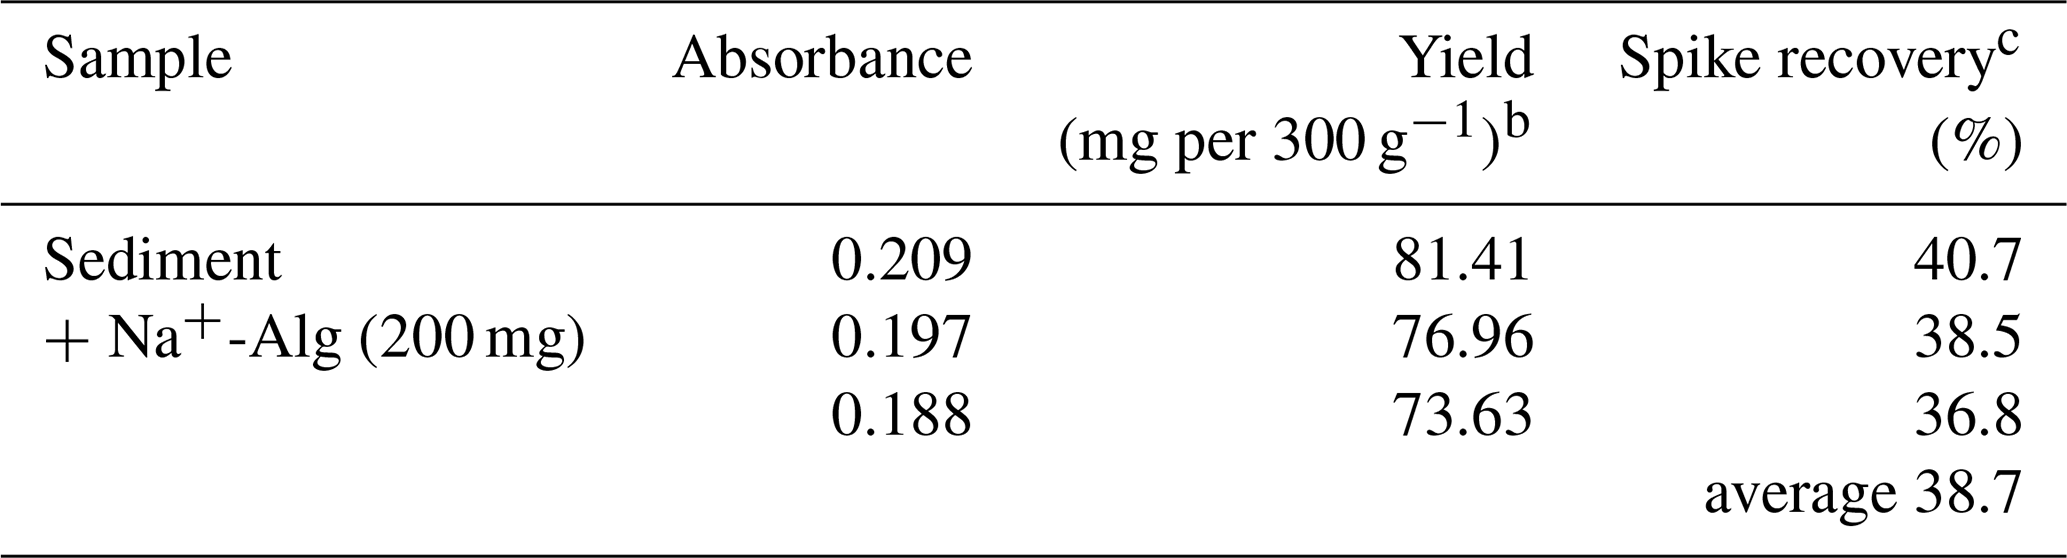
a Conventional extraction method used in food chemistry. b 300 g indicates the sediment sample weight. c Spike recovery = Yield (mg 200 mg−1).
3.2 Modification of extraction treatment
3.2.1 Dissolve Fe3+-Alg present in the sediment sample
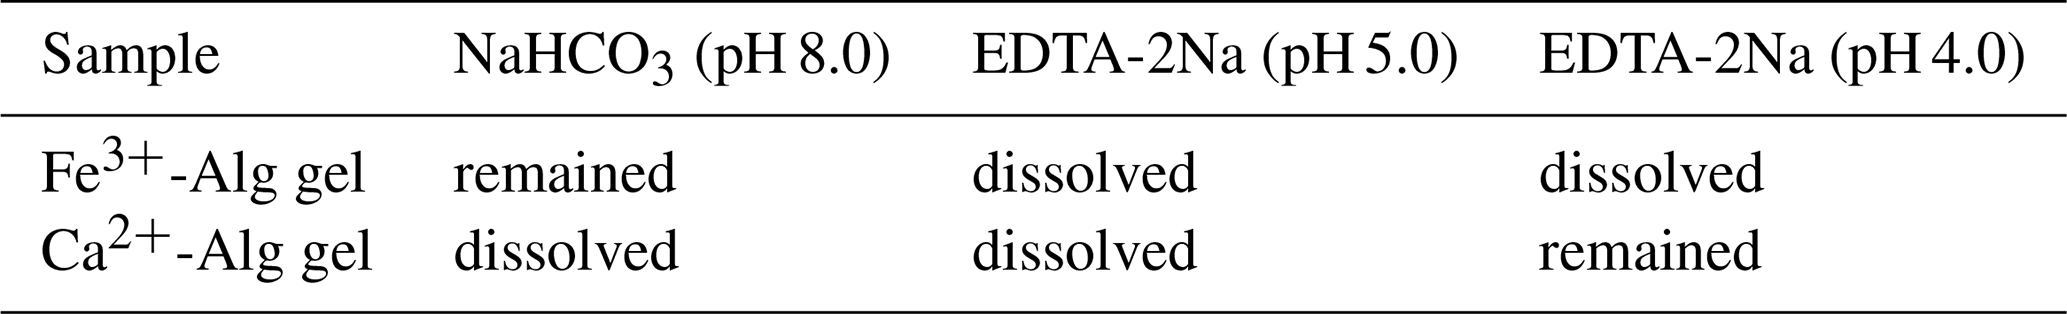
If Fe3+-Alg, formed via ion exchange between alginate and Fe3+, is present in a sediment sample, the gel may not dissolve in the NaHCO3 solution and could remain in the sediment even after alkaline treatment (Step 3), leading to reduced recovery. To address this issue, we investigated the optimal conditions for the simultaneous dissolution of both Fe3+-Alg and Ca2+-Alg gels, which are presumed to be the predominant forms of alginate present prior to the alkaline treatment. Disodium dihydrogen ethylenediamine tetraacetic acid dihydrate (EDTA-2Na) is a potent chelator that forms more stable complexes with Fe3+ than the binding affinity of Fe3+ to alginate (Berner and Hood, 1983). Because the stability of EDTA-metal complexes depends on pH (Ueno, 1959), we investigated the dissolution behavior of Fe3+-Alg and Ca2+-Alg in EDTA-2Na solutions adjusted to pH 4.0 and 5.0, and compared the results with those obtained using NaHCO3 solution at pH 8.0.
Fe3+-Alg gel was prepared by dropping 20 mL of 10 g L−1 Na+-Alg solution into 20 mL of 100 g L−1 iron (III) chloride hexahydrate (FeCl3, Wako, purity ≥ 99 %) solution in a beaker. To ensure complete reaction between Na+-Alg and Fe3+ ions, the resulting Fe3+-Alg Na+-Alg suspension was repeatedly filtered through a 100 µm stainless steel mesh using a silicone spatula. The reddish Fe3+-Alg gel retained on the mesh was collected and rinsed three times with Milli-Q water. For comparison, Ca2+-Alg gel was similarly prepared by dropping 20 mL of 10 g L−1 Na+-Alg solution into 20 mL of 100 g L−1 CaCl2 solution. Each gel type (Fe3+-Alg and Ca2+-Alg) was divided into two portions. One half of each was added to 500 mL of 10 g L−1 NaHCO3 solution and heated to 60 °C with continuous stirring for 1.5 h. The other halves were added to 500 mL of 80 g L−1 EDTA-2Na (Kanto Chemical, Tokyo, Japan, purity > 99.5 %) solution, which had an initial pH of 4.0, and stirred for 1.5 h. These suspensions were then kept overnight at room temperature. The presence or absence of remaining gel was assessed visually. Subsequently, the pH of the EDTA-2Na solution was adjusted to 5.0 by adding 3.0 mol L−1 NaOH solution. After stirring for an additional 1.5 h, the mixtures were again kept overnight at room temperature, and the presence of gel was assessed visually.
Most of the Fe3+-Alg did not dissolve in NaHCO3 (pH 8.0) solution, but it did dissolve completely in EDTA-2Na solution at pH 4.0 and pH 5.0 (Table 3). Ca2+-Alg, in contrast, was soluble in both NaHCO3 (pH 8.0) and EDTA-2Na (pH 5.0) solutions, but it remained insoluble in EDTA-2Na at pH 4.0. Based on these observations, EDTA-2Na solution at pH 5.0 was selected as the optimal condition for the simultaneous dissolution of Fe3+-Alg and Ca2+-Alg in ocean sediment samples.
Table 3Results of dissolution tests on Fe3+-Alg and Ca2+-Alg in NaHCO3 and EDTA-2Na solutions
3.2.2 Omit ethanol precipitation in the final purification step
In the field of food chemistry, Na+-Alg is generally considered to be insoluble in ethanol–water mixtures; therefore, precipitation of Na+-Alg in a 4:1 () ethanol–water solution is commonly employed as the final step in extraction and purification. However, we were concerned that trace amounts of Na+-Alg might dissolve in a 4:1 () ethanol–water solution. If such minor solubility exists, it could result in significant loss during the extraction of trace levels of Na+-Alg from ocean sediment.
To evaluate the dissolution behavior, we prepared two Na+-Alg solutions (0.50 g L−1 and 2.0 g L−1; 100 mL each) and added 400 mL of ethanol (99.5 %) to each. The mixtures were kept overnight at room temperature to allow precipitation. Afterward, each mixture was filtered through a polycarbonate membrane filter (Nuclepore, Whatman; pore size: 0.22 µm, diameter: 47 mm). The filtrates were collected and evaporated to complete dryness. The resulting residues were re-dissolved in 20mL of Milli-Q water. Subsequently, 0.50 mL of each re-dissolved sample was transferred to a separate tube and diluted 40-fold with Milli-Q water. The concentration of Na+-Alg in each diluted sample was then determined using the m-hydroxydiphenyl colorimetric method.
We observed that the 2.0 g L−1 Na+-Alg solution was partially soluble in ethanol, with approximately 66 % dissolution, whereas the 0.50 g L−1 Na+-Alg solution was completely dissolved (Table 4). These results indicate that trace amounts of alginate are soluble in ethanol. Consequently, a significant loss of alginate could occur during ethanol precipitation, particularly when extracting trace levels of alginate from ocean sediment. Therefore, the ethanol precipitation process was considered unsuitable for the extraction of alginate from sediment samples.
Table 4Dissolved amounts and loss rates of Na+-Alg in an ethanol/water (4:1) solution
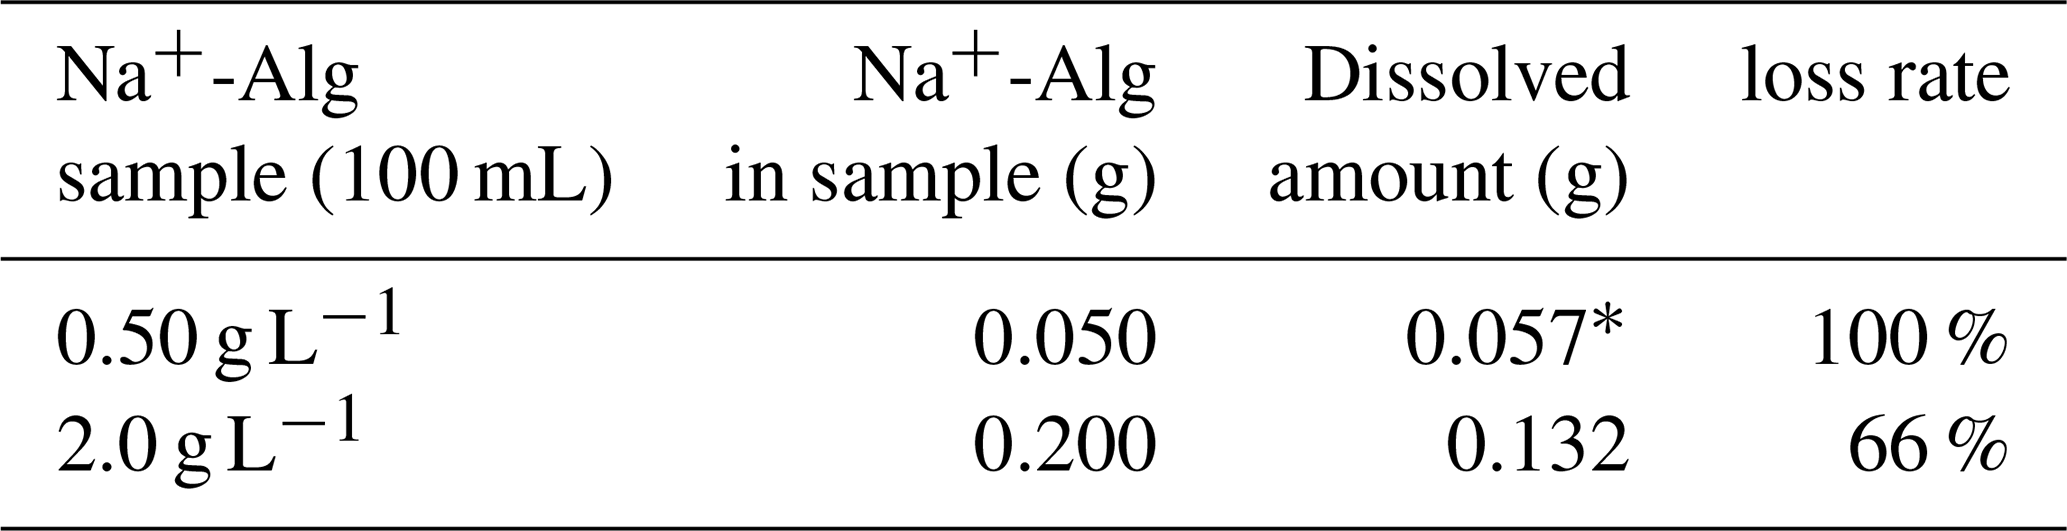
* The dissolved amount (0.057 g) was determined to be higher than the original amount (0.050 g). This value is within the analytical precision(± 15 %).
Table 5Spike recovery of added Na+-Alg from the ocean sediment when using the modified extraction protocola
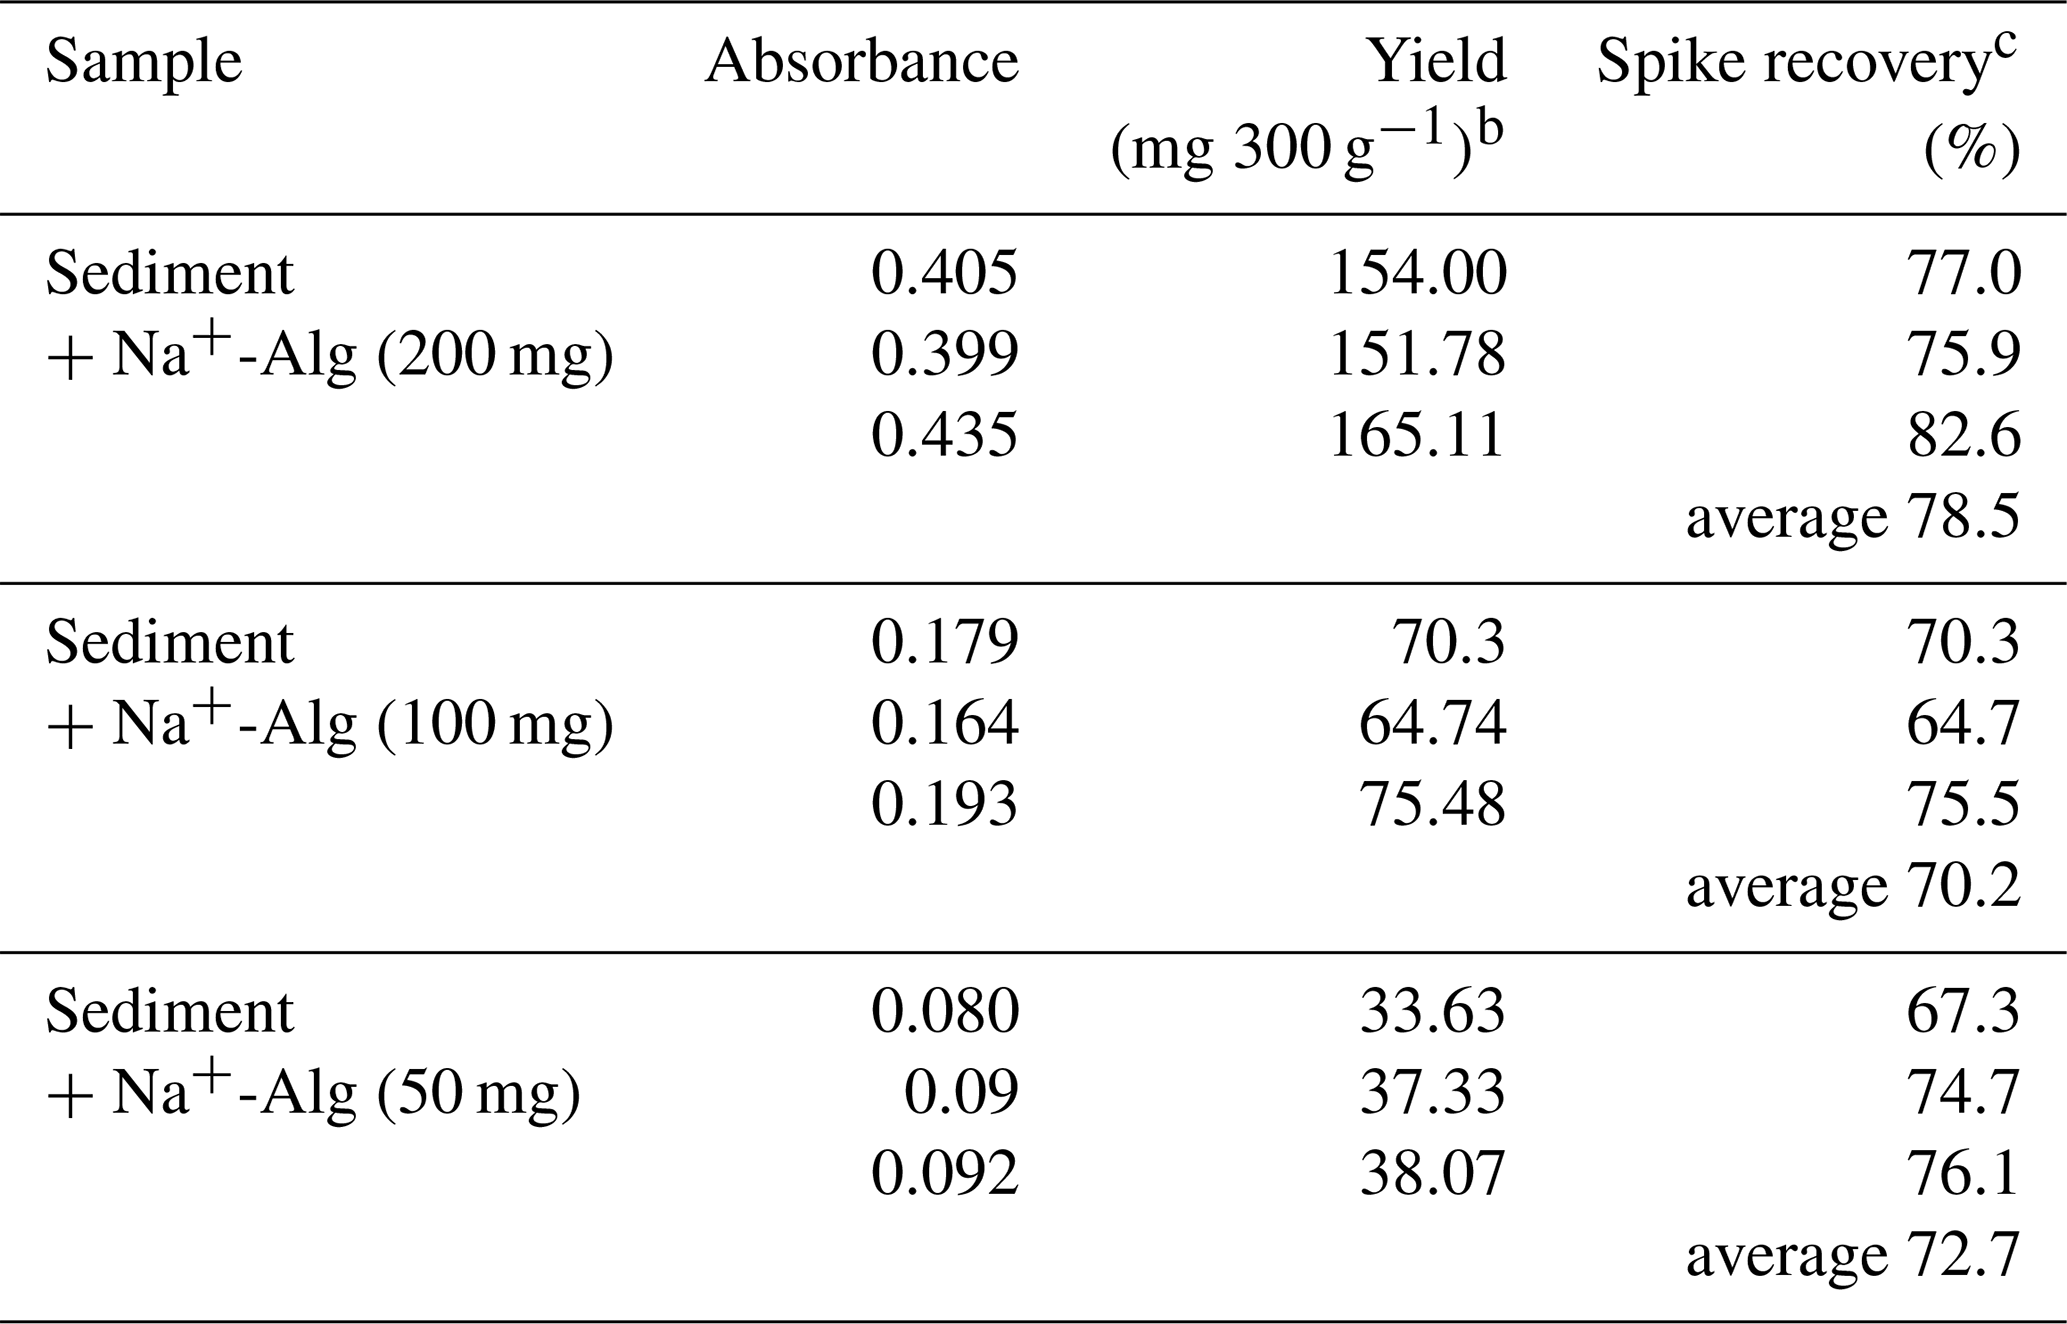
a The modified protocol includes Fe3+-Alg dissolution and does not involve ethanol precipitation. b 300 g indicates the sediment sample weight. cSpike recovery = Yield (mg 200, 100, or 50 mg−1).
3.2.3 Modified extraction protocol
We modified two key aspects of the alginate extraction protocol. First, an EDTA-2Na treatment step was introduced to dissolve Fe3+-Alg and Ca2+-Alg gels into the liquid phase. Second, the ethanol precipitation step was omitted from the final purification process to avoid significant loss of alginate. The modified extraction protocol, in which Steps 1, 2, 4, and 5 remain identical to those described in the Methods section, is presented below. A complete overview of the updated protocol for alginate extraction from ocean sediment is provided in supplementary material (Fig. S1).
We prepared nine sediment samples with a wet weight of 300 g using muddy sediment rich in organic material collected from Funka Bay (Fig. 1) in March 2024. The test samples () were treated by the modified alginate extraction method as follows (Steps 1–7).
Table 6Yield of uronic acid from plankton net samples
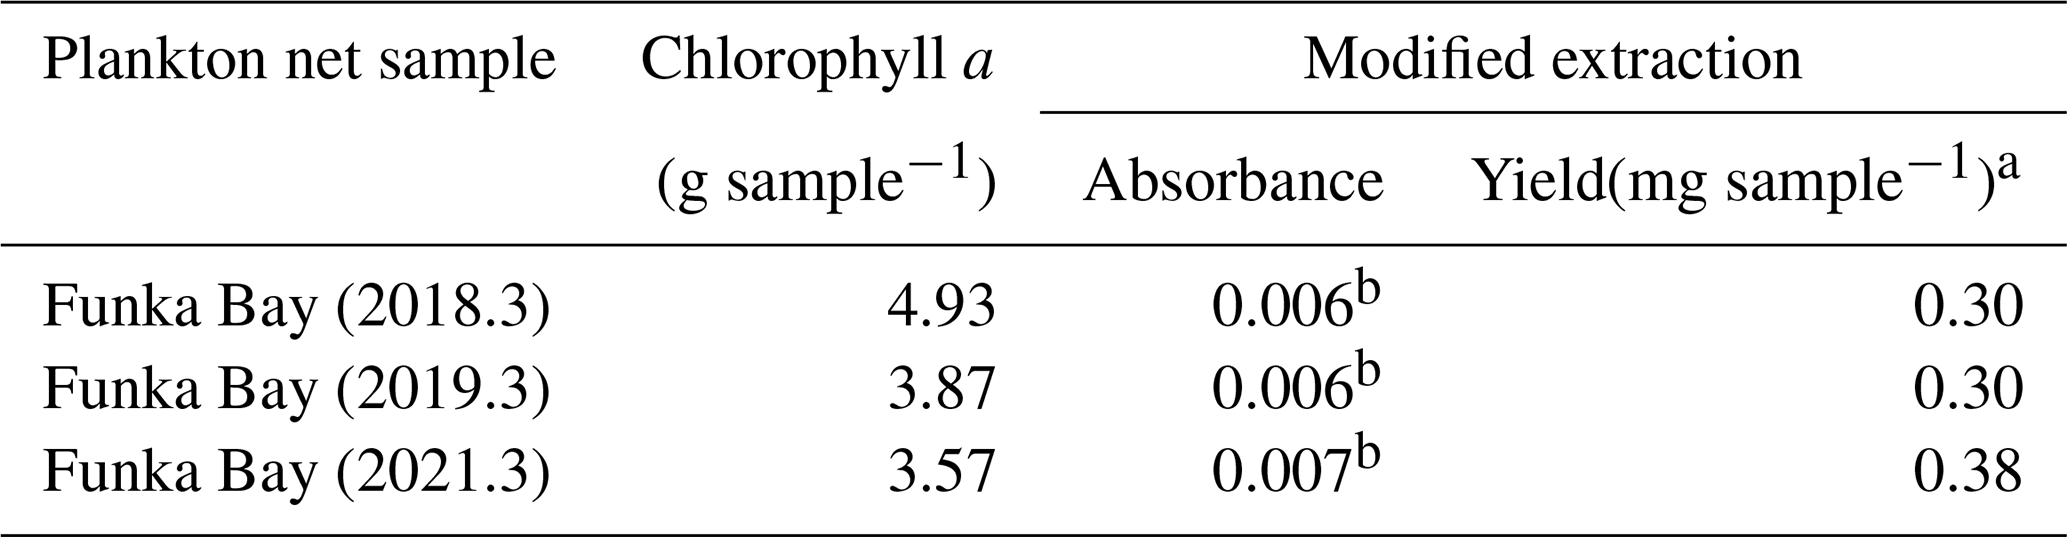
a Yield (mg) of uronic acid was converted to Na+-Alg concentration using the calibration curve in Fig. 2b. b These absorbances exceed the lower limit (absorbance = 0.0040) described in Sect. 2.2.
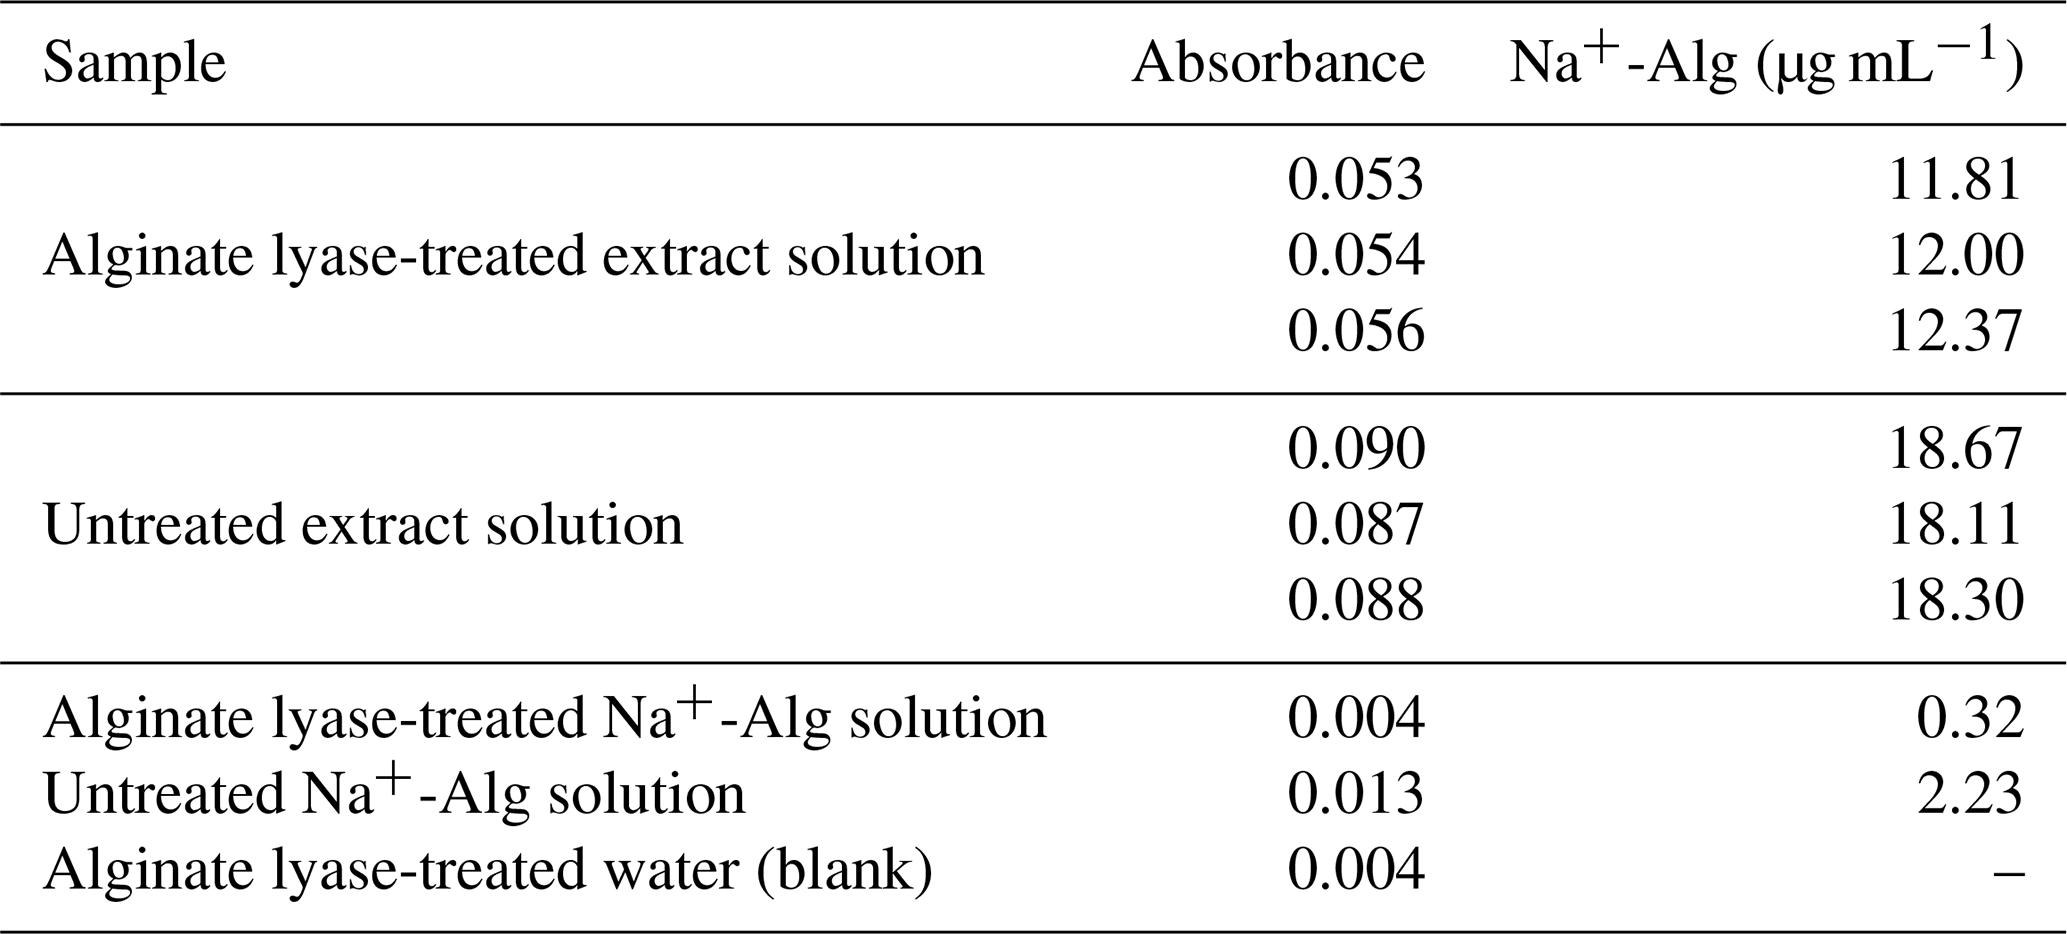
Table 7Na+-Alg concentrations of extract solution, Na+-Alg standard solution, and Milli-Q water (blank), both with and without alginate lyase treatment
Preparation of test sediment samples
To prepare the test samples, 500 mL of Milli-Q water and 20mL of Na+-Alg solutions at concentrations of 10, 5.0, and 2.5 g L−1 – containing 200, 100, and 50 mg of Na+-Alg, respectively – were added to 300g of sediment sample (n=3) in separate beakers, followed by stirring for 5 min. These samples were labeled as “sediment + Na+-Alg 200 mg,” “sediment + Na+-Alg 100 mg,” and “sediment + Na+-Alg 50 mg,” respectively. The resulting suspensions were stored overnight at 4 °C to allow the added Na+-Alg to transform into Mg2+-Alg, Ca2+-Alg gel, and Fe3+-Alg gel. After this treatment, alginate in the samples was presumed to exist as a mixture of gelled forms (Ca2+-Alg and Fe3+-Alg) and soluble salts (Na+-Alg and Mg2+-Alg).
Step 3 Alkaline extraction to dissolve alginate gel
To prepare 80 g L−1 EDTA-2Na solution, 40 g of EDTA-2Na was dissolved in 500 mL of Milli-Q water. The pH of the resulting solution was 4.0 without any adjustment. Most of the sediment containing alginate gel from each tube was transferred into a single beaker using a spoon. To recover any remaining precipitate in tubes, all eight tubes were rinsed with 500 mL of 80 g L−1 EDTA-2Na solution (pH 4.0), and the rinse solution was collected into a beaker. The resulting suspension in the beaker was stirred for 1.5 h, followed by reaction overnight at room temperature to convert Fe3+-Alg to Na+-Alg via chelation. Subsequently, the pH of the suspension was adjusted to 5.0 by adding 3.0 mol L−1 NaOH solution, followed by stirring for another 1.5h and reaction overnight at room temperature to convert Ca2+-Alg into Na+-Alg through ion exchange. Following this step, alginate in the suspension sample was presumed to exist primarily as soluble Na+-Alg.
Step 6 Collection of Na+-Alg
An appropriate volume (20–100 mL) of 10 g L−1 NaHCO3 solution, adjusted based on the estimated amount of alginate, was added to a beaker containing the precipitates to keep the alginate concentration within the range of the calibration curve (Fig. 2). For instance, 100 mL of 10 g L−1 NaHCO3 solution was added to the sample that had been supplemented with alginate during the preparation step, because it was presumed to contain a large amount of Ca2+-Alg. Conversely, for the sample without added alginate, which was presumed to contain a trace amount of Ca2+-Alg, only 20 mL of 10 g L−1 NaHCO3 solution was used. The suspension was then heated to 60 °C with continuous stirring for 1.5 h, followed by reaction overnight at room temperature to convert Ca2+-Alg to Na+-Alg. After centrifugation, the supernatant was collected into a clean bottle. Following this step, alginate in the solution sample was expected to exist as soluble Na+-Alg.
Step 7 Prepare the solution for colorimetric analysis
The extract solution appeared dark brown, likely due to the presence of residual phenolic compounds (McHugh, 1987). To reduce the coloration and ensure compatibility with colorimetric analysis, the extract solution was diluted 20–100-fold with Milli-Q water and analyzed colorimetrically as described in Sect. 2.2.
3.2.4 Spike recovery of alginate using the modified protocol
Table 5 shows the yield of alginate extracted from the sediment sample and the corresponding spike recovery based on the modified extraction protocol. We achieved higher spike recoveries (64.7 %–82.6 %) by using the modified extraction protocol than by the conventional protocol (recovery 38.7 %; Table 2). It should be noted that these efficiencies reflect the recovery of alginate naturally present in the sediment samples; therefore, the reported values may be slightly overestimated.
3.3 Interference by polyuronic acid derived from phytoplankton
Table 6 shows the yield of uronic acid extracted from the phytoplankton aggregates by applying the modified extraction protocol. The average yield was 0.33 (mg sample−1), corresponding to 23 % of the average uronic acid yield obtained from sediment samples collected in Funka Bay in August, October, and December 2024 (Fig. 1), as described in Sect. 3.5. These results indicate that although a fraction of the uronic acids (galacturonic acid or glucuronic acid) derived from phytoplankton remained in the extract solution, the modified extraction protocol effectively eliminated most of the interference from phytoplankton-derived polyuronic acids, thereby enabling the selective and efficient recovery of alginate.
Sample volumes for Funka Bay (2018 and 2019) were 800 mL, and for Funka Bay (2021) was 600 mL.
Table 8Yield of alginate from ocean sediment samples.
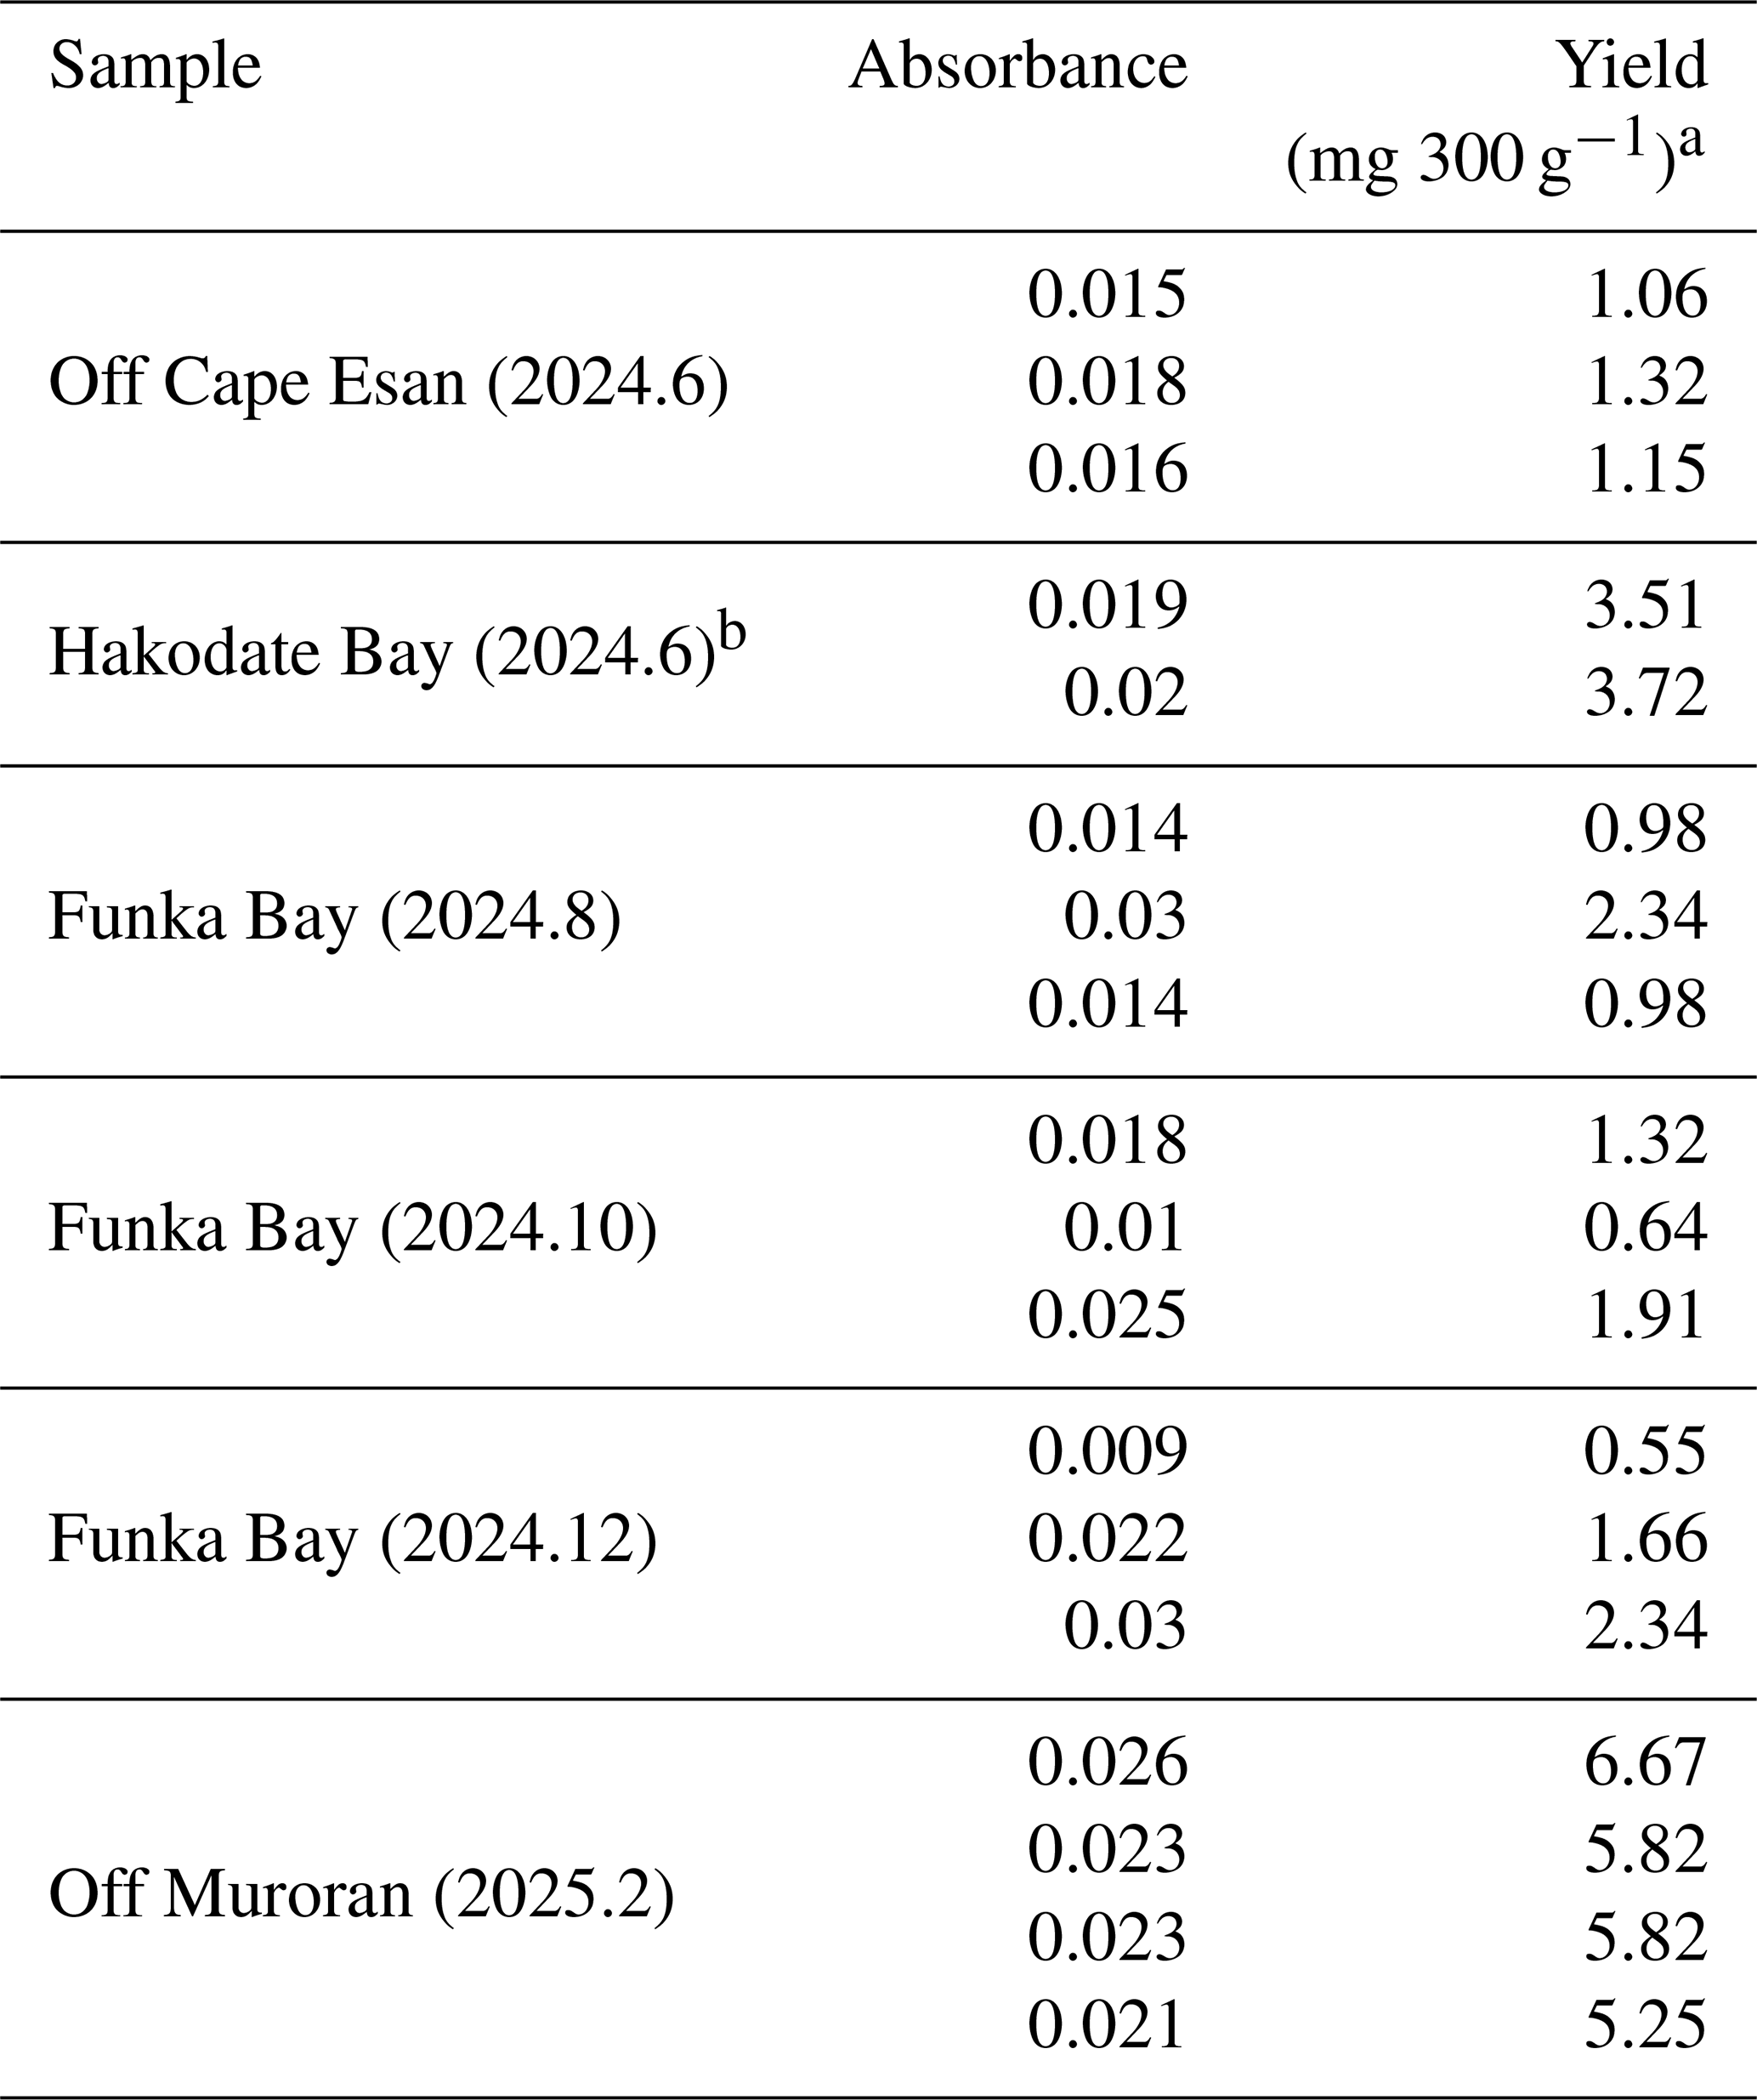
a The dilution rates of samples were 20-fold for those from off Cape Esan and Funka Bay, 50-fold for those from Hakodate Bay, and 100-fold for those from off Muroran. b Due to the amount of sediment collected, the number of samples was two (n=2).
3.4 Reduction in amount of alginate after enzymatic degradation
In Sect. 3.3, we demonstrated that a fraction of the uronic acids derived from phytoplankton remained after applying the modified extraction protocol. To confirm that the uronic acids present in the extract solution originated from alginate, we evaluated changes in uronic acid content following enzymatic degradation with alginate lyase.
The Na+-Alg concentration in the extract solution decreased from 18.11–18.67 µg mL−1 (without enzyme) to 11.81–12.37 µ g mL−1 after enzymatic treatment (Table 7). A similar reduction was observed for the Na+-Alg standard solution, which decreased from 2.23 to 0.32 µg mL−1 upon alginate lyase treatment. These results demonstrate that alginate present in both the extract and the standard solutions was effectively degraded by the enzyme, thereby supporting the presence of alginate in the extracted material.
However, the extract solution retained relatively high Na+-Alg concentrations (11.81–12.37 µg mL−1) even after enzymatic treatment. This result suggests that the bleaching treatment was insufficient to completely remove polyphenols, which may have interfered with alginate lyase activity. In addition, the absorbance of the water sample treated with alginate lyase was 0.004, indicating that residual enzyme in the measurement sample contributed slightly to the colorimetric reading; however, this effect was considered negligible. Taken together, these findings indicate that the organic matter extracted from ocean sediments using the modified protocol contained alginate, accounting for at least 34 % of the detected uronic acids.
3.5 Amount of alginate in the surface of ocean sediment in a coastal subarctic area
The modified extraction protocol was applied to the ocean sediment samples (300 g) collected from the surface 0–1 cm depth in the coastal area around southern Hokkaido, Japan (Fig. 1). Abundant alginate was detected in all extracted samples, with values of 0.55–6.67 mg 300 g−1 (alginate/wet weight of sediment; Table 8). In Funka Bay, alginate concentrations were 0.55–2.34 mg 300 g−1, corresponding to 6.11–26.0 mg m−2 (alginate/surface sediment area) during the sampling period from August to December 2024. In Hakodate Bay and off Cape Esan, concentrations were 3.51–3.72 mg 300 g−1 (39.0–41.3 mg m−2), and 1.06–1.32 mg 300 g−1 (11.8–14.7 mg m−2), respectively, during June 2024. Off Muroran, concentrations were 5.25–6.67 mg 300 g−1 (corresponding to 58.3–74.1 mg m−2) during February 2025. However, given that the extract solution may contain a fraction of phytoplankton-derived uronic acids and that confirmed alginate accounted for at least 34 % of the total, these detected values should be interpreted with caution rather than being directly equated with absolute alginate content.
In this study, we developed a novel extraction protocol for alginate in marine sediments, based on a conventional method used in food chemistry, and evaluated its applicability for quantitative analysis. We modified two key aspects – the addition of EDTA-2Na and the omission of ethanol precipitation – to improve the extraction efficiency of alginate from marine sediments. Spike recovery tests with Na+-Alg (200, 100, and 50 mg) demonstrated substantially higher recoveries (64.7 %–82.6 %) by using the modified protocol than with the conventional method (38.7 %). To assess potential interference from non-alginate polyuronic acids, such as those derived from phytoplankton, phytoplankton aggregates were subjected to the modified protocol. Although most of the interference was effectively eliminated, the minor amounts of uronic acids were detected, corresponding to 23 % of the estimated alginate content in marine sediments at the same site. To confirm that the uronic acids in marine sediments extracts originated from alginate, an enzymatic degradation test using alginate lyase was performed on the natural extracts. The uronic acid concentration decreased following enzymatic degradation, confirming that a portion of the uronic acids (at least 34 %) was derived from alginate. Finally, the alginate content of marine sediments collected around southern Hokkaido, Japan, was quantified using the modified protocol. Alginate concentrations were 6.11–26.0 mg m−2 in Funka Bay (August–December 2024), 39.0–41.3 mg m−2 in Hakodate Bay (June 2024), 11.8–14.7 mg m−2 off Cape Esan (June 2024), and 58.3–74.1 mg m−2 off Muroran (February 2025). These findings demonstrate the establishment of a quantification method for alginate in marine sediments and provide an initial application to the surface sediments of the target area.
The dataset supporting this study is available on Zenodo at https://doi.org/10.5281/zenodo.19484055 (Nakazato, 2026).
The supplement related to this article is available online at https://doi.org/10.5194/bg-23-2747-2026-supplement.
SN designed the extraction protocol and conducted the experiments. AO designed the research and conducted the observations. TK and RI assisted with the experiments. SA, AI, MF, HK, and MN provided advice on the research. SN and AO prepared the manuscript with contributions from all co-authors.
The contact author has declared that none of the authors has any competing interests.
Publisher's note: Copernicus Publications remains neutral with regard to jurisdictional claims made in the text, published maps, institutional affiliations, or any other geographical representation in this paper. The authors bear the ultimate responsibility for providing appropriate place names. Views expressed in the text are those of the authors and do not necessarily reflect the views of the publisher.
We thank the captains and crews of T/S Ushiomaru and Oshoro-maru (Hokkaido University).
This research was supported by the Hokusui Society Foundation (Sapporo, Japan) and the Regional University and Local Industrial Vitalization Grant Project, Hakodate City, funded by the Cabinet Office, Japan (March 2022).
This paper was edited by Olivier Sulpis and reviewed by two anonymous referees.
Andriamanantoanina, H. and Rinaudo, M.: Characterization of the alginates from five madagascan brown algae, Carbohydr. Polym., 82, 555–560, https://doi.org/10.1016/j.carbpol.2010.05.002, 2010.
Bergamaschi, B. A., Walters, J. S., and Hedges, J. I.: Distributions of uronic acids and O-methyl sugars in sinking and sedimentary particles in two coastal marine environments, Geochim. Cosmochim. Ac., 63, 413–425, https://doi.org/10.1016/S0016-7037(99)00075-7, 1999.
Berner, L. A. and Hood, L. F.: Iron Binding by Sodium Alginate, Food Sci., 48, 755–758, https://doi.org/10.1111/j.1365-2621.1983.tb14891.x, 1983.
Bertagnolli, C., Espindola, A. P. D., Kleinübing, S. J., Tasic, L., and da Silva, M. G. C.: Sargassum filipendula alginate from Brazil: Seasonal influence and characteristics, Carbohydr. Polym., 111, 619–623, https://doi.org/10.1016/j.carbpol.2014.05.024, 2014.
Cai, J., Lovatelli, A., Aguilar-Manjarrez, J., Cornish, L., Dabbadie, L., Desrochers, A., Diffey, S., Garrido Gamarro, E., Geehan, J., Hurtado, A., Lucente, D., Mair, G., Miao, W., Potin, P., Przybyla, C., Reantaso, M., Roubach, R., Tauati, M., and Yuan, X.: Seaweeds and microalgae: an overview for unlocking their potential in global aquaculture development, FAO Fish. Aquacul. Circul., 1229, 1–48, https://doi.org/10.4060/cb5670en, 2021.
Domozych, D.S., Serfis, A., Kiemle, S.N., and Gretz, M.R.: The structure and biochemistry of charophycean cell walls: I. Pectins of Penium margaritaceum, Protoplasma, 230, 99–115, https://doi.org/10.1007/s00709-006-0197-8, 2007.
Fang, Y., Al-Assaf, S., Phillips, G. O, Nishinari, K., Funami, T, and Williams, P. A.: Binding behavior of calcium to polyuronates: Comparison of pectin with alginate, Carbohydr. Polym., 72, 334–341, https://doi.org/10.1016/j.carbpol.2007.08.021, 2008.
Filisetti-Cozzi, T. M. C. C. and Carpita, N.C.: Measurement of uronic acids without interference from neutral sugars, Anal. Biochem., 197, 157–162, https://doi.org/10.1016/0003-2697(91)90372-Z, 1991.
Fischer, G. and Wiencke, C.: Stable carbon isotope composition, depth distribution and fate of macroalgae from the Antarctic Peninsula region, Polar Biol., 12, 341–348, https://doi.org/10.1007/BF00243105, 1992.
Gerschenson, L. N.: The production of galacturonic acid enriched fractions and their functionality, Food Hydrocoll., 68, 23–30, https://doi.org/10.1016/j.foodhyd.2016.11.030, 2017.
Gomez, C. G., Lambrecht, M. V. P., Lozano, J. E., Rinaudo, M., and Villar, M. A.: Influence of the extraction–purification conditions on final properties of alginates obtained from brown algae (Macrocystis pyrifera), Int. J. Biol. Macromol., 44, 365–371, https://doi.org/10.1016/j.ijbiomac.2009.02.005, 2009.
Grant, G. T., Morris, E. R., Rees, D. A., Smith, P. J. C., and Thom, D.: Biological interactions between polysaccharides and divalent cations: The egg-box model, FEBS Lett., 32, 195–198, https://doi.org/10.1016/0014-5793(73)80770-7, 1973.
Gügi, B., Costaouec, T. L., Burel, C., Lerouge, P., Helbert, W., and Bardor, M.: Diatom-Specific Oligosaccharide and Polysaccharide Structures Help to Unravel Biosynthetic Capabilities in Diatoms, Mar. Drugs, 13, 5993–6018, https://doi.org/10.3390/md13095993, 2015.
Hill, R., Bellgrove, A., Macreadie, P. I., Petrou, K., Beardall, J., Steven, A., and Ralph, P. J.: Can macroalgae contribute to blue carbon? An Australian perspective, Limnol. Oceanogr., 60, 1689–1706, https://doi.org/10.1002/lno.10128, 2015.
Hung, C. and Santschi, P. H.: Spectrophotometric determination of total uronic acids in seawater using cation-exchange separation and pre-concentration by lyophilization, Anal. Chim. Acta, 427, 111–117, https://doi.org/10.1016/S0003-2670(00)01196-X, 2001.
Inoue, A., Takadono, K., Nishiyama, R., Tajima, K., Kobayashi, T., and Ojima, T.: Characterization of an Alginate Lyase, FlAlyA, from Flavobacterium sp. Strain UMI-01 and Its Expression in Escherichia coli, Mar. Drugs, 12, 4693–4712, https://doi.org/10.3390/md12084693, 2014.
Kawasaki, Y., Kato, C., Ishiwata, H., and Yamada, T.: Determination Method for Sodium Alginate in Foods, Food Hyg. Safe. Sci., 39, 297–302, https://doi.org/10.3358/shokueishi.39.5_297, 1998.
Klinkhammer, G. P.: Early diagenesis in sediments from the eastern equatorial Pacific, II. Pore water metal results, Earth Planet. Sc. Lett., 49, 81–101, https://doi.org/10.1016/0012-821X(80)90151-X, 1980.
Kudo, I., and Yoshimura, T.: The Fate of Primary Production during Spring Bloom in Funka Bay, Bull. Coast. Oceanogr., 38, 47–54, https://doi.org/10.32142/engankaiyo.38.1_47, 2000.
Kumar, P. and Kumar, V.: Estimation of uronic acids using diverse approaches and monosaccharide composition of alkali soluble polysaccharide from Vitex negundo Linn., Carbohydr. Polym., 165, 205–212, https://doi.org/10.1016/j.carbpol.2017.02.034, 2017.
Masuzawa, T. and Kitano, Y.: Interstitial water chemistry in deep-sea sediments from the Japan Sea, J. Oceanogr. Soc. Jpn., 39, 171–184, https://doi.org/10.1007/BF02070261, 1983.
McHugh, D. J.: Production and utilization of products from commercial seaweeds, FAO Fish. Tech. Pap., 288, 58–115, 1987.
McHugh, D. J., Hernandez-Carmona, G., Arvizu-Higuera, D. L., and Rodríguez-Montesinos, Y. E.: Pilot plant scale extraction of alginates from Macrocystis pyrifera 3. Precipitation, bleaching and conversion of calcium alginate to alginic acid, J. Appl. Phycol., 13, 471–479, https://doi.org/10.1023/A:1012532706235, 2001.
Menakbi, C., Quignard, F., and Mineva, T.: Complexation of Trivalent Metal Cations to Mannuronate Type Alginate Models from a Density Functional Study, Phys. Chem. B, 120, 3615–3623, https://doi.org/10.1021/acs.jpcb.6b00472, 2016.
Miyajima, T., Hamaguchi, M., Nakamura, T., Katayama, H., and Hori, M.: Export and dispersal of coastal macrophyte-derived organic matter to deep offshore sediment around the Tokara and Yaeyama Islands, southwest Japan: Evaluation using quantitative DNA probing techniques, Bull. Geol. Surv. Jpn., 73, 313–321, https://doi.org/10.9795/bullgsj.73.5-6_313, 2022.
Moen, E., Larsen, B., and Østgaard, K.: Aerobic microbial degradation of alginate in Laminaria hyperborea stipes containing different levels of polyphenols, J. Appl. Phycol., 9, 45–54, https://doi.org/10.1023/A:1007956230761, 1997.
Nakazato, S: Dataset for alginate quantification in marine sediments: Method and field data, Zenodo, V 1.0 [data set], https://doi.org/10.5281/zenodo.19484055, 2026.
Nellemann, C., Corcoran, E., Duarte, C., Valdes, L., Young, C. D., Fonseca, L., and Grimsditch, G.: Blue Carbon – The Role of Healthy Oceans in Binding Carbon. A Rapid Response Assessment, United Nations Environment Programme, ISBN 978-82-7701-060-1, 2009.
Ohtani, K. and Kido, K.: Oceanographic structure in Funka Bay, Bull. Fac. Fish. Hokkaido Univ., 31, 84–114, 1980.
Saji, S., Hebden, A., Goswami, P., and Du, C.: A Brief Review on the Development of Alginate Extraction Process and Its Sustainability, Sustainability, 14, 5181, https://doi.org/10.3390/su14095181, 2022.
Steneck, R. S., Graham, M. H., Bourque, B. J., Corbett, D., Erlandson, J. M., Estes, J. A., and Tegner, M. J.: Kelp forest ecosystems: biodiversity, stability, resilience and future, Environ. Conserv., 29, 436–459, https://doi.org/10.1017/S0376892902000322, 2002.
Szekalska, M., Puciłowska, A., Szymańska, E., Ciosek, P., and Winnicka, K.: Alginate: Current Use and Future Perspectives in Pharmaceutical and Biomedical Applications, Int. J. Polym. Sci., 1–17, https://doi.org/10.1155/2016/7697031, 2016.
Trica, B., Delattre, C., Gros, F., Ursu, A.V., Dobre, T., Djelveh, G., Michaud, P., and Oancea, F.: Extraction and Characterization of Alginate from an Edible Brown Seaweed (Cystoseira barbata) Harvested in the Romanian Black Sea, Mar. Drugs, 17, 405, https://doi.org/10.3390/md17070405, 2019.
Udagawa, T., Koseki, Y., Koizumi, K., Igarashi, Y., and Fuchigami, K.: Development of a Novel Determination Method for Alginic Acid, Nippon Shokuhin Kagaku Kogaku Kaishi, 60, 654–660, https://doi.org/10.3136/nskkk.60.654, 2013 (in Japanese with English abstract).
Ueno, K.: How to use EDTA, Jpn. Analyst, 8, 207–214, https://doi.org/10.2116/bunsekikagaku.8.207, 1959 (in Japanese).
Usov, A. I., Smirnova, G. P., and Klochkova, N. G.: Polysaccharides of Algae: 55. Polysaccharide Composition of Several Brown Algae from Kamchatka, Russ. J. Bioorg. Chem., 27, 395–399, https://doi.org/10.1023/A:1012992820204, 2001.
Usov, A. I. and Zelinsky, N. D.: Chemical structures of algal polysaccharides, in: Functional Ingredients from Algae for Foods and Nutraceuticals, edited by: Domínguez, H., Woodhead Publishing, London, UK, 23–86, https://doi.org/10.1533/9780857098689.1.23, 2013.
Wei, C., Rowe G. T., Nunnally, C. C., and Wicksten, M. K.: Anthropogenic “Litter” and macrophyte detritus in the deep Northern Gulf of Mexico, Mar. Pollut. Bull., 64, 966–973, https://doi.org/10.1016/j.marpolbul.2012.02.015, 2012.
Yang, J., Xie, Y., and He, W.; Research progress on chemical modification of alginate: A review, Carbohydr. Polym., 84, 33–39, https://doi.org/10.1016/j.carbpol.2010.11.048, 2011.