the Creative Commons Attribution 4.0 License.
the Creative Commons Attribution 4.0 License.
 | 04 May 2026
PeatDepth-ML: a global map of peat depth predicted using machine learning
Jade Skye
Colin Goldblatt
Angela Gallego-Sala
Michelle Garneau
Scott Winton
Peatlands are major carbon stores that are sensitive to climate change and increasingly affected by human activity. Accurate assessment of carbon stocks and modelling of peatland responses to future climate scenarios requires robust information on peat depth. We developed PeatDepth-ML, a machine learning framework that predicts global peat depths using a comprehensive database of peat depth measurements for training and validation. Building on an existing framework for mapping peatland extent, we incorporated new environmental datasets relevant to peat formation, revised cross-validation procedures, and introduced a custom scoring metric to improve predictions of deep peat deposits. To evaluate model sensitivity to sampling bias inherent in the training data, we applied a bootstrapping approach. Model performance, assessed using a blocked leave-one-out approach, yielded a root mean square error of 70.1 ± 0.9 cm and a mean bias error of 2.1 ± 0.7 cm, performing as well as or better than previously published models. The global map produced by PeatDepth-ML predicts a median peat depth of 134 cm (IQR: 87–187) over areas with more than 30 cm of peat. Like other regression-based models, PeatDepth-ML tended to predict toward mean training depths. An area of applicability analysis suggests the model has good applicability globally with the exception of some coastal and several mountainous regions like the Andes and the highlands of Borneo and New Guinea. Predictor selection was highly sensitive to training data subsets that arose from the bootstrapping approach, occasionally resulting in regional variations in accuracy. The bootstrapping approach and our area of applicability analysis thus clearly demonstrates the prime importance of quality training data in data-driven approaches like PeatDepth-ML. Using our predicted peat depth map, together with literature-derived peatland extent and estimates of bulk density and organic carbon content, we estimate global peat carbon stocks at 327–373 Pg C, consistent with previous global estimates.
- Article
(10000 KB) - Full-text XML
- BibTeX
- EndNote


The works published in this journal are distributed under the Creative Commons Attribution 4.0 License. This license does not affect the Crown copyright work, which is re-usable under the Open Government Licence (OGL). The Creative Commons Attribution 4.0 License and the OGL are interoperable and do not conflict with, reduce or limit each other.
© Crown copyright 2025
Peatlands play a critical role in global carbon cycling, hydrological systems, and biodiversity. These waterlogged wetland ecosystems are characterized by soils with high organic matter content resulting from limited decomposition under low-oxygen conditions (Rydin and Jeglum, 2013c; Joosten and Clarke, 2002). Despite covering only about 3 % of global land area, peatlands store approximately one-third of all soil carbon and hold one-tenth of surface freshwater while supporting diverse plant and animal communities (Turunen et al., 2002; Ruppel et al., 2013; Melton et al., 2022; Joosten and Clarke, 2002; Rydin and Jeglum, 2013b; Ribeiro et al., 2021).
Historically functioning as carbon sinks, peatlands now face the threat of becoming carbon sources due to anthropogenic pressures including land use change, deforestation, and drainage (Rydin and Jeglum, 2013b; Joosten and Clarke, 2002; Fluet-Chouinard et al., 2023). Climate change poses additional risks, in both boreal regions, where warming temperatures and reduced soil moisture can accelerate peat drying (Canadell et al., 2021; Minasny et al., 2019), and tropical regions, where changes in precipitation seasonality can lead to peat loss (Garcin et al., 2022).
Despite these mounting pressures, peatlands remain poorly mapped in terms of spatial extent, depth, and carbon stores, which severely hinders conservation and restoration efforts (Austin et al., 2025). This knowledge gap has important policy implications: while the Paris Agreement lists 20 countries with mitigation targets for peatland or wetland organic soils in their Nationally Determined Contributions (NDCs) (Wiese et al., 2021), many other countries exclude peatland and wetland soils from their NDCs due, in part, to challenges with accurate quantification and monitoring of their carbon storage. Similarly, efforts to understand future peatland dynamics through process-based land surface models require more accurate and extensive data for model initialization and evaluation to ensure the projected changes are accurate (Wu et al., 2016; Chadburn et al., 2022; Bechtold et al., 2019).
Traditional peatland mapping has primarily relied on air photo interpretation and field surveys (Minasny et al., 2019), but field work is expensive and labour-intensive due to remote, waterlogged conditions (Rudiyanto et al., 2016; Minasny et al., 2019). Peat depth, in particular, is challenging as it cannot be measured using optical remote sensing (Krankina et al., 2008) and requires probing, coring, or ground penetrating radar methods (Minasny et al., 2019).
Digital soil mapping techniques, including machine learning (ML), enable peat estimation at larger scales by combining observational peat data with environmental predictors in statistical models (Minasny et al., 2019; McBratney et al., 2003; Rudiyanto et al., 2016). Predictors should reflect environmental signals of peat presence and peatland development drivers (Minasny et al., 2019; Melton et al., 2022), and models can range from simple linear regression to complex ML algorithms (Minasny et al., 2019; Rudiyanto et al., 2016; Melton et al., 2022).
ML has been successfully applied to map peatland fractional coverage both regionally (e.g. Hugelius et al., 2020; Pohjankukka et al., 2025; Ivanovs et al., 2024; Lara et al., 2025; Hastie et al., 2024) and globally (Melton et al., 2022). However, ML applications for peat depth mapping remain limited. Hugelius et al. (2020) and Crezee et al. (2022) used Random Forest to predict peat depths north of 23° N and in the Congo basin, respectively. More regional approaches have been reported including Pohjankukka et al. (2025) who mapped peat depths and extents in Finland, Deragon et al. (2023) mapped peat thickness in cultivated organic soils close to Montréal, Canada, and Rudiyanto et al. (2018) explored the feasibility of peat depth mapping for an area of roughly 50 000 ha in Indonesia. Widyastuti et al. (2025) is the only global map of peat depth, carbon content, and bulk density, though it is based upon a collection of regional models.
Here we adapt the Peat-ML modelling framework (Melton et al., 2022) to predict peat depth rather than fractional coverage, and provide extensive quality and uncertainty assessment. Our study presents several advancements over previous attempts to predict peat depths over large domains, the most important of which include: (1) the use of a single predictive model globally, (2) an estimate of spatial area of applicability, (3) no use of artificial peat core observations, (4) a novel bootstrapping approach to examine the impact of sub-pixel variability in training data, and (5) no reliance upon a map of peatland extent to determine peatland locations. This new approach, termed PeatDepth-ML, is detailed in Sect. 2 alongside our peatland definition, input datasets, and modelling scheme. Section 3 presents PeatDepth-ML output, model assessment, preliminary carbon stock estimates, and method limitations. Section 4 provides conclusions.
2.1 Definition of Peatlands
Following Joosten and Clarke (2002) and Lourenco et al. (2022), we define peatlands as ecosystems with accumulated surface peat layers. Lourenco et al. (2022) conservatively proposes a minimum criteria of 5 % organic carbon content to 10 cm depth. Our training database, Peat-DBase (Skye, 2025b), observed the 5 % organic carbon threshold for non-peat measurements but imposed no depth restrictions. This inclusive approach captures extensive peat depth data across diverse peatland ecosystems, which benefits ML algorithms that can only make reliable predictions in regions similar to their training data (Meyer and Pebesma, 2021).
For model outputs, PeatDepth-ML enforces no specific thresholds around peat depth, enabling predictions across the full range from 0 cm onwards. However, when presenting results, we often highlight depths exceeding 30 cm – a common delineation in peat datasets (Loisel et al., 2017). See Lourenco et al. (2022) and Loisel et al. (2017) for further discussion on peat definition variations and implications.
2.2 Gathering and Preparing Data
PeatDepth-ML uses the same five arcminute grid and netCDF file format as Peat-ML (Melton et al., 2022), requiring conversion of training data and new predictors to this standardised format. New predictors, typically acquired as GeoTiff raster files, were processed using similar geospatial tools: Geospatial Data Abstraction Software Library (GDAL; Rouault et al., 2023), Climate Data Operators (CDO; Schulzweida, 2022), and NetCDF Operators (NCO; Zender, 2008).
2.2.1 Training Data and Bootstrapping
Since PeatDepth-ML aims to predict peat depths globally, extensive and spatially diverse training data are essential. While ML models can fit complex relationships, their geospatial predictions are only reliable for areas similar to their training data (Xu et al., 2018; Hateffard et al., 2024). Models extrapolating to dissimilar regions produce less trustworthy results (Meyer and Pebesma, 2021), necessitating diverse peatland and non-peatland data for reasonable spatially continuous predictions.
We used Peat-DBase version 0.9 (https://doi.org/10.5281/zenodo.15530645, Skye, 2025a) as our training foundation, containing 35 132 measurements from 28 peat-focused studies along with 94 615 measurements derived from the World Soil Information Service (WoSIS; Batjes et al., 2020) that we use to provide measurements of peat absence for non-peatland regions. Coverage is reasonably good for parts of Canada, Europe, and the Congo Basin, but tropical regions generally have fewer data and sampling biases may affect depth distribution (Skye, 2025b). Notable gaps include northern and central Eurasia, southeastern South America, and New Zealand.
Point-based Peat-DBase data were gridded to five arcminute resolution by calculating mean measurements per grid cell (Sect. 2.2). For cells containing both zero-depth (peat absent) and positive-depth (peat present) measurements, zero values were removed before calculating means. This ensured the gridded dataset represented mean peatland depth within each cell rather than mean depth across all soil environments. Figure 1 shows the final gridded Peat-DBase v0.9. This spatial aggregation alters the distribution of values provided to the model compared to the original point measurements in the database (Fig. 2). The most notable change between the raw measurements (Fig. 2a) and aggregated values (Fig. 2b) is the reduction in shallow peat depth observations. This averaging process effectively replaces extreme values—both the shallowest and deepest measurements—with moderate mean values, reducing the overall variability in the dataset.
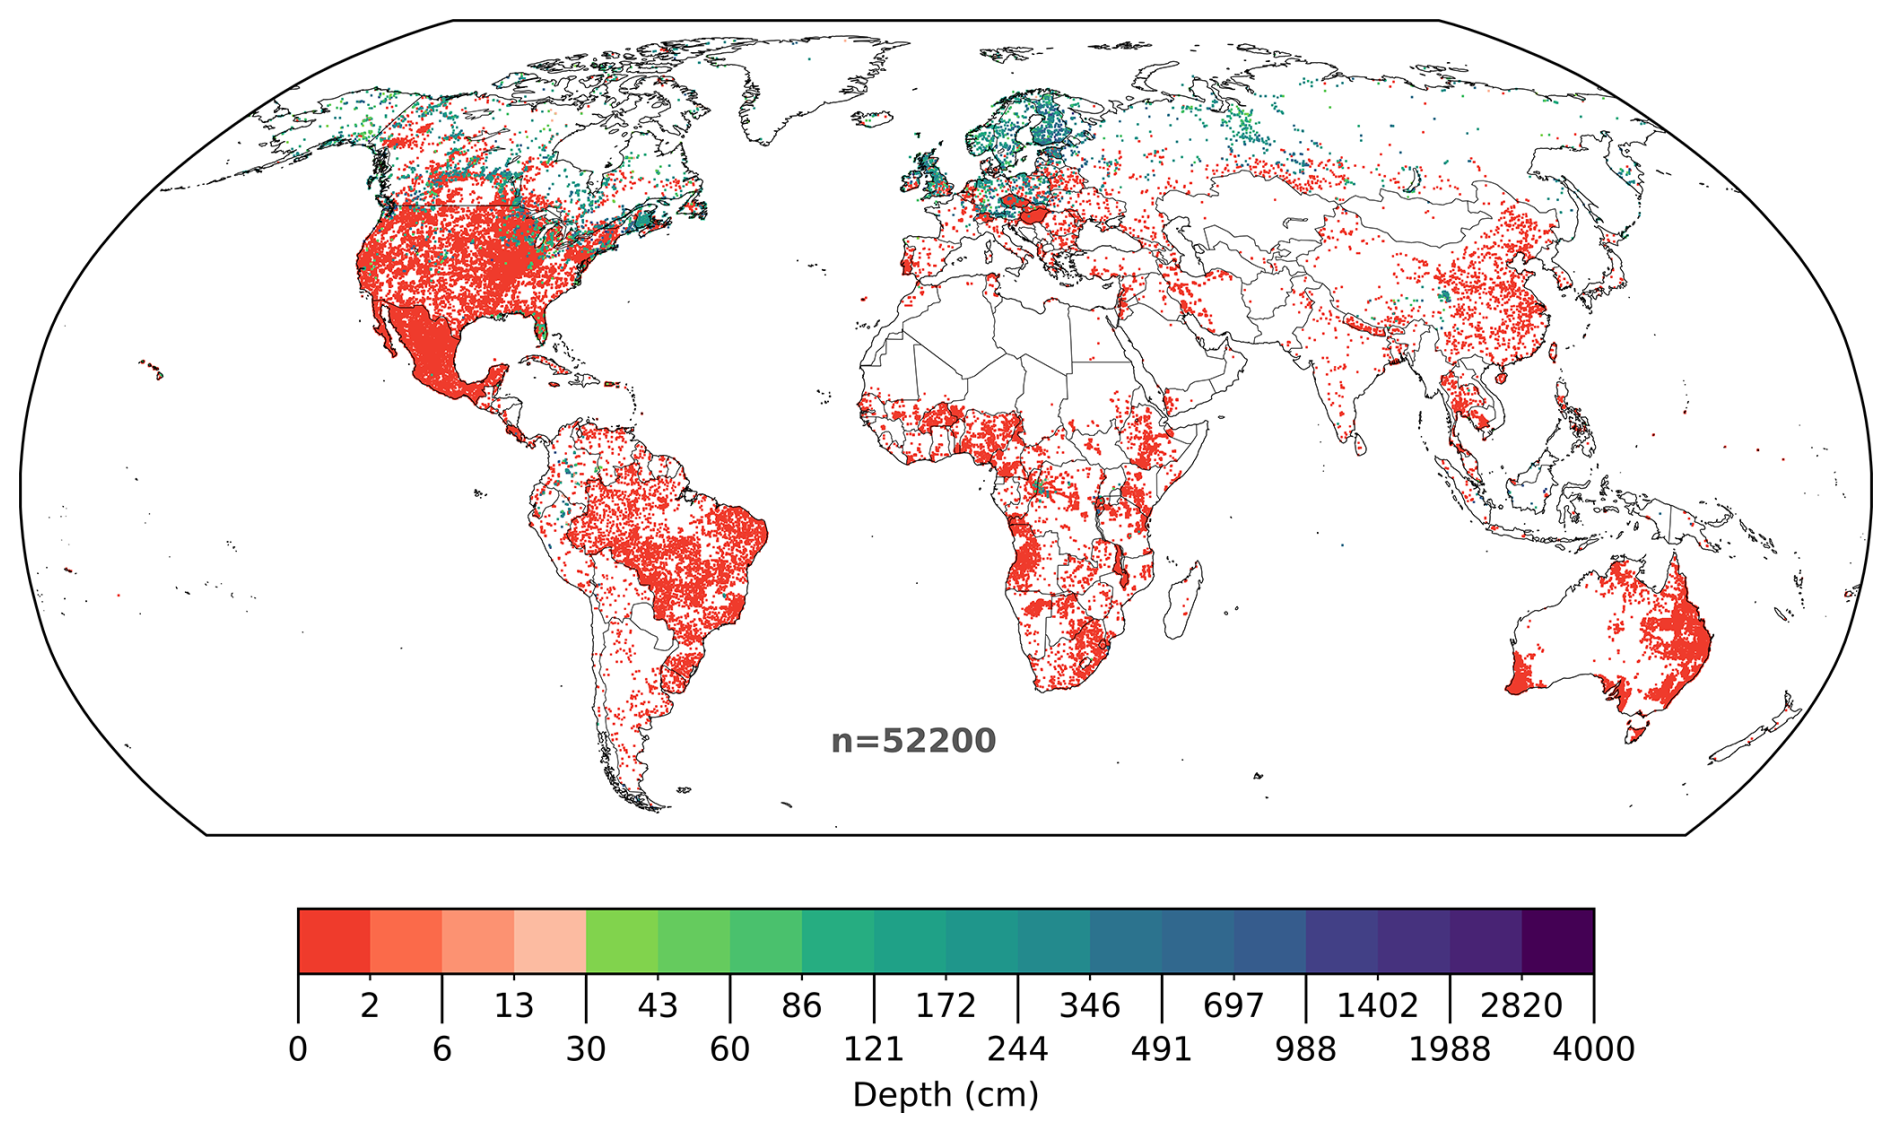
Figure 1Geographical distribution of gridded Peat-DBase version 0.9. Uncoloured areas contain no data. Following removal of zero-depth measurements from cells containing both zero and non-zero depth measurements, gridded data represent mean peat depth of peatlands within each cell, rather than mean depth across the entire cell area (see Sect. 2.2.1). Grid cells are enlarged for visibility. The logarithmic colour scale includes a break at 30 cm, a commonly used peatland classification threshold (Loisel et al., 2017).
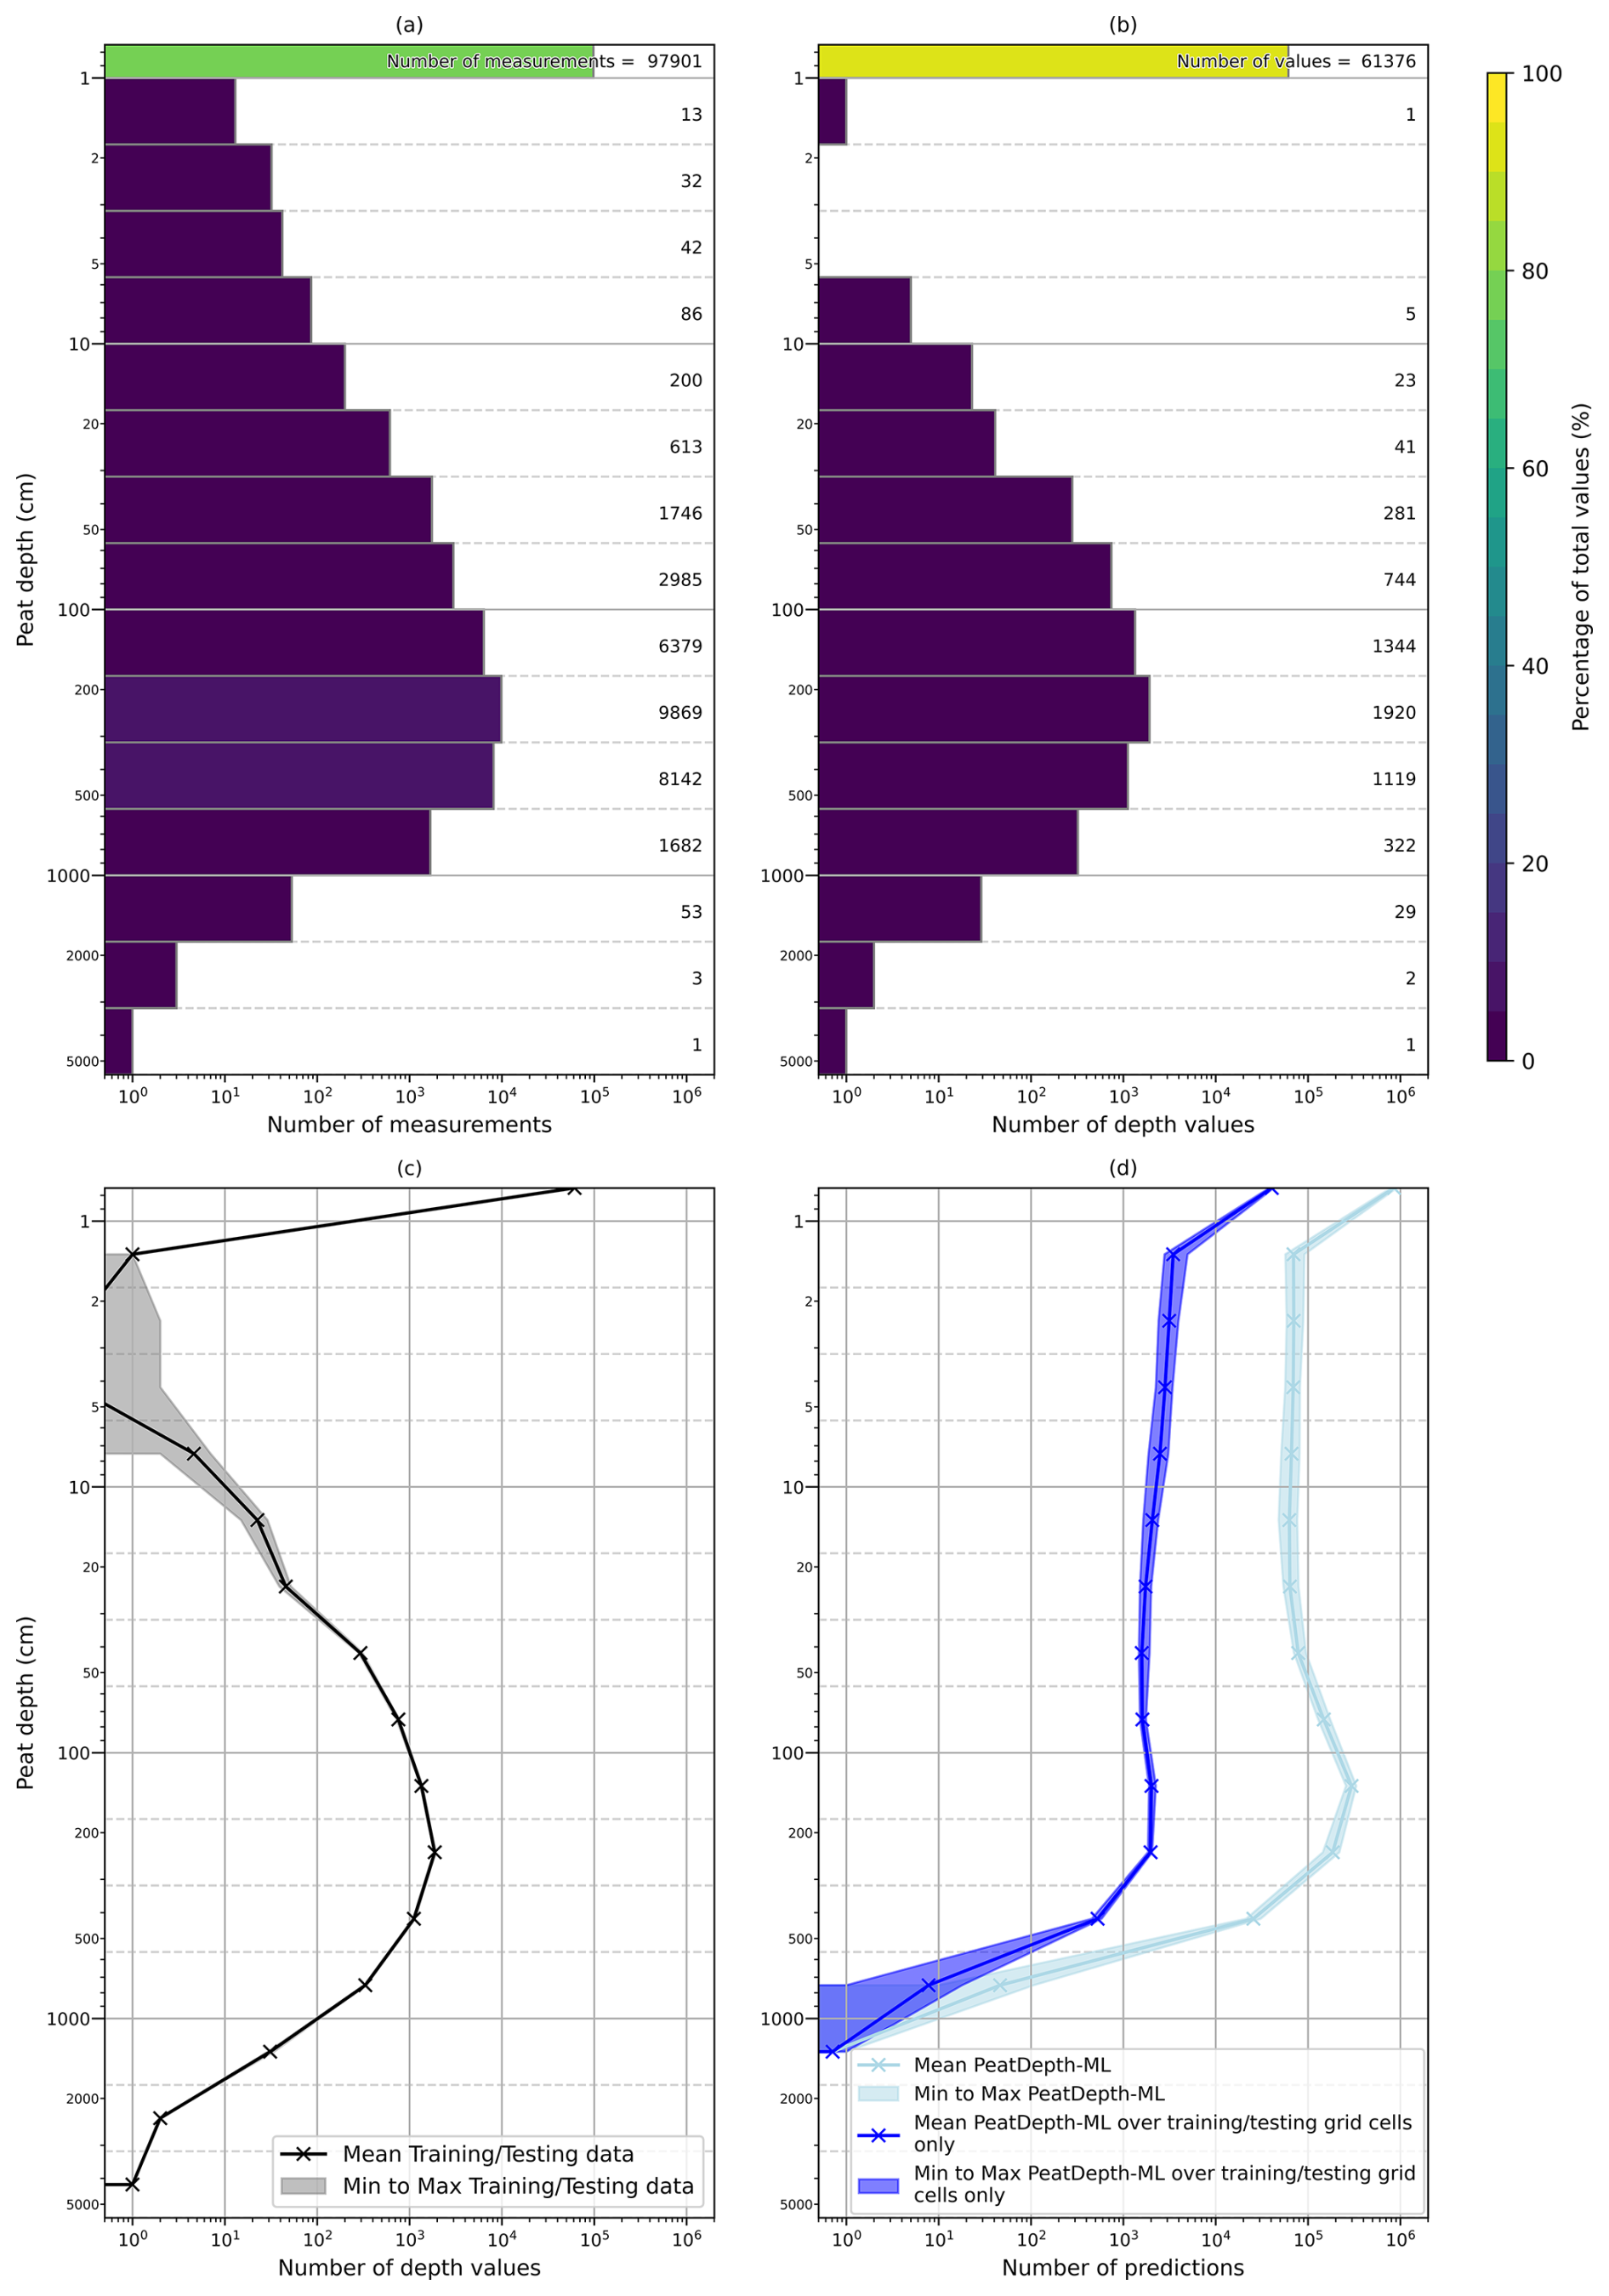
Figure 2Histograms showing peat depth distributions across different iterations of the training datasets (see Sect. 2.2.1). (a) The peat depth distribution of Peat-DBase. (b) The peat depth distribution of Peat-DBase when gridded, with the addition of desert data. (c) The peat depth distribution of the training and testing datasets created through bootstrapping Peat-DBase. (d) The peat depth distribution of the PeatDepth-ML bootstrap model outputs, where the dark blue lines represent only the output values for grid cells that contained training and testing data. Panels (c) and (d) present the mean distribution as a solid dark line and the minimum to maximum range of the distribution as a lighter band. Note that all panels use logarithmic scales, which can amplify the visual prominence of smaller values.
The distribution of peat depths varies across different training datasets generated through our bootstrapping procedure (Fig. 2c), as discussed later in this section. However, grid cells with zero peat depth consistently dominate across all bootstrap samples. This zero-inflation represents a critical modelling consideration, as these null values constitute the majority of the training data and will therefore strongly influence model predictions.
Meyer and Pebesma (2021) propose a method for identifying where a model makes reasonable predictions based on learned relationships rather than extrapolation, termed the Area of Applicability (AOA). Their approach uses a dissimilarity index that measures the distance to the nearest training data point in multidimensional predictor space. For accurate AOA representation, distances are calculated to the nearest training point outside the same cross-validation block (see Sect. 2.3). The dissimilarity threshold is set at the maximum dissimilarity index between training grid cells. Grid cells exceeding this threshold fall outside the AOA, indicating regions where the model may extrapolate beyond its training knowledge.
Early tests with the AOA approach revealed that PeatDepth-ML was poorly constrained in desert regions without additional data. We therefore added zero-depth values for desert and xeric shrubland biomes using ecoregion shapefiles from Olson et al. (2001), consistent with the Peat-ML dataset (Melton et al., 2022). A randomly dispersed 5 % coverage across these biomes provided reasonable AOA coverage without significantly impacting model performance elsewhere.
The final gridded training dataset is shown in Fig. 3 (depth distribution in Fig. 2b). Adding desert data increases zero-inflation, with the addition of 15 008 new grid cells (22.3 % of the dataset), which aligns well with estimates that deserts comprise approximately 20 % of global land area (Loidi et al., 2023). Non-zero depth values now represent 8.7 % of all training grid cells.
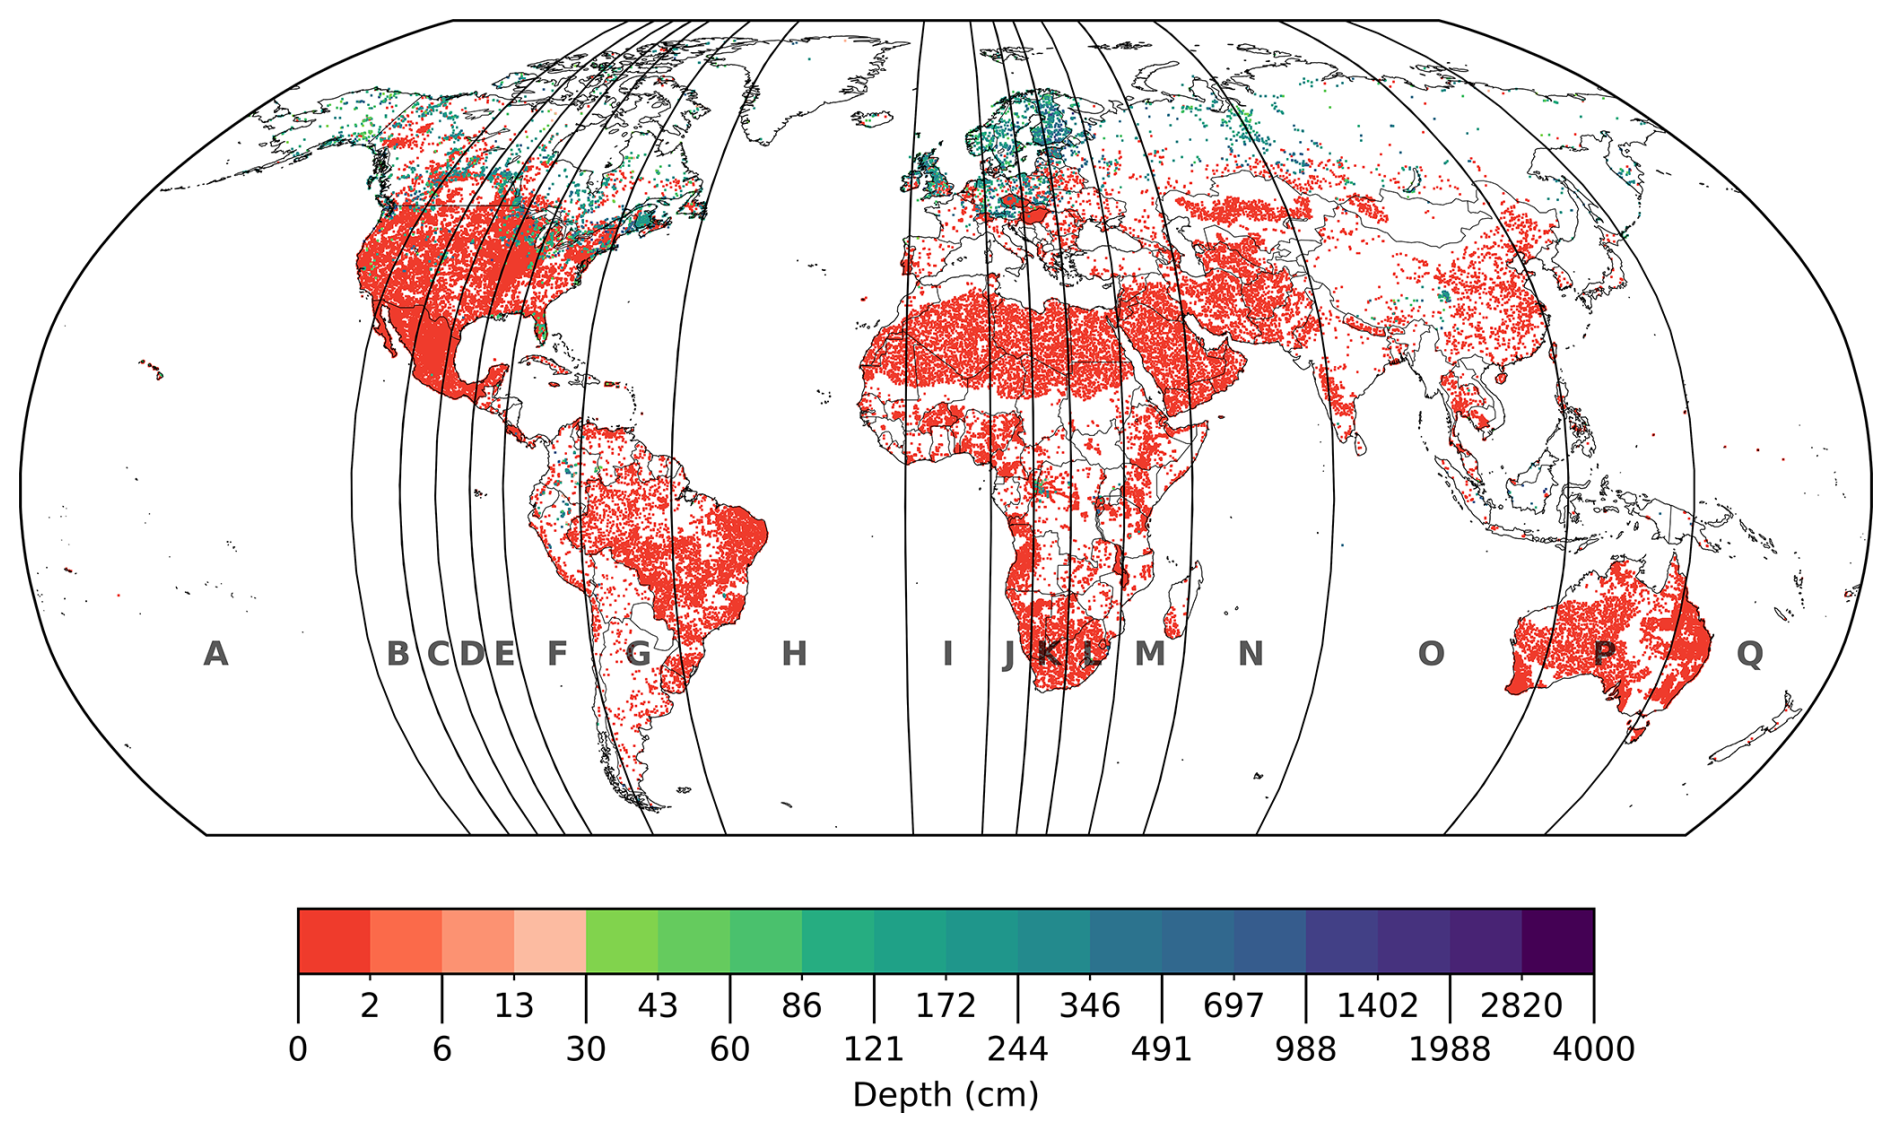
Figure 3The gridded PeatDepth-ML training dataset with processed desert data. Following the removal of zero-depth measurements from grid cells containing peat (Sect. 2.2.1), the values shown represent the mean peat depth for peatlands within each cell, rather a mean depth across the entire cell area. Grid cells are enlarged for visibility with white areas indicating no data. The logarithmic colour scale includes a break at 30 cm, a common peatland classification threshold (Loisel et al., 2017). Letters indicate cross-validation blocks (Sect. 2.3).
Peat cores may not adequately reflect the true peatland depth due to surface and basin topography variations, sampling strategies and objectives. Assigning mean core depths to represent entire grid cells perpetuates these uncertainties, particularly for single-core cells or cells containing multiple peatland complexes with cores from only one. We attempt to address this sample variability through bootstrapping – uniquely applied here to vary values within the dataset rather than subsample the entire dataset (Galdi and Tagliaferri, 2019; Johnson, 2001; Russell and Norvig, 2020; Hesterberg, 2011).
For grid cells with multiple non-zero (peat present) measurements, we subsampled with replacement, maintaining the same number of measurements while creating subsets with duplicates (see Fig. 3 in Galdi and Tagliaferri, 2019). Grid cell peat depth was set as the mean of each new subsample. Of 5829 non-zero grid cells, 3960 contained only one measurement (Fig. A1), so bootstrapping varied 32 % of non-zero cells. We performed 400 iterations, creating 401 total training datasets (including the original unbootstrapped dataset in Fig. 3). This collection of bootstrap samples is referred to as observed data hereafter.
While more bootstraps are generally preferable (Efron and Tibshirani, 1994; Hesterberg, 2011), we were limited by computational costs. Over half of the bootstrapped grid cells contained fewer than five measurements, resulting in repeating subsamples across the 401 iterations. Grid cells with the most measurements are roughly evenly distributed across high and low latitudes.
2.2.2 Predictor Data
We used the original Peat-ML predictors from Melton et al. (2020) along with new datasets for PeatDepth-ML. Most Peat-ML predictors represent climate, soils, terrain, and vegetation. However, environmental variables that indicate peat occurrence may not have equivalent predictive power for peat depth. For example, specialized wetland vegetation strongly indicates peatland presence but reveals less about depth (Minasny et al., 2019). Table 1 outlines all predictors and identifies new additions to our framework. Original formats and calculations for new predictors are detailed below; see Melton et al. (2022) for others.
(Abatzoglou et al., 2018)(Brun et al., 2022)(Fick and Hijmans, 2017)(Hengl, 2018)(ONeill et al., 2021)(Amatulli et al., 2020)(Shimada et al., 2014)(Running et al., 2011)(Didan and Barreto, 2018)(Friedl et al., 2019)(Wang, 2021)(ONeill et al., 2021)Fan et al. (2013)(Pekel et al., 2016)(Gowan et al., 2021)Table 1Environmental variable datasets provided as 397 potential peat depth predictors to PeatDepth-ML. Italicized variables are new predictors collected for PeatDepth-ML. Bold variables were selected by bootstrap model runs (Sect. 3.1). See Table 1 in Melton et al. (2022) for details on original Peat-ML predictors.
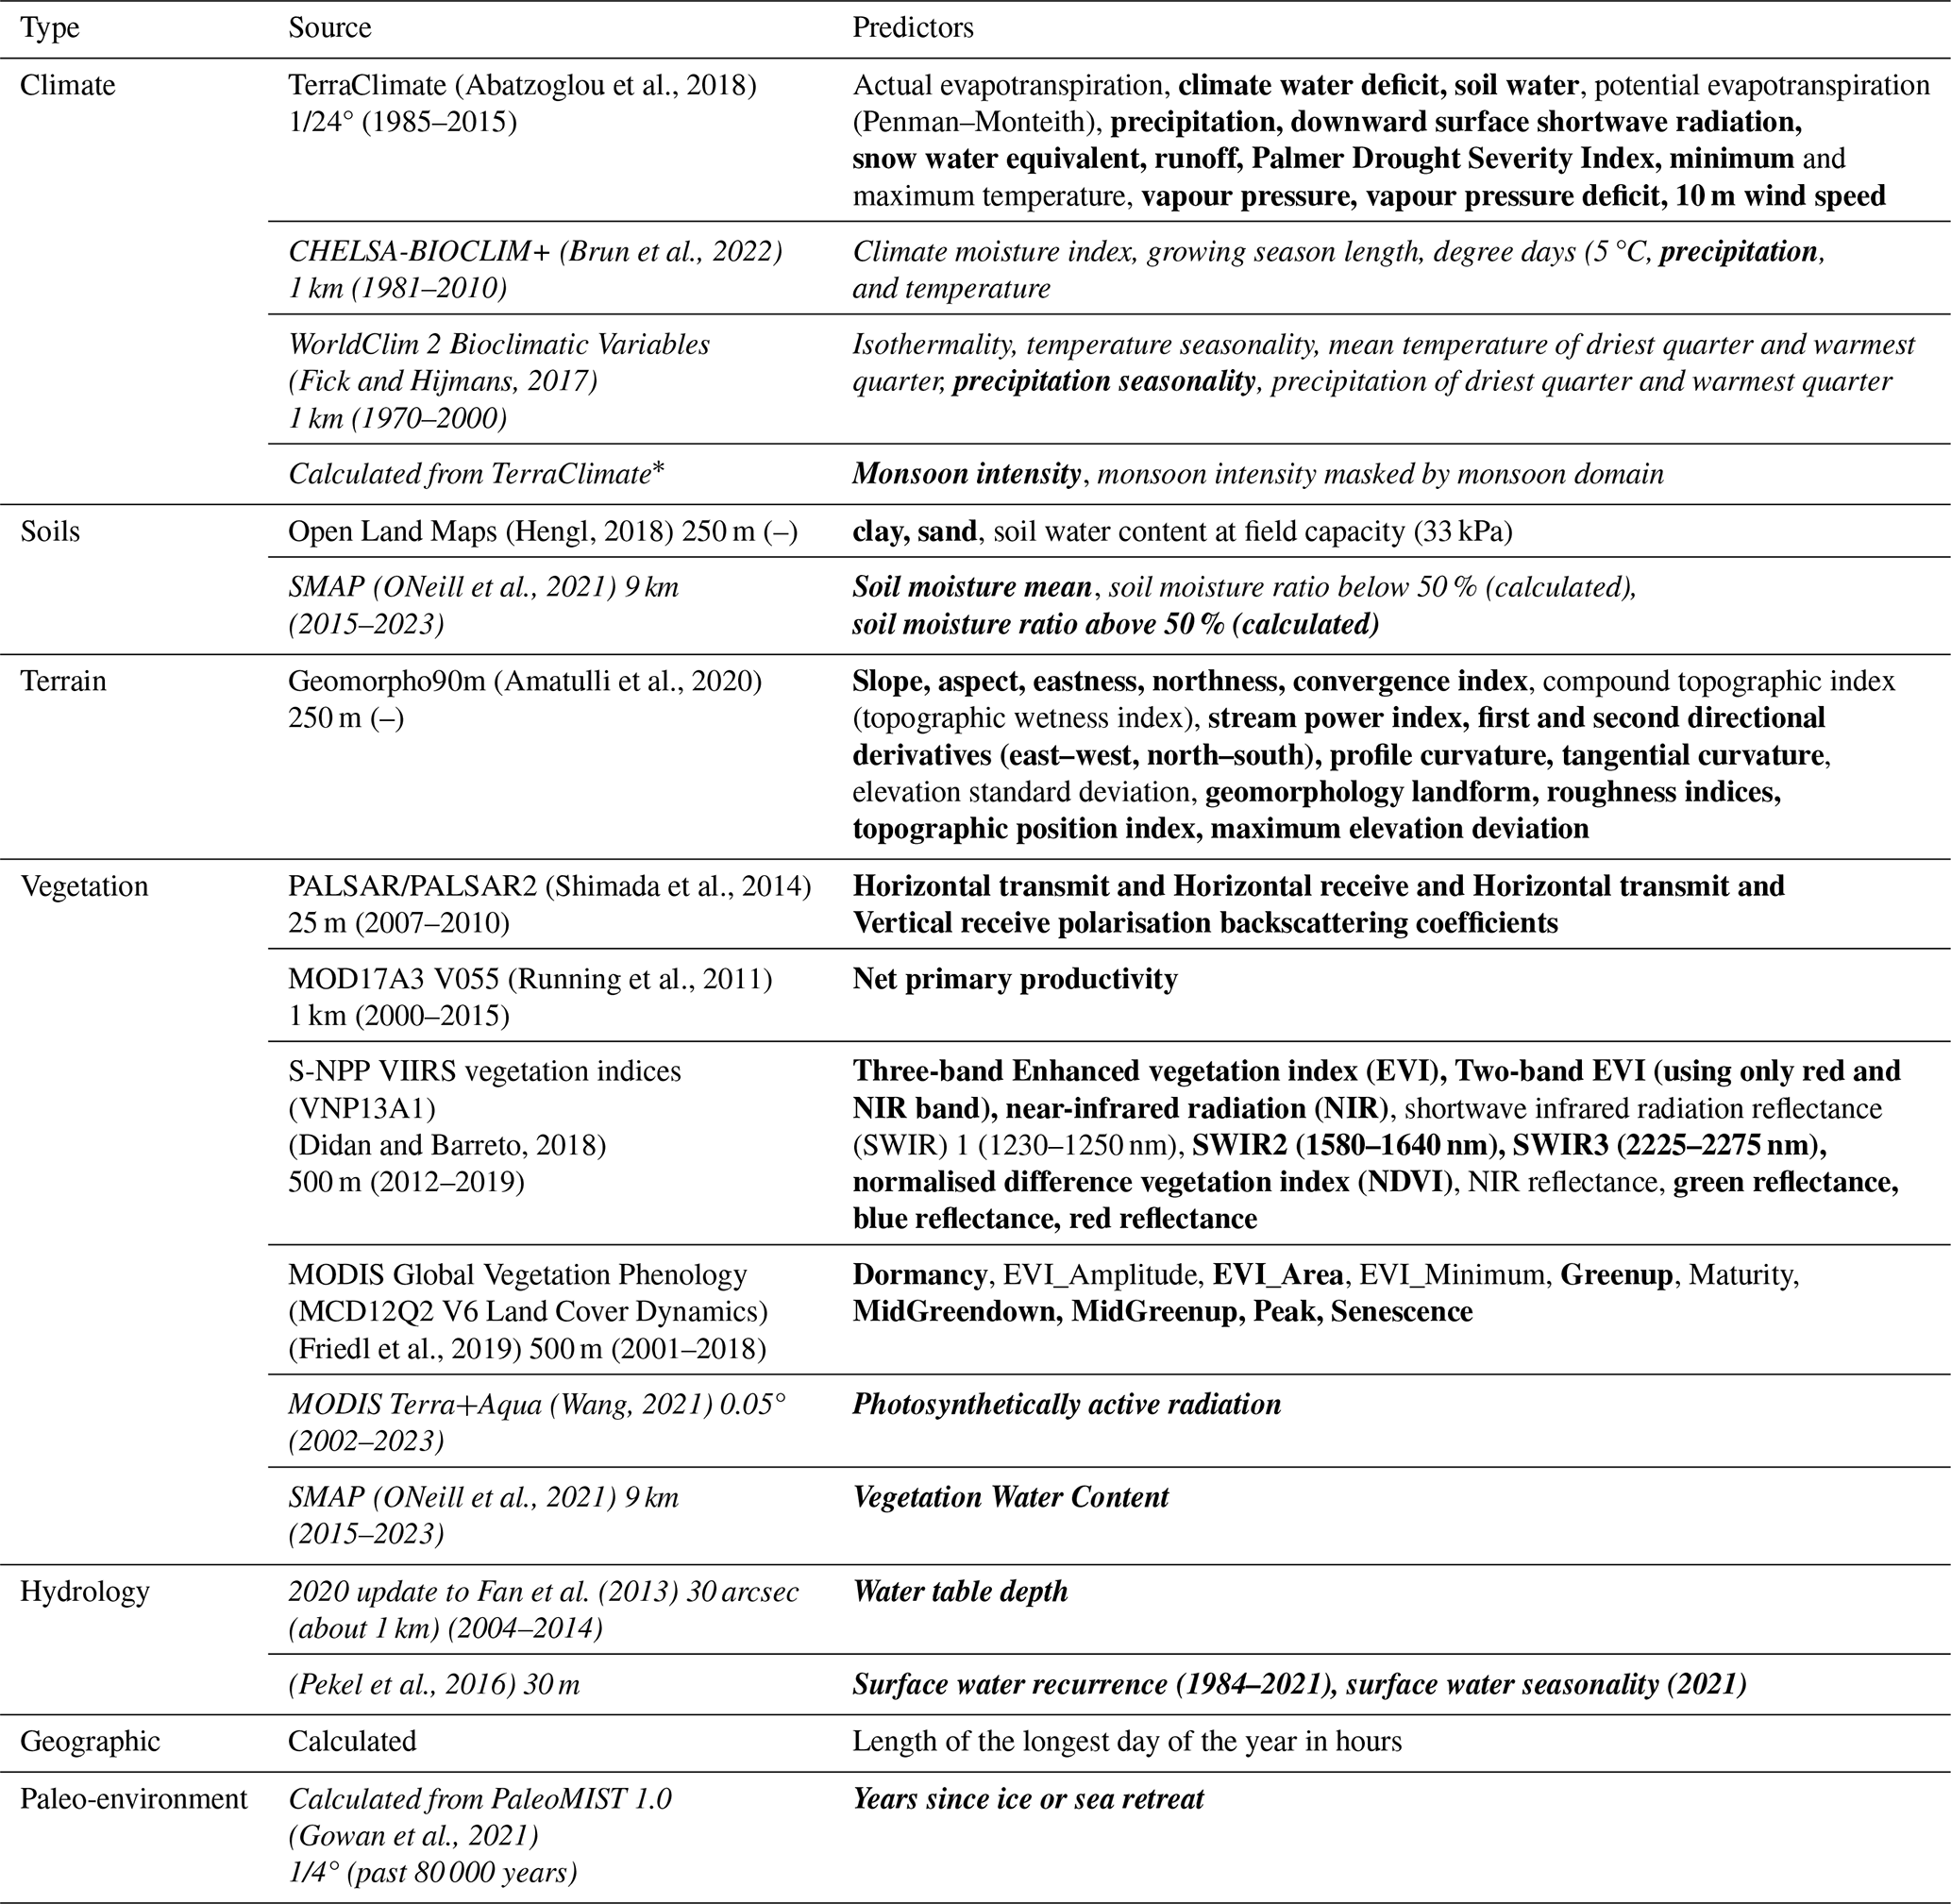
* Precipitation data based on the methodology of Zeng and Zhang (2020) and Wang and Ding (2008).
Since all peatlands develop when organic matter deposition exceeds decomposition over extended periods in waterlogged conditions (Gorham, 1957; Moore, 1989), we included hydrological predictors (water table depth, surface water recurrence and seasonality) that indicate persistent saturation that limit peat decomposition. We also added paleo-environmental information (years since ice and sea retreat; Gowan et al., 2021), though this was challenging given the Peat-DepthML framework's lack of temporal dataset support. All temporally-dimensioned predictor datasets required aggregation. Melton et al. (2022) found that seasonal means (SON, DJF, MAM, JJA) for climate predictors yielded similar results to annual minimums and maximums, despite potentially suboptimal tropical representation. We included both aggregation types plus additional climate predictors with broader applicability (e.g., growing degree days) or tropical specificity (e.g., monsoon intensity) (Wang and Ding, 2008).
We excluded organic carbon content and bulk density predictors from PeatDepth-ML. These derive from ML-based products using similar predictors to Peat-ML (Hengl et al., 2017; Hengl and MacMillan, 2019; Melton et al., 2022), creating potential circularity where our model would predict based on outputs from models targeting similar variables.
Additional climate predictors were sourced from CHELSA-BIOCLIM+ (Brun et al., 2022, https://www.envidat.ch/#/metadata/bioclim_plus, last access: 30 May 2023), WorldClim 2 (Fick and Hijmans, 2017, https://worldclim.org/data/worldclim21.html, last access: 25 July 2023), and TerraClimate (Abatzoglou et al., 2018, https://developers.google.com/earth-engine/datasets/catalog/IDAHO_EPSCOR_TERRACLIMA TE?_gl=1*zyex4e*_up*MQ..*_ga*MTkzMDAxODU5OC4 4xNzc2MTk4ODk1*_ga_SM8HXJ53K2*czE3NzYxOTg4 OTUkbzEkZzAkdDE3NzYxOTg5NTgkajYwJGwwJGgw, last access: 11 September 2023, via GEE; Gorelick et al., 2017). CHELSA-BIOCLIM+ provides 1 km resolution climate time series through statistical downscaling and calculations applied to climatologies from CHELSA V2.1 (Karger et al., 2017, 2021) and ERA5 (Hersbach et al., 2020). WorldClim 2 consists of 1 km monthly climate datasets interpolated from weather station data using MODIS satellite data; its bioclimatic variables represent annual trends from monthly rainfall and temperature data (Fick and Hijmans, 2017).
We calculated monsoon intensity predictors using the method from Zeng and Zhang (2020) using the original TerraClimate precipitation dataset, taking absolute values for equatorial consistency. We created an additional monsoon intensity predictor masked by the global monsoon precipitation domain defined by Wang and Ding (2008).
New soil predictors were derived from SMAP (Soil Moisture Active Passive; ONeill et al., 2021, https://developers.google.com/earth-engine/datasets/catalog/ NASA_SMAP_SPL3SMP_E_005?_gl=1*1n4xe5a*_up* MQ..*_ga*MTE0ODM2MjYzNy4xNzc2MTk5NjU3*_ga_ SM8HXJ53K2*czE3NzYxOTk2NTckbzEkZzAkdDE3NzY xOTk2NTckajYwJGwwJGgw, last access: 20 September 2023, via GEE). SMAP is a 9 km, daily composite soil–moisture product derived from interpolated observations of the SMAP L-band radiometer. We computed two additional predictors: the fraction of daily measurements below 50 % of the mean soil moisture and the fraction above 50 % of the mean. SMAP provides no measurements over open water or frozen ground, producing substantial Northern Hemisphere winter gaps. Because we averaged measurements over time to remove the temporal dimension, those gaps do not persist in the datasets supplied to the model, but data in the affected regions are correspondingly more uncertain.
We added vegetation predictors from MODIS Terra+Aqua PAR (Wang, 2021, https://developers.google. com/earth-engine/datasets/catalog/MODIS_062_MCD18C 2?_gl=1*5qzn3*_up*MQ..*_ga*Njc5MzE2MzY5LjE3NzY yMDEwOTg.*_ga_SM8HXJ53K2*czE3NzYyMDEwOTgk bzEkZzAkdDE3NzYyMDEwOTgkajYwJGwwJGgw, last access: 25 June 2023, via GEE) and from SMAP. MODIS Terra+Aqua PAR is a three-hourly, 0.05° product; Wang (2021) derive PAR from surface reflectance using multi-temporal MODIS signatures together with top-of-atmosphere radiance and reflectance. The SMAP product also includes vegetation water content – computed primarily from a MODIS Normalised Difference Vegetation Index (NDVI) product (ONeill et al., 2021) – which is used in the soil–moisture retrievals.
Our hydrology predictors were processed from the 2020 update to Fan et al. (2013) (http://thredds-gfnl.usc.es/thredds/catalog/GLOBALWTDFTP/catalog.html, last access: 12 February 2024) and Pekel et al. (2016) (https://developers.google.com/earth-engine/datasets/catalog/JRC_GSW1_4_GlobalSurfaceWater, last access: 18 July 2023, via GEE). Fan et al. (2013) produced 30 m resolution annual and monthly water table depth datasets by compiling well observations and gap-filling with a groundwater model forced by terrain, sea level, and climate. Pekel et al. (2016) developed 30 m resolution global surface water datasets using evidential reasoning, expert systems, and visual analytics applied to Landsat 5, 7, and 8 imagery. Though Melton et al. (2022) avoided these surface water products due to Landsat limitations for treed and small peatlands, we included them given the importance of waterlogging in peatland development (Page and Baird, 2016; Joosten and Clarke, 2002; Rydin and Jeglum, 2013a).
Peat growths occurs over centennial to millennial time scales so paleo-environmental data could provide useful predictors of peat depth. Retreating ice sheets from the Last Glacial Maximum paced northward expansion of modern peatlands, while tropical peatlands were more affected by sea level change and subsequent hydrological alterations (Treat et al., 2019). Thus, we derived a paleo-environmental predictor from PaleoMIST 1.0 (Gowan et al., 2021, https://doi.org/10.1594/PANGAEA.905800). PaleoMIST 1.0 is a 0.25° resolution product spanning 80 000 years in 2500-year time steps, developed using reconstructed sea levels and a three-layered solid Earth model. From PaleoMIST 1.0 ice thickness and paleotopography variables, we identified when each grid cell became ice-free and subaerial. For areas exposed throughout the product's duration, we assigned −82 500 years (one step older than maximum age); for areas still covered, we assigned 2500 years (one step younger than minimum age).
Predictor datasets carry inherent uncertainties that impact PeatDepth-ML (Meyer and Pebesma, 2022). While bootstrapping may broadly capture these influences (Sects. 2.2.1 and 3.1), predictor uncertainties cannot be easily separated from training data uncertainty.
2.3 Adjustments to Peat-ML Framework
PeatDepth-ML employs the same ML algorithm, parameter optimization, cross-validation method, and predictor selection process as the Peat-ML framework (Melton et al., 2022), as illustrated in Fig. 4. Similar to Peat-ML, the PeatDepth-ML workflow incorporates several key steps to enhance model robustness: (1) removal of predictors that promote overfitting through elimination of highly multicollinear features via variance inflation factor (VIF) calculation and recursive feature elimination, (2) Bayesian hyperparameter optimization, and (3) blocked leave-one-out (BLOO) cross-validation for predictor error estimation. An important distinction of the VIF over simple correlation, which only looks at pairwise relationships, is that it quantifies complex interdependencies and the combined effect of multiple predictors simultaneously. Our framework also uses a BLOO cross-validation approach as simple random splits result in overly optimistic error assessments due to spatial autocorrelation impacts (Roberts et al., 2017). BLOO, conversely, may result in overly pessimistic error estimates (Milà et al., 2022), but we prefer the more cautious estimate.
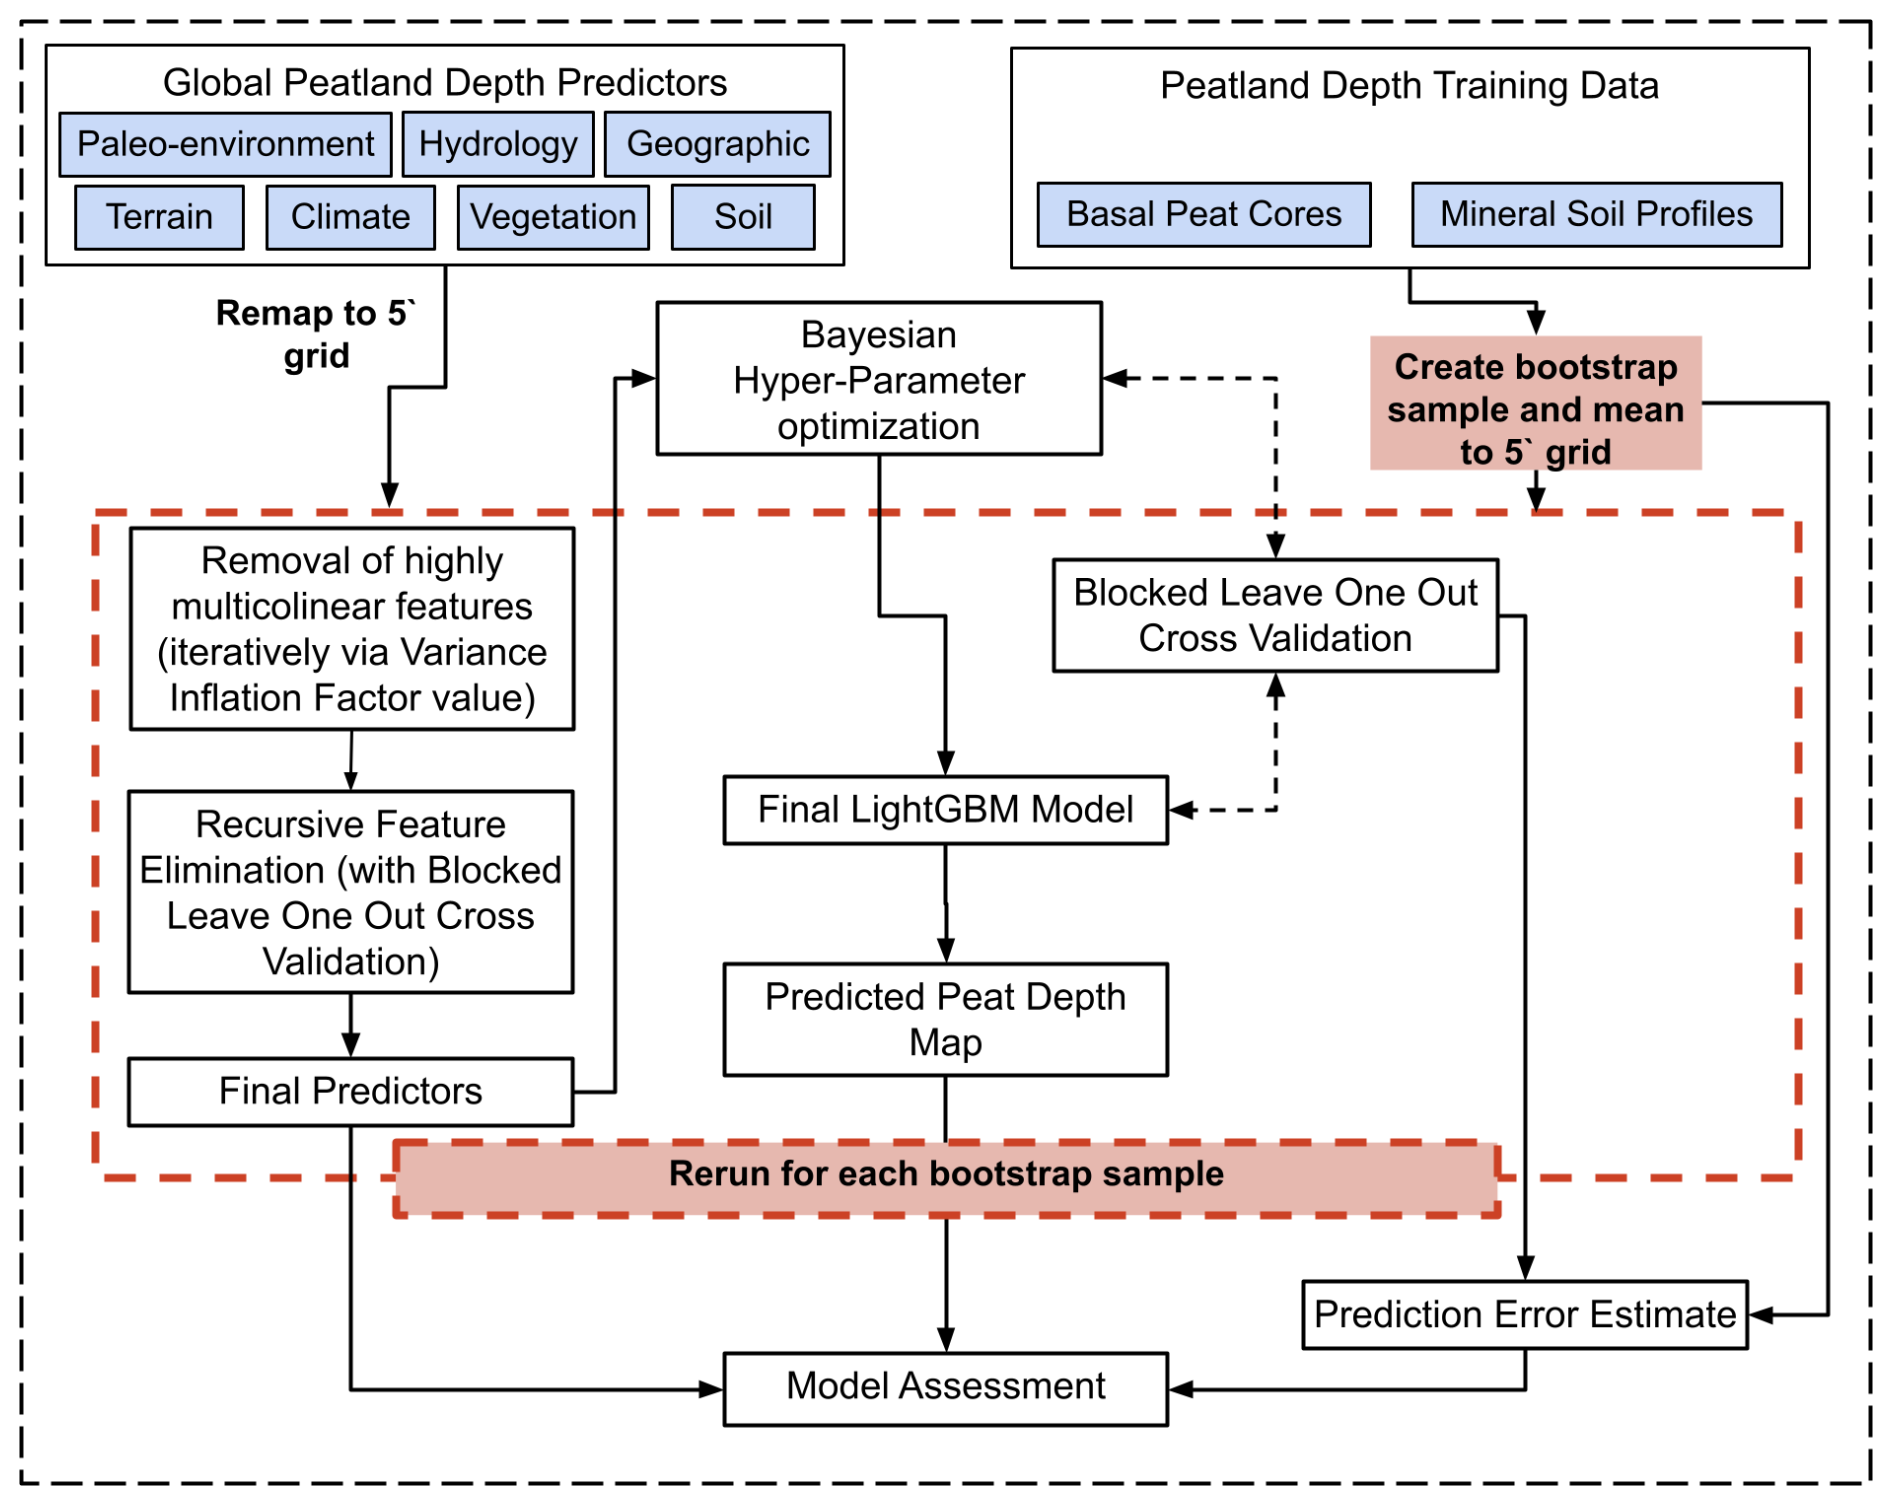
Figure 4Flow chart of the PeatDepth-ML modelling process, adapted from the Peat-ML Framework (Melton et al., 2022). The steps and acronyms are explained in more detail in Sect. 2.
PeatDepth-ML introduces a novel bootstrap resampling method and includes several adaptations to the Peat-ML framework necessary for peat depth modelling. One modification was to allow the model to generate values from zero upward, rather than constraining results to a maximum of 100 as in the original Peat-ML framework.
Like Melton et al. (2022), we established minimum cross-validation block sizes by finding where spatial autocorrelation diminished, determined by calculating mutual information (MI) of model residuals at different lag distances. MI describes similarity between a variable at one location and neighbouring locations. Positive MI indicates similar values cluster together; negative MI indicates dissimilar values cluster. Values closer to zero indicate less clustering and autocorrelation (Getis, 2010). We calculated z-scores to establish statistical significance, with values near zero indicating low significance (Getis and Ord, 1992). Figure A2 shows MI approaches zero and z-scores decrease sharply by 6°. Though both metrics decrease further beyond 6°, we chose 6° as minimum block size to balance training data non-uniformity, ensuring the maximum number of blocks access diverse peatland types (high-latitude and tropical). While model residual z scores do not match random datasets' lows, they correspond to low MI values and are deemed acceptable. Geary's C and G statistics corroborated these results (Getis, 2010; Getis and Ord, 1992; Ord and Getis, 1995). Using 6° minimum block size and aiming for even data distribution produces 17 blocks (Fig. 3) that delineate training versus testing cells in cross-validation.
We developed a custom scoring in LightGBM (Ke et al., 2017), to counter the training data's zero inflation, where peat-absent test cells received less weight (30 %) than peat-present cells (70 %) during cross-validation – a strategy from binary classification with skewed datasets (Krawczyk, 2016; Russell and Norvig, 2020). While peat-present cells comprise only 8.7 % of observed data, their model error then received greater weight. The custom loss function improved predictions of deeper depths but averaged less than 20 cm difference within known peatland regions (not shown). Grid-cell-level performance declined as expected since most test cells have zero peat depth, which we were now deliberately deprioritizing.
We also tested data preprocessing to reduce training data skew: log transformation (Feng et al., 2014; West, 2022), Box–Cox, and Log–sinh (Huang et al., 2023). However, we rejected all transformations as they provided minimal improvement while adding considerable computational cost.
The hyperparameters that were optimized for Peat-ML were also optimized for PeatDepth-ML (Melton et al., 2022). We performed our Bayesian hyperparameter optimization over 1500 model iterations and chose the values that produced the best results. These hyperparameters and their values can be found in Table A1 and are the same for every bootstrap run.
For the bootstrapping approach, we ran PeatDepth-ML for each bootstrapped dataset (401 in total) such that for each bootstrap we had the corresponding model output, cross-validation output, and the list of predictors used by that model run to produce said output. We then took the mean of the depth predicted over all the bootstrap model run outputs in each grid cell to produce a final PeatDepth-ML product (discussed in Sect. 3.2).
2.4 Approach to Allow Comparison with Other Published Datasets
PeatDepth-ML, Widyastuti et al. (2025), and Hugelius et al. (2020) were harmonized to enable statistical analysis. Widyastuti et al. (2025) was resampled to match PeatDepth-ML and Hugelius et al. (2020) resolutions, then all data outside the bounds of Widyastuti et al. (2025) were removed from both products. Mean peat depth was calculated for each product over approximately the same area, with PeatDepth-ML bootstrap means calculated then averaged together. PeatDepth-ML uncertainty bounds were derived from bootstrap outputs by determining the 5th and 95th percentiles of bootstrap means, then calculating symmetrical uncertainty as half the difference between these percentiles.
2.5 Calculation of Global Peatland Carbon Stocks
PeatDepth-ML predicts mean peat depth only over the peatland area within each grid cell. To allow estimation of global peatland C stock, we require a peatland fractional extent map that will give the peatland fraction of each PeatDepth-ML grid cell. While any fractional peatland map can be used, we select Peat-ML as our “best” estimate as it is on the same grid, provides fractional extent, and is a peer-reviewed product (Melton et al., 2022). To provide an alternative estimate we also use the Global Peatland Map (Greifswald Mire Center, unpublished dataset, https://greifswaldmoor.de/global-peatland-database-en.html, last access: 24 April 2026) although it is unpublished and little information is available about its provenance. To obtain a basic estimate of global peatland carbon stocks we follow an approach similar to Widyastuti et al. (2025):
where organic C content (OC) is in kg C kg−1, bulk density (BD) is in kg m−3, Cdens is C density in kg C m−3, Dpeat is peat depth in m, Acell is grid cell area in m2, and Cstock is C stock in kg. We calculated Acell using Peat-ML's peatland fractional coverage by determining each grid cell's trapezoidal area and scaling by peat coverage fraction.
We calculated C stock estimates using Cdens, OC, and BD values from other studies to enable comparison. Specifically, we tested Cdens values derived from the mean modelled OC and BD values in Widyastuti et al. (2025). Where their predicted peat depths exceeded 200 cm, they used their 100–200 cm OC and BD values for deeper depths, an approach we adopted. We also tested OC and BD values from two Page et al. (2011) approaches. Both methods use tropical OC and BD from their literature review, while employing high-latitude Cdens values based on Immirzi et al. (1992) estimates (assuming 1.5 m average peat depth; termed “Page1.5”) for one method, and recalculating high-latitude Cdens by combining Immirzi et al. (1992) data with 2.3 m average peat depth from Gorham (1991) for the second (termed “Page2.3”). These two approaches yield high-latitude Cdens values of 73.30 and 63.74 kg C m−3 for Page1.5 and Page2.3, respectively.
3.1 Predictor Importance
Across 401 PeatDepth-ML bootstrap runs, 123 different predictors were selected by one or more runs (bold predictors in Table 1). However, only 10 predictors were selected by over 75 % of runs, indicating many were not consistently important. Figure 5 shows the top 15 predictors by averaged importance across all runs. The highest average importance predictor is average VPD over SON (September–November), selected in 87 % of bootstrap runs and always ranking among the top two when chosen. Second is average SWE over DJF (December–February), selected in 62 % of runs with a more even importance distribution than VPD SON. No other predictors approach VPD SON and SWE DJF importance levels, except overall mean annual VPD which frequently exceeds 10 % importance when selected but appears in only 26 % of runs, yielding lower average importance. Beyond these three, most predictors range from 0 % to 10 % importance. No predictor was selected across all 401 runs, though SWIR3 MAM (March–May) standard deviation came closest (selected in 99 %), followed by Runoff SON and geomorphological landforms indicator (Geomorphon) at 96 % selection each.
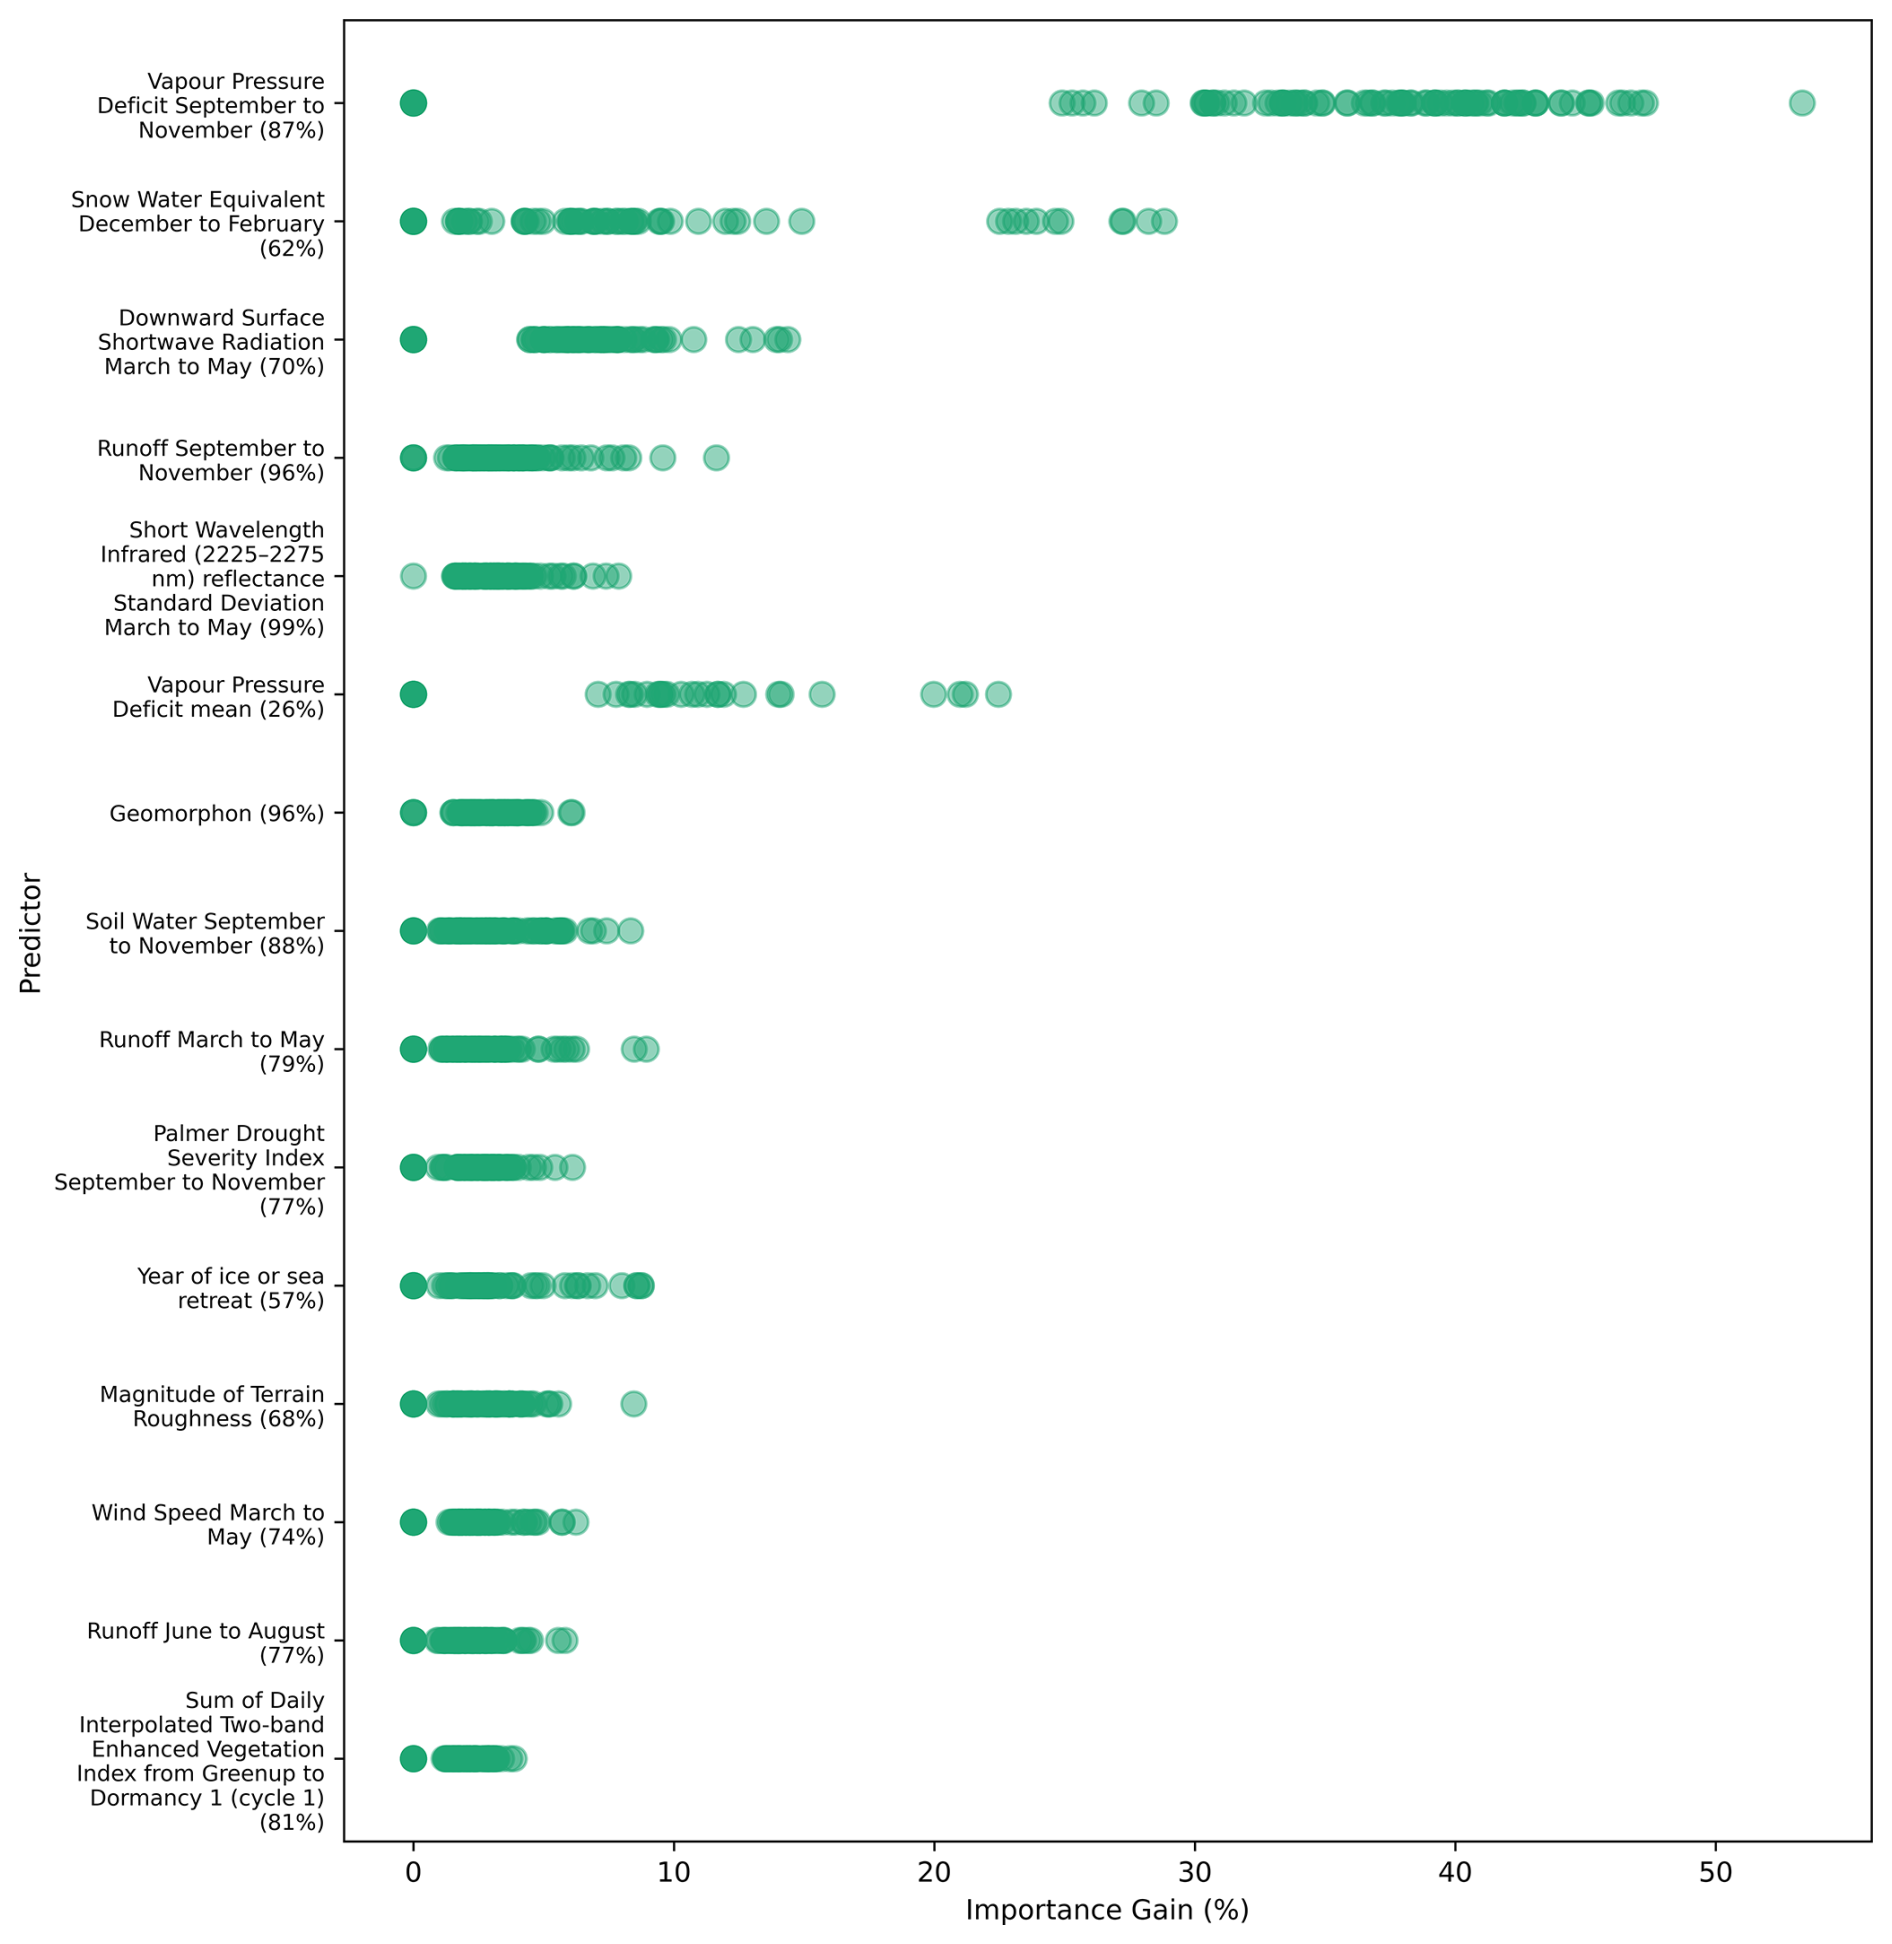
Figure 5Importance of top 15 predictors based on information gain (percent), ordered by average importance across bootstrap runs. Green dots represent predictor importance within individual bootstrap runs. When bootstrap runs did not select listed predictors, importance is treated as 0 %. Numbers beside predictor names indicate percentage of bootstrap runs selecting each predictor.
Of the top 15 predictors, 10 relate to climate, two to vegetation, two to terrain, and one is a paleo-environment predictor (Table 1). In their analysis of peat formation drivers, Minasny et al. (2019) list climate among the most important globally, alongside vegetation and topography. PeatDepth-ML therefore selects and utilizes predictors associated with peat formation despite strong variability in predictors selected arising from variability in the training data stemming from the bootstrapping. This variability in predictor importance might be also at play in other studies. For example, Widyastuti et al. (2025) train separate models for six different large regions. They find the predictor importance to vary strongly between each region (their Fig. 5), which could be at least partially due to the strong dependence upon training data we see here. This also raises the possibility that training models for smaller regions and then stitching together could bring in artifacts due to the smaller domains for each model restricting the amount of data to train upon.
The variability in predictor importance and selection makes any mechanistic interpretation of the predictors to peat formation processes challenging, nevertheless, we can make broad observations about overall PeatDepth-ML behaviour.
Frequent to continuous waterlogging from precipitation, groundwater, or both is important for peat accumulation initiation and persistence (Page and Baird, 2016). Figure 5 shows that except for downward surface shortwave radiation, wind speed, and year of ice or sea retreat, most of the top 15 climate predictors closely relate to factors that influence water or moisture presence. PeatDepth-ML likely selects VPD SON (and potentially mean VPD) to delineate shallow or non-peatland areas. Given strong zero-inflation in training data, the model likely finds improved scoring during cross-validation when choosing predictors informative for non-peatland regions, even with our custom scoring metric.
SWE DJF may separate high-latitude from tropical peatlands, as suggested for Peat-ML (Melton et al., 2022). Peat-ML also ranked SWIR3 among top predictors, suggesting it differentiates wet/dry earth and identifies fens. SWIR3 MAM standard deviation is PeatDepth-ML's most selected bootstrap predictor, and may be used to assess areas experiencing excessive moisture fluctuation that prevents deep peat accumulation, as low moisture increases respiration, limiting peat growth.
PeatDepth-ML frequently selects Runoff SON, potentially indicating adequate levels of precipitation for coastal and tropical peatlands (Ratnayake, 2020; Page and Baird, 2016). Geomorphon appears in both Peat-ML and PeatDepth-ML where it provides topographical characteristics conducive to peat development (Melton et al., 2022).
3.2 Predicted Peat Depths and Trustworthiness
Global peat depth averaged across all PeatDepth-ML bootstrap runs, hereafter called the modelled mean, appears in Fig. 6. The modelled mean indicates peat depths exceeding 30 cm in most major peatland regions including parts of Canada, Congo Basin, Scandinavia and Northern European Plain, West Siberian Lowlands, and Malay Archipelago areas.
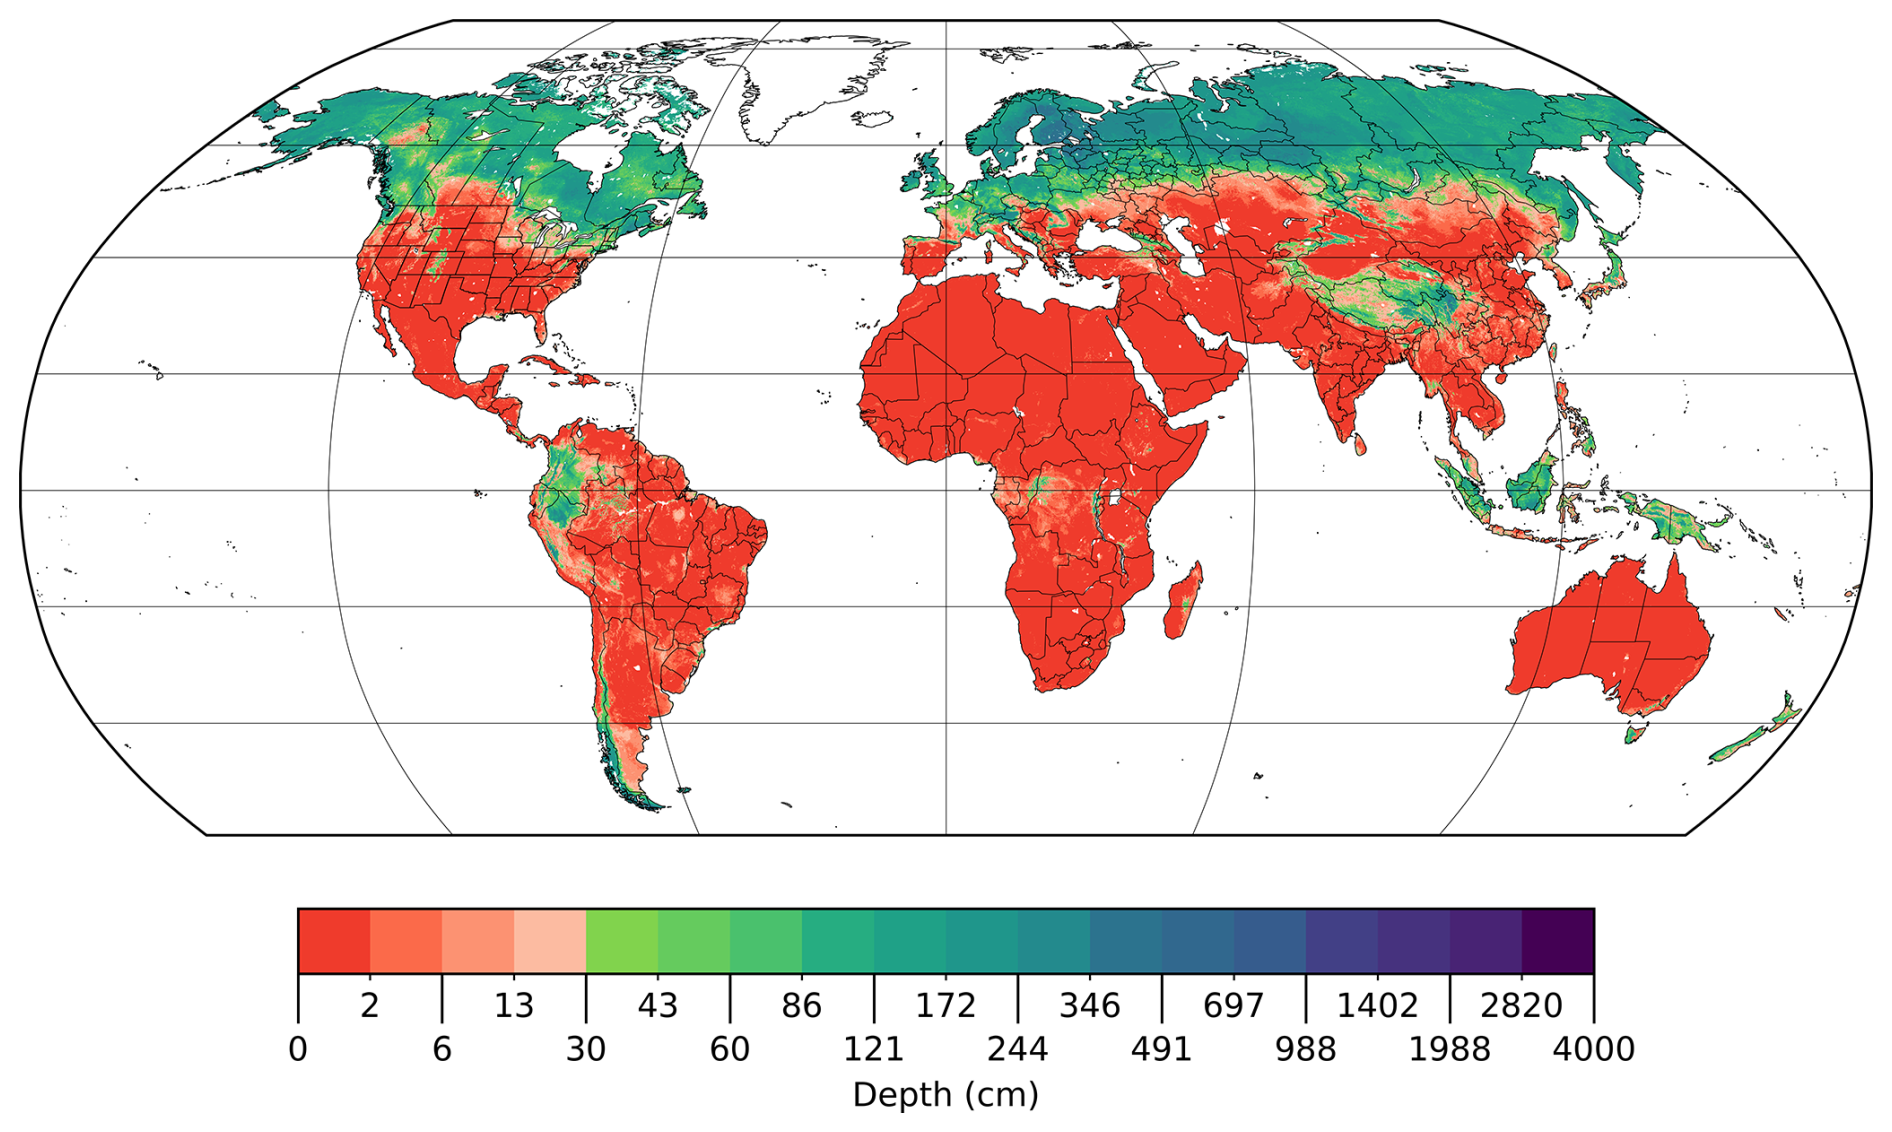
Figure 6The modelled mean averaged from 401 bootstrap PeatDepth-ML model runs. Areas without coloured grid cells contain no data. Since training and testing data represent mean peat depth of peatlands within grid cells rather than mean depth over entire grid cells (Sect. 2.2.1), these PeatDepth-ML results are similarly the depth of peatlands within each grid cell. The colour bar uses log scale with a break at 30 cm.
Some data gaps exist in PeatDepth-ML outputs due to missing predictor data. Figure 6 shows the modelled mean lacks data for parts of the Canadian arctic (Victoria Island, parts of Barren Grounds, Baffin Island), all of Greenland, and parts of Russia's Novaya Zemlya archipelago. The model cannot predict for grid cells lacking all provided predictors. Persistent gaps in the modelled mean result from gaps present in identical locations throughout every bootstrap run. Of grid cells with modelled mean data, only 0.5 % had missing data in some bootstrap outputs.
Not all areas predicted from a ML-based model should be considered equally trustworthy. To investigate our spatial applicability, Fig. 7 shows the results of the AOA analysis across all bootstrap runs, with gradients indicating percentage of runs where grid cells were deemed applicable. For locations with aforementioned missing data in some bootstraps, these count as reduced applicability corresponding to missing data frequency. Of grid cells experiencing any inapplicability, 4.2 % result from occasional bootstrap data gaps, mostly along northern Caspian Sea coasts.
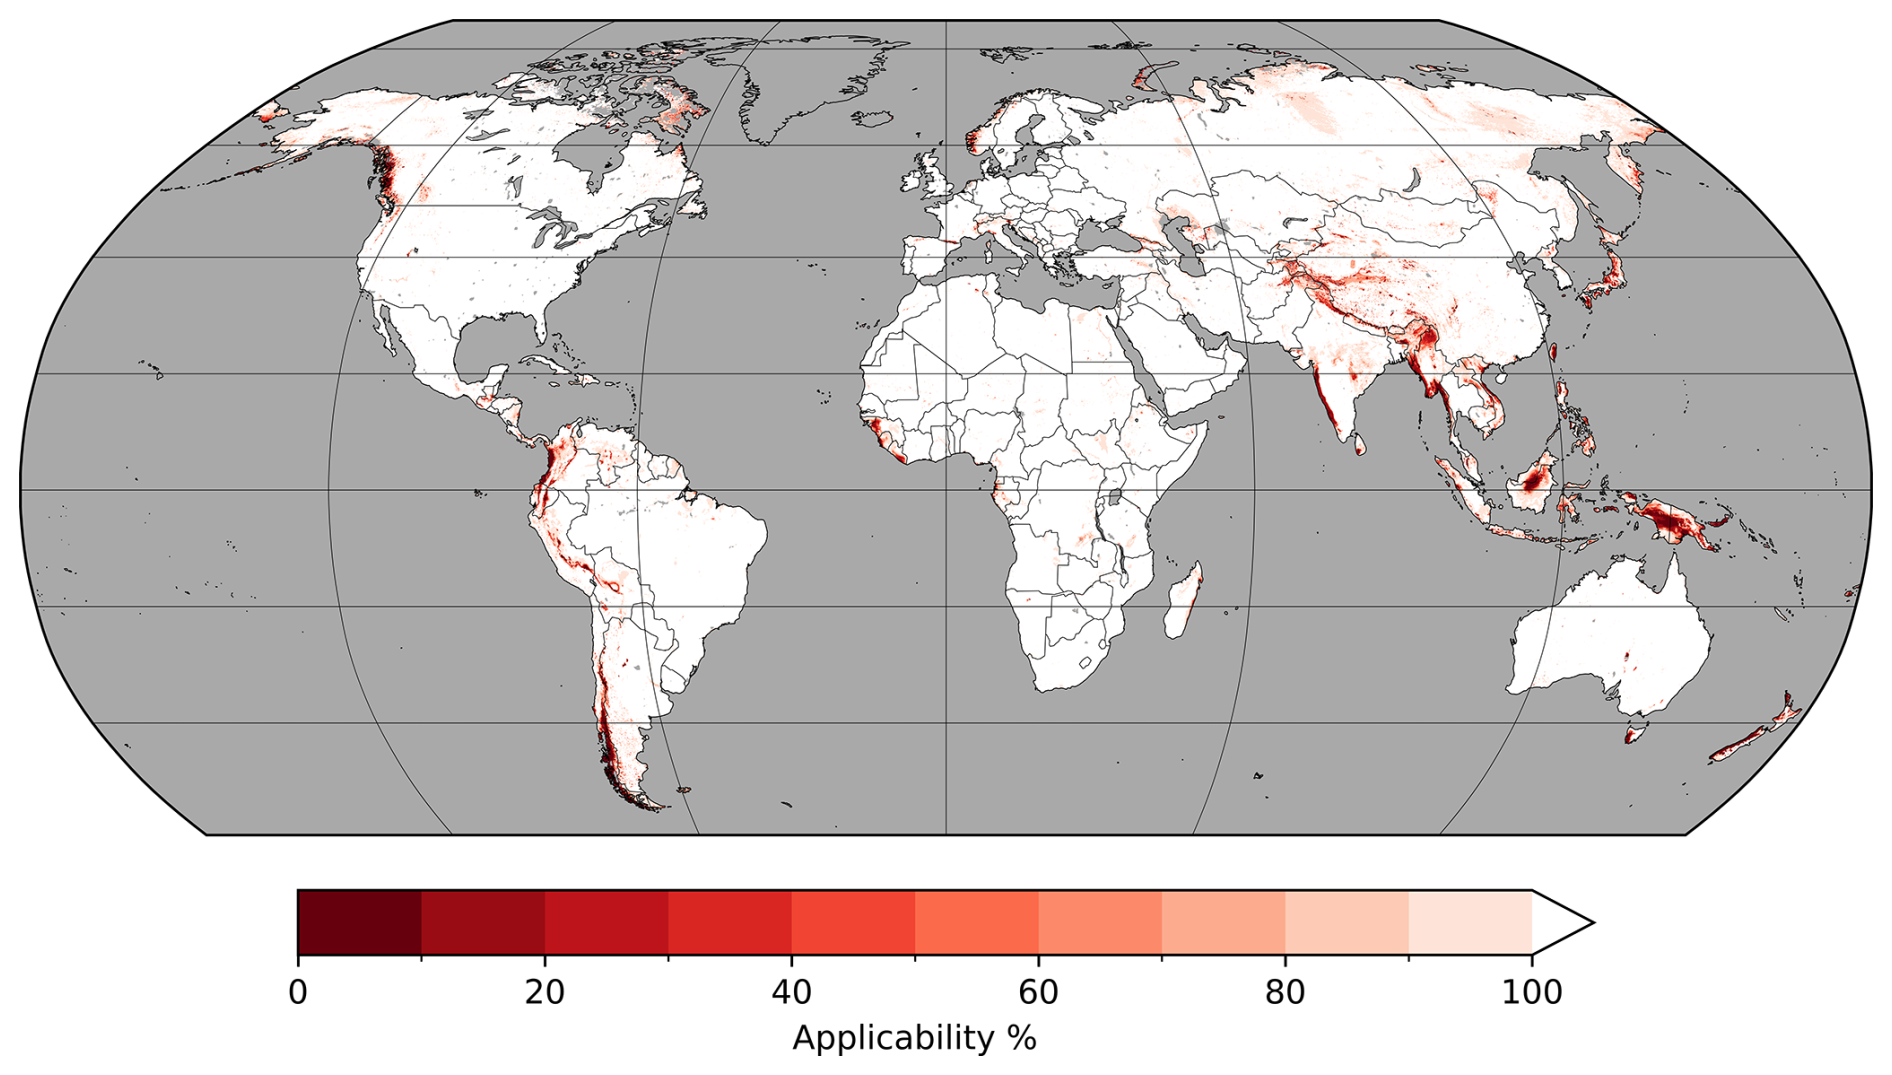
Figure 7Bootstrap run applicability percentage by area. White grid cells indicate 100 % applicability as defined by the AOA analysis protocol of Meyer and Pebesma (2021) across all 401 bootstrap runs.
Globally, the modelled mean shows lowest applicability over mountainous regions (Fig. 7). Although training data exist in or near mountainous regions, coverage is limited, particularly in Indonesia (Fig. 3). This data scarcity likely contributes to higher inapplicability in these areas. Regions in the Siberian Plateau, East Siberian Mountains, and areas extending south from the Chukchi Peninsula to the Kamchatka Peninsula show 80 %–90 % applicability, also reflecting limited training data in those regions. Additionally, since AOA depends on model predictors for each run, it reflects training data uncertainty through bootstrapping. This result is important as it implies that single model instances, as are common in the literature, are potentially unreliable. This also further raises questions about the practice of training different models for different regions of the globe and then stitching them together (e.g. Widyastuti et al., 2025).
Figure 8 compares PeatDepth-ML to Widyastuti et al. (2025) and Hugelius et al. (2020); however, quantified comparisons are challenging due to differing resolutions and spatial extents. Widyastuti et al. (2025) provides depth predictions at 1 km spatial resolution over “peat-dominated” areas from the Global Peat Map version 2.0 (GPM v.2; United Nations Environment Programme, 2021), with modifications in Indonesia, Sweden, Denmark, and the Netherlands where peat thickness maps were randomly sampled and treated as peat cores. Hugelius et al. (2020) predicted peat depths north of 23° N at 0.1° resolution. Hugelius et al. (2020) do not include non-peat data in their depth modelling process, instead combining peat depth results with their own coverage map to mask non-peatlands. Thus both Widyastuti et al. (2025) and Hugelius et al. (2020) rely upon masking methods to delineate peatland regions and also do not provide estimates of spatial applicability or extrapolation.
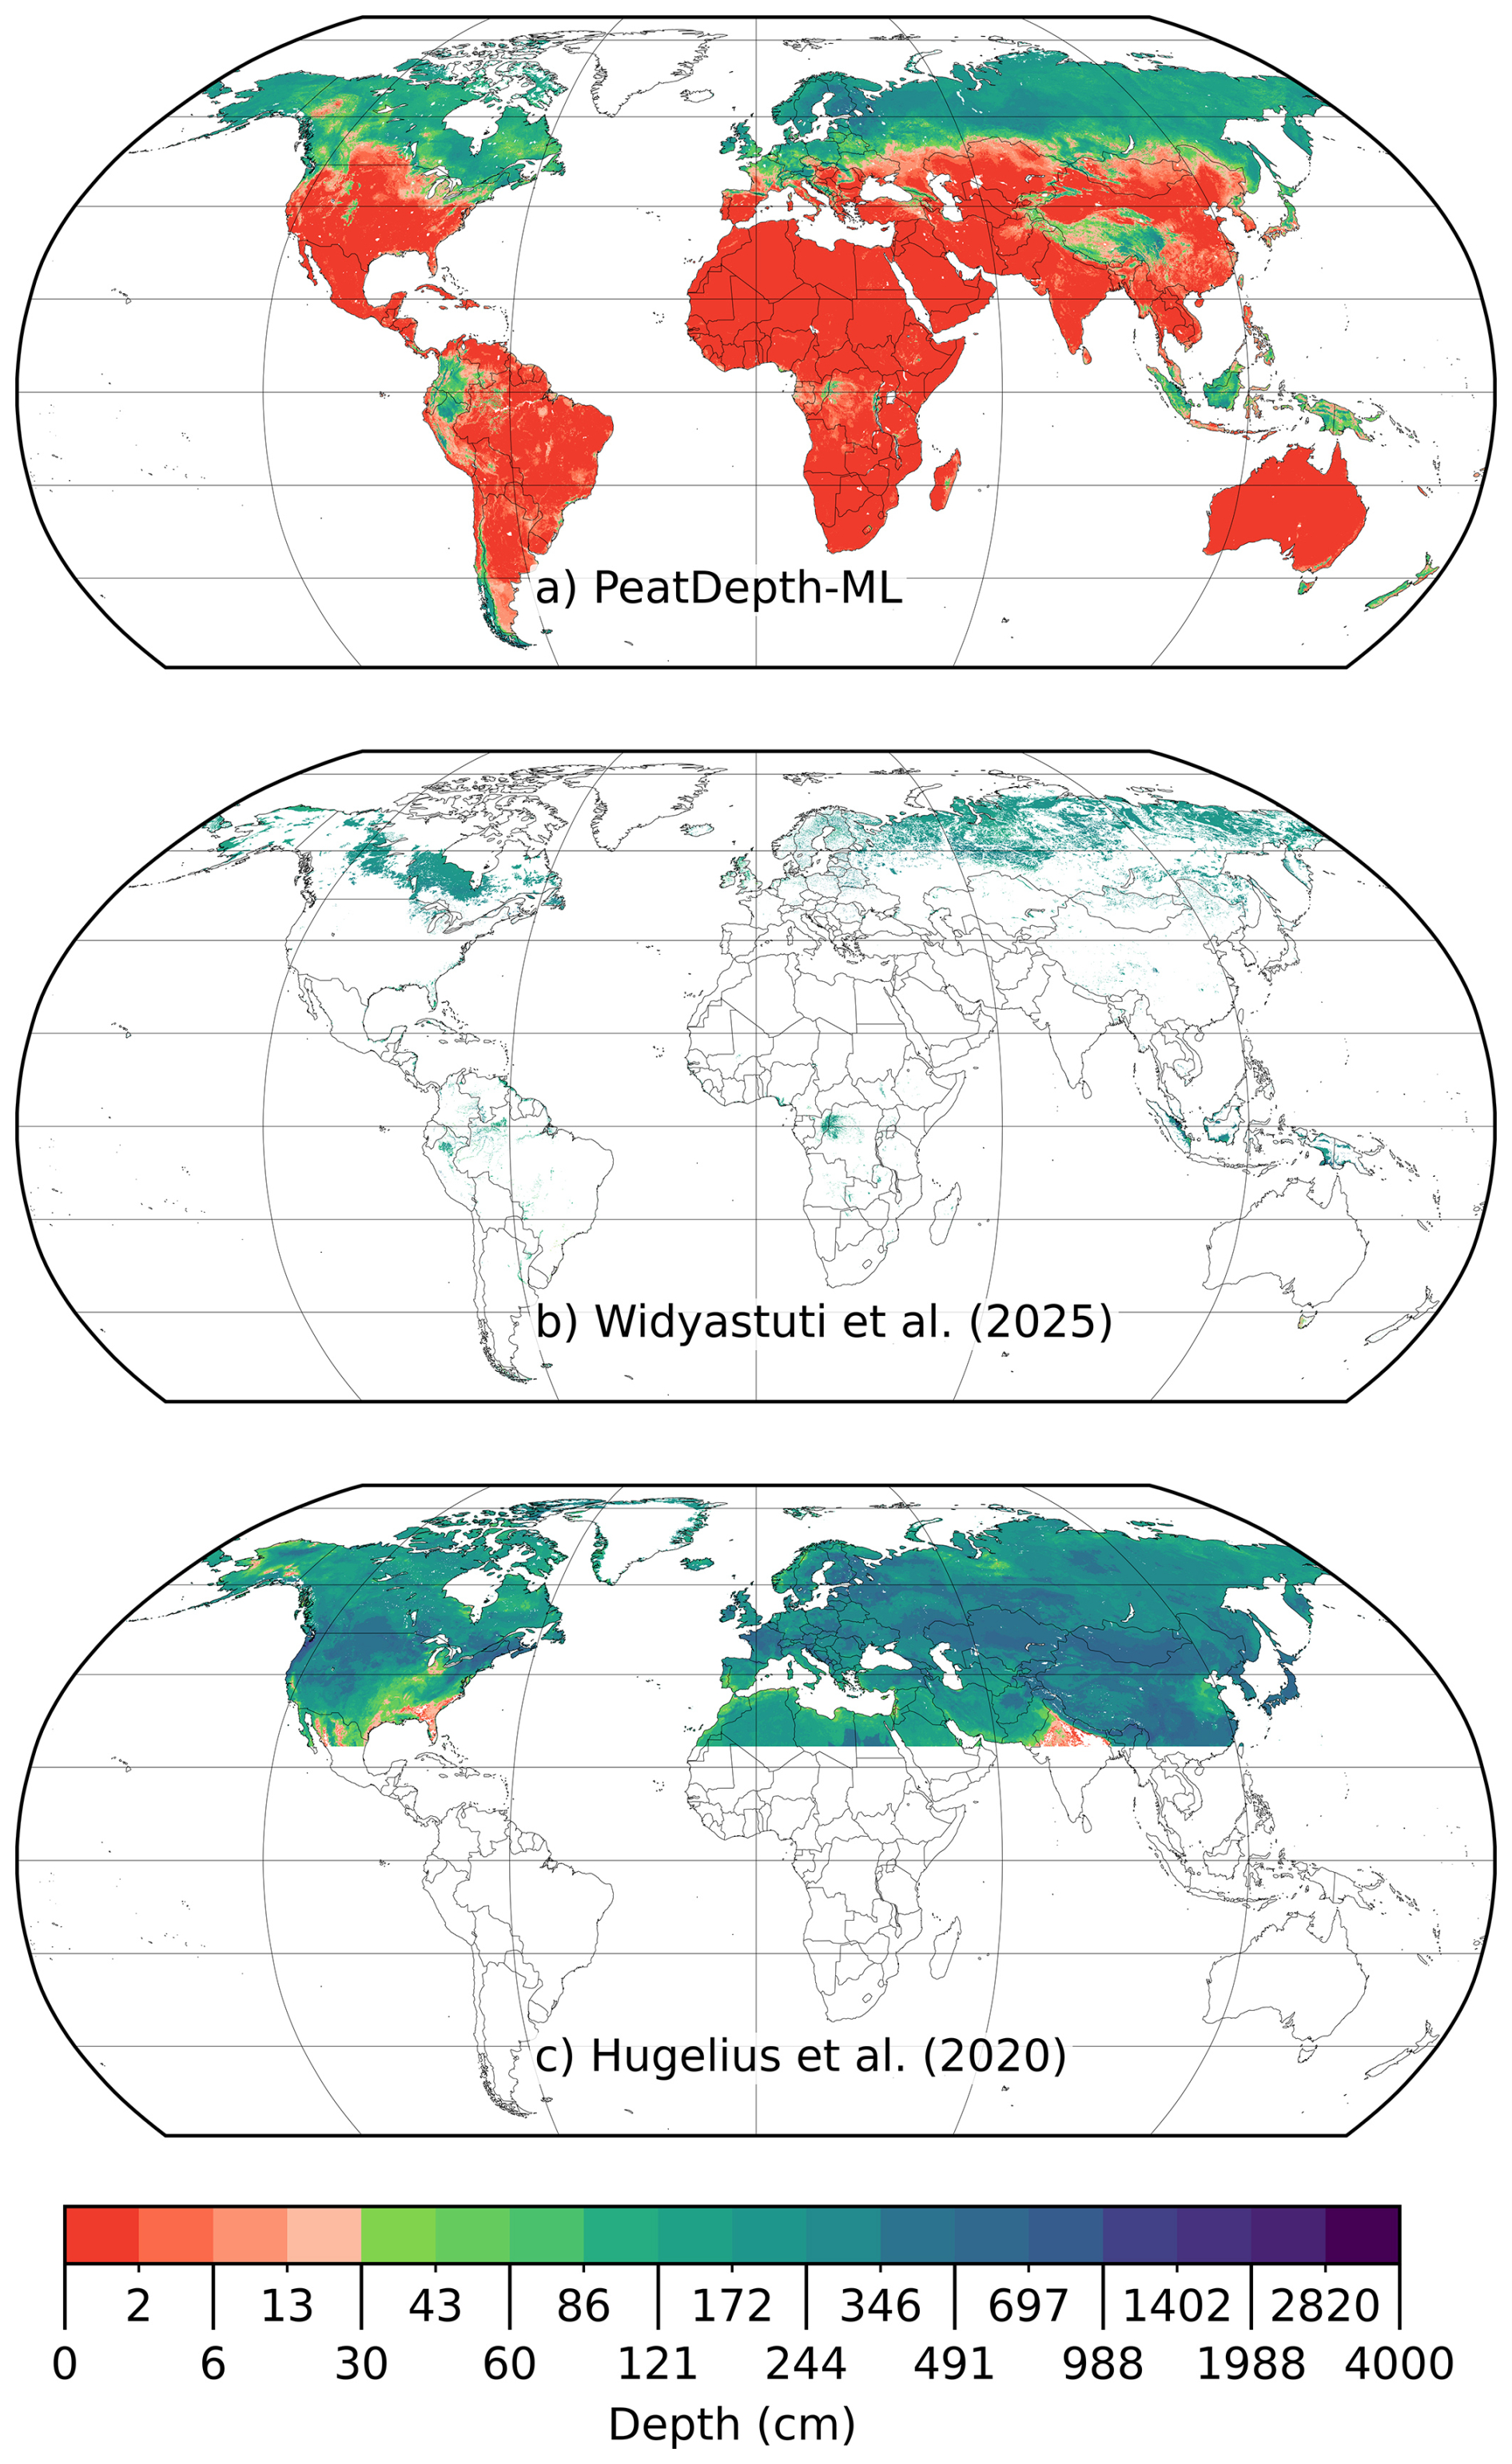
Figure 8(a) Average peat depth predictions of PeatDepth-ML's modelled mean (5 arcmin resolution). (b) Widyastuti et al. (2025) peat depth results (1 km resolution). (c) Hugelius et al. (2020) peat depth results (0.1° resolution) across entire domain (not masked to peatlands to show performance across entire domain). The colour bar uses a logarithmic scale with a colour break at 30 cm.
Visual comparison of our modeled mean with Widyastuti et al. (2025) (Fig. 8) shows deepest peat depths in similar regions: Indonesia, West Siberian Lowlands, Hudson Bay Lowlands, Canadian Boreal Plains, Pastaza-Marañón Foreland Basin, and Congo Basin. Key differences include Widyastuti et al. (2025) showing deeper peat across more of the Congo Basin, while our model indicates deeper peat in southern Chile and Argentina. In Alaska, Widyastuti et al. (2025) predicts shallow depths whereas our model shows relatively deep peat. The Tibetan Plateau, excluded from Widyastuti et al. (2025) (via the GPM v.2 mask), appears as a significant peat complex in PeatDepth-ML.
Comparing Hugelius et al. (2020) with both products at northern latitudes reveals it predicts the most widespread and consistently deepest peat, though large areas are filtered during post-processing (continental US, central Eurasia, northern Sahara). Notable differences occur in Alaska, Hudson Bay Lowlands, and West Siberian Lowlands, where Hugelius et al. (2020) predicts shallower peat than our model and Widyastuti et al. (2025). While Hugelius et al. (2020) can predict depths < 30 cm (India, US Coastal Plains), the scarcity of non-peat regions demonstrates this product's reliance on their peatland spatial coverage map.
Regional peat depths for PeatDepth-ML, Widyastuti et al. (2025), and Hugelius et al. (2020) are presented in Table 2 and Fig. 9. Due to the skewed nature of the peat depths, the results are presented as medians plus the interquartile range. PeatDepth-ML generally predicts shallower median depths than the other two products, particularly in the tropics where Widyastuti et al. (2025) exceeds PeatDepth-ML by over half a metre. In the northern hemisphere, Hugelius et al. (2020) achieves the deepest mean depth, consistent with Fig. 8.
Widyastuti et al. (2025)Widyastuti et al. (2025)Widyastuti et al. (2025)Hugelius et al. (2020)Widyastuti et al. (2025)Table 2Estimated peat depths by region. PeatDepth-ML and Hugelius et al. (2020) are masked using reduced-resolution Widyastuti et al. (2025) for direct comparison. PeatDepth-ML values are calculated based on all grid cells with predicted peat depths greater than 5 or 30 cm and, due to skew, presented as median plus the interquartile range (IQR). As PeatDepth-ML does not use a mask to define peatland area, this filter is used to remove thin predicted peat depths that are not truly indicative of peatlands as commonly defined. Northern hemisphere is > 23° N while Tropics is 23.5° S–23.5° N.
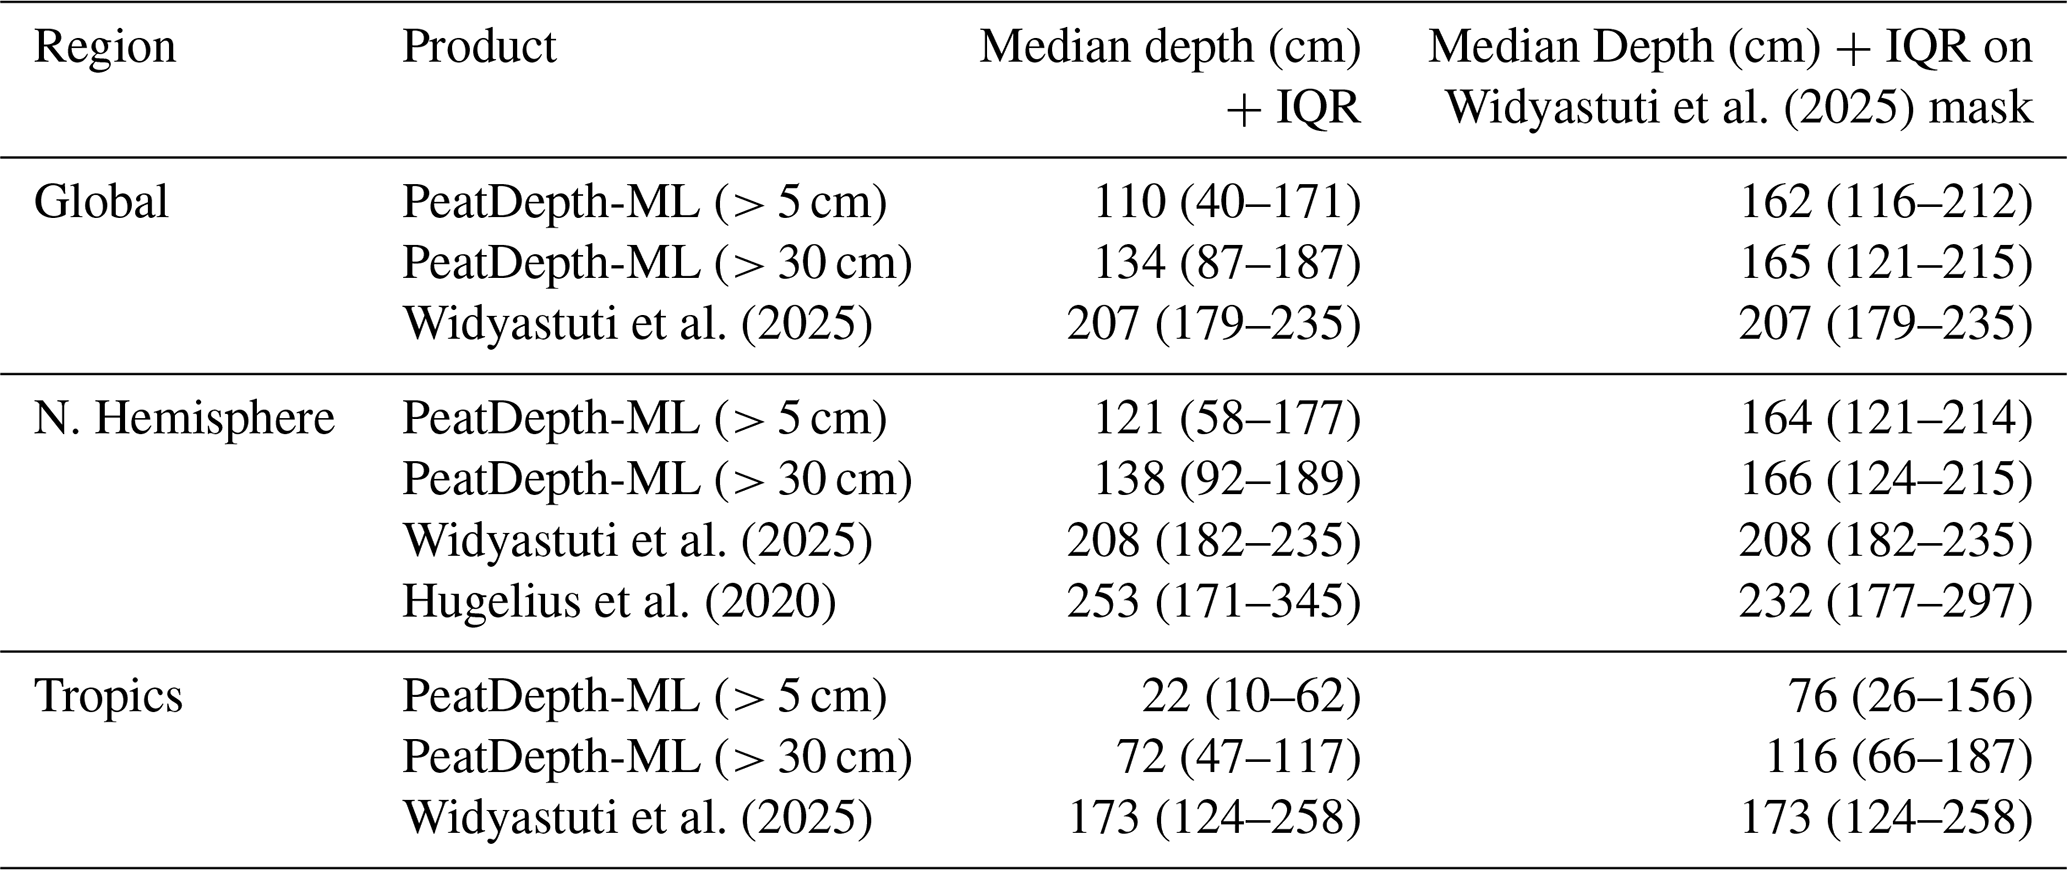
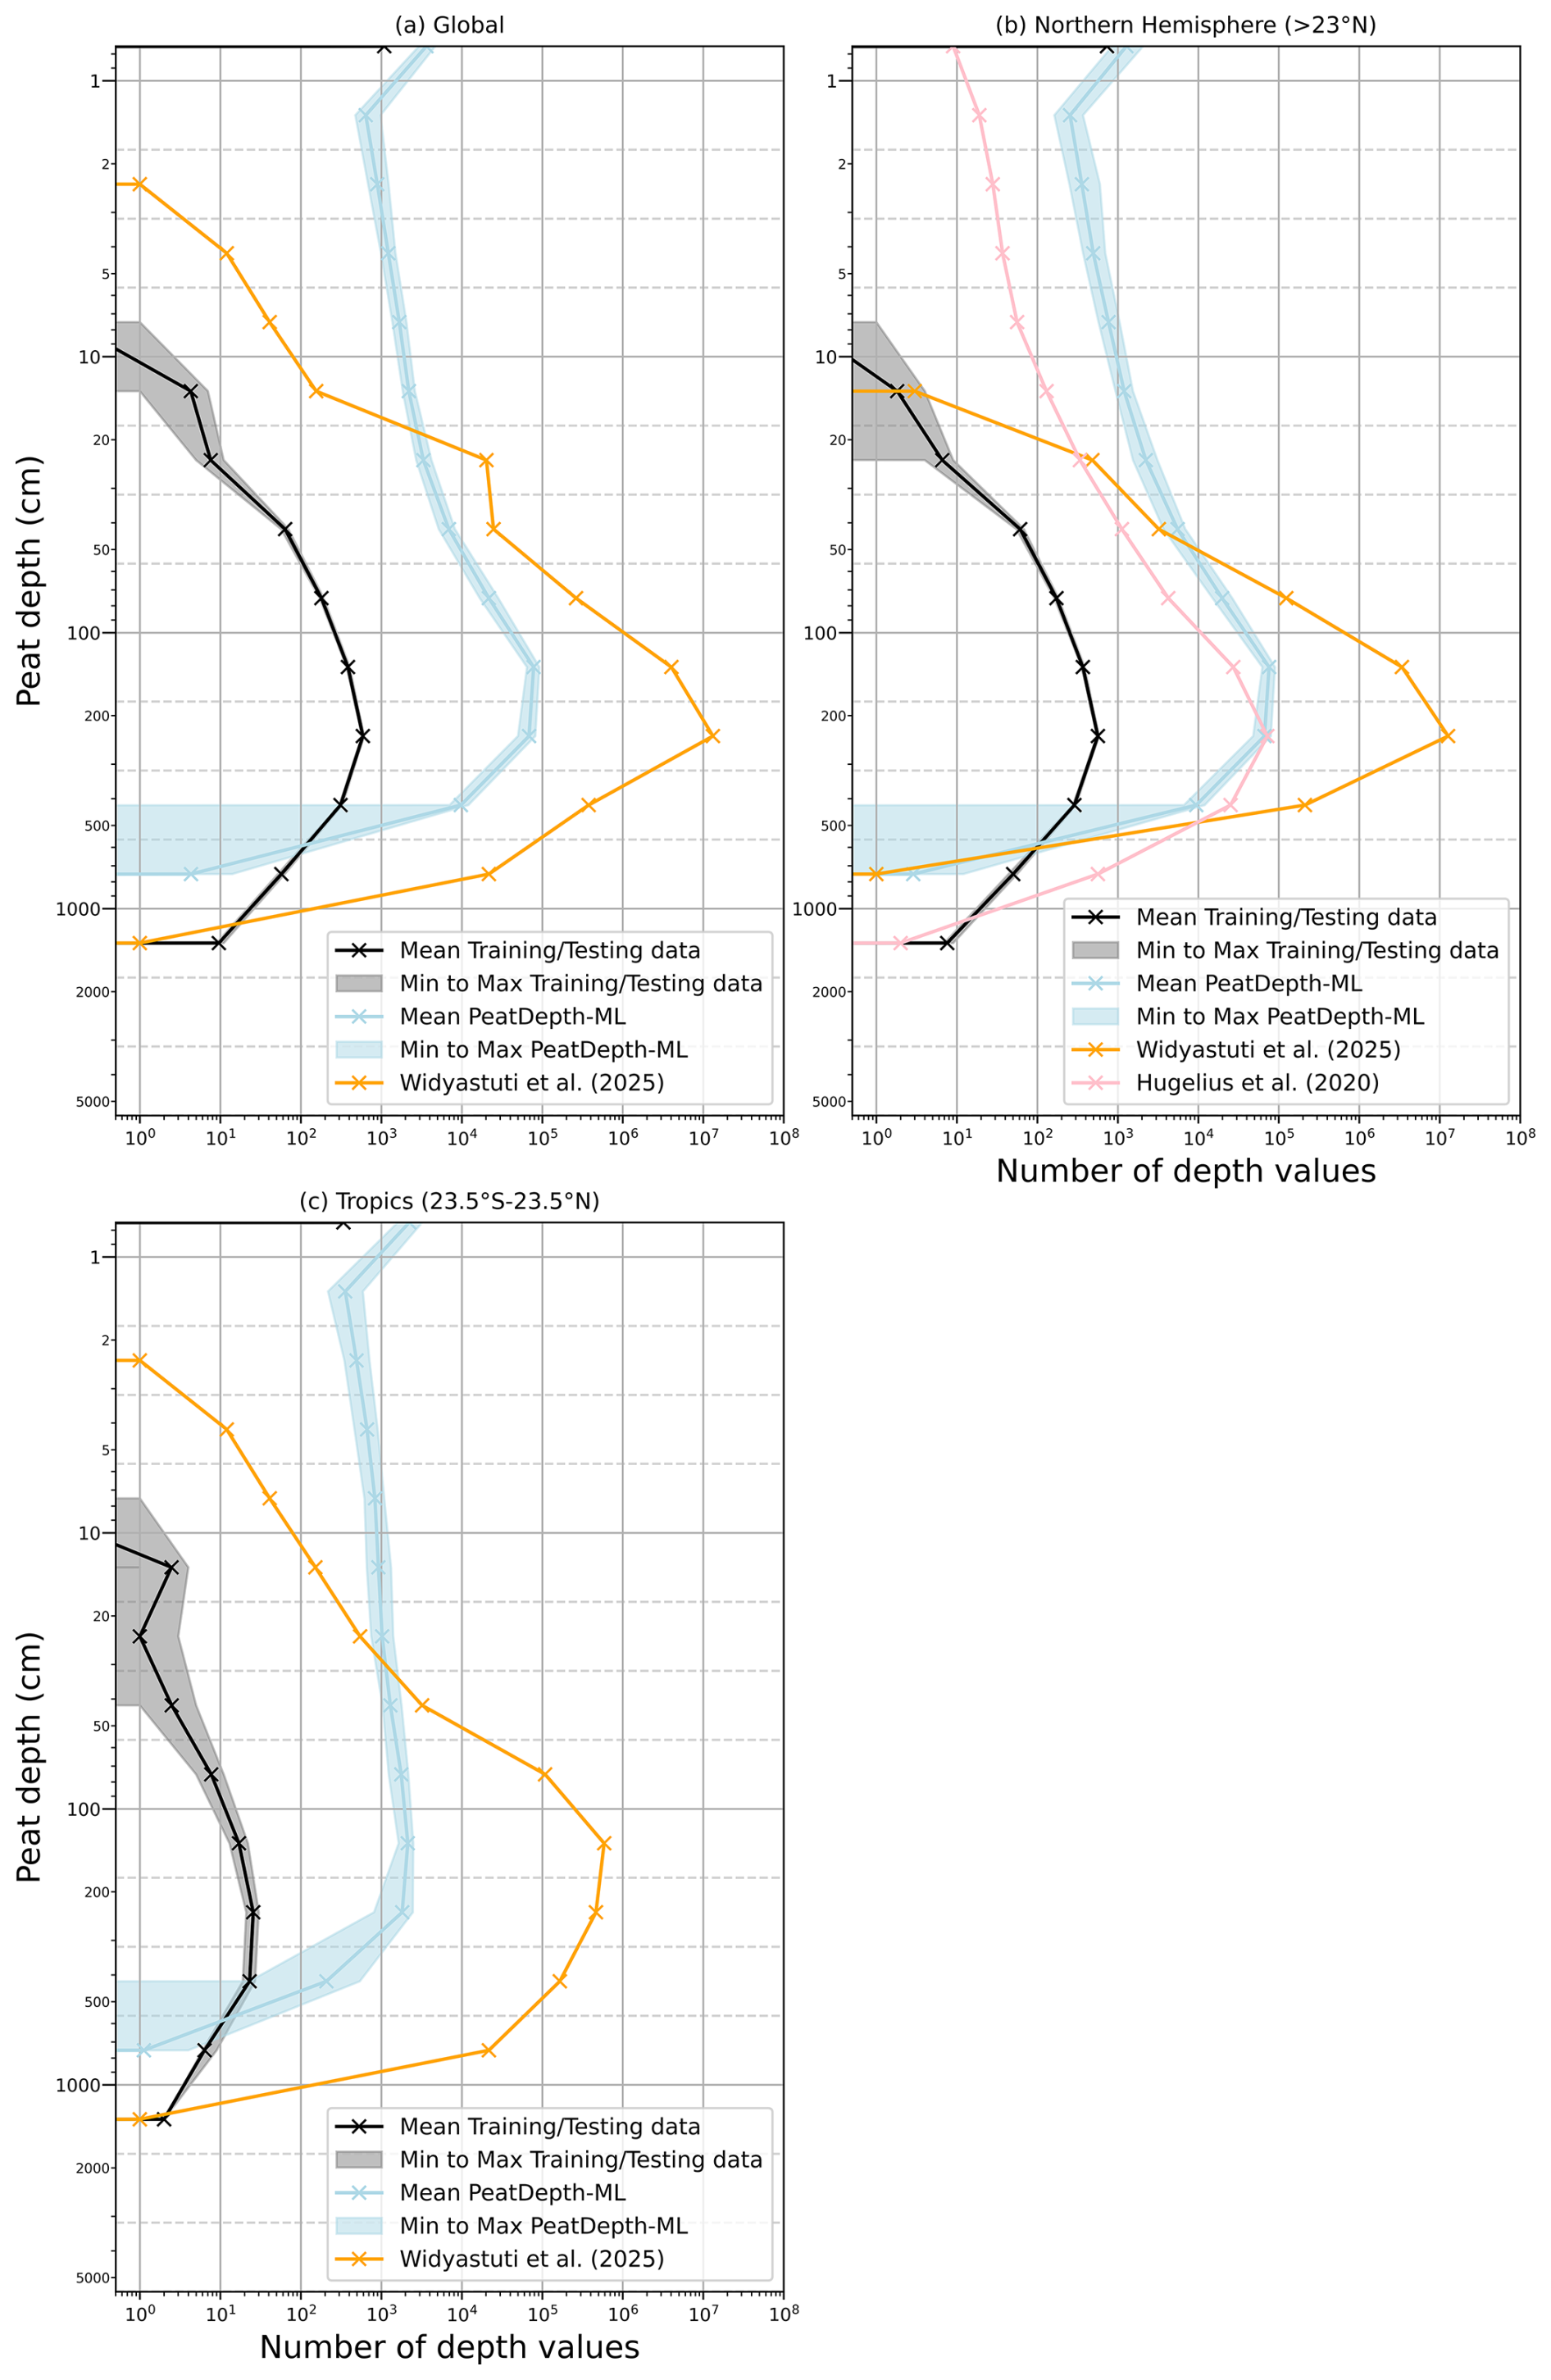
Figure 9Histograms showing peat depth distributions of PeatDepth-ML training and testing data and model outputs, Hugelius et al. (2020), and Widyastuti et al. (2025) across regions: (a) global, (b) northern latitudes (> 23° N), and (c) tropics (23.5° S–23.5° N). For PeatDepth-ML bootstrap datasets, the mean distribution appears as a solid dark line with minimum-maximum range shown as a lighter band. Products were harmonized as described in the main text. All axes use logarithmic scales, which can inflate the prominence of smaller values.
Figure 9 shows depth value distributions across products. Since the products treat non-peat regions differently, depths > 30 cm are most comparable (30 cm commonly delineates peatland classification; Loisel et al., 2017). Additionally, the general shapes and peaks of the histogram curves are likely most comparable given the products' different spatial resolutions and peatland area delineations. All three products exhibit similar relative depth distributions with peaks around 250 cm. PeatDepth-ML and Hugelius et al. (2020) show strong agreement, though Hugelius et al. (2020) extends to greater maximum depths. Widyastuti et al. (2025) again predicts deeper tropical depths than PeatDepth-ML, with more data points within the harmonised area due to its higher spatial resolution.
Greater training data availability may explain why Widyastuti et al. (2025) achieves significantly deeper mean tropical depths than PeatDepth-ML. Widyastuti et al. (2025) incorporates more non-zero peat depth training data for tropical regions, particularly Indonesia, partly by including pseudo-observations – grid cells randomly sampled from existing peat depth maps, such as the Indonesian national peat depth category map (Anda et al., 2021), using category midpoints as depth values. However, this approach introduces uncertainty by treating spatially extrapolated peat depths as equivalent to discrete soil cores. In fairness, we similarly add pseudo-observations, however the influence is found to be minimal as they are introduced into peat-free regions and since our bootstrapping results demonstrate that depth values assigned to training points can strongly influence model behaviour, we did not incorporate pseudo-observations in regions with potential peat soils.
While direct comparisons are limited by methodological differences (e.g., Widyastuti et al., 2025 used regional models; Hugelius et al., 2020 covers only high latitudes), PeatDepth-ML's relatively shallow predictions in Table 2 likely result from zero-inflated training data and ML algorithms' tendency to predict towards the means of training data (Zhang and Lu, 2012; Song, 2015). Hugelius et al. (2020) observed this behaviour in their RF model, and Xu et al. (2016) reported similar results with both RF and Maximum Entropy models when predicting mean vegetation canopy height. The empirical cumulative distribution in Fig. 10 confirms PeatDepth-ML follows this pattern. Over 90 % of training and testing data show zero depth, while approximately 75 % of PeatDepth-ML bootstrap predictions are at, or near zero, over the same grid cells. The observation and prediction distributions intersect around 150 cm, with PeatDepth-ML approaching 100 % distribution by 400 cm depth, whereas training data extend deeper without reaching 100 % as quickly. Consequently, PeatDepth-ML poorly predicts extreme values. For combined zero and non-zero depth data, PeatDepth-ML closely matches training data means; however, when considering only non-zero depths, PeatDepth-ML predicts shallower values overall (Fig. 10).
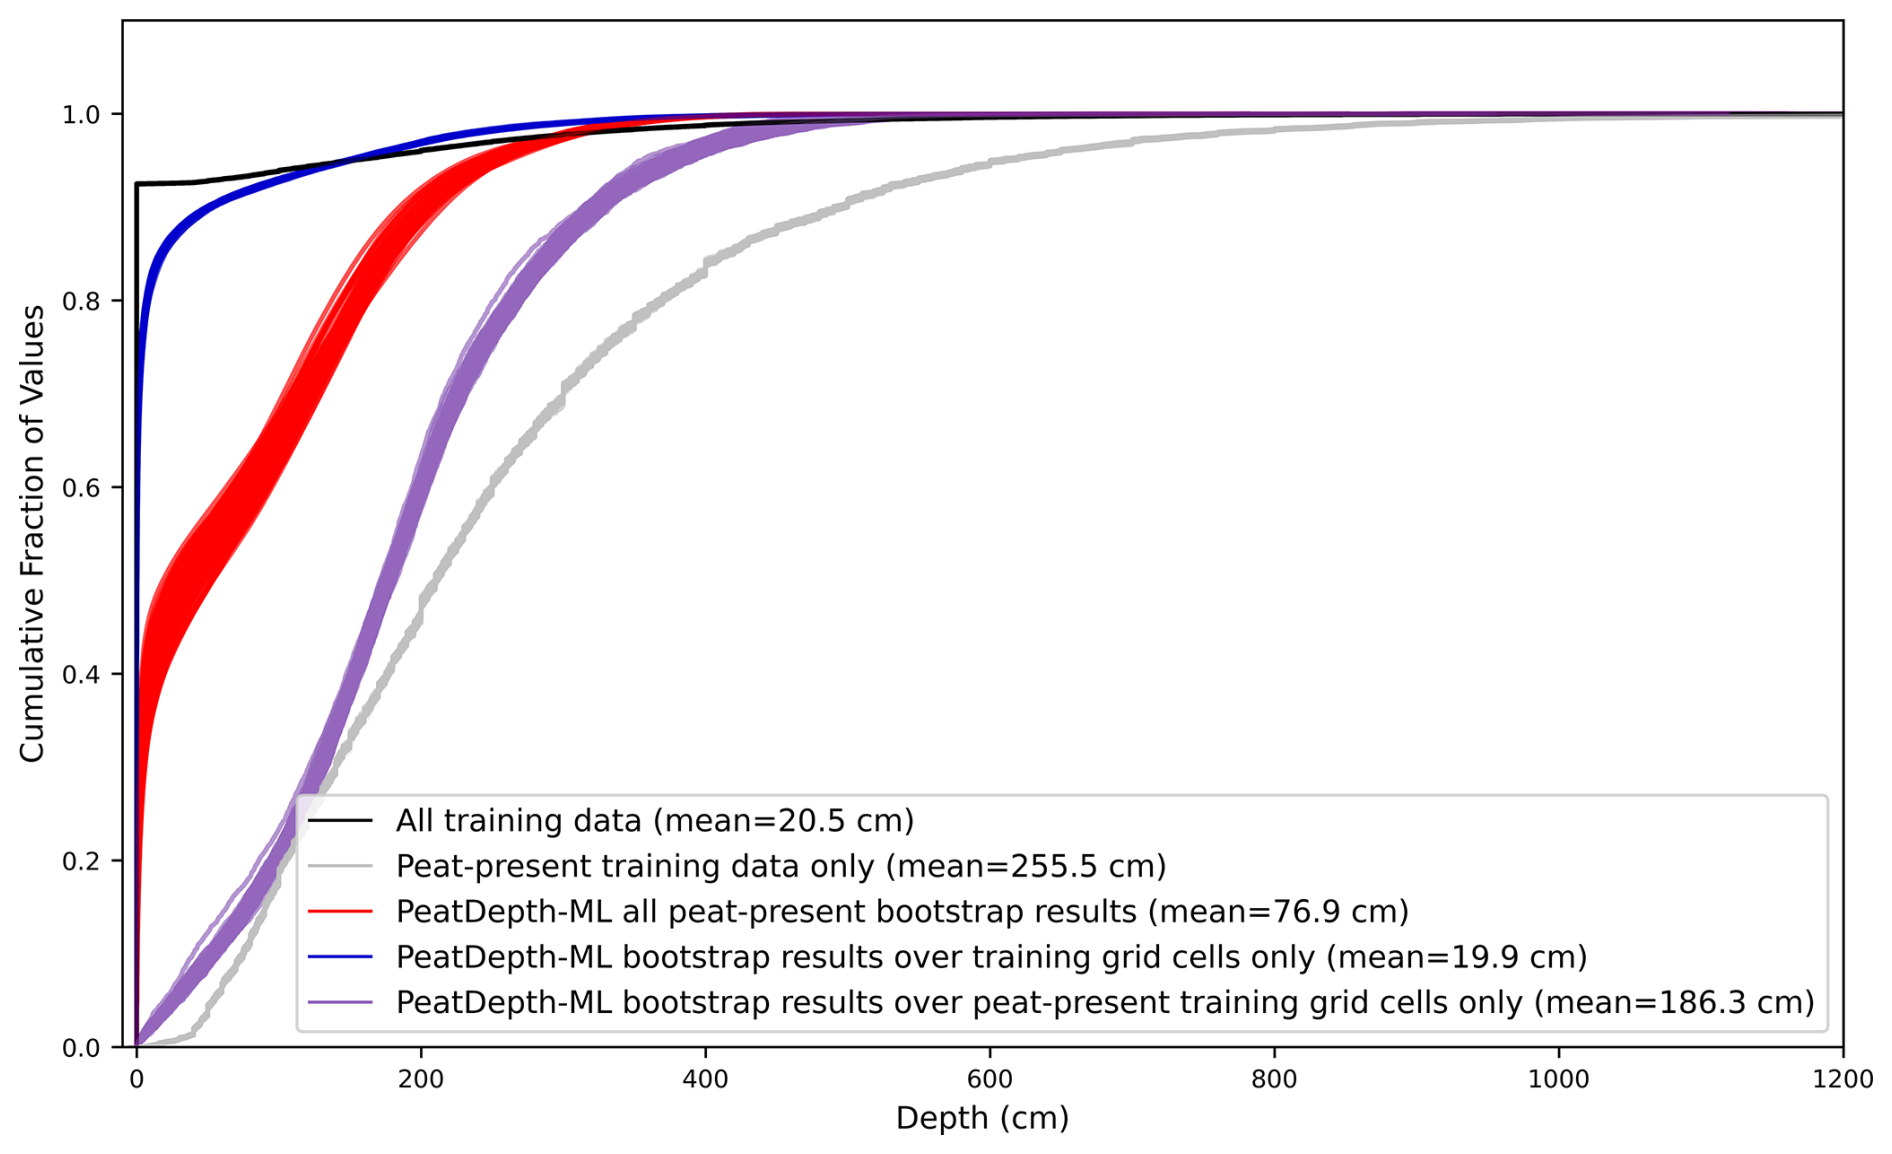
Figure 10Empirical cumulative distribution (ECD) of PeatDepth-ML results and training/testing data for all training data (black line), peat present (non-zero) training and testing data only (grey line), PeatDepth-ML bootstrap outputs over grid cells with peat present (red lines), PeatDepth-ML bootstrap outputs over grid cells with training data (blue lines), and PeatDepth-ML bootstrap outputs over grid cells with peat-present training/testing data only (purple lines). Dataset mean values are listed in the legend.
3.3 Model Performance Estimation
Beyond the previous qualitative assessments, we conducted quantitative evaluation of PeatDepth-ML performance using multiple metrics. We began with grid cell comparisons between model-predicted depth values and observations at these locations, calculating root mean square error (RMSE), mean bias error (MBE), and a version of the normalized mean error (NME) developed by Kelley et al. (2013) (see Table A2). RMSE and MBE are commonly used metrics for assessing ML models (Plevris et al., 2022), with both Widyastuti et al. (2025) and Hugelius et al. (2020) employing RMSE, and Peat-ML calculating both RMSE and MBE. Although Peat-ML and Widyastuti et al. (2025) use the Coefficient of Determination (R2), we excluded it due to its ambiguous representation of non-linear model performance (Plevris et al., 2022). We adopted Kelley et al. (2013)'s NME to enable comparison against two null models: the observed mean null model and the observed random resampling null model (Table A2; Figs. 12d and 13).
We calculated these metrics over selected areas for each bootstrap model run using cross-validation results. Figure 11 shows the regions selected for focussed assessment. We sought equal representation of high-latitude and tropical areas, choosing regions with high peatland fractional coverage according to Peat-ML (Melton et al., 2022) and substantial observed peat-present grid cells (Fig. 3). Each bootstrap model run output is compared to the bootstrapped observed data used in training and testing that model instance. Calculating metrics for each bootstrap run demonstrates variation in model behaviour arising from sampling uncertainty in observed peat depth data. However, this same uncertainty limits the accuracy achievable in our performance assessment. For more realistic representation of model ability, metric calculations use model results produced through BLOOCV (Sect. 2.3 and Fig. 4). The BLOOCV results represent PeatDepth-ML's predictions without the advantage of learning from observed peat data in the current area.
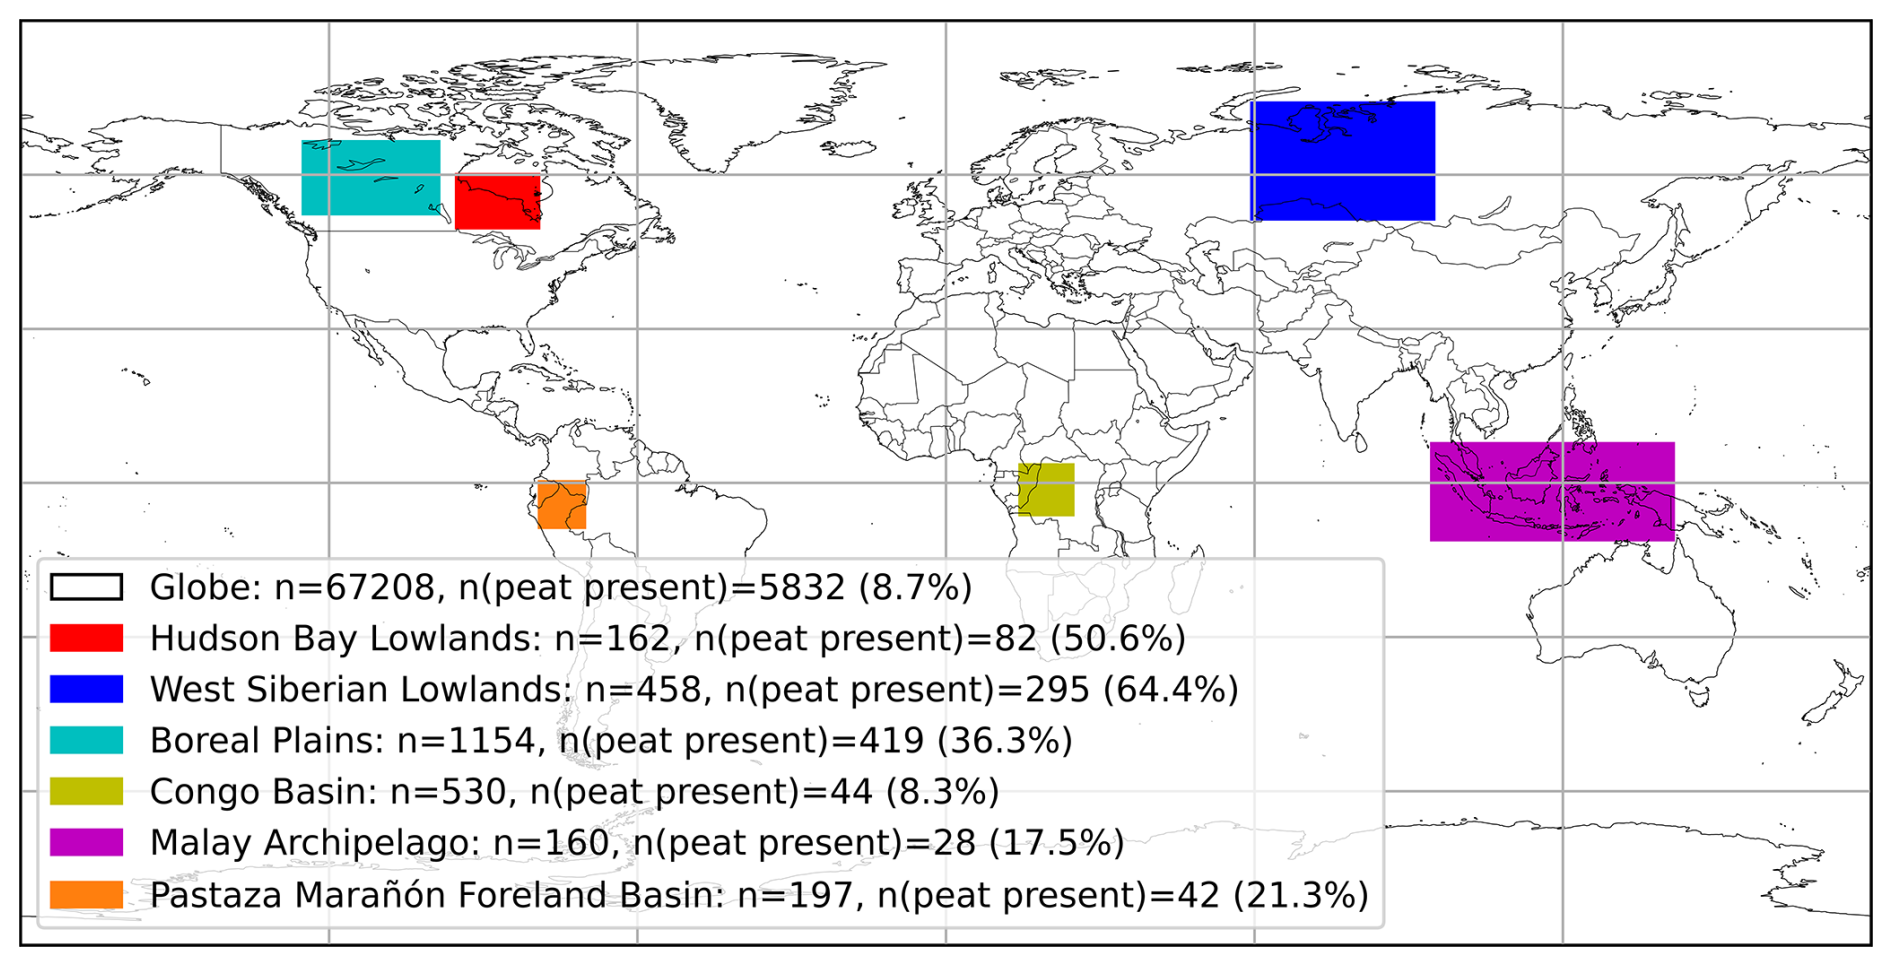
Figure 11Geographical distribution of selected regions for PeatDepth-ML performance assessment. Legend numbers indicate observed grid cells within each area, grid cells with peat present, and the proportion of peat-present to total grid cells.
Figure 12 shows mean depth and performance metrics for PeatDepth-ML bootstrap runs. Throughout panels (a)–(c), bootstrap variance in selected regions remains broadly consistent with fluctuations of roughly 10–25 cm. The Congo Basin demonstrates the best performance among selected peatland regions (Fig. 12b). We hypothesize this reflects the Congo Basin's ratio between peat-present and peat-absent training data mirroring the global ratio (see Fig. 11); therefore, globally learned patterns may be more applicable in this region. Conversely, the Malay Archipelago shows the worst RMSE performance (Fig. 12b) and most severe depth under-prediction overall (Fig. 12c). We attribute this poor performance to insufficient training data in the Malay Archipelago (Fig. 11 shows the lowest number of training points among all selected regions, despite its size). Additionally, any performance assessment is likely inadequate in the parts of this region where PeatDepth-ML is found to be generally not applicable according to AOA (Fig. 7).
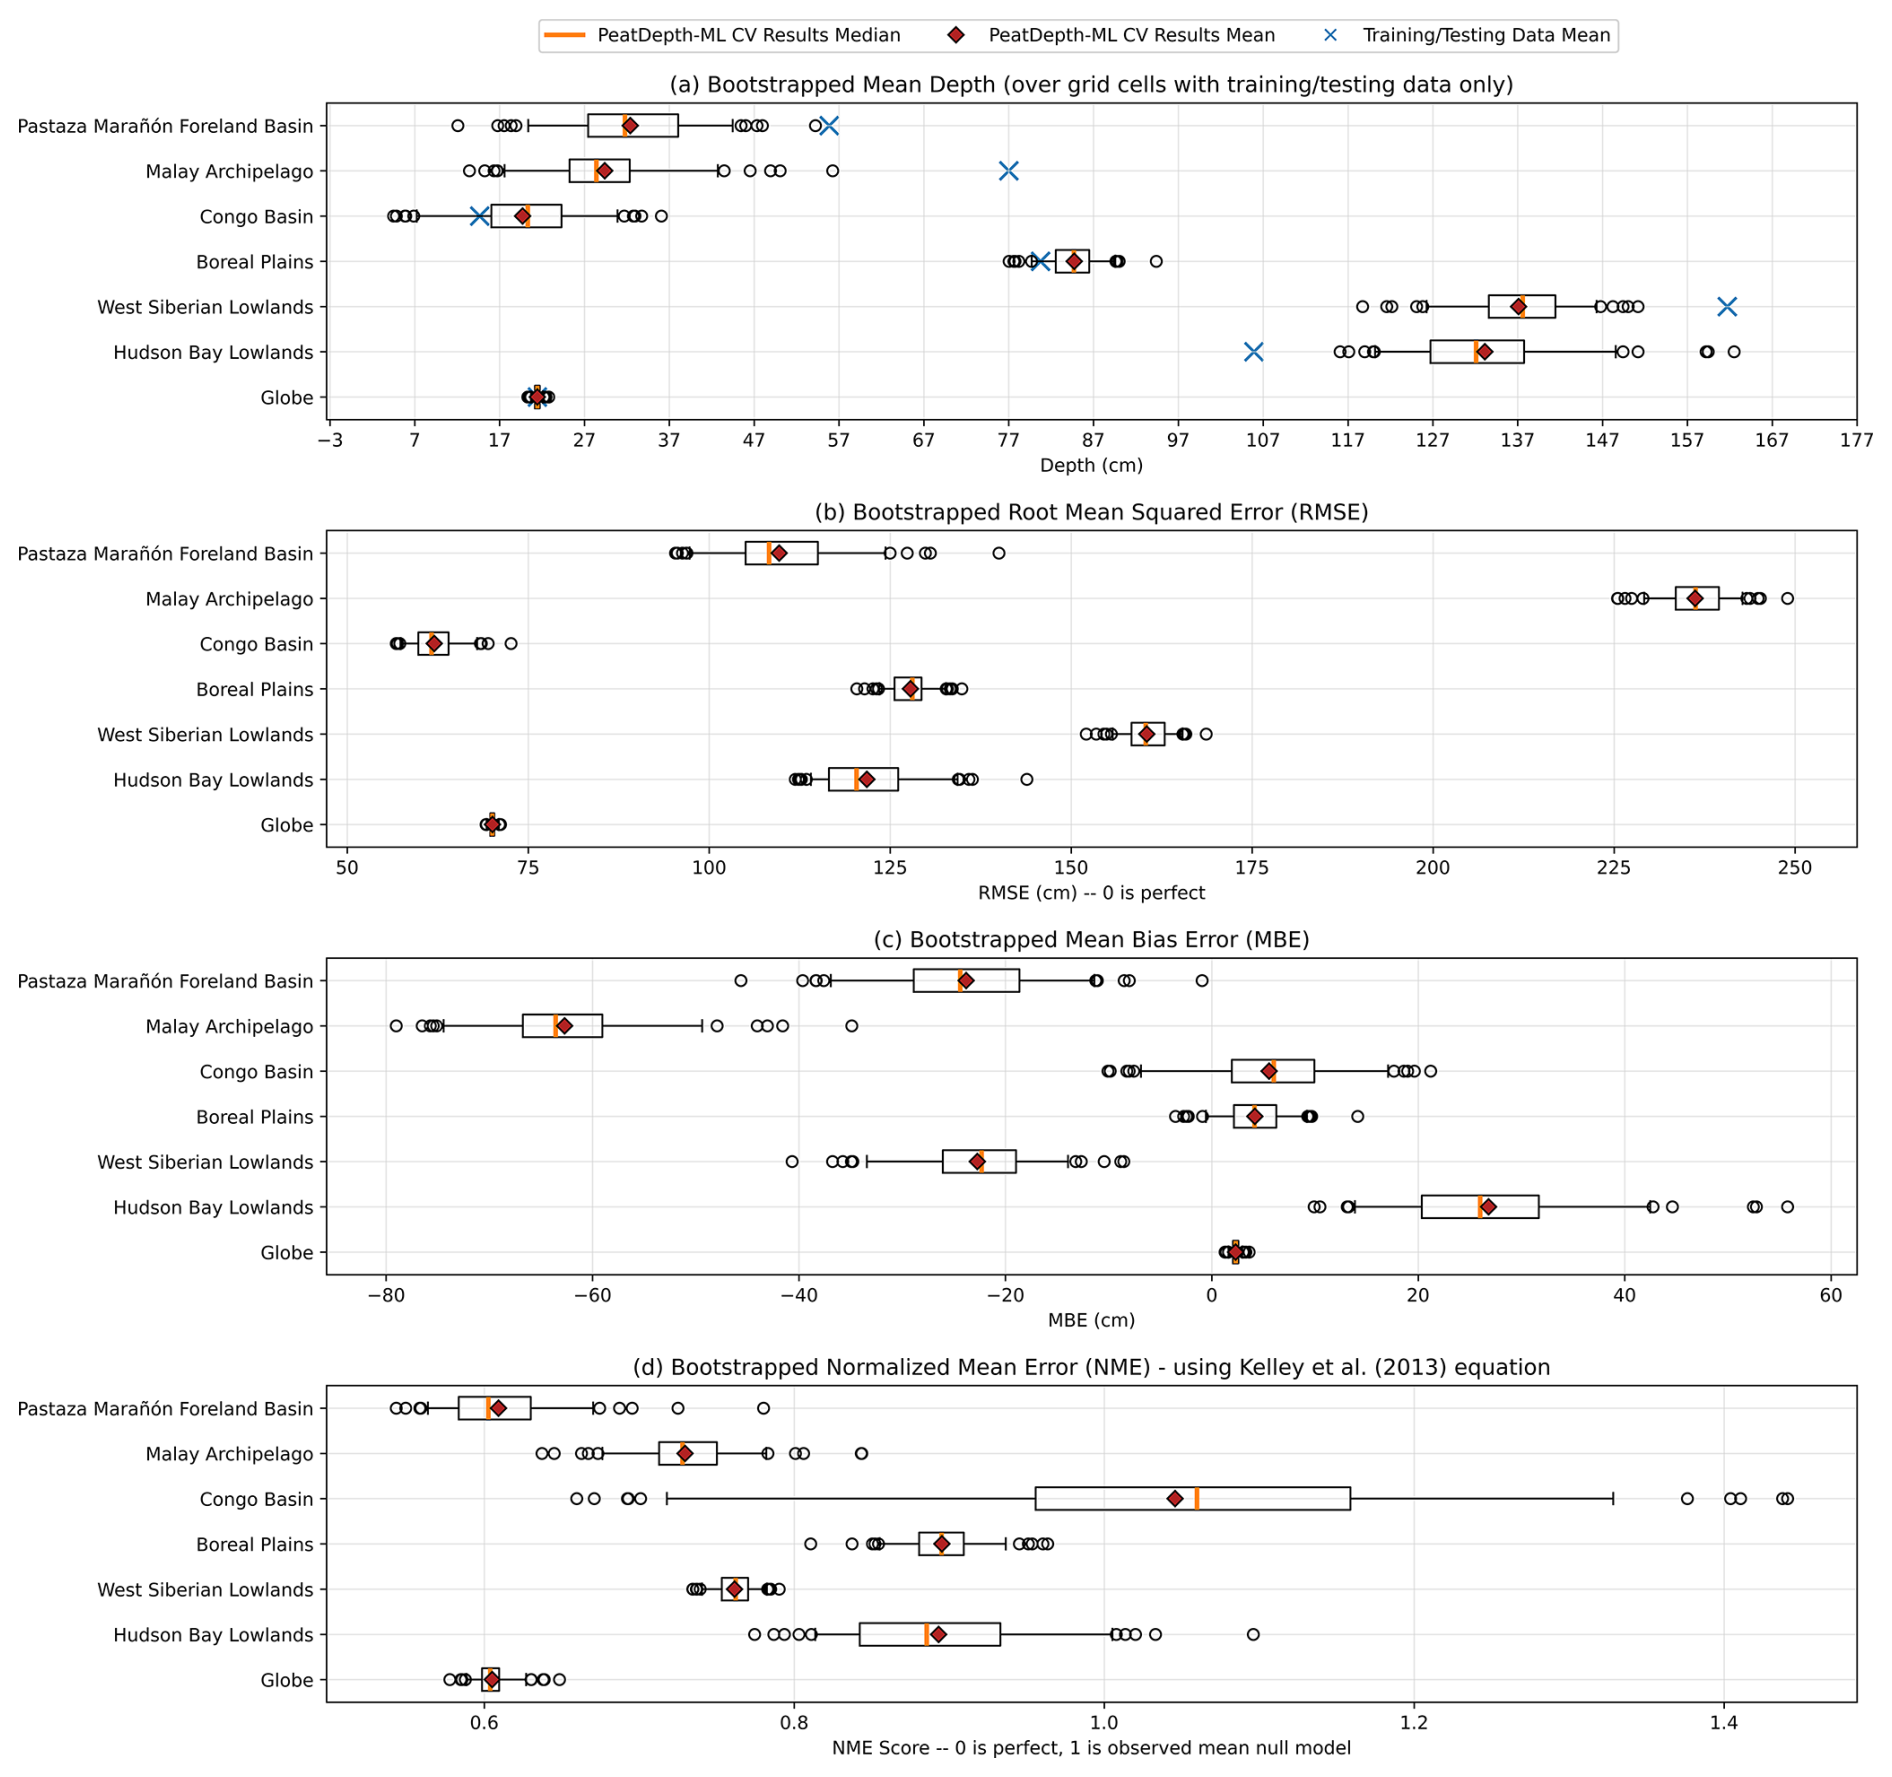
Figure 12Box and whisker plots of PeatDepth-ML performance metrics across bootstrap runs for selected regions (see Figure 11). Variation across bootstrap runs for (a) mean depth (blue x's indicate bootstrapped observed dataset means), (b) RMSE, (c) MBE, and (d) Kelley et al. (2013) NME. Whiskers extend to 5th and 95th percentiles; outliers shown as empty circles; orange lines are the PeatDepth-ML BLOOCV median values while diamonds are the mean.
The NME results differ markedly from other metrics (Fig. 12d). Generally, NME ranges between 0.6 and 1.0 for most peatland regions and globally. However, regional variation is less consistent, with the Congo Basin showing particularly wide-ranging NME scores across bootstrap runs. Since the NME denominator is observational variance (Table A2), our bootstrapping method can produce more variable values. Additionally, in a grid cell when there are more observed data points with zero peat depth, the NME denominator also approaches zero; leading NME to approach infinity. The Congo Basin contains several grid cells with exceptionally high peat depth measurement densities, allowing bootstrapped mean observed depths to vary more substantially. Moreover, the Congo Basin has the lowest non-zero depth ratio among selected peatland regions (Fig. 11). Together, these factors create high observational variance in the Congo Basin, with similarly high variance in NME.
Following Kelley et al. (2013), we compared PeatDepth-ML's NME against observed random resampling null models (Table A2). These random null models were generated by bootstrapping our 67 208 observed grid cells 1000 times, creating datasets with random selections while maintaining the same total number of grid cells. We used the non-bootstrapped observed data version (Fig. 3). NME was calculated for each random null model and plotted in Fig. 13a. Figure 13b compares random null model results to global PeatDepth-ML bootstrap results, assessing whether PeatDepth-ML outperforms random resampling. Overall, PeatDepth-ML performs better than both the observed mean null model and random null model. However, Fig. 12d shows that training data uncertainty can produce extreme cases performing worse than both null models (e.g., outlier bootstraps in the Congo).
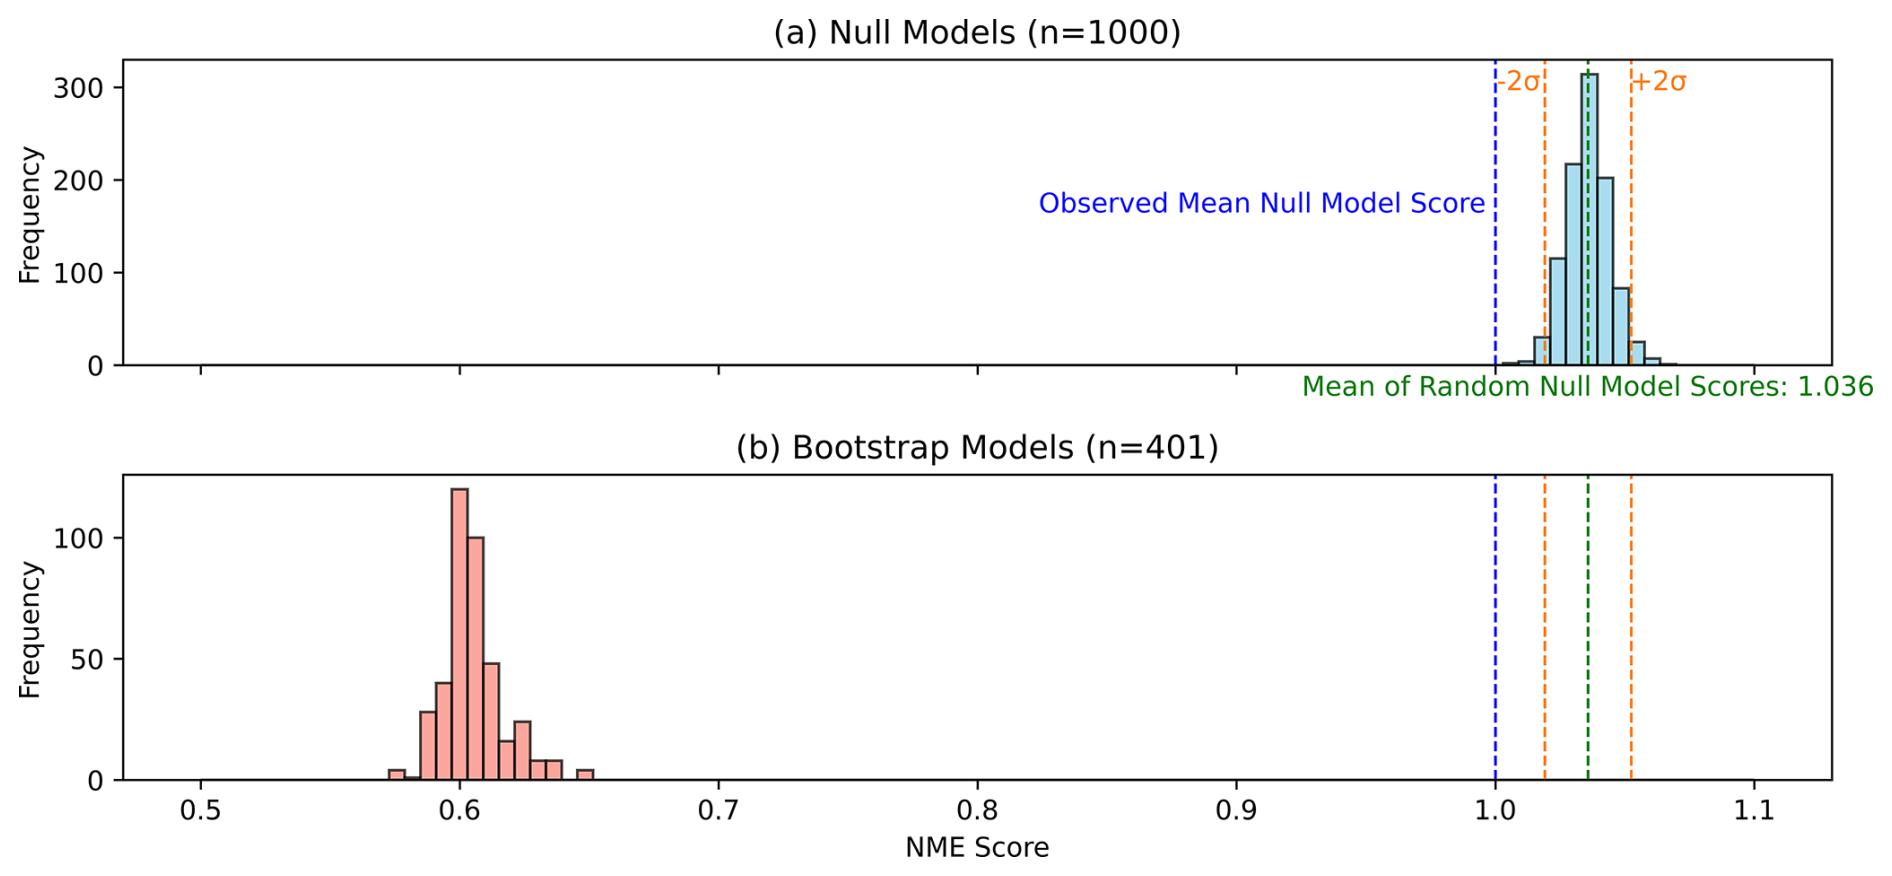
Figure 13Histograms of model NME score distributions (Table A2 explains NME and null models). (a) Distribution of NME scores for 1000 observed random resampling null models. (b) Distribution of NME scores for 401 PeatDepth-ML bootstrap model runs. Blue line: NME of the observed mean null model; green line: mean NME score of random null models; orange lines: two standard deviations from this mean.
PeatDepth-ML's RMSE can be compared to Hugelius et al. (2020) and Widyastuti et al. (2025), acknowledging key methodological differences. Hugelius et al. (2020) used 10-fold cross-validation with balanced random sampling (Kuhn, 2008), while Widyastuti et al. (2025) randomly sampled 30 % of data for testing. As discussed in Sect. 2.3, random cross-validation can produce overly optimistic performance estimates (Meyer and Pebesma, 2022). Our spatial autocorrelation accounting in cross-validation block selection provides more conservative performance estimates (Milà et al., 2022), potentially yielding comparatively lower metrics. Additionally, Hugelius et al. (2020) models only northern latitudes, while Widyastuti et al. (2025) combines six regional models (see their Fig. 1, but boundaries are not explicitly defined in the text), complicating direct comparisons. Resolution differences further limit precise comparison.
Before bias correction, Hugelius et al. (2020) reported a RMSE of 142 cm (no after-bias correction RMSE was supplied). PeatDepth-ML achieves mean RMSE of 88 ± 1 cm for ≥ 23° N. Table 3 in Widyastuti et al. (2025) reports regional RMSEs of 163 cm (North America), 92 cm (Europe and Russia), 55 cm (Latin America), 91 cm (Africa), 215 cm (South and Southeast Asia), and 100 cm (Australia and New Zealand), which we calculate to give an average of 104 cm globally (weighted by the amount of testing data per region). PeatDepth-ML achieves global mean RMSE of 70 ± 1 cm. In the Malay Archipelago – comparable to the South and Southeast Asia domain in Widyastuti et al. (2025) – PeatDepth-ML shows mean RMSE of 236 ± 7 cm, likely due to training data scarcity as suggested by AOA analysis. The highest RMSE in Widyastuti et al. (2025) also occurs in this region despite greater data availability through the use of pseudo-observations derived peat depth maps, suggesting region-specific modelling challenges.
PeatDepth-ML was developed at the global scale to avoid complications from regional approaches. The multi-domain methodology used in Widyastuti et al. (2025) requires harmonizing outputs at boundaries, with uncertain effects on AOA. Regional divisions can create disparities in peat observations, affecting model quality (Somarathna et al., 2017; Meyer and Pebesma, 2021) and requiring region-specific spatial autocorrelation distances and non-peat data tuning. Preliminary multi-model tests during PeatDepth-ML development showed extreme behaviour (e.g., single-predictor selection) in certain regions, likely from increased zero-inflation in regional datasets. Furthermore, our bootstrapping reveals significant observational uncertainty influence on the model (Fig. 12), which may intensify at smaller regional scales and vary by region.
3.4 Estimation of Peatland Carbon Stocks Using PeatDepth-ML Results
PeatDepth-ML requires a peatland fractional extent map to produce an estimate of peatland carbon stocks as the model estimates the mean peat depth only over the peatland area within each grid cell. We have chosen Peat-ML to provide peatland fractional extent as our “best” estimate (see Sect. 2.5), and will be the focus of further discussion, but any other peatland fractional extent map could be used and we provide an estimate based upon the GPM as an alternative. PeatDepth-ML estimates global peatland carbon stocks between 327 and 373 Pg C, with 7 %–10 % located in tropical peatlands (Fig. 14). This tropical proportion is lower than Page et al. (2011), who estimate 15 %–19 % of global peatland carbon in the tropics. Figure 14 shows that PeatDepth-ML generally estimates peatland carbon stocks within the lower part of the range provided by other products (Page et al., 2011; Widyastuti et al., 2025; Hugelius et al., 2020; Immirzi et al., 1992; Yu et al., 2010; Gumbricht et al., 2017; Joosten, 2009; Köchy et al., 2015; Maltby and Immirzi, 1993). Widyastuti et al. (2025) reports particularly elevated estimates, with a global value of 942 Pg C, attributed to extensive peat coverage in the Global Peat Map (6.57 million km2) compared to Peat-ML's 4.04 million km2. For the tropics, Gumbricht et al. (2017) also has a high estimate, over three-fold the next higher estimates (but includes the subtropics as well). However, compared to the more moderate estimates in Fig. 14, PeatDepth-ML's “best” estimates are commonly on the lower end of the range especially when considering only the tropical peatlands. A potential shallow bias in PeatDepth-ML may contribute to these lower carbon stock estimates, however the larger influence is the selection of Peat-ML to derive our “best” estimate, which has a smaller peatland area estimate than GPM as used by Widyastuti et al. (2025) and results in an estimate of peatland C stocks less than half those derived via GPM (Fig. 14). The strong influence of peatland fractional cover maps in the calculation of peatland carbon stocks reflects not only differences in total peatland extent (e.g. the large differences between Peat-ML and GPM as mentioned above) but also differing fractional extents in areas of shallow versus deep peat (even if total extents were the same) will have large impacts on total peatland C estimates.
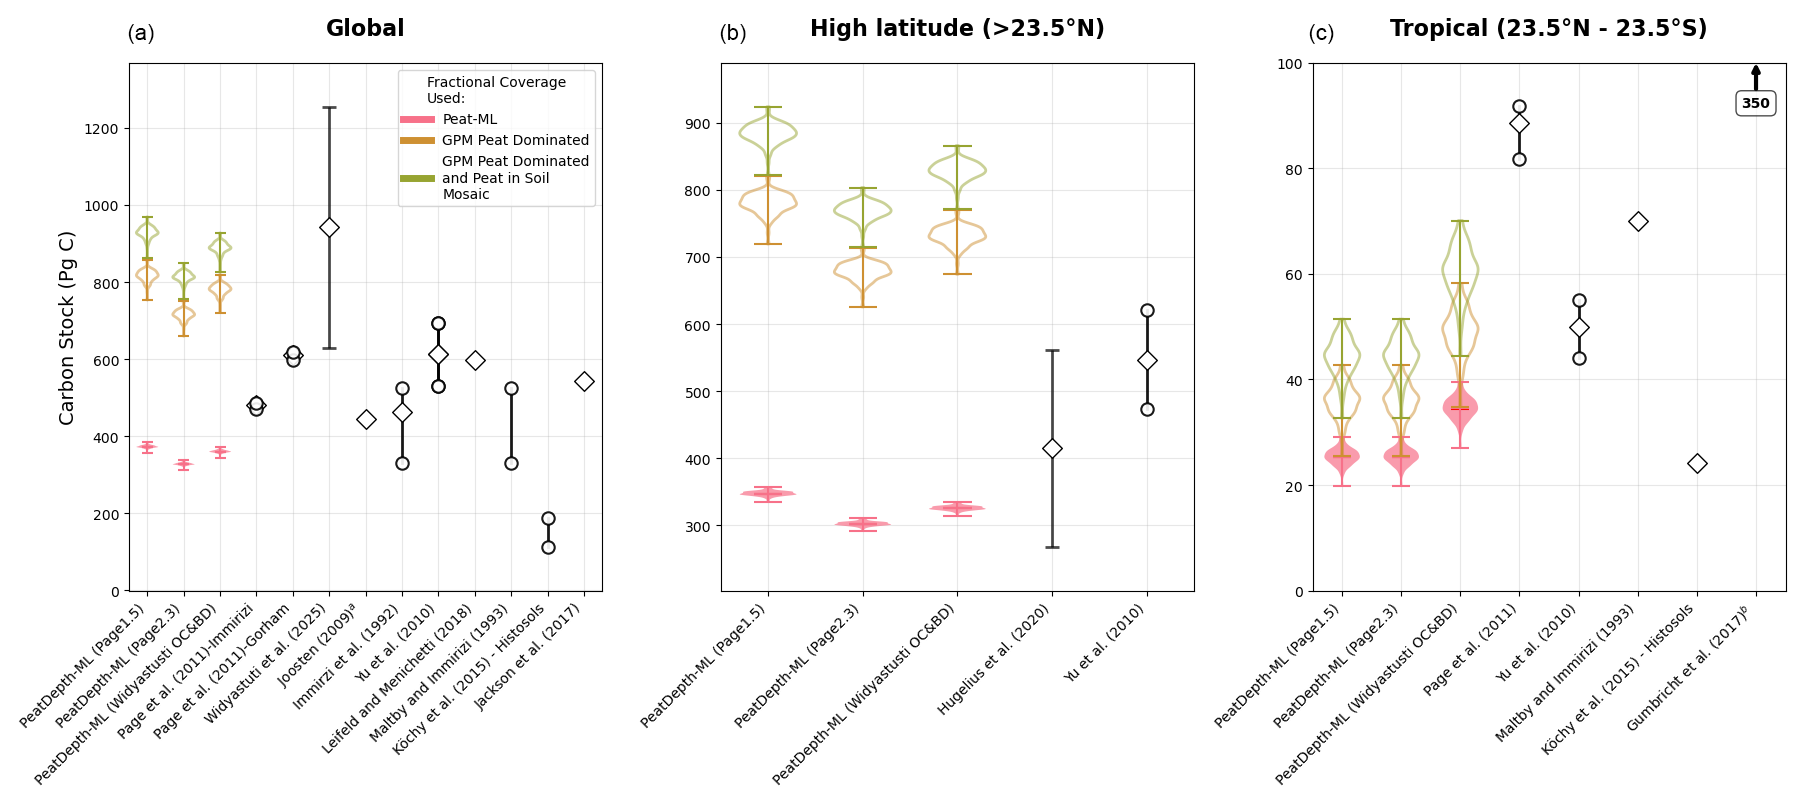
Figure 14Carbon stock estimates for (a) global, (b) high latitudes, and (c) tropical peatlands provided using PeatDepth-ML predicted peat depths, two different peatland fractional extent maps, along with literature estimates. The PeatDepth-ML estimates use predicted peat depth measurements along with different assumed organic carbon contents and bulk density thereby allowing an estimate of the total peatland carbon stocks (see Sect. 2.5). The peatland fractional cover maps include Peat-ML (Melton et al., 2022), which we term our “best” estimate and two variants of the Global Peatland Map (Greifswald Mire Center, unpublished dataset): “peat dominated” and “peat dominated + peat in soil mosaic”. The estimate from Gumbricht et al. (2017) is over a larger region than the other tropical estimates (38° N–56° S, 161° E–117° W). The value for Joosten (2009) is from Minasny et al. (2019).
3.5 Model Limitations and Future Work
As recognized by Melton et al. (2022) and mentioned earlier, we cannot readily draw conclusions about potential peat-forming conditions from the predictors selected by a ML model, as it is challenging to distinguish between cause and effect in these selections. Our examination of PeatDepth-ML's sensitivity to uncertainty in the training data revealed that predictor selection can be highly variable, rendering assumptions about their relationship to peat development potentially even more ambiguous.
PeatDepth-ML, like all data-driven models, is limited by the availability of peat depth observations for training. Both Widyastuti et al. (2025) and Melton et al. (2022) demonstrated that the accuracy of their products is affected by training data availability, with each dataset biased towards high latitudes. This bias is also present in PeatDepth-ML and is evident in our poorer performance in the Malay Archipelago (Fig. 12 and possible underprediction of peat depth at low latitudes (Fig. 12).
We focused on predicting peat depth using the LightGBM algorithm based on the Peat-ML Framework (Fig. 4); however, other algorithms may offer better performance. Hugelius et al. (2020) and Widyastuti et al. (2025) demonstrated that RF models can also predict peat depth. Both RF and LightGBM are ensemble models built from decision trees, which effectively handle missing data but are less suited to tasks with small sample sizes (Haixiang et al., 2017). Therefore, other algorithms, such as neural networks, may achieve higher accuracy with highly imbalanced datasets like ours (Haixiang et al., 2017; Chen et al., 2024). Alternatively, a first binary classification step of peatland versus non-peatland regions before predicting depth could improve results (Rožanec et al., 2025). Alternative custom scoring methods could be tested, such as weighting based on the imbalance ratio between zero and non-zero depths (Haixiang et al., 2017). Bias correction offers another potential improvement through residual rotation (Hugelius et al., 2020) or empirical distribution matching (Goodling et al., 2024).
Several aspects warrant further investigation. Including more palaeoclimate predictors could improve model performance by better representing the extensive time scales over which many peatlands developed. Distribution-scale assessment using empirical cumulative distributions (Goodling et al., 2024) may yield additional insights into PeatDepth-ML's performance. More thorough testing of regional modelling approaches (Widyastuti et al., 2025) could examine how model sensitivity and AOA vary by region, though methods to account for extreme zero-inflation in some regional training datasets would likely be required first. Additionally, more detailed C stock estimations could be performed using depth-to-stock relationships derived from peat core data (Hugelius et al., 2020), and further tests on the influence of random sampling of desert data may reveal additional model sensitivities.
Lastly, our peatland carbon stock estimates are heavily influenced by the choice of the peatland fractional extent map as seen in Sect. 3.4. Future work could reduce the grid spatial resolution (e.g. 250 m) to make the use of a peatland fractional map unnecessary.
We developed PeatDepth-ML, a global peat depth model based on machine learning, and conducted a detailed quality and uncertainty assessment to address model sensitivity to potential sampling bias in observed peat depth data. PeatDepth-ML builds on the Peat-ML Framework, using many of the same climate, soil, vegetation, and terrain predictors, with additional predictors for hydrology and paleo-environmental conditions. To train PeatDepth-ML, a large peat depth measurement database (Peat-DBase) was used and was supplemented with mineral soil profile data to train the model over non-peatland regions. Multiple training datasets were created by bootstrapping data within grid cells to test PeatDepth-ML's sensitivity to uncertainty inherent in Peat-DBase. To reduce the impact of zero-inflation, a custom scoring method prioritizing performance on non-zero depth grid cells was implemented.
PeatDepth-ML was then run on the bootstrapped training datasets. Predictor selection proved highly sensitive to individual bootstraps due to changes in the training data between bootstraps. Performance metrics calculated from cross-validated bootstrap results showed that model accuracy also varied, particularly at regional scales. Overall, PeatDepth-ML estimated a global mean peatlands (> 30 cm peat) depth of 134 cm (IQR: 87–187) achieved a root mean square error of 70.1 ± 0.9 cm, mean bias error of 2.1 ± 0.7 cm, and normalized mean error of 0.6 ± 0.0 (non-standard equation; see Sect. 2.4). Where possible, PeatDepth-ML was compared to other peat depth maps and achieved similar or improved results. Estimated global peatland carbon stocks were strongly dependent upon the peatland fractional cover map used. Our “best” estimate was between 327 and 373 Pg C, which was within the range of previous estimates. Tropical peatland carbon stocks was lower than some recent estimates. PeatDepth-ML would likely improve with additional peat depth measurements for training, particularly in the tropics, and bias correction methods may help resolve the model's tendency towards the training data mean.
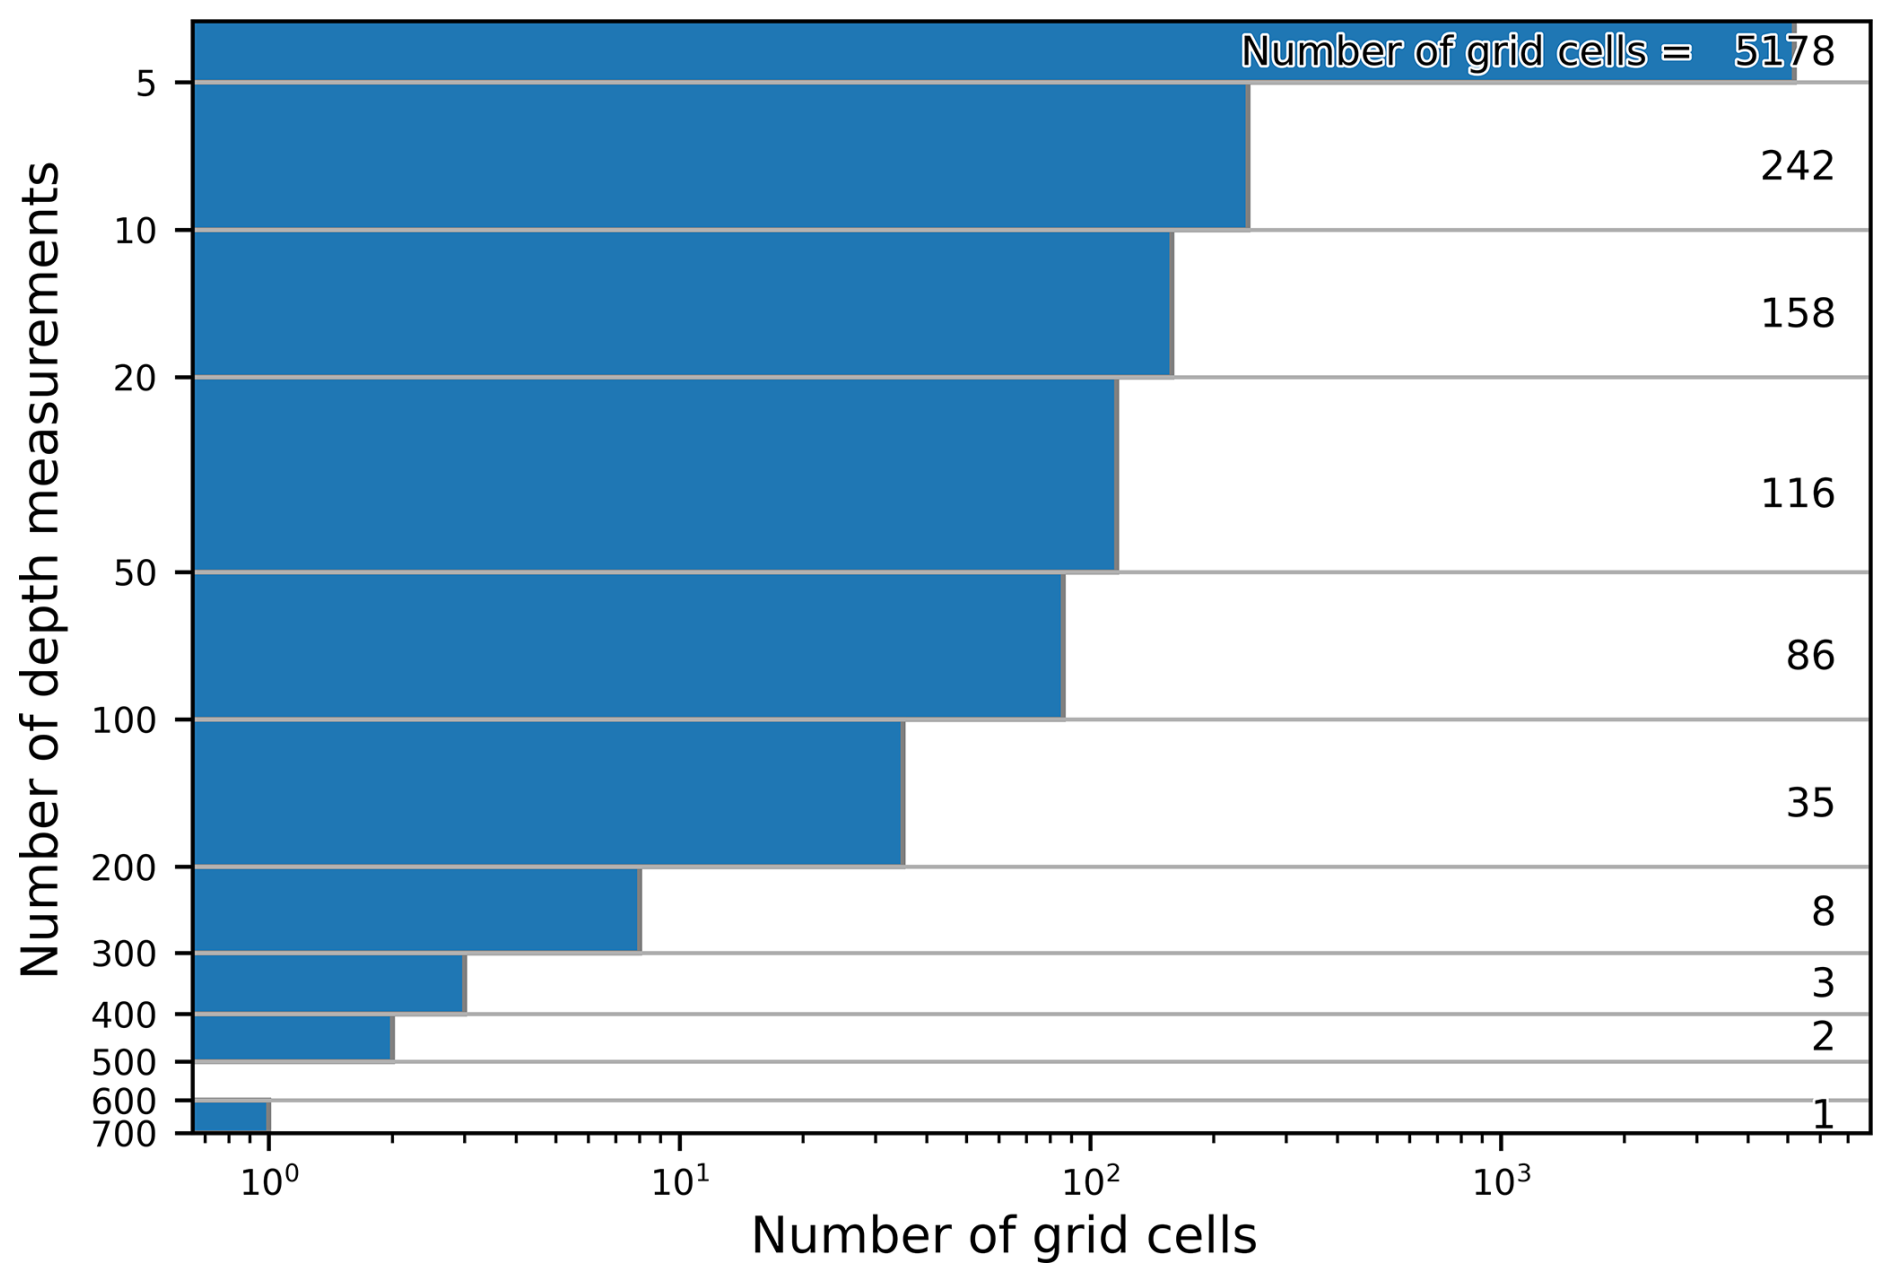
Figure A1Distribution of peat-present depth measurements per grid cell from Peat-DBase v 0.9. A total of 3960 grid cells contain only one measurement.
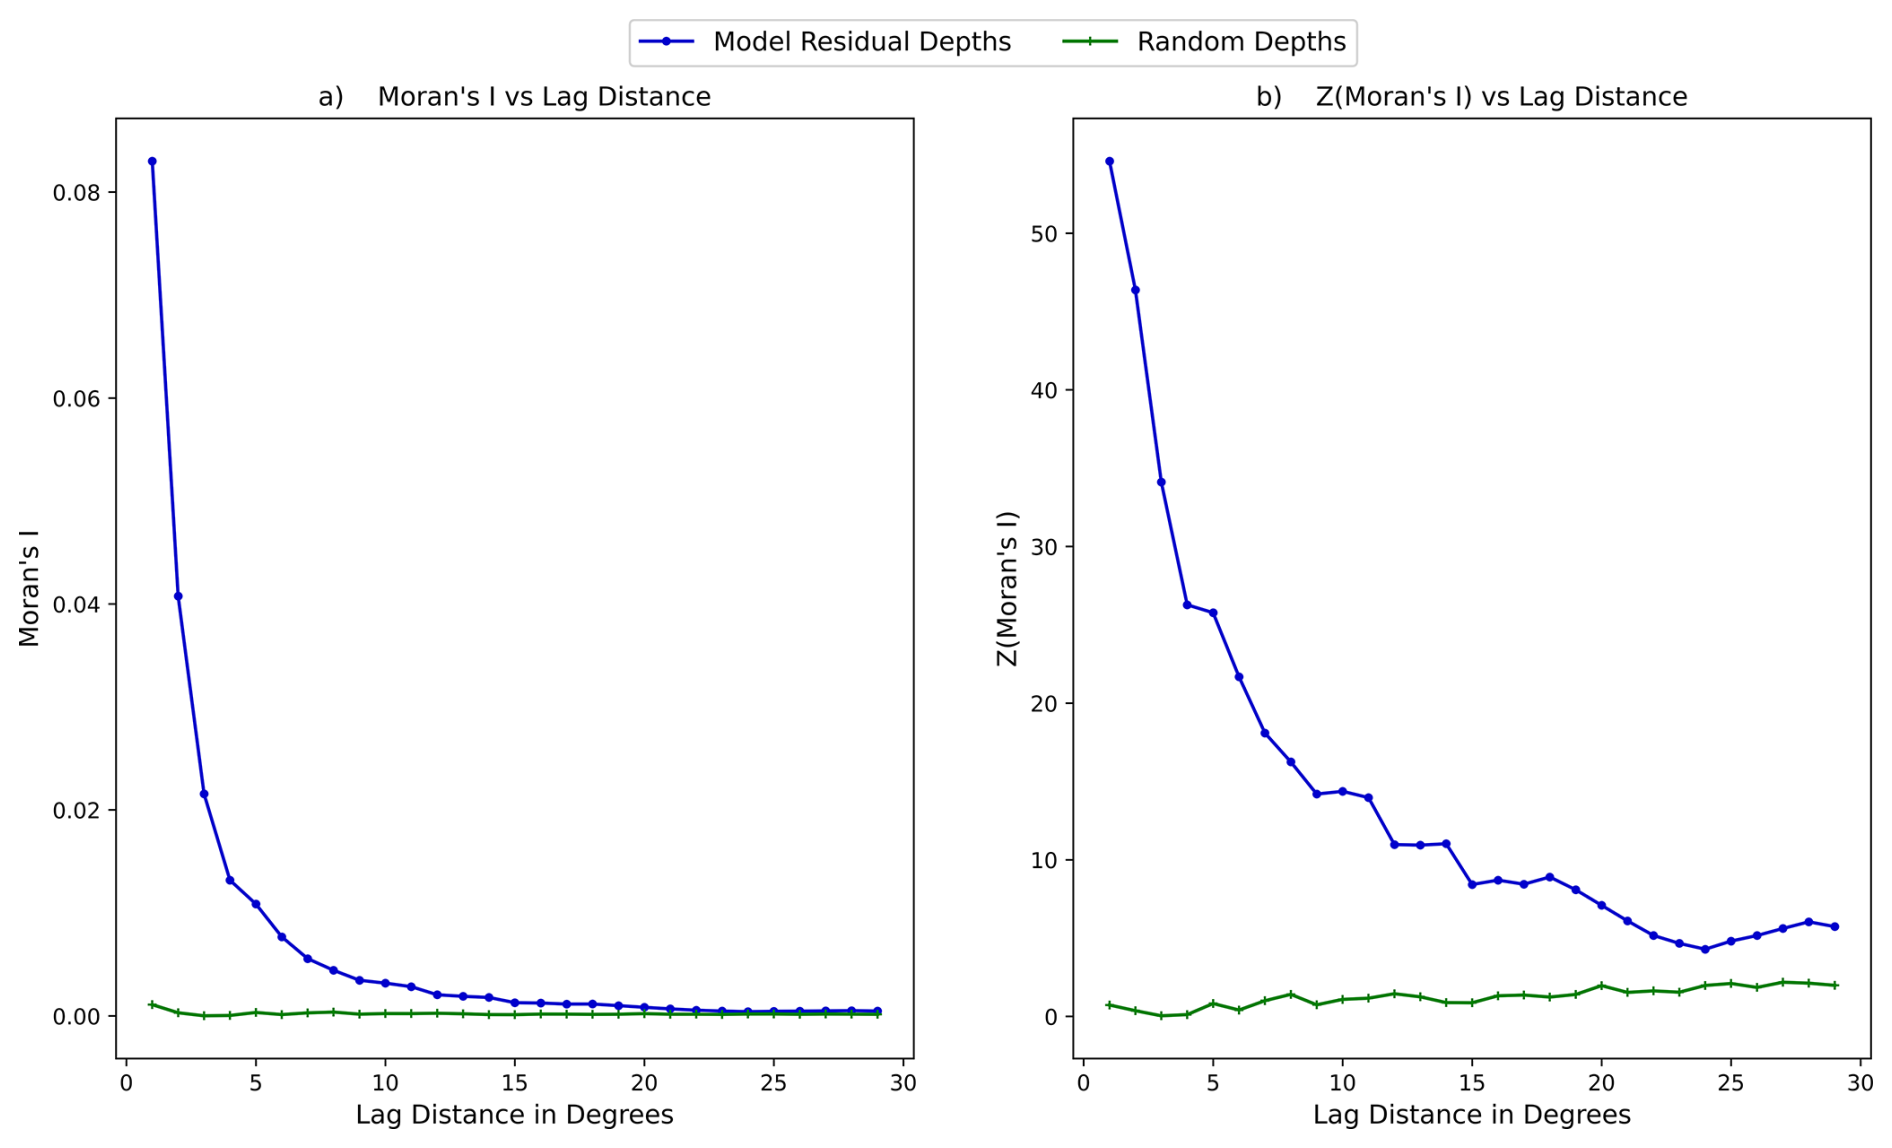
Figure A2(a) MI versus increasing distance in degrees; (b) Z score of MI versus increasing distance in degrees. Both calculated for PeatDepth-ML model residuals and randomly generated numbers (showing behaviour with no spatial autocorrelation).
Table A1The final values of the LightGBM hyperparameters chosen to undergo Bayesian optimization. These are the same hyperparameters chosen for optimization as Peat-ML (Melton et al., 2022).
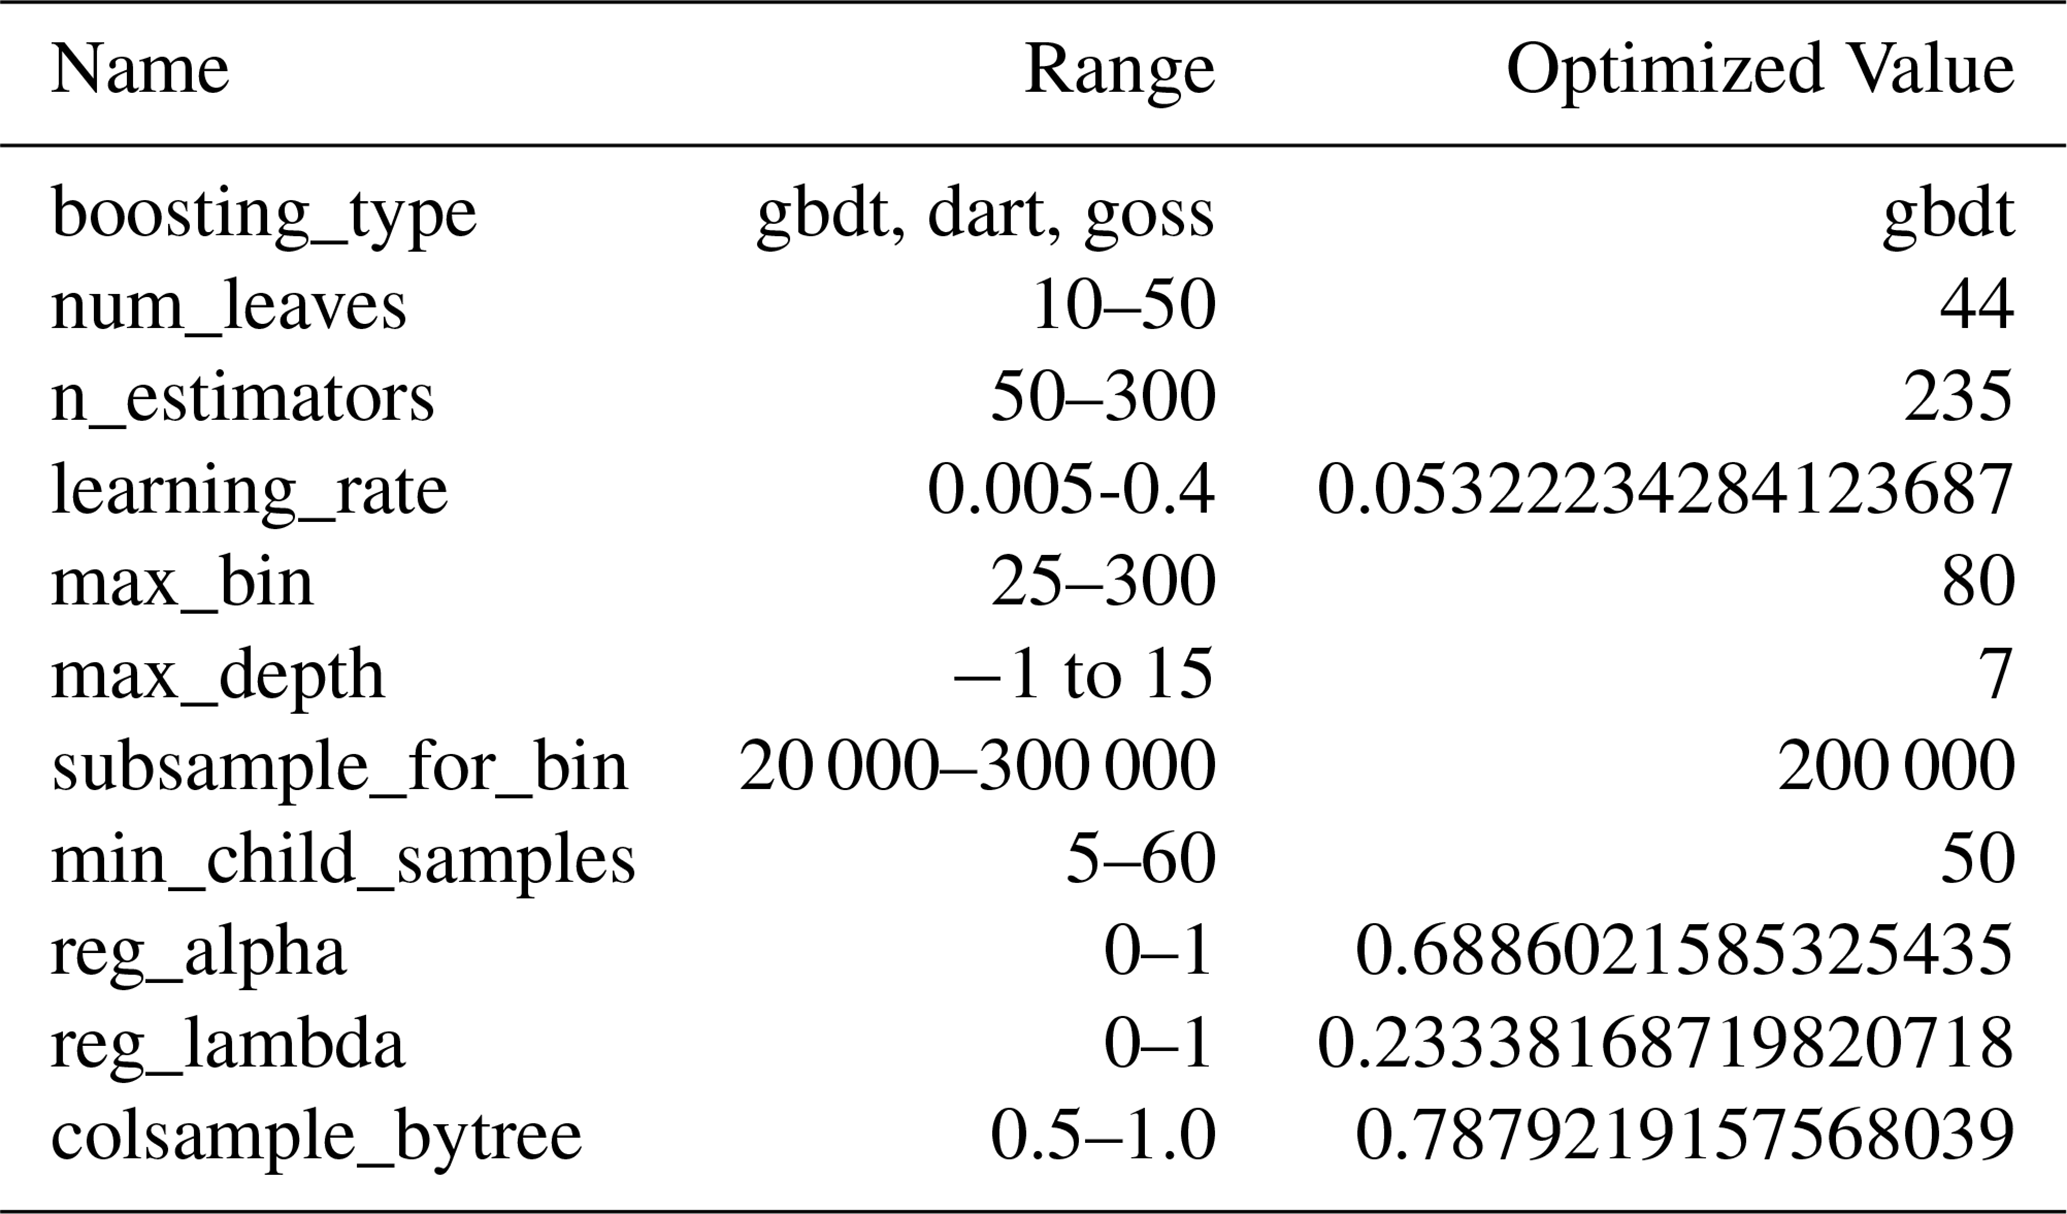
Table A2Equations used in assessing PeatDepth-ML model performance and their meanings in this context. Here, p refers to the values predicted by PeatDepth-ML, r is the “real” observed values (where all observations within a grid cell are averaged as described in Section 2.2.1, is the mean of the observed values over all grid cells, and N is the number of grid cells for which there are both predicted and observed values.
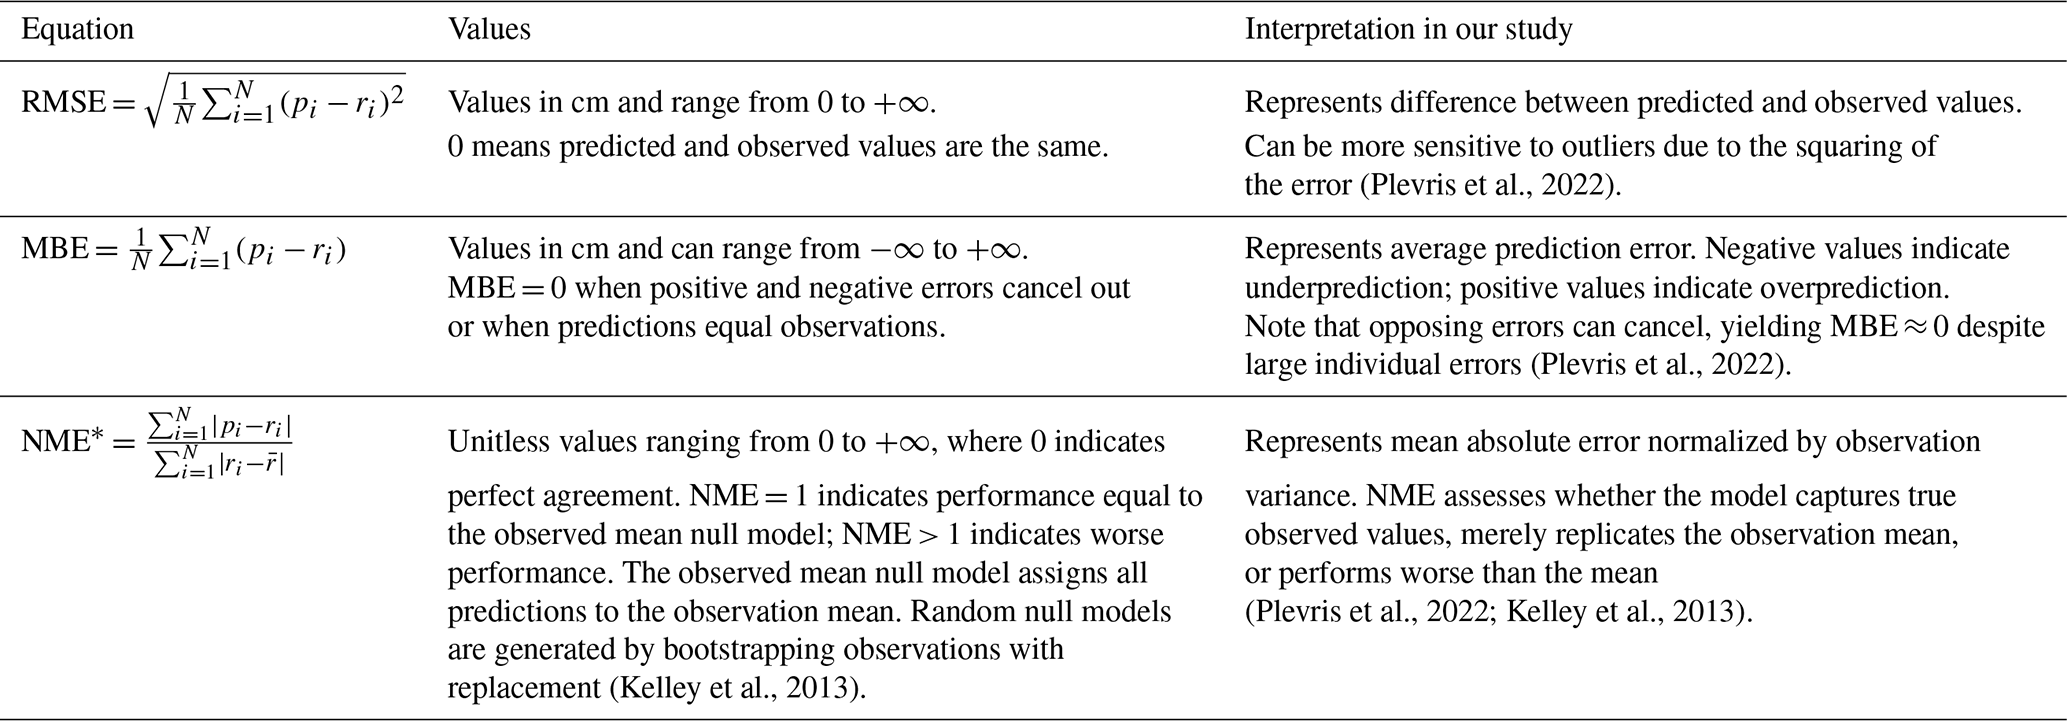
* As proposed by Kelley et al. (2013) where the mean absolute error is normalized by the variance in the observations.
Peat-DBase version 0.9 is available from https://doi.org/10.5281/zenodo.15530645 (Skye, 2025a). The PeatDepth-ML model Python script and other associated code can be downloaded from https://doi.org/10.5281/zenodo.15530816 (Skye et al., 2025). NetCDF files containing the mean of the PeatDepth-ML bootstrap runs, and the mean of the equivalent cross-validated model results are also stored in that location, along with Fig. 7 and predictor importance results from all 401 model runs.
Conceptualization, funding acquisition, and project administration: JRM. Methodology: JS, JRM, CG, AG-S, SW, MG. Investigation, data curation, formal analysis, software, validation: JS. Visualization: JS, JRM. Resources: JS, JRM, CG. Writing – original draft: JS, JRM, CG. Writing – review and editing: all authors. Supervision: JRM, CG.
The contact author has declared that none of the authors has any competing interests.
Publisher's note: Copernicus Publications remains neutral with regard to jurisdictional claims made in the text, published maps, institutional affiliations, or any other geographical representation in this paper. The authors bear the ultimate responsibility for providing appropriate place names. Views expressed in the text are those of the authors and do not necessarily reflect the views of the publisher.
Jade Skye was supported by the Federal Student Work Experience Program through Environment and Climate Change Canada, and a University of Victoria Faculty of Graduate Studies Fellowship. Joe R. Melton thanks Louis Saumier for helpful discussions. AI chat engines were used to assist coding tasks relating to model visualization and copy editing of the manuscript text written by the authors.
This paper was edited by Benjamin Stocker and reviewed by two anonymous referees.
Abatzoglou, J. T., Dobrowski, S. Z., Parks, S. A., and Hegewisch, K. C.: TerraClimate, a high-resolution global dataset of monthly climate and climatic water balance from 1958–2015, Sci. Data, 5, 170191, https://doi.org/10.1038/sdata.2017.191, 2018. a, b
Amatulli, G., McInerney, D., Sethi, T., Strobl, P., and Domisch, S.: Geomorpho90m, empirical evaluation and accuracy assessment of global high-resolution geomorphometric layers, Sci. Data, 7, 162, https://doi.org/10.1038/s41597-020-0479-6, 2020. a
Anda, M., Ritung, S., Suryani, E., Sukarman, Hikmat, M., Yatno, E., Mulyani, A., Subandiono, R. E., Suratman, and Husnain: Revisiting tropical peatlands in Indonesia: Semi-detailed mapping, extent and depth distribution assessment, Geoderma, 402, 115235, https://doi.org/10.1016/j.geoderma.2021.115235, 2021. a
Austin, K. G., Elsen, P. R., Honorio Coronado, E. N., DeGemmis, A., Gallego-Sala, A. V., Harris, L., Kretser, H. E., Melton, J. R., Murdiyarso, D., Sasmito, S. D., Swails, E., Wijaya, A., Scott Winton, R., and Zarin, D.: Mismatch Between Global Importance of Peatlands and the Extent of Their Protection, Conserv. Lett., 18, e13080, https://doi.org/10.1111/conl.13080, 2025. a
Batjes, N. H., Ribeiro, E., and van Oostrum, A.: Standardised soil profile data to support global mapping and modelling (WoSIS snapshot 2019), Earth Syst. Sci. Data, 12, 299–320, https://doi.org/10.5194/essd-12-299-2020, 2020. a
Bechtold, M., De Lannoy, G. J. M., Koster, R. D., Reichle, R. H., Mahanama, S. P., Bleuten, W., Bourgault, M. A., Brümmer, C., Burdun, I., Desai, A. R., Devito, K., Grünwald, T., Grygoruk, M., Humphreys, E. R., Klatt, J., Kurbatova, J., Lohila, A., Munir, T. M., Nilsson, M. B., Price, J. S., Röhl, M., Schneider, A., and Tiemeyer, B.: PEAT-CLSM: A Specific Treatment of Peatland Hydrology in the NASA Catchment Land Surface Model, J. Adv. Model. Earth Sy., 11, 2130–2162, https://doi.org/10.1029/2018MS001574, 2019. a
Brun, P., Zimmermann, N. E., Hari, C., Pellissier, L., and Karger, D. N.: CHELSA-BIOCLIM+ A novel set of global climate-related predictors at kilometre-resolution, EnviDat [data set], https://doi.org/10.16904/envidat.332, 2022. a, b
Canadell, J. G., Monteiro, P. M. S., Costa, M. H., Cotrim da Cunha, L., Cox, P. M., Eliseev, A. V., Henson, S., Ishii, M., Jaccard, S., Koven, C., Lohila, A., Patra, P. K., Piao, S., Rogelj, J., Syampungani, S., Zaehle, S., and Zickfeld, K.: 2021: Global Carbon and other Biogeochemical Cycles and Feedbacks, in: Climate Change 2021: The Physical Science Basis. Contribution of Working Group I to the Sixth Assessment Report of the Intergovernmental Panel on Climate Change, Tech. rep., Cambridge, United Kingdom and New York, NY, USA, https://doi.org/10.1017/9781009157896.007, 2021. a
Chadburn, S. E., Burke, E. J., Gallego-Sala, A. V., Smith, N. D., Bret-Harte, M. S., Charman, D. J., Drewer, J., Edgar, C. W., Euskirchen, E. S., Fortuniak, K., Gao, Y., Nakhavali, M., Pawlak, W., Schuur, E. A. G., and Westermann, S.: A new approach to simulate peat accumulation, degradation and stability in a global land surface scheme (JULES vn5.8_accumulate_soil) for northern and temperate peatlands, Geosci. Model Dev., 15, 1633–1657, https://doi.org/10.5194/gmd-15-1633-2022, 2022. a
Chen, W., Yang, K., Yu, Z., Shi, Y., and Chen, C. L. P.: A survey on imbalanced learning: latest research, applications and future directions, Artif. Intell. Rev., 57, 1–51, https://doi.org/10.1007/s10462-024-10759-6, 2024. a
Crezee, B., Dargie, G. C., Ewango, C. E. N., Mitchard, E. T. A., Emba B., O., Kanyama T., J., Bola, P., Ndjango, J.-B. N., Girkin, N. T., Bocko, Y. E., Ifo, S. A., Hubau, W., Seidensticker, D., Batumike, R., Imani, G., Cuní-Sanchez, A., Kiahtipes, C. A., Lebamba, J., Wotzka, H.-P., Bean, H., Baker, T. R., Baird, A. J., Boom, A., Morris, P. J., Page, S. E., Lawson, I. T., and Lewis, S. L.: Mapping peat thickness and carbon stocks of the central Congo Basin using field data, Nat. Geosci., 15, 639–644, https://doi.org/10.1038/s41561-022-00966-7, 2022. a
Deragon, R., Saurette, D. D., Heung, B., and Caron, J.: Mapping the maximum peat thickness of cultivated organic soils in the southwest plain of Montreal, Can. J. Soil Sci., 103, 103–120, https://doi.org/10.1139/cjss-2022-0031, 2023. a
Didan, K. and Barreto, A.: VIIRS/NPP Vegetation Indices 16-Day L3 Global 500m SIN Grid V001, NASA Land Processes Distributed Active Archive Center [data set], https://doi.org/10.5067/VIIRS/VNP13A1.001, 2018. a
Efron, B. and Tibshirani, R. J.: An introduction to the bootstrap, Biometrics, 50, 890–892, https://doi.org/10.2307/2532810, 1994. a
Fan, Y., Li, H., and Miguez-Macho, G.: Global patterns of groundwater table depth, Science, 339, 940–943, https://doi.org/10.1126/science.1229881, 2013. a, b, c
Feng, C., Wang, H., Lu, N., Chen, T., He, H., Lu, Y., and Tu, X. M.: Log-transformation and its implications for data analysis, Shanghai Archives of Psychiatry, 26, 105–109, https://doi.org/10.3969/j.issn.1002-0829.2014.02.009, 2014. a
Fick, S. E. and Hijmans, R. J.: WorldClim 2: new 1‐km spatial resolution climate surfaces for global land areas, Int. J. Climatol., 37, 4302–4315, https://doi.org/10.1002/joc.5086, 2017. a, b, c
Fluet-Chouinard, E., Stocker, B. D., Zhang, Z., Malhotra, A., Melton, J. R., Poulter, B., Kaplan, J. O., Goldewijk, K. K., Siebert, S., Minayeva, T., Hugelius, G., Joosten, H., Barthelmes, A., Prigent, C., Aires, F., Hoyt, A. M., Davidson, N., Finlayson, C. M., Lehner, B., Jackson, R. B., and McIntyre, P. B.: Extensive global wetland loss over the past three centuries, Nature, 614, 281–286, https://doi.org/10.1038/s41586-022-05572-6, 2023. a
Friedl, M., Gray, J., and Sulla-Menashe, D.: MCD12Q2 MODIS/Terra+Aqua Land Cover Dynamics Yearly L3 Global 500m SIN Grid V006, NASA Land Processes Distributed Active Archive Center [data set], https://doi.org/10.5067/MODIS/MCD12Q2.006, 2019. a
Galdi, P. and Tagliaferri, R.: Data Mining: Accuracy and Error Measures for Classification and Prediction, in: Encyclopedia of Bioinformatics and Computational Biology, edited by: Ranganathan, S., Gribskov, M., Nakai, K., and Schönbach, C., Academic Press, Oxford, 431–436, https://doi.org/10.1016/B978-0-12-809633-8.20474-3, ISBN 9780128114322, 2019. a, b
Garcin, Y., Schefuß, E., Dargie, G. C., Hawthorne, D., Lawson, I. T., Sebag, D., Biddulph, G. E., Crezee, B., Bocko, Y. E., Ifo, S. A., Mampouya Wenina, Y. E., Mbemba, M., Ewango, C. E. N., Emba, O., Bola, P., Kanyama Tabu, J., Tyrrell, G., Young, D. M., Gassier, G., Girkin, N. T., Vane, C. H., Adatte, T., Baird, A. J., Boom, A., Gulliver, P., Morris, P. J., Page, S. E., Sjögersten, S., and Lewis, S. L.: Hydroclimatic vulnerability of peat carbon in the central Congo Basin, Nature, 612, 277–282, https://doi.org/10.1038/s41586-022-05389-3, 2022. a
Getis, A.: Spatial Autocorrelation, in: Handbook of Applied Spatial Analysis, edited by: Fischer, M. M. and Getis, A., Springer Berlin Heidelberg, Berlin, Heidelberg, 255–278, https://doi.org/10.1007/978-3-642-03647-7_14, ISBN 9783642036460, 2010. a, b
Getis, A. and Ord, J. K.: The analysis of spatial association by use of distance statistics, Geogr. Anal., 24, 189–206, https://doi.org/10.1111/j.1538-4632.1992.tb00261.x, 1992. a, b
Goodling, P., Belitz, K., Stackelberg, P., and Fleming, B.: A spatial machine learning model developed from noisy data requires multiscale performance evaluation: Predicting depth to bedrock in the Delaware river basin, USA, Environ. Modell. Softw., 179, 106124, https://doi.org/10.1016/j.envsoft.2024.106124, 2024. a, b
Gorelick, N., Hancher, M., Dixon, M., Ilyushchenko, S., Thau, D., and Moore, R.: Google Earth Engine: Planetary-scale geospatial analysis for everyone, Remote Sens. Environ., 202, 18–27, https://doi.org/10.1016/j.rse.2017.06.031, 2017. a
Gorham, E.: The Development of Peat Lands, Q. Rev. Biol., 32, 145–166, https://doi.org/10.1086/401755, 1957. a
Gorham, E.: Northern peatlands: Role in the carbon cycle and probable responses to climatic warming, Ecol. Appl., 1, 182–195, https://doi.org/10.2307/1941811, 1991. a
Gowan, E. J., Zhang, X., Khosravi, S., Rovere, A., Stocchi, P., Hughes, A. L. C., Gyllencreutz, R., Mangerud, J., Svendsen, J.-I., and Lohmann, G.: A new global ice sheet reconstruction for the past 80 000 years, Nat. Commun., 12, 1199, https://doi.org/10.1038/s41467-021-21469-w, 2021. a, b, c
Gumbricht, T., Roman-Cuesta, R. M., Verchot, L., Herold, M., Wittmann, F., Householder, E., Herold, N., and Murdiyarso, D.: An expert system model for mapping tropical wetlands and peatlands reveals South America as the largest contributor, Glob. Change Biol., 23, 3581–3599, https://doi.org/10.1111/gcb.13689, 2017. a, b, c
Haixiang, G., Yijing, L., Shang, J., Mingyun, G., Yuanyue, H., and Bing, G.: Learning from class-imbalanced data: Review of methods and applications, Expert Syst. Appl., 73, 220–239, https://doi.org/10.1016/j.eswa.2016.12.035, 2017. a, b, c
Hastie, A., Householder, J. E., Honorio Coronado, E. N., Hidalgo Pizango, C. G., Herrera, R., Lähteenoja, O., de Jong, J., Winton, R. S., Aymard Corredor, G. A., Reyna, J., Montoya, E., Paukku, S., Mitchard, E. T. A., Åkesson, C. M., Baker, T. R., Cole, L. E. S., Córdova Oroche, C. J., Dávila, N., Águila, J. D., Draper, F. C., Fluet-Chouinard, E., Grández, J., Janovec, J. P., Reyna, D., W Tobler, M., Del Castillo Torres, D., Roucoux, K. H., Wheeler, C. E., Fernandez Piedade, M. T., Schöngart, J., Wittmann, F., van der Zon, M., and Lawson, I. T.: A new data-driven map predicts substantial undocumented peatland areas in Amazonia, Environ. Res. Lett., 19, 094019, https://doi.org/10.1088/1748-9326/ad677b, 2024. a
Hateffard, F., Steinbuch, L., and Heuvelink, G. B. M.: Evaluating the extrapolation potential of random forest digital soil mapping, Geoderma, 441, 116740, https://doi.org/10.1016/j.geoderma.2023.116740, 2024. a
Hengl, T.: Clay content in % (kg / kg) at 6 standard depths (0, 10, 30, 60, 100 and 200 cm) at 250 m resolution, Version v0.2, Zenodo [data set], https://doi.org/10.5281/zenodo.2525663, 2018. a
Hengl, T. and MacMillan, R. A.: Predictive Soil Mapping with R, OpenGeoHub foundation, Wageningen, the Netherlands, 370 pp., ISBN: 978-0-359-30635-0, 2019. a
Hengl, T., Mendes de Jesus, J., Heuvelink, G. B. M., Ruiperez Gonzalez, M., Kilibarda, M., Blagotić, A., Shangguan, W., Wright, M. N., Geng, X., Bauer-Marschallinger, B., Guevara, M. A., Vargas, R., MacMillan, R. A., Batjes, N. H., Leenaars, J. G. B., Ribeiro, E., Wheeler, I., Mantel, S., and Kempen, B.: SoilGrids250m: Global gridded soil information based on machine learning, PLoS One, 12, e0169748, https://doi.org/10.1371/journal.pone.0169748, 2017. a
Hersbach, H., Bell, B., Berrisford, P., Hirahara, S., Horányi, A., Muñoz-Sabater, J., Nicolas, J., Peubey, C., Radu, R., Schepers, D., Simmons, A., Soci, C., Abdalla, S., Abellan, X., Balsamo, G., Bechtold, P., Biavati, G., Bidlot, J., Bonavita, M., De Chiara, G., Dahlgren, P., Dee, D., Diamantakis, M., Dragani, R., Flemming, J., Forbes, R., Fuentes, M., Geer, A., Haimberger, L., Healy, S., Hogan, R. J., Hólm, E., Janisková, M., Keeley, S., Laloyaux, P., Lopez, P., Lupu, C., Radnoti, G., de Rosnay, P., Rozum, I., Vamborg, F., Villaume, S., and Thépaut, J.-N.: The ERA5 global reanalysis, Q. J. Roy. Meteor. Soc., 146, 1999–2049, https://doi.org/10.1002/qj.3803, 2020. a
Hesterberg, T.: Bootstrap, WIREs Comp. Stat., 3, 497–526, https://doi.org/10.1002/wics.182, 2011. a, b
Huang, Z., Zhao, T., Lai, R., Tian, Y., and Yang, F.: A comprehensive implementation of the log, Box-Cox and log-sinh transformations for skewed and censored precipitation data, J. Hydrol., 620, 129347, https://doi.org/10.1016/j.jhydrol.2023.129347, 2023. a
Hugelius, G., Loisel, J., Chadburn, S., Jackson, R. B., Jones, M., MacDonald, G., Marushchak, M., Olefeldt, D., Packalen, M., Siewert, M. B., Treat, C., Turetsky, M., Voigt, C., and Yu, Z.: Large stocks of peatland carbon and nitrogen are vulnerable to permafrost thaw, P. Natl. Acad. Sci. USA, 117, 20438–20446, https://doi.org/10.1073/pnas.1916387117, 2020. a, b, c, d, e, f, g, h, i, j, k, l, m, n, o, p, q, r, s, t, u, v, w, x, y, z, aa, ab, ac, ad
Immirzi, C. P., Maltby, E., and Clymo, R. S.: The global status of peatlands and their role in carbon cycling, Friends of The Earth, London, England, ISBN: 978-18-575-0105-6, 1992. a, b, c
Ivanovs, J., Haberl, A., and Melniks, R.: Modeling Geospatial Distribution of Peat Layer Thickness Using Machine Learning and Aerial Laser Scanning Data, Land, 13, 466, https://doi.org/10.3390/land13040466, 2024. a
Johnson, R. W.: An introduction to the bootstrap, Teaching Statistics, 23, 49–54, https://doi.org/10.1111/1467-9639.00050, 2001. a
Joosten, H.: The Global Peatland CO2 Picture: peatland status and drainage related emissions in all countries of the world, CABI Digital Library, https://www.wetlands.org/publication/the-global-peatland-co2-picture/ (last access: 21 April 2026), 2009. a, b
Joosten, H. and Clarke, D.: Wise Use of Mires and Peatlands, International Mire Conservation Group and International Peat Society, ISBN: 978-951-97744-8-0, 2002. a, b, c, d, e
Karger, D. N., Conrad, O., Böhner, J., Kawohl, T., Kreft, H., Soria-Auza, R. W., Zimmermann, N. E., Linder, H. P., and Kessler, M.: Climatologies at high resolution for the earth's land surface areas, Sci. Data, 4, 170122, https://doi.org/10.1038/sdata.2017.122, 2017. a
Karger, D. N., Wilson, A. M., Mahony, C., Zimmermann, N. E., and Jetz, W.: Global daily 1 km land surface precipitation based on cloud cover-informed downscaling, Sci. Data, 8, 307, https://doi.org/10.1038/s41597-021-01084-6, 2021. a
Ke, G., Meng, Q., Finley, T., Wang, T., Chen, W., Ma, W., Ye, Q., and Liu, T.-Y.: LightGBM: A Highly Efficient Gradient Boosting Decision Tree, in: 31st Conference on Neural Information Processing Systems, Long Beach, CA, USA, 4–9 December 2017, ISBN 9781510860964, 2017. a
Kelley, D. I., Prentice, I. C., Harrison, S. P., Wang, H., Simard, M., Fisher, J. B., and Willis, K. O.: A comprehensive benchmarking system for evaluating global vegetation models, Biogeosciences, 10, 3313–3340, https://doi.org/10.5194/bg-10-3313-2013, 2013. a, b, c, d, e, f, g
Köchy, M., Hiederer, R., and Freibauer, A.: Global distribution of soil organic carbon – Part 1: Masses and frequency distributions of SOC stocks for the tropics, permafrost regions, wetlands, and the world, SOIL, 1, 351–365, https://doi.org/10.5194/soil-1-351-2015, 2015. a
Krankina, O. N., Pflugmacher, D., Friedl, M., Cohen, W. B., Nelson, P., and Baccini, A.: Meeting the challenge of mapping peatlands with remotely sensed data, Biogeosciences, 5, 1809–1820, https://doi.org/10.5194/bg-5-1809-2008, 2008. a
Krawczyk, B.: Learning from imbalanced data: open challenges and future directions, Prog. Artif. Intell., 5, 221–232, https://doi.org/10.1007/s13748-016-0094-0, 2016. a
Kuhn, M.: Building Predictive Models in R Using the caret Package, J. Stat. Softw., 28, 1–26, https://doi.org/10.18637/jss.v028.i05, 2008. a
Lara, M. J., Michaelides, R., Anderson, D., Chen, W., Hall, E. C., Ludden, C., Schore, A. I. G., Mishra, U., and Scott, S. N.: A 20 m spatial resolution peatland extent map of Alaska, Sci. Data, 12, 226, https://doi.org/10.1038/s41597-025-04502-1, 2025. a
Loidi, J., Navarro-Sánchez, G., and Vynokurov, D.: A vector map of the world's terrestrial biotic units: subbiomes, biomes, ecozones and domains, Vegetation Classification and Survey, 4, 59–61, https://doi.org/10.3897/vcs.99167, 2023. a
Loisel, J., van Bellen, S., Pelletier, L., Talbot, J., Hugelius, G., Karran, D., Yu, Z., Nichols, J., and Holmquist, J.: Insights and issues with estimating northern peatland carbon stocks and fluxes since the Last Glacial Maximum, Earth-Sci. Rev., 165, 59–80, https://doi.org/10.1016/j.earscirev.2016.12.001, 2017. a, b, c, d, e
Lourenco, M., Fitchett, J. M., and Woodborne, S.: Peat definitions: A critical review, Progress in Physical Geography: Earth and Environment, 47, 506–520, https://doi.org/10.1177/03091333221118353, 2022. a, b, c
Maltby, E. and Immirzi, P.: Carbon dynamics in peatlands and other wetland soils regional and global perspectives, Chemosphere, 27, 999–1023, https://doi.org/10.1016/0045-6535(93)90065-D, 1993. a
McBratney, A. B., Mendonça Santos, M. L., and Minasny, B.: On digital soil mapping, Geoderma, 117, 3–52, https://doi.org/10.1016/S0016-7061(03)00223-4, 2003. a
Melton, J. R., Arora, V. K., Wisernig-Cojoc, E., Seiler, C., Fortier, M., Chan, E., and Teckentrup, L.: CLASSIC v1.0: the open-source community successor to the Canadian Land Surface Scheme (CLASS) and the Canadian Terrestrial Ecosystem Model (CTEM) – Part 1: Model framework and site-level performance, Geosci. Model Dev., 13, 2825–2850, https://doi.org/10.5194/gmd-13-2825-2020, 2020. a
Melton, J. R., Chan, E., Millard, K., Fortier, M., Winton, R. S., Martín-López, J. M., Cadillo-Quiroz, H., Kidd, D., and Verchot, L. V.: A map of global peatland extent created using machine learning (Peat-ML), Geosci. Model Dev., 15, 4709–4738, https://doi.org/10.5194/gmd-15-4709-2022, 2022. a, b, c, d, e, f, g, h, i, j, k, l, m, n, o, p, q, r, s, t, u, v, w, x
Meyer, H. and Pebesma, E.: Predicting into unknown space? Estimating the area of applicability of spatial prediction models, Methods Ecol. Evol., 12, 1620–1633, https://doi.org/10.1111/2041-210x.13650, 2021. a, b, c, d, e
Meyer, H. and Pebesma, E.: Machine learning-based global maps of ecological variables and the challenge of assessing them, Nat. Commun., 13, 2208, https://doi.org/10.1038/s41467-022-29838-9, 2022. a, b
Milà, C., Mateu, J., Pebesma, E., and Meyer, H.: Nearest neighbour distance matching Leave‐One‐Out Cross‐Validation for map validation, Methods Ecol. Evol., 13, 1304–1316, https://doi.org/10.1111/2041-210x.13851, 2022. a, b
Minasny, B., Berglund, O., Connolly, J., Hedley, C., de Vries, F., Gimona, A., Kempen, B., Kidd, D., Lilja, H., Malone, B., McBratney, A., Roudier, P., O'Rourke, S., Rudiyanto, Padarian, J., Poggio, L., ten Caten, A., Thompson, D., Tuve, C., and Widyatmanti, W.: Digital mapping of peatlands – A critical review, Earth-Sci. Rev., 196, 102870, https://doi.org/10.1016/j.earscirev.2019.05.014, 2019. a, b, c, d, e, f, g, h, i, j
Moore, P. D.: The ecology of peat-forming processes: a review, Int. J. Coal Geol., 12, 89–103, https://doi.org/10.1016/0166-5162(89)90048-7, 1989. a
Olson, D. M., Dinerstein, E., Wikramanayake, E. D., Burgess, N. D., Powell, G. V. N., Underwood, E. C., Itoua, I., Strand, H. E., Morrison, J. C., Loucks, C. J., Allnutt, T. F., Ricketts, T. H., Kura, Y., Lamoreux, J. F., Wettengel, W. W., Hedao, P., and Kassem, K. R.: Terrestrial Ecoregions of the World: A New Map of Life on Earth: A new global map of terrestrial ecoregions provides an innovative tool for conserving biodiversity, BioScience, 51, 933–938, https://doi.org/10.1641/0006-3568(2001)051[0933:TEOTWA]2.0.CO;2, 2001. a
ONeill, P. E., Chan, S., Njoku, E. G., Jackson, T., Bindlish, R., Chaubell, M. J., and Colliander, A.: SMAP enhanced L3 radiometer global and polar grid daily 9 km EASE-grid soil moisture, Version 5, NASA National Snow and Ice Data Center Distributed Active Archive Center [data set], https://doi.org/10.5067/4DQ54OUIJ9DL, 2021. a, b, c, d
Ord, J. K. and Getis, A.: Local spatial autocorrelation statistics: Distributional issues and an application, Geogr. Anal., 27, 286–306, https://doi.org/10.1111/j.1538-4632.1995.tb00912.x, 1995. a
Page, S. E. and Baird, A. J.: Peatlands and Global Change: Response and Resilience, Annu. Rev. Env. Resour., 41, 35–57, https://doi.org/10.1146/annurev-environ-110615-085520, 2016. a, b, c
Page, S. E., Rieley, J. O., and Banks, C. J.: Global and regional importance of the tropical peatland carbon pool, Glob. Change Biol., 17, 798–818, https://doi.org/10.1111/j.1365-2486.2010.02279.x, 2011. a, b, c
Pekel, J.-F., Cottam, A., Gorelick, N., and Belward, A. S.: High-resolution mapping of global surface water and its long-term changes, Nature, 540, 418–422, https://doi.org/10.1038/nature20584, 2016. a, b, c
Plevris, V., Solorzano, G., Bakas, N., and Ben Seghier, M.: Investigation of performance metrics in regression analysis and machine learning-based prediction models, in: 8th European Congress on Computational Methods in Applied Sciences and Engineering, ECCOMAS, Oslo, Norway, 5–9 June 2022, Vol. Computational Solid Mechanics, https://doi.org/10.23967/eccomas.2022.155, 2022. a, b, c, d, e
Pohjankukka, J., Räsänen, T. A., Pitkänen, T. P., Kivimäki, A., Mäkinen, V., Väänänen, T., Lerssi, J., Salmivaara, A., and Middleton, M.: Digital mapping of peat thickness and extent in Finland using remote sensing and machine learning, Geoderma, 455, 117216, https://doi.org/10.1016/j.geoderma.2025.117216, 2025. a, b
Ratnayake, A. S.: Characteristics of lowland tropical peatlands: Formation, classification, and decomposition, Journal of Tropical Forestry and Environment, 10, https://doi.org/10.31357/jtfe.v10i1.4685, 2020. a
Ribeiro, K., Pacheco, F. S., Ferreira, J. W., de Sousa-Neto, E. R., Hastie, A., Krieger Filho, G. C., Alvalá, P. C., Forti, M. C., and Ometto, J. P.: Tropical peatlands and their contribution to the global carbon cycle and climate change, Glob. Change Biol., 27, 489–505, https://doi.org/10.1111/gcb.15408, 2021. a
Roberts, D. R., Bahn, V., Ciuti, S., Boyce, M. S., Elith, J., Guillera-Arroita, G., Hauenstein, S., Lahoz-Monfort, J. J., Schröder, B., Thuiller, W., Warton, D. I., Wintle, B. A., Hartig, F., and Dormann, C. F.: Cross-validation strategies for data with temporal, spatial, hierarchical, or phylogenetic structure, Ecography, 40, 913–929, https://doi.org/10.1111/ecog.02881, 2017. a
Rouault, E., Warmerdam, F., Schwehr, K., Kiselev, A., Butler, H., Łoskot, M., Szekeres, T., Tourigny, E., Landa, M., Miara, I., Elliston, B., Chaitanya, K., Plesea, L., Morissette, D., Jolma, A., and Dawson, N.: GDAL, Version v3.6.2, Zenodo [code], https://doi.org/10.5281/zenodo.7764163, 2023. a
Rožanec, J. M., Petelin, G., Costa, J., Bertalanič, B., Cerar, G., Guček, M., Papa, G., and Mladenić, D.: Dealing with zero-inflated data: Achieving state-of-the-art with a two-fold machine learning approach, Eng. Appl. Artif. Intel., 149, 110339, https://doi.org/10.1016/j.engappai.2025.110339, 2025. a
Rudiyanto, Minasny, B., Setiawan, B. I., Arif, C., Saptomo, S. K., and Chadirin, Y.: Digital mapping for cost-effective and accurate prediction of the depth and carbon stocks in Indonesian peatlands, Geoderma, 272, 20–31, https://doi.org/10.1016/j.geoderma.2016.02.026, 2016. a, b, c
Rudiyanto, Minasny, B., Setiawan, B. I., Saptomo, S. K., and McBratney, A. B.: Open digital mapping as a cost-effective method for mapping peat thickness and assessing the carbon stock of tropical peatlands, Geoderma, 313, 25–40, https://doi.org/10.1016/j.geoderma.2017.10.018, 2018. a
Running, S., Mu, Q., and Zhao, M.: MOD17A3 MODIS/Terra net primary production yearly L4 global 1km SIN grid V055, NASA EOSDIS Land Processes DAAC [data set], https://doi.org/10.5067/MODIS/MOD17A3HGF.006, 2011. a
Ruppel, M., Väliranta, M., Virtanen, T., and Korhola, A.: Postglacial spatiotemporal peatland initiation and lateral expansion dynamics in North America and northern Europe, Holocene, 23, 1596–1606, https://doi.org/10.1177/0959683613499053, 2013. a
Russell, S. and Norvig, P.: Chapter 19. Learning from Examples, in: Artificial Intelligence: A modern approach, Pearson, Upper Saddle River, NJ, 4th edn., ISBN: 9780134610993, 2020. a, b
Rydin, H. and Jeglum, J. K.: Peatland succession and development, in: The Biology of Peatlands, 2nd edn, edited by: Rydin, H., Jeglum, J. K., and Bennett, K. D., Oxford University Press, Oxford, 127–147, https://doi.org/10.1093/acprof:osobl/9780199602995.003.0007, 2013a. a
Rydin, H. and Jeglum, J. K.: The Biology of Peatlands, Biology of Habitats Series, Oxford University Press, London, England, 2nd edn., https://doi.org/10.1093/acprof:osobl/9780199602995.001.0001, ISBN 9780199602995, 2013b. a, b
Rydin, H. and Jeglum, J. K.: Peatland habitats, in: The Biology of Peatlands, Oxford University Press, 1–20, https://doi.org/10.1093/acprof:osobl/9780199602995.003.0001, ISBN 9780199602995, 2013c. a
Schulzweida, U.: CDO User Guide, Version 2.1.0, Zenodo, https://doi.org/10.5281/zenodo.7112925, 2022. a
Shimada, M., Itoh, T., Motooka, T., Watanabe, M., Shiraishi, T., Thapa, R., and Lucas, R.: New global forest/non-forest maps from ALOS PALSAR data (2007–2010), Remote Sens. Environ., 155, 13–31, https://doi.org/10.1016/j.rse.2014.04.014, 2014. a
Skye, J.: Peat-DBase: A Compiled Database of Global Peat Depth Measurements, Version 0.9.0, Zenodo [data set], https://doi.org/10.5281/zenodo.15530645, 2025a. a, b
Skye, J. E.: A deeper look: The development of global peat depth datasets and subsequent carbon stock estimates, Master's thesis, University of Victoria, Canada, Victoria BC, Canada, https://hdl.handle.net/1828/22314 (last access: 21 April 2026), 2025b. a, b
Skye, J., Melton, J., Goldblatt, C., Gallego Sala, A., Garneau, M., and Winton, S. R.: PeatDepth-ML: A Global Map of Peat Depth Predicted using Machine Learning, Zenodo [code], https://doi.org/10.5281/zenodo.17478716, 2025. a
Somarathna, P. D. S. N., Minasny, B., and Malone, B. P.: More data or a better model? Figuring out what matters most for the spatial prediction of soil carbon, Soil Sci. Soc. Am. J., 81, 1413–1426, https://doi.org/10.2136/sssaj2016.11.0376, 2017. a
Song, J.: Bias corrections for Random Forest in regression using residual rotation, J. Korean Stat. Soc., 44, 321–326, https://doi.org/10.1016/j.jkss.2015.01.003, 2015. a
Treat, C. C., Kleinen, T., Broothaerts, N., Dalton, A. S., Dommain, R., Douglas, T. A., Drexler, J. Z., Finkelstein, S. A., Grosse, G., Hope, G., Hutchings, J., Jones, M. C., Kuhry, P., Lacourse, T., Lähteenoja, O., Loisel, J., Notebaert, B., Payne, R. J., Peteet, D. M., Sannel, A. B. K., Stelling, J. M., Strauss, J., Swindles, G. T., Talbot, J., Tarnocai, C., Verstraeten, G., Williams, C. J., Xia, Z., Yu, Z., Väliranta, M., Hättestrand, M., Alexanderson, H., and Brovkin, V.: Widespread global peatland establishment and persistence over the last 130,000 y, P. Natl. Acad. Sci. USA, 116, 4822–4827, https://doi.org/10.1073/pnas.1813305116, 2019. a
Turunen, J., Tomppo, E., Tolonen, K., and Reinikainen, A.: Estimating carbon accumulation rates of undrained mires in Finland–application to boreal and subarctic regions, Holocene, 12, 69–80, https://doi.org/10.1191/0959683602hl522rp, 2002. a
United Nations Environment Programme: The Global Peatland Map 2.0, https://wedocs.unep.org/20.500.11822/37571 (last access: 5 November 2024), 2021. a
Wang, B. and Ding, Q.: Global monsoon: Dominant mode of annual variation in the tropics, Dynam. Atmos. Oceans, 44, 165–183, https://doi.org/10.1016/j.dynatmoce.2007.05.002, 2008. a, b, c
Wang, D.: MODIS/Terra+Aqua Photosynthetically Active Radiation Daily/3-Hour L3 Global 0.05Deg CMG V061, NASA Land Processes Distributed Active Archive Center [data set], https://doi.org/10.5067/MODIS/MCD18C2.061, 2021. a, b, c
West, R. M.: Best practice in statistics: The use of log transformation, Ann. Clin. Biochem., 59, 162–165, https://doi.org/10.1177/00045632211050531, 2022. a
Widyastuti, M. T., Minasny, B., Padarian, J., Maggi, F., Aitkenhead, M., Beucher, A., Connolly, J., Fiantis, D., Kidd, D., Ma, Y., Macfarlane, F., Robb, C., Rudiyanto, Setiawan, B. I., and Taufik, M.: Digital mapping of peat thickness and carbon stock of global peatlands, CATENA, 258, 109243, https://doi.org/10.1016/j.catena.2025.109243, 2025. a, b, c, d, e, f, g, h, i, j, k, l, m, n, o, p, q, r, s, t, u, v, w, x, y, z, aa, ab, ac, ad, ae, af, ag, ah, ai, aj, ak, al, am, an, ao, ap, aq, ar
Wiese, L., Wollenberg, E., Alcántara-Shivapatham, V., Richards, M., Shelton, S., Hönle, S. E., Heidecke, C., Madari, B. E., and Chenu, C.: Countries' commitments to soil organic carbon in Nationally Determined Contributions, Clim. Policy, 21, 1005–1019, https://doi.org/10.1080/14693062.2021.1969883, 2021. a
Wu, Y., Verseghy, D. L., and Melton, J. R.: Integrating peatlands into the coupled Canadian Land Surface Scheme (CLASS) v3.6 and the Canadian Terrestrial Ecosystem Model (CTEM) v2.0, Geosci. Model Dev., 9, 2639–2663, https://doi.org/10.5194/gmd-9-2639-2016, 2016. a
Xu, J., Morris, P. J., Liu, J., and Holden, J.: PEATMAP: Refining estimates of global peatland distribution based on a meta-analysis, Catena, 160, 134–140, https://doi.org/10.1016/j.catena.2017.09.010, 2018. a
Xu, L., Saatchi, S. S., Yang, Y., Yu, Y., and White, L.: Performance of non-parametric algorithms for spatial mapping of tropical forest structure, Carbon Balance and Management, 11, 18, https://doi.org/10.1186/s13021-016-0062-9, 2016. a
Yu, Z., Loisel, J., Brosseau, D. P., Beilman, D. W., and Hunt, S. J.: Global peatland dynamics since the Last Glacial Maximum, Geophys. Res. Lett., 37, https://doi.org/10.1029/2010gl043584, 2010. a
Zender, C. S.: Analysis of self-describing gridded geoscience data with netCDF Operators (NCO), Environ. Modell. Softw., 23, 1338–1342, https://doi.org/10.1016/j.envsoft.2008.03.004, 2008. a
Zeng, J. and Zhang, Q.: The trends in land surface heat fluxes over global monsoon domains and their responses to monsoon and precipitation, Scientific Reports, 10, 5762, https://doi.org/10.1038/s41598-020-62467-0, 2020. a, b
Zhang, G. and Lu, Y.: Bias-corrected random forests in regression, J. Appl. Stat., 39, 151–160, https://doi.org/10.1080/02664763.2011.578621, 2012. a