the Creative Commons Attribution 4.0 License.
the Creative Commons Attribution 4.0 License.
 | 10 Jun 2026
Addition of brackish water to tundra soils does not inhibit methane production: implications for Arctic coastal methane production
Alexie Roy-Lafontaine
Rebecca Lee
Peter M. J. Douglas
Dustin Whalen
André Pellerin
In Arctic regions where coastal sediments contain permafrost, global climate change drives processes such as erosion and subsidence. The contribution of these processes to carbon emissions, especially from ground subsidence, are still uncertain. Relative sea level rise can lead to more waterlogged environments, promoting anoxic degradation of organic matter but it can also lead to a greater exposure of coastal sediments to seawater. This could alter methane (CH4) production dynamics, although the controls remain poorly understood. For instance, sulfates contained in seawater may have a tampering effect on methanogenesis through competitive inhibition but the increase in microbial abundance could enhance methanogenesis. In this study, we present CH4 production rates alongside geochemical analyses in a rapidly evolving coastal landscape near the community of Tuktoyaktuk, NWT, Canada, which is located in the continuous permafrost zone. To better constrain CH4 production dynamics along the land to ocean continuum, sediment cores were collected from nearshore marine sediments and soil profiles were collected from the active layer of the coastal (intertidal) zone and inland soils. Anoxic incubations were performed, amended with brackish water to simulate the effect of seawater on the breakdown of organic matter and the production of CH4. We found marine sediments expectedly led to negligible CH4 production rates, while the inland sites showed variable rates between null and 35 nmol cm−3 d−1. The coastal (intertidal) zone had the highest rates reaching 415 nmol cm−3 d−1. Interestingly, sulfate present in brackish water and sediments did not suppress methanogenesis in the incubations of the coastal and inland zones. Analyses of stable carbon isotopes from CH4 produced in the incubation experiment indicated greater acetotrophy and higher organic matter lability in the coastal zone, possibly contributing to higher CH4 production rates. This study highlights the potential for significant CH4 emissions even with high sulfate concentrations which are classically thought to inhibit methanogenesis. This suggests that Arctic coastal microbial CH4 production might be an understudied source to the atmosphere.
- Article
(2564 KB) - Full-text XML
-
Supplement
(1320 KB) - BibTeX
- EndNote


Arctic coastal ecosystems are impacted by sea level rise, coastal erosion, land submersion, higher frequency in storm events and permafrost degradation (AMAP, 2017; Guimond et al., 2021; Irrgang et al., 2022; Lantuit et al., 2012; Lim et al., 2020). The amplification of coastal environmental changes has impacts on biogeochemical cycles (AMAP, 2017) and on organic matter (OM) degradation processes and fluxes at the land-ocean continuum (Tanski et al., 2021). Furthermore, the progressive thawing of permafrost exposes long frozen organic matter to microbial decomposition (Lapham et al., 2020; Pellerin et al., 2022; Schuur et al., 2015), leading to the release of greenhouse gases like carbon dioxide (CO2) and methane (CH4). Inputs and outputs of the Arctic carbon biogeochemical cycle are known to be reshaped by rapid environmental changes (Couture et al., 2018), but processes in coastal settings are still poorly understood.
Rates of coastal change vary according to the morphology of coastal landscapes (Manson et al., 2019). The average rate of land retreat measured in the Tuktoyaktuk Coastlands (North-West Territories, Canada), our study site, between 1985 and 2020 was −1.0 m yr−1, while processes of ground subsidence and submersion induced retreat rates higher than −4 m yr−1 (Costa et al., 2022) which can inundate large swaths of land. Inundated tundra flats and polygons are widespread landforms in the landscape (Costa et al., 2022). Polygon tundra flats are characterized by ice-wedge polygons, which are formed by the repeated thermal contraction and expansion of the upper layers of the permafrost (Steedman et al., 2017). At the surface, the polygons are expressed as minor topographic features separated by lower-lying, often wet or inundated channels called troughs (Fig. 1). Polygons can be classified as low-centered (with a low, wet center and raised rims) or as high-centered (with well-drained centers and lower well-drained rims) (Fig. 1), exhibiting strong thermal, hydrological and geochemical gradients (Vaughn et al., 2016).
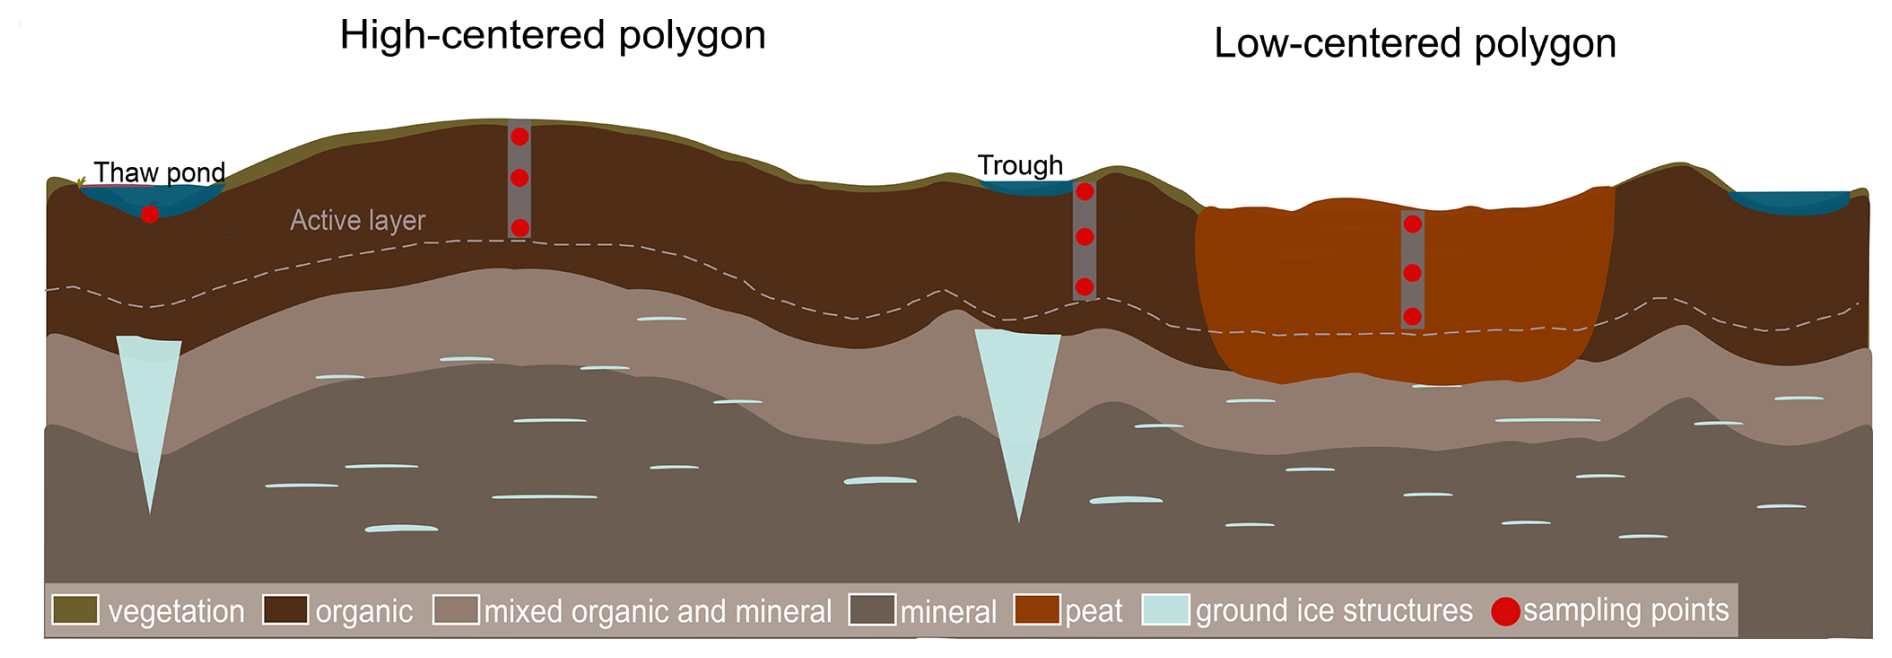
Figure 1Schematic representation of polygonal tundra with peat accumulation as seen in continuous permafrost environments and sampling design for this study. High-centered polygons are associated with drier conditions, while low-centered polygons, troughs and pondlets are associated with humid or water-saturated conditions. Vegetation cover and OM reflect the hydrology of sites. Not to scale.
During growing season, where atmospheric temperatures allow for active layer to thaw and vegetation to grow, hydrological conditions in polygons play a pivotal role in shaping the pathways of OM decomposition and consequently influence the resulting CO2 and CH4 production. Well drained oxic conditions allow microbes to decompose OM rapidly, leading to the production of CO2 (Jones et al., 2020). Conversely, water saturation restricts oxygen availability, promoting anaerobic respiration and fermentation, inducing both CO2 and CH4 production (Lipson et al., 2012; Turetsky et al., 2008). Thus, coastal changes and higher atmospheric temperatures during open-water season can swiftly alter water saturation conditions in polygons, in many cases significantly enhancing fermentation and CH4 production (Elberling et al., 2013; Holm et al., 2020; Treat et al., 2014).
Furthermore, coastal changes can also influence the chemistry of the water within soils, which can affect OM degradation. In anaerobic conditions, OM degradation processes follow a sequence of electron acceptors of decreasing energetic yields with nitrate, manganese oxides, iron oxides and sulfate as the most abundant electron acceptors (Froelich et al., 1979). It is when all alternative electron acceptors are depleted that fermentation takes place, leading to the production of CH4; methanogenesis. For example, it has long been established that in beach, estuarine, and marsh mudflats on the Brittany coast (France), organic matter (OM) degradation is dominated by sulfate reduction, as the high sulfate content of seawater inhibits methanogenesis through competitive inhibition (Winfrey and Ward, 1983). In contrast, sediments beneath thermokarst lakes are anoxic and largely devoid of alternative electron acceptors, so OM degradation is almost entirely driven by methanogenesis (Sepulveda-Jauregui et al., 2015). These examples highlight that the chemical composition of the aqueous environment plays a critical role in controlling the pathways of OM degradation. CH4 produced in soils or sediments can also be oxidized by anaerobic methanotrophic archaea and sulfate-reducing bacteria (Boetius et al., 2000; La et al., 2022) present in the soils or sediment, contributing to lower CH4 emissions in coastal environments. Thus, on or near the coast, the interaction with seawater, which contains electron acceptors such as sulfate, can shift the OM mineralization pathway and the resulting CO2 and CH4 productions. Consequently, a nuanced understanding of biogeochemical processes and their drivers is paramount in determining the magnitude of permafrost carbon emissions, especially from coastal environments.
Numerous CH4 emissions monitoring programs are in operation, but remote-sensing methods lack the ability to comprehensively capture the microbial, biogeochemical and environmental processes involved. In specific regions, estimates of methane production from the breakdown of OM is possible by carefully studying degradation pathways and production rates (Pellerin et al., 2022; Heslop et al., 2015; Knoblauch et al., 2018; Treat et al., 2014). To reduce the knowledge gap of CH4 biogeochemistry in coastal permafrost settings, we collected material from the active layer and taliks of water bodies for incubation experiments, which were coupled to physical and chemical characterizations. The main objective of this study was to assess microbial CH4 production dynamics in a coastal permafrost setting and apply it at the landscape level, since methane production is well documented in inland thermokarst but is not well understood in a land-ocean interaction context. We hypothesized that methanogenesis in coastal active layer incubations would be suppressed by the addition of sulfate. Consequently, we discuss the influence of environmental conditions on microbial CH4 production with an emphasis on brackish water addition in coastal soils and sediments along with the microbial pathways involved. We then apply these results at the landscape level to provide an estimate of CH4 production in the event that a natural process like a storm inputs brackish water over a large area of polygonal patterned ground. We use the region around Tuktoyaktuk as an example.
2.1 Site description and sampling
Tuktoyaktuk (69°26′24′′ N, 133°01′52′′ W) is located in the Inuvik region of the North-West Territories, adjacent to the Arctic Ocean in the Kugmallit Bay, east of the Mackenzie Delta. The region experiences prolonged cold winters, short cool summers, and year-round low precipitation, fostering low-arctic tundra vegetation. Lying in the continuous permafrost zone, its coastal areas feature thick Quaternary and glaciogenic unconsolidated deposits (Rampton, 1988), where permafrost thickness averages 400 m (Hu et al., 2013) and is characterized by prevalent ground ice structures (Mackay and Dallimore, 1992; Martin et al., 2018; Murton, 1996; Rampton, 1988). The area has been ice-free for the past 13 000 years, with evidence indicating that early Holocene summer temperatures were up to 6 °C warmer than today, fostering vegetation and peat accumulation (Dallimore et al., 1997; Vardy et al., 1997). During that same period, sea level was considerably lower than it is today and the Tuktoyaktuk area was located approximately 100 km inland (Vardy et al., 1997). Currently, ground subsidence and coastal erosion are major causes of rapid land retreat (Hynes et al., 2014; Lapham et al., 2020; Lim et al., 2020). Combined with sea level rise (Hill et al., 1993), it is projected that a substantial amount of terrestrial soil will become part of the ocean seafloor either by erosion and deposition or by subsidence of land and submersion. Over the past 15 years, extensive studies on Tuktoyaktuk's coastal environment, driven by the region's vulnerability to climate change, highlighted challenges for the Inuvialuit population relying on hunting, fishing, trapping and harvesting (Andrachuk and Smit, 2012).
Active layer samples were collected from two sites: an inland site, Reindeer Point (RP) and a coastal site, Toker Point (TP). Talik sediments were also collected at both RP and TP sites from polygonal troughs and pondlets and sediments from a marine site, Harbor, completed the transect from terrestrial to marine settings (Fig. 2). RP was selected as the inland site because it features a polygonal patterned ground typical of the region, and is located in a stable region not directly affected by coastal processes such as storm surges, tides, seawater intrusion, erosion etc. The thermokarst lake margin, about 300 m south of RP has remain unchanged since aerial photos began recording the evolution of the landscape in 1947 (Fig. S1 in the Supplement). TP was selected as the coastal site because of the strong coastal processes such as tides and storm surge that regularly lead to seawater intrusion in this polygonal patterned ground, strongly influenced by ground subsidence. The Harbor site was selected about 400 m offshore in the Harbor of Tuktoyaktuk where total water depth was 20 m and cold marine bottom waters were overlain by a 10 m surface brackish water layer. 25 cm sediment cores were collected using a UWITEC gravity corer. The sediments consisted of recently deposited silty sands originating from the strong erosional processes occurring in the region (Whalen et al., 2022). The site was accessible by small watercraft. At RP and TP sites, soil profiles were extracted from the active layer by digging a soil pit with a shovel. To retain an intact stratigraphic relationship, samples were taken from the wall of the soil pit. Biogenic ebullition gases were collected from pondlets at RP and TP. Pondlets were located within sampled polygonal patterned ground and are defined as small (1 to 3 m2) and shallow standing bodies of water, potentially draining seasonally. Samples were trapped using a plastic funnel attached to a 20 mL glass vial. Surface soil lying at the bottom of the pondlets (Fig. 1) were poked until the vial was filled with gas. Once full, vials were crimped with 20 mm butyl rubber stoppers and aluminum caps. Samples were kept frozen until the time of analyses.
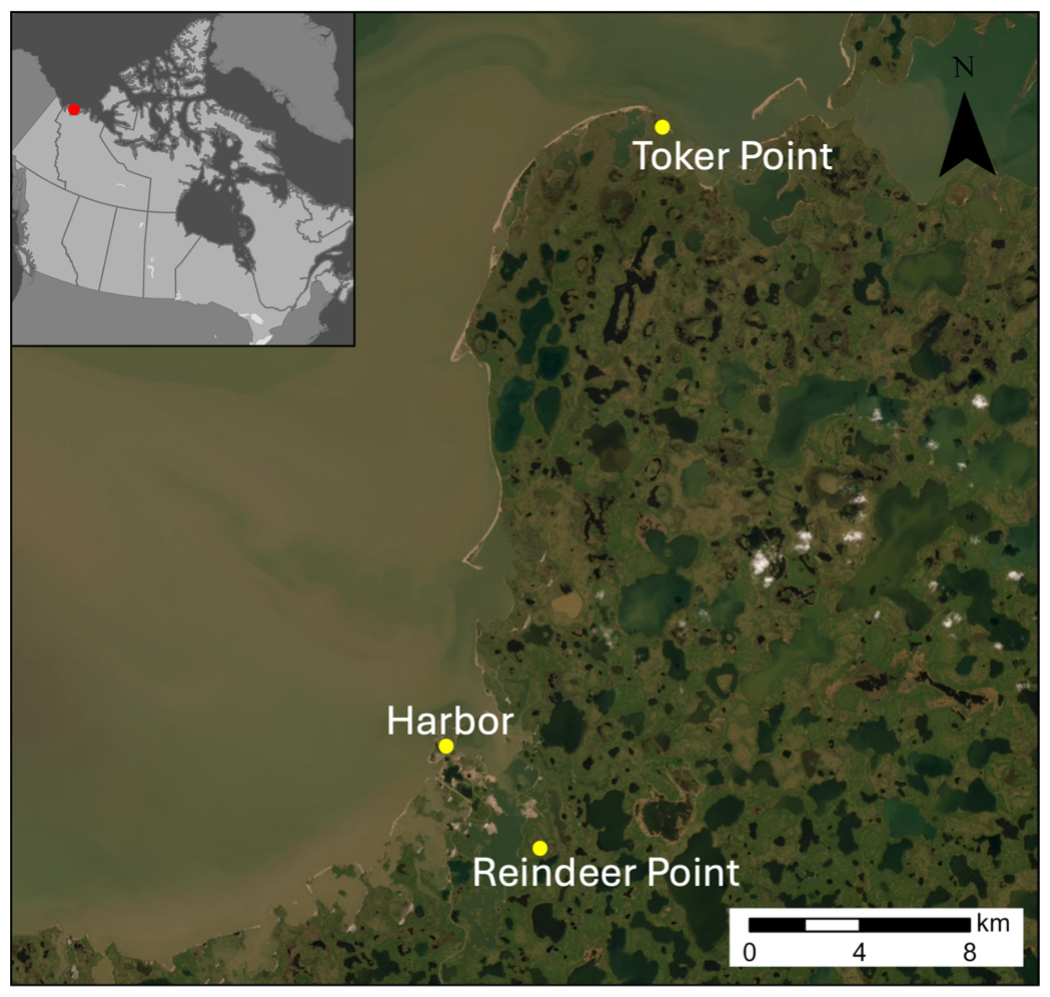
Figure 2Map of study area indicating the sampled sites with yellow dots (Esri, 2022; powered by Esri). Harbor site is located in the marine waters of Tuktoyaktuk, Toker Point site is located in the coastal (intertidal) zone and Reindeer Point site is located inland. High resolution satellite imagery and pictures of soil profiles for RP and TP sites available in the Supplement (Fig. S3).
The inland site, (RP), was located 750 m from the coast and 2 km East of Tuktoyaktuk in a polygonal patterned ground. This patterned ground is located in a depression, surrounded by elevated plateaus with observable ground water flowing into the valley. In this area, low-centered polygons exhibited higher moisture levels compared to high-centered polygons. High-centered polygons were colonized by shrubs and small flowering plants like Ericaceae, while low-centered polygons were dominated by hydrophilic plants such as grasses and sedges. Wet troughs delimited the polygons, with vegetation reflecting waterlogged conditions. The mean active layer and talik thickness across RP was about 35 cm. Profile 10A was collected from a trough and presented water-saturated conditions with brown OM. Profiles 10B and 10D were collected from high-centered polygons and characterized by unsaturated conditions with dark brown OM and presence of roots until 20 cm depth. Profile 10C was collected from a low-centered polygon and consisted of reddish-brown peat throughout. Profiles 10A, 10B and 10D did not consist of peat.
The coastal site (TP) is located 20 km NW of Tuktoyaktuk, featuring a polygonal patterned ground, largely colonized by Carex sp., a type of graminoid plant common near Arctic coastlines. The mean active layer and talik depths were 35 cm. The site's dynamics are influenced by the twice-daily ebb and flow of tides. Profile 07 was collected from a water-saturated low-centered polygon, located in the intertidal zone. The soil color was very dark greyish black. Profile 08 was collected from a water-saturated polygonal trough not immediately located in the intertidal zone, but which floods during storms The soil was characterized by dark greyish-brown OM mixed with sand. Finally, profile 09, was collected from the center of a higher-centered polygon situated in the middle intertidal zone. The active layer appeared water unsaturated. The soil from this site consisted of a mixture of black organic-rich material and sand. The sand found in samples from TP appeared to be wind-deposited from nearby dunes.
2.2 Sulfates and chloride concentrations in sediments
The extraction of sulfate and chloride from sediments and soils pore-water was conducted through a leaching experiment following Lacelle et al. (2019). Frozen aliquots of sediments and soils were thawed at 4 °C overnight, then weighed, dried in the oven at 60 °C for 24 h and re-weighed to determine the densities. Aliquots of dried material were put in 50 mL falcon tubes with nanopure water following a 1:10 ratio. Tubes were then shaken for one hour to promote leaching of anions towards the aqueous phase of the solution. Once the leaching process was done, 2 mL of the aqueous solution was filtered using 0.2 µm pore size Whatman 25 mm GD/X syringe filters and transferred in disposable microtubes. Concentrations of sulfate and chloride were measured by ion chromatography using a Thermo Dionex Integrion at UQAR's Chemistry department facilities with a limit of detection of 0.01 µg mL−1. The measured concentrations are expressed in mmol g−1 per wet-weight of material (mmol g−1 wweight−1). Only one measurement per sample was performed as stability tests revealed variability of less than 3 % between measured samples. The error on each value was calculated by the least squares method (Skoog et al., 2014).
2.3 Methane production rates in incubations
Long-term sediment and soil incubations under anoxic conditions were used to assess CH4 production rates over several months by measuring CH4 accumulation in the vials' headspace. The objective was to simulate the increased connectivity between the land and the ocean in the coastal environment of the Canadian Arctic, which represents an important aspect of the ongoing regional environmental transition. Collected sediments and soil profiles were immediately sub-sampled based on depth, at 5 or 10 cm intervals, according to shifts in sedimentary units. To prepare incubations, about 4 mL of sediment and exactly 2 mL of brackish water (collected from the coast) were immediately transferred into 20 mL glass vials. Incubation vials were crimped with 20 mm blue chlorobutyl rubber stoppers and aluminum caps. The bottles were flushed with nitrogen gas (Alpha Gaz 1) at a rate of 300 mL min−1 for 2 min in the field to replace the air with a nitrogen atmosphere. Four incubations were prepared for each sampled depth; 3 were kept for measurements of CH4 production rates (triplicates) and one served for isotopic analyses. Incubations were kept at a constant temperature of 4 °C throughout the entire 339 d incubation period with no fluctuations. Substrate concentrations were not actively controlled or monitored, aside from repeated measurements of headspace methane. For logistical reasons, we were not able to measure CH4 concentrations from the incubations in the first few weeks and the last measurement was conducted at day 339. The brackish water added to all incubations contained 5.7 ± 0.0 mmol g−1 wweight−1 of sulfate and 28.7 ± 0.5 mmol g−1 wweight−1 of chloride.
Analyses of the CH4 concentrations in the headspace of the vials were performed on a gas chromatograph (Agilent 8900) equipped with a flame ionization detector (GC-FID) at UQAR facilities. The GC-FID is equipped with a 100 µL injection loop to ensure a consistent volume of sample is analyzed. To saturate the injection loop, 300 µL are taken from the headspace of the vials and transferred to the injection loop with a gas-tight syringe. Prior to injection, samples were shaken for 30 s to equilibrate headspace and sediment gases. This procedure was done every 2 weeks for 16 weeks to measure CH4 accumulation in the headspace. The resulting production rates were calculated from the linear accumulation measured during the incubation period, and values are expressed in nmol of CH4 per cubic centimeters of wet material per day (nmol cm−3 d−1). The density of the collected samples varied widely, with some being organic deposits and peat, while others contained higher mineral content. Consequently, the CH4 production rates were expressed volumetrically to account for these discrepancies which are more representative of the volume they occupy in the soil, sedimentary columns and landscape. The limit of detection of the GC-FID is 0.3 ppm and all samples had higher concentrations. Each value represents the mean of triplicate measurements and the reported uncertainty on the measurement is the standard deviation on triplicates.
To estimate the potential total active layer CH4 production (T), the active layer production rates were vertically integrated to obtain the total CH4 production of each profile. Values are reported in mmol m−2 d−1 and were calculated using Eq. (1):
where Pi represents CH4 production rate in layer i (nmol cm−3 d−1), ei represents the thickness of layer i (cm) and n represents the numbers of layers in the profile.
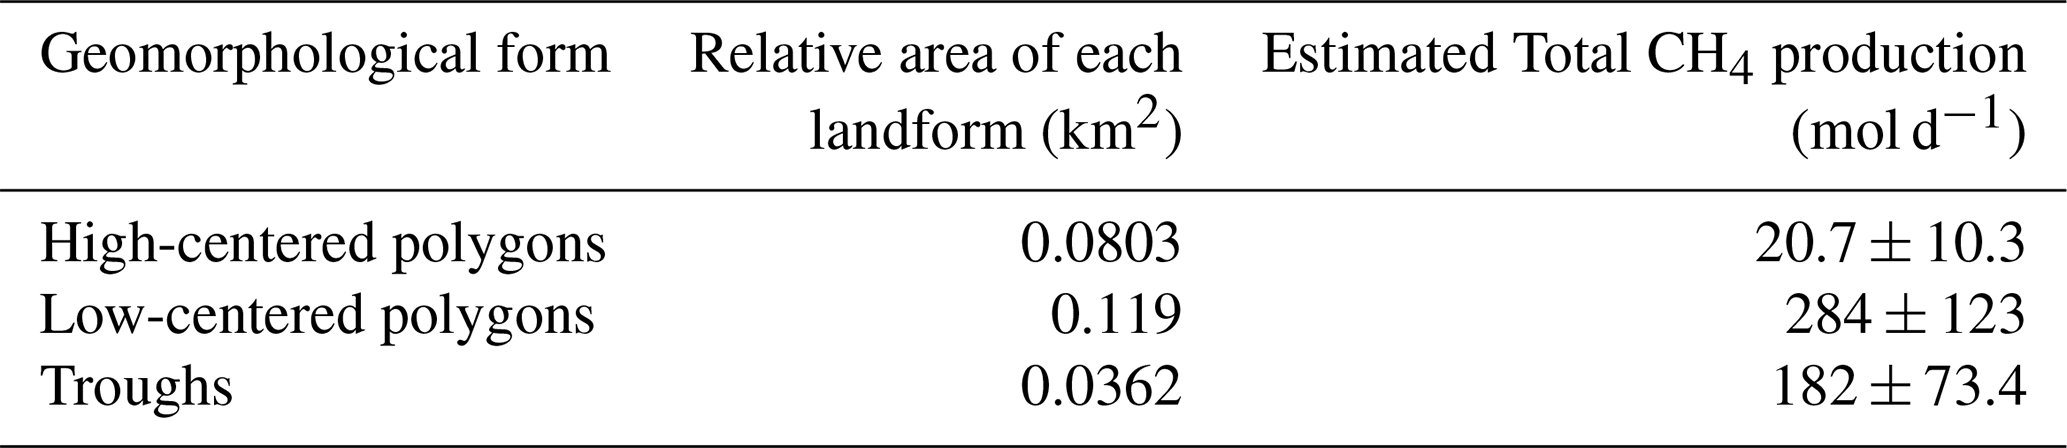
Using aerial imagery from 2022, the polygonal tundra at RP was mapped in QGIS, allowing for the discrimination between high-centered polygons, low-centered polygons and throughs (Fig. S2). The total area of each geomorphological form was calculated based on the map data (Table S1). Landforms total areas were multiplied by the corresponding potential total active layer methane production (T) to estimate the total CH4 produced in the polygonal tundra of RP over a day (mol d−1).
2.4 Elemental and isotope composition of the sediment
The total organic carbon (TOC) content of the sediments was measured by combustion using an elemental analyzer (ECS 8020, NC Technologies) combined with a gas chromatograph equipped with a thermal conductivity detector at ULaval facilities (The International Research Laboratory Takuvik). A 100 mg aliquot of sediment was thawed and weighed for each sample. They were then dried in an oven at 60 °C for 48 h and re-weighed to determine their water content. Sediments were then ground using a granite mortar pestle and homogenized using a 1.18 mm pore size sieve to remove roots and rootlets. Instruments were cleaned with ethanol between manipulations. Inorganic carbon was removed from sediments by adding 2.2 mL of 12 M HCl in every sample. After reacting for 24 h, around 8 mg was encapsulated in tin foil capsules. Samples were kept in a desiccator until analyses. Values are expressed as % of carbon contained in the weighed sample (wt %).
The organic carbon (δ13C-TOC) isotopic compositions were measured at UOttawa facilities (Jàn Veizer Stable Isotope Laboratory) using EA-IRMS (Delta Advantage, Thermo Germany). The sample preparation method was the same used for elemental analyses. δ13C-TOC values are denoted as δ ‰ =103 ((Rsample/Rstandard) − 1), where R is 13C 12C and standards refer to the Vienna Pee Dee Belmnite (VPDP).
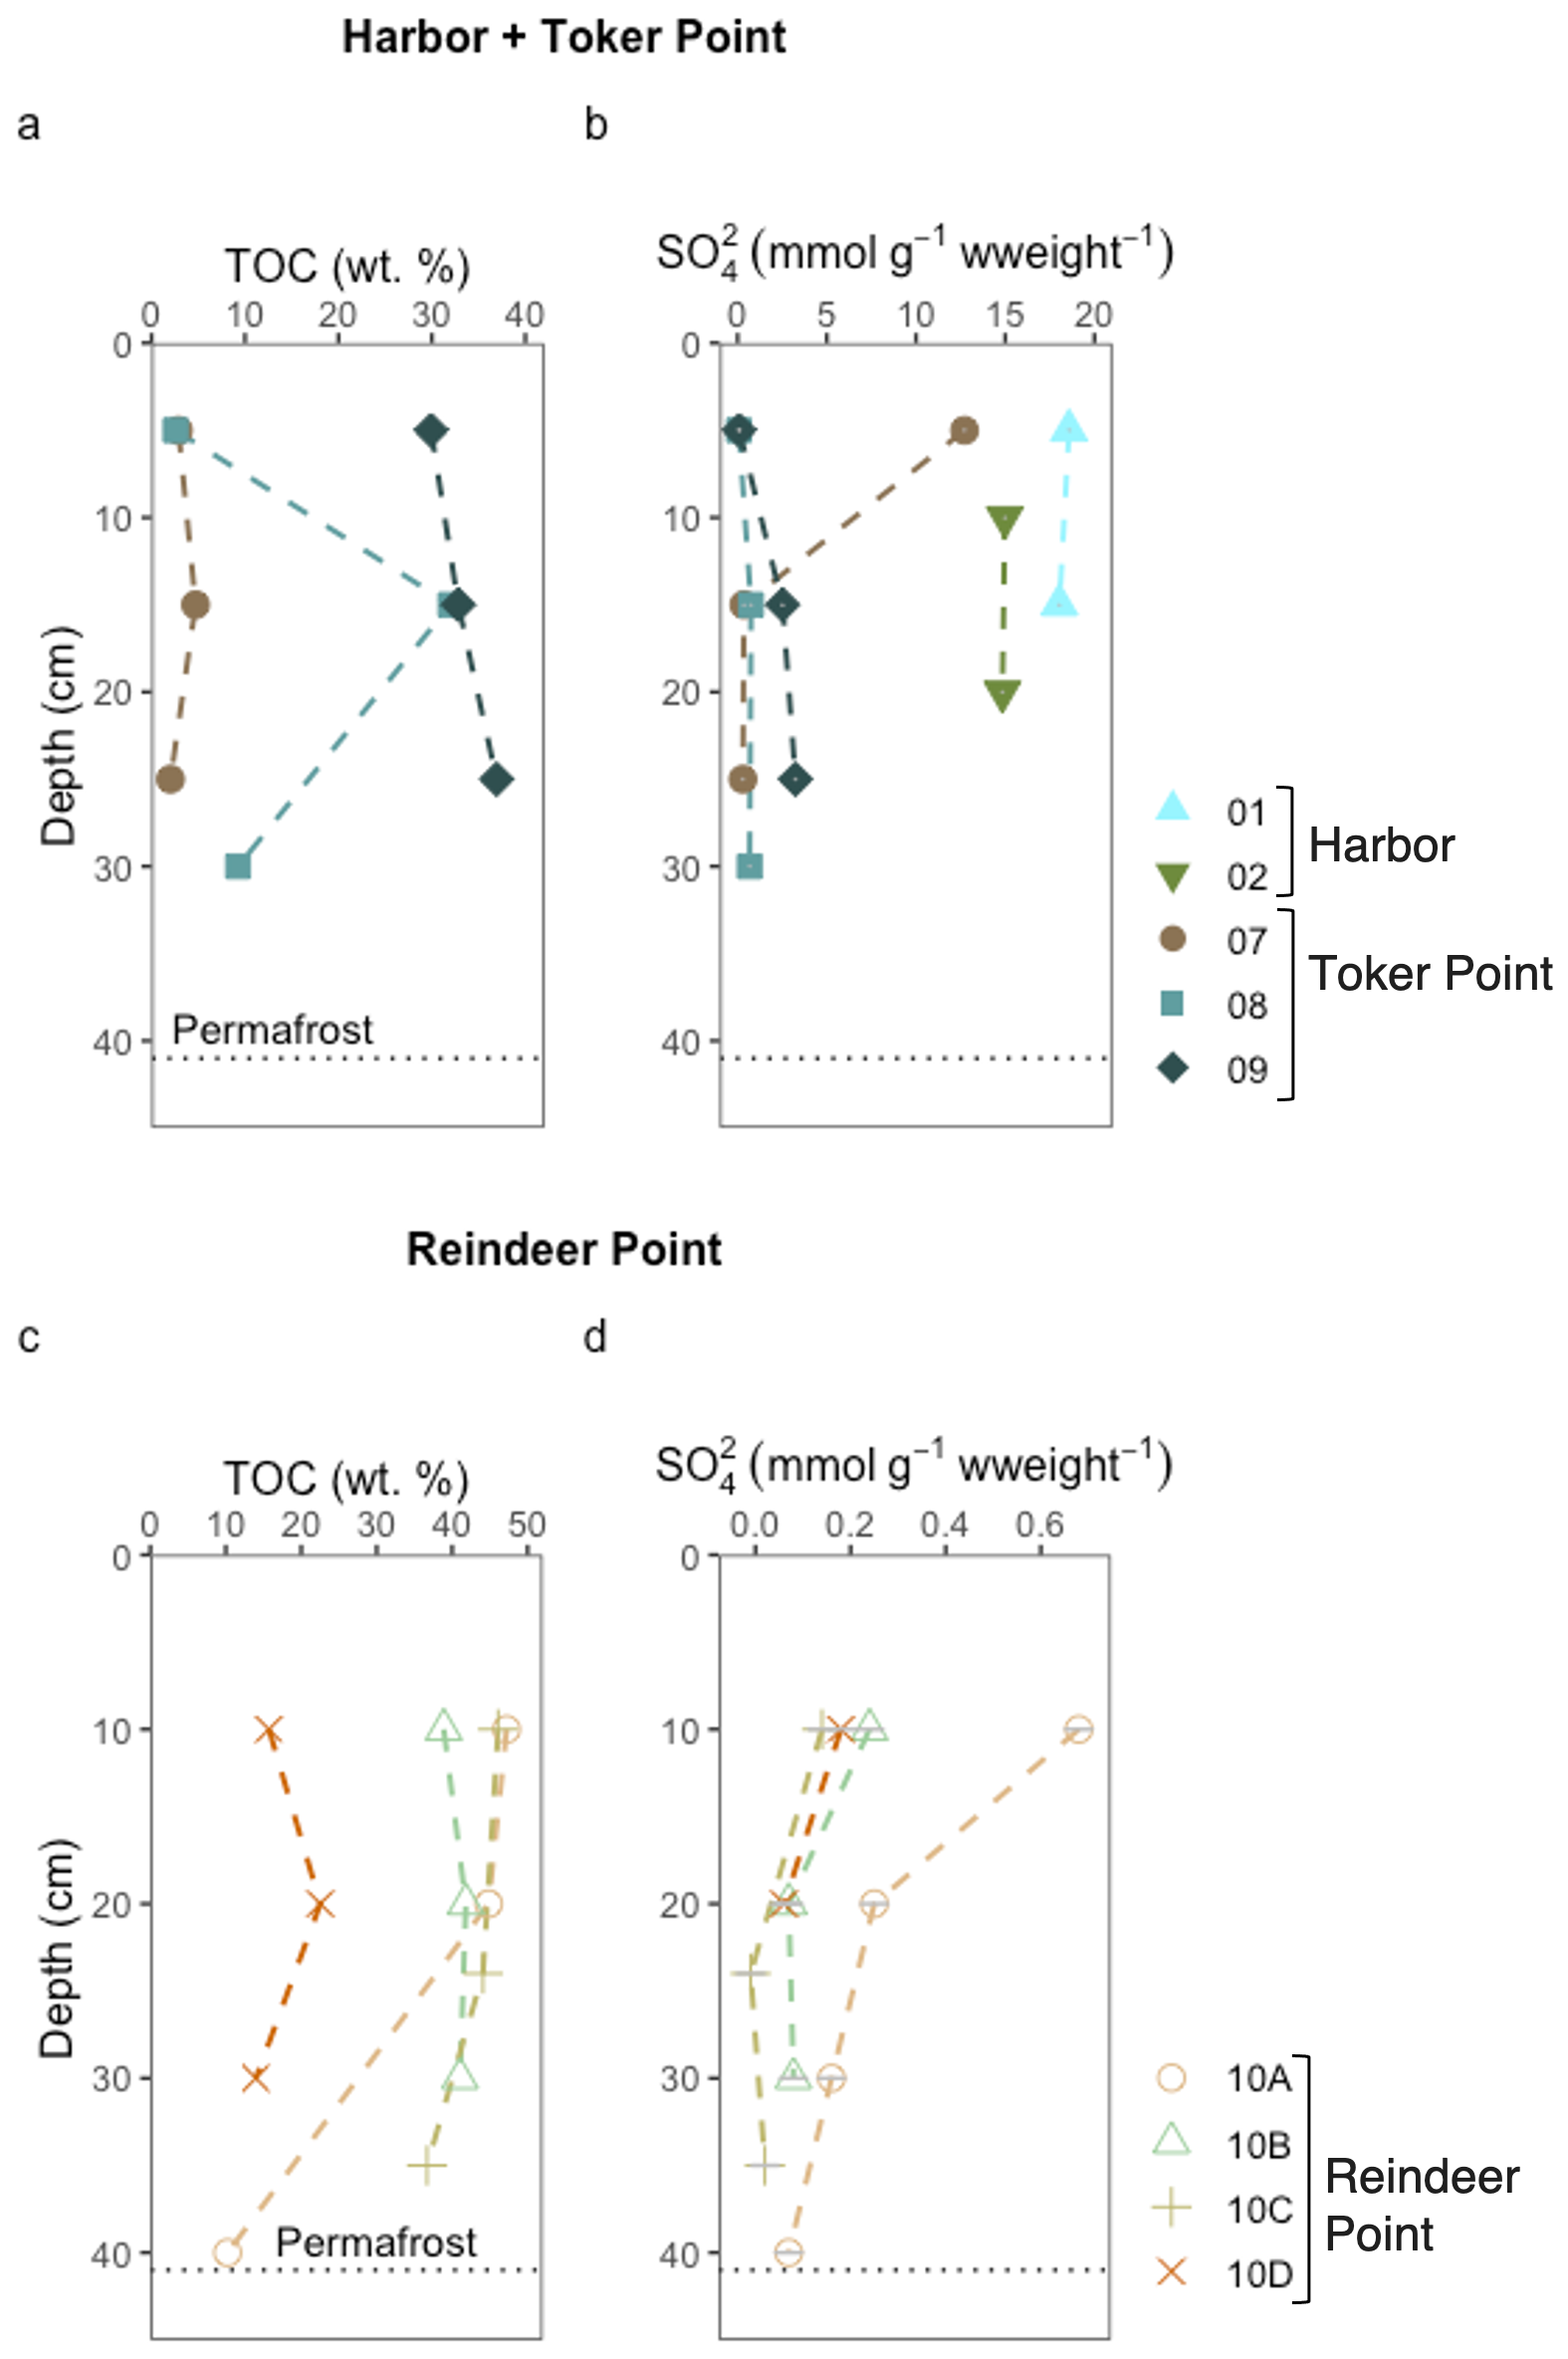
Figure 3Total organic carbon and sulfate (SO) concentrations in sediment or soil of different sites in this study. The datasets are separated into two for clarity. The upper part of the figure (a, b) displays the data of the marine site Harbor (profile 01 and 02), and the coastal site, Toker Point (profile 07, 08 and 09). The lower part of the figure (c, d) displays the data from the inland site Reindeer Point (profile 10A, 10B, 10C and 10D). The black horizontal dotted line in each graph represents the permafrost-active layer or talik interface except for the Harbor site, where the talik is much deeper but not measured. TOC data from Harbor site is not available. A uniform color pattern is used throughout this manuscript.
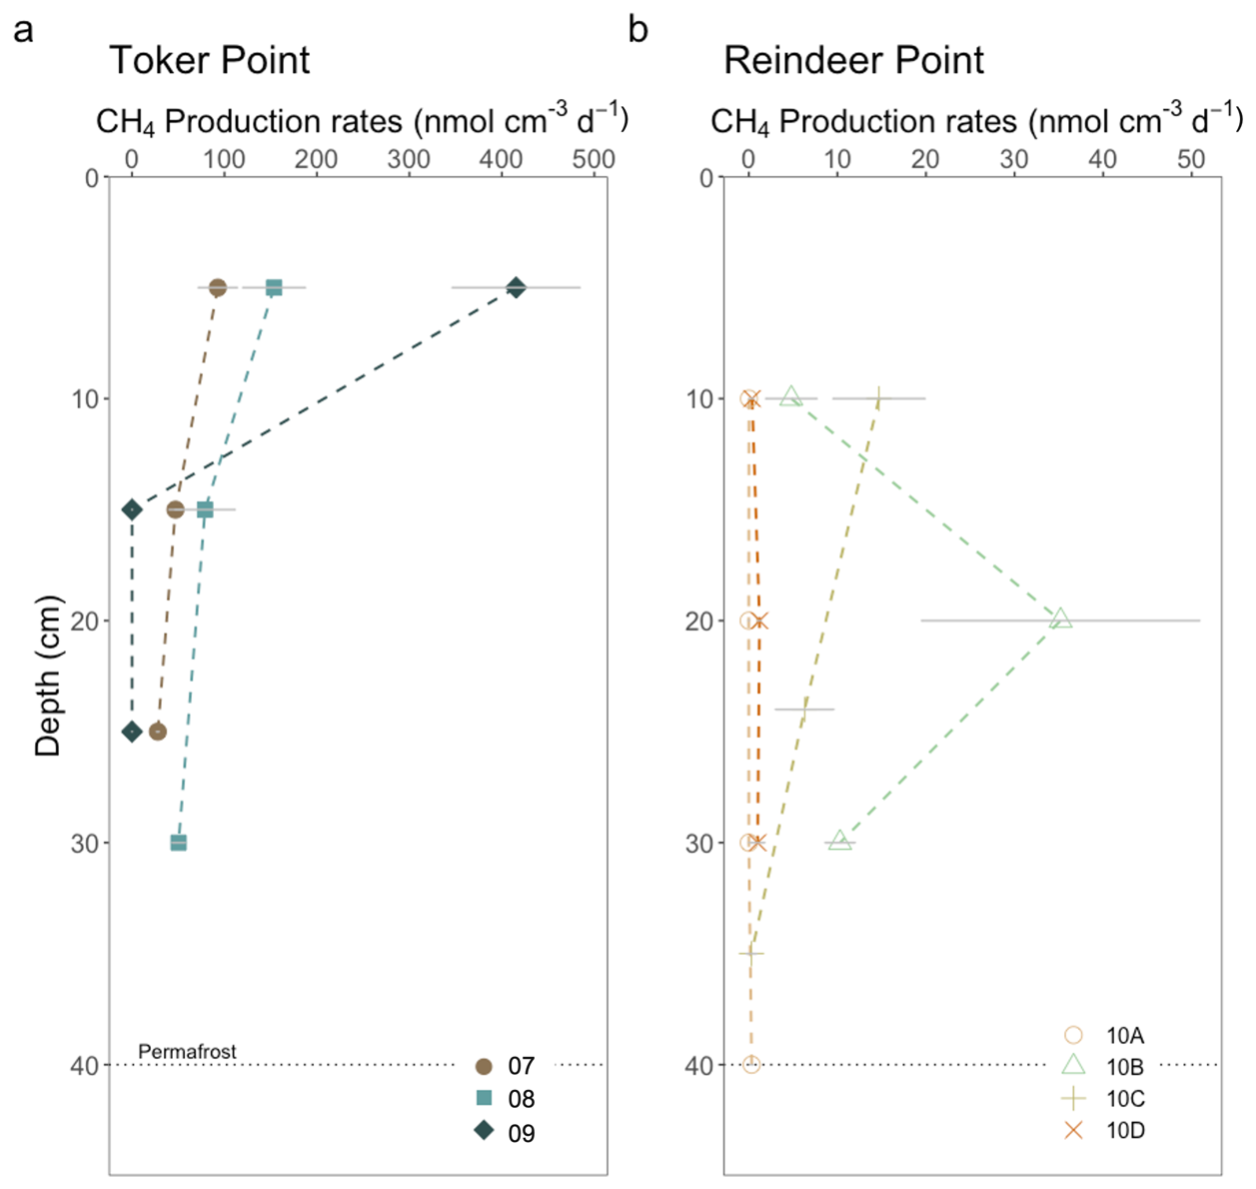
Figure 4CH4 production in incubations of soil and sediment with brackish water from (a) TP and (b) RP. Each datapoint represent the mean value of three incubations. The error bars in grey lines are equal to the standard deviation of the three separate incubations. Each profile corresponds to a specific landform. At Toker Point (a), profile 07 is from a low-centered polygon, profile 08 is from a trough and profile 09 is from a high-centered polygon. At Reindeer point (b), profile 10A is from a high-centered polygon, profile 10B is from a trough, profile 10C is from a low-centered polygon and profile 10D is from a high-centered polygon.
2.5 Stable carbon isotopic composition of methane
One incubation vial was analyzed for stable carbon isotopic composition of headspace methane (δ13C–CH4). Stable carbon from methane ebullition samples collected from pondlets were also analyzed. Both types of samples were analyzed with a cavity ring-down spectrometer (PICARRO G2201-i isotopic CO2 CH4) equipped with a 16-port distribution manifold and small sample introduction module (SSIM) at McGill (McGill Isotope Biogeochemistry Laboratory). Incubations were kept at 4 °C in the dark for 8 months to let the microbial community stabilize and produce sufficient CH4 for analysis. To stay in the detection range of the analyzer (1.8–1000 ppm CH4), a small volume of the headspace, proportional to CH4 concentration in sample, was drawn from the incubation vial (0.2–6 mL). The sample was introduced to the 16-port manifold with a 21 G needle connected to a disposable luer lock plastic syringe. Samples were diluted with zero air by the SSIM to reach a volume of 20 mL. Two or three measurements per sample were conducted depending on headspace concentration. Ebullition gases samples were analyzed following the same method. Measured values were corrected with internal certified methane standards (−59 ‰ and −42 ‰ ) from AirLiquide and stability of the analyzer was tested with injections of ambient air. Measured values were more precise than ±1.2 ‰. All δ13C–CH4 values are expressed relatively to VPDB. While those isotopic analyses results provide valuable insight into methane cycling processes, they should be interpreted with caution in the absence of biological replication.
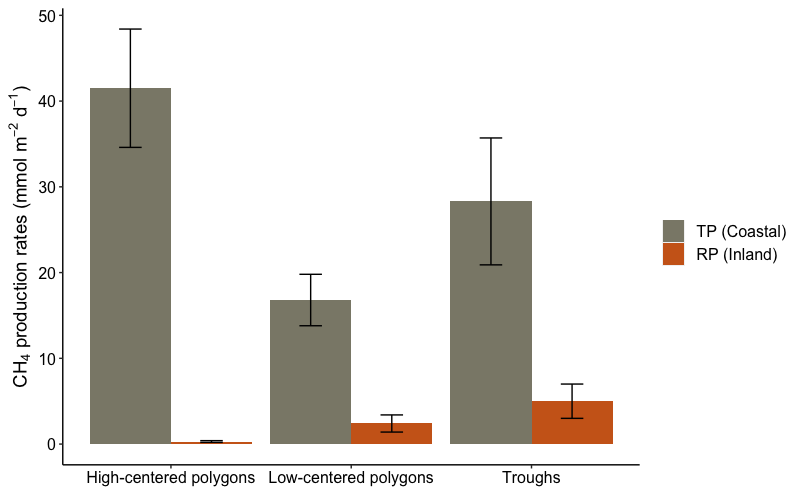
Figure 5Total CH4 production rates (T) at Toker Point (Coastal) and Reindeer Point (Inland) organized by geomorphological forms of high-centered polygons, low-centered polygons and throughs. High-centered polygons at RP is the mean of two profiles. All other landforms at RP and TP are one profile. The uncertainty on T is propagated from the uncertainty of individual CH4 production rates, not averages from replicate sites.
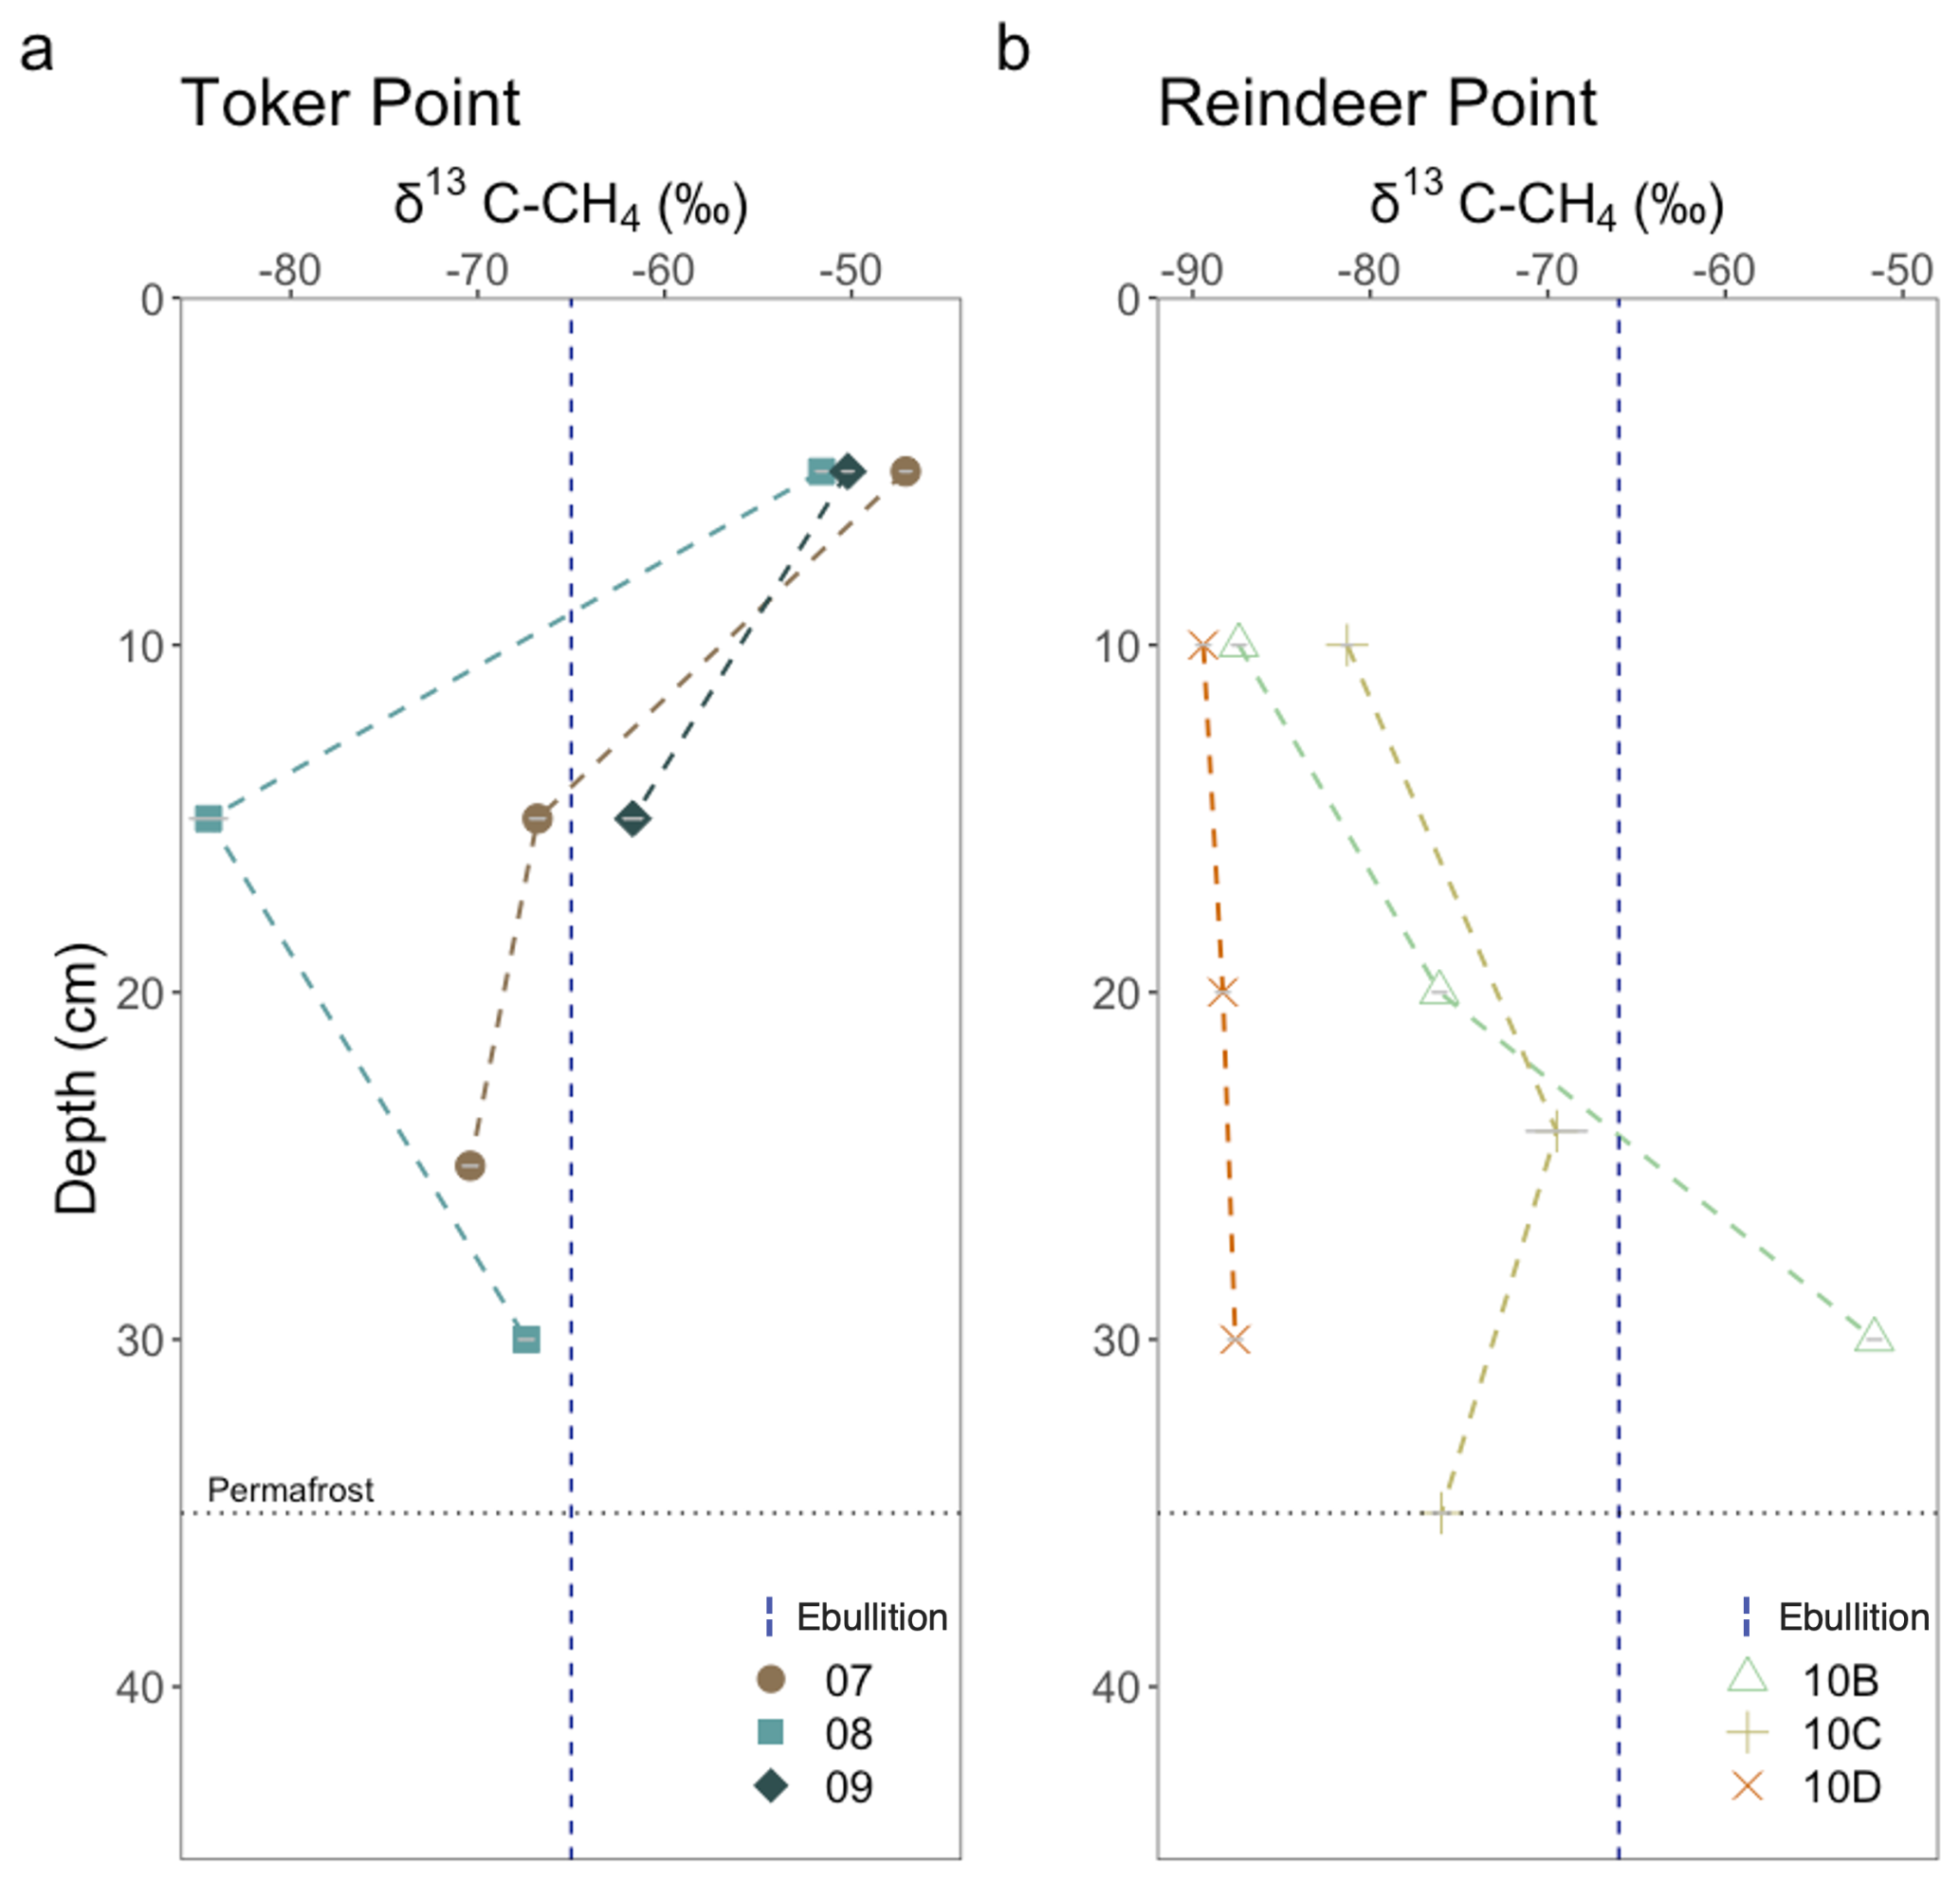
Figure 6Isotopic composition of CH4 produced in brackish water incubations from (a) TP and (b) RP. Each datapoint corresponds to the mean value of two or three measurements done on one incubation, depending on the headspace concentration. The dashed vertical lines correspond to in situ ebullition CH4 collected in pondlets at each sampling site (n = 1). These values give information on the pathways used by the soil microbes to produce CH4. δ13C between −65 ‰ and −50 ‰ is typically associated with acetoclastic methanogenesis, while δ13C between −110 ‰ and −60 ‰ is associated with hydrogenotrophic methanogenesis (Hornibrook et al., 1997, 2000). The grey error bars on each point represents the analytical uncertainty on the measured value. If not visible, the uncertainty is smaller than the point.
3.1 Soil description and composition
TOC content in the sampled soils ranged from 2 wt % to 47 wt %, with no clear trend in relation to depth (Fig. 3a, c). The RP polygonal patterned ground featured organic soils with TOC content ranging from 14 wt % to 47 wt % (Fig. 3c). The TP coastal polygonal patterned ground also featured organic soils with TOC content ranging from 2 wt % to 37 wt % (Fig. 3a).
RP, the inland site, had low sulfate and chloride concentrations relative to TP, the coastal site (Figs. 3b, d and S2). Sulfates at RP ranged from null concentrations to 0.68 ± 0.03 mmol g−1 wweight−1, while at TP, profiles exhibited varying concentrations and patterns in relation to depth. Sulfate concentrations, ranged from 0.07 ± 0.03 to 12.72 ± 0.03 mmol g−1 wweight−1. Profile 07, the low-centered polygon, exhibited the highest sulfates concentrations of all TP site at its surface (12.72 ± 0.03 mmol g−1 wweight−1), with concentrations decreasing drastically with depth, reaching 0.29 ± 0.03 mmol g−1 wweight−1 at 25 cm (Fig. 3a). In profile 09, the high-centered polygon, sulfate concentrations increased with depth ranging from 0.09 ± 0.03 mmol g−1 wweight−1 at 5 cm to 3.2 ± 0.03 mmol g−1 wweight−1 at 25 cm. Finally, profile 08, characterized as a polygonal trough, had sulfate concentrations ranging from 0.07 ± 0.03 to 0.75 ± 0.03 mmol g−1 wweight−1. The highest sulfate concentrations measured in this study were found in the sediments of the Harbor site, with a mean value of 16.6 mmol g−1 wweight−1 (Fig. 3a).
3.2 Methane production
Rates of CH4 production in incubations of sediment and soil with brackish water were undertaken at the three studied sites: RP, TP and Harbor. Production rates ranged from null to 415.4 ± 69.2 nmol cm−3 d−1 (Fig. 4) throughout all samples in this study. At RP, the maximum CH4 production rate of 35.2 ± 15.7 nmol cm−3 d−1 was measured in the trough profile (10B) at a depth of 20 cm. Lower values were obtained for the surface and at the talik-permafrost interface. The low-centered polygon (10C) had its maximum CH4 production rate in the surface, decreasing with depth. High-centered polygons (10A and 10D) had very low production rates along their depth profiles ranging between null to 1.2 ± 0.2 nmol cm−3 d−1. Both water-saturated trough and low-centered polygon (10B, 10C) had relatively high CH4 production rate compared with the high-centered polygon profiles (10A, 10D), which were water-unsaturated.
At TP, a maximum CH4 production rate was recorded in profile 09, the high-centered polygon at 415.4 ± 69.2 nmol cm−3 d−1 at the uppermost depth but it quickly decreased in the subsurface. Profile 08, the trough, and profile 07, the low-centered polygon, had lower sub-surface CH4 production rates, but rates decreased less drastically with depth with values being relatively high at the permafrost-talik and permafrost-active layer interface, respectively. Profile 07 had values ranging from 27.9 ± 1.5 to 92.8 ± 21.2 nmol cm−3 d−1 and profile 08 had values ranging from 50.4 ± 7.2 and 153.7 ± 33.9 nmol cm−3 d−1 (Fig. 4). In general, at TP, the coastal site, much higher CH4 production rates were measured than at RP, the inland site (Fig. 4). The mean CH4 production rate measured at RP was 5.7 nmol cm−3 d−1, while at TP it was 96.2 nmol cm−3 d−1. The incubations with silty-clay Harbor sediments did not have measurable CH4 production rates (Fig. S5).
Estimated total CH4 production rates were calculated for each geomorphological landforms of RP and TP sites. At RP, the total CH4 production estimated for the high-centered polygons (profile 10A and 10D), low-centered polygon (profile 10C) and trough (profile 10B) were 0.3 ± 0.1, 2.4 ± 1.0 and 5 ± 2 mmol m−2 d−1, respectively (Fig. 5). At TP, the total CH4 production estimated for the high-centered polygon (profile 09), the low-centered polygon (profile 07) and the through (profile 08) were 41.5 ± 6.9, 16.8 ± 3.0 and 28.3 ± 7.4 mmol m−2 d−1, respectively (Fig. 5). In all landforms, the total CH4 production rates were higher in the coastal site, TP, than the inland site, RP.
3.3 Isotopic composition of 13C–CH4
In parallel with CH4 production rates, one incubation vial per depth was used to measure the stable carbon isotopic composition of the CH4 produced. At RP, the δ13C–CH4 of the first sampled depth (10 cm) ranged from −81.3 ‰ to −89.4 ‰ . At TP, the coastal site, the δ13C–CH4 signature of the first sampled depth (5 cm) ranged from −47.1 ‰ and −51.6 ‰ . The values cluster together based on site, suggesting surface OM degradation processes are most similar within sites than between sites (Fig. 6). Profiles at RP became progressively enriched in 13C with depth, except for profile 10C where a more depleted value was observed at 35 cm. Conversely, at TP, profiles became depleted in 13C with depth, except for profile 08 where an enrichment was measured between 15 and 30 cm.
Ebullition samples from pondlets were also measured for stable isotopes. The ebullition samples represent the net δ13C signature of methane produced in the sediments of pondlets at RP and TP. At RP, CH4 ebullition from a sampled thaw pond had a δ13C of −66.1 ‰ (Fig. 6). At TP, CH4 ebullition from a sampled pondlet had a δ13C–CH4 of −65.0 ‰ (Fig. 6).
4.1 Addition of brackish water to anoxic incubations did not strongly suppress methanogenesis
Before discussing the effects of brackish water addition in incubation experiments, it is important to clarify the role of sulfate measured in situ within soil and sediment profiles. Across the studied sites, sulfate concentrations varied with depth and between landforms; however, this spatial variability did not show a consistent relationship with methane production rates measured in the incubations (Fig. S4). A few layers clearly contained higher sulfate amounts. However, layers characterized by higher or lower sulfate concentrations did not systematically correspond to lower or higher CH4 production, indicating that in situ sulfate availability alone does not explain the observed patterns in methane production across profiles. This interpretation is subject to important limitations. Sulfate and chloride concentrations were measured at single points within each profile and were not replicated across multiple locations within the same landform, preventing resolution of fine-scale spatial heterogeneity in electron-acceptor availability. As a result, sulfate concentrations are interpreted here as first-order indicators of geochemical context rather than as spatially representative or mechanistic controls on methane production. Given these constraints, we focus the following discussion on the experimental addition of sulfate via brackish water during anoxic incubations, which evaluate how episodic marine influence may affect methane production potential in coastal permafrost environments.
Despite the addition of brackish water containing sulfate to incubations, the range of CH4 production rates measured in this study is consistent with reports for anaerobic incubations of recently thawed permafrost soils, suggesting that the input of brackish water to some costal systems may not inhibit CH4 production. For example, in the talik of Big Trail Lake, a young thermokarst lake in the interior of Alaska, CH4 production rates based on incubations ranged between 4.7 and 16.1 nmol cm−3 d−1 (Pellerin et al., 2022), while in incubations from Vault Lake, another thermokarst lake in the interior of Alaska, CH4 production rates varied between 11.1 and 275 nmol cm−3 d−1 (Heslop et al., 2015). In active layer incubations from the Yamal Peninsula in NW Siberia (Russia), CH4 production rates of incubations varied between 0.1 and 33.8 nmol cm−3 d−1 (Heyer et al., 2002). This indicates that overall, the CH4 production rates measured at both TP and RP are within the range observed in typical ice-rich permafrost settings and reasonable for the environment studied (Fig. 4). We note that our experimental design did not include parallel incubations without brackish water or with sulfate concentration gradients; therefore, our interpretation relies in part on comparison with previous incubations of Tuktoyaktuk soils conducted without brackish water addition (Lapham et al., 2020) and should be regarded as exploratory rather than definitive. Lapham et al. (2020) conducted sediment incubation experiments using a core collected from the coast of the Tuktoyaktuk Peninsula. In their study, CH4 production was measured under anaerobic conditions at 15 °C, without the addition of water, over a 35 d period. The reported CH4 production rate was 0.07 nmol cm−3 d−1. Although their incubations were performed over a shorter duration and at a significantly higher temperature than those in the present study, the measured rate reflects CH4 production under relatively natural, unamended conditions. This value is comparable to the lowest CH4 production rates measured in our incubations at both the coastal (TP) and inland (RP) sites and provides a useful reference for CH4 production under unamended conditions.
The novel aspect of this study is that it attempts to understand marine influence on OM degradation by addition of brackish water to sediment and soil incubations of a fully marine site (Harbor), one that is periodically submerged (TP) and never submerged (RP). This simulates the input of seawater to the active layer and taliks of tundra soils (RP) as well as providing reference sites with a high marine influence (Habor and TP). We hypothesized that the addition of locally obtained brackish water, which contained sulfate (5.7 mmol L−1), to the incubations, would suppress CH4 production in RP, the inland site and potentially also at TP, the coastal site. This reasoning is because supplying sulfate to low sulfate organic-rich sediment would promote sulfate reduction, which is thermodynamically more favorable than methanogenesis, thereby competitively inhibiting it (Lovley and Klug, 1983; Oremland and Polcin, 1982). This hypothesis is also consistent with field observations; organic matter mineralization in brackish wetlands is consistently dominated by bacterial sulfate reduction (Bridgham et al., 2012; Torres-Alvarado et al., 2005) where little to no CH4 emissions are observed (Pönisch et al., 2023; Petersen et al., 2023; Kroeger et al., 2017). However, recent field studies show that in coastal permafrost soils, inundation and low sulfate concentrations do not necessarily suppress methanogenesis (Jenrich et al., 2025; Jenrich et al., 2024; Yang et al., 2023). These contrasting observations reveal a key knowledge gap in how marine influence controls carbon mineralization pathways in permafrost systems. By experimentally testing brackish water additions across sites with contrasting marine exposure, our study provides new mechanistic insight into the regulation of OM degradation and CH4 production under ongoing Arctic coastal change.
RP had low sulfate concentrations before addition of the brackish water but so did many of the profiles from TP (Fig. 3). In the Harbor sediments, no methane production was observed (Fig. S5). This is consistent with the competitive inhibition of methanogenesis by energetically favorable redox reactions with electron acceptors like oxygen, nitrate, iron oxides or sulfate that is typical of marine systems e.g. (Martens and Berner, 1974) as well as the potential for anaerobic oxidation of methane (AOM). Given that the Harbor sediments already had high sulfate concentrations, the lack of methane production with addition of brackish water was expected. However, strong CH4 production was observed in the incubations of both the coastal site TP and the inland site RP, indicating that CH4 production was not halted by the addition of sulfate via the brackish water addition at those sites. While sulfate reduction rates were not measured and therefore not demonstrated directly in our incubations, a strong sulfide smell was recorded when opening most of the incubations at the end of the experiment. This observation may indicate the coexistence of sulfate reduction and methanogenesis during the incubations. However, to rigorously assess this observation, future studies should include tracer-based sulfate reduction assays and microbial functional gene analysis.
Coexistence of sulfate and methanogenesis within complex sediment systems such as estuarine, coastal and salt marsh sediments, as well as thermokarst lasens has been widely reported (Lovley and Klug, 1983; Oremland and Polcin, 1982; Sela-Adler et al., 2017; Yang et al., 2023). Two main mechanisms are invoked to explain this co-existence in our incubation experiment: (1) noncompetitive methanogenesis (i.e. methylotrophic methanogenesis) and (2) syntrophic methanogenesis. (1) Noncompetitive substrates are substrates like methanol and methylamines that are used by methanogens alone and cannot be used with electron acceptors like sulfate (Lovley and Klug, 1983; Oremland and Polcin, 1982). Noncompetitive substrates are thus microbially converted to CH4, even in sediments with high sulfate concentrations (Maltby et al., 2018; Yuan et al., 2019). For example, in salt marshes, where high sulfate concentrations are often found, elevated CH4 emissions are suggested to mainly stem from noncompetitive methanogenesis (Comer-Warner et al., 2022; Poffenbarger et al., 2011; Yuan et al., 2019). In the sulfate reducing zone of sediments from the Baltic Sea, where ample sulfate is found in the porewaters, seasonal methanogenesis rates were measured up to 1.3 nmol cm−3 d−1 due to noncompetitive substrates (Maltby et al., 2018). In permafrost soils, methanol, methylamines and the microorganisms capable of degrading them have been observed but their concentrations are typically low (Coolen and Orsi, 2015; Kramshøj et al., 2018). However, our study sites are on a coast undergoing a rapid transgression which may be driving imbalances between substrate supply and microbial abundances. The rates of methane production observed at RP and TP of up to 154 nmol cm−3 d−1 contrast with reported values for methylotrophic methanogenesis (Maltby et al., 2018). Based on these numbers, noncompetitive substrates likely play a small role in the total methane production at our study sites but further investigation into methylotrophic methane production in coastal environments will allow to document the overall role of methylotrophic methane production in coastal permafrost settings.
(2) Syntrophic methanogenesis occurs when molecular hydrogen produced by acetoclastic sulfate-reducing bacteria is used by hydrogenotrophic methanogens. In this syntrophy, the chemical energy is shared via interspecies hydrogen transfer (Ozuolmez et al., 2015). For instance, in permafrost soils of Sweden, it was demonstrated that syntrophic methanogenesis was favored in anoxic and water-saturated soils by an elevated abundance in methanogens and their syntrophic partners (Keuschnig et al., 2022). As the incubation experiment in our study at RP and TP featured water-saturated and anoxic environments, syntrophic methanogenesis could participate in the co-occurrence of sulfate-reduction and methanogenesis. This mechanism is consistent with most incubations producing methane with a δ13C value in the range of hydrogenotrophic methanogenesis (see below).
Measuring methane production through incubations inherently has limitations as they prevent continuous inputs of microorganisms, fresh OM and nutrients that would occur in the natural environment. This can create a “bottle effect”, which leads to restrictions in microbial community composition, limits the input of nutrients and leads to the accumulation of metabolites which would normally be degraded (Ionescu et al., 2015). Typically, overestimation of microbial processes rates is observed compared to in situ data (Sherr et al., 1999). The overestimation of CH4 production rates by incubations relative to the in situ rates are difficult to assess because of a lack of data in permafrost environments (Heslop et al., 2020). Furthermore, a lag time between the start of anaerobic incubations and maximum CH4 production rate is widely documented, which appears to be the case for both active layer and thawed permafrost incubations (Holm et al., 2020; Knoblauch et al., 2018; Knoblauch et al., 2013; Roy Chowdhury et al., 2015). Drier or water-unsaturated conditions lead to a longer lag time before the onset of maximum CH4 production (Treat et al., 2014). Microbial community composition in the soil or sediment also exerts a strong control on the organic carbon degradation and has been shown to change throughout the incubations (Holm et al., 2020). Low initial methanogen population in soils can contribute to this lag time, but other factors such as disturbance of sediment during sampling, substrate availability and redox state can also contribute to the observed lag time in some incubations (Treat et al., 2014; Roy Chowdhury et al., 2015).
Furthermore, it is also possible that a “priming effect” from the addition of brackish water in incubations could have supercharged OM degradation with marine organic carbon, nutrients and microorganisms (Bianchi, 2011), which may have enhanced CH4 production. However, this priming effect was not observed in the Harbor sediments which were amended with the same brackish water. Furthermore, CH4 ebullition samples collected from pondlets adjacent to RP and TP exhibited broadly similar δ13C values to methane produced in incubations (Fig. 6), suggesting a similitude in microbial degradation pathways to methane in situ and in the incubations. Despite these uncertainties, our dataset shows clear depth trends and landscape-level variations, indicating that even under brackish water addition, local conditions will strongly influence CH4 production.
4.2 CH4 production pathways depend on hydrology and organic matter lability
The addition of brackish water resulted in incubation conditions being water-saturated in all cases, but it appears that biological and hydrological conditions of the polygonal patterned grounds influenced the magnitude of CH4 production, nonetheless.
In all landforms, CH4 production rates were lower at the inland site, RP than at TP, the coastal site (Fig. 4). Inland, low-centered polygons and troughs have typically higher CH4 fluxes than unsaturated landforms like high-centered polygons (Roy Chowdhury et al., 2015; Martin et al., 2018; Zheng et al., 2018) which indicates they may also have higher CH4 production rates. Within sites in our study, brackish water amended incubations of high-centered polygon soils had lower CH4 production rates, while brackish water amended incubations of troughs and low-centered polygons had higher CH4 production rates (Fig. 4). This indicates that for the degradation of organic matter into CH4 in tundra soils, increasing seawater interactions through coastal processes, such as submersion due to subsidence or increased storm severity, resulting in the input of seawater in terrestrial soils, does not halt CH4 production. It also shows that landforms and local hydrology remain important in controlling the microbial communities which affects the resulting CH4 production. Differences among landforms and sites are generally large and clearly exceed the range of variability as shown by the uncertainty, supporting the use of means with standard deviations to convey contrasts without formal statistical tests. This approach allows us to highlight pronounced differences in methane production potential and geochemical context across coastal and inland sites.
Marine OM and nutrient inputs from tides and storm surges may contribute to the higher lability of OM and could fuel greater fermentation (Valdemarsen and Kristensen, 2010). It was reported that 8.7 % of the organic carbon in nearshore sediments of Herschel Island, Beaufort Sea, came from marine sources (Couture et al., 2018). This is relevant for the TP site because while δ13C signature of soils showed that terrestrial OM is dominant (Fig. S6), marine OM may get transported and deposited in coastal soils during high tides and storm surges. Although our analyses could not detect the presence of marine OM in TP soils, the higher CH4 production rates recorded in the incubations of TP, relatively to those of RP could in part be explained by marine OM and nutrient inputs. Interestingly, the high-centered polygon at TP, profile 09 (Fig. 4), did not behave in a predictable manner, since it had very high CH4 production rates on the surface. This elevated methane production rate coincided with the presence of substantial goose fecal deposits at TP, profile 09. While this observation suggests a potential local input of labile organic matter and nutrients (e.g., N and P) and possibly a distinct surface microbial community, no direct measurements were conducted to establish a mechanistic link. This site-specific observation is therefore reported as contextual field information rather than evidence of causation. Lower in the profile, CH4 production rates were very low, characteristic of the CH4 production rates observed in water-unsaturated high-centered polygons (Fig. 4). Therefore, in this instance, proximity with the coast may have influenced CH4 production through the presence of fauna.
Stable carbon isotopic signature of CH4 provides insights on the microbial processes involved in methanogenesis and on substrates used. δ13C–CH4 between −65 ‰ and −50 ‰ is typically associated with acetoclastic methanogenesis, while δ13C–CH4 between −110 ‰ and −60 ‰ is associated with hydrogenotrophic methanogenesis (Hornibrook et al., 1997, 2000). The stable isotopic signature of methylotrophic methanogenesis is between −83 ‰ and −72 ‰ (Penger et al., 2012), which overlaps with the hydrogenotrophic interval, precluding us from separating these two metabolic pathways. At RP, except for profile 10B, δ13C–CH4 had more negative values, consistent with the processing of recalcitrant organic matter through the hydrogenotrophic production pathway (Heffernan et al., 2022; Hodgkins et al., 2014). Profile 10B, a polygonal trough, had less negative 13C–CH4 values more consistent with acetoclastic methanogenesis (Hornibrook et al., 1997). At TP, the coastal polygonal tundra, δ13C–CH4 at 5 cm depth is less negative, consistent with methanogenesis with more labile organic carbon and the acetoclastic production pathway (Hodgkins et al., 2014), transitioning to more negative values, associated to hydrogenotrophic production with depth. This shift suggests an input of labile OM in TP surface and sub-surface soils. This may be due to the labile OM from abundant geese fecal matter that was observed in the surface. It is also possible that Carex sp., the dominant plant species of the site, may be a source of labile fermentation precursors (Galand et al., 2010; Liebner et al., 2015). To evaluate whether δ13C–CH4 covaried with other geochemical properties measured in this study, δ13C–CH4 values were examined alongside TOC content and sulfate concentrations; however, no consistent relationships were observed across landforms or depths (Fig. S4), indicating that methanogenic pathway signatures are not straightforwardly predicted by bulk TOC or sulfate availability at the scale investigated. However, it is clear that future work should integrate measurements of organic matter degradation, microbial community composition, and pore water chemistry to better resolve the mechanisms driving spatial variability in methane production.
4.3 Total CH4 production rates are comparable to the net CH4 fluxes measured in similar environments
In a polygonal terrain of the Tuktoyaktuk Coastlands, net CH4 fluxes from the center of high-centered polygons and troughs derived from flux chambers were measured to be 1.9 ± 20.4 and 13.0 ± 20.4 mmol m−2 d−1 respectively (Martin et al., 2018). These overlap with values of estimated total CH4 production derived from the brackish water amended incubation experiments (Fig. 5). It is clear from the large variations in measured CH4 emissions from the study of Martin et al. (2018) that incubations to estimate total active layer CH4 production rates can discern small differences due to local variations that stem mostly from the polygonal features. For example, at RP a comparable polygonal terrain located in the same study area of Martin et al. (2018), the total CH4 production of high-centered polygons and trough were 0.3 ± 0.1 and 5.0 ± 2.0 mmol m−2 d−1 (Fig. 5), respectively which are significantly different. This indicates the role of polygonal forms in controlling the activity of microbial communities which controls CH4 production and the potential to scale more accurately CH4 production at the landscape level based on landform distributions.
Interestingly, TP, the coastal site, had an estimated total CH4 production rate comparable to emissions of a St. Lawrence estuary salt marsh which had a CH4 flux of 24 ± 14.4 mmol m−2 d−1 (Comer-Warner et al., 2022). The St. Lawrence estuary salt marshes are affected by freeze-thaw cycles associated with seasons comparable to the freeze-thaw cycles observed in the active layer of Tuktoyaktuk coastlands despite lacking some characteristics features of our site like the presence of permafrost and rapid coastal erosion rates. CH4 emissions and production within areas of coastal influence thus appear of similar magnitude. By comparison, mangrove forests, which are a major global source of CH4 but a very different environment from coastal Arctic polygon terrain, had average CH4 fluxes to the atmosphere of 0.3 ± 0.1 mmol m−2 d−1 (Rosentreter et al., 2018). In another study, the average measured CH4 flux from a Yangtze Estuary (China) tidal salt marsh, with a subtropical monsoon climate, was 2.4 mmol m−2 d−1 (Li et al., 2021). These reported values are similar to our study as well as other studies in the region. When considered alongside the global distribution of coastal wetlands, this similarity in flux magnitude becomes particularly relevant. Tropical coastal wetlands are dominated by mangroves (∼ 147 000 km2), whereas Arctic wetlands cover approximately 3.5×10⁶ km2 (Worthington et al., 2024). Even if only a small fraction of Arctic wetlands is located within coastal zones, their total extent is comparable to the global mangrove area (Worthington et al., 2024), suggesting that permafrost Arctic coastal wetlands could represent a non-negligible component of the global CH4 budget and warrant further investigation.
Table 1Total methane production in a context of brackish water addition in high-centered polygons, low-centered polygons and throughs during growing season applied to the spatial scale of the polygonal landscape of RP. Two samples were taken for the high-centered polygon. The mean active layer and talik depth of the region is 35 cm. The error represents the propagation of the analytical uncertainty from the incubations results.
The calculated total methane production rates (T) from TP and RP do not take into account aerobic and anaerobic oxidation of CH4, which will most likely reduce fluxes of CH4 from these sites. Studies and models of Arctic soils emissions have highlighted that aerobic methanotrophy could consume more than half of the CH4 produced in soils, greatly limiting surface emissions (Oh et al., 2020; Zheng et al., 2018). Furthermore, AOM has been shown to play an important role in attenuating CH4 production in soils and sediments (Segarra et al., 2013; Winkel et al., 2019) but did not appear to influence significantly CH4 production in incubations with thermokarst lake sediments (Lotem et al., 2023). While AOM represents a major sink for CH4 in marine sediments (Knittel and Boetius, 2009; Reeburgh, 2009), the very different biogeochemical and hydrological characteristics of our coastal sites suggest that the role of AOM in these environments may diverge from that observed in fully marine systems. Recent work in coastal thermokarst lagoons, which can present key similarities to our coastal study sites due to episodic or persistent brackish water intrusion, have been shown to exhibit strong AOM control on CH4 dynamics, particularly in sulfate-rich settings where AOM may constitute a major CH4 sink (Yang et al., 2023). For the discussion of this study, we compared results of brackish water incubations to CH4 emissions measured in other landscapes. Such comparisons provide valuable context by comparing long-term microbial production processes with net atmospheric fluxes. However, we emphasize that CH4 production rates cannot be directly equated to CH4 emissions.
To better frame the potential impact of brackish water addition at scale, we extrapolated its consequence to a 25 ha area of polygonal tundra surrounding RP (Fig. S2). This estimate simulates CH4 production following the infiltration of brackish water into the terrestrial polygonal landscape around Tuktoyaktuk. This event could result from coastal flooding during storm surges, which are frequent in the Mackenzie River delta (Kokelj et al., 2012; Solomon, 2005). Taking into consideration the distribution of the polygonal features within RP and the relative areas of each landform, the CH4 production rates in the active layer, excluding pondlets, for an area of 25 ha was calculated to be 487 mol d−1 (Table 1) or 22 nmol m−2 s−1 and is consistent with the CH4 emissions measured from various wetland types (Cui et al., 2024). The increasing sensitivity of wetlands to climate change and the preponderant role of carbon substrate availability in controlling global methane emissions (Hu et al., 2024) warrants further investigating CH4 dynamics in thawing continuous permafrost landscapes and the role of coastal processes influencing these emissions. More polygonal tundra in various settings should be investigated as a comparison to the studied region. Further research on aerobic and anaerobic CH4 oxidation is necessary to provide a more precise estimate of the CH4 cycle inputs and outputs in a scope of the evaluation of its impacts on the greenhouse gas feedback loop.
The primary hypothesis for this study was that an increase in waterlogged environments due to coastal flooding and inundation processes would not enhance CH4 production because of sulfate present in coastal waters. However, our incubation experiments revealed high CH4 production rates in the presence of sulfates. Additionally, waterlogged conditions attributed to the ebb and flow of tides, seems to favor anoxic OM degradation and may potentially provide inputs of fresh OM and nutrients from marine sources, contributing to the elevated CH4 production rates measured in the coastal setting of TP. Moreover, no conclusive explanation for the co-occurrence of sulfate-reduction and methanogenesis in our brackish water incubations was identified, but based on evidence, we suggest syntrophic methanogenesis could support this co-occurrence. More investigation on methylotrophic methanogenesis in coastal soils are needed as it can be an important process in saline environments (Conrad, 2020). Future studies should investigate CH4 oxidation processes in greater detail, as they could provide crucial insights into Arctic coastal carbon cycling in sediments and soils affected by changing sea level.
All raw data of incubation experiment and other analyses performed and generated by study are available in the Supplement.
The supplement related to this article is available online at https://doi.org/10.5194/bg-23-3777-2026-supplement.
AP designed the experiment; ARL executed the experiments and analyses. AP, ARL, DW, RL participated in the fieldwork. PMJD provided lab space, equipment and insights for the stable carbon isotopes analyses on incubation CH4. RL performed all GIS analyses and maps. ARL performed the data interpretation and generated all figures. AP provided expertise on the writing and interpretation of figures. All authors reviewed and edited the manuscript.
The contact author has declared that none of the authors has any competing interests.
Publisher's note: Copernicus Publications remains neutral with regard to jurisdictional claims made in the text, published maps, institutional affiliations, or any other geographical representation in this paper. The authors bear the ultimate responsibility for providing appropriate place names. Views expressed in the text are those of the authors and do not necessarily reflect the views of the publisher.
We thank Santiago Mareque for assistance during field sampling. Mathieu Babin and Thi Hao Bui are acknowledged for assisting with the laboratory work performed at Université du Québec à Rimouski and at McGill University, respectively. Takuvik Laboratory is acknowledged for providing analyses and results on δ13C and TOC content of sediments. We also thank the community of Tuktoyaktuk for providing wildlife monitors with insightful information on the territory during field sampling. This research was funded by NSERC Discovery Grant and Northern Supplement to AP. ARL acknowledges financial support from the NSERC Northern Scientific Training Program. PMJD acknowledges support from the NSERC Discovery Grant and the Canadian Foundation for Innovation.
This research has been supported by the Natural Sciences and Engineering Research Council of Canada (Discovery Grant) and the Natural Resources Canada (Geological Survey of Canada – Nuna Project grant).
This paper was edited by Susanne Liebner and reviewed by Maren Jenrich and one anonymous referee.
AMAP: Snow, Water, Ice and Permafrost in the Arctic (SWIPA) 2017, Arctic Monitoring and Assessment Programme (AMAP), Oslo, Norway, 269 pp., ISBN 978-82-7971-101-8, 2017.
Andrachuk, M. and Smit, B.: Community-based vulnerability assessment of Tuktoyaktuk, NWT, Canada to environmental and socio-economic changes, Reg. Environ. Change, 12, 867–885, https://doi.org/10.1007/s10113-012-0299-0, 2012.
Bianchi, T. S.: The role of terrestrially derived organic carbon in the coastal ocean: A changing paradigm and the priming effect, Proc. Natl. Acad. Sci. USA, 108, 19473–19481, https://doi.org/10.1073/pnas.1017982108, 2011.
Boetius, A., Ravenschlag, K., Schubert, C. J., Rickert, D., Widdel, F., Gieseke, A., Amann, R., Jørgensen, B. B., Witte, U., and Pfannkuche, O.: A marine microbial consortium apparently mediating anaerobic oxidation of methane, Nature, 407, 623–626, https://doi.org/10.1038/35036572, 2000.
Bridgham, S. D., Cadillo-Quiroz, H., Keller, J. K., and Zhuang, Q.: Methane emissions from wetlands: biogeochemical, microbial, and modeling perspectives from local to global scales, Glob. Chang. Biol., 19, 1325–1346, https://doi.org/10.1111/gcb.12131, 2012.
Comer-Warner, S. A., Ullah, S., Ampuero Reyes, W., Krause, S., and Chmura, G. L.: Spartina alterniflora has the highest methane emissions in a St. Lawrence estuary salt marsh, Environ. Res. Ecol., 1, 011003, https://doi.org/10.1088/2752-664X/ac706a, 2022.
Conrad, R.: Importance of hydrogenotrophic, aceticlastic and methylotrophic methanogenesis for methane production in terrestrial, aquatic and other anoxic environments: A mini review, Pedosphere, 30, 25–39, https://doi.org/10.1016/S1002-0160(18)60052-9, 2020.
Coolen, M. J. L. and Orsi, W. D.: The transcriptional response of microbial communities in thawing Alaskan permafrost soils, Front. Microbiol., 6, 197, https://doi.org/10.3389/fmicb.2015.00197, 2015.
Costa, B., Vieira, G., and Whalen, D.: The fast-changing coast of Tuktoyaktuk Peninsula (Beaufort Sea, Canada): geomorphological controls on changes between 1985 and 2020, EGU General Assembly 2022, Vienna, Austria, 23–27 May 2022, EGU22-2426, https://doi.org/10.5194/egusphere-egu22-2426, 2022.
Couture, N. J., Irrgang, A., Pollard, W., Lantuit, H., and Fritz, M.: Coastal erosion of permafrost soils along the Yukon Coastal Plain and fluxes of organic carbon to the Canadian Beaufort Sea, J. Geophys. Res. Biogeosci., 123, 406–422, https://doi.org/10.1002/2017JG004166, 2018.
Cui, S., Liu, P., Guo, H., Nielsen, C. K., Pullens, J. W. M., Chen, Q., Pugliese, L., and Wu, S.: Wetland hydrological dynamics and methane emissions, Commun. Earth Environ., 5, 1635, https://doi.org/10.1038/s43247-024-01635-w, 2024.
Dallimore, S. R., Wolfe, S. A., Matthews Jr., J. V., and Vincent, J.-S.: Mid-Wisconsinan eolian deposits of the Kittigazuit Formation, Tuktoyaktuk Coastlands, Northwest Territories, Canada, Can. J. Earth Sci., 34, 1421–1441, https://doi.org/10.1139/e17-116, 1997.
Elberling, B., Michelsen, A., Schädel, C., Schuur, E. A. G., Christiansen, H. H., Berg, L., Tamstorf, M. P., and Sigsgaard, C.: Long-term CO2 production following permafrost thaw, Nat. Clim. Chang., 3, 890–894, https://doi.org/10.1038/nclimate1955, 2013.
Froelich, P., Klinkhammer, G., Bender, M., Luedtke, N., Heath, G., Cullen, D., Dauphin, P., Hammond, D., Hartman, B., and Maynard, V.: Early oxidation of organic matter in pelagic sediments of the eastern equatorial Atlantic: suboxic diagenesis, Geochim. Cosmochim. Acta, 43, 1075–1090, https://doi.org/10.1016/0016-7037(79)90095-4, 1979.
Galand, P. E., Yrjälä, K., and Conrad, R.: Stable carbon isotope fractionation during methanogenesis in three boreal peatland ecosystems, Biogeosciences, 7, 3893–3900, https://doi.org/10.5194/bg-7-3893-2010, 2010.
Guimond, J. A., Mohammed, A. A., Walvoord, M. A., Bense, V. F., and Kurylyk, B. L.: Saltwater intrusion intensifies coastal permafrost thaw, Geophys. Res. Lett., 48, e2021GL094776, https://doi.org/10.1029/2021GL094776, 2021.
Heffernan, L., Cavaco, M. A., Bhatia, M. P., Estop-Aragonés, C., Knorr, K.-H., and Olefeldt, D.: High peatland methane emissions following permafrost thaw: enhanced acetoclastic methanogenesis during early successional stages, Biogeosciences, 19, 3051–3071, https://doi.org/10.5194/bg-19-3051-2022, 2022.
Heslop, J. K., Walter Anthony, K. M., Sepulveda-Jauregui, A., Martinez-Cruz, K., Bondurant, A., Grosse, G., and Jones, M. C.: Thermokarst lake methanogenesis along a complete talik profile, Biogeosciences, 12, 4317–4331, https://doi.org/10.5194/bg-12-4317-2015, 2015.
Heslop, J. K., Walter Anthony, K. M., Winkel, M., Sepulveda-Jauregui, A., Martinez-Cruz, K., Bondurant, A., Grosse, G., and Liebner, S.: A synthesis of methane dynamics in thermokarst lake environments, Earth Sci. Rev., 210, 103365, https://doi.org/10.1016/j.earscirev.2020.103365, 2020.
Heyer, J., Berger, U., Kuzin, I. L., and Yakovlev, O. N.: Methane emissions from different ecosystem structures of the subarctic tundra in Western Siberia during midsummer and during the thawing period, Tellus B, 54, 231–249, https://doi.org/10.1034/j.1600-0889.2002.01280.x, 2002.
Hill, P. R., Héquette, A., and Ruz, M.-H.: Holocene sea-level history of the Canadian Beaufort shelf, Can. J. Earth Sci., 30, 103–108, https://doi.org/10.1139/e93-009, 1993.
Hodgkins, S. B., Tfaily, M. M., McCalley, C. K., Logan, T. A., Crill, P. M., Saleska, S. R., Rich, V. I., and Chanton, J. P.: Changes in peat chemistry associated with permafrost thaw increase greenhouse gas production, Proc. Natl. Acad. Sci. USA, 111, 5819–5824, https://doi.org/10.1073/pnas.1314641111, 2014.
Holm, S., Walz, J., Horn, F., Yang, S., Grigoriev, M. N., Wagner, D., Knoblauch, C., and Liebner, S.: Methanogenic response to long-term permafrost thaw is determined by paleoenvironment, FEMS Microbiol. Ecol., 96, fiaa021, https://doi.org/10.1093/femsec/fiaa021, 2020.
Hornibrook, E. R., Longstaffe, F. J., and Fyfe, W. S.: Spatial distribution of microbial methane production pathways in temperate zone wetland soils: stable carbon and hydrogen isotope evidence, Geochim. Cosmochim. Acta, 61, 745–753, https://doi.org/10.1016/S0016-7037(96)00368-7, 1997.
Hornibrook, E. R. C., Longstaffe, F. J., and Fyfe, W. S.: Evolution of stable carbon isotope compositions for methane and carbon dioxide in freshwater wetlands and other anaerobic environments, Geochim. Cosmochim. Acta, 64, 1013–1027, https://doi.org/10.1016/S0016-7037(99)00321-X, 2000.
Hu, H., Chen, J., Zhou, F., Nie, M., Hou, D., Liu, H., Delgado-Baquerizo, M., Ni, H., Huang, W., Zhou, J., Song, X., Cao, X., Sun, B., Zhang, J., Crowther, T. W., and Liang, Y.: Relative increases in CH4 and CO2 emissions from wetlands under global warming dependent on soil carbon substrates, Nat. Geosci., 17, 26–31, https://doi.org/10.1038/s41561-023-01345-6, 2024.
Hu, K., Issler, D., Chen, Z., and Brent, T.: Permafrost investigation by well logs, and seismic velocity and repeated shallow temperature surveys, Beaufort-Mackenzie Basin, Geological Survey of Canada, https://doi.org/10.4095/293120, 2013.
Hynes, S., Solomon, S. M., and Whalen, D.: GIS compilation of coastline variability spanning 60 years in the Mackenzie Delta and Tuktoyaktuk in the Beaufort Sea, Geological Survey of Canada Open File 7685, https://doi.org/10.4095/295579, 2014.
Ionescu, D., Bizic-Ionescu, M., Khalili, A., Malekmohammadi, R., Morad, M. R., de Beer, D., and Grossart, H.-P.: A new tool for long-term studies of POM-bacteria interactions: overcoming the century-old Bottle Effect, Sci. Rep., 5, 14706, https://doi.org/10.1038/srep14706, 2015.
Irrgang, A. M., Bendixen, M., Farquharson, L. M., Baranskaya, A. V., Erikson, L. H., Gibbs, A. E., Ogorodov, S. A., Overduin, P. P., Lantuit, H., Grigoriev, M. N., and Jones, B. M.: Drivers, dynamics and impacts of changing Arctic coasts, Nat. Rev. Earth Environ., 3, 39–54, https://doi.org/10.1038/s43017-021-00232-1, 2022.
Jenrich, M., Angelopoulos, M., Liebner, S., Treat, C. C., Knoblauch, C., Yang, S., Grosse, G., Giebeler, F., Jongejans, L. L., Grigoriev, M., and Strauss, J.: Greenhouse gas production and microbial response during the transition from terrestrial permafrost to a marine environment, Permafr. Periglac. Process., https://doi.org/10.1002/ppp.2251, 2024.
Jenrich, M., Wolter, J., Liebner, S., Knoblauch, C., Grosse, G., Giebeler, F., Whalen, D., and Strauss, J.: Rising Arctic seas and thawing permafrost: uncovering the carbon cycle impact in a thermokarst lagoon system in the outer Mackenzie Delta, Canada, Biogeosciences, 22, 2069–2086, https://doi.org/10.5194/bg-22-2069-2025, 2025.
Jones, E. L., Hodson, A. J., Thornton, S. F., Redeker, K. R., Rogers, J., Wynn, P. M., Dixon, T. J., Bottrell, S. H., and O'Neill, H. B.: Biogeochemical processes in the active layer and permafrost of a high Arctic fjord valley, Front. Earth Sci., 8, 342, https://doi.org/10.3389/feart.2020.00342, 2020.
Keuschnig, C., Larose, C., Rudner, M., Pesqueda, A., Doleac, S., Elberling, B., Björk, R. G., Klemedtsson, L., and Björkman, M. P.: Reduced methane emissions in former permafrost soils driven by vegetation and microbial changes following drainage, Glob. Chang. Biol., 28, 3411–3425, https://doi.org/10.1111/gcb.16137, 2022.
Knittel, K. and Boetius, A.: Anaerobic oxidation of methane: progress with an unknown process, Annu. Rev. Microbiol., 63, 311–334, https://doi.org/10.1146/annurev.micro.61.080706.093130, 2009.
Knoblauch, C., Beer, C., Sosnin, A., Wagner, D., and Pfeiffer, E.-M.: Predicting long-term carbon mineralization and trace gas production from thawing permafrost of Northeast Siberia, Glob. Chang. Biol., 19, 1160–1172, https://doi.org/10.1111/gcb.12116, 2013.
Knoblauch, C., Beer, C., Liebner, S., Grigoriev, M. N., and Pfeiffer, E.-M.: Methane production as key to the greenhouse gas budget of thawing permafrost, Nat. Clim. Chang., 8, 309–312, https://doi.org/10.1038/s41558-018-0095-z, 2018.
Kokelj, S. V., Lantz, T. C., Solomon, S., Pisaric, M. F., Keith, D., Morse, P., Thienpont, J. R., Smol, J. P., and Esagok, D.: Using multiple sources of knowledge to investigate northern environmental change: regional ecological impacts of a storm surge in the Outer Mackenzie Delta, N.W.T., Arctic, 65, 3, https://doi.org/10.14430/arctic4214, 2012.
Kramshøj, M., Albers, C. N., Holst, T., Holzinger, R., Elberling, B., and Rinnan, R.: Biogenic volatile release from permafrost thaw is determined by the soil microbial sink, Nat. Commun., 9, 3412, https://doi.org/10.1038/s41467-018-05824-y, 2018.
Kroeger, K. D., Crooks, S., Moseman-Valtierra, S., and Tang, J.: Restoring tides to reduce methane emissions in impounded wetlands: a new and potent blue carbon climate change intervention, Sci. Rep., 7, 12138, https://doi.org/10.1038/s41598-017-12138-4, 2017.
La, W., Han, X., Liu, C.-Q., Ding, H., Liu, M., Sun, F., Li, S., and Lang, Y.: Sulfate concentrations affect sulfate reduction pathways and methane consumption in coastal wetlands, Water Res., 217, 118441, https://doi.org/10.1016/j.watres.2022.118441, 2022.
Lacelle, D., Fontaine, M., Pellerin, A., Kokelj, S. V., and Clark, I. D.: Legacy of Holocene landscape changes on soil biogeochemistry: a perspective from paleo-active layers in northwestern Canada, J. Geophys. Res. Biogeosciences, 124, 2662–2679, https://doi.org/10.1029/2018JG004916, 2019.
Lantuit, H., Overduin, P. P., Couture, N., Wetterich, S., Aré, F., Atkinson, D., Brown, J., Cherkashov, G., Drozdov, D., Forbes, D. L., Graves-Gaylord, A., Grigoriev, M., Hubberten, H.-W., Jordan, J., Jorgenson, T., Ødegård, R. S., Ogorodov, S., Pollard, W. H., Rachold, V., and Vasiliev, A.: The Arctic coastal dynamics database: a new classification scheme and statistics on Arctic permafrost coastlines, Estuar. Coasts, 35, 383–400, https://doi.org/10.1007/s12237-010-9362-6, 2012.
Lapham, L. L., Dallimore, S. R., Magen, C., Henderson, L. C., Powers, L. C., Gonsior, M., Clark, B., Côté, M., Fraser, P., and Orcutt, B. N.: Microbial greenhouse gas dynamics associated with warming coastal permafrost, western Canadian Arctic, Front. Earth Sci., 8, 582103, https://doi.org/10.3389/feart.2020.582103, 2020.
Li, Y., Wang, D., Chen, Z., Chen, J., Hu, H., and Wang, R.: Methane emissions during the tide cycle of a Yangtze Estuary salt marsh, Atmosphere, 12, 245, https://doi.org/10.3390/atmos12020245, 2021.
Liebner, S., Ganzert, L., Kiss, A., Yang, S., Wagner, D., and Svenning, M. M.: Shifts in methanogenic community composition and methane fluxes along the degradation of discontinuous permafrost, Front. Microbiol., 6, 356, https://doi.org/10.3389/fmicb.2015.00356, 2015.
Lim, M., Whalen, D., Martin, J., Mann, P. J., Hayes, S., Fraser, P., Berry, H. B., and Ouellette, D.: Massive ice control on permafrost coast erosion and sensitivity, Geophys. Res. Lett., 47, e2020GL087917, https://doi.org/10.1029/2020GL087917, 2020.
Lipson, D. A., Zona, D., Raab, T. K., Bozzolo, F., Mauritz, M., and Oechel, W. C.: Water-table height and microtopography control biogeochemical cycling in an Arctic coastal tundra ecosystem, Biogeosciences, 9, 577–591, https://doi.org/10.5194/bg-9-577-2012, 2012.
Lotem, N., Pellerin, A., Anthony, K. W., Gafni, A., Boyko, V., and Sivan, O.: Anaerobic oxidation of methane does not attenuate methane emissions from thermokarst lakes, Limnol. Oceanogr., 68, 1316–1330, https://doi.org/10.1002/lno.12349, 2023.
Lovley, D. R. and Klug, M. J.: Sulfate reducers can outcompete methanogens at freshwater sulfate concentrations, Appl. Environ. Microbiol., 45, 187–192, https://doi.org/10.1128/aem.45.1.187-192.1983, 1983.
Mackay, J. R. and Dallimore, S. R.: Massive ice of the Tuktoyaktuk area, western Arctic coast, Canada, Can. J. Earth Sci., 29, 1235–1249, https://doi.org/10.1139/e92-099, 1992.
Maltby, J., Steinle, L., Löscher, C. R., Bange, H. W., Fischer, M. A., Schmidt, M., and Treude, T.: Microbial methanogenesis in the sulfate-reducing zone of sediments in the Eckernförde Bay, SW Baltic Sea, Biogeosciences, 15, 137–157, https://doi.org/10.5194/bg-15-137-2018, 2018.
Manson, G. K., Couture, N. J., and James, T. S.: CanCoast 2.0: data and indices to describe the sensitivity of Canada's marine coasts to changing climate, Geological Survey of Canada Open File 8551, https://doi.org/10.4095/314669, 2019.
Martens, C. S. and Berner, R. A.: Methane production in the interstitial waters of sulfate-depleted marine sediments, Science, 185, 1167–1169, https://doi.org/10.1126/science.185.4157.1167, 1974.
Martin, A. F., Lantz, T. C., and Humphreys, E. R.: Ice wedge degradation and CO2 and CH4 emissions in the Tuktoyaktuk Coastlands, Northwest Territories, Arct. Sci., 4, 130–145, https://doi.org/10.1139/as-2016-0011, 2018.
Murton, J. B.: Thermokarst-lake-basin sediments, Tuktoyaktuk Coastlands, western Arctic Canada, Sedimentology, 43, 737–760, https://doi.org/10.1111/j.1365-3091.1996.tb02023.x, 1996.
Oh, Y., Zhuang, Q., Liu, L., Welp, L. R., Lau, M. C. Y., Onstott, T. C., Medvigy, D., Bruhwiler, L., Dlugokencky, E. J., Hugelius, G., D'Imperio, L., and Elberling, B.: Reduced net methane emissions due to microbial methane oxidation in a warmer Arctic, Nat. Clim. Chang., 10, 317–321, https://doi.org/10.1038/s41558-020-0734-z, 2020.
Oremland, R. S. and Polcin, S.: Methanogenesis and sulfate reduction: competitive and noncompetitive substrates in estuarine sediments, Appl. Environ. Microbiol., 44, 1270–1276, https://doi.org/10.1128/aem.44.6.1270-1276.1982, 1982.
Ozuolmez, D., Na, H., Lever, M. A., Kjeldsen, K. U., Jørgensen, B. B., and Plugge, C. M.: Methanogenic archaea and sulfate reducing bacteria co-cultured on acetate: teamwork or coexistence?, Front. Microbiol., 6, 492, https://doi.org/10.3389/fmicb.2015.00492, 2015.
Pellerin, A., Lotem, N., Walter Anthony, K., Eliani Russak, E., Hasson, N., Røy, H., Chanton, J. P., and Sivan, O.: Methane production controls in a young thermokarst lake formed by abrupt permafrost thaw, Glob. Chang. Biol., 28, 3206–3221, https://doi.org/10.1111/gcb.16151, 2022.
Penger, J., Conrad, R., and Blaser, M.: Stable carbon isotope fractionation by methylotrophic methanogenic archaea, Appl. Environ. Microbiol., 78, 7596–7602, https://doi.org/10.1128/AEM.01773-12, 2012.
Petersen, S. G. G., Kristensen, E., and Quintana, C. O.: Greenhouse gas emissions from agricultural land before and after permanent flooding with seawater or freshwater, Estuar. Coasts, 46, 1459–1474, https://doi.org/10.1007/s12237-023-01218-6, 2023.
Poffenbarger, H. J., Needelman, B. A., and Megonigal, J. P.: Salinity influence on methane emissions from tidal marshes, Wetlands, 31, 831–842, https://doi.org/10.1007/s13157-011-0197-0, 2011.
Pönisch, D. L., Breznikar, A., Gutekunst, C. N., Jurasinski, G., Voss, M., and Rehder, G.: Nutrient release and flux dynamics of CO2, CH4, and N2O in a coastal peatland driven by actively induced rewetting with brackish water from the Baltic Sea, Biogeosciences, 20, 295–323, https://doi.org/10.5194/bg-20-295-2023, 2023.
Rampton, V. N.: Quaternary geology of the Tuktoyaktuk coastlands, Northwest Territories, Geological Survey of Canada, Memoir 423, 98 pp., Report No. EMR-M46-423E, MICROLOG-88-02809, 1988.
Reeburgh, W. S.: Oceanic methane biogeochemistry, Chem. Rev., 107, 486–513, https://doi.org/10.1021/cr050362v, 2009.
Rosentreter, J. A., Maher, D. T., Erler, D. V., Murray, R. H., and Eyre, B. D.: Methane emissions partially offset blue carbon burial in mangroves, Sci. Adv., 4, eao4985, https://doi.org/10.1126/sciadv.aao4985, 2018.
Roy Chowdhury, T., Herndon, E. M., Phelps, T. J., Elias, D. A., Gu, B., Liang, L., Wullschleger, S. D., and Graham, D. E.: Stoichiometry and temperature sensitivity of methanogenesis and CO2 production from saturated polygonal tundra in Barrow, Alaska, Glob. Chang. Biol., 21, 722–737, https://doi.org/10.1111/gcb.12762, 2015.
Schuur, E. A. G., McGuire, A. D., Schädel, C., Grosse, G., Harden, J. W., Hayes, D. J., Hugelius, G., Koven, C. D., Kuhry, P., Lawrence, D. M., Natali, S. M., Olefeldt, D., Romanovsky, V. E., Schaefer, K., Turetsky, M. R., Treat, C. C., and Vonk, J. E.: Climate change and the permafrost carbon feedback, Nature, 520, 171–179, https://doi.org/10.1038/nature14338, 2015.
Segarra, K. E., Comerford, C., Slaughter, J., and Joye, S. B.: Impact of electron acceptor availability on the anaerobic oxidation of methane in coastal freshwater and brackish wetland sediments, Geochim. Cosmochim. Acta, 115, 15–30, https://doi.org/10.1016/j.gca.2013.03.029, 2013.
Sela-Adler, M., Ronen, Z., Herut, B., Antler, G., Vigderovich, H., Eckert, W., and Sivan, O.: Co-existence of methanogenesis and sulfate reduction with common substrates in sulfate-rich estuarine sediments, Front. Microbiol., 8, 766, https://doi.org/10.3389/fmicb.2017.00766, 2017.
Sepulveda-Jauregui, A., Walter Anthony, K. M., Martinez-Cruz, K., Greene, S., and Thalasso, F.: Methane and carbon dioxide emissions from 40 lakes along a north–south latitudinal transect in Alaska, Biogeosciences, 12, 3197–3223, https://doi.org/10.5194/bg-12-3197-2015, 2015.
Sherr, E., Sherr, B., and Sigmon, C.: Activity of marine bacteria under incubated and in situ conditions, Aquat. Microb. Ecol., 20, 213–223, https://doi.org/10.3354/ame020213, 1999.
Skoog, D. A., West, D. M., Holler, F. J., and Crouch, S. R.: Fundamentals of analytical chemistry, 9th ed., Cengage Learning, Singapore, ISBN 978-0-495-55828-6, 2014.
Solomon, S. M.: Spatial and temporal variability of shoreline change in the Beaufort-Mackenzie region, Northwest Territories, Canada, Geo-Mar. Lett., 25, 127–137, https://doi.org/10.1007/s00367-004-0194-x, 2005.
Steedman, A. E., Lantz, T. C., and Kokelj, S. V.: Spatio-temporal variation in high-centre polygons and ice-wedge melt ponds, Tuktoyaktuk Coastlands, Northwest Territories, Permafr. Periglac. Process., 28, 66–78, https://doi.org/10.1002/ppp.1880, 2017.
Tanski, G., Bröder, L., Wagner, D., Knoblauch, C., Lantuit, H., Beer, C., Sachs, T., Fritz, M., Tesi, T., Koch, B. P., Haghipour, N., Eglinton, T. I., Strauss, J., and Vonk, J. E.: Permafrost carbon and CO2 pathways differ at contrasting coastal erosion sites in the Canadian Arctic, Front. Earth Sci., 9, 630493, https://doi.org/10.3389/feart.2021.630493, 2021.
Torres-Alvarado, R., Ramírez-Vives, F., Fernández, F. J., and Barriga-Sosa, I.: Methanogenesis and methane oxidation in wetlands: Implications in the global carbon cycle, Hidrobiológica, 15, 327–349, 2005.
Treat, C. C., Wollheim, W. M., Varner, R. K., Grandy, A. S., Talbot, J., and Frolking, S.: Temperature and peat type control CO2 and CH4 production in Alaskan permafrost peats, Glob. Chang. Biol., 20, 2674–2686, https://doi.org/10.1111/gcb.12572, 2014.
Turetsky, M. R., Treat, C. C., Waldrop, M. P., Waddington, J. M., Harden, J. W., and McGuire, A. D.: Short-term response of methane fluxes and methanogen activity to water table and soil warming manipulations in an Alaskan peatland, J. Geophys. Res. Biogeosci., 113, G03S05, https://doi.org/10.1029/2007JG000496, 2008.
Valdemarsen, T. B. and Kristensen, E.: Degradation of dissolved organic monomers and short-chain fatty acids in sandy marine sediment by fermentation and sulfate reduction, Geochim. Cosmochim. Acta, 74, 1593–1605, https://doi.org/10.1016/j.gca.2009.12.009, 2010.
Vardy, S. R., Warner, B. G., and Aravena, R.: Holocene climate effects on the development of a peatland on the Tuktoyaktuk Peninsula, Northwest Territories, Quat. Res., 47, 90–104, https://doi.org/10.1006/qres.1996.1869, 1997.
Vaughn, L. J. S., Conrad, M. E., Bill, M., and Torn, M. S.: Isotopic insights into methane production, oxidation, and emissions in Arctic polygon tundra, Glob. Chang. Biol., 22, 3487–3502, https://doi.org/10.1111/gcb.13281, 2016.
Whalen, D., Forbes, D. L., Kostylev, V., Lim, M., Fraser, P., Nedimović, M. R., and Stuckey, S.: Mechanisms, volumetric assessment, and prognosis for rapid coastal erosion of Tuktoyaktuk Island, an important natural barrier for the harbour and community, Can. J. Earth Sci., 59, 945–960, https://doi.org/10.1139/cjes-2021-0101, 2022.
Winfrey, M. R. and Ward, D. M.: Substrates for sulfate reduction and methane production in intertidal sediments, Appl. Environ. Microbiol., 45, 193–199, https://doi.org/10.1128/aem.45.1.193-199.1983, 1983.
Winkel, M., Sepulveda-Jauregui, A., Martinez-Cruz, K., Heslop, J. K., Rijkers, R., Horn, F., Liebner, S., and Walter Anthony, K. M.: First evidence for cold-adapted anaerobic oxidation of methane in deep sediments of thermokarst lakes, Environ. Res. Commun., 1, 021002, https://doi.org/10.1088/2515-7620/ab1042, 2019.
Worthington, T. A., Spalding, M., Landis, E., Maxwell, T. L., Navarro, A., Smart, L. S., Murray, N. J.: The distribution of global tidal marshes from Earth observation data, Global Ecol. Biogeogr., 33, https://doi.org/10.1111/geb.13852, 2024.
Yang, S., Anthony, S. E., Jenrich, M., in 't Zandt, M. H., Strauss, J., Overduin, P. P., Grosse, G., Angelopoulos, M., Biskaborn, B. K., Grigoriev, M. N., Wagner, D., Knoblauch, C., Jaeschke, A., Rethemeyer, J., and Liebner, S.: Microbial methane cycling in sediments of Arctic thermokarst lagoons, Glob. Chang. Biol., 29, 2714–2731, https://doi.org/10.1111/gcb.16649, 2023.
Yuan, J., Liu, D., Ji, Y., Xiang, J., Lin, Y., Wu, M., and Ding, W.: Spartina alterniflora invasion drastically increases methane production potential by shifting methanogenesis from hydrogenotrophic to methylotrophic pathway in a coastal marsh, J. Ecol., 107, 2436–2450, https://doi.org/10.1111/1365-2745.13164, 2019.
Zheng, J., RoyChowdhury, T., Yang, Z., Gu, B., Wullschleger, S. D., and Graham, D. E.: Impacts of temperature and soil characteristics on methane production and oxidation in Arctic tundra, Biogeosciences, 15, 6621–6635, https://doi.org/10.5194/bg-15-6621-2018, 2018.