the Creative Commons Attribution 4.0 License.
the Creative Commons Attribution 4.0 License.
 | 11 Jun 2026
Global quantification of the eco-hydrological co-benefits of soil carbon sequestration
Inne Vanderkelen
Marie-Estelle Demory
Sean Swenson
David M. Lawrence
Benjamin D. Stocker
Myke Koopmans
Édouard L. Davin
Soil carbon sequestration is an important strategy for climate change mitigation with several co-benefits, including increased water holding capacity and infiltration. However, a global-scale quantification of hydrological co-benefits for water availability to plants is still lacking. In this study, we investigate the effect of soil carbon sequestration on hydrology and water resources by conducting experiments with the Community Terrestrial Systems Model (CTSM). Using global experiments with spatially explicit soil organic carbon (SOC), we apply various soil carbon sequestration scenarios, including one aligned with the “4 per 1000” initiative, to investigate the effect on soil moisture and soil water balance variables with a focus on cropland regions. Our results show that soil organic carbon redistributes water within the soil profile, retaining moisture in the rooting zone and limiting percolation into deeper layers, which is particularly pronounced in relatively arid regions with sandy soils. Global average soil water content increases by 4 mm in the first 30 cm under a scenario with a uniform SOC increase of 5.5 gC kg−1 soil. Carbon sequestration also redistributes the mean annual soil water balance, with global mean reductions in surface runoff (−1 mm yr−1), subsurface runoff (−0.6 mm yr−1), and an increase in evapotranspiration (+2 mm yr−1), contributing to improved vegetation productivity. Water stress is overall reduced across most regions. Although the hydrological impacts of soil carbon sequestration are generally small in magnitude, they are consistent and systematic. The relative changes following realistic and policy-relevant SOC enhancement scenarios, such as those under the 4 per 1000 initiative, are limited due to the modest carbon additions involved. Nevertheless, these changes offer measurable eco-hydrological co-benefits that may support both climate mitigation and ecosystem resilience, particularly in water-limited environments.
- Article
(6121 KB) - Full-text XML
- BibTeX
- EndNote


Soil carbon sequestration is widely recognized as a key strategy for climate change mitigation, through storing carbon from anthropogenic CO2 in soils (Amelung et al., 2020; Paustian et al., 2016; Lal, 2004). It leverages sustainable land management practices, such as cover cropping, mulching, conservation tillage, organic manure application, and agroforestry, to increase the soil's capacity to capture and retain carbon (Paustian et al., 2016; Bossio et al., 2020). Soil organic carbon (SOC) stocks have declined globally due to land use and land cover changes, resulting in an estimated loss of approximately 133 PgC (Sanderman et al., 2017). Regions experiencing the highest SOC losses are typically cropland and grazing areas. By implication, these soils hold the highest potential for restoration through carbon sequestration (Sanderman et al., 2017). Global estimates of carbon sequestration potential in croplands range from 29 to 65 PgC over a period of at least 20 years (Zomer et al., 2017; Padarian et al., 2022).
Soil carbon sequestration through sustainable practices is widely recognized as a nature-based solution for climate mitigation, intended to complement efforts to reduce greenhouse gas emissions (Paustian et al., 2016; Minasny et al., 2017; Chabbi et al., 2017). Soil carbon sequestration has been endorsed by the international 4 per 1000 initiative (4p1000), launched at COP21 in Paris, which advocates for increasing global SOC stocks by 0.4 % yr−1 to contribute to offsetting greenhouse gas emissions (Rumpel et al., 2018, 2020). The initiative has highlighted the potential of soil carbon storage for climate mitigation while also initiating discussions about the complexities of its implementation, including soil carbon dynamics, regional variability, socio-economic factors, and the importance of complementing carbon sequestration efforts with reductions in fossil fuel emissions (de Vries, 2018; Lal, 2016; Rumpel et al., 2020).
In addition to its mitigation potential, soil carbon sequestration provides adaptation potential through various benefits such as improving soil health, reducing erosion, and enhancing biodiversity (Chabbi et al., 2017; Amelung et al., 2020; Bossio et al., 2020). Additionally, biogeophysical effects may arise through the influence of SOC on soil hydraulic properties. SOC stabilizes soil aggregates and increases porosity, thereby enhancing water retention, infiltration, and overall water holding capacity (Bowling et al., 2020; Arenas-Calle et al., 2021). In cropland soils, enhanced carbon sequestration has the potential to mitigate drought-induced impacts such as delaying the drought onset because of wetter soils (Turek et al., 2023), or increase drought resilience, thereby increasing crop yields (Iizumi and Wagai, 2019; Kane et al., 2021).
The extent to which SOC influences soil hydraulic properties depends on factors such as soil texture and climate conditions. Coarse-textured soils are more effective at retaining water for plant use, as they typically have lower wilting points, while soils with high clay content may retain more total water but have less plant-available water due to higher wilting points (Minasny and McBratney, 2018; Williams et al., 2016). SOC benefits tend to be more apparent in dry regions and in soils with low water holding capacity and large interannual fluctuations in climate conditions, such as temperature and precipitation (Iizumi and Wagai, 2019; Williams et al., 2016).
Through its control on soil water retention, SOC should also moderate plant water availability and thus affect all biogeophysical and biogeochemical processes at the land-atmosphere interface. However, despite the widely recognized increase in the water holding capacity of soils, the effect of SOC on available water capacity to plants is less clear.
A meta-analysis of 60 studies by Minasny and McBratney (2018) found that a 1 % mass increase in SOC (10 gC kg−1 soil) corresponds to a modest gain of 1.16 mm water per 100 mm soil in available water capacity, suggesting that the influence of SOC on plant-available water may be limited. Similar findings were reported by Panagea et al. (2021), who observed no statistically significant changes in soil water retention, and by Skadell et al. (2025), who found an average increase of 1.6 mm water per 100 mm soil per 10 gC kg−1 SOC increase across 11 sites in Germany. Bagnall et al. (2022) developed new SOC-sensitive pedotransfer functions based on 124 long-term research sites and reported larger increases of 3.0 mm per 100 mm soil for the same SOC increment in non-calcareous soils indicating that the magnitude of SOC effects likely depends on the empirical relationships used.
The effects of SOC changes on soil water content have mostly been investigated using local-scale empirical or modeling studies (e.g. Jordán et al., 2010; Turek et al., 2023; Panagea et al., 2021; Araya et al., 2022), meta-analyses (Minasny and McBratney, 2018) and regional or global statistical analyses (e.g. Iizumi and Wagai, 2019; Kane et al., 2021). However, insights from global or regional land modeling experiments remains sparse. McDermid et al. (2022) used the NASA Goddard Institute for Space Studies (GISS) ModelE, an Earth System Model, to explore the impacts of SOC loss from soil degradation on soil hydraulic properties and moisture retention. Their findings indicated that reductions in SOC lead to lower porosity across agricultural lands, causing reductions in total soil water content at regional scales. Other studies with land and climate models investigate changes in soil carbon from a biogeochemical and carbon cycle perspective for model evaluation and process understanding (Luo et al., 2016; Ito et al., 2020).
Despite these advances, a global quantification of the effects of policy-relevant soil carbon sequestration on soil moisture and related water balance variables is still lacking. Such a comprehensive analysis helps identify the hydrological co-benefits of soil carbon sequestration. Global-scale assessments are particularly relevant to inform policy initiatives, such as the 4 per 1000 initiative, and to enable comparisons across regions with varying soil textures, hydro-climatic conditions, and vegetation cover.
In this study, we address this gap by using the Community Terrestrial Systems Model (CTSM) to identify the hydrological co-benefits of soil carbon sequestration under policy-relevant scenarios. Thereby, we analyze the impact of carbon sequestration on soil hydrology and the implications for soil hydraulic properties and soil water balance related variables including soil evaporation, vegetation evapotranspiration, runoff and subsurface drainage. To this end, we use scenarios representing high- and low-end soil carbon sequestration rates alongside a scenario aligned with the 4 per 1000 initiative.
2.1 Model description
The Community Terrestrial Systems Model (CTSM version 5.2) is an advanced land model that simulates physical, chemical, and biological processes in terrestrial ecosystems and climate across varying spatial and temporal scales (Lawrence et al., 2019), in which the Community Land Model (CLM 5) serves as the core land surface component (Lawrence et al., 2018). Land surface heterogeneity is captured through a nested subgrid hierarchy, where each grid cell consists of multiple land units representing lakes, urban areas, crops, glaciers, and vegetated areas. Each land unit includes one or more columns that define the state variables for soil temperature and water content. Columns host patches that represent distinct Plant Functional Types (PFTs) or bare ground for vegetated units, and different crop functional types for cropland units. In total, 16 PFTs are defined, each varying in physiology and structure. In the default CTSM configuration, PFTs may share a soil column, competing for water and energy. In our set-up however, we conducted additional simulations where each PFT resides on its own soil column to investigate the impact of plant competition for water on carbon sequestration scenarios. This setup isolates the effects of transpiration and root water uptake specific to each PFT.
When the crop model is inactive, crops are represented by one irrigated and one unirrigated unmanaged C3 crop, treated similarly to C3 grass (Lawrence et al., 2018). Effects of land management on soil carbon, such as harvesting, tillage and erosion are not included in this modeling setup. Land unit distributions are prescribed using the default land cover dataset from the Land Use Harmonization Project 2 (LUH2; Hurtt et al., 2020, Appendix Fig. A2).
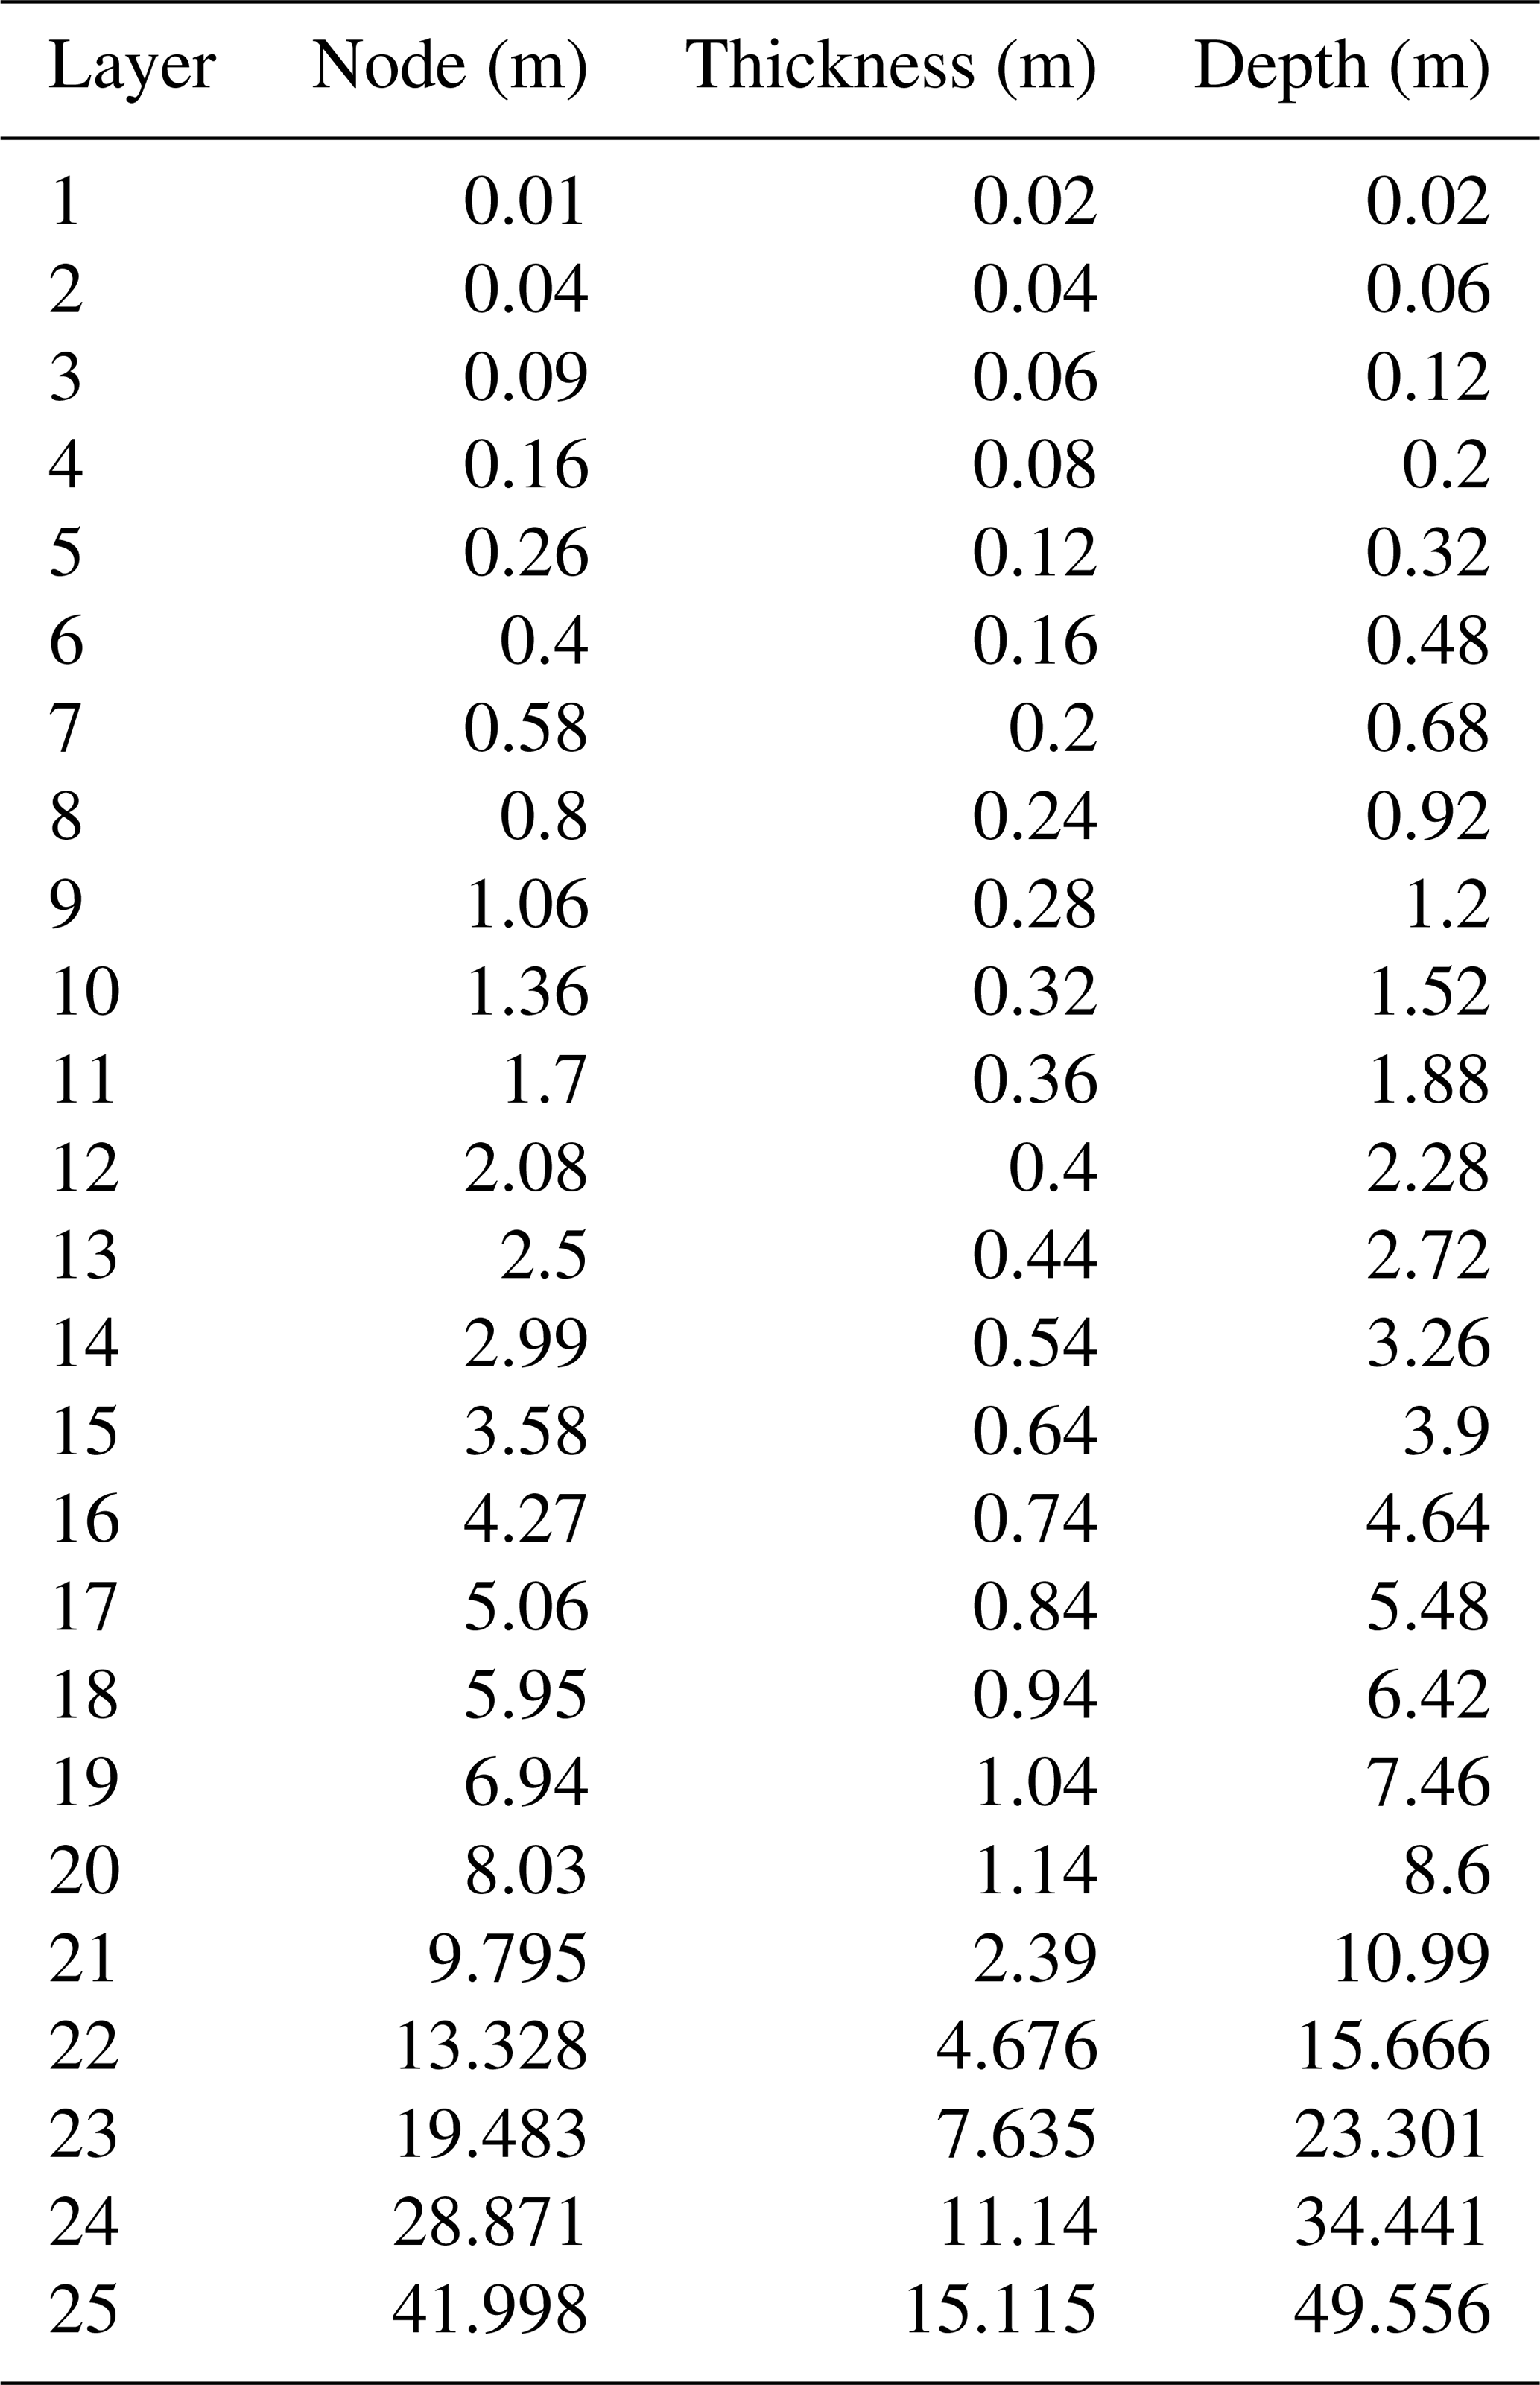
The default soil column configuration in CTSM includes 25 layers with a total soil depth of about 50 m. The soil is hydrologically active in the top 20 layers (down to 8.6 m depth). Soil layer depths and thicknesses follow the default CTSM parameterization (Table A1). The soil depth to bedrock is spatially variable and prescribed using data from (Pelletier et al., 2016, , Appendix Fig. A1), which constrains the number of hydrologically active layers to the maximum soil depth for each grid cell. One dimensional water flow is described, following the (Clapp and Hornberger, 1978) parametrization, by Darcy's law and Richards equation with the hydraulic conductivity (k, mm s−1) and soil matric potential (ψ, mm), which are both varying per soil layer with volumetric soil water (θ, mm3 mm−3), soil texture and soil organic matter (Lawrence et al., 2018).
Soil texture and soil organic matter are prescribed based on spatial datasets of clay and sand percentages and organic matter density (kg OM m−3). We use the WISE30sec dataset (Batjes, 2016), a harmonized soil profile database based on the World Inventory of Soil property Estimates (WISE), which provides global soil property estimates up to 2 m depth at a 30 arcsec resolution. Percentages of clay and sand from WISE30sec are used as direct input to CTSM (Fig. 1b, c), while soil organic carbon (SOC, gC kg−1 soil) from WISE30sec is converted to organic matter density (OM, kg OM m−3) using the formula:
using the bulk density (ρsoil, g cm−3) and fraction of coarse fragments (fcoarse, volumetric, %), and 1 g OM is equivalent to the van Bemmelen conversion factor of 0.58 gC (Fig. 1a). By using SOC and texture values from the same dataset, we ensure consistency across soil characteristics. Within CTSM, organic matter is further converted to an organic fraction using a maximum density of 130 kg m−3 corresponding to 100 %, corresponding to the standard organic matter density of peat soils.
The volumetric water content at saturation for soil layer i (θsat,i, mm3 mm−3) is computed as a weighted average of the organic and mineral soil components:
where fOM,i is the soil organic matter fraction, θsat,OM (mm3 mm−3), is the porosity of organic matter (set to 0.9; Letts et al., 2000), and θsat,min,i (mm3 mm−3) the porosity of the mineral fraction, which depends on the sand fraction (fsand,i) as:
The volumetric water content at the permanent wilting point (θwp, mm3 mm−3) is calculated from the soil water retention function:
where mm, the soil matric potential at wilting point, B the Clapp and Hornberger (1978) exponent, and ψsat (mm) the saturated soil matric potential. The exponent B is determined as a weighted average of the organic value (fixed at 2.7) and a mineral value dependent on the clay content (). The saturated matric potential ψsat is similarly calculated as weighted average, with the organic component fixed at −10.3 mm and the mineral component defined as . Note that in CTSM, ψsat is therefore not zero but reflects the combined properties of the mineral and organic fractions in each soil layer. Field capacity is defined as the soil water content in each soil layer at a matric potential of −33 kPa. Since the fraction organic matter and the percent sand are prescribed and constant in time throughout a simulation, the volumetric water content at saturation, the field capacity and the wilting point are invariant in time. For a complete description of the parametrization, the reader is referred to the CTSM technical documentation (Lawrence et al., 2018).
In CTSM, soil infiltration is simulated using the Richards equation, where water flow depends on soil hydraulic potential gradients and hydraulic conductivity. SOC affects these processes indirectly by altering soil hydraulic parameters such as porosity, bulk density, and the shape of the water retention curve, which together influence infiltration capacity and vertical water redistribution (Lawrence et al., 2018). Plant transpiration processes, including root water uptake and stomatal conductance, are simulated using the plant hydraulic stress module of Kennedy et al. (2019). This parametrisation models water transport through vegetation using prognostic vegetation water potential at the root, stem, and leaf levels. Leaf water potential serves as the basis for stomatal conductance water stress, replacing soil potential, while hydraulic root water uptake is simulated using root water potential, replacing the previous transpiration partitioning function (Kennedy et al., 2019). The vertical root distribution used in CTSM follows an exponential decay with depth, resulting in the majority of roots concentrated in the upper soil layers, which are not varying in time (Fig. A3).
2.2 Experimental design
We conduct land-only simulations for the present day climate using a regular horizontal grid at 0.5° by 0.5° resolution. All simulations are conducted with CTSM version 5.2, using prescribed vegetation phenology based on MODIS satellite observations (IHistCLM51SP compset; Lawrence et al., 2019). The biogeochemistry module is not activated, so soil organic matter remains constant throughout the simulations, and vegetation responses to changes in water availability are not represented. Atmospheric forcing is prescribed by the Global Soil Wetness Project (GSWP3; https://www.isimip.org/documents/405/GSWP3.forcing.HyungjunKim20140306.HJKIM.pdf, last access: 4 June 2026; see also Lawrence et al., 2019), a reanalysis product with 0.5° global resolution. GSWP3 provides three-hourly bias-adjusted meteorological variables based on the dynamically downscaled 20th century reanalysis (version 2) of the NCEP model (Compo et al., 2011).
The simulation workflow begins with a 60-year spin-up control simulation to ensure steady-state conditions in the soil water compartments. All subsequent simulations branch off from this control and span the period 1985–2014. The first ten years are treated as an additional spin-up, leaving 20 years (1995–2014) for analysis. Throughout the simulations, land use is fixed to the state of the year 2000.
The main land cover types targeted for soil carbon sequestration are cropland. Here, we focus on soil column variables specific to the crop fraction of each grid cell (Fig. A2). The crop soil column is not shared by other PFTs. The soil column is not shared by other PFTs. The simulations assume a generic C3 crop and are conducted without irrigation to isolate the effects of SOC changes on soil moisture and water availability. Since organic soils are unlikely to sequester additional carbon (Amelung et al., 2020) and are not the focus of this study, grid cells with organic carbon contents above 120 gC kg−1 soil (WRB, 2022) are excluded from the analysis.
2.3 Soil carbon sequestration scenarios
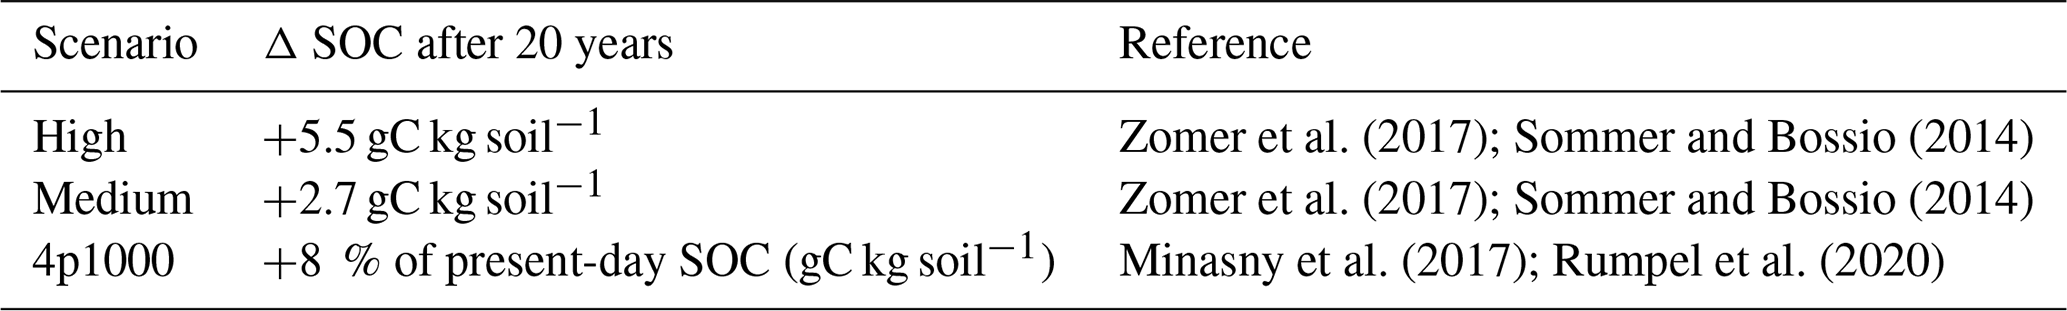
The effect of carbon sequestration on soil hydrology is assessed by comparing a control simulation with present-day, fixed SOC content to three distinct scenarios representing the soil carbon content after 20 years of active carbon sequestration, rather than a gradual linear increase over time (Fig. 1d, Table 1). A 20-year period reflects a commonly cited saturation point after which a new equilibrium in SOC for the upper soil layers is reached (Zomer et al., 2017). Thus, the scenarios represent stable states of SOC after 20 years of management. In each scenario, carbon increases are applied to the top 30 cm of the soil column, relative to present-day SOC values. This depth is consistent with prior studies (Zomer et al., 2017; Padarian et al., 2022) and the 4p1000 initiative, as this layer holds the majority of soil carbon and is influenced by management practices (Batjes, 1996). The input data implicitly assume historical carbon loss through cultivation since the onset of agricultural practices, allowing for soil carbon sequestration to reach a new equilibrium.
The first two scenarios assume uniform soil carbon sequestration applied globally to all cropland grid cells on top of present-day SOC (Table 1). These amounts are based on estimates by Zomer et al. (2017), who estimated a realistic soil carbon sequestration potential based on the SOC of the SoilGrids 250 m dataset and the scenarios of Sommer and Bossio (2014). The High scenario assumes a total absolute increase of 0.55 %, or 5.5 gC kg−1 soil in SOC over 20 years relative to present-day levels, representing a high sequestration potential for cropland. The Medium scenario applies a total absolute increase of 0.27 % or 2.7 gC kg−1 soil after 20 years. For both scenarios, the increase is applied to all grid cells worldwide. The third scenario, 4p1000, is based on the 4 per 1000 initiative and assumes an annual increase of 0.4 %. Over a period of 20 years, this results in a total increase of 8 % relative to current SOC levels, under the assumption that the increase does not compound annually. So while the first two scenarios represent a spatially invariant, rather small but attainable increases everywhere, the 4p1000 scenario results in spatially variable increases consistent to the pattern of present-day SOC, with high SOC changes in high-latitude regions and lower values in mid to low latitudes (Fig. A4). In all scenarios, sequestration is applied to the soil organic carbon (SOC, gC kg−1), based on the organic matter (OM) input layer (Eq. 1), for the top five soil layers (0–32 cm), approximating the 30 cm sequestration depth assumption.
The input SOC map with a horizontal resolution of 0.5° by 0.5°, based on the WISE30sec dataset is validated by comparing the mean SOC in the top 30 cm of cropland soil with values from literature. The mean SOC in cropland topsoils amounts to 68 t ha−1 and is derived using the SOC (gC kg−1) and soil bulk density (g cm−3) of the CTSM input derived from WISE30sec and a soil depth of 30 cm. This value aligns with recent studies: Padarian et al. (2022) reports 1.3 gC kg soil−1, corresponding to 59.1 t ha−1 derived using a neural network based on global climate, land cover and soil datasets. Zomer et al. (2017) cites 82 t ha−1, based on the Soils Grid 250 m global database. Additionally, Zomer et al. (2017) estimates total cropland SOC at 131.81 PgC, while our CTSM input map yields 108.42 PgC using the same cropland mask.
Four experiments are conducted, which differ in the soil organic matter input provided. The control scenario (CTL) uses the default WISE30sec SOC map, while the High, Medium, and 4p1000 scenarios use modified soil organic matter input maps.
Zomer et al. (2017); Sommer and Bossio (2014)Zomer et al. (2017); Sommer and Bossio (2014)Minasny et al. (2017); Rumpel et al. (2020)Table 1Soil carbon sequestration scenarios. All values are added to current SOC and correspond to SOC after 20 years.
2.4 Analysis
The effects of carbon sequestration on soil hydrology are quantified by comparing differences between the scenarios and CTL simulations across various soil moisture-related variables including water holding capacity, saturated fraction, volumetric and total water content. To this end, we compare mean values from the 20-year simulation period across experiments (Sect. 2.2). The water holding capacity is defined as the plant available water, calculated as the difference between field capacity (θfc, mm3 mm−3) and wilting point (θwp, mm3 mm−3).
The saturated fraction (θs, mm3 mm−3) represents the extent to which the soil is saturated and is calculated as:
where θ (mm3 mm−3) is the actual volumetric water content, and θsat (mm3 mm−3) is the volumetric water content at saturation.
Soil water stress conditions are defined based on a threshold relative to field capacity and the wilting point. Water stress occurs when the volumetric soil water content (θ) falls below 50 % of the water content at field capacity (θfc), provided that this threshold remains above the wilting point (θwp). In cases where , the wilting point is used as the stress threshold instead. The annual water stress is then quantified as the cumulative deficit between the applicable stress threshold and the actual soil water content (θ), accumulated over the year and summed across the first seven soil layers (d=0.68 m), representing the upper 60 cm of the soil profile corresponding to the depth affected by irrigation (Eq. 7).
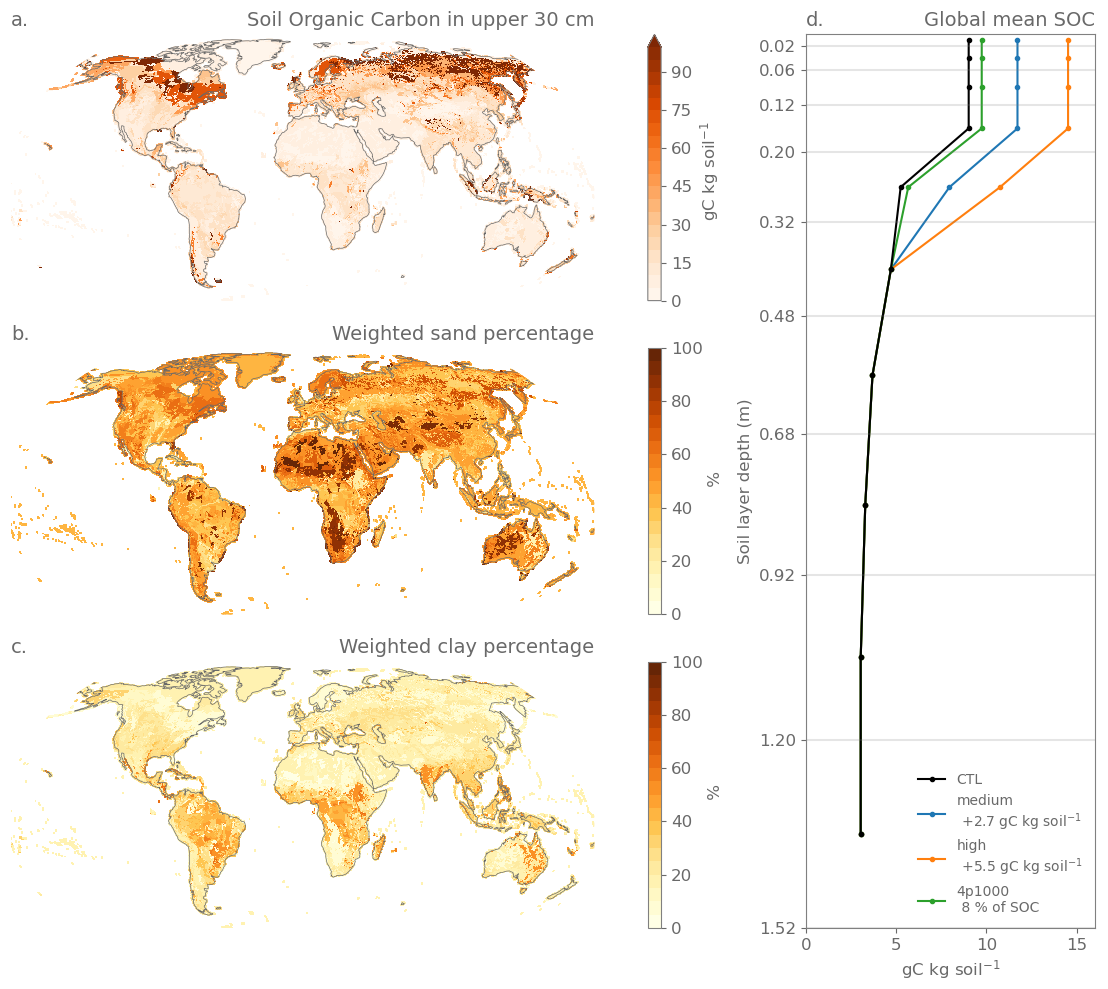
Figure 1Soil Organic Carbon (SOC), soil textures and different soil carbon sequestration scenarios used as model input. Spatial distribution of SOC in the top 30 cm of soil based on the WISE30sec dataset (a), percentage sand (b) and clay (c), both weighted over the different soil layers following the WISE30sec dataset. Vertical profiles of global mean SOC in the control simulation (CTL) and the three soil carbon sequestration scenarios: medium, high, and 4p1000 (d).
3.1 Impact of soil carbon sequestration on water holding capacity, saturated fraction and soil water content
The impact of soil carbon sequestration is measured through changes in water holding capacity, saturated fraction, and volumetric water content of the High scenario compared to CTL (Fig. 2). Water holding capacity in each simulation remains constant over time, as defined by the model formulation. Spatially, however, it increases globally, with a global mean volumetric rise of 0.002 m3 m−3, or 2 mm water per 100 mm soil (Fig. 2a). This pattern is driven by a consistent increase in soil water content at field capacity, strongly influenced by the soil organic carbon (SOC) fraction (Appendix Fig. A5b) and reflects the model's representation of the improved soil porosity from added organic carbon. While soil water content at wilting point also increases, this effect is less widespread and less pronounced (Appendix Fig. A5a). Changes in the saturated fraction exhibit a more heterogeneous spatial pattern and are generally of much lower magnitude, with areas showing substantial decreases (Fig. 2b). These decreases occur when soil water content at saturation (θsat) increases more than the mean simulated volumetric soil water content (θ), averaged over all years. This mean volumetric water content generally increases when weighted over the soil layers, with a global mean increase of 0.002 m3 m−3 (Fig. 2c). Overall, the changes are small and consistent in the High scenario, which involves a small forcing of a 5.5 gC kg−1 soil (0.55 %) increase in SOC.
With the soil's increased capacity to retain water and rising volumetric water content in most regions, a key question emerges: Is this additional water accessible to plants, which would reduce water stress and thereby potentially alleviate pressures on irrigation water abstraction and unsustainable use? Given the importance of this issue, and the potential of soil carbon sequestration for croplands, the remainder of our analysis focuses on the crop fraction of the grid cell. Cropland resides on its own soil column, which elucidates the competing effects of different PFTs with different rooting depths.
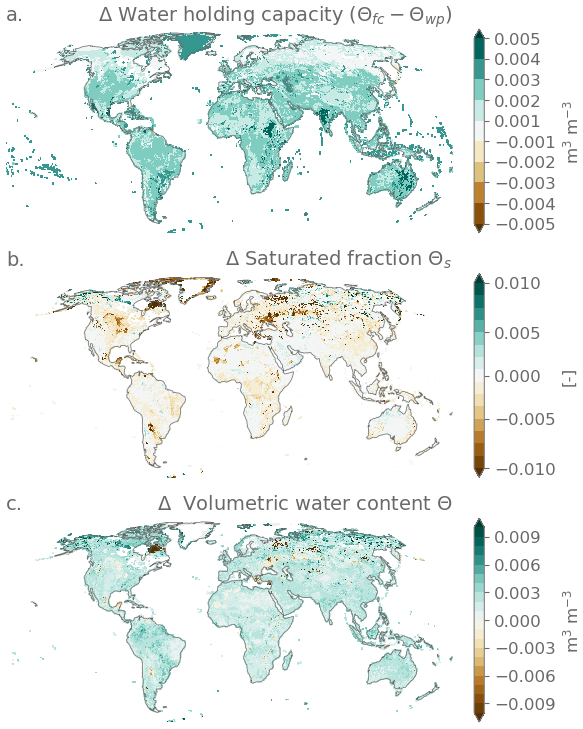
Figure 2Effect of soil carbon sequestration on the water holding capacity, saturated fraction and volumetric water content. Difference in the High and CTL scenarios averaged over 20 simulation years for all land grid cells in (a) the soil columns water holding capacity (field capacity – wilting point); (b) saturated fraction; and (c) volumetric water content; all weighted averages over the first 10 soil layers of CTSM. Grid cells with organic soils (organic carbon content > 120 gC kg−1 soil) are excluded from the analysis.
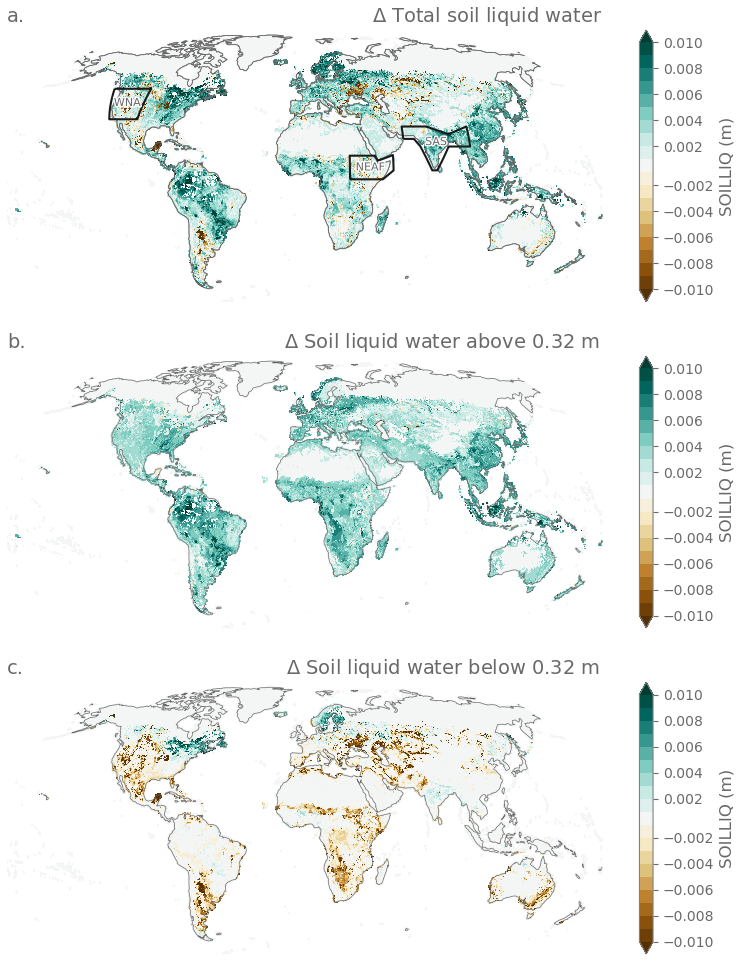
Figure 3Effect of soil carbon sequestration scenario on soil water content. Difference in High and CTL scenarios averaged over 20 simulation years for the column hosting crop fraction for total soil water content over the whole soil column. Black contours refer to the regions showed in Fig. A8a, water content above 32 cm, corresponding to the first five soil layers in CTSM (b) and water content below 32 cm (c). Grid cells with organic soils (organic carbon content > 120 gC kg−1 soil) are excluded from the analysis.
The effect on mean total water availability and total soil liquid water content shows an increase of 2 mm averaged globally, and varies by region (Fig. 3a); hereafter, soil water content refers to the liquid fraction. In areas such as the Amazon, the eastern United States and Canada, Scandinavia, Western Europe, West and Central Africa, Madagascar, and East and Southeast Asia, soil carbon sequestration leads to an increase in total soil water content. Conversely, a marked decrease in soil water content is observed in regions such as the western United States, the Argentinian Pampas, parts of Southern Africa (spanning Namibia, Angola, Botswana, and South Africa), the Sahel, areas of East Africa, portions of the Eurasian continent, northeastern China, and Australia. These contrasting responses result from differences in soil water content above and below a depth of 32 cm.
In the upper 32 cm of the soil, where soil carbon sequestration is applied, mean water content consistently increases across all crop regions, with a global average increase of +4 mm (Fig. 3b), likely reflecting a redistribution of water that is retained in the topsoil and therefore less available for percolation to deeper layers. In contrast, the deeper soil layers below 32 cm exhibit diverging patterns (Fig. 3c, global average decrease of −1 mm). In most cropland areas, water content in these deeper layers decreases, particularly where total water content is reduced throughout the entire soil column. However, some regions – such as eastern Canada, Scandinavia, and parts of India and Southeast Asia – show increases in deeper layer water content. These increases may be linked to ice melting within the model or regional soil characteristics. The soil depth in these layers is determined by the soil depth map (Appendix Fig. A1), which defines maximum depths for each location. Areas with strong declines in water content tend to correspond with more arid or sandy regions (Fig. 1b), indicating that water is retained in the upper soil layers rather than percolating into deeper depths.
To better assess regional differences, we examine volumetric water content (θ) and the saturated fraction (θs) in three IPCC AR6 regions: Western North America (WNA), Northeastern Africa (NEAF), and South Asia (SAS) (Fig. 3a; Iturbide et al., 2020). WNA, a dry region with extensive irrigation and a rainy season from November to March, has 50 % sand and 20 % clay (Fig. 1b, c). NEAF, covering the arid Horn of Africa and wetter Ethiopian Highlands, has high sand (55 %–60 %) and low clay (<20 %) fractions, with a dry season from December to March. Both regions show no clear increase in total water content due to declines below 32 cm (Fig. 3a, c). SAS, a major irrigated region with a monsoon season from April to September, has 30 % sand and 60 % clay, leading to a slight increase in soil water content below 32 cm (Fig. 3c).
Seasonal variations in the influence of soil carbon sequestration on soil water content for these regions are examined through vertical profiles of changes in volumetric water content and the saturated fraction (Fig. 4). Volumetric water content is highest between 20 and 32 cm – the deepest layer where soil carbon sequestration is applied (Fig. 4a–c). Across all three regions, water content increases most during the rainy season and persists at greater depths beyond the wet periods. In contrast, a slight soil carbon sequestration-induced drying occurs in the surface layers during the dry season, with the deepest drying observed in Western North America. Below the carbon-sequestered layers, changes in water content are minimal, with slight drying or no change observed. This pattern suggests that increased SOC in the upper layers enhances water retention in the upper layers, thereby reducing percolation and limiting the downward movement of water through soil texture effects, increasing water retention.
The reduction in saturated fraction is most pronounced in the upper layers and diminishes with depth, indicating lower surface soil saturation (Fig. 4). Relative increases in volumetric water content reach up to 10 % at the deepest soil carbon sequestration layer, with minimal seasonal variation compared to absolute values (Appendix Fig. A8). This indicates that soil carbon sequestration enhances water retention within the sequestration layers, thereby amplifying soil water seasonality. At the same time, it reduces the downward percolation of water into layers below the soil carbon sequestration depth. Especially in the surface layers, the increase in saturated fraction is not fully matched by the actual increase in water content from percolation, resulting in less saturated surface soil layers.
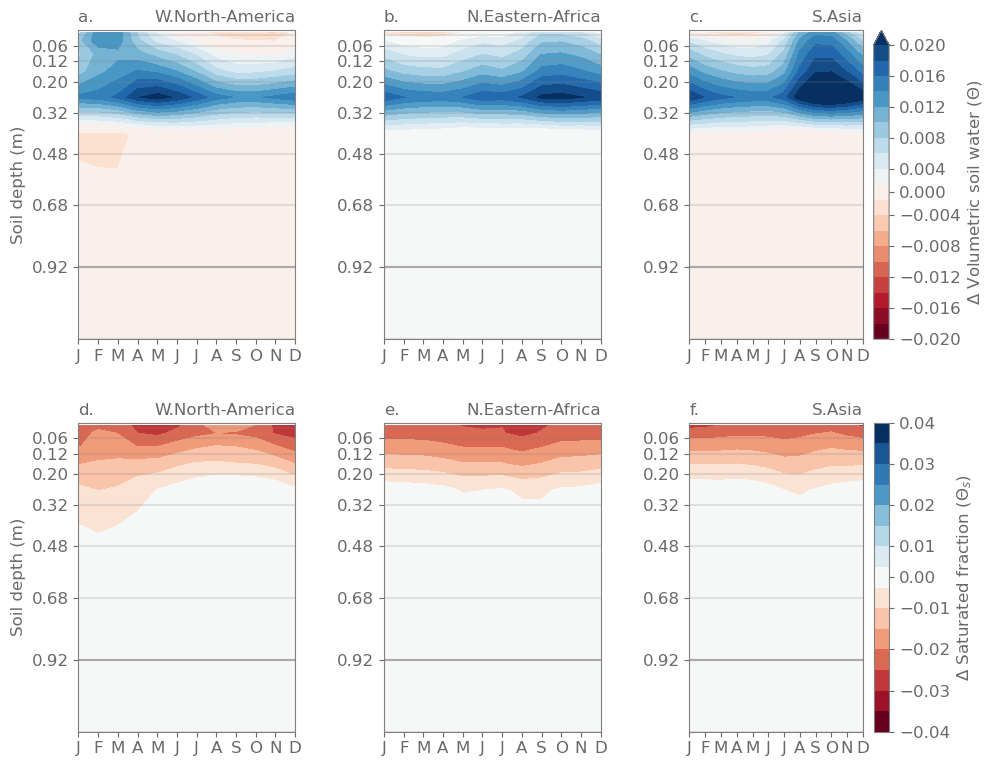
Figure 4Seasonal effect of soil carbon sequestration on volumetric soil water and saturated fraction for different regions and soil depths. (a, b, c) Difference in High and CTL scenarios averaged over 20 simulation years for volumetric soil water θ (mm3 mm−3) and (d, e, f) saturated fraction θs mm3 mm−3) across seasons and soil depth for three regions: (a, d) Western North-America, (d, e) North-Eastern Africa and (c) South Asia, averaged over their cropland grid cells. The y-axis indicates the different soil layers. Grid cells with organic soils (organic carbon content > 120 gC kg−1 soil) are excluded from the analysis.
3.2 Effect on evapotranspiration
To assess whether the increased water content in upper soil layers improves plant water availability, we examine its impact on evapotranspiration components: soil evaporation, vegetation transpiration, vegetation evaporation, and the total evapotranspiration (Fig. 5). Carbon sequestration has a clear spatial effect on soil evaporation, but its impact is smaller compared to vegetation transpiration (Fig. 5a). Soil evaporation increases in more sandy regions like the Monte Desert in Argentina, Western Southern Africa, Western North America, as well as the Sahel and parts of the Eurasian Steppe. In contrast, areas with higher clay fractions, such as the Ethiopian Highlands, parts of India and Northwestern Australia, show reductions in soil evaporation. Soil carbon sequestration seems to reduce soil evaporation in clay-rich regions while enhancing it in sandy ones. The increase in soil evaporation appears to reduce the water available for transpiration. This is somewhat unexpected, given that evaporation primarily draws from near-surface moisture, whereas transpiration accesses water from deeper soil layers.
Soil carbon sequestration generally boosts vegetation transpiration, suggesting that plants have more access to water (Fig. 5b). This effect is particularly notable in clay-rich regions, such as in India, Southeast Asia and the tropical rain forests. In these areas water is typically not limiting, and the effect likely reflects local increases in soil water retention and root-zone moisture storage rather than a true alleviation of water stress. In contrast, the impact on vegetation evaporation, i.e., evaporation from precipitation intercepted by the canopy, is minimal (Fig. 5c). This can be explained by the fact that this flux is independent of soil water content. However, because 2 m temperature is a diagnostic variable in CTSM, a small temperature-related feedback is observed in vegetation evaporation rates. The overall change in evapotranspiration is primarily driven by increased vegetation transpiration, with a smaller contribution from enhanced soil evaporation and amounts up to a global average increase of +2 mm (Fig. 5d).
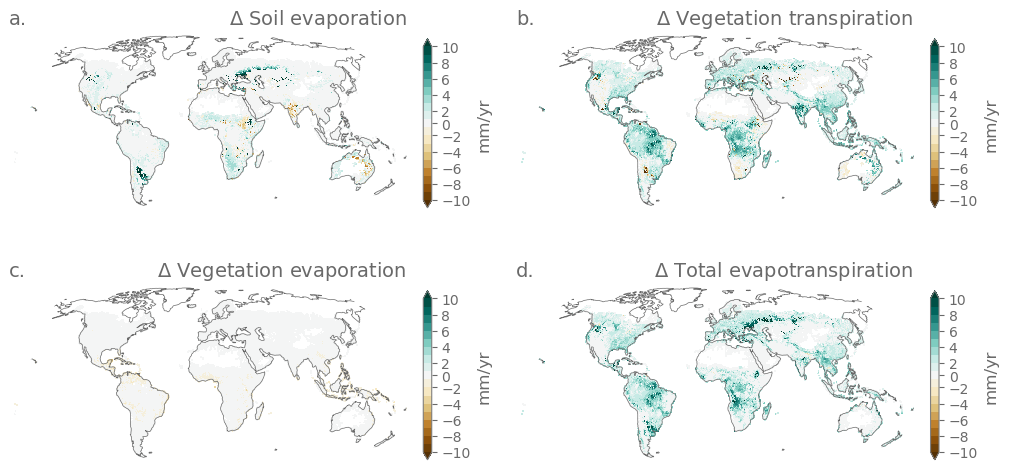
Figure 5Effect of soil carbon sequestration on evapotranspiration. Difference in High and Control scenarios averaged over 20 simulation years for the column hosting crop fraction for (a) soil evaporation, (b) vegetation transpiration, (c) vegetation evaporation and (d) total evapotranspiration. Grid cells with organic soils (organic carbon content > 120 gC kg−1 soil) are excluded from the analysis.
3.3 Effect on water stress
Annual water stress decreases across most regions, particularly in Western North America, parts of South America, the Sahel, Western Southern Africa, South Asia and the Middle East, which correspond to areas with high sand contents. The decrease in water stress reaches several meters per year in some areas (Fig. 6a), indicating that carbon sequestration reduces the accumulated soil moisture deficit below the stress threshold over the annual cycle, particularly in coarse-textured regions. These results shows the potential for reducing irrigation demands. It is however not possible to quantify the direct reduction in irrigation needs due to the way irrigation is parametrized in the CTSM, using a threshold soil moisture value that also changes with increased soil carbon.
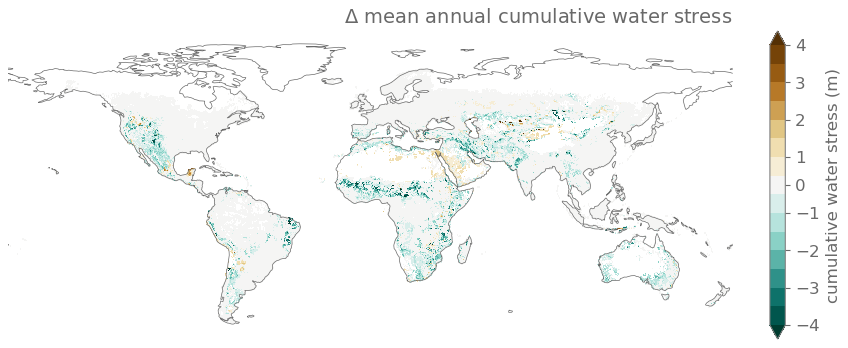
Figure 6Effect of soil carbon sequestration scenario on water stress. Difference of annual cumulative water stress in the soil layers above 60 cm and in the High and Control scenarios for the column hosting crop fraction, annually averaged over a 20 simulation years. Grid cells with organic soils (organic carbon content > 120 gC kg−1 soil) are excluded from the analysis.
3.4 Implications for runoff
Soil carbon sequestration reduces surface runoff in most regions (Fig. 7a, −1 mm globally averaged), with pronounced decreases observed in Scandinavia, Central Europe, northeastern Canada and the western Amazon. This reduction suggests improved infiltration rates (Appendix Fig. A17). Subsurface drainage, which refers to water exiting the bottom of the grid cell, also decreases in most areas, except in regions like northeastern Canada, Scandinavia and Central Europe (Fig. 7b, −0.6 mm globally averaged). The simulated reduction in drainage is attributed to a lower saturated fraction across the soil column (Sect. 3.1, Fig. 2), leading to reduced water tables and subsurface runoff. This result aligns with the model’s representation of subsurface drainage Felfelani et al. (2020). Overall, these findings suggest that increased soil carbon in CTSM generally enhances the soil's ability to retain water.
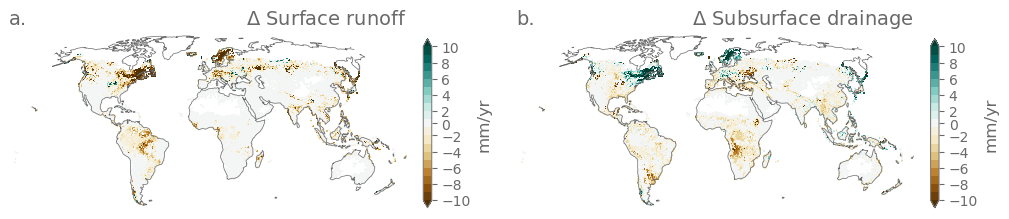
Figure 7Effect of soil carbon sequestration on runoff. (a) Difference in the High and CTL scenarios averaged over 20 simulation years for the column hosting crop fraction for surface runoff and (b) subsurface drainage. Grid cells with organic soils (organic carbon content > 120 gC kg−1 soil) are excluded from the analysis.
3.5 Differences between scenarios
The soil water balance responses described above correspond to the High soil carbon sequestration scenario. The Medium soil carbon sequestration scenario exhibits similar spatial patterns but with smaller magnitude differences (Appendix Figs. A7, A10, A12, A14 and A16). The 4p1000 scenario, where soil carbon sequestration is relative to existing carbon stocks (Appendix Fig. A4), shows distinct spatial patterns, which are reflected in the hydrological responses (Appendix Figs. A6, A9, A11, A13 and A15).
Comparing volumetric water content across the three selected regions (as shown in Fig. 3a) shows compensatory effects, with increased soil moisture above 32 cm and decreases below (Fig. 8). This pattern is most pronounced in Western North America and Northeastern Africa, where both the High and Medium soil carbon sequestration scenarios result in a net soil water increase. However, in the 4p1000 scenario, the decline below 32 cm outweighs the gains above, leading to an overall reduction in volumetric water content. In South Asia, decreases below 32 cm are minimal, and in the 4p1000 scenario, a slight increase is observed, resulting in a strong overall increase in soil water in the full column (Fig. 8).
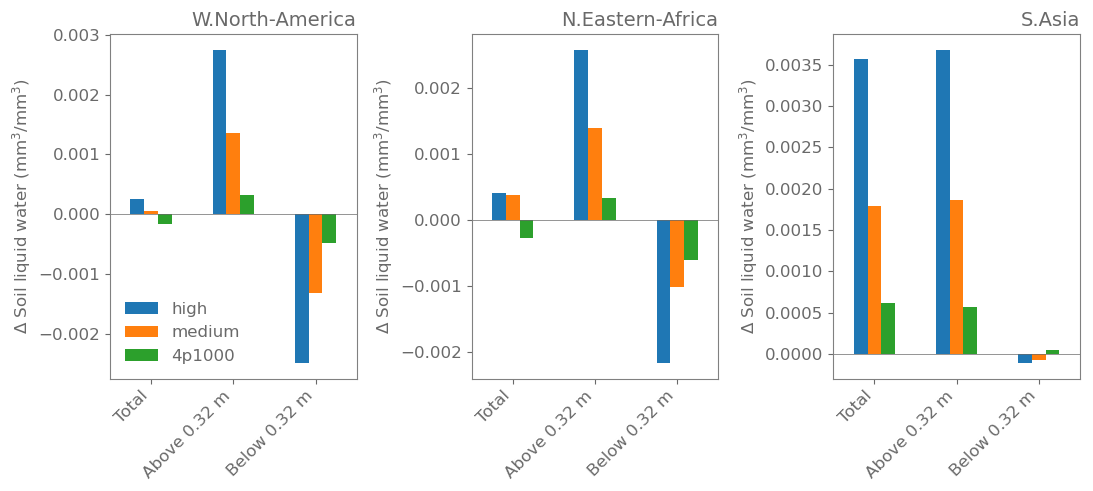
Figure 8Effect of soil carbon sequestration following different scenarios on volumetric soil water content. Difference in soil moisture under the High, Medium, and 4p1000 scenarios, averaged over 20 simulation years and across Western North America, Northeastern Africa, and South Asia. Grid cells with organic soils (organic carbon content > 120 gC kg−1 soil) are excluded from the analysis.
Our simulations indicate that soil carbon sequestration enhances soil moisture in the upper layers where it is applied, effectively retaining water near the surface, limiting percolation to deeper layers and also leading to a reduction in surface runoff (Fig. 9). The increased soil moisture supports higher evapotranspiration rates, primarily driven by more vegetation transpiration and soil evaporation. Finally, as water storage capacity increases more than the actual water retained, saturation levels decline, resulting in reduced subsurface drainage from the grid cell. Soil organic carbon thus redistributes the partitioning of the available water from precipitation from less surface and subsurface runoff to more evapotranspiration.
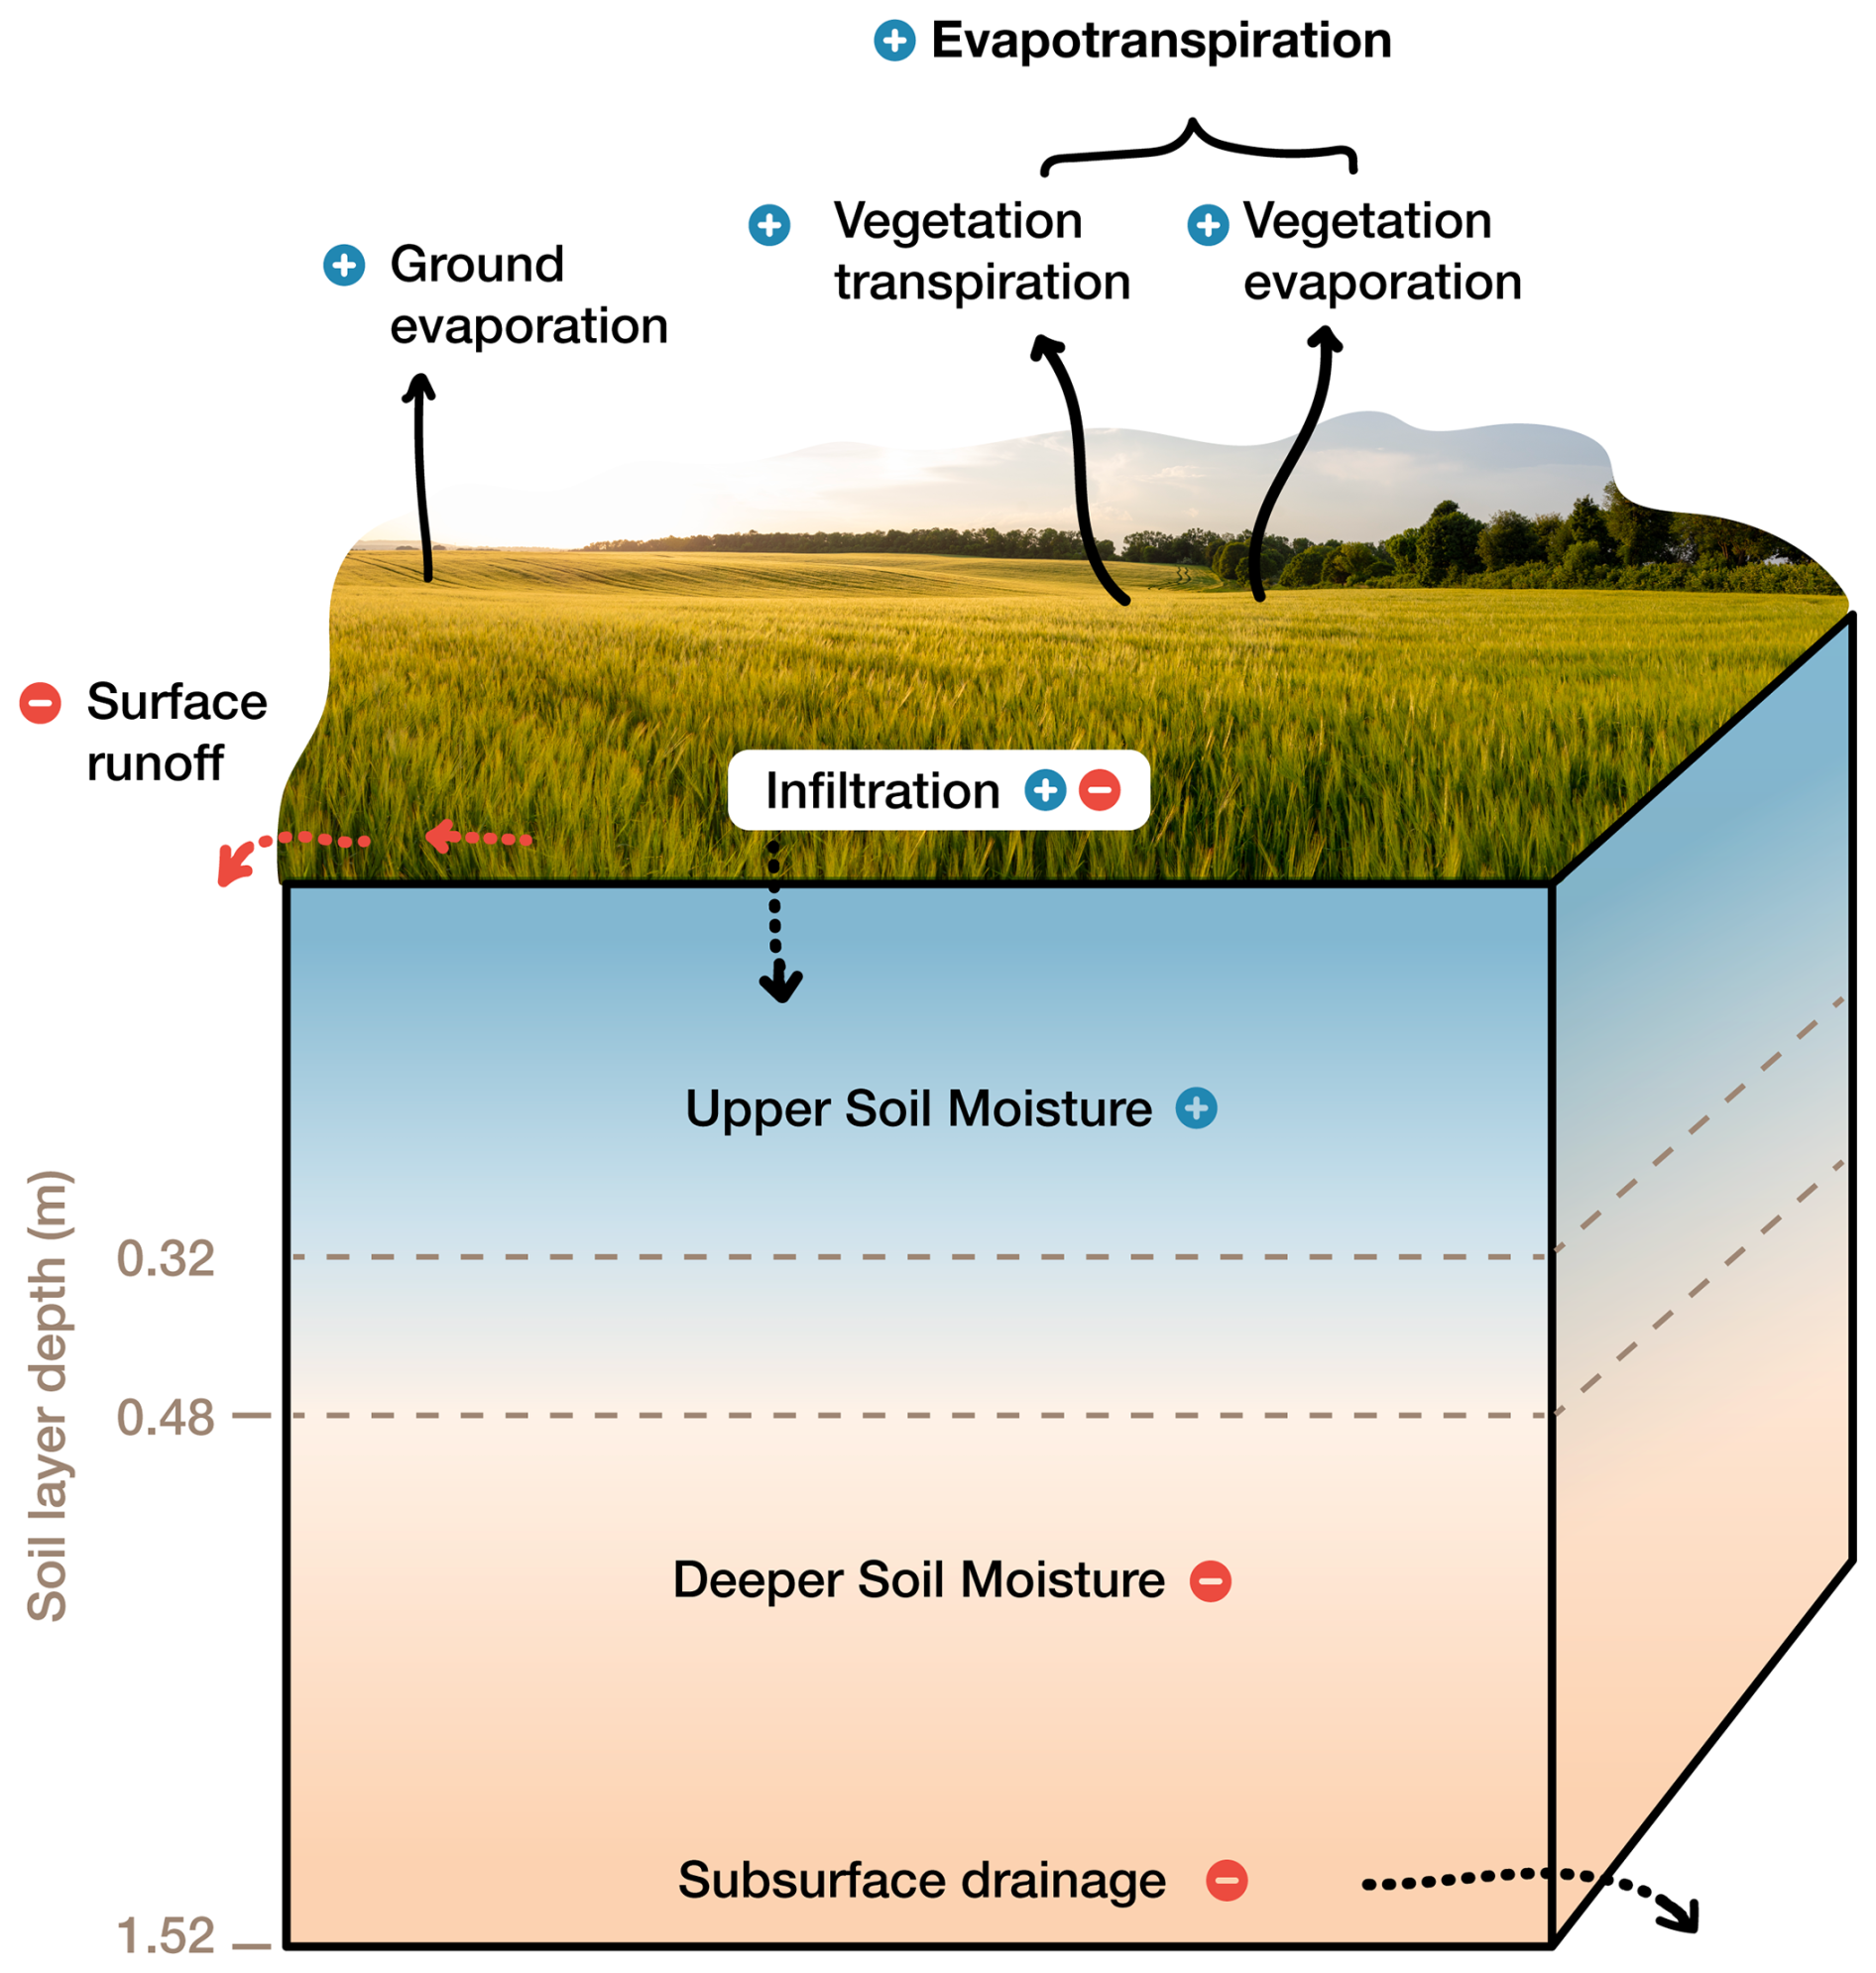
Figure 9Influence of soil organic carbon on water balance components. Conceptual illustration showing changes in the soil column and hydrological processes due to increased soil organic carbon.
Similar to the findings of Minasny and McBratney (2018), we observe a positive effect of increased soil organic carbon (SOC) on available water capacity, defined as the difference between field capacity and the wilting point. While Minasny and McBratney (2018) report that a 1 % mass increase in SOC leads to a 1.16 % volumetric increase in available water capacity, our results suggest a slightly stronger response: in the high SOC scenario (corresponding to a 0.55 % mass increase), we find a global average increase in water holding capacity of approximately 2 % (Fig. 2, Sect. 3.1). The accompanying increase in volumetric water content of 2 % globally averaged, further supports the conclusion that soil carbon sequestration can enhance water availability, albeit to a limited extent.
While this study does not include a direct validation against observations of soil carbon sequestration effects, the hydrology and energy balance components of CTSM have been extensively evaluated in previous studies (e.g., Lawrence et al., 2019; Cheng et al., 2021; Kennedy et al., 2019). The analysis therefore represents a model sensitivity experiment conducted within a well-validated modeling framework.
Although our simulations provide insights at large scales, global land models have inherent limitations in capturing local soil hydrological processes and their feedbacks with the atmosphere. In CTSM, as in other global land models, soil hydraulic functions such as water retention and hydraulic conductivity are parameterized through pedotransfer functions that strongly depend on input soil texture maps and organic matter content. These empirical functions do not account for dynamic feedbacks between SOC and soil properties. In particular, structural effects such as aggregation, macroporosity, and changes in infiltration capacity are not explicitly represented (Fatichi et al., 2020). As a result, important soil processes associated with SOC accumulation and management practices, such as no-till, cover cropping, compaction, or enhanced biological activity, are only partially captured (Minasny and McBratney, 2018). The model may not fully represent the complexity of SOC–water interactions, leading to underestimation of both co-benefits (e.g. improved infiltration and reduced runoff) and trade-offs (e.g. reduced deep drainage or oxygen stress due to water logging under saturation).
The pedotransfer functions in CTSM dictate that water holding capacity increases with SOC up to intermediate levels (Appendix Fig. A18). Yet, this behavior likely underestimates the true effect of SOC sequestration on soil hydraulic properties. Recent studies suggest that SOC influences water retention primarily through changes in soil aggregation, pore size distribution, and connectivity. Bagnall et al. (2022) proposed revised carbon-sensitive pedotransfer functions that account for SOC-driven changes in soil structure and aggregation, which result in substantially higher increases in water holding capacity compared to conventional pedotransfer functions. At the field scale, Araya et al. (2022) and Skadell et al. (2025) showed that SOC sequenstration management techniques increases water holding capacity. Panagea et al. (2021), however shows that the direct impact of SOC on water holding capacity is small, and SOC-induced changes in soil structure and aggregate composition are more important. These findings highlight the need for model developments that incorporate SOC-sensitive hydraulic pedotransfer and soil structural processes to better quantify the effects of carbon sequestration on soil water content.
Furthermore, because vegetation phenology is prescribed, dynamic plant responses such as changes in rooting depth or stomatal regulation cannot adjust to altered soil water conditions, constraining the representation of vegetation–soil feedbacks. Finally, the coarse 0.5° by 0.5° spatial resolution and generalized parameterizations smooth regional variability in soil texture, management, and climate, limiting representation of localized processes such as infiltration contrasts or management-induced changes in soil structure. However, the model’s tiled approach allows differentiation between land types within a grid cell, for example separating irrigated from rain-fed croplands and grasslands, which partially accounts for sub-grid variability.
Here, we focused on croplands to apply soil carbon sequestration. However, next to croplands, other agricultural land such as meadows and pastures where herbaceous forage crops are grown, provide potential to store carbon (Sommer and Bossio, 2014; Tessema et al., 2020). Bai and Cotrufo (2022) provides estimates of the global potential for soil carbon sequestration through grassland restoration, with mean theoretical, realistic, and achievable capacities of 10.2, 6.8, and 3.4 billion t CO2 equivalents per year, respectively. Converted to SOC after 20 years, these values correspond to 55.6, 37.0 and 18.6 PgC, respectively. Compared to estimated range of 29 to 65 PgC realistic storage potential in croplands, these values are slightly lower (Zomer et al., 2017; Padarian et al., 2022). Nevertheless, grassland areas could also provide eco-hydrological co-benefits, with magnitudes similar to the Medium scenario of croplands.
This study focused on mean changes as a first step in assessing the hydrological co-benefits of soil carbon sequestration. However, its potential becomes clearer when considering its role in mitigating drought risk and reducing irrigation water demand. This is particularly relevant in the context of climate change, as drought frequency is projected to increase (Pokhrel et al., 2021). To better quantify these benefits, future studies should account for precipitation anomalies and evolving drought conditions rather than relying solely on mean changes. Additionally, our approach, which prescribes vegetation phenology, does not capture soil carbon dynamics, vegetation responses or land-atmosphere feedbacks. To fully assess the impact of soil carbon sequestration under different climate change scenarios, future research should employ dynamic vegetation models coupled to the atmosphere.
This study presents a sensitivity experiment using CTSM to assess the eco-hydrological co-benefits of soil carbon sequestration under policy-relevant scenarios. By prescribing atmospheric conditions and vegetation phenology, we isolate the direct effects of SOC on soil water dynamics.
Our simulation experiments with CTSM show that soil carbon sequestration enhances the soil’s water-holding capacity, improving its ability to retain moisture. Across most regions, total soil water content increases, primarily due to higher moisture levels in the upper 30 cm, where soil carbon sequestration is applied, while deeper layers often experience slight reductions – particularly in sandy and arid regions. However, the increase in soil water content is insufficient to fully offset the rise in water-holding capacity, leading to less saturated upper layers. Despite this, simulations indicate increased vegetation transpiration, suggesting greater water availability for plant uptake, especially in clay-rich soils, which indicates that the partitioning of the available precipitation shifts to less surface and subsurface runoff and more evapotranspiration. This effect is particularly relevant for annual water stress, which is consistently reduced. However, the overall impact remains limited, reflecting the relatively small but realistic forcing applied in the three scenarios.
Our findings demonstrate the value of global land surface models for identifying regional differences in eco-hydrological co-benefits of soil carbon sequestration, supporting locally relevant climate mitigation and adaptation strategies. Future work could build on this work by incorporating multiple land surface models with varying soil hydrological parameterizations and conducting coupled simulations to explore potential atmospheric feedbacks, particularly through changes in evapotranspiration. As interest in soil carbon sequestration restoration grows (Amelung et al., 2020), its potential to provide co-benefits by increasing plant available water availability should be carefully considered.
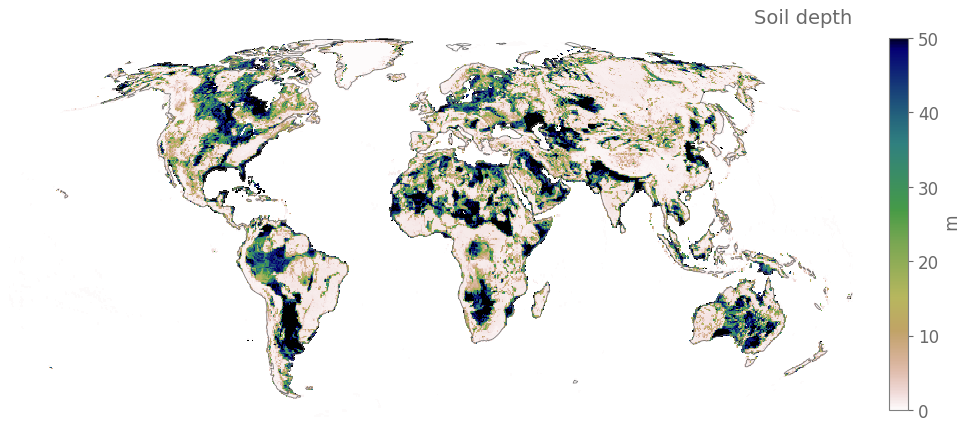
Figure A1Soil depth map used as input in CTSM5.1.
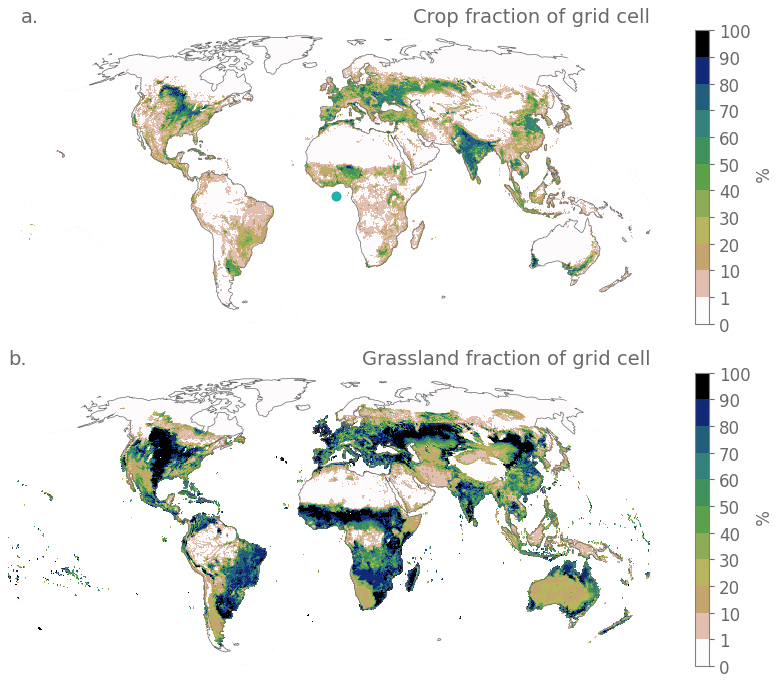
Figure A2(a) Crop fraction and (b) grassland fraction of the grid cells as prescribed by the surface datasets in CTSM5.1.
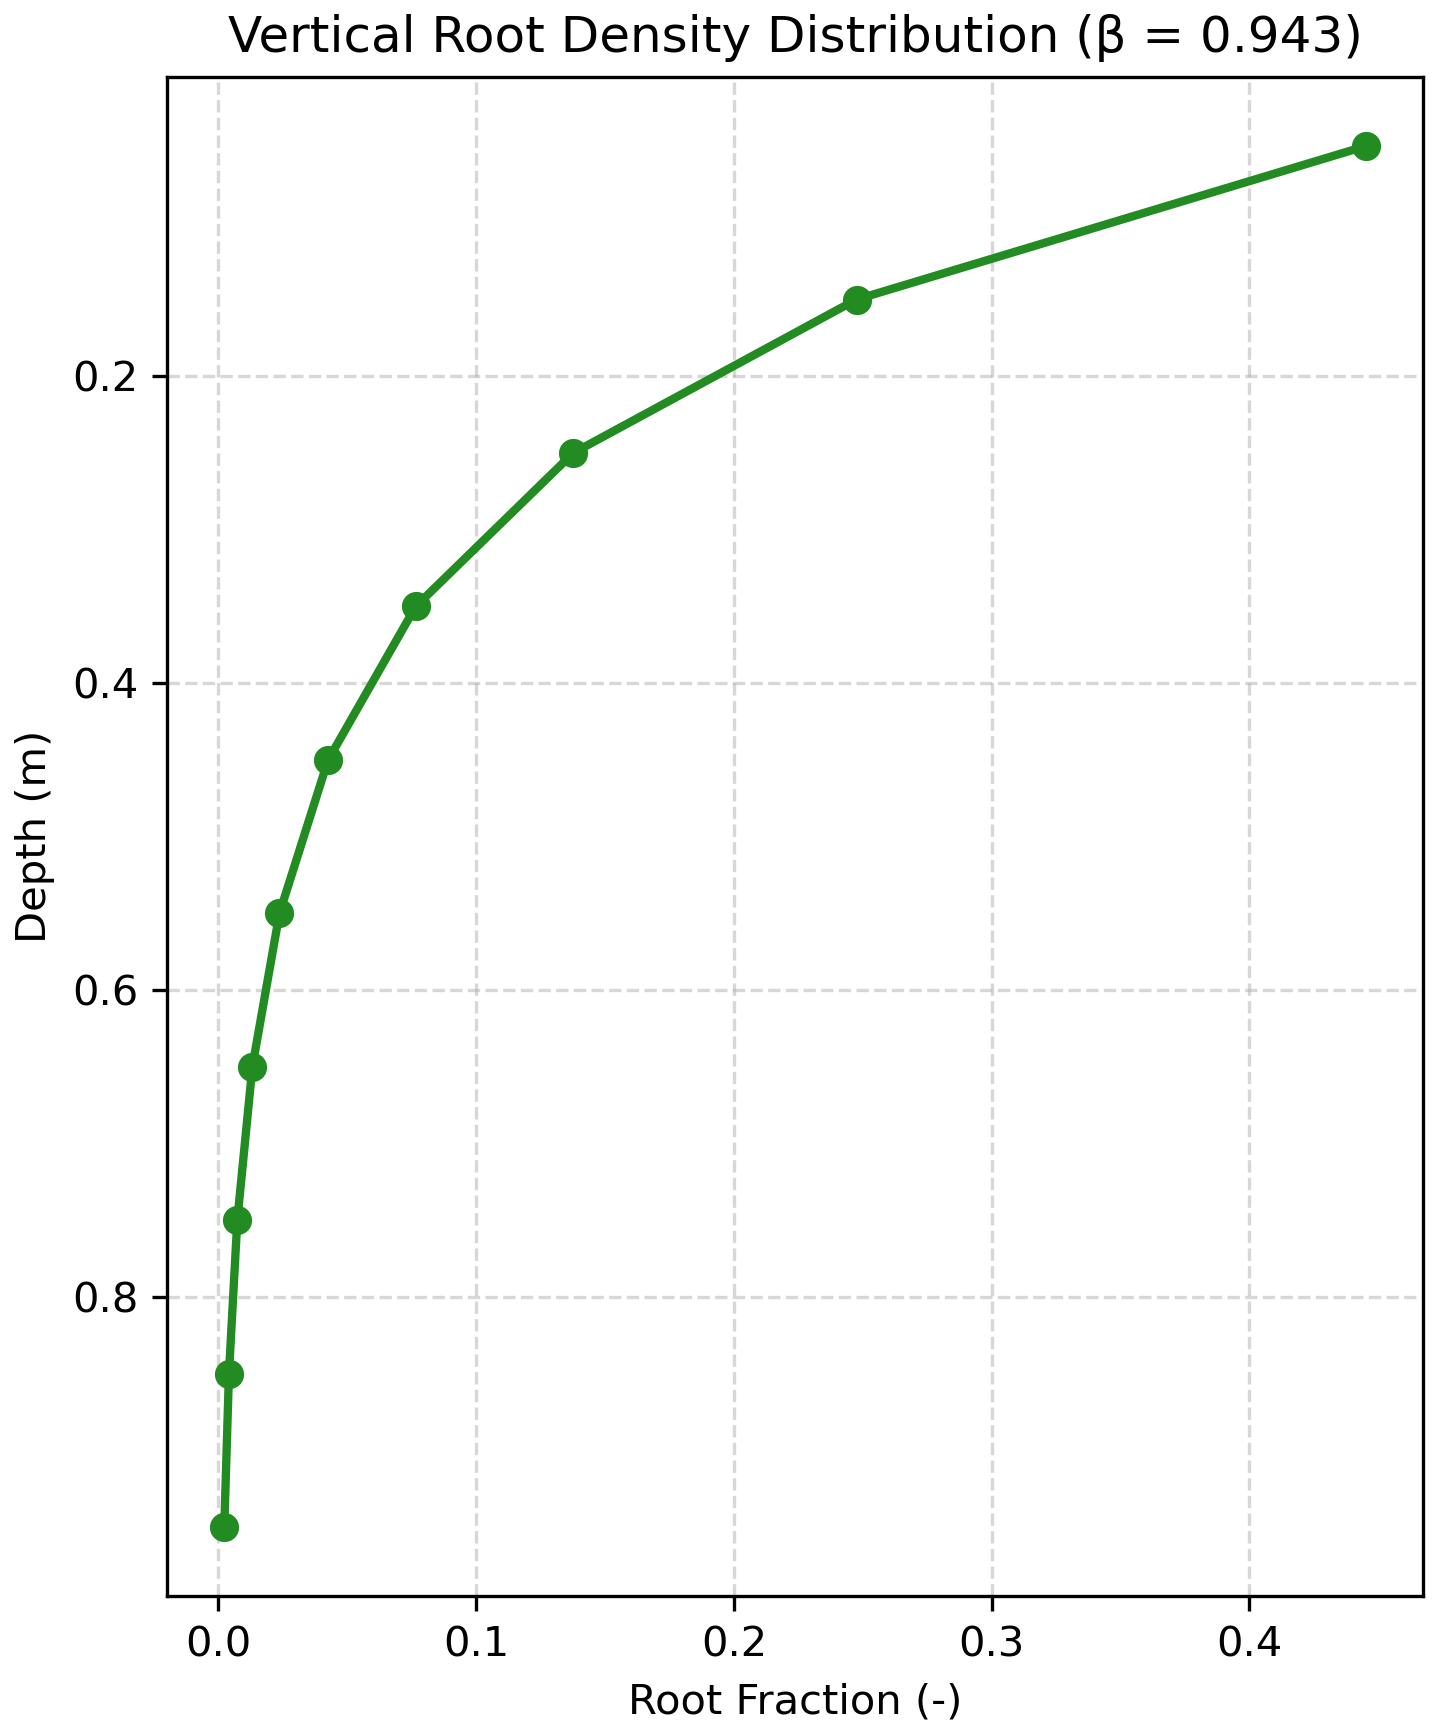
Figure A3Vertical root density distribution for crops, calculated using the root distribution parameter β=0.943 following Lawrence et al. (2018). The figure shows the normalized fraction of roots per soil layer (ri), derived from the vertical root distribution equation , where zh denotes soil layer boundaries in meters. Depth increases downward.
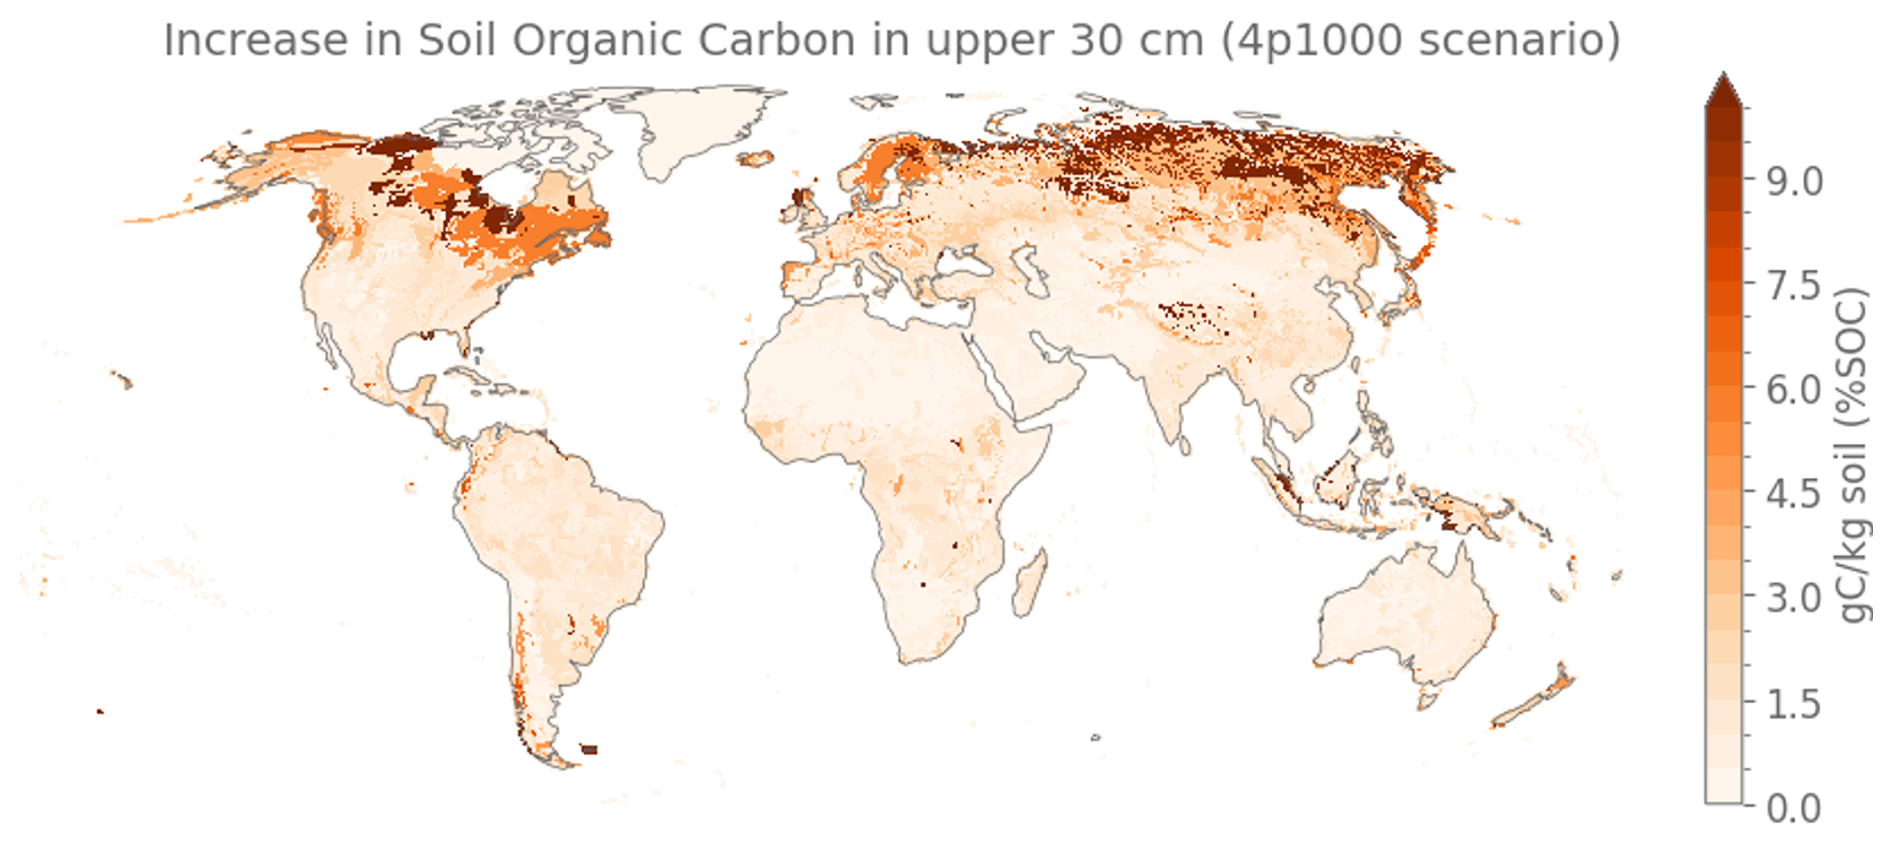
Figure A4Increase in SOC in the top 30 cm following the 4p1000 scenario, assuming a 0.4 % annual increase of the current carbon stocks over a period of 20 years, corresponding to an 8 % increase of present-day SOC.
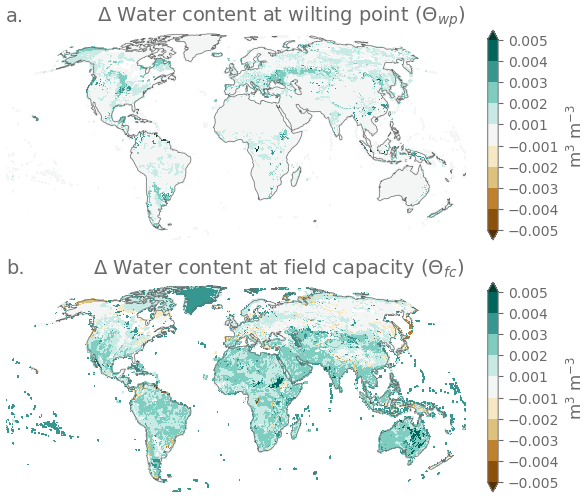
Figure A5Effect of soil carbon sequestration on the water content at wilting point and field capacity. (a) Difference in the High and CTL scenarios for all land grid cells in the soil columns volumetric water content at permanent wilting point and (b) field capacity, all weighted averages over the first 10 soil layers of CTSM. Grid cells with organic soils (organic carbon content > 120 gC kg−1 soil) are excluded from the analysis.
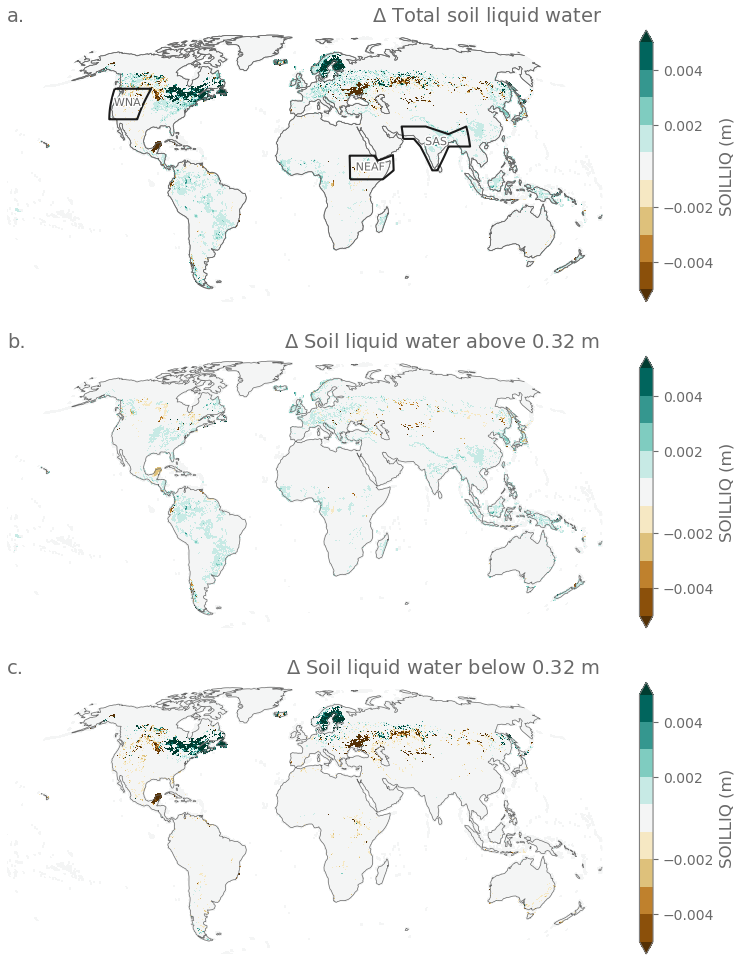
Figure A6As Fig. 3, but for the 4p1000 scenario.
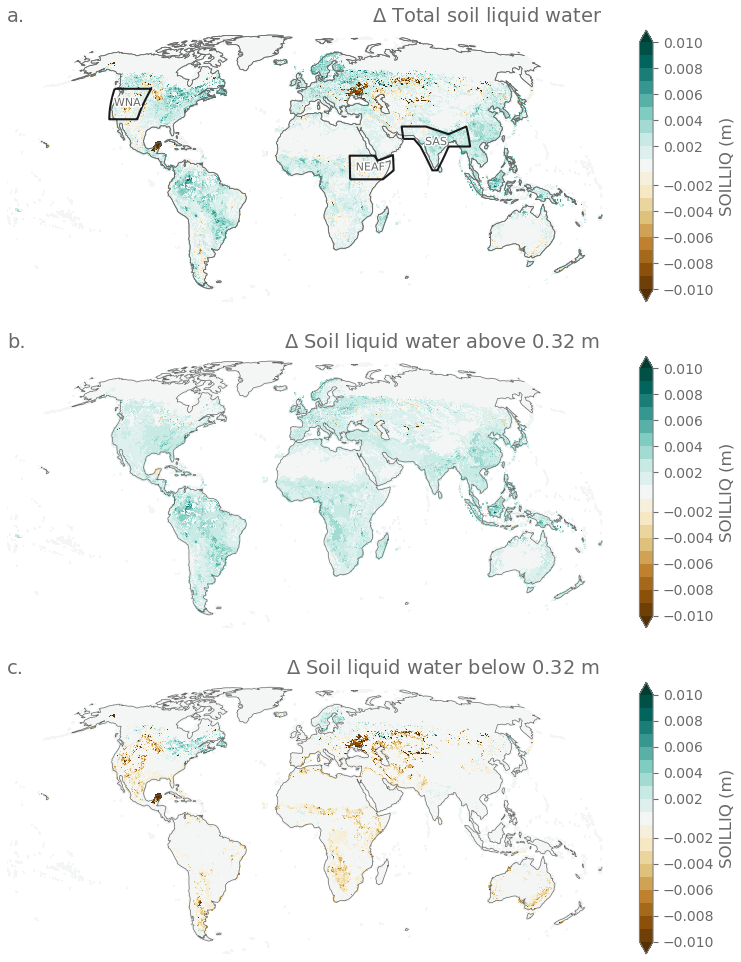
Figure A7As Fig. A7, but for the medium scenario.
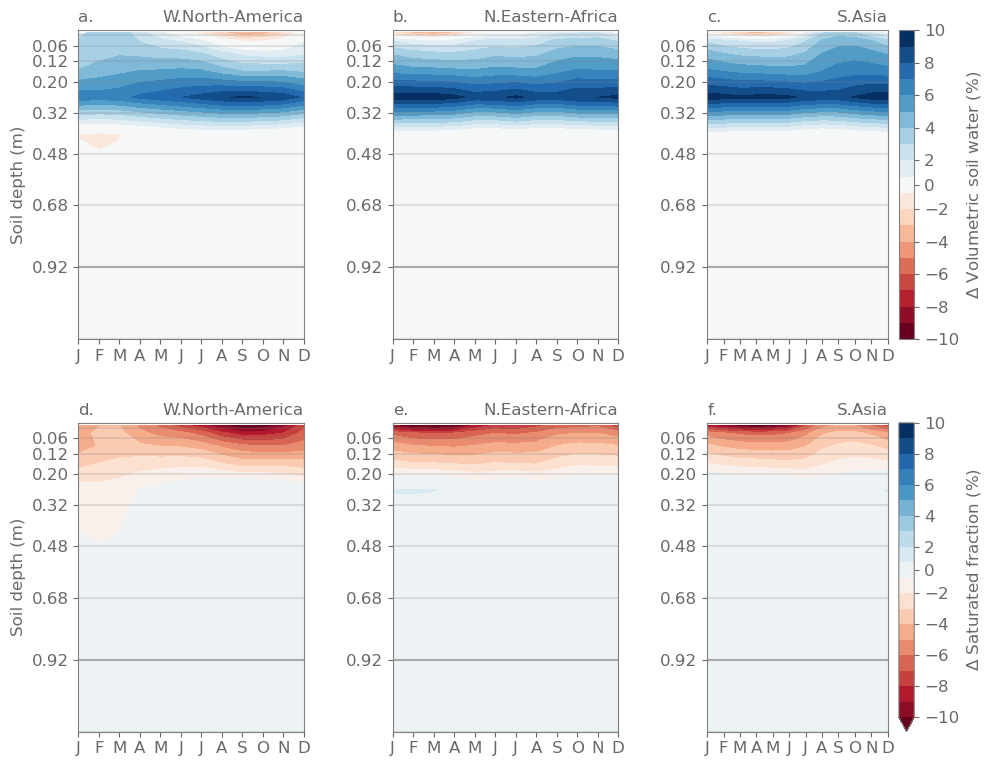
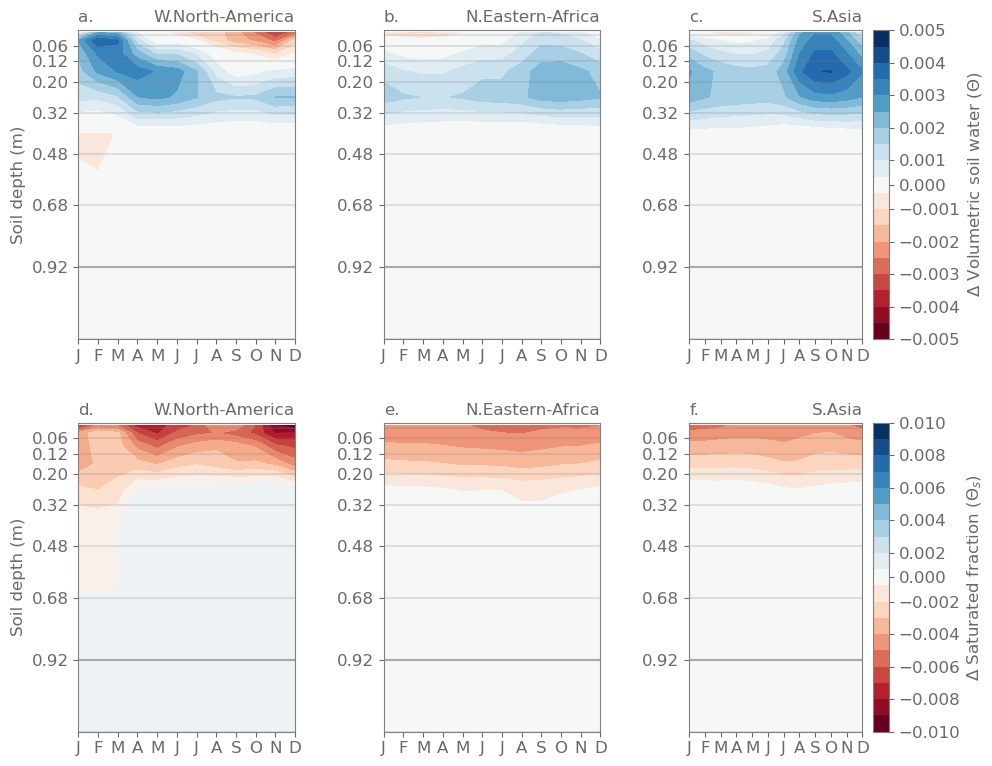
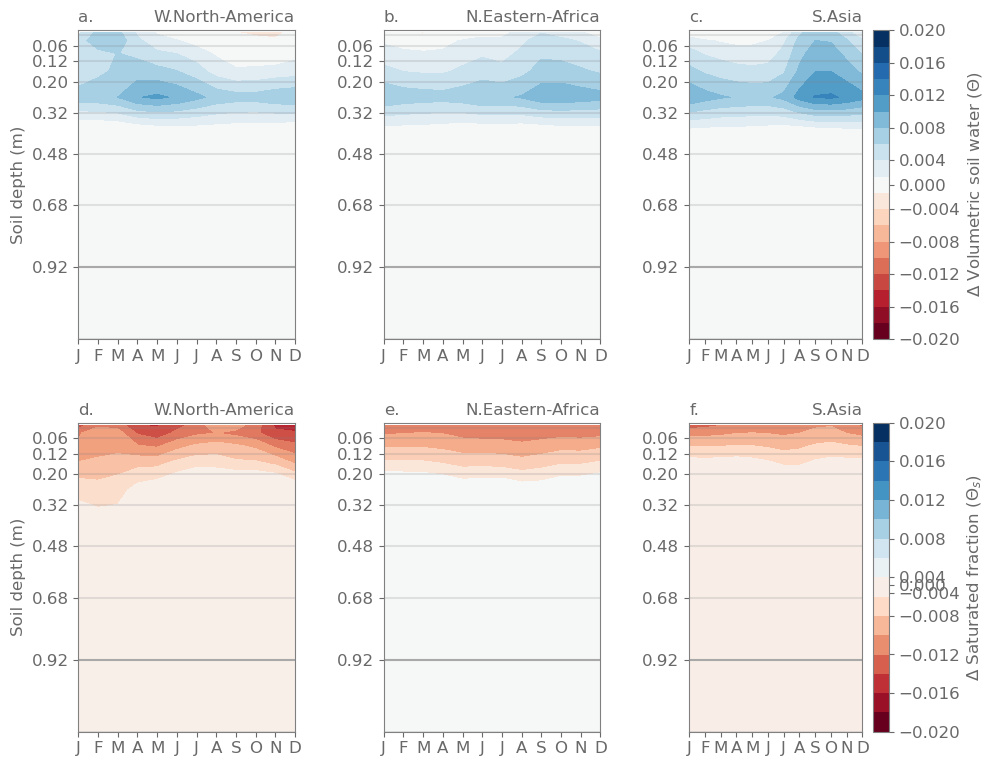
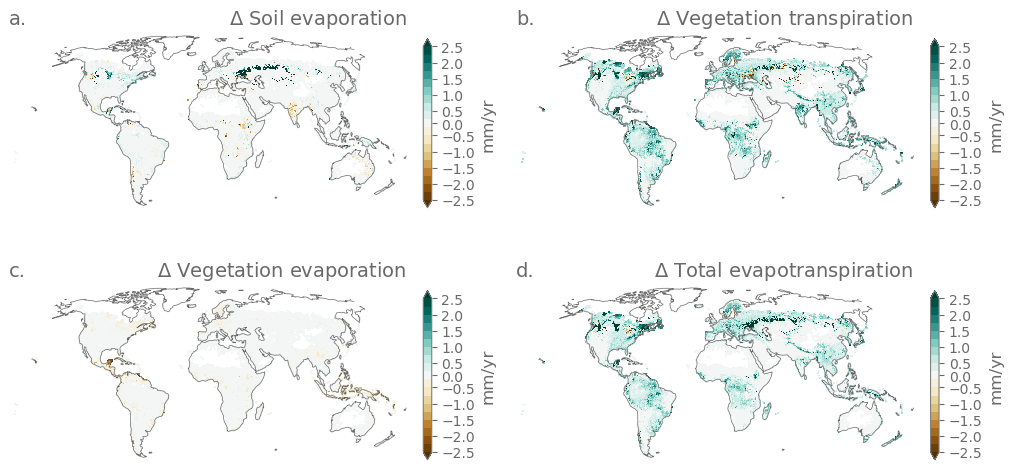
Figure A11As Fig. 5, but for the 4p1000 scenario.
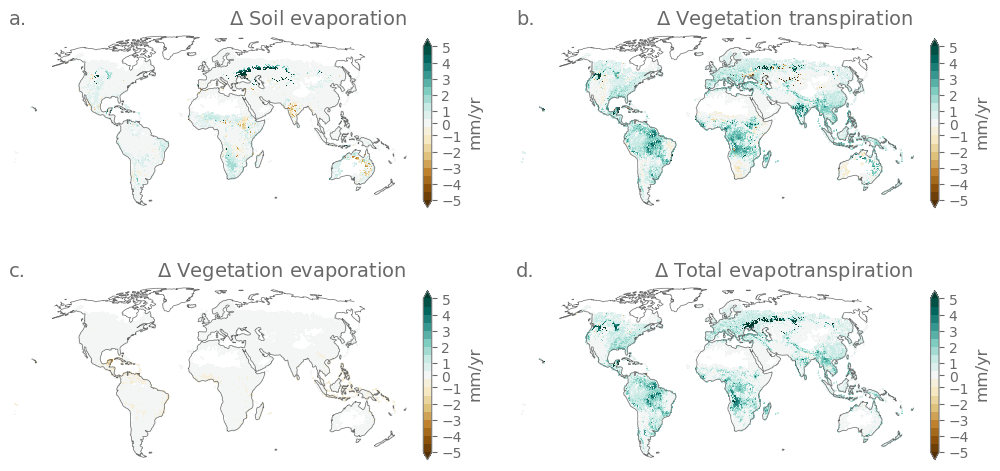
Figure A12As Fig. 5, but for the medium scenario.
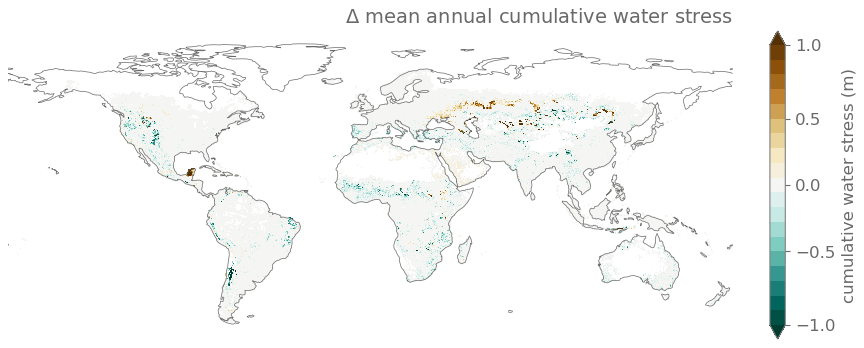
Figure A13As Fig. 6, but for the 4p1000 scenario.
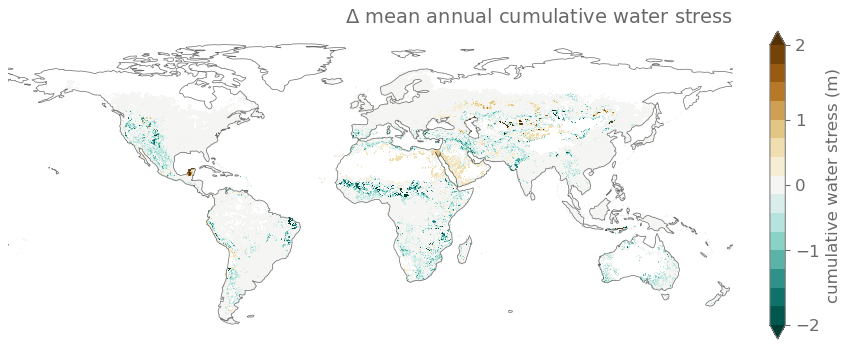
Figure A14As Fig. 6, but for the medium scenario.
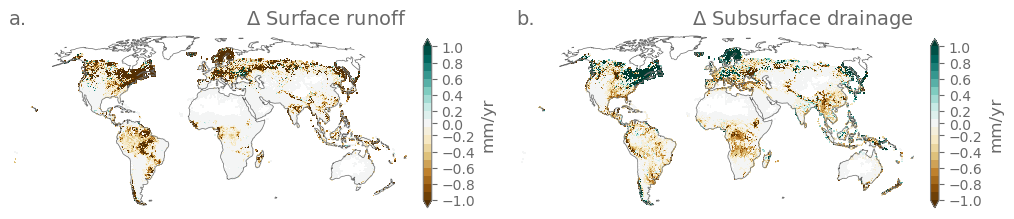
Figure A15As Fig. 7, but for the 4p1000 scenario.
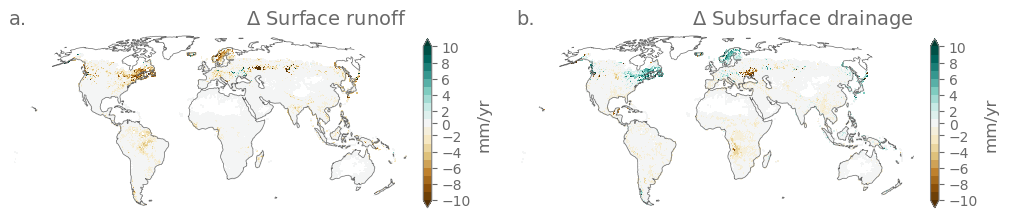
Figure A16As Fig. 7, but for the medium scenario.
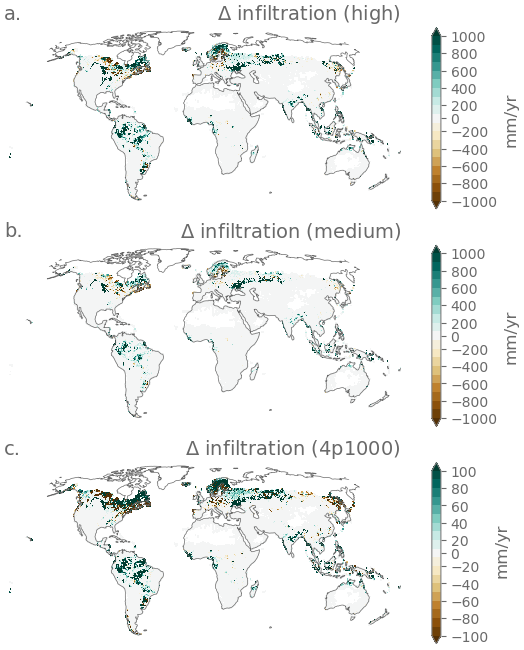
Figure A17Effect of soil carbon sequestration on infiltration following the (a) High, (b) Medium and (c) 4p1000 scenarios. Grid cells with organic soils (organic carbon content > 120 gC kg−1 soil) are excluded from the analysis.
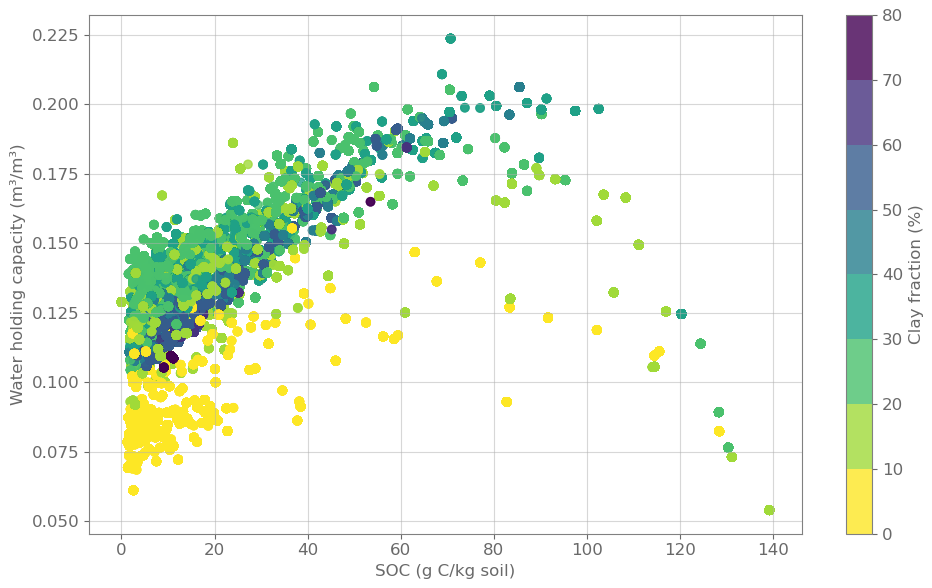
Figure A18Change in water holding capacity with increasing soil organic carbon. Scatterplot showing the relationship between soil organic carbon (SOC) and water holding capacity (difference between water content at field capacity (θfc and wilting point θwp)) for 10 soil levels of every grid cell. Points are colored by clay fraction to indicate soil texture. Grid cells with organic soils (organic carbon content > 120 gC kg−1 soil) are excluded from the analysis.
The WISE30sec dataset described in Batjes (2016) is available at https://data.isric.org/geonetwork/srv/api/records/dc7b283a-8f19-45e1-aaed-e9bd515119bc (last access: 4 June 2026). CTSM is available through the following repository: https://github.com/ESCOMP/CTSM (last access: 4 June 2026). The scripts used in this study are available at: https://github.com/Ivanderkelen/Vanderkelen_etal_2025_BG (last access: 4 June 2026) with the DOI: https://doi.org/10.5281/zenodo.15561257 (Vanderkelen, 2025a). Finally, the created input data, ancillary data and model output are available on Zenodo at https://doi.org/10.5281/zenodo.15552986 (Vanderkelen, 2025b).
IV and ELD designed the study. IV performed the analysis and wrote the manuscript. SS and DL provided scientific input on CTSM responses and source code. IV wrote the manuscript with major contributions from MED, BDS and MK and input from all other authors. All authors critically revised the draft and gave final approval for publication.
The authors have the following competing interests: Some authors are members of the editorial board of Biogeosciences.
Publisher's note: Copernicus Publications remains neutral with regard to jurisdictional claims made in the text, published maps, institutional affiliations, or any other geographical representation in this paper. The authors bear the ultimate responsibility for providing appropriate place names. Views expressed in the text are those of the authors and do not necessarily reflect the views of the publisher.
IV acknowledges the support of the Belgian Science Policy Office (FED-tWIN grant “COVERED”). The authors are grateful to the Swiss National Supercomputing Centre (CSCS, Switzerland) for awarding access to Piz Daint. We thank Dr. Petra Sieber for helping with the porting of CTSM on Piz Daint and Daria Vuistiner for the design of Fig. 9.
This research has been supported by the Belgian Federal Science Policy Office (grant no. Prf-2022-043) and the Centro Svizzero di Calcolo Scientifico (grant no. s1207).
This paper was edited by Cornelius Senf and reviewed by three anonymous referees.
Amelung, W., Bossio, D., de Vries, W., Kögel-Knabner, I., Lehmann, J., Amundson, R., Bol, R., Collins, C., Lal, R., Leifeld, J., Minasny, B., Pan, G., Paustian, K., Rumpel, C., Sanderman, J., van Groenigen, J. W., Mooney, S., van Wesemael, B., Wander, M., and Chabbi, A.: Towards a global-scale soil climate mitigation strategy, Nat. Commun., 11, 5427, https://doi.org/10.1038/s41467-020-18887-7, 2020. a, b, c, d
Araya, S. N., Mitchell, J. P., Hopmans, J. W., and Ghezzehei, T. A.: Long-term impact of cover crop and reduced disturbance tillage on soil pore size distribution and soil water storage, SOIL, 8, 177–198, https://doi.org/10.5194/soil-8-177-2022, 2022. a, b
Arenas-Calle, L. N., Ramirez-Villegas, J., Whitfield, S., and Challinor, A. J.: Design of a Soil-based Climate-Smartness Index (SCSI) using the trend and variability of yields and soil organic carbon, Agr. Syst., 190, 103086, https://doi.org/10.1016/j.agsy.2021.103086, 2021. a
Bagnall, D. K., Morgan, C. L. S., Cope, M., Bean, G. M., Cappellazzi, S., Greub, K., Liptzin, D., Norris, C. L., Rieke, E., Tracy, P., Aberle, E., Ashworth, A., Bañuelos Tavarez, O., Bary, A., Baumhardt, R. L., Borbón Gracia, A., Brainard, D., Brennan, J., Briones Reyes, D., Bruhjell, D., Carlyle, C., Crawford, J., Creech, C., Culman, S., Deen, W., Dell, C., Derner, J., Ducey, T., Duiker, S. W., Dyck, M., Ellert, B., Entz, M., Espinosa Solorio, A., Fonte, S. J., Fonteyne, S., Fortuna, A.-M., Foster, J., Fultz, L., Gamble, A. V., Geddes, C., Griffin-LaHue, D., Grove, J., Hamilton, S. K., Hao, X., Hayden, Z. D., Howe, J., Ippolito, J., Johnson, G., Kautz, M., Kitchen, N., Kumar, S., Kurtz, K., Larney, F., Lewis, K., Liebman, M., Lopez Ramirez, A., Machado, S., Maharjan, B., Martinez Gamiño, M. A., May, W., McClaran, M., McDaniel, M., Millar, N., Mitchell, J. P., Moore, P. A., Moore, A., Mora Gutiérrez, M., Nelson, K. A., Omondi, E., Osborne, S., Alcalá, L. O., Owens, P., Pena-Yewtukhiw, E. M., Poffenbarger, H., Ponce Lira, B., Reeve, J., Reinbott, T., Reiter, M., Ritchey, E., Roozeboom, K. L., Rui, I., Sadeghpour, A., Sainju, U. M., Sanford, G., Schillinger, W., Schindelbeck, R. R., Schipanski, M., Schlegel, A., Scow, K., Sherrod, L., Sidhu, S., Solís Moya, E., St. Luce, M., Strock, J., Suyker, A., Sykes, V., Tao, H., Trujillo Campos, A., Van Eerd, L. L., Verhulst, N., Vyn, T. J., Wang, Y., Watts, D., Wright, D., Zhang, T., and Honeycutt, C. W.: Carbon-sensitive pedotransfer functions for plant available water, Soil Sci. Soc. Am. J., 86, 612–629, https://doi.org/10.1002/saj2.20395, 2022. a, b
Bai, Y. and Cotrufo, M. F.: Grassland soil carbon sequestration: Current understanding, challenges, and solutions, Science, 377, 603–608, https://doi.org/10.1126/science.abo2380, 2022. a
Batjes, N.: Total carbon and nitrogen in the soils of the world, Eur. J. Soil Sci., 47, 151–163, https://doi.org/10.1111/j.1365-2389.1996.tb01386.x, 1996. a
Batjes, N. H.: Harmonized soil property values for broad-scale modelling (WISE30sec) with estimates of global soil carbon stocks, Geoderma, 269, 61–68, https://doi.org/10.1016/j.geoderma.2016.01.034, 2016. a, b
Bossio, D. A., Cook-Patton, S. C., Ellis, P. W., Fargione, J., Sanderman, J., Smith, P., Wood, S., Zomer, R. J., von Unger, M., Emmer, I. M., and Griscom, B. W.: The role of soil carbon in natural climate solutions, Nature Sustainability, 3, 391–398, https://doi.org/10.1038/s41893-020-0491-z, 2020. a, b
Bowling, L. C., Cherkauer, K. A., Lee, C. I., Beckerman, J. L., Brouder, S., Buzan, J. R., Doering, O. C., Dukes, J. S., Ebner, P. D., Frankenberger, J. R., Gramig, B. M., Kladivko, E. J., and Volenec, J. J.: Agricultural impacts of climate change in Indiana and potential adaptations, Climatic Change, 163, 2005–2027, https://doi.org/10.1007/s10584-020-02934-9, 2020. a
Chabbi, A., Lehmann, J., Ciais, P., Loescher, H. W., Cotrufo, M. F., Don, A., SanClements, M., Schipper, L., Six, J., Smith, P., and Rumpel, C.: Aligning agriculture and climate policy, Nat. Clim. Change, 7, 307–309, https://doi.org/10.1038/nclimate3286, 2017. a, b
Cheng, Y., Huang, M., Zhu, B., Bisht, G., Zhou, T., Liu, Y., Song, F., and He, X.: Validation of the Community Land Model Version 5 Over the Contiguous United States (CONUS) Using In Situ and Remote Sensing Data Sets, J. Geophys. Res.-Atmos., 126, e2020JD033 539, https://doi.org/10.1029/2020JD033539, 2021. a
Clapp, R. B. and Hornberger, G. M.: Empirical equations for some soil hydraulic properties, Water Resour. Res., 14, 601–604, https://doi.org/10.1029/WR014i004p00601, 1978. a, b
Compo, G. P., Whitaker, J. S., Sardeshmukh, P. D., Matsui, N., Allan, R. J., Yin, X., Gleason, B. E., Vose, R. S., Rutledge, G., Bessemoulin, P., Brönimann, S., Brunet, M., Crouthamel, R. I., Grant, A. N., Groisman, P. Y., Jones, P. D., Kruk, M. C., Kruger, A. C., Marshall, G. J., Maugeri, M., Mok, H. Y., Nordli, O., Ross, T. F., Trigo, R. M., Wang, X. L., Woodruff, S. D., and Worley, S. J.: The Twentieth Century Reanalysis Project, Q. J. Roy. Meteor. Soc., 137, 1–28, https://doi.org/10.1002/qj.776, 2011. a
de Vries, W.: Soil carbon 4 per mille: a good initiative but let's manage not only the soil but also the expectations: Comment on Minasny et al. (2017) Geoderma 292: 59–86, Geoderma, 309, 111–112, https://doi.org/10.1016/j.geoderma.2017.05.023, 2018. a
Fatichi, S., Or, D., Walko, R., Vereecken, H., Young, M. H., Ghezzehei, T. A., Hengl, T., Kollet, S., Agam, N., and Avissar, R.: Soil structure is an important omission in Earth System Models, Nat. Commun., 11, 522, https://doi.org/10.1038/s41467-020-14411-z, 2020. a
Felfelani, F., Lawrence, D. M., and Pokhrel, Y.: Representing Intercell Lateral Groundwater Flow and Aquifer Pumping in the Community Land Model, Water Resour. Res., 57, e2020WR027531, https://doi.org/10.1029/2020WR027531, 2020. a
Hurtt, G. C., Chini, L., Sahajpal, R., Frolking, S., Bodirsky, B. L., Calvin, K., Doelman, J. C., Fisk, J., Fujimori, S., Klein Goldewijk, K., Hasegawa, T., Havlik, P., Heinimann, A., Humpenöder, F., Jungclaus, J., Kaplan, J. O., Kennedy, J., Krisztin, T., Lawrence, D., Lawrence, P., Ma, L., Mertz, O., Pongratz, J., Popp, A., Poulter, B., Riahi, K., Shevliakova, E., Stehfest, E., Thornton, P., Tubiello, F. N., van Vuuren, D. P., and Zhang, X.: Harmonization of global land use change and management for the period 850–2100 (LUH2) for CMIP6, Geosci. Model Dev., 13, 5425–5464, https://doi.org/10.5194/gmd-13-5425-2020, 2020. a
Iizumi, T. and Wagai, R.: Leveraging drought risk reduction for sustainable food, soil and climate via soil organic carbon sequestration, Scientific Reports, 9, 19744, https://doi.org/10.1038/s41598-019-55835-y, 2019. a, b, c
Ito, A., Hajima, T., Lawrence, D. M., Brovkin, V., Delire, C., Guenet, B., Jones, C. D., Malyshev, S., Materia, S., McDermid, S. P., Peano, D., Pongratz, J., Robertson, E., Shevliakova, E., Vuichard, N., Wårlind, D., Wiltshire, A., and Ziehn, T.: Soil carbon sequestration simulated in CMIP6-LUMIP models: implications for climatic mitigation, Environ. Res. Lett., 15, 124061, https://doi.org/10.1088/1748-9326/abc912, 2020. a
Iturbide, M., Gutiérrez, J. M., Alves, L. M., Bedia, J., Cerezo-Mota, R., Cimadevilla, E., Cofiño, A. S., Di Luca, A., Faria, S. H., Gorodetskaya, I. V., Hauser, M., Herrera, S., Hennessy, K., Hewitt, H. T., Jones, R. G., Krakovska, S., Manzanas, R., Martínez-Castro, D., Narisma, G. T., Nurhati, I. S., Pinto, I., Seneviratne, S. I., van den Hurk, B., and Vera, C. S.: An update of IPCC climate reference regions for subcontinental analysis of climate model data: definition and aggregated datasets, Earth Syst. Sci. Data, 12, 2959–2970, https://doi.org/10.5194/essd-12-2959-2020, 2020. a
Jordán, A., Zavala, L. M., and Gil, J.: Effects of mulching on soil physical properties and runoff under semi-arid conditions in southern Spain, CATENA, 81, 77–85, https://doi.org/10.1016/j.catena.2010.01.007, 2010. a
Kane, D. A., Bradford, M. A., Fuller, E., Oldfield, E. E., and Wood, S. A.: Soil organic matter protects US maize yields and lowers crop insurance payouts under drought, Environ. Res. Lett., 16, 044018, https://doi.org/10.1088/1748-9326/abe492, 2021. a, b
Kennedy, D., Swenson, S., Oleson, K. W., Lawrence, D. M., Fisher, R., Lola da Costa, A. C., and Gentine, P.: Implementing Plant Hydraulics in the Community Land Model, Version 5, J. Adv. Model. Earth Sy., 11, 485–513, https://doi.org/10.1029/2018MS001500, 2019. a, b, c
Lal, R.: Soil Carbon Sequestration Impacts on Global Climate Change and Food Security, Science, 304, 1623–1627, https://doi.org/10.1126/science.1097396, 2004. a
Lal, R.: Beyond COP 21: Potential and challenges of the “4 per Thousand” initiative, J. Soil Water Conserv., 71, 20A–25A, https://doi.org/10.2489/jswc.71.1.20A, 2016. a
Lawrence, D., Fisher, R., Koven, C. D., Oleson, K., Swenson, S., and Vertenstein, M.: Technical Description of version 5.0 of the Community Land Model (CLM), https://www2.cesm.ucar.edu/models/cesm2/land/CLM50_Tech_Note.pdf (last access: 4 June 2026), 2018. a, b, c, d, e, f, g
Lawrence, D. M., Fisher, R. A., Koven, C. D., Oleson, K. W., Swenson, S. C., Bonan, G., Collier, N., Ghimire, B., van Kampenhout, L., Kennedy, D., Kluzek, E., Lawrence, P. J., Li, F., Li, H., Lombardozzi, D., Riley, W. J., Sacks, W. J., Shi, M., Vertenstein, M., Wieder, W. R., Xu, C., Ali, A. A., Badger, A. M., Bisht, G., van den Broeke, M., Brunke, M. A., Burns, S. P., Buzan, J., Clark, M., Craig, A., Dahlin, K., Drewniak, B., Fisher, J. B., Flanner, M., Fox, A. M., Gentine, P., Hoffman, F., Keppel-Aleks, G., Knox, R., Kumar, S., Lenaerts, J., Leung, L. R., Lipscomb, W. H., Lu, Y., Pandey, A., Pelletier, J. D., Perket, J., Randerson, J. T., Ricciuto, D. M., Sanderson, B. M., Slater, A., Subin, Z. M., Tang, J., Thomas, R. Q., Val Martin, M., and Zeng, X.: The Community Land Model Version 5: Description of New Features, Benchmarking, and Impact of Forcing Uncertainty, J. Adv. Model. Earth Sy., 11, 4245–4287, https://doi.org/10.1029/2018MS001583, 2019. a, b, c, d
Letts, M. G., Roulet, N. T., Comer, N. T., Skarupa, M. R., and Verseghy, D. L.: Parametrization of peatland hydraulic properties for the Canadian land surface scheme, Atmos. Ocean, 38, 141–160, https://doi.org/10.1080/07055900.2000.9649643, 2000. a
Luo, Y., Ahlström, A., Allison, S. D., Batjes, N. H., Brovkin, V., Carvalhais, N., Chappell, A., Ciais, P., Davidson, E. A., Finzi, A., Georgiou, K., Guenet, B., Hararuk, O., Harden, J. W., He, Y., Hopkins, F., Jiang, L., Koven, C., Jackson, R. B., Jones, C. D., Lara, M. J., Liang, J., McGuire, A. D., Parton, W., Peng, C., Randerson, J. T., Salazar, A., Sierra, C. A., Smith, M. J., Tian, H., Todd-Brown, K. E. O., Torn, M., van Groenigen, K. J., Wang, Y. P., West, T. O., Wei, Y., Wieder, W. R., Xia, J., Xu, X., Xu, X., and Zhou, T.: Toward more realistic projections of soil carbon dynamics by Earth system models, Global Biogeochem. Cy., 30, 40–56, https://doi.org/10.1002/2015GB005239, 2016. a
McDermid, S. S., Weng, E., Puma, M., Cook, B., Hengl, T., Sanderman, J., Lannoy, G. J. M. D., and Aleinov, I.: Soil Carbon Losses Reduce Soil Moisture in Global Climate Model Simulations, Earth Interact., 26, 195–208, https://doi.org/10.1175/EI-D-22-0003.1, 2022. a
Minasny, B. and McBratney, A. B.: Limited effect of organic matter on soil available water capacity, Eur. J. Soil Sci., 69, 39–47, https://doi.org/10.1111/ejss.12475, 2018. a, b, c, d, e, f
Minasny, B., Malone, B. P., McBratney, A. B., Angers, D. A., Arrouays, D., Chambers, A., Chaplot, V., Chen, Z.-S., Cheng, K., Das, B. S., Field, D. J., Gimona, A., Hedley, C. B., Hong, S. Y., Mandal, B., Marchant, B. P., Martin, M., McConkey, B. G., Mulder, V. L., O'Rourke, S., Richer-de Forges, A. C., Odeh, I., Padarian, J., Paustian, K., Pan, G., Poggio, L., Savin, I., Stolbovoy, V., Stockmann, U., Sulaeman, Y., Tsui, C.-C., Vågen, T.-G., van Wesemael, B., and Winowiecki, L.: Soil carbon 4 per mille, Geoderma, 292, 59–86, https://doi.org/10.1016/j.geoderma.2017.01.002, 2017. a, b
Padarian, J., Minasny, B., McBratney, A., and Smith, P.: Soil carbon sequestration potential in global croplands, PeerJ, 10, e13740, https://doi.org/10.7717/peerj.13740, 2022. a, b, c, d
Panagea, I. S., Berti, A., Čermak, P., Diels, J., Elsen, A., Kusá, H., Piccoli, I., Poesen, J., Stoate, C., Tits, M., Toth, Z., and Wyseure, G.: Soil Water Retention as Affected by Management Induced Changes of Soil Organic Carbon: Analysis of Long-Term Experiments in Europe, Land, 10, 1362, https://doi.org/10.3390/land10121362, 2021. a, b, c
Paustian, K., Lehmann, J., Ogle, S., Reay, D., Robertson, G. P., and Smith, P.: Climate-smart soils, Nature, 532, 49–57, https://doi.org/10.1038/nature17174, 2016. a, b, c
Pelletier, J. D., Broxton, P. D., Hazenberg, P., Zeng, X., Troch, P. A., Niu, G.-Y., Williams, Z., Brunke, M. A., and Gochis, D.: A gridded global data set of soil, intact regolith, and sedimentary deposit thicknesses for regional and global land surface modeling, J. Adv. Model. Earth Sy., 8, 41–65, https://doi.org/10.1002/2015MS000526, 2016. a
Pokhrel, Y., Felfelani, F., Satoh, Y., Boulange, J., Burek, P., Gädeke, A., Gerten, D., Gosling, S. N., Grillakis, M., Gudmundsson, L., Hanasaki, N., Kim, H., Koutroulis, A., Liu, J., Papadimitriou, L., Schewe, J., Müller Schmied, H., Stacke, T., Telteu, C. E., Thiery, W., Veldkamp, T., Zhao, F., and Wada, Y.: Global terrestrial water storage and drought severity under climate change, Nat. Clim. Change, 11, 226–233, https://doi.org/10.1038/s41558-020-00972-w, 2021. a
Rumpel, C., Amiraslani, F., Koutika, L.-S., Smith, P., Whitehead, D., and Wollenberg, E.: Put more carbon in soils to meet Paris climate pledges, Nature, 564, 32–34, https://doi.org/10.1038/d41586-018-07587-4, 2018. a
Rumpel, C., Amiraslani, F., Chenu, C., Garcia Cardenas, M., Kaonga, M., Koutika, L.-S., Ladha, J., Madari, B., Shirato, Y., Smith, P., Soudi, B., Soussana, J.-F., Whitehead, D., and Wollenberg, E.: The 4p1000 initiative: Opportunities, limitations and challenges for implementing soil organic carbon sequestration as a sustainable development strategy, Ambio, 49, 350–360, https://doi.org/10.1007/s13280-019-01165-2, 2020. a, b, c
Sanderman, J., Hengl, T., and Fiske, G. J.: Soil carbon debt of 12,000 years of human land use, P. Natl. Acad. Sci. USA, 114, 9575–9580, https://doi.org/10.1073/pnas.1706103114, 2017. a, b
Skadell, L. E., Dettmann, U., Guggenberger, G., and Don, A.: Effects of Agricultural Management on Water Retention via Changes in Organic Carbon in Topsoil and Subsoil, J. Plant Nutr. Soil Sc., 188, 949–963, https://doi.org/10.1002/jpln.70004, 2025. a, b
Sommer, R. and Bossio, D.: Dynamics and climate change mitigation potential of soil organic carbon sequestration, J. Environ. Manage., 144, 83–87, https://doi.org/10.1016/j.jenvman.2014.05.017, 2014. a, b, c, d
Tessema, B., Sommer, R., Piikki, K., Söderström, M., Namirembe, S., Notenbaert, A., Tamene, L., Nyawira, S., and Paul, B.: Potential for soil organic carbon sequestration in grasslands in East African countries: A review, Grassl. Sci., 66, 135–144, https://doi.org/10.1111/grs.12267, 2020. a
Turek, M. E., Nemes, A., and Holzkämper, A.: Sequestering carbon in the subsoil benefits crop transpiration at the onset of drought, SOIL, 9, 545–560, https://doi.org/10.5194/soil-9-545-2023, 2023. a, b
Vanderkelen, I.: Ivanderkelen/Vanderkelen_etal_2025_BG: v0.11, Zenodo [code], https://doi.org/10.5281/zenodo.15561257, 2025a. a
Vanderkelen, I.: Data of “Global quantification of the eco-hydrological co-benefits of soil carbon sequestration”, v0.1, Zenodo [data set], https://doi.org/10.5281/zenodo.15552986, 2025b. a
Williams, A., Hunter, M. C., Kammerer, M., Kane, D. A., Jordan, N. R., Mortensen, D. A., Smith, R. G., Snapp, S., and Davis, A. S.: Soil Water Holding Capacity Mitigates Downside Risk and Volatility in US Rainfed Maize: Time to Invest in Soil Organic Matter?, PLOS ONE, 11, e0160974, https://doi.org/10.1371/journal.pone.0160974, 2016. a, b
WRB, I. W. G.: World reference base for soil resources 2022: International soil classification system for naming soils and creating legends for soil maps, International Union of Soil Sciences, Vienna, Austria, 4th edn., ISBN 979-8-9862451-1-9, oCLC: 1392141494, 2022. a
Zomer, R. J., Bossio, D. A., Sommer, R., and Verchot, L. V.: Global Sequestration Potential of Increased Organic Carbon in Cropland Soils, Scientific Reports, 7, 15554, https://doi.org/10.1038/s41598-017-15794-8, 2017. a, b, c, d, e, f, g, h, i