the Creative Commons Attribution 4.0 License.
the Creative Commons Attribution 4.0 License.
 | 15 Jun 2026
In situ production of hybrid N2O in dust-rich Antarctic ice
Lison Soussaintjean
Jochen Schmitt
Joël Savarino
J. Andy Menking
Edward J. Brook
Barbara Seth
Vladimir Lipenkov
Thomas Röckmann
Hubertus Fischer
Nitrous oxide (N2O) is a potent greenhouse gas involved in the destruction of stratospheric ozone. Past atmospheric mixing ratios of N2O are archived in ice cores; however, the presence of in situ N2O production in dust-rich Antarctic ice complicates their accurate reconstruction, especially during glacial periods. This production occurs in extremely cold ice and without sunlight. This study aims to understand the reaction producing N2O in Antarctic ice by identifying the precursors and the reaction pathway. We compared the oxygen and nitrogen bulk and position-specific isotope composition of in situ N2O in ice cores to the isotopic composition of nitrate (), a possible precursor of N2O. The 15N signature of is fully transferred into the central N atom (Nα) of in situ N2O, but it is not transferred into the terminal N atom (Nβ), resulting in a 50 % transfer of the 15N signature of into the bulk 15N isotopic composition. These findings suggest that the in situ N2O production involves two different nitrogen precursors present in ice: the central N atom (Nα) originates from and the terminal N atom (Nβ) from a different precursor not yet identified. Oxygen isotope analysis shows that cannot be the only reservoir for the O atom of in situ N2O. Temperature, pH, and absence of sunlight in Antarctic ice point to an abiotic N-nitrosation reaction. The limiting factor of the reaction is probably associated with mineral dust and might be Fe2+, reducing to or the precursor of the Nβ atom. The site preference (SP) values of in situ N2O are highly variable between different ice cores and depend on the bulk 15N isotopic composition of N2O, itself depending on the 15N isotopic composition of the precursor. This finding is unexpected because SP is usually determined by the production pathway through symmetric reaction intermediates that mix the N atoms in α and β positions and average out their isotopic difference. In contrast, our results provide the first evidence of a hybrid N2O production pathway involving an asymmetric intermediate that preserves the distinct 15N signatures of two different precursors – one contributing to the Nα atom and the other to the Nβ atom.
- Article
(7809 KB) - Full-text XML
- BibTeX
- EndNote


Nitrous oxide (N2O) is a potent greenhouse gas whose global warming potential is 273 times higher than that of carbon dioxide (CO2) on a 100 year timescale (IPCC, 2023). As a result of the anthropogenic alteration of the nitrogen cycle (Gruber and Galloway, 2008), the N2O atmospheric mixing ratio has risen by 23 % compared to pre-industrial levels (Rubino et al., 2019), reaching 338 ppb in December 2024 (Lan et al., 2025) and contributing around 6 % to the radiative forcing from long-lived greenhouse gases. N2O is also the primary source of stratospheric nitrogen oxides (NOx) that destroy ozone (Ravishankara et al., 2009).
Soils and aquatic environments are the main sources of atmospheric N2O. Production of N2O occurs both during denitrification, the reduction of nitrate () to nitrite () and ultimately molecular nitrogen (N2), and as a by-product of nitrification, where ammonium () is oxidized to hydroxylamine (NH2OH) and then converted to and (Baggs, 2011; Bange, 2008). N2O is also produced during the reduction of to N2O in nitrifier denitrification, where nitrifying microorganisms reduce to N2O similarly to heterotrophic denitrifiers (Wrage-Mönnig et al., 2018). These reactions are performed by bacteria, archaea and fungi, but abiotic reactions have also been documented (Zhu-Barker et al., 2015). These include chemo-denitrification (Jones et al., 2015; Tischer et al., 2022), which is the reduction of or by Fe(II), and NH2OH oxidation by Fe(III) or Mn(IV).
The composition of the atmosphere in the past can be reconstructed by analyzing air trapped in polar and high-altitude ice cores. Ice cores are the only direct atmospheric archive and have provided continuous CO2 and CH4 records over the last 800 000 years covering eight glacial-interglacial cycles (Loulergue et al., 2008; Lüthi et al., 2008) and a partial record of N2O (Schilt et al., 2010b). In addition to N2O mixing ratios, measurement of the stable isotopic composition of N2O is used for source attribution of N2O emissions. In the current state of the climate system, natural sources account for 57 % of total N2O emissions, while anthropogenic sources contribute the remaining 43 % (Tian et al., 2020). Natural sources are approximately 58 % emissions from soils, 38 % from marine ecosystems, and the remaining 4 % from lightning and atmospheric production (Tian et al., 2020). N2O emissions from both land and marine ecosystems may have varied in the past. Because sources differ in their isotopic signatures, past changes in terrestrial and marine emissions can be reconstructed using the isotopic composition of N2O archived in ice cores (Fischer et al., 2019; Menking et al., 2020; Schilt et al., 2014).
Beyond bulk isotope analyses (δ15N and δ18O), position-specific measurements provide even more detailed insights into N2O production mechanisms. Because N2O is an asymmetric molecule, the nitrogen isotopic composition of the two N atoms can deviate from each other, and this difference can be measured separately at the central N atom (Nα, bonded to oxygen) and the terminal N atom (Nβ). From these values, the site preference () can be calculated. Because SP reflects intramolecular isotope partitioning during N-N bond formation, it is primarily controlled by the reaction mechanism and the structure of the last intermediate rather than by the isotopic composition of the precursor (Frame and Casciotti, 2010; Sutka et al., 2003, 2006; Toyoda et al., 2005). As a result, SP values are often characteristic of specific N2O formation pathways and can remain constant even when precursor δ15N values vary widely. In contrast to bulk δ15N, which integrates source and fractionation effects, SP provides mechanistic information on how N2O is formed and is therefore widely used to discriminate between N2O production pathways; SP values are typically negative for bacterial denitrification and positive for nitrification (Toyoda et al., 2017). Using this tool, Prokopiou et al. (2018) showed that SP values increased since preindustrial times, pointing to a relative shift from denitrification to nitrification, consistent with agricultural emissions playing a major role in the N2O increase. Similarly, Menking et al. (2025) demonstrated that the increase in N2O concentrations during the transition from the Last Glacial Maximum to the Holocene reflected contributions from both nitrification and denitrification, whereas the N2O decrease during the Younger Dryas was driven by reduced nitrification.
However, the atmospheric signal of greenhouse gases archived in ice cores can be altered (Anklin et al., 1995; Delmas, 1993; Lee et al., 2020; Mühl et al., 2023). This is particularly true for N2O: the N2O mixing ratio in glacial period ice from Antarctica shows large scatter between nearby samples from the same core and different values between ice cores for the same age (Fig. 1) (Flückiger et al., 2002; Sowers, 2001; Stauffer et al., 2003), which is inconsistent with the homogeneous global atmospheric mixing ratio of N2O resulting from its 123 year atmospheric lifetime (Prather et al., 2015) and the low-pass filtering of the atmospheric signal through the slow bubble enclosure process. Because these anomalies were observed for ice core analyses using two distinct gas extraction methods – wet extraction by melting (Schilt et al., 2010b) and dry extraction by grating the ice (Sowers, 2001) – it was concluded that N2O production occurred already in the ice sheet and not during the analysis. This “in situ production” or excess N2O in dust-rich sections of polar ice cores has two major consequences for the climatic interpretation. First, as the production process has not yet been identified, and the excess N2O has not yet been quantified, we do not have access to past atmospheric N2O mixing ratios during most past glacial periods (Schilt et al., 2010b), where high dust contents are found in the ice. Secondly, samples affected by in situ production deviate from the isotopic composition of atmospheric N2O (Fig. 1), which compromises source attribution (Fischer et al., 2019; Schilt et al., 2014). It is therefore necessary to understand the N2O production process(es) in the ice to systematically identify affected samples and thus avoid misinterpretation. Several detection methods were implemented to scrutinize the N2O record (Flückiger et al., 2004; Spahni et al., 2005), but they were only used to discard the samples likely to be affected. Understanding the production processes could potentially provide a reliable way of quantifying the fraction of N2O produced in situ and to correct the measured signal with the aim to obtain the past atmospheric signal.
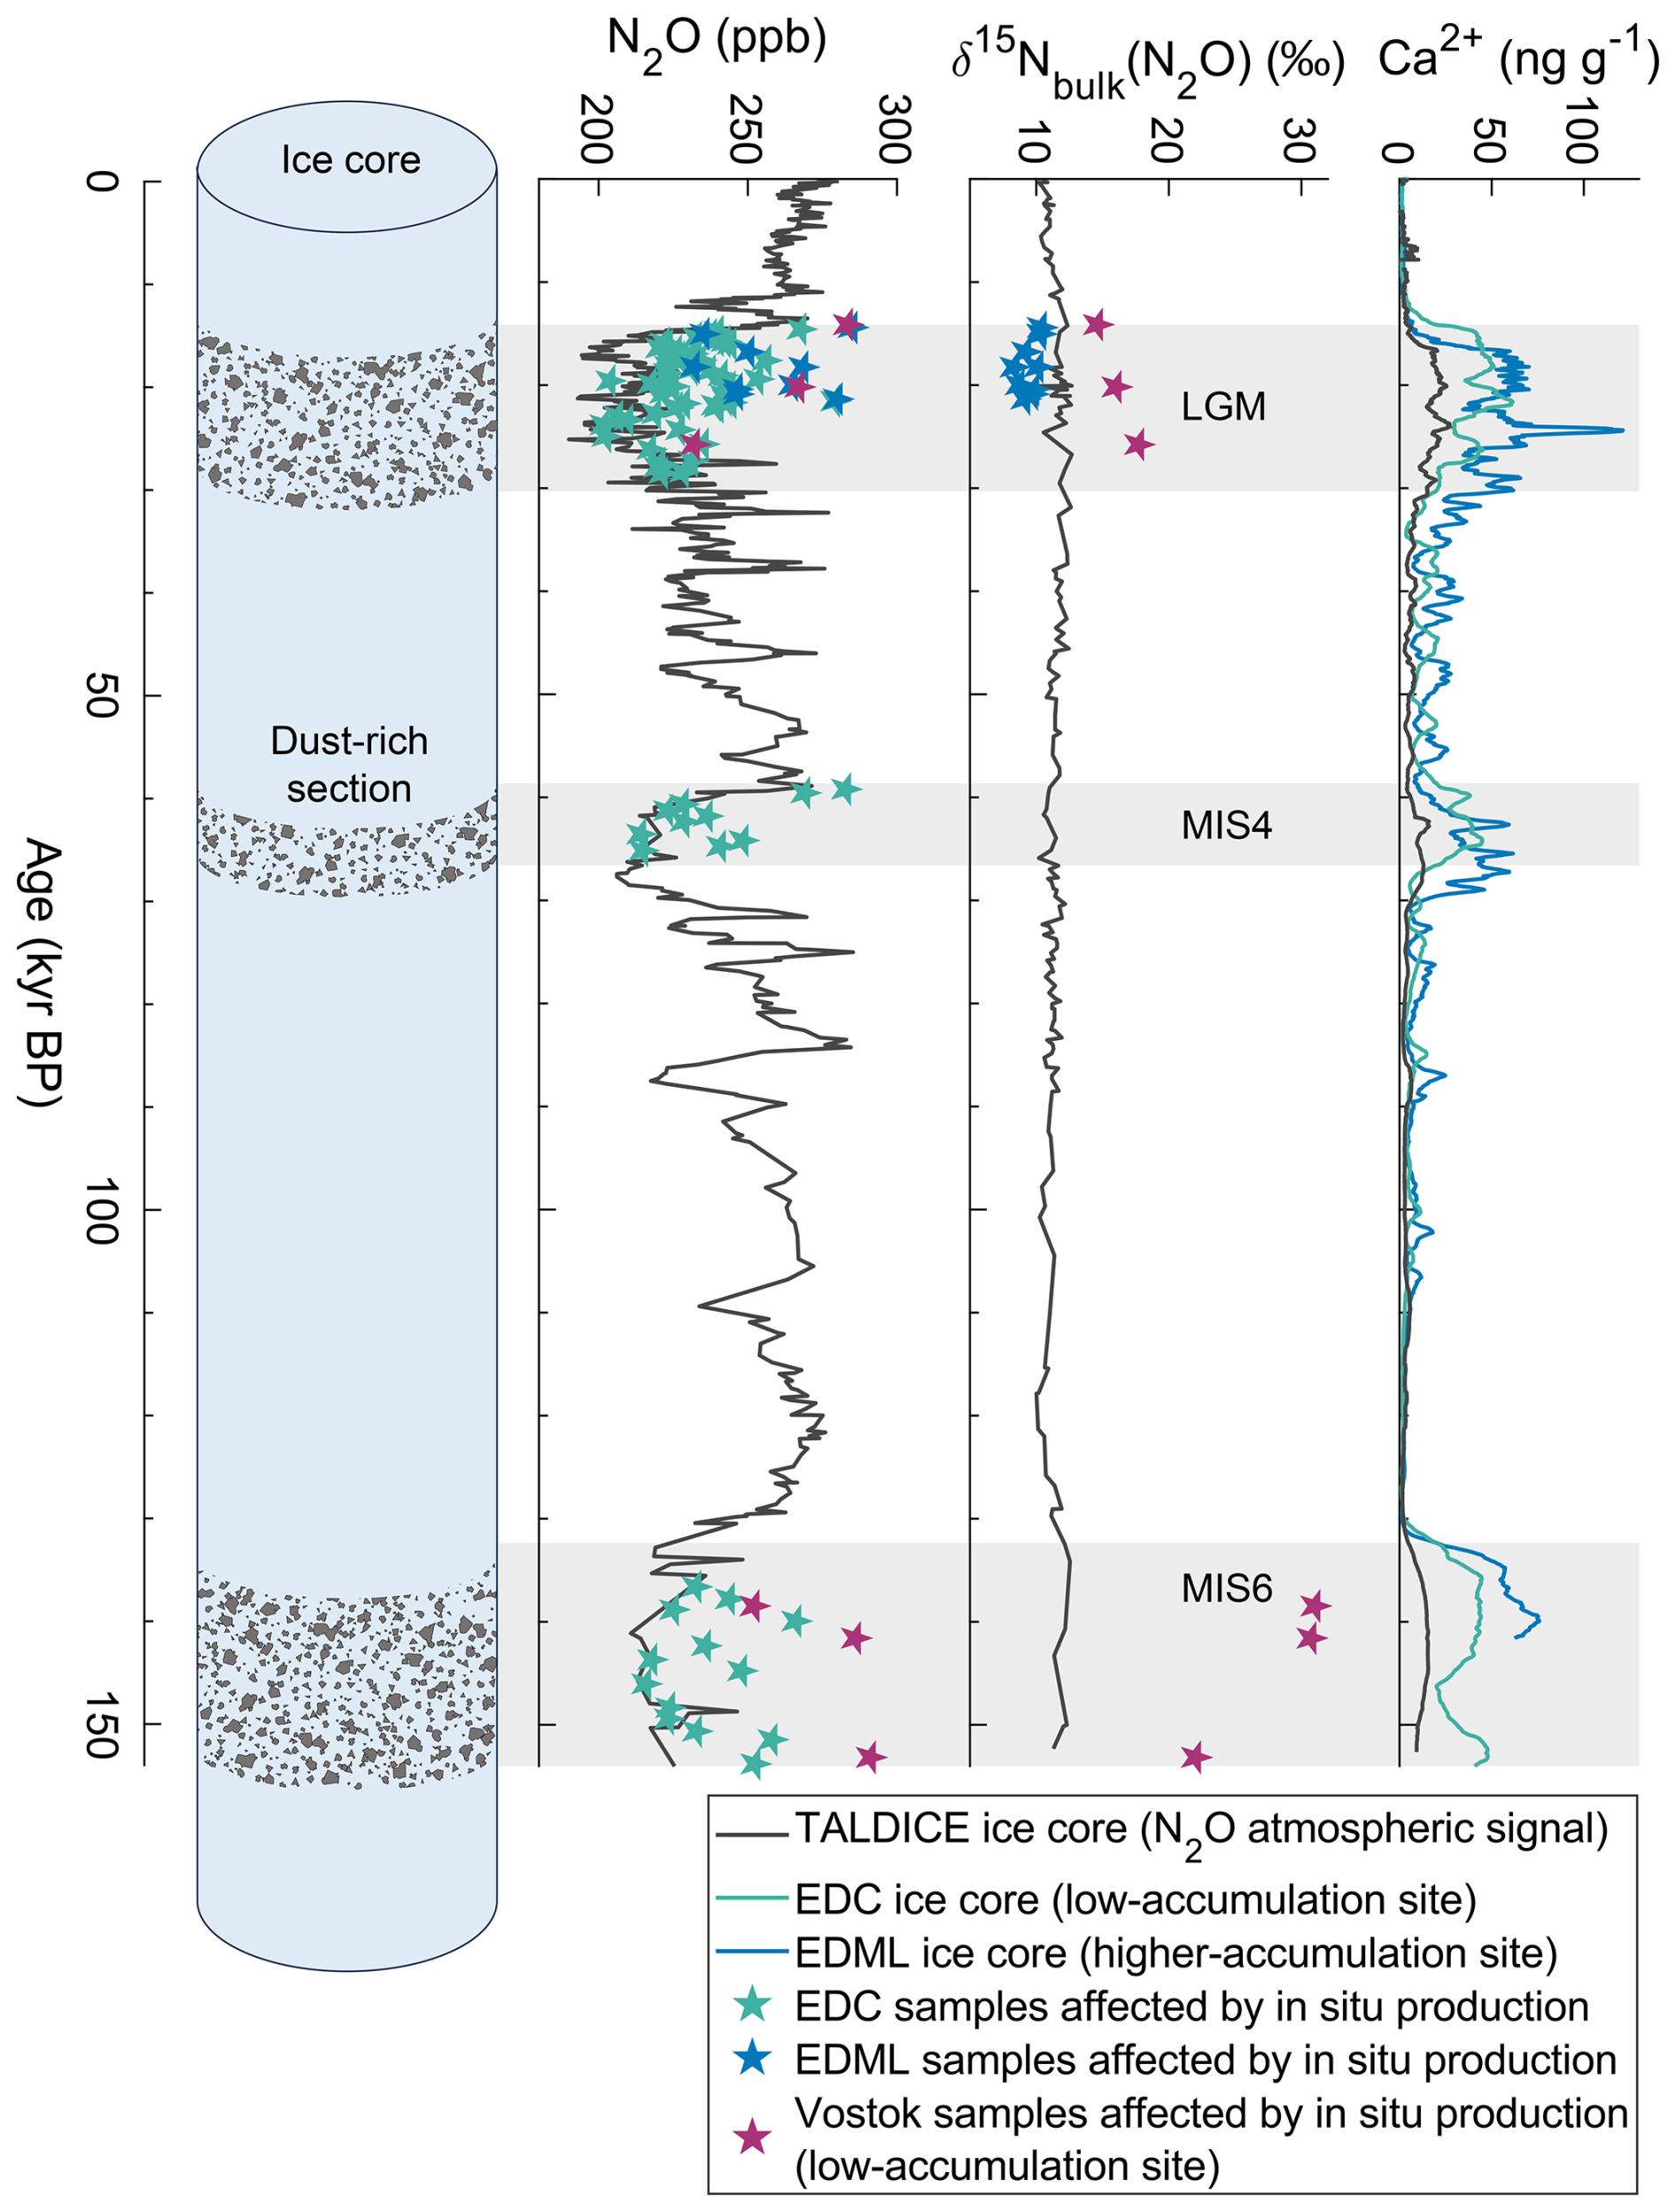
Figure 1N2O mixing ratio, N2O bulk nitrogen isotopic composition, and Ca2+ concentrations that represent the mineral dust content, measured in the TALDICE (Schilt et al., 2010a), EDC (Schilt et al., 2010b), EDML (Fischer et al., 2019), and Vostok (Miteva et al., 2007) ice cores. Because of its low dust content, the TALDICE record in black is considered to represent the best estimate of atmospheric N2O levels (see Sect. 3.2.2). Stars correspond to samples affected by in situ production and represent the total N2O measured, i.e., atmospheric N2O plus in situ N2O. Grey boxes mark the dust-rich sections of the EDC ice core corresponding to the Last Glacial Maximum (LGM), the Marine Isotope Stage (MIS) 4 and 6 cold periods.
This work also has relevance for nitrogen cycle processes in extreme environments. Very few studies have focused on N2O production under extreme conditions as those encountered in the Antarctic ice sheet, where temperatures reach down to −60 °C, pressures are enormous, and reaction time scales can be of the order of several thousand years. Priscu et al. (2008) measured very high N2O mixing ratios in a permanently ice-covered lake in the Dry Valleys, Antarctica, which they attributed to microbial nitrification. Investigating N2O production in Antarctic ice is an opportunity to explore whether microorganisms can be metabolically active at −60 °C. Although previous studies suggested potential N2O production by bacteria (Flückiger et al., 2002; Schilt et al., 2010b; Sowers, 2001), there is currently no evidence to support microbial activity in Antarctic ice as a source for in situ N2O. High microbial counts have only been found in a few of the Vostok ice core samples where in situ production was reported (Sowers, 2001). Also, abiotic reactions may cause N2O formation in polar ice. In the Dry Valleys, Antarctica, Samarkin et al. (2010) demonstrated abiotic N2O production by chemo-denitrification in the Don Juan Pond soils.
This study uses isotope analysis to characterize in situ N2O in various ice cores. The background of the study, the extreme environmental conditions in the polar environment, and the potential consequences for the reactions involved are presented in Sect. 2. Based on the strong enrichment in 15N observed in some samples affected by in situ N2O production (Fig. 1), we hypothesize that , which can also be highly enriched in 15N in ice, is one of the nitrogen precursors for in situ N2O. To test this hypothesis, we measured the isotopic composition of N2O and in the same ice core samples and calculated the isotopic signature of in situ N2O (Sects. 3 and 4). Position-specific nitrogen isotope analysis of N2O was carried out to further constrain the reaction pathway(s) involved. The potential mechanisms for in situ N2O production are discussed in Sect. 5.
For both Greenland and Antarctic ice cores, N2O production is inferred in ice-core sections corresponding to glacial periods, while there is no in situ production apparent for the Holocene and other interglacial and interstadial periods (Flückiger et al., 2004; Schilt et al., 2010b). The chemical composition of the ice differs significantly between glacial and interglacial periods, particularly in terms of its mineral dust content. Dust concentrations are significantly higher during glacial periods than during interglacial periods (factor of 30–100) in Antarctic and Greenland ice cores (Fuhrer et al., 1999; Lambert et al., 2012). In fact, N2O excess production is only observed in dust-rich ice and, in Antarctica specifically, it increases with higher dust concentrations (Fig. 1). This points to a reaction involving at least one compound contained in or associated with the dust.
The excess N2O produced in Antarctic ice is on average 0.4 nmol N kg−1. The main nitrogen compounds that are generally considered as N2O precursors are and . The typical concentrations of and in ice are above 320 and 55 nmol N kg−1, respectively (Kaufmann et al., 2010; Röthlisberger et al., 2000a), and therefore more than sufficient to produce the observed excess N2O. However, neither nor spontaneously react to N2O. These precursors need to be activated by a chemical or biochemical agent, such as iron II (Fe2+) (Zhu-Barker et al., 2015) or bacteria, respectively. Both Fe2+ (Spolaor et al., 2012, 2013; Traversi et al., 2004) and bacteria (Miteva et al., 2016; Rohde et al., 2008; Sowers, 2001) were detected in polar ice.
Previous research has shown that samples affected by in situ production exhibit isotopic deviations from the atmospheric signature that differ in both direction and magnitude across ice cores (Fischer et al., 2019; Menking et al., 2025; Schilt et al., 2014; Sowers, 2001). It has been observed that the 15N signatures of total N2O – i.e. atmospheric plus in situ N2O – depend on snow accumulation: sites with low accumulation show enrichment in 15N compared to the atmospheric signature (Sowers, 2001), while sites with higher accumulation show depletion in 15N (Fischer et al., 2019) (Fig. 1). A similar dependence of isotopic composition on accumulation rate is observed for . The accepted reason is that after deposition some of the undergoes photolysis in the photic zone, corresponding approximately to the first meter of the surface snow. Kinetic isotope effects for photolysis favor the loss of the lighter isotopologues (i.e. containing 14N), resulting in 15N enrichment of the remaining (Blunier et al., 2005; Frey et al., 2009). The fraction of photolyzed and the degree of isotopic enrichment depends on the time spends in the photic zone before it is archived in the ice by progressive burial. At low-accumulation sites, the duration within the photic zone is longer and a large fraction of is photolyzed leading to a highly 15N-enriched archived in the ice, reaching values of at Concordia (Erbland et al., 2013). In ice core samples affected by in situ N2O production, the presence of high values of N2O along with 15N-enriched strongly suggests that in situ N2O production uses N from . The isotopic composition of has never been measured in Antarctic ice cores, because large amounts of ice are required at the low concentrations, and the samples are highly sensitive to NH3 contamination (Lamothe et al., 2023). Although a low contamination protocol has been developed by Lamothe et al. (2023), it was used for samples with higher concentrations, where the blanks are small compared to the sample concentration. Nonetheless, the hypothesis of as an N2O precursor is discussed in Sect. 5.1.3.
The production of N2O might already start near the surface of the ice sheet, in the snow and firn, but most of the produced N2O would be lost to the atmosphere via air exchange. In the deeper section of the diffusive zone of the firn column and below the air lock-in depth (Battle et al., 1996), exchange of the firn air with the atmosphere is limited or excluded and the produced N2O is partly or fully preserved in the ice. To be able to observe in situ N2O in ice cores, the production must continue close to or below the lock-in depth (located between 50 to 100 m, depending on the location and conditions of the ice sheet). For example, during the LGM at Vostok, Antarctica, the lock-in depth was around 94 m, and the age of the ice at this depth was 5200 years (Table 1). This means that at Vostok, N2O was still produced several thousand years after the precursors were deposited onto the ice sheet. This observation shows that either it takes time for the precursors to come into contact, for example by diffusion in the ice or ice recrystallization, or that the reaction is very slow due to low temperatures. In the latter case, it would not be possible to reproduce such slow reaction kinetics in the laboratory. This observation also shows that the reaction does not need light.
Table 1Characteristics of the ice core drilling sites presented in this study.
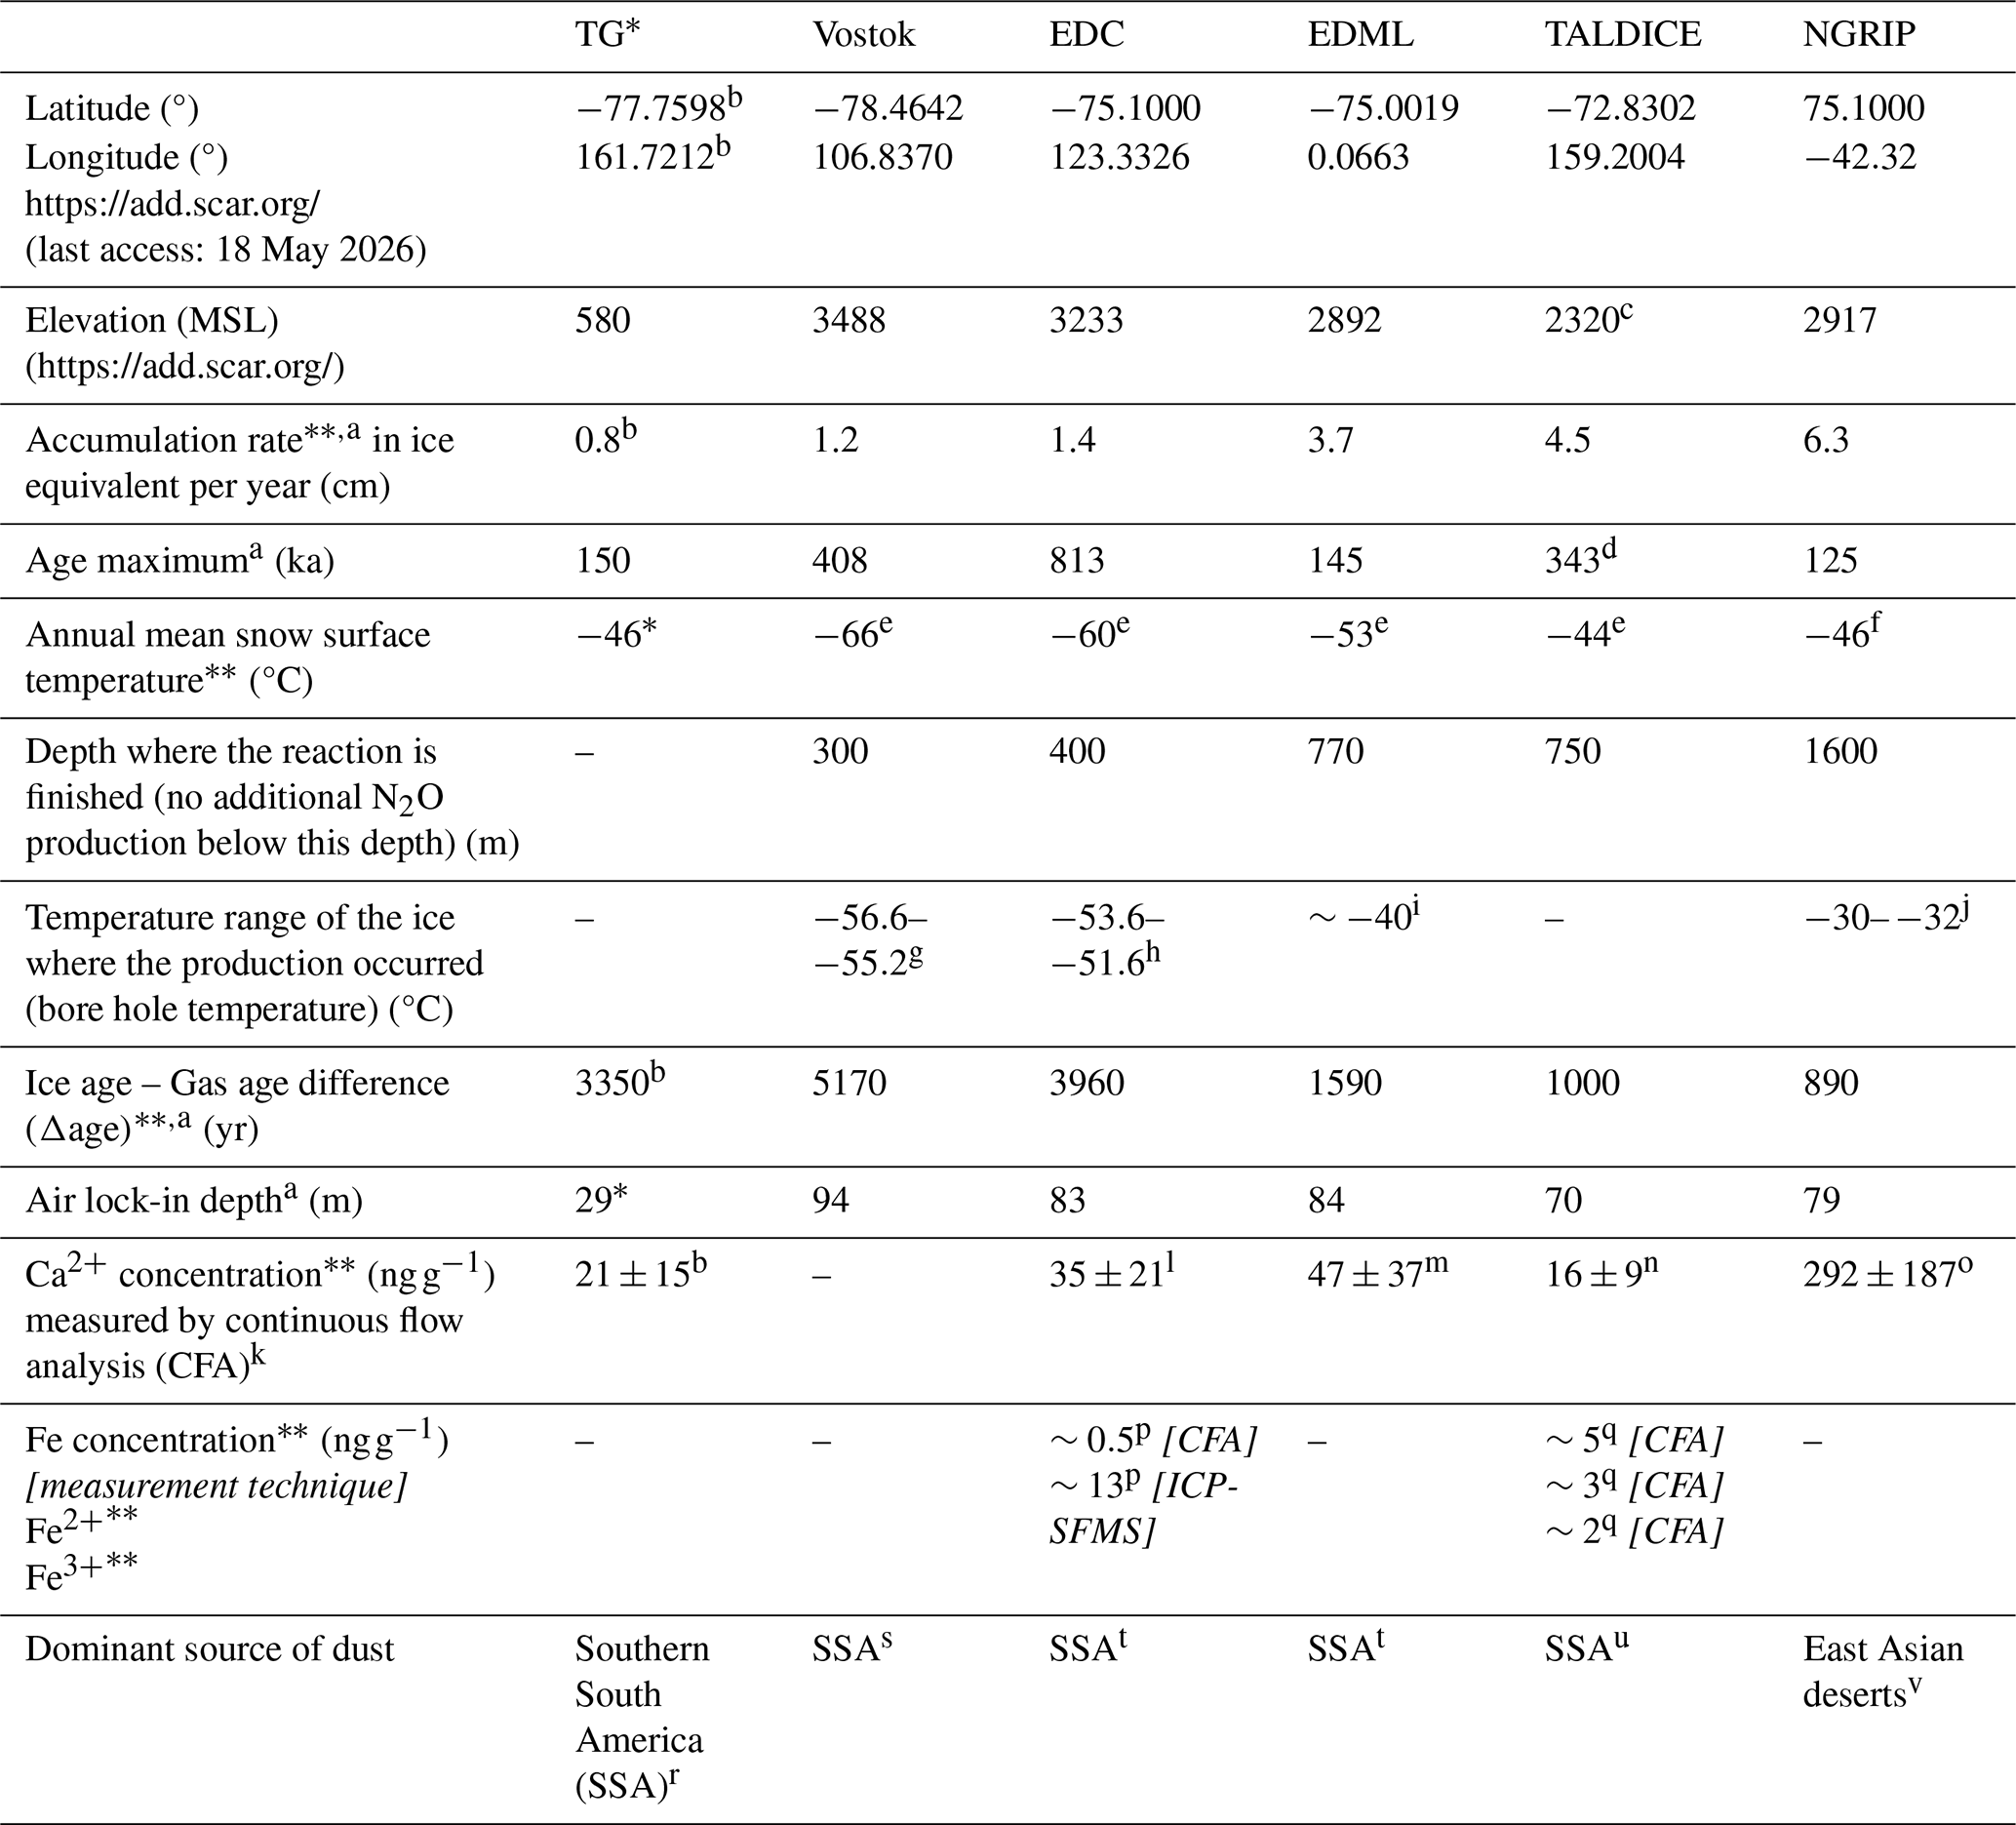
∗ special case: horizontal core. LGM mean snow surface temperature estimated based on δ18O(H2O) data. LGM lock-in depth calculated using the Herron-Langway firn model with delta age and temperature inputs for the TG accumulation zone near Taylor Dome (Herron and Langway, 1980).
averaged over the period 15–30 ka.
a Bouchet et al. (2023), b Baggenstos et al. (2018), c Buiron et al. (2011), d Crotti et al. (2021), e Markle and Steig (2022), f Kindler et al. (2014), g Salamatin et al. (1994), h Ritz et al. (1982), i Wilhelms et al. (2007), j Tarasov and Peltier (2003), k Röthlisberger et al. (2000b), l Lambert et al. (2012), m Fischer et al. (2007), n Schüpbach et al. (2014), o Bigler (2004), p Traversi et al. (2004), q Spolaor et al. (2013), r Aarons et al. (2017), s Delmonte et al. (2004), t Marino et al. (2009), u Delmonte et al. (2010), v Ruth et al. (2003).
3.1 Ice core samples
To gain a comprehensive understanding of the N2O production process(es) in diverse environmental settings, we analyzed ice core samples from different sites with different characteristics: variable dust contents, variable dust chemical compositions, variable snow accumulation rates and therefore isotopic signatures of , and variable drilling site temperatures. These characteristics are reported in Table 1. Calcium (Ca2+) concentrations are used as a proxy for dust content because they have been found to be correlated with mineral dust concentrations (Ruth et al., 2002). Figure 2 shows the location of the drilling sites.
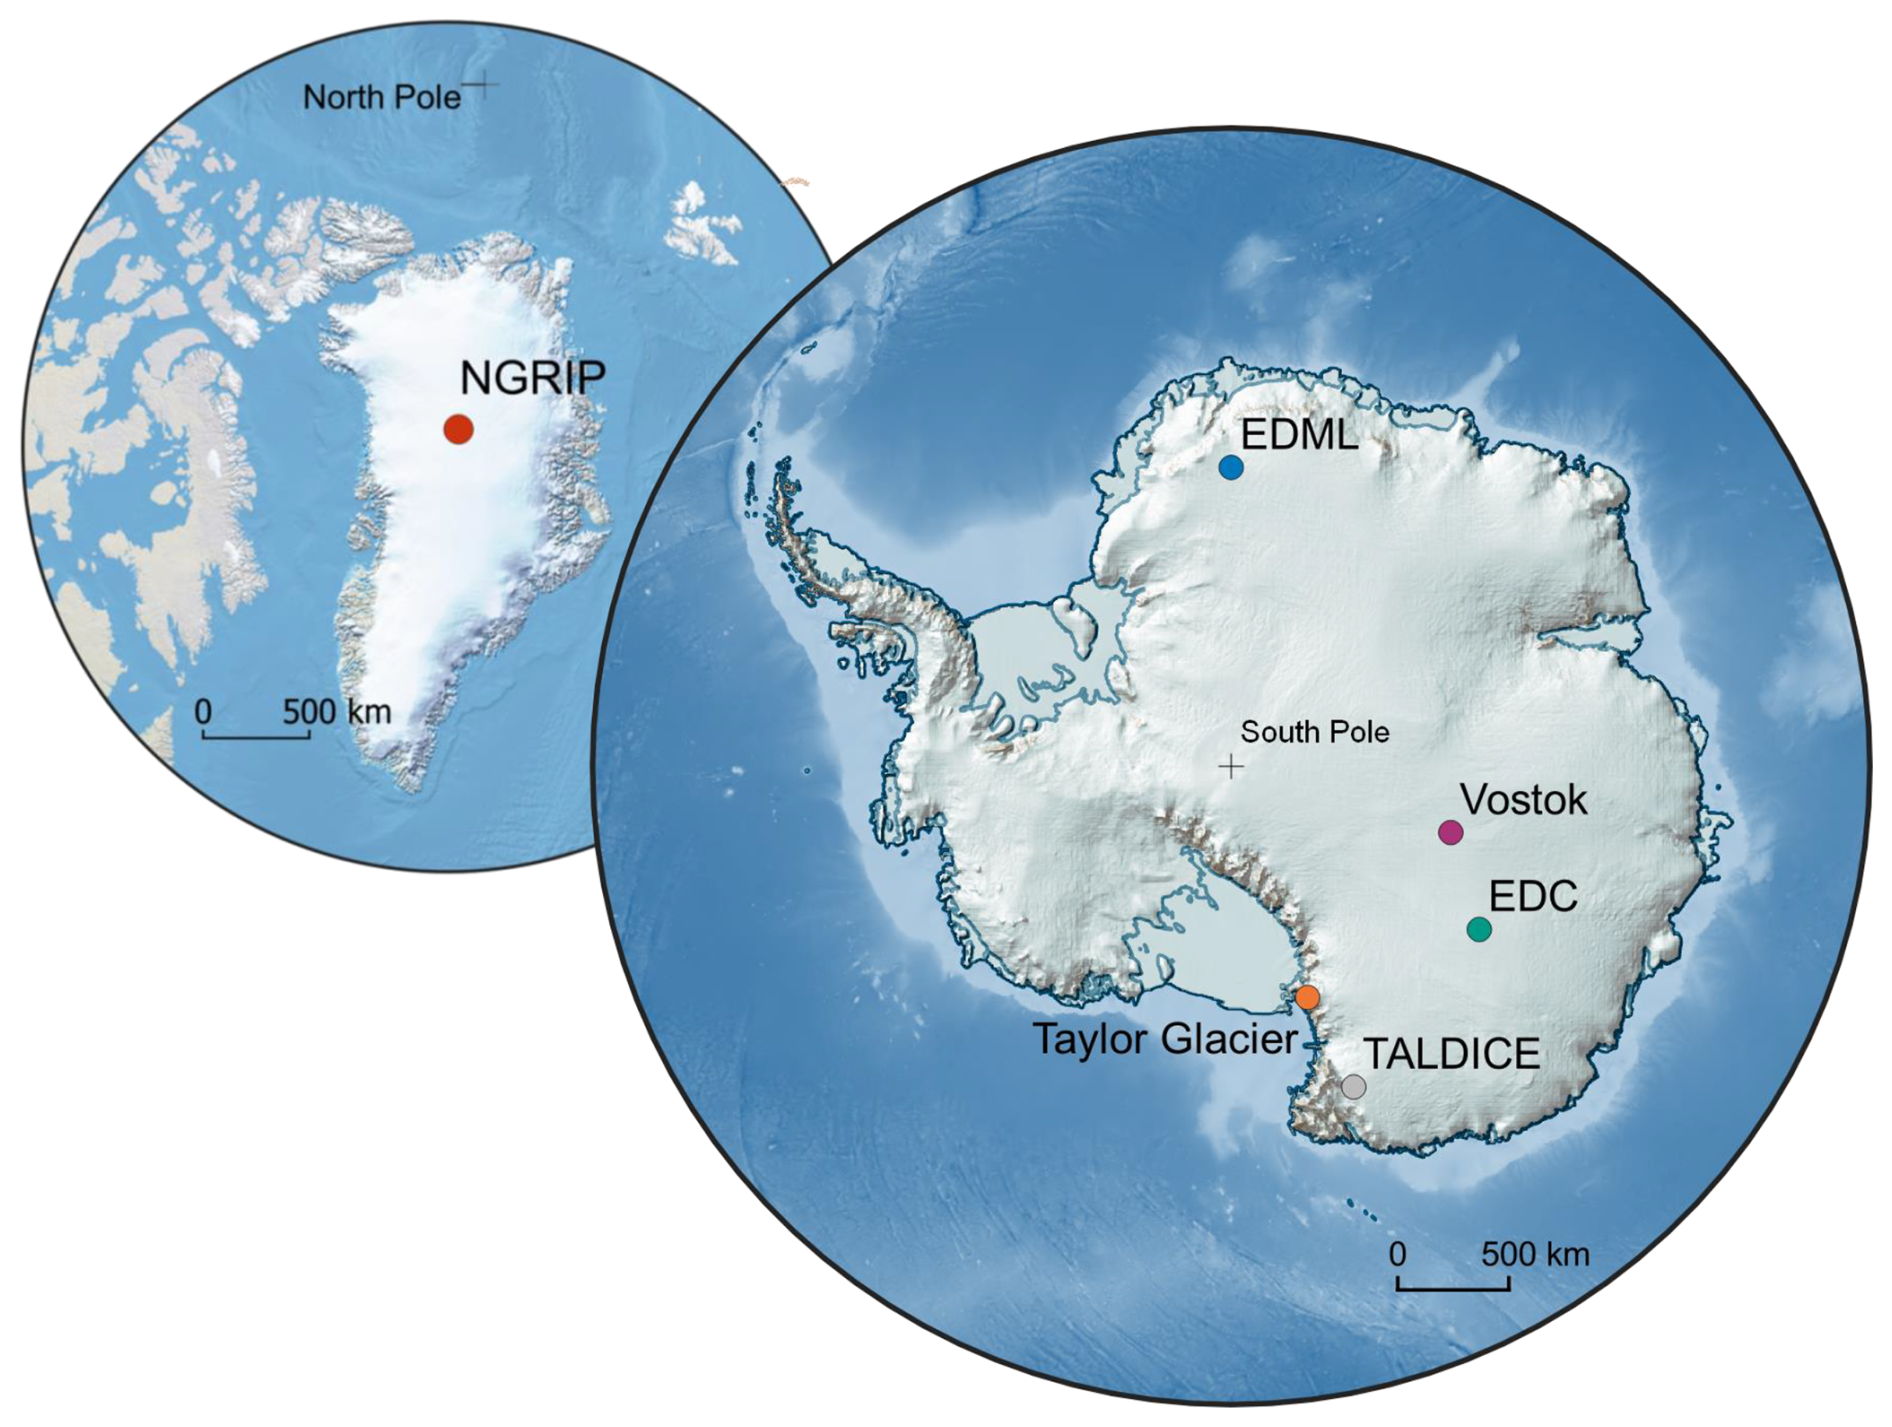
Figure 2Location of the ice core drilling sites presented in this study. Maps created using the Quantarctica (Matsuoka et al., 2018) and QGreenland (Moon et al., 2023) QGIS data packages.
We analyzed samples from five Antarctic ice cores: the Talos Dome Ice Core (TALDICE), the European Project for Ice Coring in Antarctica (EPICA) Dome C core (EDC), the EPICA Dronning Maud Land core (EDML), the Vostok ice core, and the main transect of the Taylor Glacier (TG) blue ice area. Additionally, we analyzed samples from one Greenland ice core, the North Greenland Ice Core Project ice core (NGRIP). The TALDICE ice core was selected for its low dust content (and expected low degree of in situ N2O) compared to other Antarctic ice cores, the EDC and Vostok ice cores for their low snow accumulation rate, the EDML ice core for its relatively higher snow accumulation rate. The NGRIP ice core was analyzed to compare the isotopic signature of in situ N2O in Greenland and Antarctic ice.
We measured the stable isotopic composition ( and δ18O) of N2O in the TALDICE, EDC, EDML, Vostok, TG and NGRIP ice cores, and the stable isotopic composition (δ15N and δ18O) of in all samples except NGRIP. We also carried out position-specific isotope analysis of the central () and terminal () nitrogen atoms in N2O in the Vostok and TG ice cores.
The samples date from either the Last Glacial Maximum (LGM) and glacial-interglacial transition (14 to 29 ka), Marine Isotope Stage 4 (MIS4, 57 to 71 ka), or Marine Isotope Stage 6 (MIS6, 130 to 191 ka), which are all dust-rich glacial periods and are therefore prone to in situ production of N2O. We selected samples younger than 150 ka because the N2O atmospheric baseline recorded in the dust-poor TALDICE ice core and used in our mass balance approach (see Sect. 3.2.2) does not extend to older periods.
3.2 N2O analysis
3.2.1 Measurement of N2O mixing ratio and isotopic composition
Prior to analysis, the samples were decontaminated by removing ∼5 mm of the outer surface potentially affected by diffusion of modern air and chemical contaminants. Scraping was performed with a precleaned knife and wearing polyethylene gloves to minimize contamination (see Sect. 3.3).
The mixing ratio and bulk isotopic composition of N2O were measured at the University of Bern, Switzerland, using the method described in detail in Schmitt et al. (2014). Briefly, the air was extracted by melting the ice core samples with infrared light in a glass vessel under high vacuum. Water vapor was removed from the air sample with a cold trap, CO2 was removed using Ascarite™, and N2O, CH4, and other trace gases were separated from the bulk air components (N2, O2, and Ar) using a cold trap filled with activated carbon. N2O and CH4 were then separated on a gas chromatography column, and N2O was analyzed with an IsoPrime isotope ratio mass spectrometer (IRMS). The results were converted to international isotope scales. Isotopic compositions are expressed in δ values where , with R referring to and ratios. The international references are N2 in air for nitrogen and Vienna Standard Mean Ocean Water (VSMOW) for oxygen. The analytical precision of N2O mixing ratio, and δ18O values is 3 ppb, 0.3 ‰ and 0.4 ‰ respectively.
We analyzed the position-specific isotopic composition of N2O from ice core samples at Oregon State University following gas extraction, N2O purification, IRMS analysis, and data reduction methods described in detail in Menking et al. (2025). Briefly, the air was extracted by grating the ice core samples at −60 °C to open the enclosed air bubbles (Bauska et al., 2016), i.e., using a so-called dry extraction device, without melting the ice. N2O was purified and pre-concentrated using a series of progressively smaller-volume cold traps and gas chromatography separation of the trapped N2O from residual CO2. Isotopic measurements were performed using a Thermo Delta V Plus IRMS, where 44, 45, and 46 and 30 and 31 were monitored simultaneously for N2O isotopes and N2O fragment (NO) isotopes, respectively. The position-specific isotopic composition of N2O, i.e. (central-position N atom), (terminal-position N atom) and site preference (SP), is defined as:
The , and δ18O values were measured and the and SP values were calculated using Eqs. (1) and (2), respectively. The precision of the measurement is 3 ppb for N2O mixing ratio, ±0.4 ‰ for , ±0.6 ‰ for , ±0.8 ‰ for , ±1.3 ‰ for SP, and ±0.6 ‰ for δ18O.
3.2.2 Calculation of the mixing ratio and bulk isotopic composition of the in situ N2O fraction
The N2O mixing ratio and isotopic composition that we measured represent the total N2O extracted from the ice cores, i.e., a mixture of atmospheric N2O plus any in situ N2O. For our study, we need to calculate the mixing ratio and isotopic composition of in situ N2O only. To calculate the in situ values from the measured values, we used the following mass balance approach for each sample:
where [N2O]meas is the N2O mixing ratio measured in the ice core sample, [N2O]in situ is the mixing ratio of in situ N2O in that sample, and [N2O]atm is the true atmospheric mixing ratio of N2O at the gas age of the sample; the same terminology applies for delta values.
One issue with this mass balance approach is the need to know [N2O]atm and δatm, given that most N2O records are affected by in situ production. We used the N2O record from the dust-poor TALDICE ice core, which is the best estimate of an atmospheric baseline. TALDICE is not significantly impacted by in situ N2O production but is limited in time reconstruction (∼150 ka). Low in situ contribution is supported by the observation that the TALDICE N2O mixing ratios during the dust-rich LGM and MIS4 periods generally align with the NGRIP N2O mixing ratios, after in situ N2O outliers are removed from the NGRIP record (Fig. A1 in Appendix A). Previous studies identified the high-resolution NGRIP record as representative of atmospheric N2O variations (Flückiger et al., 2004; Schilt et al., 2010a, 2013). As atmospheric N2O mixing ratios are globally homogeneous while in situ N2O production is ice-core dependent, the agreement between the TALDICE and NGRIP records supports the atmospheric nature of the TALDICE record. This is particularly significant because the NGRIP and TALDICE ice cores, drilled in Greenland and Antarctica, respectively, have very different chemical compositions that would lead to different in situ production features. To associate each sample with the atmospheric values matching its gas age, we applied a cubic smoothing spline interpolation with a 2000 year smoothing window to the measured TALDICE data, which has a temporal resolution of approximately 300 years over the LGM and 600 years over MIS4.
We acknowledge that there could be a small in situ production of N2O in the TALDICE ice core, isotopically undetectable if the isotopic signature of in situ N2O is close to the atmospheric one. We conducted a sensitivity study to evaluate the impact of this possibility (Figs. C1 and C2 in Appendix C). Assuming that N2O production is proportional to dust content, we estimated the in situ N2O mixing ratios by multiplying the calcium concentrations – used as a dust proxy – by a constant N2O production factor. These in situ N2O mixing ratios were subtracted from the TALDICE N2O mixing ratios to obtain a corrected record that was used in the mass balance approach as an atmospheric baseline. This approach assumes a constant total air content (TAC) across all samples. While variations in TAC affect the conversion from Ca2+-based N2O estimates (in ng g−1) to mixing ratios (ppb), this effect is relatively minor (within ±10 %) and does not dominate the overall uncertainty in our mass balance calculation. Our sensitivity study varied the production factor from 0 to 1 ppb of N2O per ng g−1 of Ca2+ (Figs. C1 and C2 in Appendix C). A production factor above 0.5 ppb-N2O/ng g−1-Ca2+ is unlikely, as it would result in significantly lower N2O mixing ratios in TALDICE compared to NGRIP. Increasing production factors in TALDICE result in isotopic signatures of in situ N2O in the other ice cores that are closer to atmospheric values. Importantly, assuming small production factors of 0.1 to 0.2 ppb-N2O/ng g−1-Ca2+, which represents the upper range of expected values for TALDICE, results in only minimal changes in regression slopes when comparing the isotopic compositions of in situ N2O and . Thus, we conclude that the interpretations that follow remain valid even if the assumption that TALDICE represents the true atmospheric N2O baseline is not entirely fulfilled.
3.2.3 Calculation of the position-specific isotopic composition of the in situ N2O fraction
We used the same mass balance approach as in Sect. 3.2.2 to calculate the in situ values in the Vostok and TG samples, with Eqs. (3) and (4) in which the δ values are substituted with . The in situ values were calculated with Eq. (1) () and in situ SP values with Eq. (2) (). One problem with this approach is that the TALDICE record does not include position-specific information. As the atmospheric reference , we therefore used the average of the values measured by Menking et al. (2025) in samples from the TG ice core during the period 16 to 21 ka, as these values vary little over time during the last glacial period and because these TG samples were shown to be unaffected by in situ production by comparison with TALDICE and NGRIP.
3.2.4 Uncertainties
There are several sources of error in our approach, including measurement uncertainties in N2O mixing ratios and isotopic composition, uncertainties in the TALDICE N2O spline interpolation, uncertainties in gas-age estimates – which in turn impact the chronological alignment between ice cores – and potential small in situ production in TALDICE. We used a Monte Carlo method for error propagation by running 1000 simulations to determine the mixing ratio and isotopic composition of in situ N2O. We varied the variables of Eqs. (3) and (4) within their uncertainty ranges (Table B1 in Appendix B). The derived uncertainties were calculated as the standard deviation of the results of the 1000 simulations.
As expected, the uncertainty increases for low in situ N2O mixing ratios (see Eq. 4). To avoid too large uncertainties, we excluded samples with calculated in situ N2O mixing ratios below 20 ppb. This threshold was chosen because a large part of the dataset exhibits in situ mixing ratios below 50 ppb. Applying a higher cutoff would remove a substantial number of samples and significantly limit our ability to investigate in situ N2O production processes. For samples with in situ N2O mixing ratios close to 20 ppb, the propagated uncertainties are large (up to several tens of per mil). Nevertheless, these samples were included in this study because in situ N2O production in ice, although small in absolute mixing ratio, can significantly alter the measured N2O isotopic composition (Fig. 3a) and these isotopic deviations should be documented.
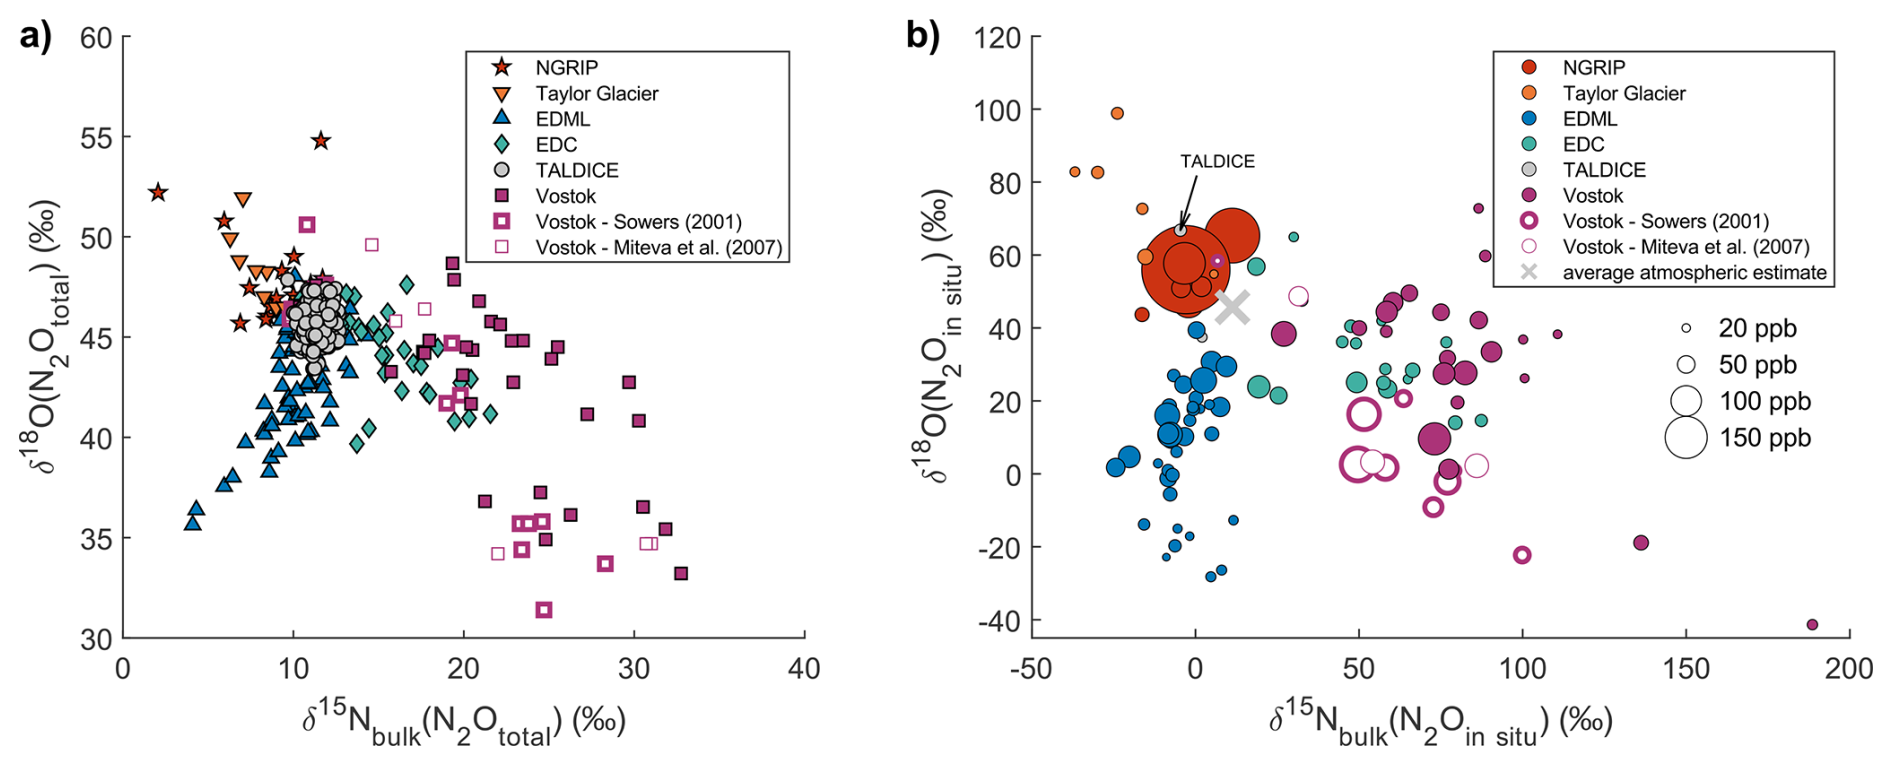
Figure 3Nitrogen and oxygen isotopic composition of total N2O measured in samples from different ice cores (a) and nitrogen and oxygen isotopic composition calculated for in situ N2O in the same samples (b). The mixing ratio of in situ N2O is represented by the size of the markers. The grey cross represents the average isotopic signature of the TALDICE samples and reflects the isotopic composition of atmospheric N2O. In panel (b), one TALDICE sample shows in situ N2O production associated with an exceptionally high dust peak (see text). Note that the scale of the axes is different for panel (a) and (b).
3.3 Measurement of concentration and isotopic composition
After wet extraction and dry extraction of N2O at the University of Bern and Oregon State University, respectively, the meltwater and melted ice chips from ice-core samples were used for nitrate isotope analysis. To avoid any chemical reaction and hence production or consumption of , the collected samples were refrozen and stored at −25 °C.
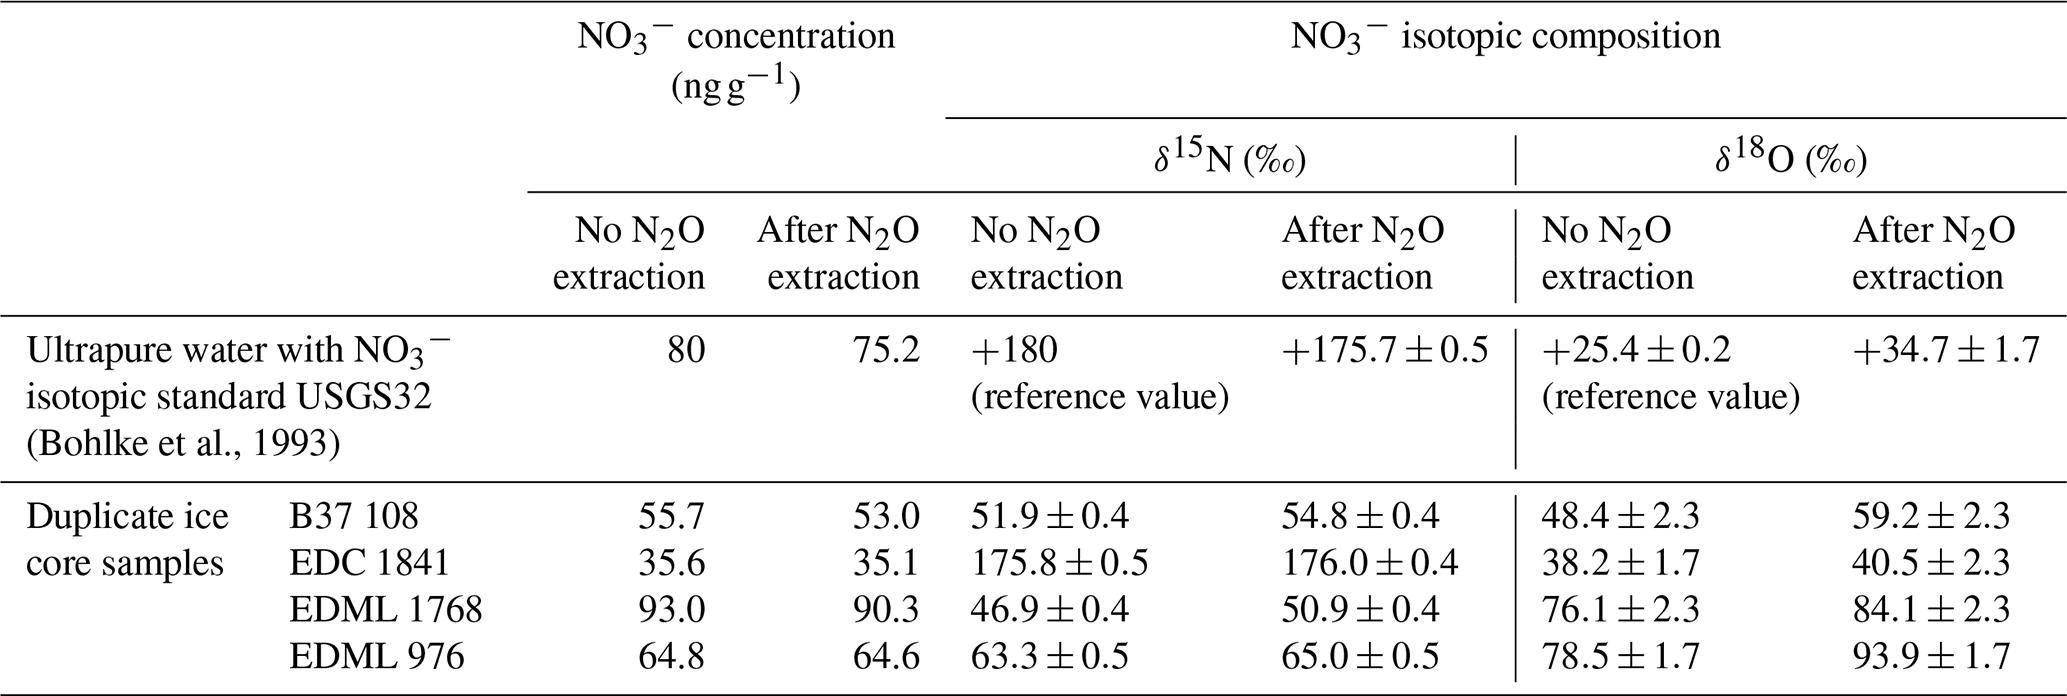
To assess the potential contamination impact of the gas extraction techniques on , we measured the concentration and isotopic composition of in ultrapure ice samples spiked with a controlled amount of isotope standard after gas extraction as described above. Additionally, we compared the concentration and isotopic composition of in duplicate ice core samples, one analyzed directly and the other analyzed after gas extraction (Table D1 in Appendix D). These tests show that the gas extraction techniques do not lead to measurable contamination, loss, or δ15N isotopic fractionation of in the collected samples. Although δ18O() values are slightly affected, the impact is negligible relative to their typical variability observed in ice cores.
The method used for nitrate isotope analysis is described in detail in previous publications (Erbland et al., 2013; Kaiser et al., 2007; Morin et al., 2009). Briefly, the concentration was measured by ion chromatography using a Dionex Integrion system; in the samples was preconcentrated using an AG 1-X8 anion exchange resin in the chloride form. After the sample was drained and the ions were quantitatively trapped onto the resin, was eluted from the resin with 6 mL of 1 M NaCl solution in three portions of 2 mL. was then converted to N2O through bacterial denitrification, using a strain of Pseudomonas aureofaciens. The bacteria were injected in 2 mL aliquots into 20 mL headspace vials. To remove air and dissolved N2O, the vials were purged for 3 h with pure helium. The concentrated samples were added to the vials in volumes adjusted to obtain 100 nmol of , and were allowed to denitrify overnight. For isotope analysis, a continuous He flow was used to transfer the produced N2O from the headspace vial and carry it through a purification line. The N2O sample was passed through columns of perchlorate, Ascarite, and Supelco Purge Trap type F to remove water, CO2, and VOCs, respectively. Following this purification step, the purified N2O was decomposed to N2 and O2 on a gold catalyst kept at 850 °C, and the isotopic compositions of the obtained N2 and O2 were measured with a Thermo Fischer MAT 253 IRMS. The results were corrected for blank contribution and calibrated on international scales following the procedure described in Erbland et al. (2013). Measurement errors are ±0.8 ‰ for δ15N and ±1.0 ‰ for δ18O.
4.1 Bulk isotopic signatures of total N2O and in situ N2O
Figure 3a illustrates the measured isotopic signatures of total N2O from various ice cores. The TALDICE data, representing atmospheric N2O, clusters around a mean value of +11.3 ‰ ± 0.7 ‰ (1σ standard deviation) and a mean δ18O value of +45.7 ‰ ± 0.9 ‰. These data cover the last 140 kyr interval and their standard deviation is only about two times the measurement error, hence the detectable temporal variability of the isotopic signature of N2O is small. In contrast, other ice cores show wider ranges, both in and δ18O: the deviations from the atmospheric range and relationship with elevated N2O mixing ratios indicate that these samples are substantially affected by in situ production.
Importantly, the magnitude and direction of deviations from the atmospheric signature are ice core specific. Because the in situ N2O fraction shapes the observed isotopic deviations, we closely examine the isotopic signature of in situ N2O in Fig. 3b, which presents the results of our mass balance calculation. Individual samples in the NGRIP ice core in Greenland show the highest in situ N2O production, up to 380 ppb, while Antarctic ice cores like Vostok, EDML, EDC, and TG show in situ production in the order of 40 ppb, which corresponds to 20 % of the atmospheric N2O mixing ratios during glacial periods. The isotopic signature of in situ N2O is highly variable, ranging from −37 ‰ to +189 ‰ for and from −41 ‰ to +100 ‰ for δ18O. Not only does in situ N2O have a distinct isotopic signature in each ice core, it also exhibits a variable isotopic signature within a given ice core. This suggests that the isotopic signature of the precursor(s) varies. Interestingly, all the ice cores except EDML show a negative correlation between (N2Oin situ) and δ18O(N2Oin situ) (Fig. 3b) while EDML shows a positive correlation.
While we used the TALDICE N2O record to represent atmospheric N2O, it is important to note that one sample within this ice core record is affected by in situ production (Fig. 3b). By comparison with the TALDICE spline, this particular sample contains 31 ppb of in situ N2O with a (N2Oin situ) value of −5 ‰ and a δ18O(N2Oin situ) value of +67 ‰. Despite this anomaly, there are compelling reasons to use TALDICE as a reliable record for atmospheric values. Firstly, only one sample out of the 192 measured was found to be affected by in situ production, indicating that such occurrences are rare. Indeed, this sample is characterized by an exceptionally high dust content of 188 ng g−1 of Ca2+, which is 280 % higher than typical dust peaks observed in the TALDICE ice core during the LGM. Secondly, the amount of in situ N2O in the affected sample is relatively small compared to this high dust content: it corresponds to a production factor of 0.16 ppb of N2O per ng g−1 of Ca2+, which has little influence on our results, as shown by our sensitivity study (Fig. C2 in Appendix C).
We stress that the mass balance approach used to calculate the isotopic signature of in situ N2O leads to substantial uncertainties due to error propagation from atmospheric N2O estimates and analytical precision. These uncertainties are not shown in Fig. 3 for readability but are reported in Figs. 4–7 and are explicitly taken into account in the following comparisons between δ15N(N2Oin situ) and δ15N(), including the regression analyses.
4.2 Comparison of isotopic compositions of and in situ N2O
In this section, we compare the measured isotopic composition of and the calculated isotopic composition of in situ N2O to test our hypothesis that is a precursor for in situ produced N2O. The analyses come from the same ice samples: N2O was measured in the extracted air and subsequently used to calculate the in situ N2O isotopic signature, while was measured in the sample meltwater collected after air extraction. To compare the data, we used the regression method by York et al. (2004) that accounts for errors in both the x and y variables and their potential correlation.
Figure 4 shows the bulk nitrogen isotopic composition of in situ N2O and the nitrogen isotopic composition of measured in the EDML, EDC, TG and Vostok ice cores. There is a clear positive correlation between (N2Oin situ) and δ15N() with a R2 value of 0.86 which points to nitrate being a key precursor for the in situ produced N2O. However, the slope is significantly different from 1, and in fact close to one half (0.53 ± 0.02), i.e., roughly one of the two N atoms of the in situ produced N2O originates from .
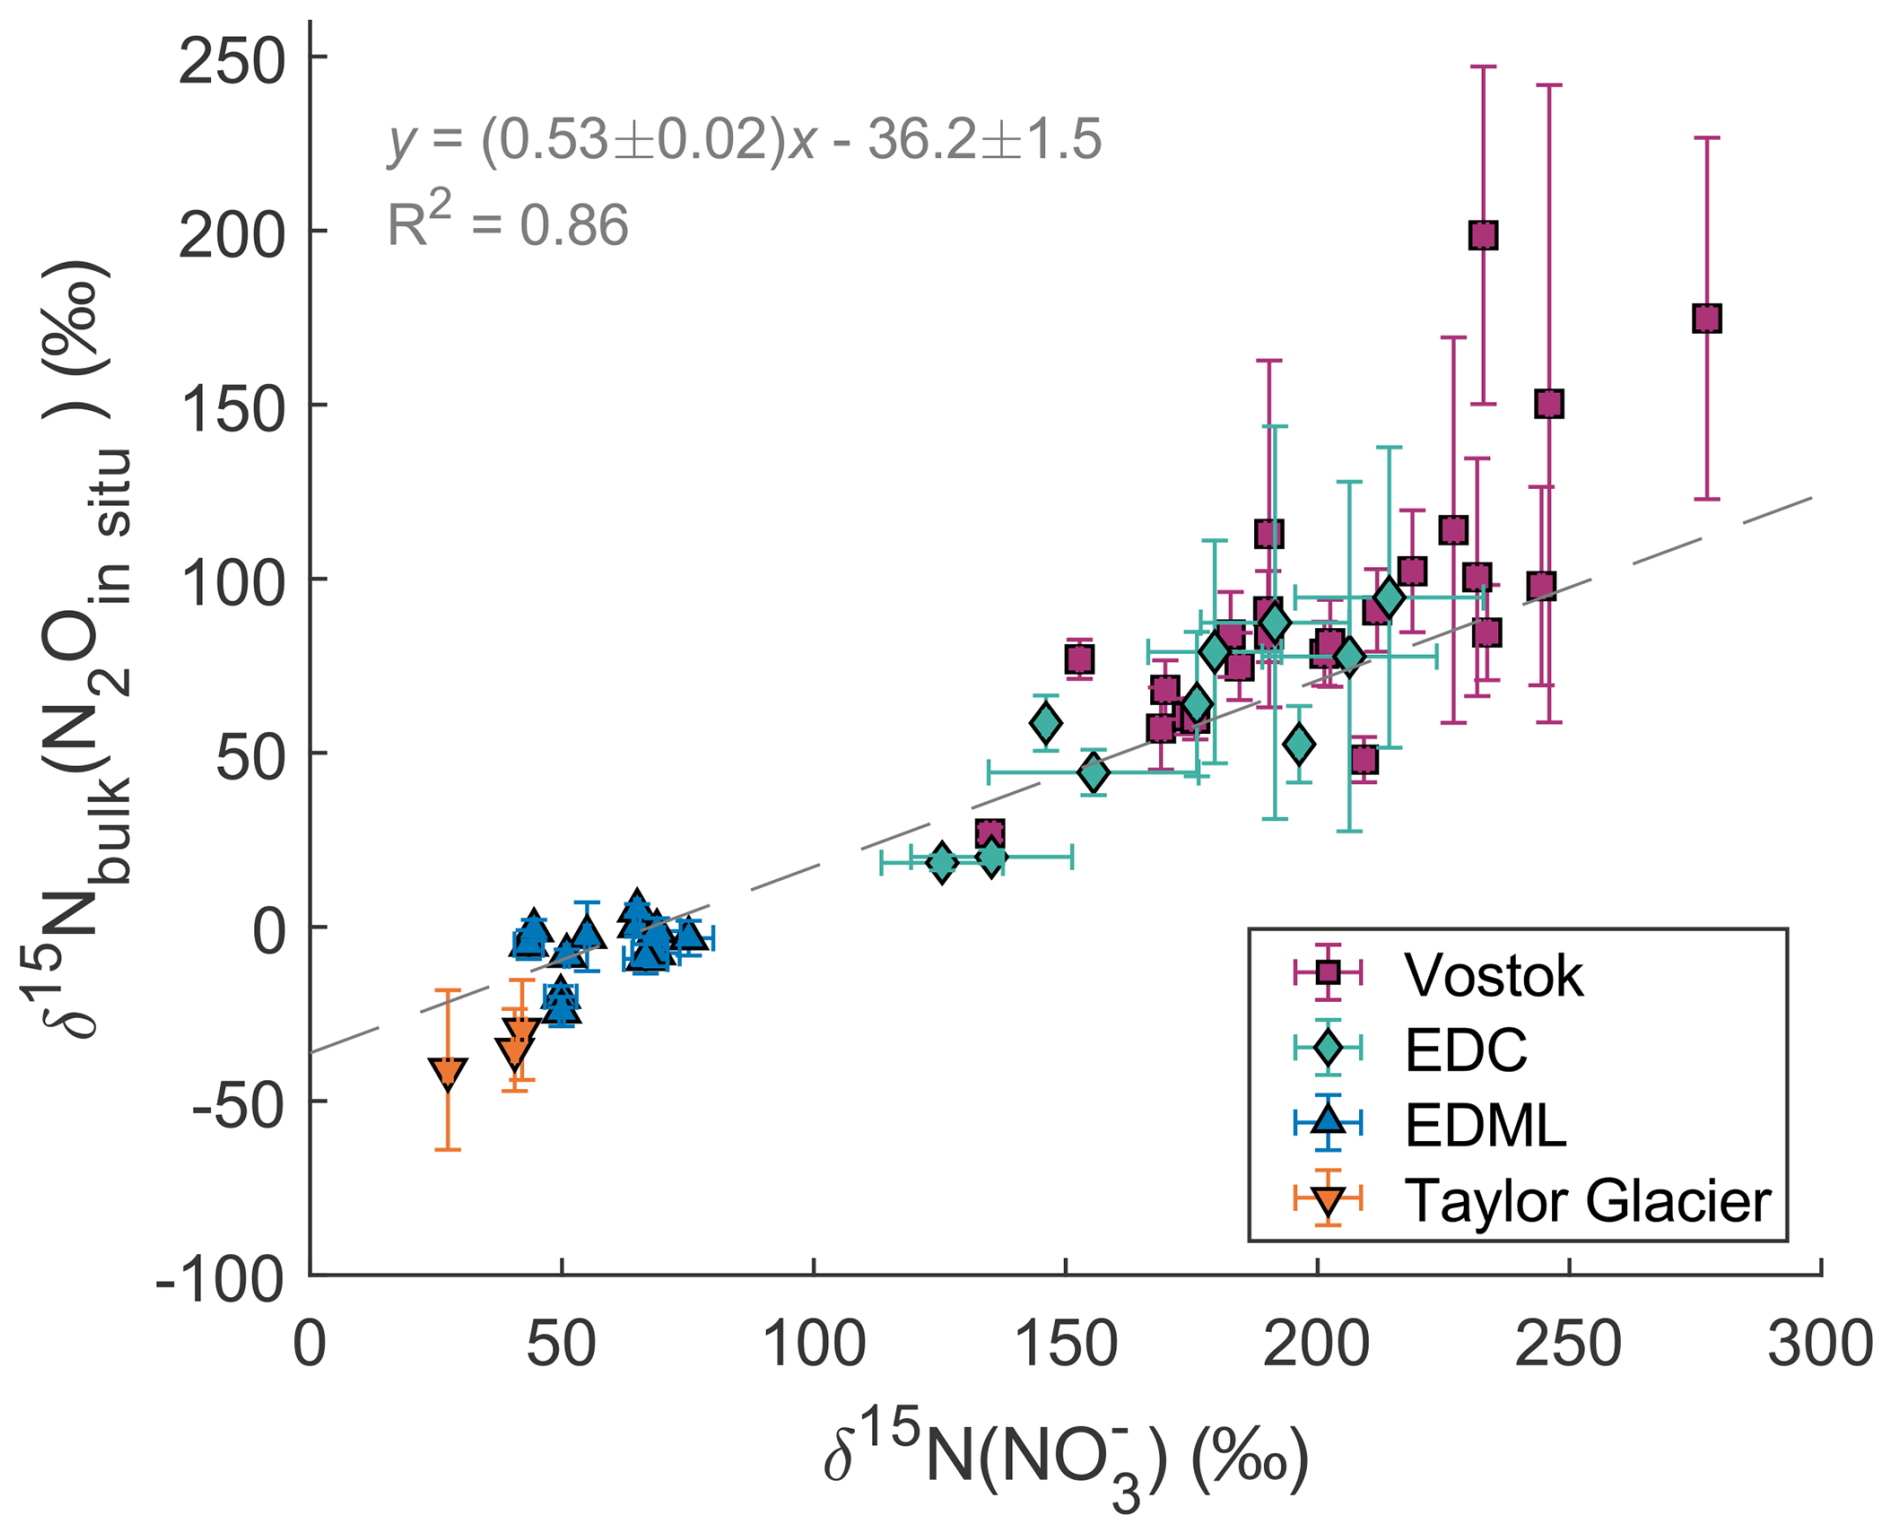
Figure 4Relation between (N2Oin situ) and δ15N(). The dashed line represents the linear regression.
Figure 5 shows the comparison between the δ18O values of and in situ N2O. There is no correlation between these two variables across or within sites, and no general trend towards 18O enrichment or depletion of in situ N2O relative to . At Vostok and EDC, δ18O() values are around +45 ‰ ± 6 ‰ (1σ), while δ18O(N2Oin situ) values are approximately +31 ‰ ± 17 ‰. At TG, δ18O() values are higher at +68 ‰ ± 4 ‰, and δ18O(N2Oin situ) values reach +93 ‰ ± 11 ‰. At EDML, δ18O() values are the highest at +87 ‰ ± 6 ‰, whereas δ18O(N2Oin situ) values are the lowest, at +17 ‰ ± 11 ‰.
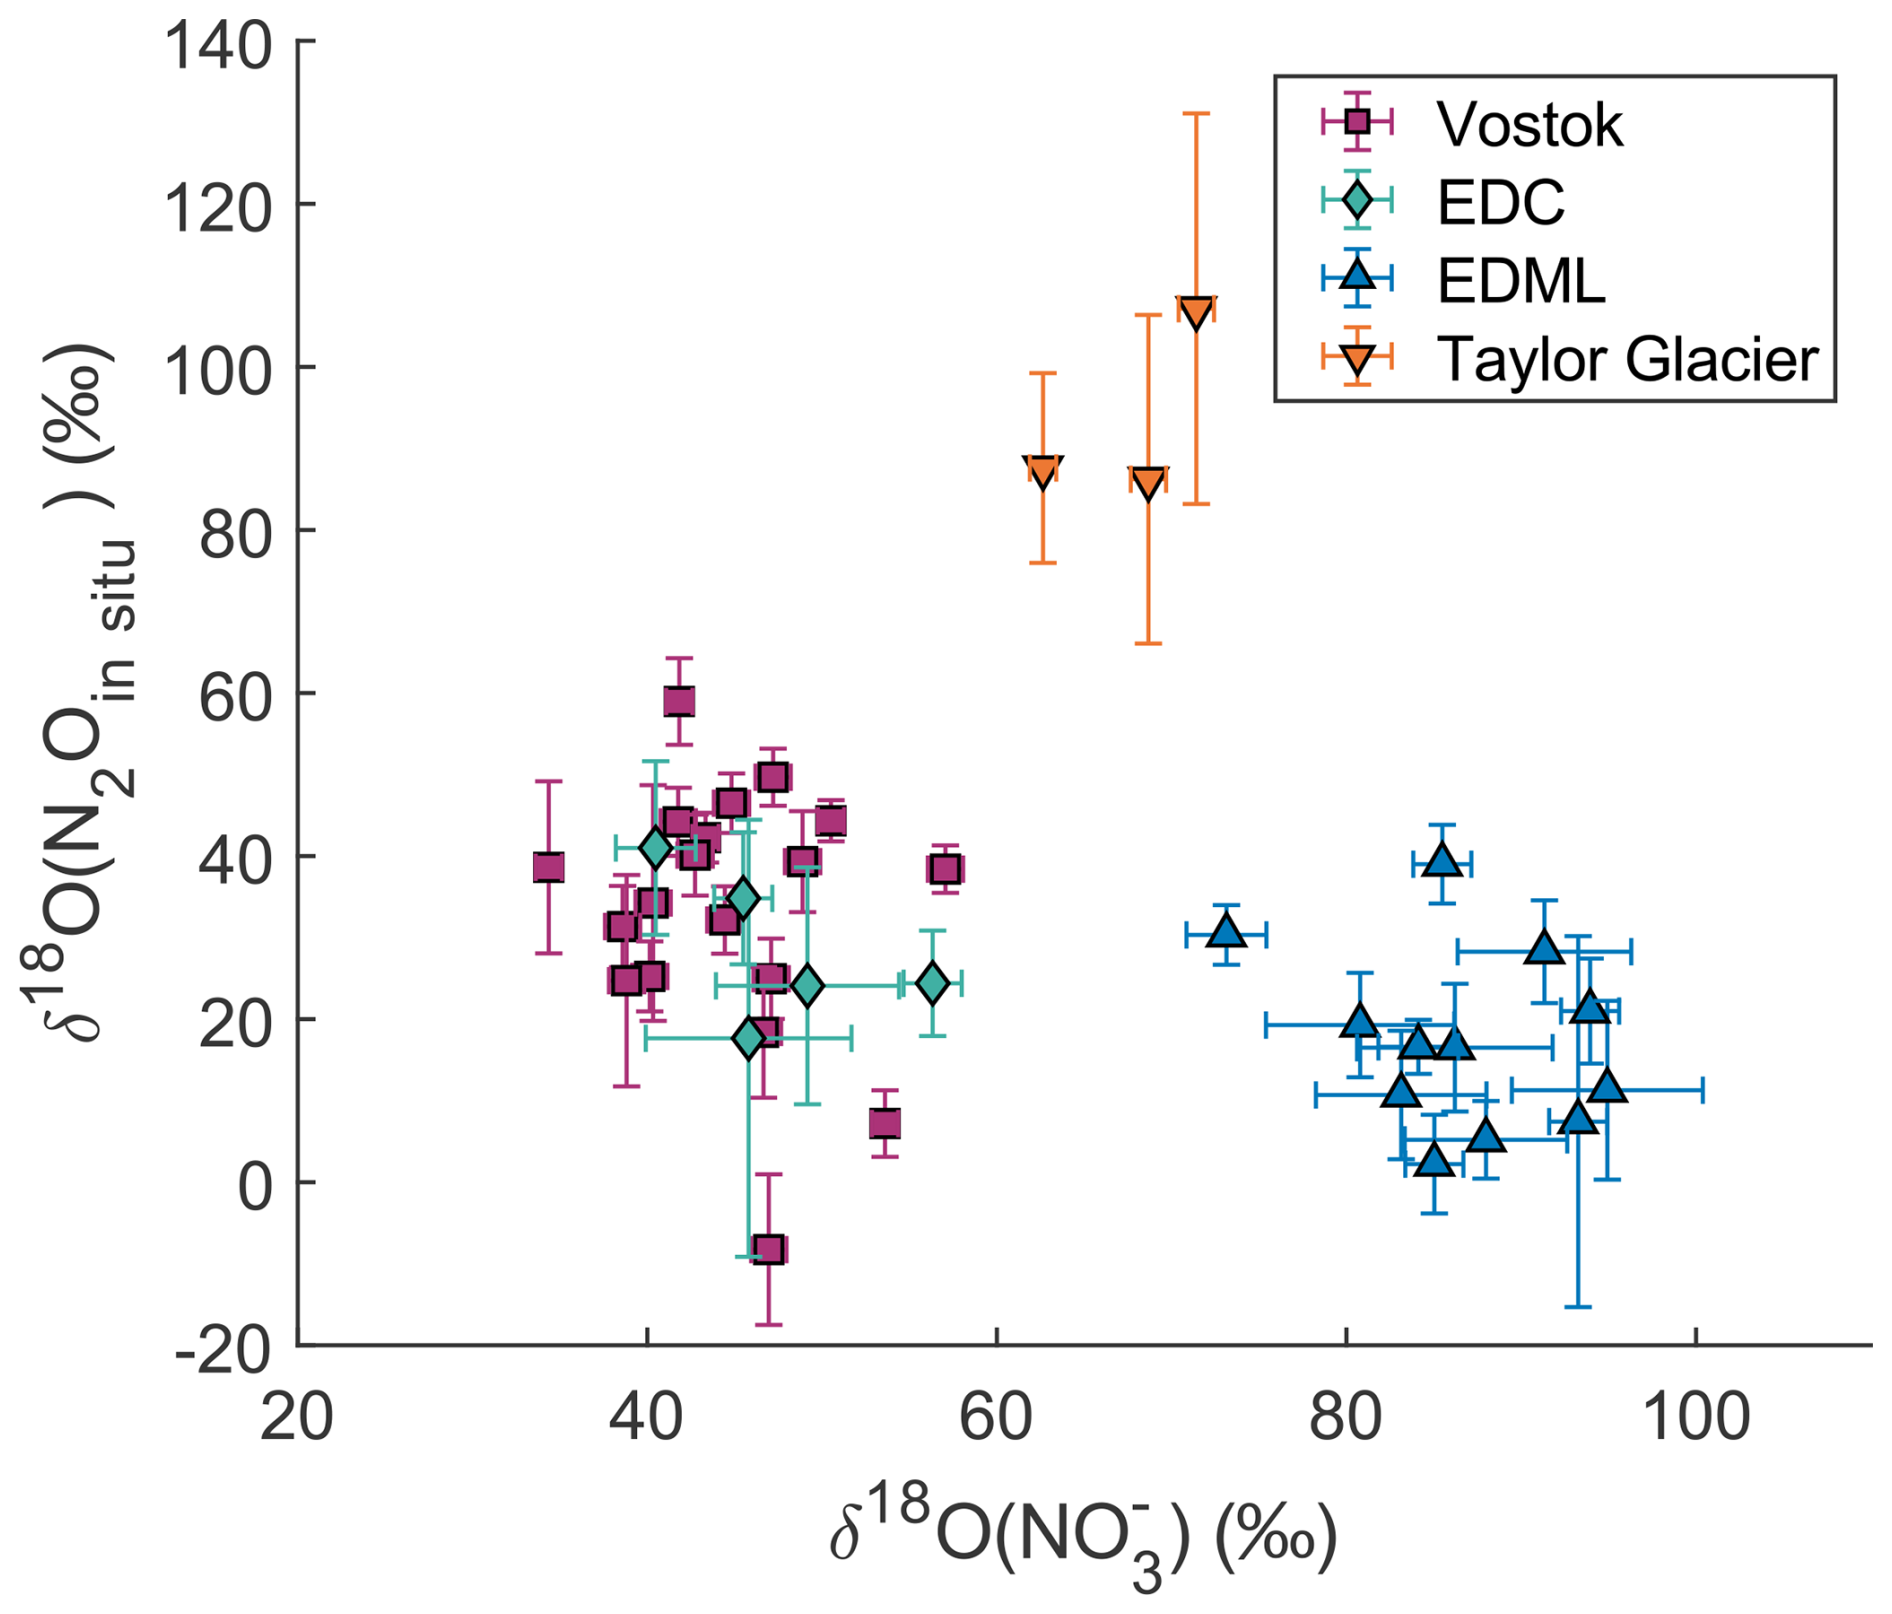
The very high δ18O(N2Oin situ) values observed at TG may appear anomalous compared to other sites, but we are confident that they do not result from a bias in the measurements or calculation. Even without applying the mass balance calculation, the measured N2O at TG already shows δ18O values higher than the atmospheric signature in samples affected by in situ production (Fig. 3a). This indicates that the in situ N2O at TG is indeed enriched in δ18O. A similar enrichment is observed in the NGRIP ice core. Importantly, these elevated δ18O values were measured using two different extraction methods and two different IRMS instruments at the University of Bern and Oregon State University, which strengthens our confidence that the signal is robust and not an artefact of a specific analytical setup.
In summary, despite the clear correlation between (N2Oin situ) and δ15N() values suggesting as a precursor, the incomplete transfer of both its nitrogen and oxygen isotopic compositions to in situ N2O indicates that alone does not fully account for the nitrogen and oxygen sources of in situ N2O. To gain deeper insights into the reaction mechanisms, we turn our focus to the position-specific isotopic composition of in situ N2O.
4.3 Site preference of 15N in in situ N2O
Figure 6 shows clear correlations of , , and SP values versus of total N2O (a, c) and in-situ N2O (b, d) measured in the TG and Vostok ice cores.
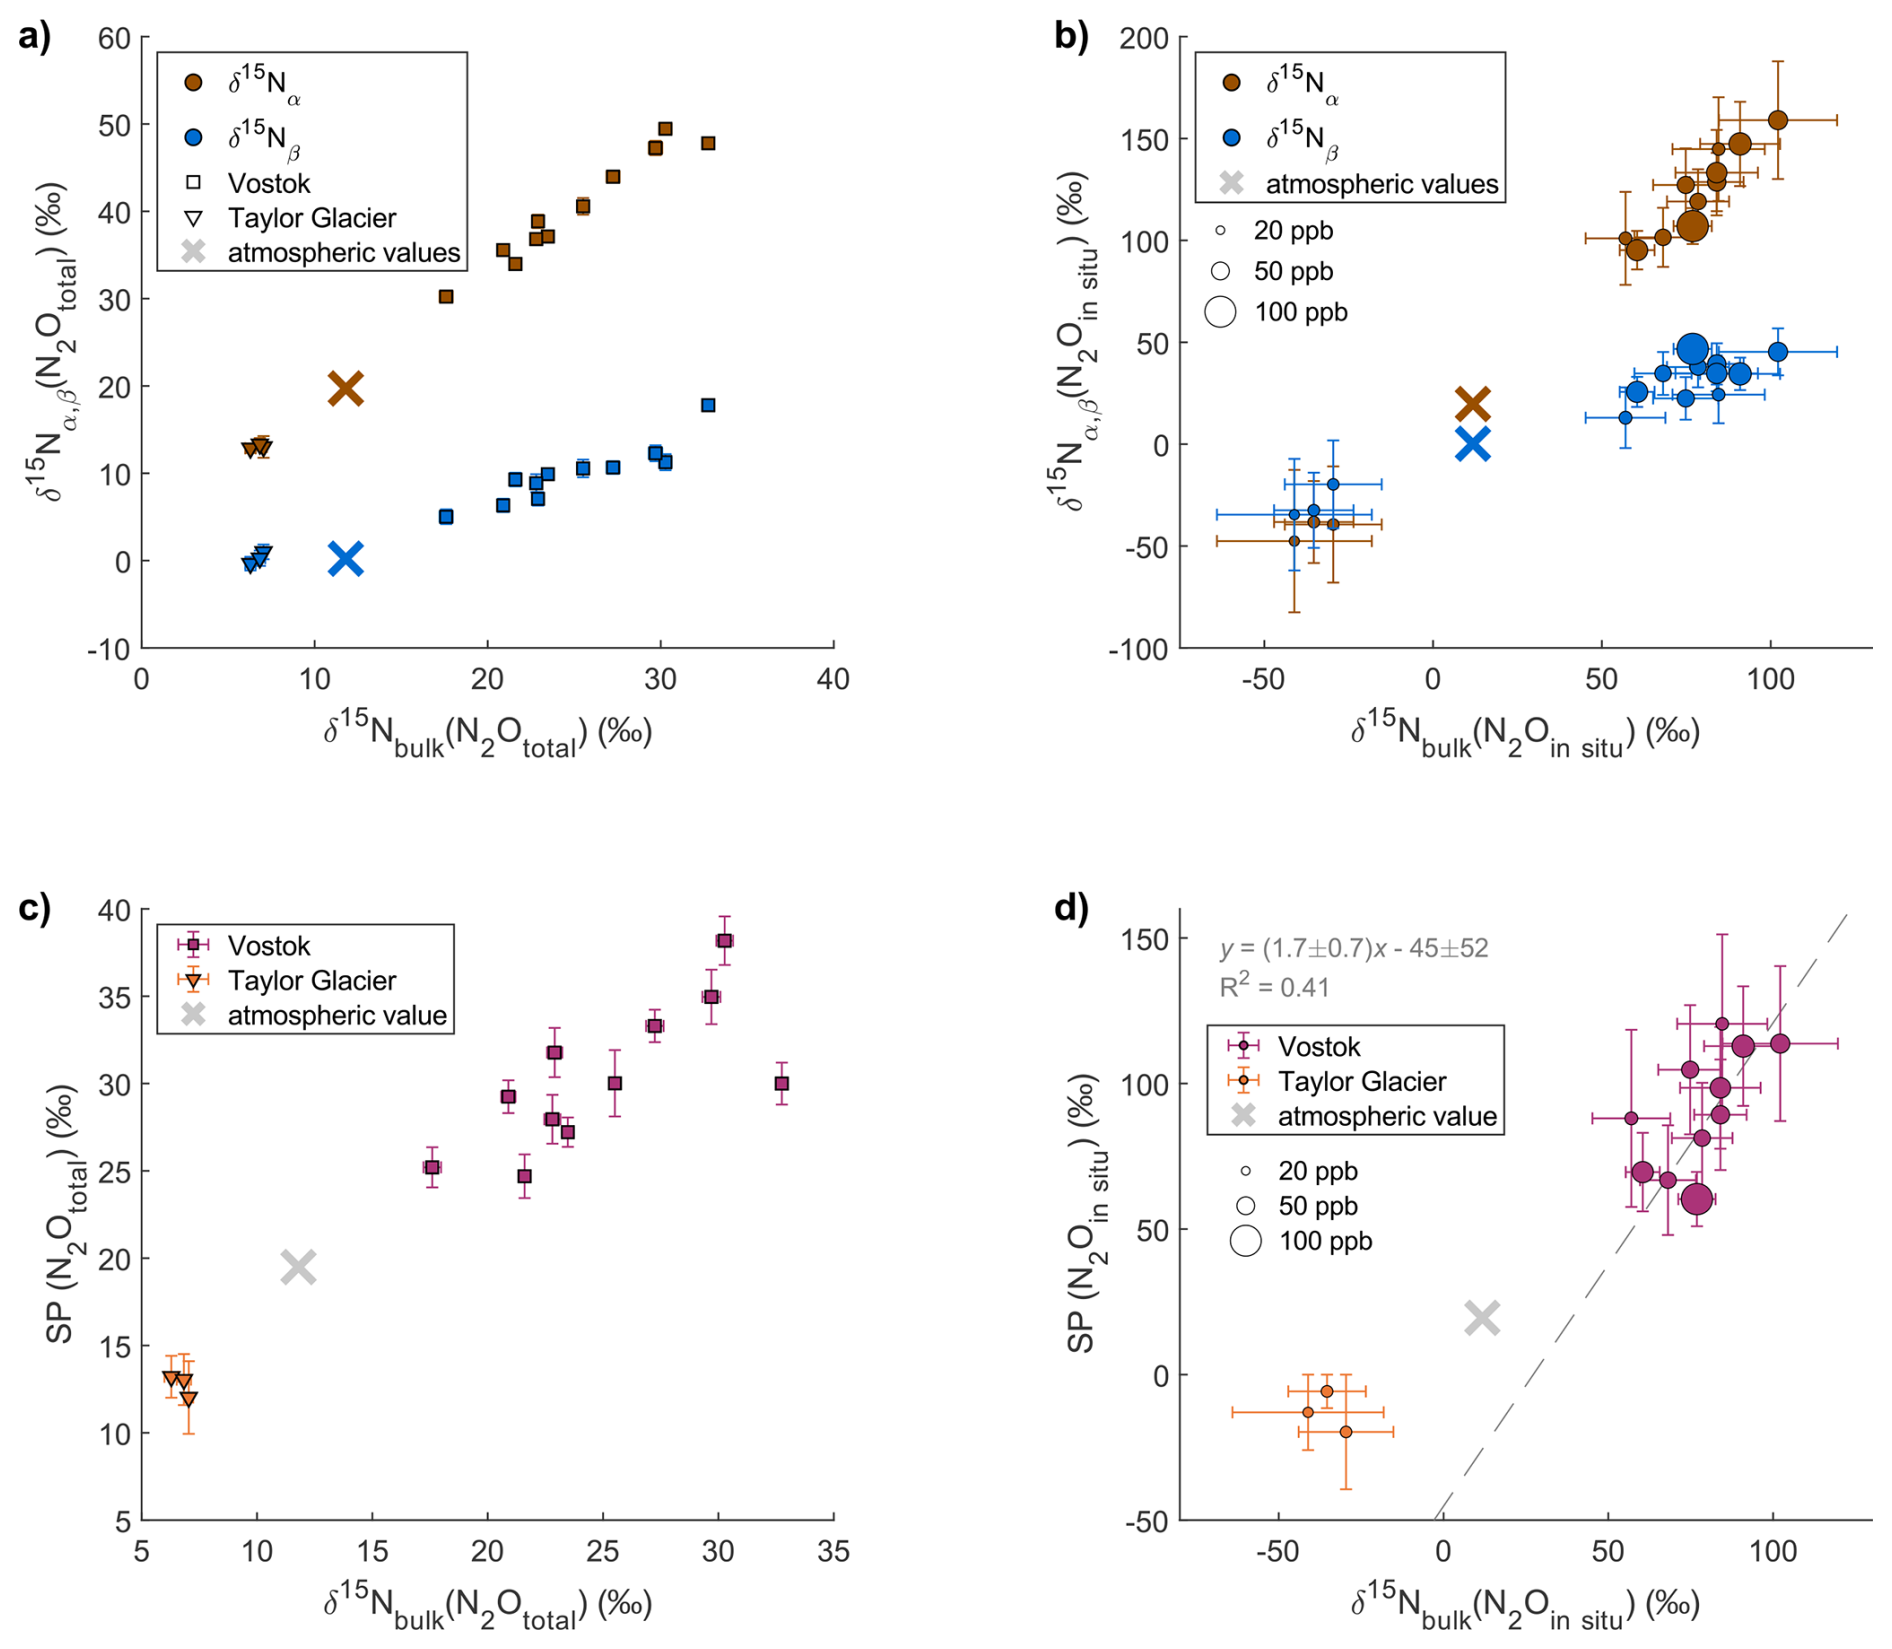
Figure 6Position-specific isotopic composition measured for total (atmospheric + in situ) N2O and calculated for in situ N2O in the Vostok and TG ice cores. The panels show the relation between , and of total N2O (atmospheric + in situ) (a) and in situ N2O (b), and between site preference (SP) and of total N2O (atmospheric + in situ) (c) and in situ N2O (d). The size of the markers on panel (b) and (d) are scaled to the amount of in situ N2O in the sample. In panel (b), TG samples are in the bottom-left corner. The crosses represent the unaffected atmospheric values measured by Menking et al. (2025) in dust-poor Taylor Glacier samples from the period 16 to 21 ka.
In situ N2O at Vostok exhibits high values from +95 ‰ to +152 ‰ and much lower values from +13 ‰ to +43 ‰. In contrast, in situ N2O at TG has low values from −50 ‰ to −39 ‰ and low values from −34 ‰ to −18 ‰, with being lower than the values. The Vostok and TG samples exhibit very different SP(N2Oin situ) values; +59 ‰ to +122 ‰ and −22 ‰ to −8 ‰, respectively. These values differ significantly from those of atmospheric N2O which range in SP from +17 ‰ to +24 ‰ across last glacial termination, as reconstructed from dust-poor sections of TG ice (Menking et al., 2025). The SP(N2Oin situ) values at Vostok are very high and variable, and are outside the range of typical reported values from −11 ‰ to +37 ‰ (Toyoda et al., 2017; Zhu-Barker et al., 2015). Note that the SP(N2Oin situ) values at Vostok seem to be correlated to the (N2Oin situ) values with a slope of 1.7 ± 0.7, whereas SP values in field and culture studies have been shown to be generally independent of (Frame and Casciotti, 2010; Sutka et al., 2003, 2006; Toyoda et al., 2005). For TG, there is too little data to identify a potential correlation.
Interestingly, the SP(N2Oin situ) values at TG are negative. Although the low amounts of in situ N2O at TG result in large uncertainties in the calculated in situ signatures, the low SP signal is already visible in the measured (total) N2O data (Fig. 6c), independent of any mass-balance calculation. While Vostok samples affected by in situ production show total SP values higher than the atmospheric signature, TG samples show the opposite pattern, with total SP values lower than the atmospheric signature. This opposite deviation indicates that the low SP values observed at TG reflect a real feature of in situ N2O production rather than an artefact of the calculation.
In Fig. 7, the and values of in situ N2O are compared with δ15N values of measured in the TG and Vostok ice cores on the same samples. When considering both TG and Vostok samples, (N2Oin situ) shows a strong positive correlation with δ15N() (slope=1.0 ± 0.1, R2=0.97). This relationship also holds when considering the Vostok data alone, indicating that the correlation is robust even within a single ice core. In contrast, (N2Oin situ) does not show a statistically significant correlation with δ15N() for either site.
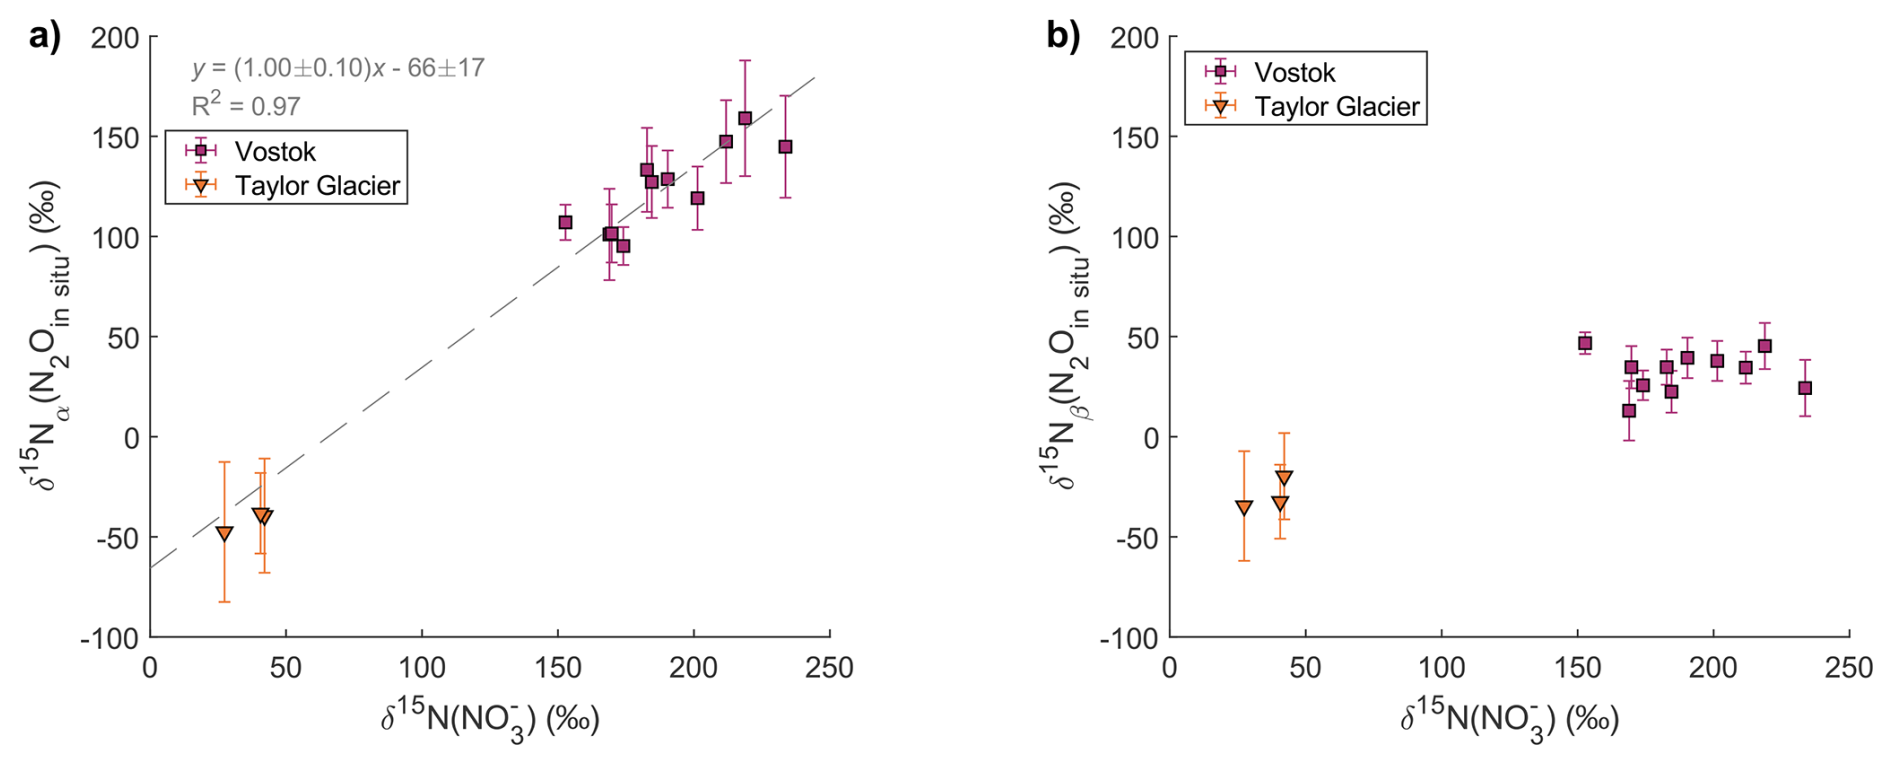
Figure 7Relation between (N2Oin situ) and δ15N() (a) and between (N2Oin situ) and δ15N() (b).
5.1 Production of hybrid N2O
The strong correlation between (N2Oin situ) and δ15N() indicates that is involved in the in situ N2O formation. However, the slope is (0.53 ± 0.02) (Fig. 4), whereas a slope of 1 would be expected if both nitrogen atoms in N2O originate from in the ice. Therefore, our results suggest that in situ N2O is not derived from alone, and does not originate from a single precursor (we use the term “single-precursor N2O” hereafter, see Fig. 9). The strong correlation of (N2Oin situ) and δ15N() with a slope of 1.0 ± 0.1 (Fig. 7a), implies that the central N atom in N2O (Nα), originates exclusively from archived in the ice. At the same time, the (N2Oin situ) values are not correlated to δ15N(), indicating that the terminal N atom (Nβ) originates from a different nitrogen source. The slope of the linear regression between SP(N2Oin situ) and (N2Oin situ) (1.7 ± 0.7) is consistent, within uncertainty, with transfer of a variable N isotopic composition from to Nα and transfer of a constant N isotopic composition from another precursor to Nβ. Indeed, by substitution of Eqs. (1) and (2), one would expect , where is relatively constant within each ice core, although its specific value differs between cores (Fig. 7b). Our results suggest that the N2O produced in situ is thus “hybrid N2O”, defined by its two nitrogen atoms originating from two distinct nitrogen precursors, one of them being in ice (Fig. 9).
To assess whether microbial N2O reduction to N2 could provide an alternative explanation for the observed isotopic patterns of in situ N2O – such as high SP values correlated with or high δ18O values – we examined the relationship between SP and δ18O in our samples (Fig. 8). Previous studies showed that N2O reduction produces a characteristic increase in both SP and δ18O in the residual N2O, with data falling along a “reduction line” defined by the ratio of the fractionation factors (median slope≈0.36; Lewicka-Szczebak et al., 2015; Yu et al., 2020). In contrast, in both the Vostok and Taylor Glacier ice cores, SP increases while δ18O decreases, and the data clearly do not fall along the expected reduction line (Fig. 8). This dual isotope plot for in situ N2O is therefore incompatible with N2O reduction. We note that published reduction lines were derived from studies conducted at warmer temperatures than those in ice cores (Yu et al., 2020). Very low temperatures could modify the fractionation factors; however, colder conditions would be expected to increase the fractionation for both SP and δ18O, still resulting in a positive slope. The mismatch between our data and the reduction line therefore remains regardless of potential temperature effects. A second line of evidence comes from the correlation between δ15N() and (N2Oin situ), which shows a slope of ∼1. Because N2O reduction preferentially breaks N-O bonds of light isotopes, the residual N2O becomes enriched in 15N at the α position, resulting in a steeper slope than observed here. Taken together, these observations show that microbial N2O reduction cannot explain the isotopic signatures in the ice cores, and that N2O consumption does not occur in the ice. The isotopic signature of in situ N2O is therefore explained by hybrid N2O production.
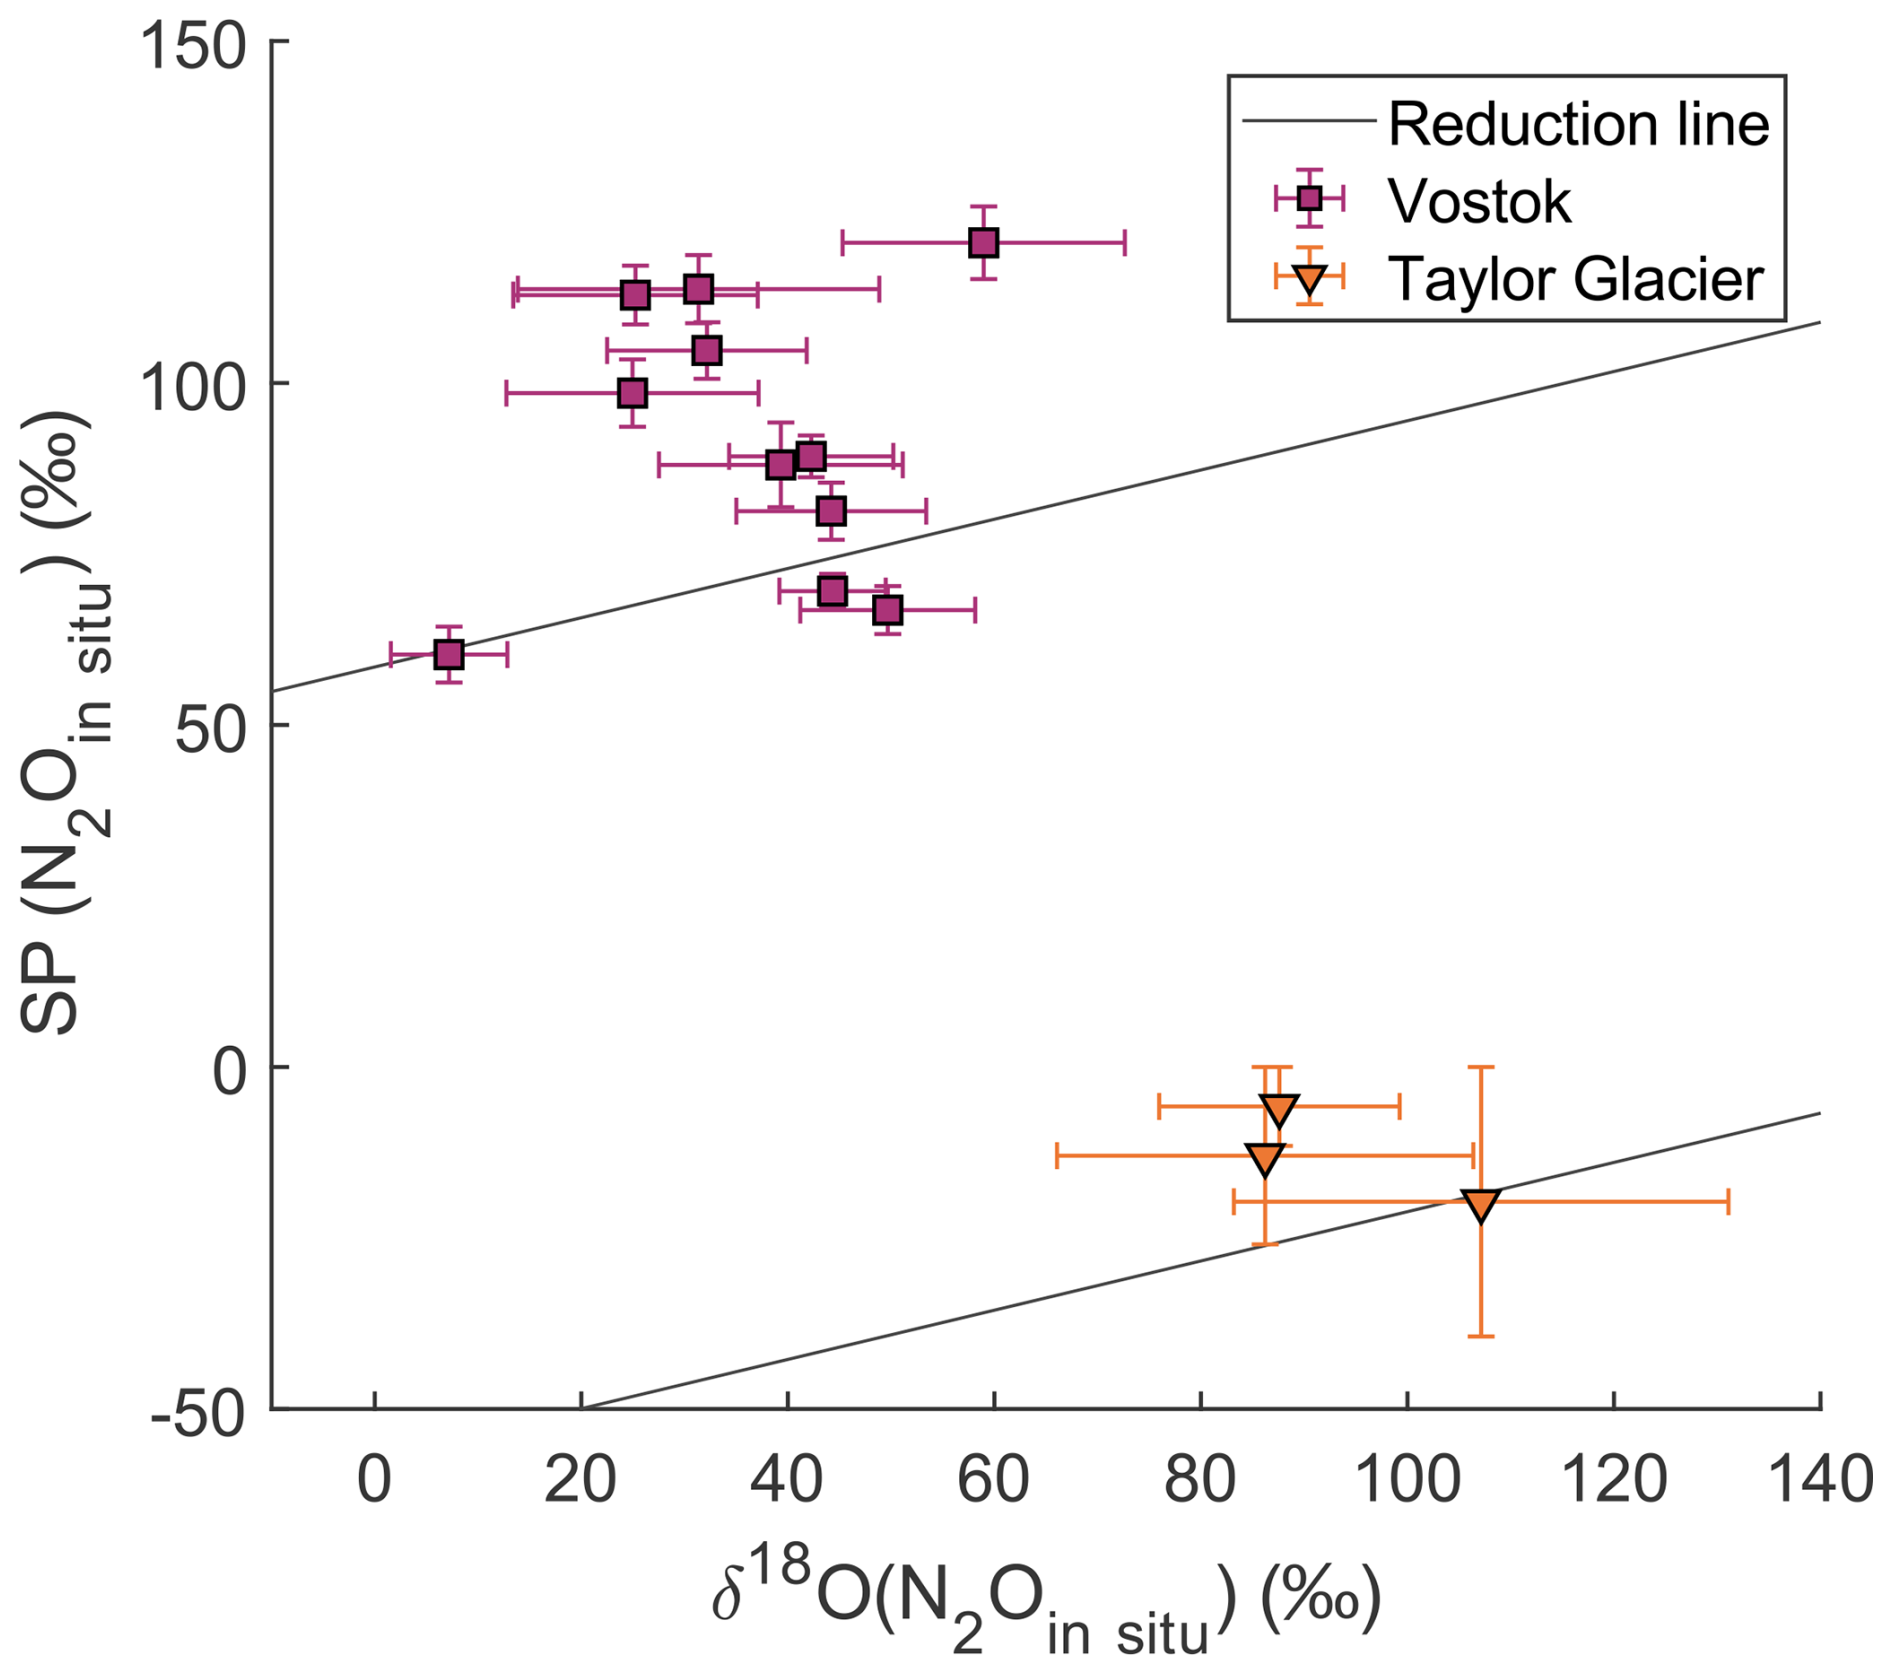
Figure 8Dual isotope plot of δ18O and site preference (SP) values of in situ N2O. Theoretical N2O reduction lines (thin black lines) are shown for comparison, with intercepts calculated assuming that samples with the lowest SP values are unaffected by N2O reduction. The slope of the reduction line corresponds to the median of published fractionation ratios for SP versus δ18O during N2O reduction, as reported by Yu et al. (2020).
5.1.1 Potential reaction pathways
A large number of studies have reported the production of hybrid N2O through various reaction pathways, including N-nitrosation reactions (Spott et al., 2011) and the decomposition of ammonium nitrate (NH4NO3) (Rubasinghege et al., 2011). N-nitrosation reactions generally involve the replacement of a hydrogen atom on a nucleophilic precursor by a nitroso () group (Spott et al., 2011). Production of N2O occurs during N-nitrosation under acidic conditions, when the nitrosating agent nitrite () reacts with the nucleophile hydroxylamine (NH2OH) to form nitroxyl (HNO). Two HNO molecules then dimerize to produce nitrous oxide (N2O) and water (Spott et al., 2011). This reaction can be abiotic or mediated by bacteria, archaea, or fungi. Other nucleophilic species can react with to produce N2O, such as azide (), ammonium (), hydrazine (N2H4), or salicylhydroxamic acid (C7H7NO3) (Spott et al., 2011).
Another pathway for hybrid N2O production is the decomposition of ammonium nitrate (NH4NO3), either by thermal decomposition or by a light-initiated reaction involving the photoreduction of to NO2 coupled with the oxidation of to NH2, which react with each other to produce N2O (Rubasinghege et al., 2011). However, several arguments challenge the feasibility of the NH4NO3 decomposition in ice. Firstly, the ice environment lacks sufficient heat for thermal decomposition, and light penetration is minimal within the deep firn and ice, raising questions about the availability of sufficient energy for these reactions. The high activation energy of the decomposition would make the reaction very slow at the ice temperature. Additionally, if N2O were produced from NH4NO3, the oxygen atom in N2O would originate from and inherit its isotopic composition, yet the δ18O values of in situ N2O do not correlate with those of (Fig. 5). Finally, and are present in dust-poor polar ice as well, where no in situ N2O production is observed, and similarly, there is not necessarily in situ N2O production everywhere in dust-rich ice from Greenland despite sufficient and . In our view, an N-nitrosation reaction is more likely than a NH4NO3 decomposition reaction for N2O production in ice.
5.1.2 Source of central nitrogen atom Nα
In the case of in situ N2O produced by N-nitrosation, the central nitrogen atom (Nα) may originate from after reduction of . However, it is unlikely that this derives directly from photolysis in the near-surface snowpack. photolysis produces both gaseous NO2 and ion, with accounting for ∼10 % of the photolysis products (Meusinger et al., 2014; Warneck and Wurzinger, 1988). Photolysis occurs at the snow surface only, where sunlight penetrates and where air exchange with the atmosphere is still active. Any N2O produced through photolysis-driven pathways in this zone would therefore be largely released to the atmosphere and not preserved in the ice core record. In addition, photolysis enriches the remaining in 15N while producing that is depleted in 15N, with its isotopic composition depending on the extent of photolysis. If photolysis-derived were a precursor of in situ N2O, the signature of in situ N2O would reflect both the initial δ15N() and the extent of photolysis, and would not be directly proportional to the δ15N values of archived in the ice. Instead, our data show a strong proportionality between δ15N() and δ15N(N2Oin situ), indicating that the precursor must form deeper in the ice from archived that already carries its final, post-photolysis isotopic signature, rather than from photolysis-derived produced in the surface snowpack. Therefore, the reduction of to occurring within the ice requires a reducing agent. Such a reducing agent is likely associated with mineral dust, which is consistent with the observation that in situ N2O production occurs only in dust-rich ice. Iron II (Fe2+) is likely involved in this reduction step (see Sect. 5.2).
5.1.3 Source of terminal nitrogen atom Nβ
Our work does not yet allow us to identify the nucleophilic precursor for Nβ, especially because the presence and concentrations of most N-bearing compounds in ice have not yet been investigated. Nevertheless, represents a potential candidate for supplying Nβ in the case of N-nitrosation reactions. Atmospheric exhibits δ15N values ranging from −20 ‰ to +25 ‰ (Chen et al., 2022), rather similar to the values of in situ N2O in Vostok and TG with average values of −27 ‰ and +24 ‰, respectively. These site differences could be due to post-depositional processes altering the isotopic composition of differently at different drilling sites. The nitrogen isotopic composition of has been measured only in one alpine glacier ice core, with δ15N values ranging from −15 ‰ to +5 ‰ for the years 2013–2017 (Lamothe et al., 2023). To further investigate this hypothesis, we suggest measuring the nitrogen isotopic composition of in Antarctic ice cores, specifically from Vostok and Taylor Glacier, to compare with the values of in situ N2O.
5.2 Limiting factor of the reaction
One key observation is that the elevated N2O mixing ratios during glacial periods are of similar magnitude over the last 800 kyr in the EDC ice core with no increase with depth/age (Schilt et al., 2010b). This observation suggests that N2O in situ production does not increase further over time and is essentially finished at the LGM (20 to 26.5 ka). Therefore, we hypothesize a mechanism that is limited by the concentration or transport/diffusion of a reactant. The limiting factor cannot be as the concentrations remain high over time. Thus, it could be the precursor of the terminal N atom (Nβ) or the agent reducing to .
Indeed, because N-nitrosation reactions typically involve rather than (Spott et al., 2011), a prior conversion of to is required. While this step can be carried out by denitrifying organisms, the extremely low temperatures and acidic conditions in Antarctic ice make an abiotic process more likely (see Sect. 5.5). can be abiotically reduced to by redox-active metal ions such as Fe2+ or Mn2+ (Zhu-Barker et al., 2015). This hypothesis is supported by the presence of Fe2+ in ice cores (Spolaor et al., 2012, 2013). Baccolo et al. (2021) found decreasing Fe2+ concentrations with depth in the TALDICE core, and below 1500 m only Fe3+ is present in the form of jarosite (), a mineral that forms through chemical weathering of aeolian dust under acidic conditions in deep ice. These findings indicate that Fe2+ undergoes slow post-depositional oxidation in the ice. One possible explanation is that oxidizes dust-derived Fe2+, which could explain the observed link between dust content and in situ N2O production. In this scenario, Fe2+ is the limiting factor for N2O production, as it is progressively consumed during the conversion from to .
5.3 Site preference constraints on the N2O production mechanism
Since many reaction pathways have specific SP values, the SP signature is commonly used to attribute N2O production to a specific pathway. High SP values ranging from +22 ‰ to +37 ‰ are reported for nitrification (Toyoda et al., 2002, 2017), fungal denitrification (Toyoda et al., 2017), and abiotic reactions such as reduction and NH2OH oxidation (Heil et al., 2015; Toyoda et al., 2005). Several studies suggested that the similarity of the SP signatures for these distinct formation pathways is attributable to a common intermediate species – hyponitrous acid HONNOHcis (Heil et al., 2015; Toyoda et al., 2002, 2005, 2017). During decomposition, this intermediate preferentially breaks at the 14N-O bond over the 15N-O bond, enriching the central N atom (Nα) in 15N and explaining high SP values (Toyoda et al., 2002) (Fig. 9a). In contrast, bacterial and nitrifier denitrification produce N2O with low SP values from −11 ‰ to 0 ‰ (Toyoda et al., 2017), which are thought to derive from a different intermediate. Modeling work suggested a trans-hyponitrous structure that decomposes preferentially into 15N14NO due to kinetic isotope effects, thus explaining the low SP values of these formation pathways (Fehling, 2012) (Fig. 9a). Overall, in these cases, SP values are therefore determined by the decomposition step of the last intermediate into N2O and are independent of the δ15N values of the precursor (Fig. 9).
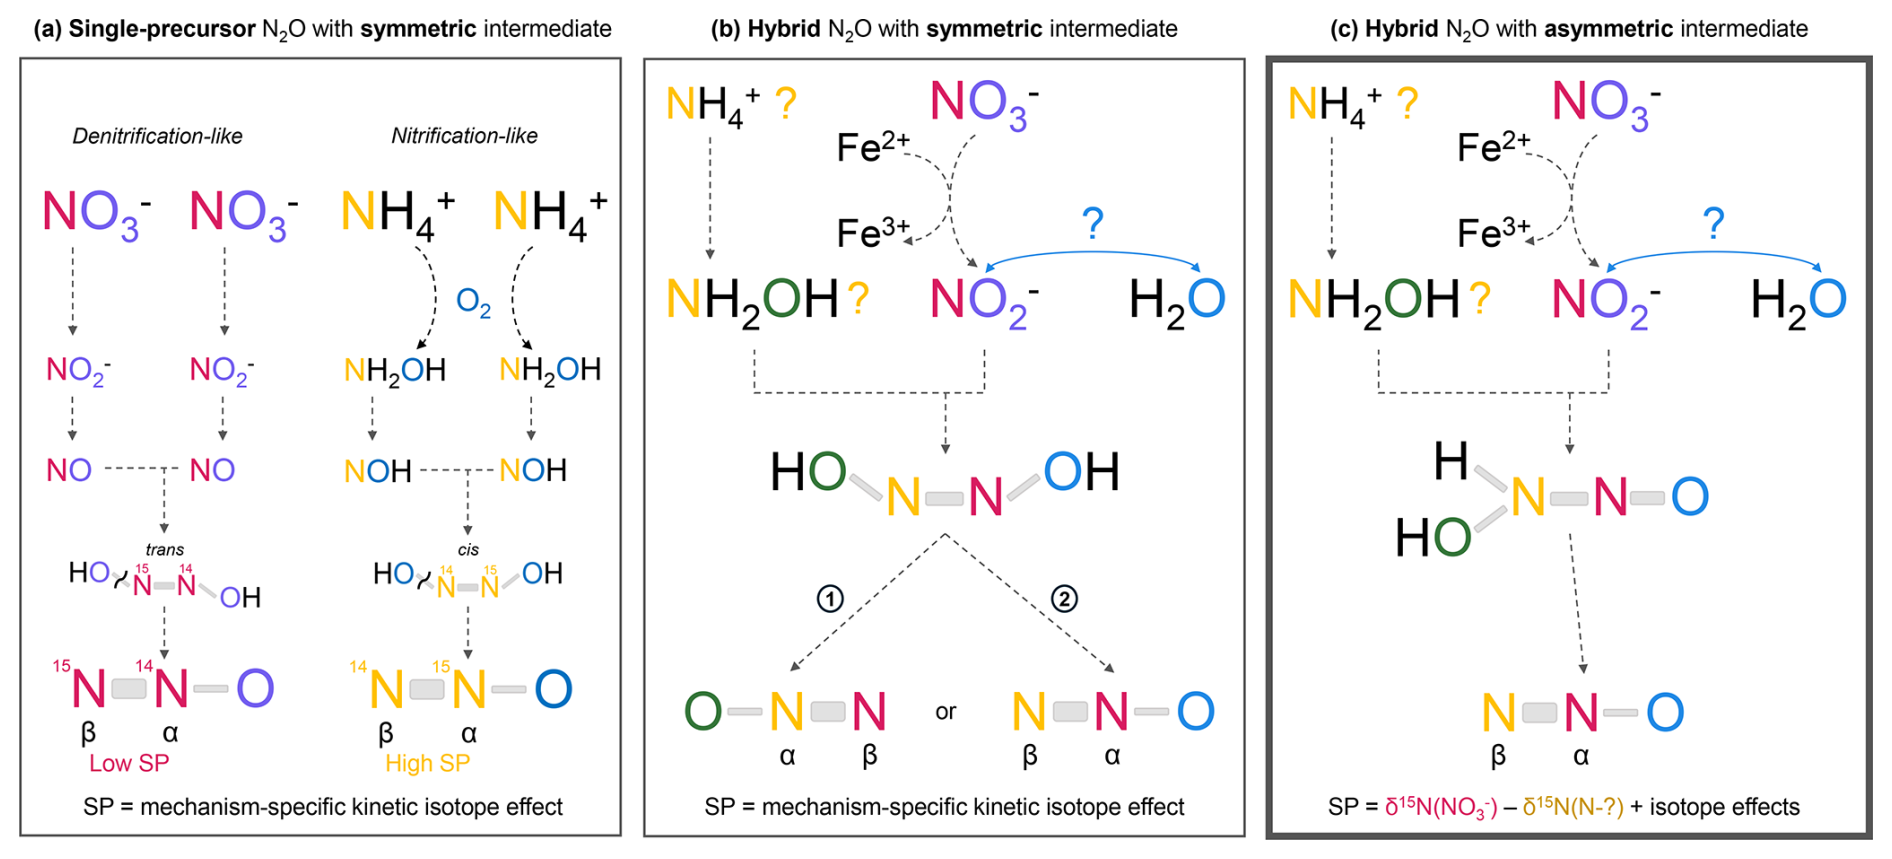
Figure 9Production mechanisms for single-precursor N2O (a) and hybrid N2O (b, c). Two mechanisms for hybrid N2O production are proposed: panel (b) explains constant SP values, while panel (c), which explains the observed SP dependence on the δ15N values of the precursor, is more likely to represent the in situ production pathway. (b) Mechanism with a symmetric intermediate, here the cis-hyponitrous acid HONNOH. Depending on which N-O bond of the symmetric intermediate breaks, the NO2-derived and NH2OH-derived N atoms can each end up either in the central position (α) or in the terminal position (β) in N2O. The percentage of molecules 1 and 2, and consequently the site preference, only reflects the preferential cleavage of the 14N-O bond over the 15N-O bond during the last step of N2O formation. Therefore, hybrid N2O exhibits a consistent site preference that is independent of the δ15N values of the precursors (Heil et al., 2014). In this case the O atom is derived from one precursor or the other. (c) Mechanism with an asymmetric intermediate. In this case, the O atom and the central N atom (Nα) are always derived from and the terminal N atom (Nβ) from NH2OH. The two N atoms retain the δ15N signatures of their individual precursors. The site preference is therefore variable, as it depends on the difference between the δ15N values of the two precursors. This mechanism matches our observations but to our knowledge has not yet been reported in the literature. Note that the precursors and intermediates shown in this figure are only examples used to illustrate our point about SP values. It is one hypothesis among others for the mechanism of in situ N2O production as the nitrogen source of the terminal nitrogen Nβ in N2O (in yellow) remains unknown. During in situ production, Fe2+ carried by dust may reduce to and act as the limiting factor once fully oxidized to Fe3+.
For in situ N2O, however, the SP values for the Vostok and TG ice cores do not fall into either typical low or high SP range and are highly variable (Table 2). The constant-SP pathways discussed above produce single-precursor N2O, but in the case of hybrid N2O production, one would expect a priori that the SP would no longer be a unique mechanism-dependent signature. Instead, for hybrid reactions the SP should be influenced by the difference between the δ15N signatures of the two precursors, if the central N atom (Nα) is derived from one precursor and the terminal N atom (Nβ) from the other. However, Heil et al. (2014) demonstrated that hybrid N2O from the nitrosation of NH2OH by is also characterized by a constant SP value of +34 ‰ (Table 2) regardless of the precursor signatures. The authors concluded that the NH2OH-nitrosation mechanism also involves the symmetric hyponitrous intermediate (Fig. 9b). In fact, since this intermediate is symmetrical, the N atoms from each precursor can either take the α-position or the β-position in the final N2O molecule; the difference in their δ15N values then has no influence on the SP value (Fig. 9b).
Table 2Comparison of the site preference (SP) range measured for hybrid N2O in a previous study with SP ranges calculated for in situ N2O in the Vostok and TG ice cores.
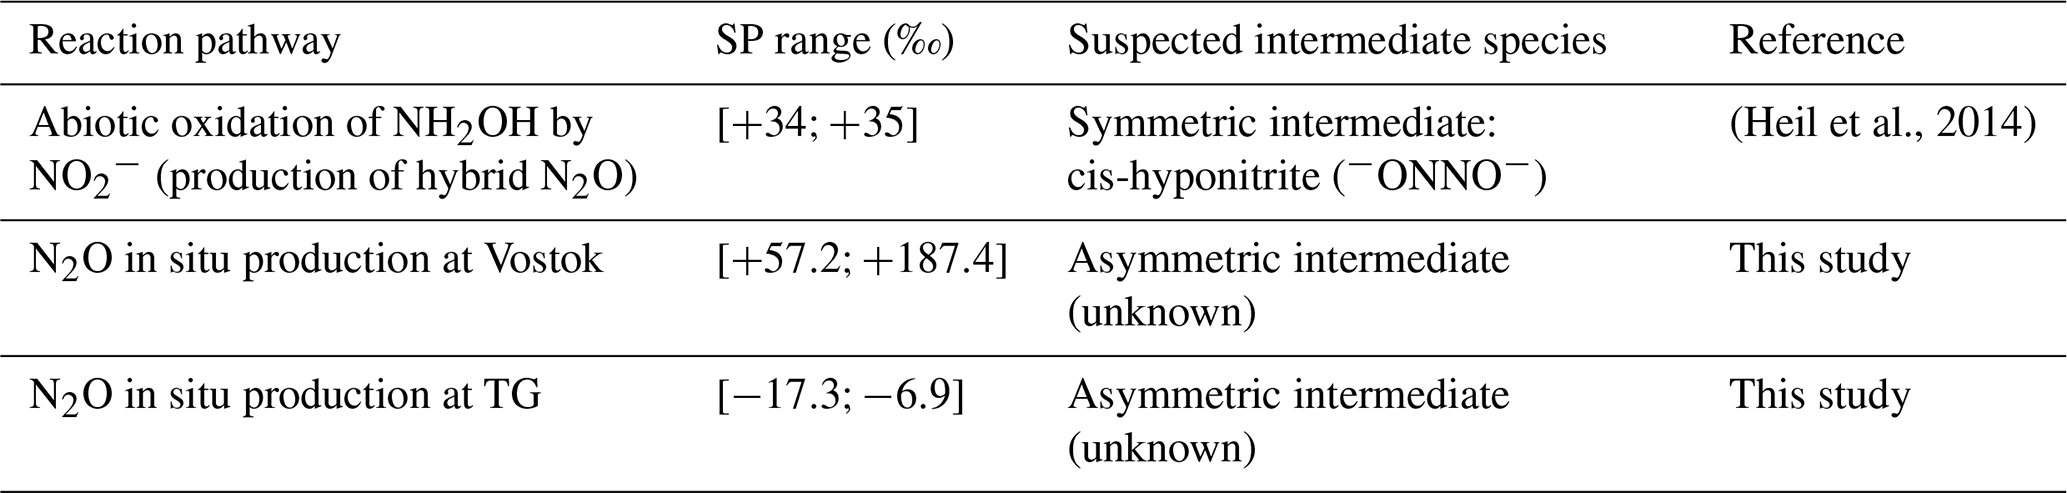
Because of the variability of the SP(N2Oin situ) values and their dependence on the δ15N() signature, we therefore deduce that the production mechanism of in situ N2O does not involve the hyponitrous symmetrical intermediate. In Fig. 9c, we propose a new reaction mechanism that involves an asymmetric intermediate, resulting in a hybrid N2O molecule in which the N atoms at the α and β positions are derived from a specific precursor. Nα and Nβ retain the two individual signatures of the precursors rather than losing them as discussed above. The high variability of SP values is then attributable to the variability of values (Fig. 6), which originates from the wide range of δ15N() values (Fig. 7).
We note that all published SP datasets used for comparison were obtained at ambient temperatures, whereas in situ N2O production in Antarctic ice occurs at very low temperatures. Such low temperatures imply extremely slow reaction rates, which may alter the magnitude of isotope fractionation and make direct comparison of absolute SP values with ambient-temperature experiments difficult. To our knowledge, no SP measurements exist under such cold conditions. However, our interpretation does not rely on comparing absolute SP values. Instead, we focus on whether SP is constant or variable with respect to the δ15N signature of the precursor; this property should be independent of the absolute magnitude of isotope fractionation. Although lower temperatures may increase kinetic isotope effects and shift absolute SP values, they do not change whether SP remains constant (as in reactions involving symmetrical intermediates) or varies with the precursor isotopic composition (as expected when an asymmetrical intermediate forms). Thus, the comparison of the mechanisms remains valid even without low-temperature experimental data from previous studies.
Several mechanisms could potentially explain why the intermediate of in situ N2O production is asymmetric, even though its exact chemical structure remains unknown. Firstly, the precursor of the β-position N atom could be different from NH2OH. Although most studies on hybrid N2O production report a reaction between NH2OH and (Frame et al., 2017; Spott et al., 2011; Stieglmeier et al., 2014; Terada et al., 2017), other nucleophilic precursors have been reported as precursors of hybrid N2O. Hydrazine (N2H4), for example, forms the asymmetrical intermediate (Perron et al., 1976). A second possibility is that very low temperatures modify the structure or stability of the intermediate normally formed from NH2OH and at ambient temperature conditions, favoring an asymmetrical species and thereby generating the observed dependence of SP on the precursor δ15N values.
The same hybrid production mechanism proposed for in situ N2O production in Antarctic ice may occur at Don Juan Pond (DJP), Antarctica. Like in ice cores, N2O formation at DJP reported by Samarkin et al. (2010) occurs under very low temperatures and involves and especially , with higher production rates for as precursor. The authors demonstrated that N2O extracted from DJP soil is abiotically produced. Moreover, they measured very low and highly variable SP values at DJP, down to −45 ‰, which also fall outside the typical SP range. This variability in SP values and similar environmental conditions support the possibility of a shared, likely abiotic, mechanism of hybrid N2O production in Antarctic ice and at DJP.
5.4 Source of oxygen in in situ N2O
The δ18O signature of in situ N2O does not reflect the δ18O of , indicating that additional processes modify the oxygen isotopic composition during or prior to N2O formation; below, we therefore discuss possible mechanisms that could explain this decoupling, while noting that the dominant process remains uncertain.
Considering an N-nitrosation pathway, the observed δ18O(N2Oin situ) values might be explained by the combined processes of reduction and isotopic equilibration with H2O (Casciotti et al., 2007). Since N-nitrosation typically involves rather than , it is likely that is first reduced to . Several studies have shown that is prone to exchange its O atoms with the O atoms of water molecules in aqueous solution (Bunton et al., 1959). The water from Antarctic ice is strongly depleted in 18O, with δ18O(H2O) values of approximately −62 ‰ at Vostok (Lorius et al., 1985), −56 ‰ at EDC (Landais and Stenni, 2021), −42 ‰ at EDML (EPICA Community Members, 2010) and −42 ‰ as well at TG (Baggenstos et al., 2018). Thus, incorporation of O atoms from H2O into N2O through exchange with could explain the 18O depletion observed in in situ N2O compared to in the EDML, EDC, and Vostok ice cores (Fig. 5). However, the δ18O(N2Oin situ) values are not correlated to δ18O(H2O) values and the difference between δ18O(N2Oin situ) and δ18O() is significantly larger at EDML than at EDC and Vostok. This may indicate an incomplete exchange of O atoms between and H2O, with a larger fraction of exchanged O atoms at EDML than EDC and Vostok.
In contrast, δ18O(N2Oin situ) values at TG are unexpectedly higher than δ18O(), suggesting that oxygen exchange with water alone cannot explain the δ18O(N2Oin situ) values. In this case, the observed enrichment in 18O compared to might be due to the “branching effect” associated with reduction. This effect results from the incomplete incorporation of the oxygen pool from to N2O (Casciotti et al., 2007). Indeed, only two out of three O atoms from are transferred into , then one out of two from to N2O. Since 16O atoms are preferentially lost, and N2O become enriched in 18O. For the abiotic reduction of to N2O by Fe2+, the branching effect results in positive isotope effect of about +30 ‰ at 25 °C (Buchwald et al., 2016) which is likely even larger at very low temperatures. Although the same branching effect probably occurs at EDC, Vostok, and EDML, the fraction of exchanged O atoms might be smaller at TG, making the branching effect relatively more pronounced in the final δ18O(N2Oin situ) values.
The reason why the fraction of exchanged O atoms would vary among ice cores is not fully understood. It likely depends on the relative rates of oxygen isotope equilibration and the N-nitrosation reaction, both of which are temperature- and pH-dependent. Casciotti et al. (2007) showed that oxygen exchange is faster under acidic conditions, and Su et al. (2019) reported that low pH also accelerates abiotic nitrosation reactions. However, measurement constraints of pH remain limited. Although glacial Antarctic ice is generally acidic and Greenland ice is typically more alkaline, pH measurements are not available for the specific samples investigated here, making it difficult to interpret the differences in δ18O(N2Oin situ) among Antarctic sites in terms of pH effects. Moreover, even if pH were measured in the liquid phase (meltwater), it would be difficult to directly infer the pH of the solid ice matrix, as pH is formally defined only for liquid solutions. In addition, the relevant reactions likely occur at the surfaces of dust particles (where the reduction of to may take place) rather than in the bulk ice, and the chemical conditions in these micro-environments may differ from those of the surrounding ice.
To conclude, the combination of different ice chemical compositions and environmental conditions during the reaction could influence the fraction of O atoms exchanged between and H2O. While the relative contributions of oxygen exchange and branching effect to the δ18O(N2Oin situ) values remain unclear, overall, these processes may mask the transfer of the original δ18O() signature into in situ N2O.
5.5 Likelihood of an abiotic production of N2O
In situ N2O production in polar ice has often been attributed to microbial activity. Sowers (2001) reported two N2O maxima in the Vostok ice core at around 150 ka that coincided with elevated bacterial counts. Similarly, Rohde et al. (2008) found that in the GISP2 Greenland ice core, most of the samples affected by in situ production were associated with large cell counts.
However, several observations challenge the hypothesis of a microbial in situ production. First, the correlation between microbial counts and N2O maxima may not be causal, as the dust content could be a confounding variable: mineral particles are the main carriers of microbial cells to the ice sheet (Miteva, 2008; Miteva et al., 2016), so both microbial concentrations and in situ N2O are positively correlated with dust content in Antarctic ice cores. Second, because the low temperatures affect microbial metabolism and thus limit the reaction, one would expect the increase in ice temperature with depth to result in an increase in excess N2O as well. However, such an increase is not observed (Schilt et al., 2010b). Third, microbial activity generally requires the presence of liquid water. Although thin water channels called “liquid veins” can form during ice crystal growth due to concentration of acidic impurities at crystal interfaces (Barletta et al., 2012; Dani et al., 2012), the upper hundreds of meters where N2O is produced are too cold for such features to exist at sites like Vostok (Dani et al., 2012). Fourth, our SP and δ18O data indicate the absence of microbial N2O reduction in the ice (Sect. 5.1). While absence of N2O reduction alone does not rule out microbial N2O production, these two processes are generally linked in terrestrial and aquatic environments, where N2O produced by bacterial denitrification is typically at least partly reduced to N2. Fifth, no functional genes involved in bacterial and archaeal nitrification and denitrification were detected by PCR amplification in the NEEM Greenland ice core during the last glacial period (Miteva et al., 2016). Finally, Antarctic ice is an acidic environment (EPICA community members, 2004; Wolff et al., 1997), but the review by Spott et al. (2011) indicates that hybrid N2O production by biotic nitrosation generally occurs under neutral pH conditions, within a range of 6 to 7.5. Only one study reported production of hybrid N2O by ammonia-oxidizing archaea at a moderately low pH of 5.5 (Jung et al., 2019). In contrast, Su et al. (2019) showed that abiotic production of hybrid N2O is enhanced at pH≤5. Given the above constraints, an abiotic mechanism is the most plausible explanation for in situ N2O production.
An abiotic reaction triggered by low pH could also explain the differences in N2O production observed between Antarctic and Greenland ice. In Antarctic ice cores, N2O production occurs consistently throughout dust-rich depths and the amount of in situ N2O is roughly correlated with the amount of dust (Schilt et al., 2010b, a). In contrast, Greenland ice shows erratic N2O production with a finite number of outliers of very high N2O mixing ratio (Flückiger et al., 2004). In Greenland ice cores, it occurs in specific depth intervals with moderate dust concentrations, while sections with very high dust concentrations rarely show in situ production. This very dusty Greenland ice is alkaline due to the deposition of alkaline dust (calcium carbonates), which can neutralize acids in the ice (Biscaye et al., 1997; Mayewski et al., 1994; Wolff et al., 1997), a phenomenon not observed in Antarctic ice which is acidic (EPICA community members, 2004; Wolff et al., 1997). The generally higher pH of Greenland ice (Rasmussen et al., 2023) may inhibit in situ N2O production, potentially explaining the absence of widespread production in these cores. Isolated outliers with elevated N2O mixing ratios occur at depths where the ice is more acidic, for instance near volcanic horizons, as they are often found close to sulfate peaks.
Using bulk and position-specific isotope analyses, we have improved the understanding of N2O production in Antarctic ice while also raising new questions about its nature. Our results show that N2O produced in ice is hybrid N2O, with its central N atom (Nα) derived from and its terminal N atom (Nβ) from a different precursor. This hybrid N2O is likely produced abiotically through an N-nitrosation reaction, in which is first reduced to that then reacts with a nucleophilic compound that supplies Nβ in N2O. Fe2+ contained in dust particles may be the agent that reduces to . In addition to the precursor of the terminal N atom, this reducing agent could be a limiting factor in the reaction. Low pH may also be a necessary condition for this process. To better understand the pH control on N2O production, future work should investigate the isolated in situ N2O outliers in Greenland ice. The sources of the terminal N atom (Nβ) and the O atom in in situ N2O remain uncertain. One possibility is that Nβ originates from , potentially converted to NH2OH; measuring the isotopic composition of in Antarctic ice cores could help testing this hypothesis. For the O atom, it may be derived from two different oxygen pools – either from or from H2O through oxygen exchange with .
Our work revealed that the isotopic composition of in situ N2O is highly variable even within a single ice core. As a result, N2O records from ice cores cannot be accurately corrected for in situ production using a fixed isotopic signature in a mass balance approach. A more robust correction method would be to measure isotopic composition alongside total N2O in the same samples, as we did in this study. Since the in situ N2O signature reflects the variability of isotopes, this method would help estimate the isotopic signature of in situ N2O in affected samples. We could not apply this method to the existing N2O records because the meltwater at that time was not collected after N2O analysis, thus the isotopic composition cannot be measured in these specific samples.
This study also highlights the importance of accounting for in situ N2O production when using N2O isotopes for source attribution. In some ice cores, the isotopic signature of in situ N2O deviates drastically from the atmospheric signal. Even small amounts of in situ N2O can significantly impact the measured isotopic composition and thus alter paleoclimatic interpretations. For example, for atmospheric N2O at a mixing ratio of 200 ppb and in situ N2O at 5 ppb, with (N2Oin situ) as high as +70 ‰ as we observed in the Vostok ice core, this small in situ contribution would shift the (N2Ototal) by +1.5 ‰. Such a shift would result in a 16 % increase in estimated marine N2O emissions and a change in marine-to-terrestrial emission ratio from 0.39 to 0.45, which is close to the entire change observed over the last 21 kyr (Fischer et al., 2019). Therefore, identifying and excluding all samples affected by in situ production is essential to avoid misinterpretation.
Our results reveal a previously unidentified N2O production pathway likely involving an asymmetric reaction intermediate. This process may not be limited to ice but could also occur in other environments such as soils or aquatic systems, suggesting it may contribute to atmospheric N2O more broadly. This has important implications for the interpretation of SP values. The SP(N2Oin situ) values observed in this study show unusual variability and strong dependence on the isotopic composition of the precursors, compared to SP values reported in previous studies (Heil et al., 2014; Toyoda et al., 2017). These results may reflect the production of hybrid N2O via an asymmetric intermediate, where Nα and Nβ originate from distinct precursors and retain the isotopic signature of their respective sources. In this case, the SP values depend on the difference between the isotopic signatures of the two sources. This mechanism complicates the use of SP to trace N2O pathways, as they are not always characterized by a constant SP value. We therefore recommend further investigation of SP values in hybrid N2O under different environmental conditions and reaction mechanisms.
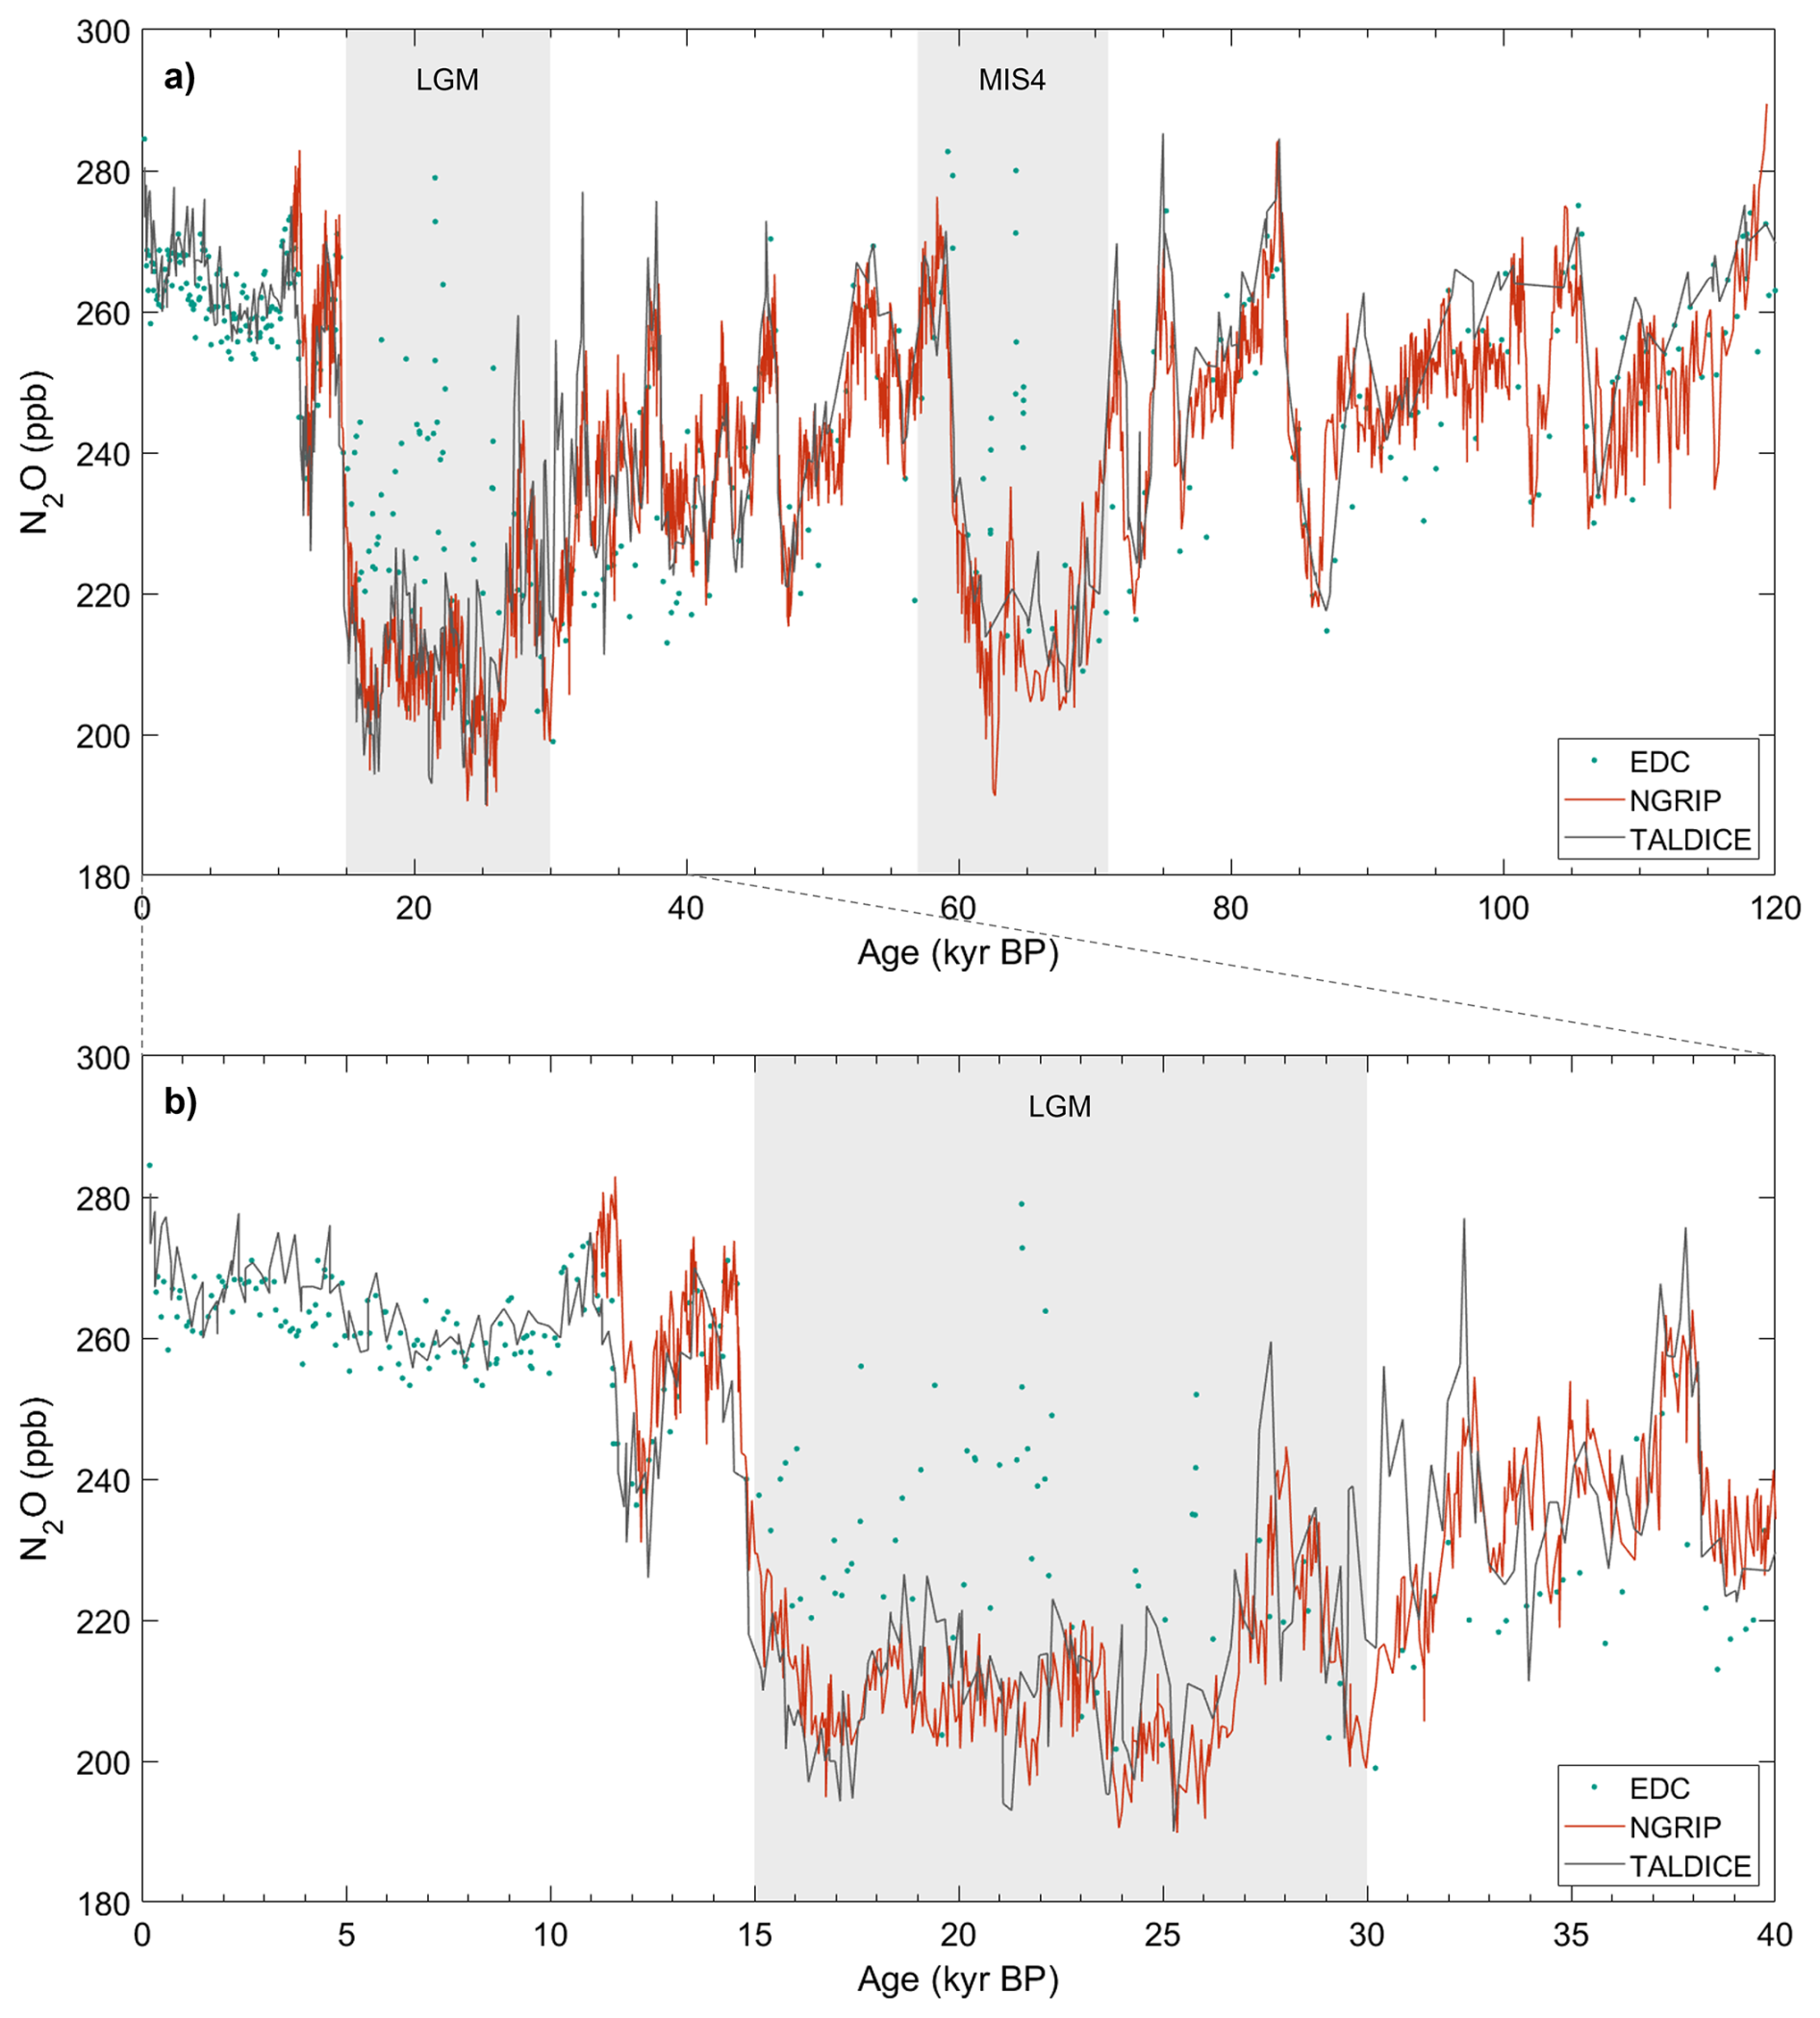
Figure A1N2O concentrations measured in the TALDICE (Schilt et al., 2010a), NGRIP (Flückiger et al., 2004; Schilt et al., 2010a, 2013), and EDC (Schilt et al., 2010b) ice cores over the last 120 kyr (a) and over the last 40 kyr (b). In situ N2O outliers have been removed from the NGRIP record. The EDC ice core is affected by in situ production of N2O during the LGM and MIS4.
Table B1Uncertainty ranges used in the Monte-Carlo calculation of the uncertainty of in situ N2O isotopic signature. Here we report the uncertainties due to differences in gas age scales of TALDICE and other ice cores, as the atmospheric values in the mass balance calculation are defined as the spline values matching the age of the measured sample.
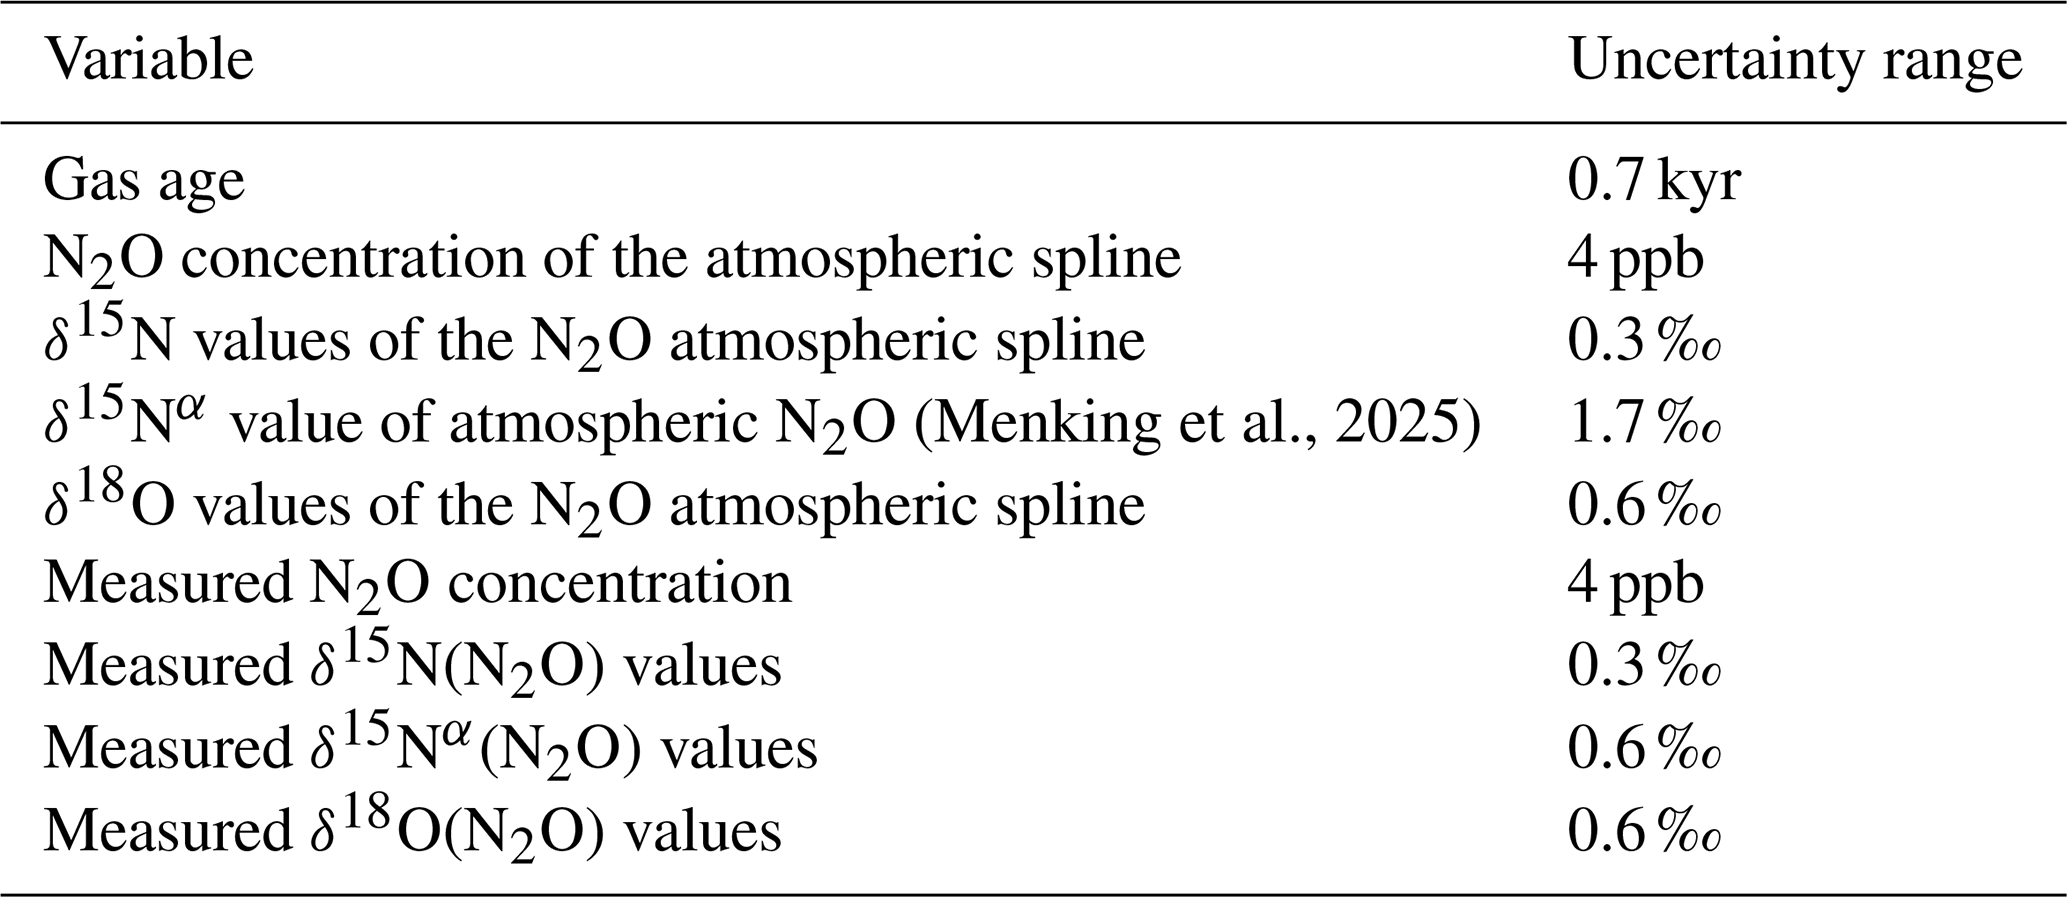
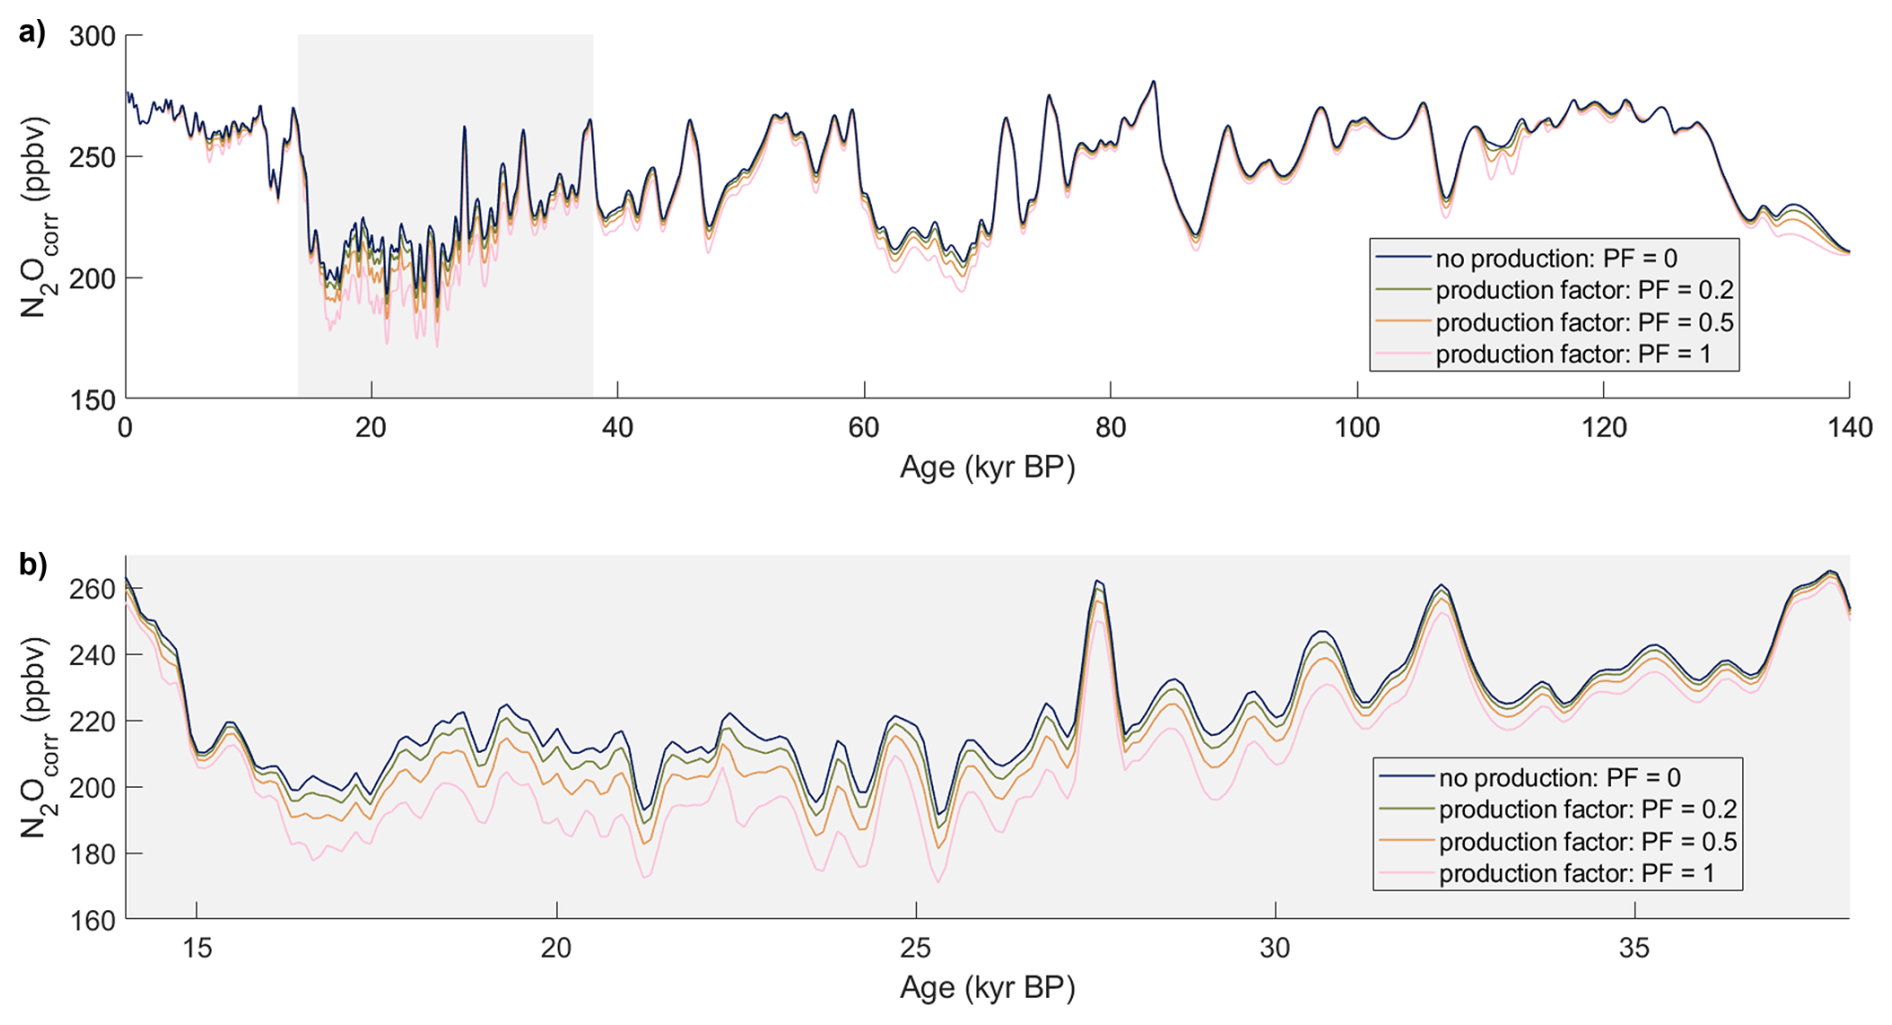
Figure C1Spline interpolation of TALDICE N2O concentrations, corrected for potential in situ production proportional to dust content. The different curves correspond to varying production factors, which link dust concentration to the amount of in situ N2O produced. (a) 0 to 140 kyr BP, (b) 14 to 38 kyr BP.
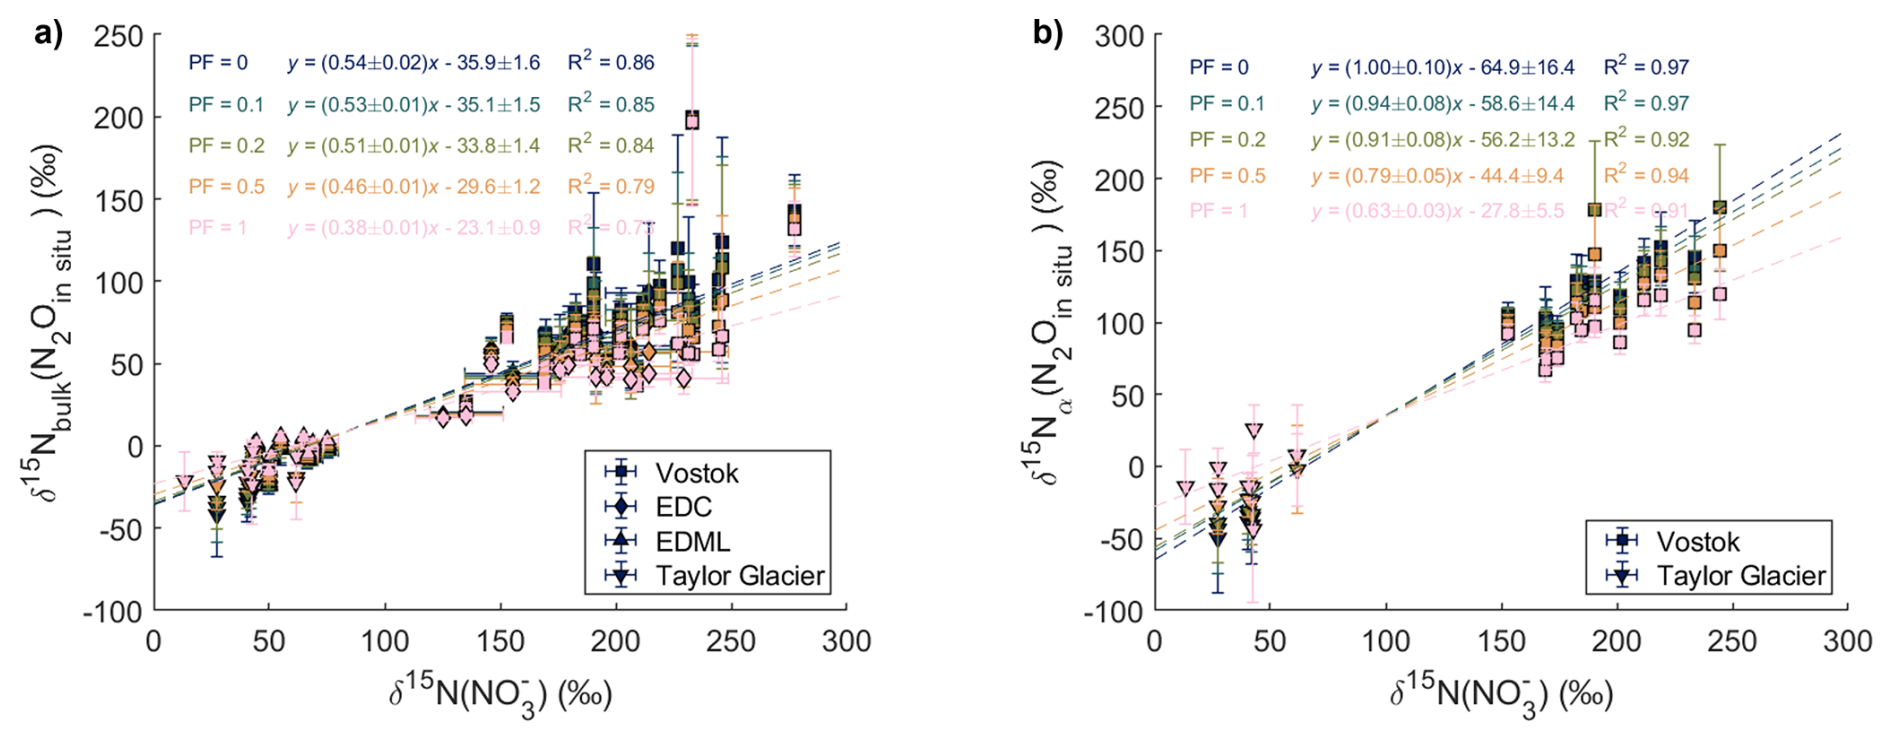
Figure C2Sensitivity study testing the impact of in situ N2O production in TALDICE proportional to Ca2+ concentrations, with production factors (PF) ranging from 0 to 1. PF=0 means no N2O production. (a) Relation between (N2Oin situ) and δ15N(). (b) Relation between (N2Oin situ) and δ15N().
Table D1 concentration and isotopic composition of the same samples with and without N2O extraction.
The data presented in this study are available on PANGAEA at: https://doi.org/10.1594/PANGAEA.986638 (Soussaintjean et al., 2026).
The concept of the study was developed by JSc, HF, and LS. The bulk isotope analyses of N2O were carried out by LS and BS. LS performed the position-specific isotope analyses of N2O under the guidance of JAM and EJB and the isotope analyses under the guidance of JSa. JSa, VL, and EJB provided ice core samples. LS and JSc analyzed the data. TR, JAM, and EJB provided input on SP measurements. HF managed and supervised the project. LS wrote the manuscript with contributions from all authors.
The contact author has declared that none of the authors has any competing interests.
Publisher's note: Copernicus Publications remains neutral with regard to jurisdictional claims made in the text, published maps, institutional affiliations, or any other geographical representation in this paper. The authors bear the ultimate responsibility for providing appropriate place names. Views expressed in the text are those of the authors and do not necessarily reflect the views of the publisher.
This publication was generated in the frame of the DEEPICE project. The project has received funding from the European Union's Horizon 2020 research and innovation programme under the Marie Skłodowska-Curie grant agreement no. 955750. This research has also been supported by the Schweizerischer Nationalfonds zur Förderung der Wissenschaftlichen Forschung (grant no. 200020_200328).
This paper was edited by Wei Wen Wong and reviewed by Dominika Lewicka-Szczebak and one anonymous referee.
Aarons, S. M., Aciego, S. M., Arendt, C. A., Blakowski, M. A., Steigmeyer, A., Gabrielli, P., Sierra-Hernández, M. R., Beaudon, E., Delmonte, B., Baccolo, G., May, N. W., and Pratt, K. A.: Dust composition changes from Taylor Glacier (East Antarctica) during the last glacial-interglacial transition: A multi-proxy approach, Quaternary Sci. Rev., 162, 60–71, https://doi.org/10.1016/j.quascirev.2017.03.011, 2017.
Anklin, M., Barnola, J.-M., Schwander, J., Stauffer, B., and Raynaud, D.: Processes affecting the CO2 concentrations measured in Greenland ice, Tellus B, 47, 461–470, https://doi.org/10.1034/j.1600-0889.47.issue4.6.x, 1995.
Baccolo, G., Delmonte, B., Niles, P. B., Cibin, G., Di Stefano, E., Hampai, D., Keller, L., Maggi, V., Marcelli, A., Michalski, J., Snead, C., and Frezzotti, M.: Jarosite formation in deep Antarctic ice provides a window into acidic, water-limited weathering on Mars, Nat. Commun., 12, 436, https://doi.org/10.1038/s41467-020-20705-z, 2021.
Baggenstos, D., Severinghaus, J. P., Mulvaney, R., McConnell, J. R., Sigl, M., Maselli, O., Petit, J., Grente, B., and Steig, E. J.: A Horizontal Ice Core From Taylor Glacier, Its Implications for Antarctic Climate History, and an Improved Taylor Dome Ice Core Time Scale, Paleoceanogr. Paleoclimatol., 33, 778–794, https://doi.org/10.1029/2017PA003297, 2018.
Baggs, E. M.: Soil microbial sources of nitrous oxide: recent advances in knowledge, emerging challenges and future direction, Curr. Opin. Env. Sust., 3, 321–327, https://doi.org/10.1016/j.cosust.2011.08.011, 2011.
Bange, H. W.: Gaseous Nitrogen Compounds (NO, N2O, N2, NH3) in the Ocean, in: Nitrogen in the Marine Environment, Elsevier, 51–94, https://doi.org/10.1016/B978-0-12-372522-6.00002-5, 2008.
Barletta, R. E., Priscu, J. C., Mader, H. M., Jones, W. L., and Roe, C. H.: Chemical analysis of ice vein microenvironments: II. Analysis of glacial samples from Greenland and Antarctica, J. Glaciol., 58, 1109–1118, https://doi.org/10.3189/2012JoG12J112, 2012.
Battle, M., Bender, M., Sowers, T., Tans, P. P., Butler, J. H., Elkins, J. W., Ellis, J. T., Conway, T., Zhang, N., Lang, P., and Clarket, A. D.: Atmospheric gas concentrations over the past century measured in air from firn at the South Pole, Nature, 383, 231–235, https://doi.org/10.1038/383231a0, 1996.
Bauska, T. K., Baggenstos, D., Brook, E. J., Mix, A. C., Marcott, S. A., Petrenko, V. V., Schaefer, H., Severinghaus, J. P., and Lee, J. E.: Carbon isotopes characterize rapid changes in atmospheric carbon dioxide during the last deglaciation, P. Natl. Acad. Sci. USA, 113, 3465–3470, https://doi.org/10.1073/pnas.1513868113, 2016.
Bigler, M.: Hochauflösende Spurenstoffmessungen an polaren Eisbohrkernen: Glazio-chemische und klimatische Prozessstudien, https://doi.org/10.57694/7211, 2004.
Biscaye, P. E., Grousset, F. E., Revel, M., Van Der Gaast, S., Zielinski, G. A., Vaars, A., and Kukla, G.: Asian provenance of glacial dust (stage 2) in the Greenland Ice Sheet Project 2 Ice Core, Summit, Greenland, J. Geophys. Res., 102, 26765–26781, https://doi.org/10.1029/97JC01249, 1997.
Blunier, T., Floch, G. L., Jacobi, H., and Quansah, E.: Isotopic view on nitrate loss in Antarctic surface snow, Geophys. Res. Lett., 32, 2005GL023011, https://doi.org/10.1029/2005GL023011, 2005.
Bohlke, J. K., Gwinn, C. J., and Coplen, T. B.: New reference materials for nitrogen-isotope-ratio measurements, Geostand. Geoanal. Res., 17, 159–164, https://doi.org/10.1111/j.1751-908X.1993.tb00131.x, 1993.
Bouchet, M., Landais, A., Grisart, A., Parrenin, F., Prié, F., Jacob, R., Fourré, E., Capron, E., Raynaud, D., Lipenkov, V. Y., Loutre, M.-F., Extier, T., Svensson, A. M., Martinerie, P., Leuenberger, M. C., Jiang, W., Ritterbusch, F., Lu, Z.-T., and Yang, G.-M.: The Antarctic ice core chronology (AICC2023), https://doi.org/10.1594/PANGAEA.961017, 2023.
Buchwald, C., Grabb, K., Hansel, C. M., and Wankel, S. D.: Constraining the role of iron in environmental nitrogen transformations: Dual stable isotope systematics of abiotic NO2-reduction by Fe(II) and its production of N2O, Geochim. Cosmochim. Ac., 186, 1–12, https://doi.org/10.1016/j.gca.2016.04.041, 2016.
Buiron, D., Chappellaz, J., Stenni, B., Frezzotti, M., Baumgartner, M., Capron, E., Landais, A., Lemieux-Dudon, B., Masson-Delmotte, V., Montagnat, M., Parrenin, F., and Schilt, A.: TALDICE-1 age scale of the Talos Dome deep ice core, East Antarctica, Clim. Past, 7, 1–16, https://doi.org/10.5194/cp-7-1-2011, 2011.
Bunton, C. A., Llewellyn, D. R., and Stedman, G.: Oxygen exchange between nitrous acid and water, J. Chem. Soc., 568, https://doi.org/10.1039/jr9590000568, 1959.
Casciotti, K. L., Böhlke, J. K., McIlvin, M. R., Mroczkowski, S. J., and Hannon, J. E.: Oxygen Isotopes in Nitrite: Analysis, Calibration, and Equilibration, Anal. Chem., 79, 2427–2436, https://doi.org/10.1021/ac061598h, 2007.
Chen, Z.-L., Song, W., Hu, C.-C., Liu, X.-J., Chen, G.-Y., Walters, W. W., Michalski, G., Liu, C.-Q., Fowler, D., and Liu, X.-Y.: Significant contributions of combustion-related sources to ammonia emissions, Nat. Commun., 13, 7710, https://doi.org/10.1038/s41467-022-35381-4, 2022.
Crotti, I., Landais, A., Stenni, B., Bazin, L., Parrenin, F., Frezzotti, M., Ritterbusch, F., Lu, Z.-T., Jiang, W., Yang, G.-M., Fourré, E., Orsi, A., Jacob, R., Minster, B., Prié, F., Dreossi, G., and Barbante, C.: An extension of the TALDICE ice core age scale reaching back to MIS 10.1, Quaternary Sci. Rev., 266, 107078, https://doi.org/10.1016/j.quascirev.2021.107078, 2021.
Dani, K. G. S., Mader, H. M., Wolff, E. W., and Wadham, J. L.: Modelling the liquid-water vein system within polar ice sheets as a potential microbial habitat, Earth Planet. Sc. Lett., 333–334, 238–249, https://doi.org/10.1016/j.epsl.2012.04.009, 2012.
Delmas, R. J.: A natural artefact in Greenland ice-core CO2 measurements, Tellus B, 45, 391–396, https://doi.org/10.1034/j.1600-0889.1993.t01-3-00006.x, 1993.
Delmonte, B., Basile-Doelsch, I., Petit, J.-R., Maggi, V., Revel-Rolland, M., Michard, A., Jagoutz, E., and Grousset, F.: Comparing the Epica and Vostok dust records during the last 220 000 years: stratigraphical correlation and provenance in glacial periods, Earth-Sci. Rev., 66, 63–87, https://doi.org/10.1016/j.earscirev.2003.10.004, 2004.
Delmonte, B., Baroni, C., Andersson, P. S., Schoberg, H., Hansson, M., Aciego, S., Petit, J., Albani, S., Mazzola, C., Maggi, V., and Frezzotti, M.: Aeolian dust in the Talos Dome ice core (East Antarctica, Pacific/Ross Sea sector): Victoria Land versus remote sources over the last two climate cycles, J. Quaternary Sci., 25, 1327–1337, https://doi.org/10.1002/jqs.1418, 2010.
EPICA community members: Eight glacial cycles from an Antarctic ice core, Nature, 429, 623–628, https://doi.org/10.1038/nature02599, 2004.
EPICA Community Members: Stable oxygen isotopes of ice core EDML, https://doi.org/10.1594/PANGAEA.754444, 2010.
Erbland, J., Vicars, W. C., Savarino, J., Morin, S., Frey, M. M., Frosini, D., Vince, E., and Martins, J. M. F.: Air–snow transfer of nitrate on the East Antarctic Plateau – Part 1: Isotopic evidence for a photolytically driven dynamic equilibrium in summer, Atmos. Chem. Phys., 13, 6403–6419, https://doi.org/10.5194/acp-13-6403-2013, 2013.
Fehling, C.: Mechanistic Insights from the 15N-Site Preference of Nitrous Oxide utilizing High Resolution Near-Infrared cw Cavity Ringdown Spectroscopy and Density Functional Theory Calculations, PhD Thesis, Kiel University, 130 pp., 2012.
Fischer, H., Fundel, F., Ruth, U., Twarloh, B., Wegner, A., Udisti, R., Becagli, S., Castellano, E., Morganti, A., Severi, M., Wolff, E., Littot, G., Röthlisberger, R., Mulvaney, R., Hutterli, M. A., Kaufmann, P., Federer, U., Lambert, F., Bigler, M., Hansson, M., Jonsell, U., De Angelis, M., Boutron, C., Siggaard-Andersen, M.-L., Steffensen, J. P., Barbante, C., Gaspari, V., Gabrielli, P., and Wagenbach, D.: Reconstruction of millennial changes in dust emission, transport and regional sea ice coverage using the deep EPICA ice cores from the Atlantic and Indian Ocean sector of Antarctica, Earth Planet. Sc. Lett., 260, 340–354, https://doi.org/10.1016/j.epsl.2007.06.014, 2007.
Fischer, H., Schmitt, J., Bock, M., Seth, B., Joos, F., Spahni, R., Lienert, S., Battaglia, G., Stocker, B. D., Schilt, A., and Brook, E. J.: N2O changes from the Last Glacial Maximum to the preindustrial – Part 1: Quantitative reconstruction of terrestrial and marine emissions using N2O stable isotopes in ice cores, Biogeosciences, 16, 3997–4021, https://doi.org/10.5194/bg-16-3997-2019, 2019.
Flückiger, J., Monnin, E., Stauffer, B., Schwander, J., Stocker, T. F., Chappellaz, J., Raynaud, D., and Barnola, J.-M.: High-resolution Holocene N2O ice core record and its relationship with CH4 and CO2: High-resolution Holocene N2O ice core record, Global Biogeochem. Cy., 16, 10-1–10-8, https://doi.org/10.1029/2001GB001417, 2002.
Flückiger, J., Blunier, T., Stauffer, B., Chappellaz, J., Spahni, R., Kawamura, K., Schwander, J., Stocker, T. F., and Dahl-Jensen, D.: N2O and CH4 variations during the last glacial epoch: Insight into global processes., Global Biogeochem. Cy., 18, https://doi.org/10.1029/2003GB002122, 2004.
Frame, C. H. and Casciotti, K. L.: Biogeochemical controls and isotopic signatures of nitrous oxide production by a marine ammonia-oxidizing bacterium, Biogeosciences, 7, 2695–2709, https://doi.org/10.5194/bg-7-2695-2010, 2010.
Frame, C. H., Lau, E., Nolan, E. J., Goepfert, T. J., and Lehmann, M. F.: Acidification Enhances Hybrid N2O Production Associated with Aquatic Ammonia-Oxidizing Microorganisms, Front. Microbiol., 7, https://doi.org/10.3389/fmicb.2016.02104, 2017.
Frey, M. M., Savarino, J., Morin, S., Erbland, J., and Martins, J. M. F.: Photolysis imprint in the nitrate stable isotope signal in snow and atmosphere of East Antarctica and implications for reactive nitrogen cycling, Atmos. Chem. Phys., 9, 8681–8696, https://doi.org/10.5194/acp-9-8681-2009, 2009.
Fuhrer, K., Wolff, E., and Johnsen, S. J.: Timescales for dust variability in the Greenland Ice Core Project (GRIP) ice core in the last 100 000 years, J. Geophys. Res., 104, 31043–31052, https://doi.org/10.1029/1999JD900929, 1999.
Gruber, N. and Galloway, J. N.: An Earth-system perspective of the global nitrogen cycle, Nature, 451, 293–296, https://doi.org/10.1038/nature06592, 2008.
Heil, J., Wolf, B., Brüggemann, N., Emmenegger, L., Tuzson, B., Vereecken, H., and Mohn, J.: Site-specific 15N isotopic signatures of abiotically produced N2O, Geochim. Cosmochim. Ac., 139, 72–82, https://doi.org/10.1016/j.gca.2014.04.037, 2014.
Heil, J., Liu, S., Vereecken, H., and Brüggemann, N.: Abiotic nitrous oxide production from hydroxylamine in soils and their dependence on soil properties, Soil Biol. Biochem., 84, 107–115, https://doi.org/10.1016/j.soilbio.2015.02.022, 2015.
Herron, M. M. and Langway, C. C.: Firn Densification: An Empirical Model, J. Glaciol., 25, 373–385, https://doi.org/10.3189/S0022143000015239, 1980.
IPCC: Climate Change 2021 – The Physical Science Basis: Working Group I Contribution to the Sixth Assessment Report of the Intergovernmental Panel on Climate Change, 1st edn., Cambridge University Press, https://doi.org/10.1017/9781009157896, 2023.
Jones, L. C., Peters, B., Lezama Pacheco, J. S., Casciotti, K. L., and Fendorf, S.: Stable Isotopes and Iron Oxide Mineral Products as Markers of Chemodenitrification., Environ. Sci. Technol., 49, 3444–3452, https://doi.org/10.1021/es504862x, 2015.
Jung, M.-Y., Gwak, J.-H., Rohe, L., Giesemann, A., Kim, J.-G., Well, R., Madsen, E. L., Herbold, C. W., Wagner, M., and Rhee, S.-K.: Indications for enzymatic denitrification to N2O at low pH in an ammonia-oxidizing archaeon, ISME J., 13, 2633–2638, https://doi.org/10.1038/s41396-019-0460-6, 2019.
Kaiser, J., Hastings, M. G., Houlton, B. Z., Röckmann, T., and Sigman, D. M.: Triple Oxygen Isotope Analysis of Nitrate Using the Denitrifier Method and Thermal Decomposition of N2O, Anal. Chem., 79, 599–607, https://doi.org/10.1021/ac061022s, 2007.
Kaufmann, P., Fundel, F., Fischer, H., Bigler, M., Ruth, U., Udisti, R., Hansson, M., de Angelis, M., Barbante, C., Wolff, E. W., Hutterli, M., and Wagenbach, D.: Ammonium and non-sea salt sulfate in the EPICA ice cores as indicator of biological activity in the Southern Ocean, Quaternary Sci. Rev., 29, 313–323, https://doi.org/10.1016/j.quascirev.2009.11.009, 2010.
Kindler, P., Guillevic, M., Baumgartner, M., Schwander, J., Landais, A., and Leuenberger, M.: Temperature reconstruction from 10 to 120 kyr b2k from the NGRIP ice core, Clim. Past, 10, 887–902, https://doi.org/10.5194/cp-10-887-2014, 2014.
Lambert, F., Bigler, M., Steffensen, J. P., Hutterli, M., and Fischer, H.: Centennial mineral dust variability in high-resolution ice core data from Dome C, Antarctica, Clim. Past, 8, 609–623, https://doi.org/10.5194/cp-8-609-2012, 2012.
Lamothe, A., Savarino, J., Ginot, P., Soussaintjean, L., Gautier, E., Akers, P. D., Caillon, N., and Erbland, J.: An extraction method for nitrogen isotope measurement of ammonium in a low-concentration environment, Atmos. Meas. Tech., 16, 4015–4030, https://doi.org/10.5194/amt-16-4015-2023, 2023.
Lan, X., Thoning, K., Dlugokencky, E., and NOAA Global Monitoring Laboratory: Trends in globally-averaged CH4, N2O, and SF6 determined from NOAA Global Monitoring Laboratory measurements (Version 2025-04), https://doi.org/10.15138/P8XG-AA10, 2025.
Landais, A. and Stenni, B.: Water stable isotopes (dD, d18O) from EPICA Dome C ice core (Antarctica) (0–800 ka), https://doi.org/10.1594/PANGAEA.934094, 2021.
Lee, J. E., Edwards, J. S., Schmitt, J., Fischer, H., Bock, M., and Brook, E. J.: Excess methane in Greenland ice cores associated with high dust concentrations, Geochim. Cosmochim. Ac., 270, 409–430, https://doi.org/10.1016/j.gca.2019.11.020, 2020.
Lewicka-Szczebak, D., Well, R., Bol, R., Gregory, A. S., Matthews, G. P., Misselbrook, T., Whalley, W. R., and Cardenas, L. M.: Isotope fractionation factors controlling isotopocule signatures of soil-emitted N2O produced by denitrification processes of various rates, Rapid Commun. Mass Sp., 29, 269–282, https://doi.org/10.1002/rcm.7102, 2015.
Lorius, C., Jouzel, J., Ritz, C., Merlivat, L., Barkov, N. I., Korotkevitch, Y. S., and Kotlyakov, V.: Delta 18O record versus age for 150 ka in ice core Vostok, https://doi.org/10.1594/PANGAEA.860950, 1985.
Loulergue, L., Schilt, A., Spahni, R., Masson-Delmotte, V., Blunier, T., Lemieux, B., Barnola, J.-M., Raynaud, D., Stocker, T. F., and Chappellaz, J.: Orbital and millennial-scale features of atmospheric CH4 over the past 800 000 years, Nature, 453, 383–386, https://doi.org/10.1038/nature06950, 2008.
Lüthi, D., Le Floch, M., Bereiter, B., Blunier, T., Barnola, J.-M., Siegenthaler, U., Raynaud, D., Jouzel, J., Fischer, H., Kawamura, K., and Stocker, T. F.: High-resolution carbon dioxide concentration record 650 000–800 000 years before present, Nature, 453, 379–382, https://doi.org/10.1038/nature06949, 2008.
Marino, F., Castellano, E., Nava, S., Chiari, M., Ruth, U., Wegner, A., Lucarelli, F., Udisti, R., Delmonte, B., and Maggi, V.: Coherent composition of glacial dust on opposite sides of the East Antarctic Plateau inferred from the deep EPICA ice cores, Geophys. Res. Lett., 36, 2009GL040732, https://doi.org/10.1029/2009GL040732, 2009.
Markle, B. R. and Steig, E. J.: Improving temperature reconstructions from ice-core water-isotope records, Clim. Past, 18, 1321–1368, https://doi.org/10.5194/cp-18-1321-2022, 2022.
Matsuoka, K., Skoglund, A., and Roth, G.: Quantarctica, Norwegian Polar Institute [data set], https://doi.org/10.21334/npolar.2018.8516e961, 2018.
Mayewski, P. A., Meeker, L. D., Whitlow, S., Twickler, M. S., Morrison, M. C., Bloomfield, P., Bond, G. C., Alley, R. B., Gow, A. J., Meese, D. A., Grootes, P. M., Ram, M., Taylor, K. C., and Wumkes, W.: Changes in Atmospheric Circulation and Ocean Ice Cover over the North Atlantic During the Last 41 000 Years, Science, 263, 1747–1751, https://doi.org/10.1126/science.263.5154.1747, 1994.
Menking, J. A., Brook, E. J., Schilt, A., Shackleton, S., Dyonisius, M., Severinghaus, J. P., and Petrenko, V. V.: Millennial-Scale Changes in Terrestrial and Marine Nitrous Oxide Emissions at the Onset and Termination of Marine Isotope Stage 4, Geophys. Res. Lett., 47, https://doi.org/10.1029/2020GL089110, 2020.
Menking, J. A., Lee, J. E., Brook, E. J., Schmitt, J., Soussaintjean, L., Fischer, H., Kaiser, J., and Rice, A.: Glacial-Interglacial and Millennial-Scale Changes in Nitrous Oxide Emissions Pathways and Source Regions, Global Biogeochem. Cy., 39, e2024GB008287, https://doi.org/10.1029/2024GB008287, 2025.
Meusinger, C., Berhanu, T. A., Erbland, J., Savarino, J., and Johnson, M. S.: Laboratory study of nitrate photolysis in Antarctic snow. I. Observed quantum yield, domain of photolysis, and secondary chemistry, J. Chem. Phys., 140, 244305, https://doi.org/10.1063/1.4882898, 2014.
Miteva, V.: Bacteria in Snow and Glacier Ice, in: Psychrophiles: from Biodiversity to Biotechnology, Springer Berlin Heidelberg, Berlin, Heidelberg, 31–50, https://doi.org/10.1007/978-3-540-74335-4_3, 2008.
Miteva, V., Sowers, T., and Brenchley, J.: Production of N2O by Ammonia Oxidizing Bacteria at Subfreezing Temperatures as a Model for Assessing the N2O Anomalies in the Vostok Ice Core, Geomicrobiol. J., 24, 451–459, https://doi.org/10.1080/01490450701437693, 2007.
Miteva, V., Sowers, T., Schüpbach, S., Fischer, H., and Brenchley, J.: Geochemical and Microbiological Studies of Nitrous Oxide Variations within the New NEEM Greenland Ice Core during the Last Glacial Period, Geomicrobiol. J., 33, 647–660, https://doi.org/10.1080/01490451.2015.1074321, 2016.
Moon, T. A., Fisher, M., Stafford, T., and Thurber, A.: QGreenland (v3), Zenodo [data set], https://doi.org/10.5281/zenodo.12823307, 2023.
Morin, S., Savarino, J., Frey, M. M., Domine, F., Jacobi, H.-W., Kaleschke, L., and Martins, J. M. F.: Comprehensive isotopic composition of atmospheric nitrate in the Atlantic Ocean boundary layer from 65° S to 79° N, J. Geophys. Res., 114, D05303, https://doi.org/10.1029/2008JD010696, 2009.
Mühl, M., Schmitt, J., Seth, B., Lee, J. E., Edwards, J. S., Brook, E. J., Blunier, T., and Fischer, H.: Methane, ethane, and propane production in Greenland ice core samples and a first isotopic characterization of excess methane, Clim. Past, 19, 999–1025, https://doi.org/10.5194/cp-19-999-2023, 2023.
Perron, J. R., Stedman, G., and Uysal, N.: Kinetic and product study of the reaction between nitrous acid and hydrazine, J. Chem. Soc. Dalton, 2058, https://doi.org/10.1039/dt9760002058, 1976.
Prather, M. J., Hsu, J., DeLuca, N. M., Jackman, C. H., Oman, L. D., Douglass, A. R., Fleming, E. L., Strahan, S. E., Steenrod, S. D., Søvde, O. A., Isaksen, I. S. A., Froidevaux, L., and Funke, B.: Measuring and modeling the lifetime of nitrous oxide including its variability, J. Geophys. Res.-Atmos., 120, 5693–5705, https://doi.org/10.1002/2015JD023267, 2015.
Priscu, J. C., Christner, B. C., Dore, J. E., Popp, B. N., Casciotti, K. L., and Lyons, W. B.: Supersaturated N2O in a perennially ice-covered Antarctic lake: Molecular and stable isotopic evidence for a biogeochemical relict, Limnol. Oceanogr., 53, 2439–2450, https://doi.org/10.4319/lo.2008.53.6.2439, 2008.
Prokopiou, M., Sapart, C. J., Rosen, J., Sperlich, P., Blunier, T., Brook, E., Van De Wal, R. S. W., and Röckmann, T.: Changes in the Isotopic Signature of Atmospheric Nitrous Oxide and Its Global Average Source During the Last Three Millennia, J. Geophys. Res.-Atmos., 123, https://doi.org/10.1029/2018JD029008, 2018.
Rasmussen, S. O., Dahl-Jensen, D., Fischer, H., Fuhrer, K., Hansen, S. B., Hansson, M., Hvidberg, C. S., Jonsell, U., Kipfstuhl, S., Ruth, U., Schwander, J., Siggaard-Andersen, M.-L., Sinnl, G., Steffensen, J. P., Svensson, A. M., and Vinther, B. M.: Ice-core data used for the construction of the Greenland Ice-Core Chronology 2005 and 2021 (GICC05 and GICC21), Earth Syst. Sci. Data, 15, 3351–3364, https://doi.org/10.5194/essd-15-3351-2023, 2023.
Ravishankara, A. R., Daniel, J. S., and Portmann, R. W.: Nitrous Oxide (N2O): The Dominant Ozone-Depleting Substance Emitted in the 21st Century, Science, 326, 123–125, https://doi.org/10.1126/science.1176985, 2009.
Ritz, C., Lliboutry, L., and Rado, C.: Analysis of a 870 m deep temperature profile at Dome C, Ann. Glaciol., 3, 284–289, 1982.
Rohde, R. A., Price, P. B., Bay, R. C., and Bramall, N. E.: In situ microbial metabolism as a cause of gas anomalies in ice, P. Natl. Acad. Sci. USA, 105, 8667–8672, https://doi.org/10.1073/pnas.0803763105, 2008.
Röthlisberger, R., Hutterli, M. A., Sommer, S., Wolff, E. W., and Mulvaney, R.: Factors controlling nitrate in ice cores: Evidence from the Dome C deep ice core, J. Geophys. Res., 105, 20565–20572, https://doi.org/10.1029/2000JD900264, 2000a.
Röthlisberger, R., Bigler, M., Hutterli, M., Sommer, S., Stauffer, B., Junghans, H. G., and Wagenbach, D.: Technique for Continuous High-Resolution Analysis of Trace Substances in Firn and Ice Cores, Environ. Sci. Technol., 34, 338–342, https://doi.org/10.1021/es9907055, 2000b.
Rubasinghege, G., Spak, S. N., Stanier, C. O., Carmichael, G. R., and Grassian, V. H.: Abiotic Mechanism for the Formation of Atmospheric Nitrous Oxide from Ammonium Nitrate, Environ. Sci. Technol., 45, 2691–2697, https://doi.org/10.1021/es103295v, 2011.
Rubino, M., Etheridge, D. M., Thornton, D. P., Howden, R., Allison, C. E., Francey, R. J., Langenfelds, R. L., Steele, L. P., Trudinger, C. M., Spencer, D. A., Curran, M. A. J., van Ommen, T. D., and Smith, A. M.: Revised records of atmospheric trace gases CO2, CH4, N2O, and δ13C−CO2 over the last 2000 years from Law Dome, Antarctica, Earth Syst. Sci. Data, 11, 473–492, https://doi.org/10.5194/essd-11-473-2019, 2019.
Ruth, U., Wagenbach, D., Bigler, M., Steffensen, J. P., Röthlisberger, R., and Miller, H.: High-resolution microparticle profiles at NorthGRIP, Greenland: case studies of the calcium–dust relationship, Ann. Glaciol., 35, 237–242, https://doi.org/10.3189/172756402781817347, 2002.
Ruth, U., Wagenbach, D., Steffensen, J. P., and Bigler, M.: Continuous record of microparticle concentration and size distribution in the central Greenland NGRIP ice core during the last glacial period, J. Geophys. Res., 108, 2002JD002376, https://doi.org/10.1029/2002JD002376, 2003.
Salamatin, A. N., Lipenkov, V. Y., and Blinov, K. V.: Vostok (Antarctica) climate record time-scale deduced from the analysis of a borehole-temperature profile, Ann. Glaciol., 20, 207–214, 1994.
Samarkin, V. A., Madigan, M. T., Bowles, M. W., Casciotti, K. L., Priscu, J. C., McKay, C. P., and Joye, S. B.: Abiotic nitrous oxide emission from the hypersaline Don Juan Pond in Antarctica, Nat. Geosci., 3, 341–344, https://doi.org/10.1038/ngeo847, 2010.
Schilt, A., Baumgartner, M., Schwander, J., Buiron, D., Capron, E., Chappellaz, J., Loulergue, L., Schüpbach, S., Spahni, R., Fischer, H., and Stocker, T. F.: Atmospheric nitrous oxide during the last 140 000 years, Earth Planet. Sc. Lett., 300, 33–43, https://doi.org/10.1016/j.epsl.2010.09.027, 2010a.
Schilt, A., Baumgartner, M., Blunier, T., Schwander, J., Spahni, R., Fischer, H., and Stocker, T. F.: Glacial–interglacial and millennial-scale variations in the atmospheric nitrous oxide concentration during the last 800 000 years, Quaternary Sci. Rev., 29, 182–192, https://doi.org/10.1016/j.quascirev.2009.03.011, 2010b.
Schilt, A., Baumgartner, M., Eicher, O., Chappellaz, J., Schwander, J., Fischer, H., and Stocker, T. F.: The response of atmospheric nitrous oxide to climate variations during the last glacial period, Geophys. Res. Lett., 40, 1888–1893, https://doi.org/10.1002/grl.50380, 2013.
Schilt, A., Brook, E. J., Bauska, T. K., Baggenstos, D., Fischer, H., Joos, F., Petrenko, V. V., Schaefer, H., Schmitt, J., Severinghaus, J. P., Spahni, R., and Stocker, T. F.: Isotopic constraints on marine and terrestrial N2O emissions during the last deglaciation, Nature, 516, 234–237, https://doi.org/10.1038/nature13971, 2014.
Schmitt, J., Seth, B., Bock, M., and Fischer, H.: Online technique for isotope and mixing ratios of CH4, N2O, Xe and mixing ratios of organic trace gases on a single ice core sample, Atmos. Meas. Tech., 7, 2645–2665, https://doi.org/10.5194/amt-7-2645-2014, 2014.
Schüpbach, S., Federer, U., Kaufmann, P. R., Albani, S., Barbante, C., Stocker, T. F., and Fischer, H.: Calcium and sodium concentrations of the Talos Dome ice core, Antarctica, https://doi.org/10.1594/PANGAEA.833044, 2014.
Soussaintjean, L., Schmitt, J., Savarino, J., Menking, J. A., Brook, E. J., Seth, B., Lipenkov, V. Y., Röckmann, T., and Fischer, H.: Bulk and position-specific isotopic composition of N2O (total and in situ) and nitrate from the EDC, EDML, Vostok, TALDICE, Taylor Glacier, and NGRIP ice cores, PANGAEA [data set], https://doi.org/10.1594/PANGAEA.986638, 2026.
Sowers, T.: N2O record spanning the penultimate deglaciation from the Vostok ice core, J. Geophys. Res., 106, 31903–31914, https://doi.org/10.1029/2000JD900707, 2001.
Spahni, R., Chappellaz, J., Stocker, T. F., Loulergue, L., Hausammann, G., Kawamura, K., Flückiger, J., Schwander, J., Raynaud, D., Masson-Delmotte, V., and Jouzel, J.: Atmospheric Methane and Nitrous Oxide of the Late Pleistocene from Antarctic Ice Cores, Science, 310, 1317–1321, https://doi.org/10.1126/science.1120132, 2005.
Spolaor, A., Vallelonga, P., Gabrieli, J., Cozzi, G., Boutron, C., and Barbante, C.: Determination of Fe2+ and Fe3+ species by FIA-CRC-ICP-MS in Antarctic ice samples, J. Anal. Atom. Spectrom., 27, 310–317, https://doi.org/10.1039/C1JA10276A, 2012.
Spolaor, A., Vallelonga, P., Cozzi, G., Gabrieli, J., Varin, C., Kehrwald, N., Zennaro, P., Boutron, C., and Barbante, C.: Iron speciation in aerosol dust influences iron bioavailability over glacial-interglacial timescales, Geophys. Res. Lett., 40, 1618–1623, https://doi.org/10.1002/grl.50296, 2013.
Spott, O., Russow, R., and Stange, C. F.: Formation of hybrid N2O and hybrid N2 due to codenitrification: First review of a barely considered process of microbially mediated N-nitrosation, Soil Biol. Biochem., 43, 1995–2011, https://doi.org/10.1016/j.soilbio.2011.06.014, 2011.
Stauffer, B., Flückiger, J., Monnin, E., Nakazawa, T., and Aoki, S.: Discussion of the reliabilityof CO2, CH4 and N2O records from polar ice cores, Mem. Natl. Inst. Polar Res., Memoirs of National Institute of Polar Research, Special Issue 57, 139–152, 2003.
Stieglmeier, M., Mooshammer, M., Kitzler, B., Wanek, W., Zechmeister-Boltenstern, S., Richter, A., and Schleper, C.: Aerobic nitrous oxide production through N-nitrosating hybrid formation in ammonia-oxidizing archaea, ISME J., 8, 1135–1146, https://doi.org/10.1038/ismej.2013.220, 2014.
Su, Q., Domingo-Félez, C., Jensen, M. M., and Smets, B. F.: Abiotic Nitrous Oxide (N2O) Production Is Strongly pH Dependent, but Contributes Little to Overall N2O Emissions in Biological Nitrogen Removal Systems, Environ. Sci. Technol., 53, 3508–3516, https://doi.org/10.1021/acs.est.8b06193, 2019.
Sutka, R. L., Ostrom, N. E., Ostrom, P. H., Gandhi, H., and Breznak, J. A.: Nitrogen isotopomer site preference of N2O produced by Nitrosomonas europaea and Methylococcus capsulatus Bath, Rapid Commun. Mass Sp., 17, 738–745, https://doi.org/10.1002/rcm.968, 2003.
Sutka, R. L., Ostrom, N. E., Ostrom, P. H., Breznak, J. A., Gandhi, H., Pitt, A. J., and Li, F.: Distinguishing Nitrous Oxide Production from Nitrification and Denitrification on the Basis of Isotopomer Abundances, Appl. Environ. Microb., 72, 638–644, https://doi.org/10.1128/AEM.72.1.638-644.2006, 2006.
Tarasov, L. and Peltier, W. R.: Greenland glacial history, borehole constraints, and Eemian extent, J. Geophys. Res., 108, 2001JB001731, https://doi.org/10.1029/2001JB001731, 2003.
Terada, A., Sugawara, S., Hojo, K., Takeuchi, Y., Riya, S., Harper, W. F., Yamamoto, T., Kuroiwa, M., Isobe, K., Katsuyama, C., Suwa, Y., Koba, K., and Hosomi, M.: Hybrid Nitrous Oxide Production from a Partial Nitrifying Bioreactor: Hydroxylamine Interactions with Nitrite, Environ. Sci. Technol., 51, 2748–2756, https://doi.org/10.1021/acs.est.6b05521, 2017.
Tian, H., Xu, R., Canadell, J. G., Thompson, R. L., Winiwarter, W., Suntharalingam, P., Davidson, E. A., Ciais, P., Jackson, R. B., Janssens-Maenhout, G., Prather, M. J., Regnier, P., Pan, N., Pan, S., Peters, G. P., Shi, H., Tubiello, F. N., Zaehle, S., Zhou, F., Arneth, A., Battaglia, G., Berthet, S., Bopp, L., Bouwman, A. F., Buitenhuis, E. T., Chang, J., Chipperfield, M. P., Dangal, S. R. S., Dlugokencky, E., Elkins, J. W., Eyre, B. D., Fu, B., Hall, B., Ito, A., Joos, F., Krummel, P. B., Landolfi, A., Laruelle, G. G., Lauerwald, R., Li, W., Lienert, S., Maavara, T., MacLeod, M., Millet, D. B., Olin, S., Patra, P. K., Prinn, R. G., Raymond, P. A., Ruiz, D. J., van der Werf, G. R., Vuichard, N., Wang, J., Weiss, R. F., Wells, K. C., Wilson, C., Yang, J., and Yao, Y.: A comprehensive quantification of global nitrous oxide sources and sinks, Nature, 586, 248–256, https://doi.org/10.1038/s41586-020-2780-0, 2020.
Tischer, J., Zopfi, J., Frey, C., Magyar, P. M., Brand, A., Oswald, K., Jegge, C., Frame, C. H., Miracle, M. R., Sòria-Perpinyà, X., Vicente, E., and Lehmann, M. F.: Isotopic signatures of biotic and abiotic N2O production and consumption in the water column of meromictic, ferruginous Lake La Cruz (Spain), Limnol. Oceanogr., 67, 1760–1775, https://doi.org/10.1002/lno.12165, 2022.
Toyoda, S., Yoshida, N., Miwa, T., Matsui, Y., Yamagishi, H., Tsunogai, U., Nojiri, Y., and Tsurushima, N.: Production mechanism and global budget of N2O inferred from its isotopomers in the western North Pacific, Geophys. Res. Lett., 29, https://doi.org/10.1029/2001GL014311, 2002.
Toyoda, S., Mutobe, H., Yamagishi, H., Yoshida, N., and Tanji, Y.: Fractionation of N2O isotopomers during production by denitrifier, Soil Biol. Biochem., 37, 1535–1545, https://doi.org/10.1016/j.soilbio.2005.01.009, 2005.
Toyoda, S., Yoshida, N., and Koba, K.: Isotopocule analysis of biologically produced nitrous oxide in various environments, Mass Spectrom. Rev., 36, 135–160, https://doi.org/10.1002/mas.21459, 2017.
Traversi, R., Barbante, C., Gaspari, V., Fattori, I., Largiuni, O., Magaldi, L., and Udisti, R.: Aluminium and iron record for the last 28 kyr derived from the Antarctic EDC96 ice core using new CFA methods, Ann. Glaciol., 39, 300–306, https://doi.org/10.3189/172756404781814438, 2004.
Warneck, P. and Wurzinger, C.: Product quantum yields for the 305 nm photodecomposition of nitrate in aqueous solution, J. Phys. Chem., 92, 6278–6283, https://doi.org/10.1021/j100333a022, 1988.
Wilhelms, F., Sheldon, S. G., Hamann, I., and Kipfstuhl, S.: Implications for and findings from deep ice core drillings an example: The ultimate tensile strength of ice at high strain rates, Physics and Chemistry of Ice (The proceedings of the International Conference on the Physics and Chemistry of Ice held at Bremerhaven, Germany on 23–28 July 2006) Roy. Soc. Ch., 311, 635–639, 2007.
Wolff, E. W., Moore, J. C., Clausen, H. B., and Hammer, C. U.: Climatic implications of background acidity and other chemistry derived from electrical studies of the Greenland Ice Core Project ice core, J. Geophys. Res., 102, 26325–26332, https://doi.org/10.1029/96JC02223, 1997.
Wrage-Mönnig, N., Horn, M. A., Well, R., Müller, C., Velthof, G., and Oenema, O.: The role of nitrifier denitrification in the production of nitrous oxide revisited, Soil Biol. Biochem., 123, A3–A16, https://doi.org/10.1016/j.soilbio.2018.03.020, 2018.
York, D., Evensen, N. M., Martýìnez, M. L., and De Basabe Delgado, J.: Unified equations for the slope, intercept, and standard errors of the best straight line, Am. J. Phys., 72, 367–375, https://doi.org/10.1119/1.1632486, 2004.
Yu, L., Harris, E., Lewicka-Szczebak, D., Barthel, M., Blomberg, M. R. A., Harris, S. J., Johnson, M. S., Lehmann, M. F., Liisberg, J., Müller, C., Ostrom, N. E., Six, J., Toyoda, S., Yoshida, N., and Mohn, J.: What can we learn from N2O isotope data? – Analytics, processes and modelling, Rapid Commun. Mass Sp., 34, e8858, https://doi.org/10.1002/rcm.8858, 2020.
Zhu-Barker, X., Cavazos, A. R., Ostrom, N. E., Horwath, W. R., and Glass, J. B.: The importance of abiotic reactions for nitrous oxide production, Biogeochemistry, 126, 251–267, https://doi.org/10.1007/s10533-015-0166-4, 2015.
- Abstract
- Introduction
- Background – Potential precursors and reaction rate of N2O production in polar ice
- Samples and Methods
- Results
- Discussion
- Conclusion
- Appendix A: Can the TALDICE data be used as an atmospheric reference?
- Appendix B: Uncertainties in the mass balance calculation
- Appendix C: Sensitivity study: potential in situ contribution in TALDICE N2O
- Appendix D: Assessment of potential contamination, loss, or isotopic fractionation during N2O extraction from ice core samples
- Data availability
- Author contributions
- Competing interests
- Disclaimer
- Financial support
- Review statement
- References