the Creative Commons Attribution 4.0 License.
the Creative Commons Attribution 4.0 License.
 | 22 Jun 2026
Winter fluxes determine the annual carbon balance of an unmanaged subarctic drained peatland
Asra Salimi
Bjarni D. Sigurdsson
Brynhildur Bjarnadottir
Chenxin Feng
Hlynur Óskarsson
Ivan Mammarella
Peatlands are critical components of the global carbon (C) cycle, storing large amounts of soil organic carbon (SOC). However, drainage substantially alters their carbon exchange and hydrological functioning, often converting them into net carbon dioxide (CO2) sources. This study presents the first year-round, ecosystem-scale Eddy Covariance (EC) assessment of CO2 dynamics from an unmanaged drained peatland in western Iceland, originally drained in the early 1960s. Two years of continuous EC measurements were collected alongside high-resolution environmental data, including solar radiation, air and soil temperatures, soil water content, and groundwater level. Several multispectral drone flights were also conducted during the study period, which provided seasonal NDVI-based estimates of canopy greenness. The two study years differed markedly in annual weather during the growing season (GS), with 2023 GS being unusually warm and dry, while 2024 GS was cold and wet. Despite these contrasts, annual net ecosystem exchange (NEE) remained similar between the 2 years. The annual NEE was dominated by non-growing-season (NGS) respiration, which highlighted the necessity for year-round measurements. Overall, the site remained a persistent CO2 source, emitting 4.1–4.4 nearly 60 years after drainage. Temperature exerted the strongest control on ecosystem respiration (Reco), while gross primary production (GPP) responded primarily to seasonal irradiance and NDVI. A compensatory mechanism was observed during the warm year (2023) at this relatively cool site, where warming-induced increases in Reco were offset by an enhanced GPP, resulting in a relatively stable annual NEE despite meteorological contrasts. Soil moisture and vapor pressure deficit played only minor roles under these cool and moist conditions. These findings highlight the need for continued monitoring of unmanaged drained peatlands to better quantify their contribution to regional greenhouse gas budgets.
- Article
(5577 KB) - Full-text XML
-
Supplement
(290 KB) - BibTeX
- EndNote


Peatlands cover only 3 % (4.23 million km2) of the Earth's land surface, yet they represent a massive global carbon (C) reservoir, storing approximately 600 Gt C (Yu et al., 2010; Xu et al., 2018; Loisel et al., 2021). This C storage is remarkably large, as peatlands store a similar amount of C as global forest soils and litter combined, despite forests covering 31 % of the Earth's land surface (FAO, 2020; Loisel et al., 2021). Functionally, these ecosystems remain a significant net C sink of approximately 0.14 Gt yr−1, contributing 3 %–10 % of the total global terrestrial C sink (IPCC, 2007; Loisel et al., 2021). Peatlands function as C reservoirs because waterlogged conditions suppress decomposition, allowing organic matter (peat) to accumulate over thousands of years, often since the Last Glacial Maximum (Gorham, 1991; Yu et al., 2010). High-latitude peatlands, in particular, play an important role in the global C cycle, as their large soil C stocks may be highly sensitive to climatic warming and changes in hydrology (Loisel et al., 2021).
Drainage of natural peatlands for agriculture, forestry, or human infrastructure development is a major disturbance factor; it is estimated that the drainage has degraded 15.7 % of global peatlands, often transforming them from C sinks to persistent C sources (Joosten and Clarke, 2002; Leifeld and Menichetti, 2018; Leifeld et al., 2019). Drainage typically accelerates peat decomposition by lowering the water table and promoting an aerobic microbial oxidation of organic matter (Loisel et al., 2021). However, drainage can also alter vegetation traits (such as species composition and diversity), potentially increasing photosynthetic rates, biomass, and C inputs (Jauhiainen et al., 2019). In some cases, particularly where forests are established on drained peatlands, the increased C sequestration in biomass can temporarily offset soil carbon losses, turning the site into a net C sink (Minkkinen and Laine, 1998; Lohila et al., 2011; Bjarnadottir et al., 2021). Ultimately, the balance between drainage-induced changes in carbon inputs and outputs strongly depends on climate and management practices (Maljanen et al., 2010), highlighting the critical importance of monitoring the net carbon balance of drained wetlands in different settings.
Drained organic soils are recognized as significant sources of atmospheric greenhouse gas (GHG) emissions within national inventories under international treaties. In the 2013 IPCC Wetland Supplement (IPCC, 2014), the available studies on the GHG balances of drained peatlands at the time were used to establish default Tier 1 emission factors (EFs) to be used globally for countries lacking accurate national data. For the boreal zone, the Tier 1 EFs for CO2 are 0.25–0.37, 0.93, 5.7 and 7.9 for drained nutrient-poor forest/fallow lands, drained nutrient-rich forest lands, drained grasslands, and drained croplands, respectively (where drainage occurred < 50 years ago). In recent years, there have been several new studies published on the CO2 and other GHGs balances of some drained land classes (e.g. Evans et al., 2021; Jauhiainen et al., 2023; van Giersbergen et al., 2025). Jauhiainen et al. (2023) reviewed northern European studies on drained forest peat soils and published more accurate EFs, while similar initiatives are still missing for croplands and grasslands of N-Europe; especially there are few studies existing for unmanaged drained peatlands at higher latitudes (Guðmundsson et al., 2024). In a study in Denmark, annual ecosystem respiration (Reco) was found to increase from 4.2 in an undrained bog to 13.3 in a nearby drained permanent grassland (cattle grazing) (Kandel et al., 2018). The difference of 9.1 can, however, not be interpreted as a local EF, as neither net ecosystem exchange (NEE) nor annual CO2 uptake were measured and therefore net carbon balance was unknown.
A major limitation of many existing peatland carbon balance studies is the incomplete representation of non-growing-season (NGS) fluxes, which are often excluded or poorly constrained due to limited winter measurements (Alm et al., 1999; Aurela et al., 2004). At high latitudes, winter periods are long and can contribute significantly to annual CO2 emissions, even when short-term fluxes are relatively low (Aurela et al., 2002). This is particularly relevant in maritime climates, where relatively mild winter conditions can sustain continuous Reco throughout much of the NGS (Bjornsson et al., 2007). Many studies rely on growing-season (GS) chamber measurements, requiring model-based extrapolation to estimate annual budgets (e.g. Ojanen et al., 2010; Koskinen et al., 2016). In contrast, the eddy covariance (EC) method quantifies ecosystem-scale CO2 exchange continuously, allowing for a direct assessment of both GS and NGS contributions to the annual carbon balance (Aurela et al., 2002).
Drainage of peatlands in Iceland began in the early 20th century and was most intensive between the 1940s to 1970s, with little new drainage occurring in recent decades (Hallsdóttir et al., 2012; Guðmundsson and Óskarsson, 2014). Fully drained organic soils cover about 4196 km2, consisting mostly of unmanaged grasslands (Hallsdóttir et al., 2012; Guðmundsson and Óskarsson, 2014). These areas represent the largest single source of CO2 emissions in Iceland, estimated at ∼ 8.5 million t CO2-C annually (∼ 65 % of reported national GHG emissions; Umhverfisstofnun, 2025). Iceland currently applies the IPCC (2014) default EFs for all drained land categories, even though more than half of these areas were drained over 50 years ago and Icelandic peatlands differ significantly from those at comparable latitudes (Arnalds et al., 2016b). Specifically, Icelandic peatlands are unusually mineral-rich due to volcanic and aeolian inputs, which increase nutrient availability and may influence carbon chemistry and turnover (Dagsson-Waldhauserova et al., 2014; Arnalds, 2015; Möckel et al., 2021, 2023).
Limited data exists on the actual annual CO2 emissions from Icelandic drained peatlands, both unmanaged and croplands. Using peat-soil inventories of eight paired undrained and drained unmanaged 15–50-year-old site-pairs in southern Iceland, Gunnarsdóttir (2017) found an average annual loss of 1.7 , ranging between 0.7 and 3.1 . These estimates are much lower than the 5.7 IPCC (2014) default EF for boreal grasslands. In another study, Ólafsdóttir (2015) used chamber techniques to measure surface CO2 fluxes from an uncultivated drained peatland in western Iceland, and after interpolating the annual flux found a NEE of 3.8 ± 0.65 , which is also below the IPCC (2014) default EF.
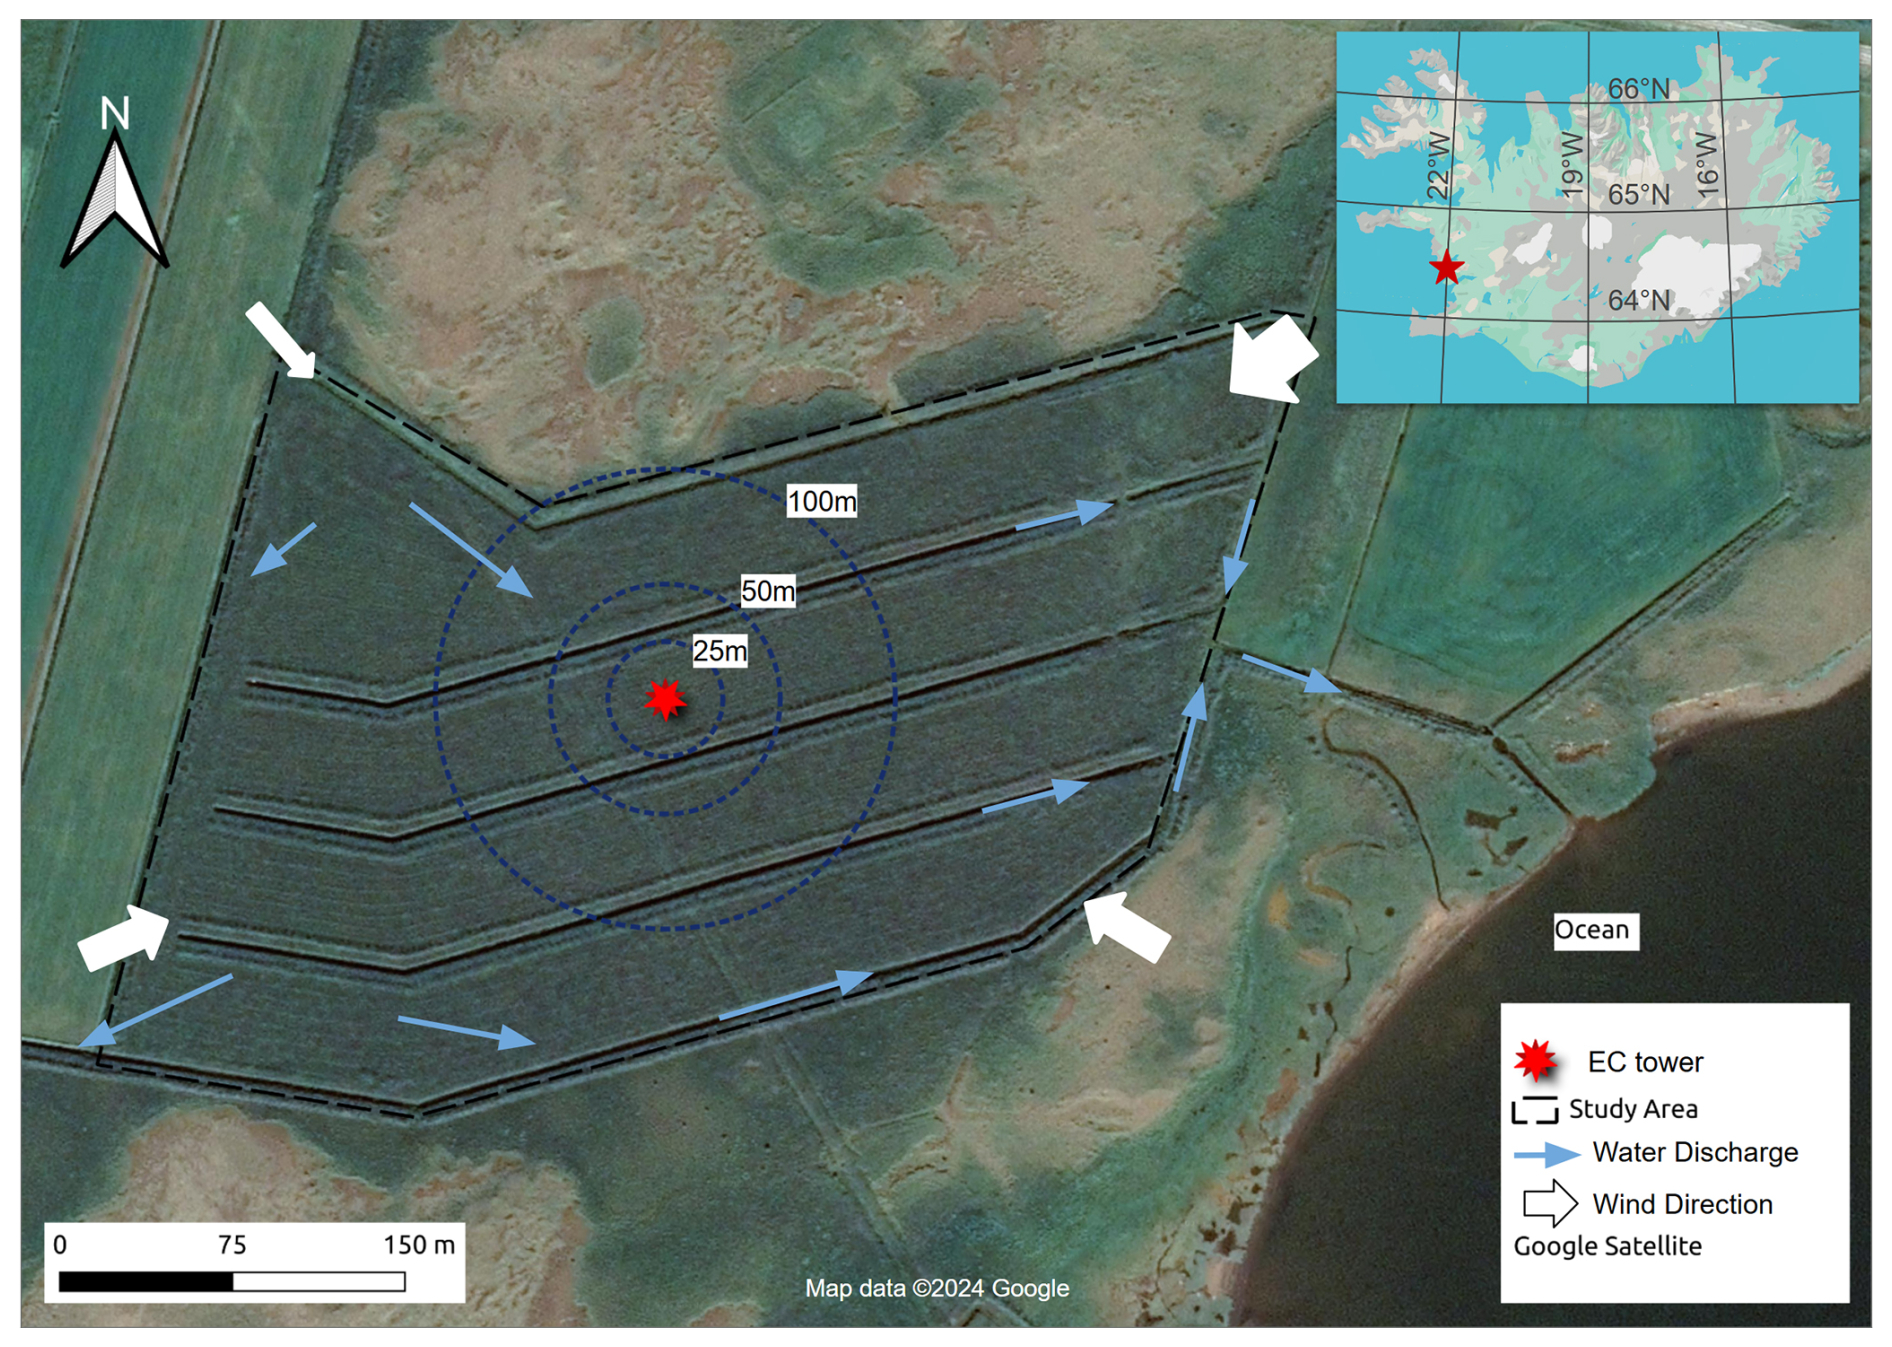
Figure 1Location of the LD site (unmanaged drained peatland) in W-Iceland. The red star marks the eddy covariance (EC) tower, while dark blue circles indicate buffer zones with radius of 25, 50, and 100 m around the tower. Light blue arrows illustrate water discharge pathways from the field toward the ocean, and white arrows indicate the prevailing wind direction and magnitude toward the tower.
Iceland possesses a cool temperate maritime climate at elevations below 400 (Bjornsson et al., 2007), with a growing season of approximately four months (Einarsson, 1984). Being an island in the middle of the North Atlantic Ocean, its winters are relatively mild compared to the more continental climates found at similar latitudes in Scandinavia and North America (Bjornsson et al., 2007; Ruosteenoja and Jylhä, 2022). In fact, the current relatively warm winter climate in lowland Iceland represents similar conditions as are predicted to occur at the same latitudes in Scandinavia during the latter part of this century if GHG emissions are not reduced (Hanssen-Bauer et al., 2017; Ruosteenoja and Jylhä, 2022).
The Umhverfisstofnun (2025) national inventory report emphasized that continuous flux measurements from unmanaged, drained sites in Iceland are still lacking. To address this knowledge gap, this study quantified the annual NEE of an unmanaged drained peatland in western Iceland over a two-year period using EC measurements. The study aimed to determine: (i) how close the unmanaged site was to the IPCC's (2014) default EF for drained grasslands, (ii) how strongly the NEE values and its component fluxes were influenced by different environmental conditions and (iii) how NEE and its component fluxes differed between the GS and the NGS, in the cool, maritime climate of Iceland.
2.1 Study site
The study was carried out at a 12 ha unmanaged drained grassland site at the Lækur Farm in Western Iceland (64.39° N, 21.89° W), hereafter termed the LD site. The site was artificially drained in 1961 through a network of ca. 2 m deep ditches spaced roughly 52 m apart and by putting in subterranean channels at ca. 60 cm depth between the ditches. Despite the drainage effort, the land has never been cultivated or fertilized, allowing natural vegetation succession under altered hydrological conditions. This has resulted in a dense, highly productive grass cover. There was some livestock grazing at the site prior to 1997, but since then it has remained protected. The terrain is predominantly flat, with subtle hummocks and the site drains southeast and southwest toward the ocean, which is > 120 m away from the lowest edge of the LD site (Fig. 1). The peat soil of the site is classified as Histosols, with a bulk density of 0.2 g cm−3, a pH of 4.6 and a ratio of 20.36 in the 0–50 cm layer.
Table 1Summary of site characteristics and environmental parameters for the LD site (unmanaged drained peatland) in W-Iceland during 2023–2024, including climate, topography, soil, hydrology, and vegetation data.
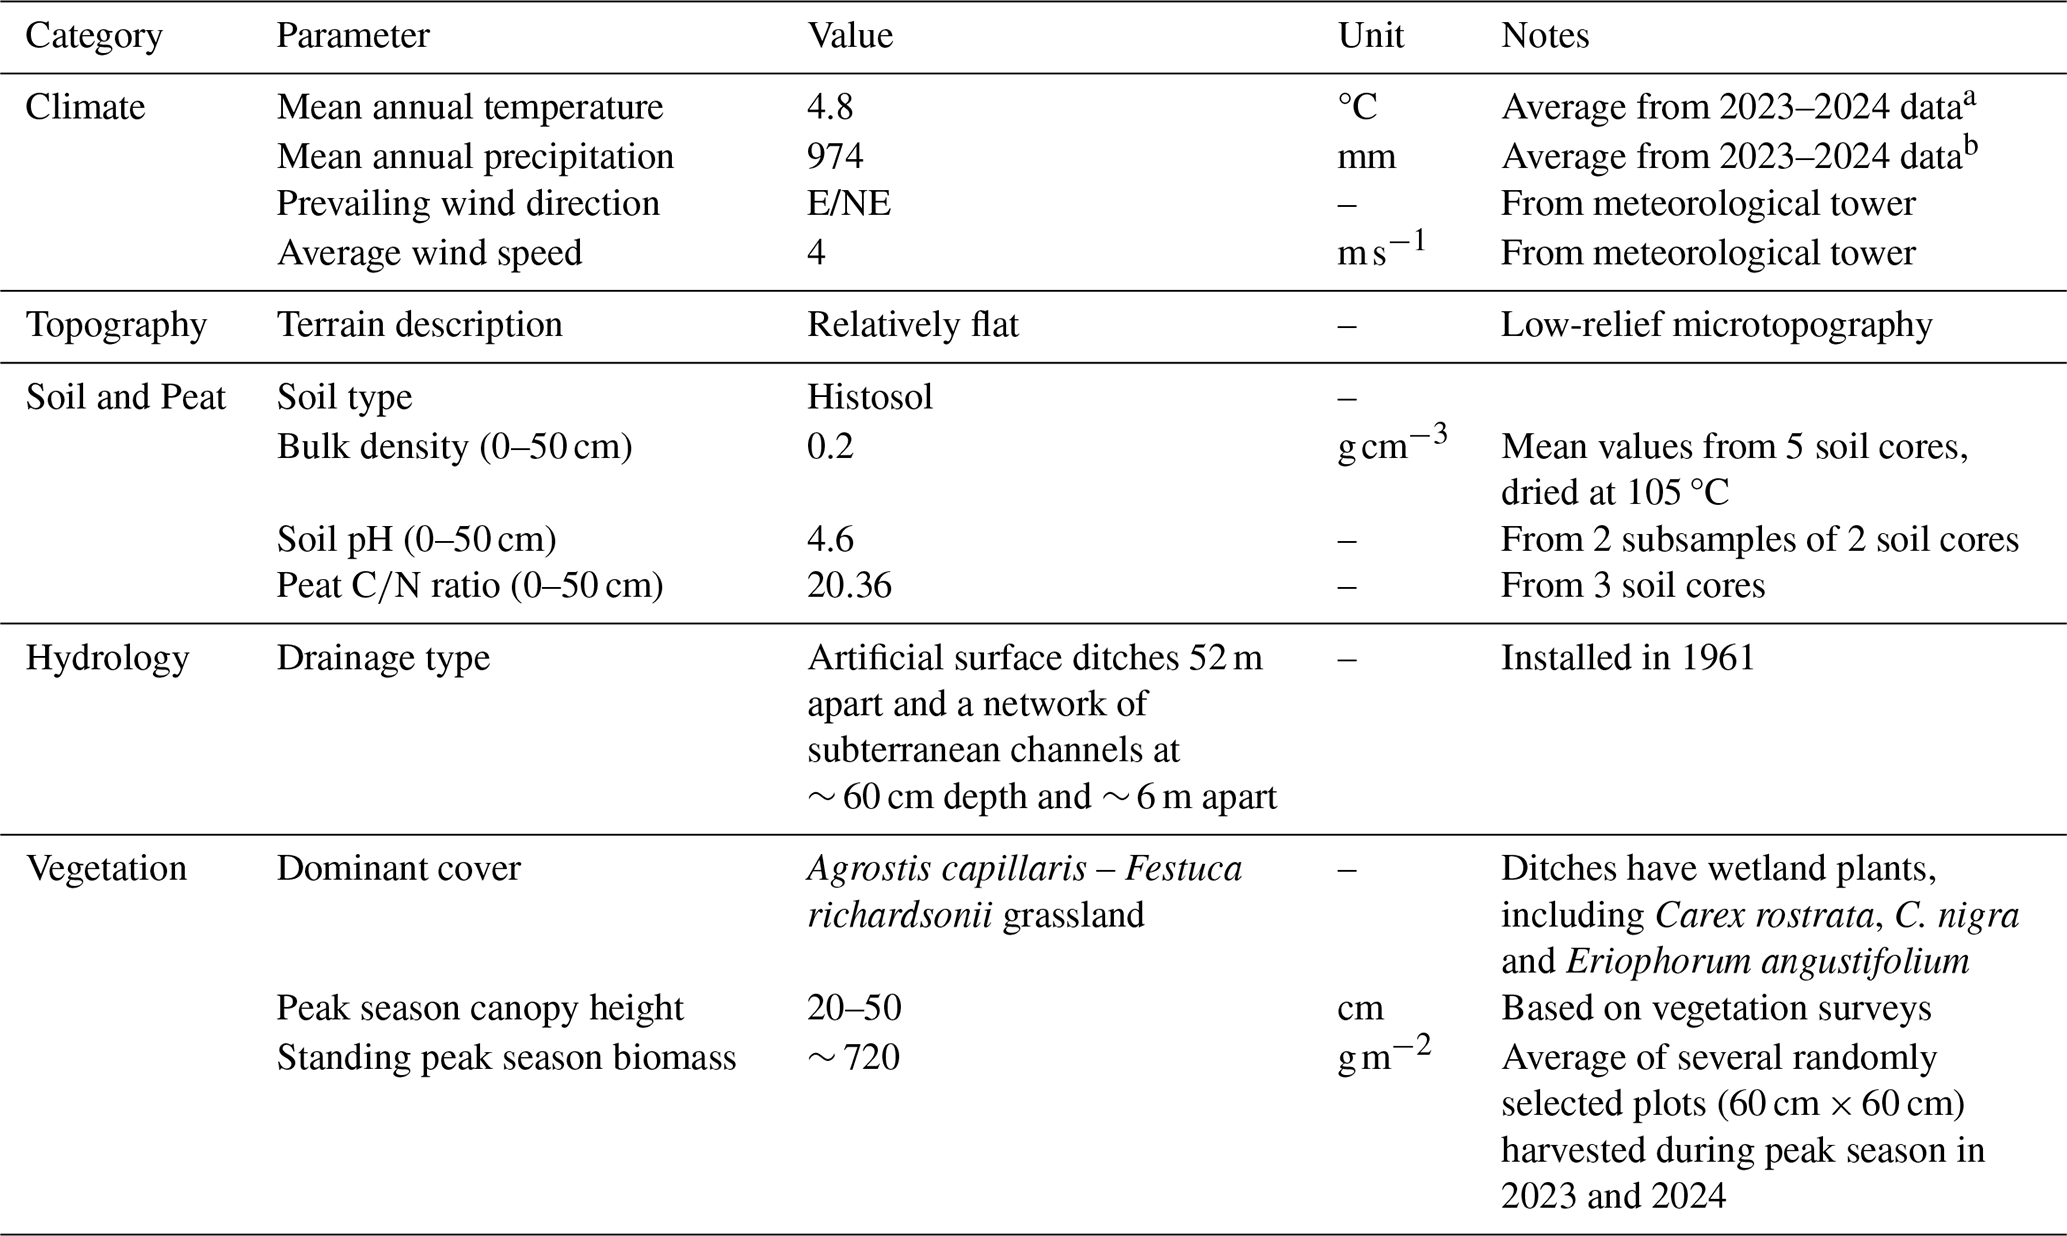
a Data from Hafnarfjall weather station (ID 31674; ∼ 10 km away from the study site) (Icelandic Meteorological office, 2025). b Data from Neðra-Skarð weather station (ID 97; ∼ 5 km away from the study site) (Icelandic Meteorological office, 2025).
The climate is cool maritime, with a mean annual temperature (MAT) of +4.8 °C and mean annual precipitation (MAP) of 1011 mm, based on 2023 and 2024 data from the nearest weather station to the site (Icelandic Meteorological office, 2025). Seasonal minimum and maximum temperatures ranged from −14 °C in winter to 20 °C in summer during the same period. Prevailing winds originate mainly from the east and northeast, averaging 4 m s−1 (Table 1). The uniform microtopography of the site likely supports a relatively consistent microclimate.
The current vegetation at the site is classified as a Boreo-subalpine Agrostis grassland habitat type (Ottósson et al., 2017), with common bentgrass (Agrostis capillaris) and Arctic fescue (Festuca richardsonii) as dominating species. The peak season's plant canopy height is 20–50 cm and maximum annual aboveground biomass is ∼ 720 g m−2 (Table 1).
2.2 Instrumentation and data collection
2.2.1 Eddy Covariance system
An EC tower was established in early January 2023 at the drained (LD) site, positioned based on predominant wind directions to optimize the flux footprint and minimize edge effects (Fig. 1). The instrumentation consisted of an open-path infrared gas analyser (LI-7500DS, LI-COR Biosciences, Lincoln, NE, USA) for real-time CO2 and H2O measurements, integrated with a 3D sonic anemometer (WindMaster Pro, Gill Instruments, Lymington, UK). The system recorded three-dimensional wind velocity and gas concentrations at a sampling frequency of 10 Hz. In addition to CO2 exchange, the EC system measured latent heat flux (LE) and sensible heat flux (H), providing insight into energy exchange processes and friction velocity (u∗). From January 2023 until May 2024, flux measurements were conducted at a height of 2.15 m above the canopy, after which the sensor height was increased to 3.5 m.
Due to the absence of grid power, the setup was powered using a hybrid power solution consisting of 200 W solar panels and a methanol fuel-cell generator (EFOY Pro 900, SFC Energy AG, Brunnthal, Germany). This configuration ensured continuous year-round operation, particularly during winter months when solar radiation is insufficient at high latitudes. The fuel cell was strategically positioned northwest of the EC system, outside the dominant wind directions, to avoid interference with flux measurements; footprint analysis and CO2 concentration data confirmed negligible influence from this sector (further details are provided in Appendix A).
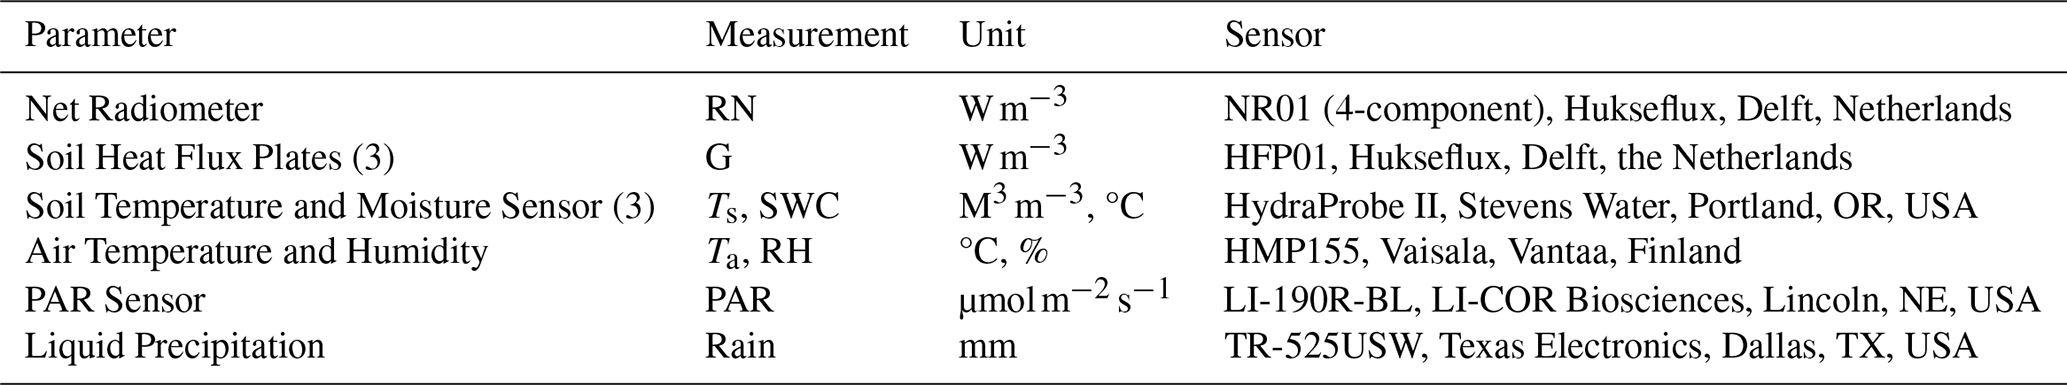
Table 2The instrumentation and technical specifications at the LD site (unmanaged drained peatland) in W-Iceland.
2.2.2 Biomet and auxiliary sensors
A micro-meteorological tower was installed near the EC system. This tower was equipped with sensors to monitor air temperature (Ta), humidity (RH), precipitation (Rain), and solar radiation (PAR). Soil temperature (Ts) and soil moisture (SWC; with a factory calibration for organic soil) were measured at fixed depth of 10 cm (point measurement) below the surface (Table 2).
Groundwater level (WL) was recorded hourly close to the EC tower using a pressure sensor with barometric compensation (Onset, HOBO MX2001 water level logger, Bourne, MA, USA). The WL well was manually augured to a depth of 330 cm to capture the full range of seasonal water table fluctuations. Additionally, five wells were augured at different locations within the site where WL was manually measured. The WL data were post-processed to correct for sensor drift and noise from freezing conditions. WL is reported as the vertical distance from the peat surface, with negative values indicating that the water table was below ground level.
2.2.3 Site characterization and surface mapping
To characterize spatial heterogeneity and surface features at the study site, a combination of in-situ measurements and drone-based mapping was used. Peat depth was assessed using a manual peat depth probe (Eijkelkamp Soil & Water, Giesbeek, Netherlands), inserted vertically until the mineral substrate was encountered. A total of 46 measurements were collected across a systematic grid. A peat depth map was generated from the point measurements using Inverse Distance Weighting (IDW) interpolation in QGIS (v3.28.9-Firenze, QGIS Development Team). IDW was selected over geostatistical methods because the peat thickness showed significant local variability without a clear regional trend, and the sample size was better suited for a deterministic interpolation approach.
A high-resolution Digital Surface Model (DSM) was generated from drone imagery acquired during low-altitude flights. Imagery was captured using a 10-band MicaSense RedEdge-MX Dual Camera Imaging System (MicaSense Inc., Seattle, WA, USA) mounted on a DJI Matrice 300 RTK drone (SZ DJI Technology Co., Ltd., Shenzhen, China). To ensure temporal comparability, all imagery was radiometrically calibrated using a calibrated reflectance panel and a downwelling light sensor (DLS 2) for each flight. The data were processed using structure-from-motion (SfM) photogrammetry in Agisoft Metashape (v2.1.1, Agisoft LLC, St. Petersburg, Russia). This technique is well-suited for high-precision surface reconstruction in ecological studies (Westoby et al., 2012; Dandois and Ellis, 2013).
Seasonal changes in the site's Normalized Difference Vegetation Index (NDVI) were derived from multispectral imagery acquired during 14 drone flights (5 in 2023; 9 in 2024). NDVI was calculated using the standard spectral reflectance ratio:
Where RNIR and RRed represent surface reflectance in the near-infrared and red bands, respectively (Rouse et al., 1974). Weekly NDVI values were estimated by fitting a smoothing spline to discrete flight data to reflect the seasonal development of canopy greenness.
2.3 EC data processing
EC data were processed using EddyPro software (v7.0.9, LI-COR Biosciences, Lincoln, NE, USA), following standard protocols for open-path sensor configurations. The processing workflow included angle-of-attack correction, double coordinate rotation, and time lag compensation. Spectral losses were compensated following Moncrieff et al. (1997). To adjust for fluctuations in air temperature and water vapor, Webb–Pearman–Leuning (WPL) density correction was applied (Webb et al., 1980). To account for instrument-related density effects, the Burba et al. (2008) correction was applied to the entire 2023–2025 dataset. Owing to the high-latitude, cool-climate setting of the Icelandic site, a temperature gradient between the ambient air and the LI-7500DS sensor head was expected to persist for much of the year. Applying the correction consistently across all seasons ensured a uniform processing workflow and avoided introducing artificial discontinuities at seasonal transitions. The correction magnitude scaled with the observed air-instrument temperature gradient and naturally became negligible during warmer periods.
To account for CO2 accumulation below the measurement height, a storage flux correction was applied following the approach of Aubinet et al. (2001). Although the EC system height was increased from 2.15 to 3.5 m during the study period, data comparability was maintained through consistent storage corrections and the site's high degree of topographical and vegetative homogeneity.
The EC system data was integrated with the micro-meteorological sensors data (Table 2) and automatically time-aligned via the EddyPro software, enabling the computation of half-hourly averages for NEE, H, and LE. This integration also provided the metadata and diagnostic quality flags required for subsequent quality assurance and data analysis.
Following initial processing, a multi-step quality control (QC) procedure was implemented. Outliers were removed through a combination of statistical screening and visual inspection. The dataset was filtered using the turbulence and stationarity classification scheme of Mauder and Foken (2011); only data with high (0) or moderate (1) quality flags were retained. Data periods affected by instrument malfunction or signal loss were also excluded. u∗ thresholds were determined using the moving point test implemented in the REddyProc R package (Wutzler et al., 2018). Thresholds of 0.26 and 0.29 m s−1 were applied to the 2023 and 2024 datasets, respectively, to minimize underestimation of nocturnal fluxes (Papale et al., 2006). An additional filtering step was applied specifically to CO2 fluxes. Data collected during precipitation events, dew formation, or low vapor pressure deficit (VPD) were excluded, as these conditions interfere with open-path analyser performance and can yield biologically unrealistic values (Wohlfahrt et al., 2005; Aubinet et al., 2012).
Energy balance closure (EBC) was evaluated by comparing the sum of the turbulent energy fluxes to the available energy (Foken, 2008). To account for energy temporarily stored within the ecosystem, storage terms were included in the energy balance equation:
Where H is the sensible heat flux (W m−1), LE is the latent heat flux (W m−2), Rn is the net radiation (W m−2), G is the ground heat flux (W m−2), and S represents the sum of heat storage terms, including storage in the air column (Sa) and the soil layer above the heat flux plates (Sg).
The spatial representativeness of the EC fluxes was assessed using the Flux Footprint Prediction (FFP) model of Kljun et al. (2015) using Tovi software (v2.9.1, LI-COR Biosciences, Lincoln, NE, USA). Footprints were computed at 30 min resolution using measured u∗, Obukhov length (L), wind direction, and lateral wind variability (σv), with constant surface parameters of roughness length (z0 = 0.035 m) and displacement height (d = 0.23 m).
2.4 Data analysis and statistical approaches
2.4.1 CO2 Flux gap-filling and partitioning
Meteorological drivers, including Ta, Ts, VPD, and PAR, were gap-filled prior to flux processing. Missing values were substituted using data from auxiliary on-site sensors and the nearest Icelandic Meteorological Office (IMO) weather station. This pre-processing follows standard FLUXNET and REddyProc procedures, which require continuous meteorological inputs for CO2 gap-filling and flux partitioning (Wutzler et al., 2018; Pastorello et al., 2020).
The GS was defined using a daily mean Ta threshold of 5 °C, following the standard Nordic climatological approach (Carter, 1998; Førland et al., 2004). Since short warm spells in winter are common in Iceland's maritime climate and to avoid falsely identifying early or mid-winter warm events as genuine growing-season onset, the growing season onset and end was only confirmed when temperatures remained above or below 5 °C for at least 10 consecutive days.
Initial CO2 data coverage across the study period was 78 %, mainly due to power outages. After applying quality filters (e.g., removing low-turbulence periods and sensor-related artifacts gaps lasting more than 12 h), the remaining data coverage was 65 %. To produce a continuous record of CO2 fluxes, a two-step gap-filling approach combining Marginal Distribution Sampling (MDS) (Reichstein et al., 2005) and Extreme Gradient Boosting (XGBoost) (Chen and Guestrin, 2016) was applied.
First, MDS was performed using the REddyProc package which fills missing flux values by sampling observed data during periods with similar environmental conditions within flexible temporal windows. Environmental drivers including PAR, Ta, and VPD were used to account for seasonal and diurnal variability. Short-term gaps (≤ 24 h) were filled using MDS, while MDS estimates associated with high uncertainty (standard deviation > 4 ) were excluded.
Long-term gaps and unreliable MDS outputs were subsequently re-estimated using XGBoost, a machine-learning algorithm well-suited for capturing non-linear relationships between carbon fluxes and environmental drivers in Python (v3.12.3; Python Software Foundation). To account for seasonal shifts in ecosystem response, separate models were trained for the GS and NGS using only high-quality NEE observations. Predictor variables included PAR, Ta, Ts, VPD, and time-of-year indicators to capture phenological trends.
The model was evaluated using 5-fold cross-validation on 14 610 cleaned observations. In each iteration, the model was trained on 80 % of the data and validated on the remaining 20 %, ensuring that all data points were independently used for validation. Model performance was quantified using the coefficient of determination (R2) and root mean square error (RMSE). To assess potential overfitting, training and validation performance were compared. Furthermore, SHAP (SHapley Additive exPlanations; Lundberg and Lee, 2017) values were calculated to provide a physically meaningful interpretation of variable importance and to quantify the contribution of each environmental driver to the predicted NEE. This approach effectively addressed missing or low-quality data and enabled reliable reconstruction of NEE over the entire study period.
The NEE was partitioned into gross primary production (GPP) and Reco using a physics-guided hybrid approach. Ecosystem respiration was first parameterized from nighttime NEE with the Lloyd–Taylor temperature response function using Ts as the primary environmental driver (Lloyd and Taylor, 1994):
where Rref is Reco at a reference temperature (Tref = 283.15 K), E0 is the activation energy-type parameter, and T0 is a fitted constant (227.13 K). To account for freeze–thaw state dependence common in Icelandic peatlands, the function was fitted across two thermal regimes (cold: Ts≤ 2 °C; warm: Ts > 2 °C). Non-temperature-driven variations (calculated as the residual between observed nighttime NEE and the Lloyd–Taylor Reco) were modelled using a constrained XGBoost algorithm. This residual model was trained on environmental drivers (Ta, Ts, VPD, SWC), diel and seasonal harmonics, and cumulative thermal indicators such as thawing and freezing degree days. To maintain biological consistency, monotonicity constraints were enforced, ensuring that predicted nighttime Reco did not decrease with increasing temperatures. Furthermore, a temperature-based gating function was applied to prioritize the Lloyd–Taylor baseline during frozen conditions while allowing XGBoost to capture complex biological variance during warmer, more active periods. The model was evaluated using 5-fold cross-validation, and potential overfitting was assessed by comparing predictive performance metrics (R2 and RMSE) between the training and validation sets. SHAP values were also calculated to assess the relative importance of model input variables.
Daytime GPP was subsequently calculated by subtracting the measured NEE from the modelled Reco (GPP = Reco−NEE), where negative values indicate CO2 uptake (net-photosynthesis). During the prolonged twilight hours typical of 64° N, light sensors can become unreliable; therefore, when PAR fell below 150 , GPP values were smoothed toward a standard light-response curve (Lasslop et al., 2010). To prevent sensor noise from biasing the carbon budget, GPP was strictly set to zero during astronomical nights (solar elevation ≤ −12°). Finally, uncertainty in GPP and Reco estimates was quantified using bootstrap resampling of the entire processing chain (N=30; meaning that the entire workflow including Lloyd–Taylor fitting, XGBoost training, and flux partitioning was repeated 30 times), yielding time-dependent standard deviations.
Carbon flux dynamics were analysed at multiple temporal scales, including diurnal, seasonal, and annual cycles. This multi-scale approach enabled the assessment of both short-term variability and longer-term ecosystem behaviour. Annual carbon budgets were calculated for the full calendar years of 2023 and 2024, expressed in . A mean annual value was derived from both years to represent the long-term site behaviour.
2.4.2 Statistical relationships
To examine how CO2 fluxes responded to environmental conditions, analyses were restricted to periods with observed (non-gapfilled) NEE and the corresponding partitioned GPP and Reco values. Environmental drivers (accumulated weekly PAR (PARacc), VPD, Ta, Ts, SWC, and WL) were likewise limited to their measured values. Weekly averages of fluxes and weekly summaries of drivers were then computed for both study years and used to evaluate relationships between environmental conditions and GPP or Reco. In addition to individual drivers, a combined radiation–vegetation metric (PARacc × NDVI) was calculated, with weekly NDVI representing canopy greenness and commonly used parameter as a proxy for the fraction of absorbed PAR (fPAR) in light-use-efficiency frameworks that are typically linearly related to GPP sums (Monteith, 1972; Sellers, 1985). The PARacc × NDVI product is therefore an approximation to total intercepted PAR.
Linear regressions were subsequently applied in Python to quantify how strongly each environmental variable explained weekly variation in GPP and Reco within each study year, enabling comparison of the relative influence of individual drivers and interannual differences in response strength. Model performance was evaluated using R2 and associated p-values to assess statistical significance.
For the relationship between Reco and temperature, a non-linear Q10 temperature-response function following Raich and Schlesinger (1992) was applied to capture the characteristic exponential increase in metabolic activity with temperature, which linear models typically fail to represent across a broad thermal range. The function is expressed as:
Where R(T) is ecosystem respiration at temperature T, Rref is respiration at a reference temperature (Tref = 10 °C), and Q10 represents the factor by which respiration increases for a 10 °C rise in temperature.
Furthermore, Pearson correlation coefficients (Pearson, 1896) were calculated across the full study period to assess the overall strength and direction of linear associations between weekly flux components (NEE, GPP, and Reco) and environmental drivers, integrating seasonal progression and interannual variability. Pearson's r was selected to characterize broad-scale relationships rather than year-specific responses.
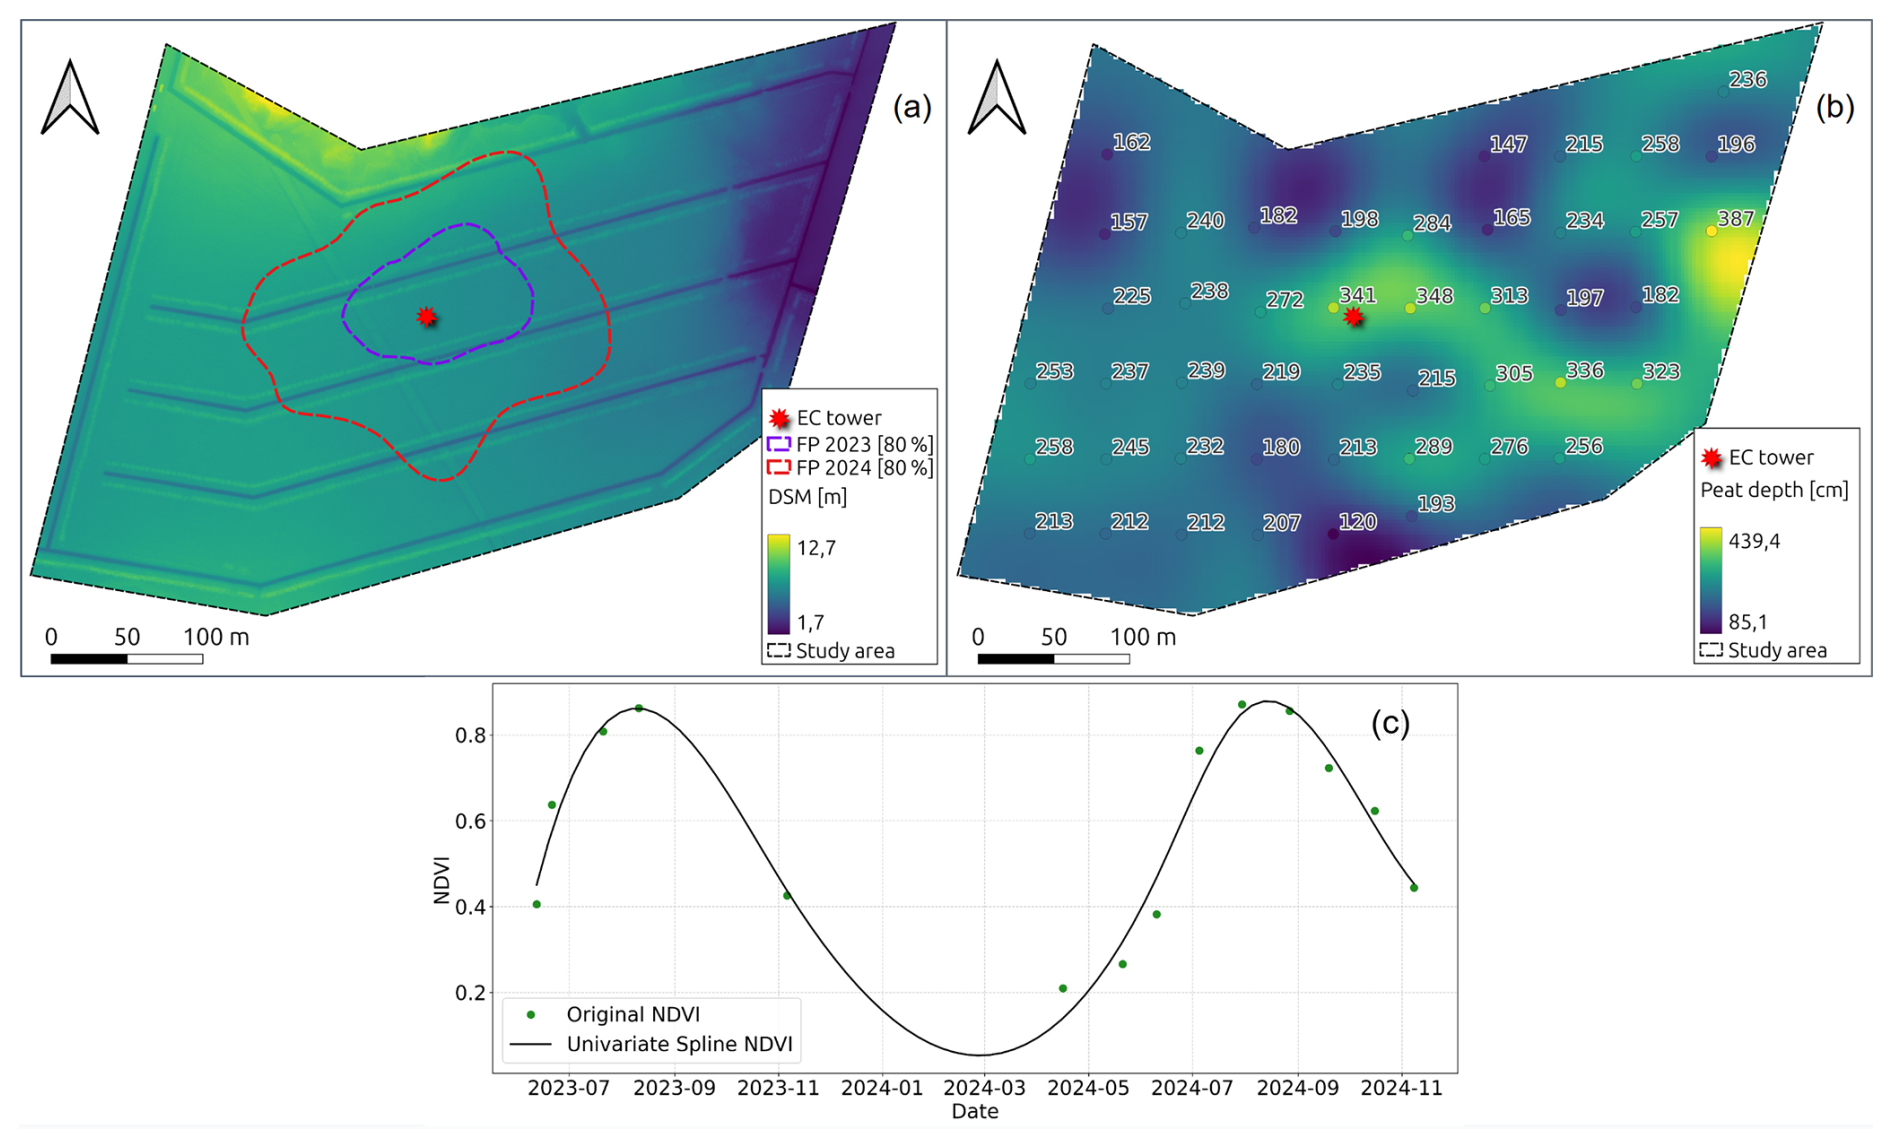
Figure 2Site characteristics of the LD site (unmanaged drained peatland) in W-Iceland: (a) Digital Surface Model (DSM) of the site showing the 80 % flux footprint boundaries for 2023 (instrument height of 2.15 m above mean canopy height) and 2024 (instrument height of 3.5 m); (b) peat depth map derived from spatial interpolation, overlaid with the 46 manual measurement points; (c) seasonal NDVI patterns across the 2023–2024 study period.
3.1 Surface and subsurface characteristics
The high-resolution DSM with 7 cm ground sampling distance shows that the site is predominantly flat, with most of the area situated around 7 Elevation ranged from 1 to 11 m, with the lowest point along the eastern boundary and the highest in the northwest, though these extremes fell largely outside the main flux footprint (Fig. 2a).
In 2023, when the measurement height was 2.15 m, the 80 % footprint averaged 50–70 m around the tower, which was smaller than expected due to the rough, hummocky surface (Fig. 2a). After the measurement height was increased to 3.5 m in 2024, the 80 % EC flux footprint extended on average 100–120 m around the tower (Fig. 2a). The 80 % footprint remained within the main study area for both years and covered relatively uniform terrain with less than 2 m elevation variation and similar vegetation composition. The site was characterized by predominantly easterly winds and high u∗ (mostly above 0.2 m s−1), indicating that mechanical turbulence dominated and atmospheric conditions were mostly neutral.
Within the footprint, subtle microtopographic features were present, including hummocks and drainage ditches with their associated spoil ridges. Surface classification indicated that ∼ 3.5 % of the footprint consisted of ditches, 9.5 % of excavated peat soil, and the remaining ∼ 87 % was the main drained unmanaged peatland grassland field (Fig. 2a).
Measured peat depths across the 46 sampling points ranged from 120 to 387 cm. Spatially, deeper peat deposits were primarily concentrated in the central and eastern parts of the site. In contrast, shallower regions were typically located near the northern and southern site boundaries. The average depth recorded from field measurements was 235 cm, while the mean depth derived from the generated peat depth map was 237 cm (Fig. 2b).
Temporal trends in NDVI followed a clear seasonal pattern, with values peaking in mid-summer (July–August), reflecting maximum canopy development and light interception. NDVI values were lowest in early spring, late autumn and winter corresponding to the dormant phases and the deciduous character of the vegetation and relative lack of moss cover in the fertile grassland (Fig. 2c).
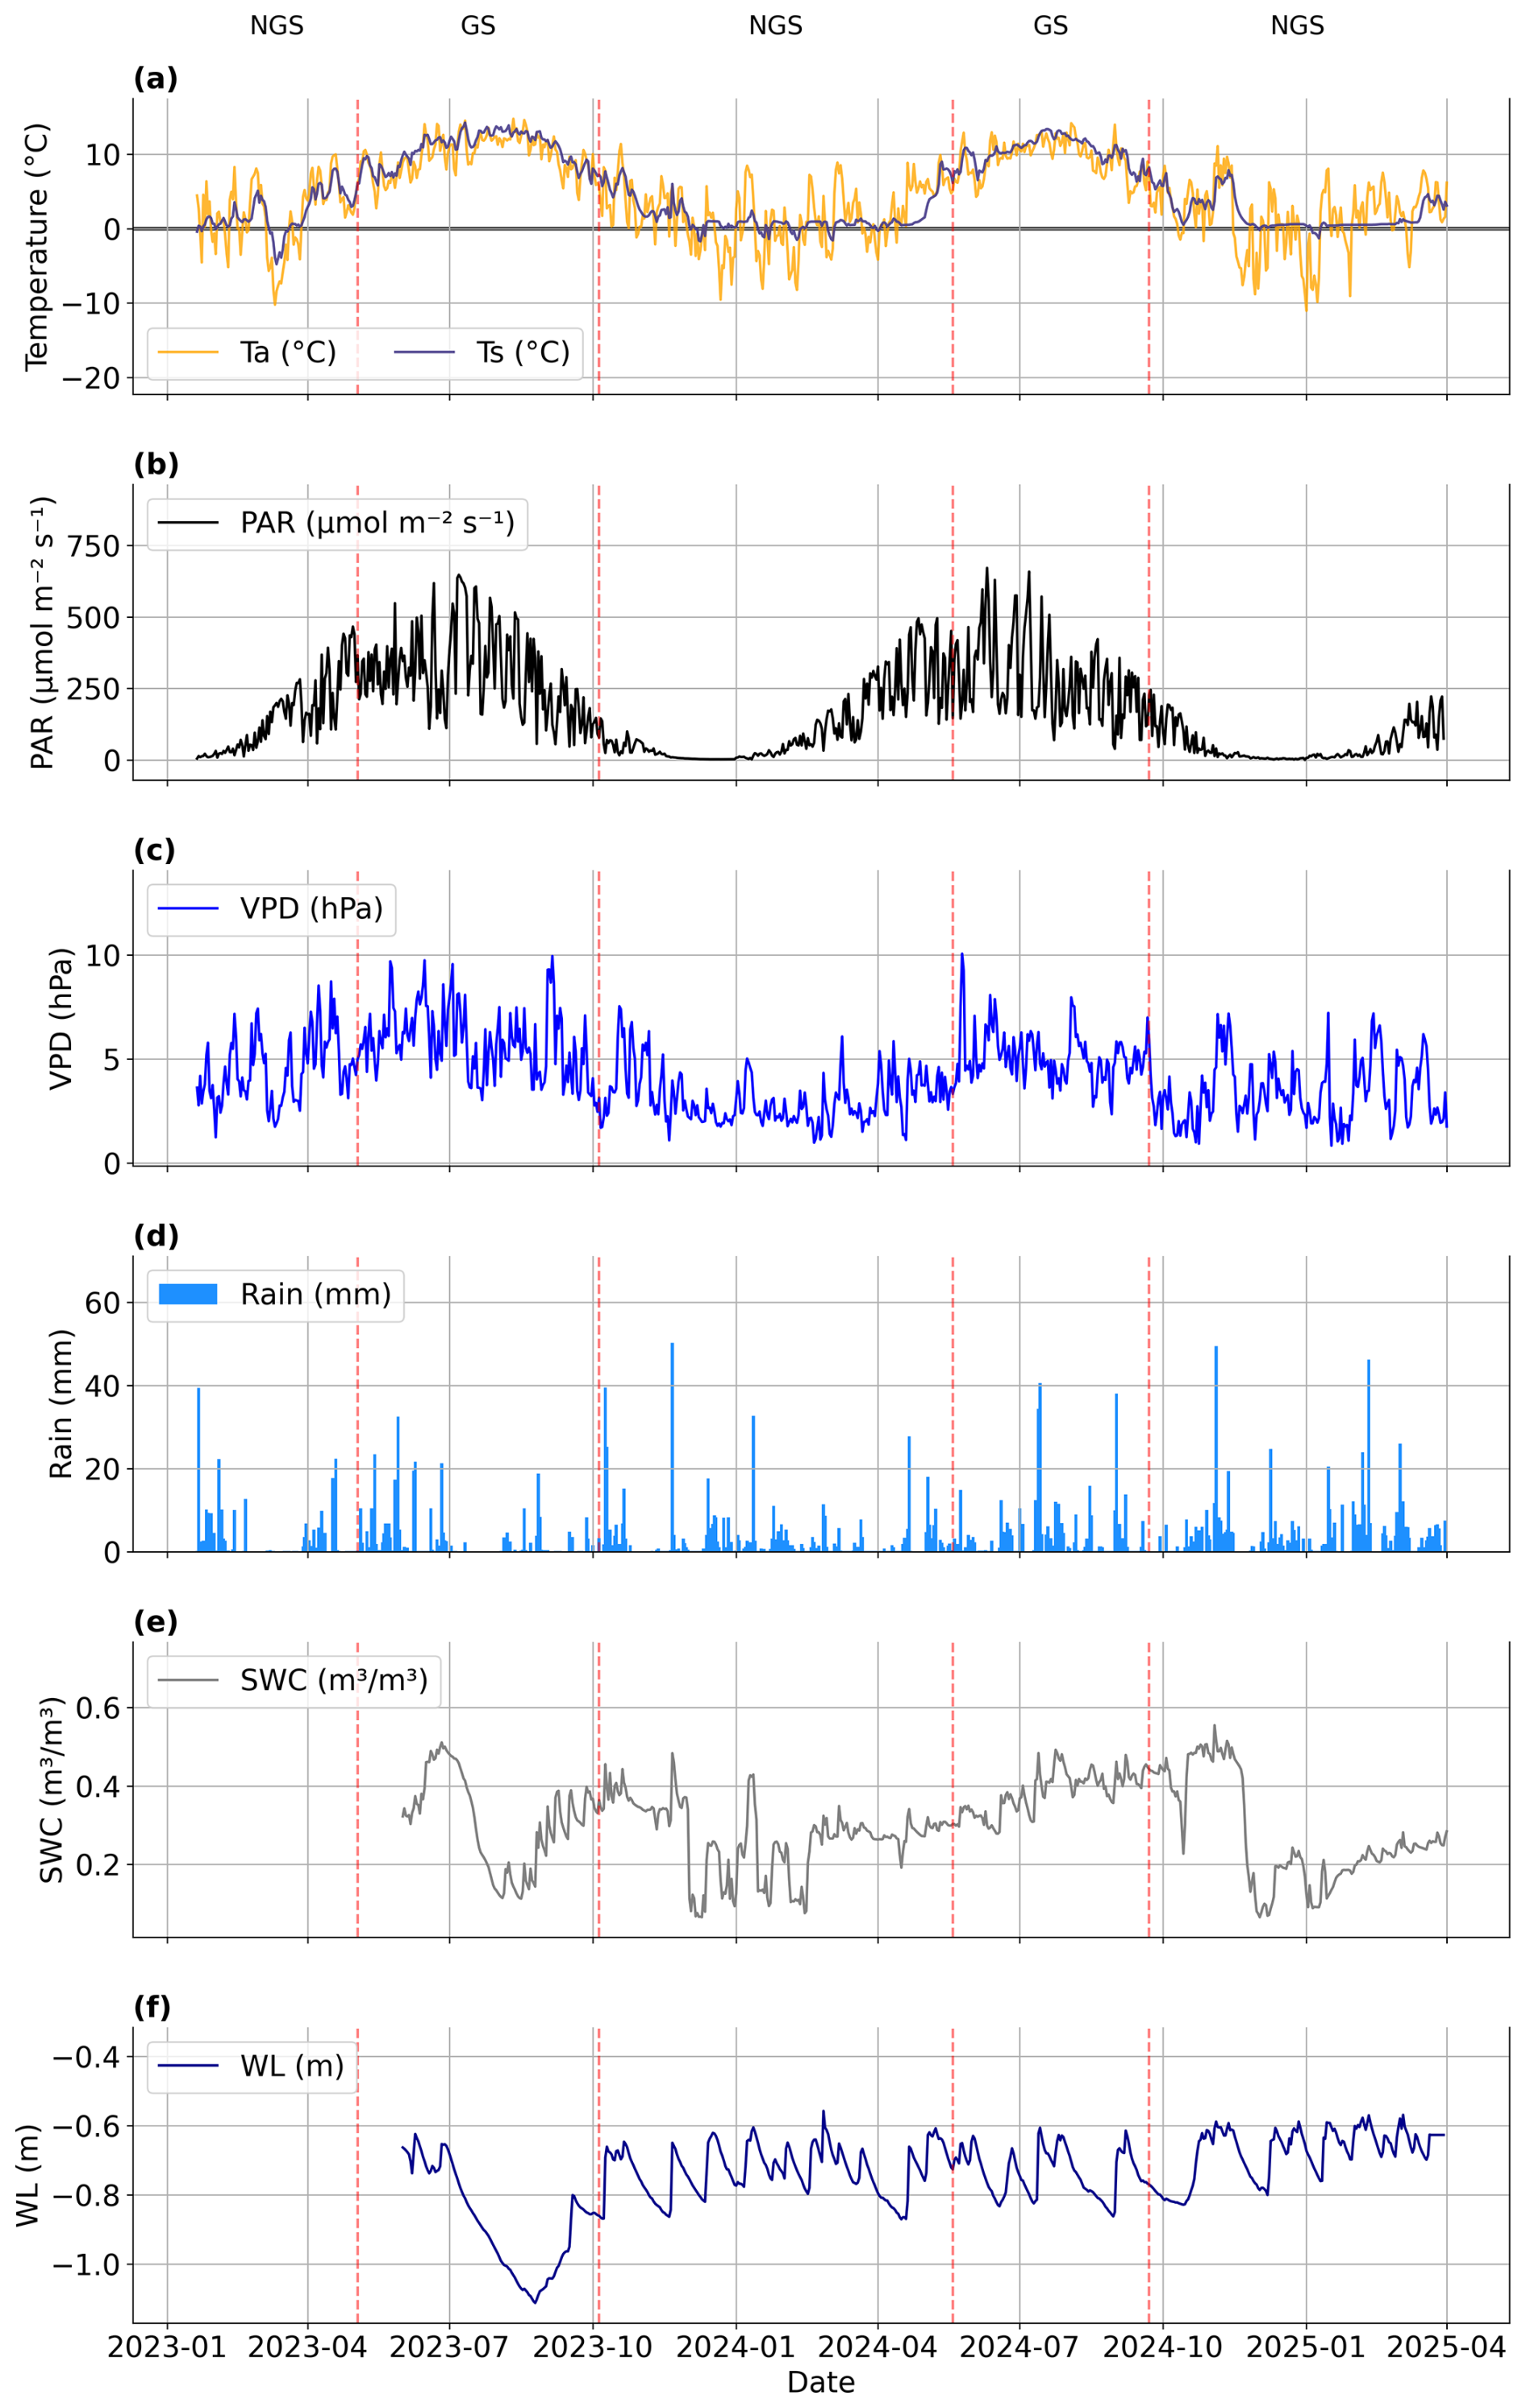
Figure 3Meteorological and environmental conditions at the LD site (unmanaged drained peatland) in W-Iceland. Time series of key environmental parameters measured from January 2023 to April 2025 including (a) air temperature (Ta; °C) and soil temperature (Ts; °C), (b) photosynthetically active radiation (PAR; ), (c) vapor pressure deficit (VPD; hPa), (d) precipitation (Rain; mm), (e) soil water content (SWC; m3 m−3), and (f) water level (WL; m). Vertical red dashed lines show the transitions between the growing seasons (GS) and non-growing seasons (NGS).
3.2 Environmental variables
The seasonality of key environmental drivers, including Ta, Ts (at 10 cm below the surface), PAR, VPD, Rain, SWC and WL, was analyzed to provide essential context for interpreting the ecosystem CO2 fluxes (Fig. 3).
The GS began in early May and extended into early October in 2023 (3 May–5 October), reflecting a relatively long period of active plant growth. In 2024 the GS was noticeably shorter; it started later and ended earlier, covering the period from 19 May to 22 September (Fig. 3; vertical red dashed lines). This corresponds to the length of the GS being 45 % of the year in 2023 and 35 % in 2024.
Mean Ta during GS was slightly higher in 2023 (9.8 °C) than in 2024 (9.5 °C), with similar patterns during the NGS with mean Ta of 1.7 °C in 2023 and 1.6 °C in 2024. Ts followed similar trends, remaining low during NGS (mostly close to 0 °C due to freezing of surface peat layers) and reaching GS means of 10.6 °C (2023) and 10.4 °C (2024) (Fig. 3a).
PAR showed the strongest seasonal signal (Fig. 3b), with GS means of 302 in 2023 and 281 in 2024, while NGS values remained low. VPD remained relatively low in both years (with GS mean of 5.8 hPa in 2023 and 5.1 hPa in 2024 and even lower values during NGS), reflecting the humid maritime climate, but showed slightly stronger seasonality in 2023 (Fig. 3c).
Total annual precipitation was higher in 2024 (950 mm) than in 2023 (823 mm), an increase of roughly 15 % (Fig. 3d). During the GS, rainfall increased from 328 mm in 2023 to 391 mm in 2024, with 2023 characterized by a pronounced dry period in July–August, whereas precipitation in 2024 was more evenly distributed.
SWC reflected the precipitation pattern, with reduced values during the dry period of 2023 and consistently higher, more stable levels (∼ 0.4 m3 m−3) during GS 2024. Lower winter SWC in both years was associated with soil freezing, consistent with Ts values near 0 °C.
The WL fluctuated between approximately −0.5 and −0.9 m through most of the study period, close to the subterranean channel depth of −0.6 m (Fig. 3f). During GS 2023 the mean WL was −0.88 m, while GS 2024 showed a shallower mean of −0.73 m, indicating that the GS WL was on average about 17 % higher in 2024. The deepest drawdowns occurred in late GS of 2023, reaching approximately −1.1 m, while the deepest drawdowns in 2024 was only −0.86 m.
Overall, 2023 was warmer and drier compared to 2024, which was colder and had more precipitation especially during GS.
3.3 Data quality, gap filling, and partitioning
In EBC evaluation, linear regression of half-hourly H + LE against Rn − G yielded a slope of 0.79 and an intercept of 2.68 W m−2 in 2023 and a slope of 0.74 and an intercept of 2.25 W m−2 in 2024, indicating reasonable EBC within the expected range for peatland and wetland ecosystems (Wilson et al., 2002).
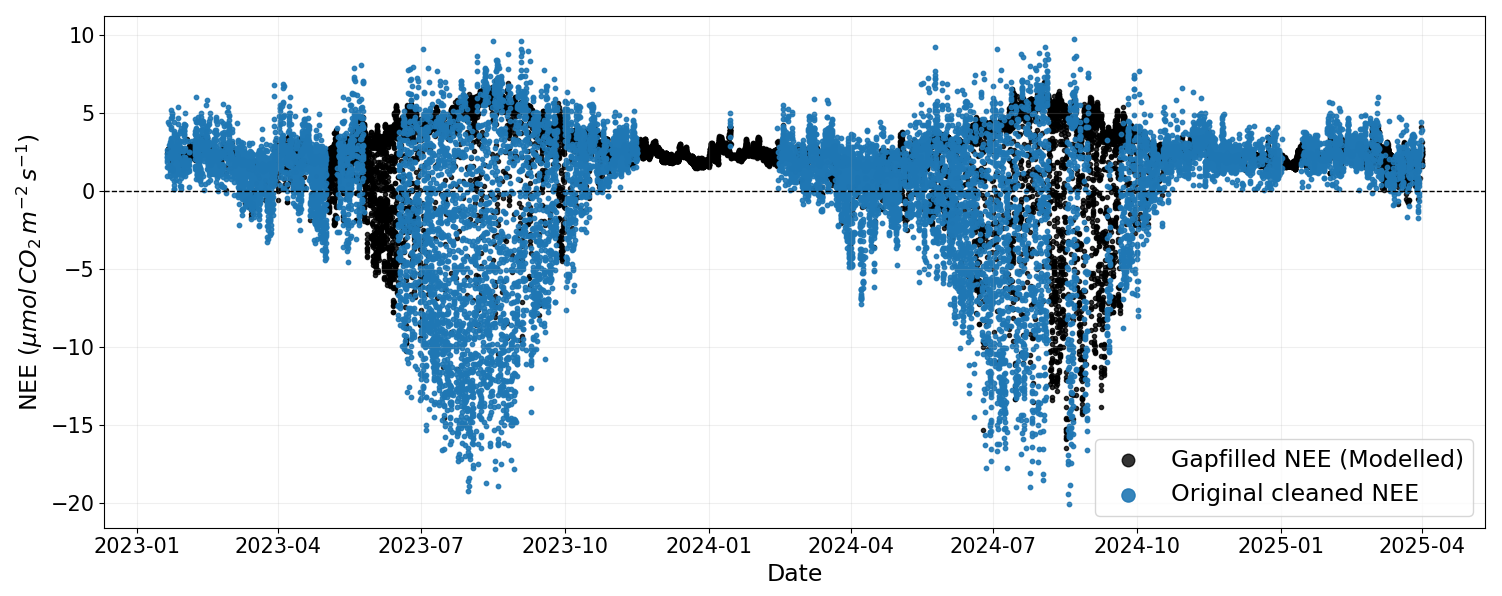
Figure 4Time series of measured and gap-filled CO2 flux (Net Ecosystem Exchange, NEE) at the LD site (unmanaged drained peatland) in W-Iceland from January 2023 to April 2025. The data includes the original quality-controlled observations (blue) and the continuous record reconstructed using the hybrid MDS-XGBoost gap-filling approach (black).
The final gap-filled time series (Fig. 4) combined accepted MDS estimates with XGBoost predictions, producing a smooth and internally consistent NEE dataset. Model evaluation demonstrated strong predictive performance, with R2 values of 0.8 for MDS model and 0.91 for XGBoost, and RMSE below 1.36 , highlighting the high level of agreement between predicted and observed fluxes. Based on SHAP values, radiation and thermal variables emerged as the primary contributors, while seasonal and diurnal temporal indicators were additionally used by the model to capture systematic patterns in ecosystem exchange not fully resolved by meteorological drivers alone. A detailed breakdown of XGBoost feature attribution based on SHAP values is provided in Appendix B.
The gap-filled NEE was partitioned into flux components (Reco and GPP). Evaluation metrics showed an acceptable model fit, yielding an R2 of 0.59 and an RMSE of 0.913 (see Appendix B for the complete SHAP value analysis). These continuous NEE, GPP and Reco data provided a robust foundation for analyzing seasonal dynamics and annual carbon budgets.
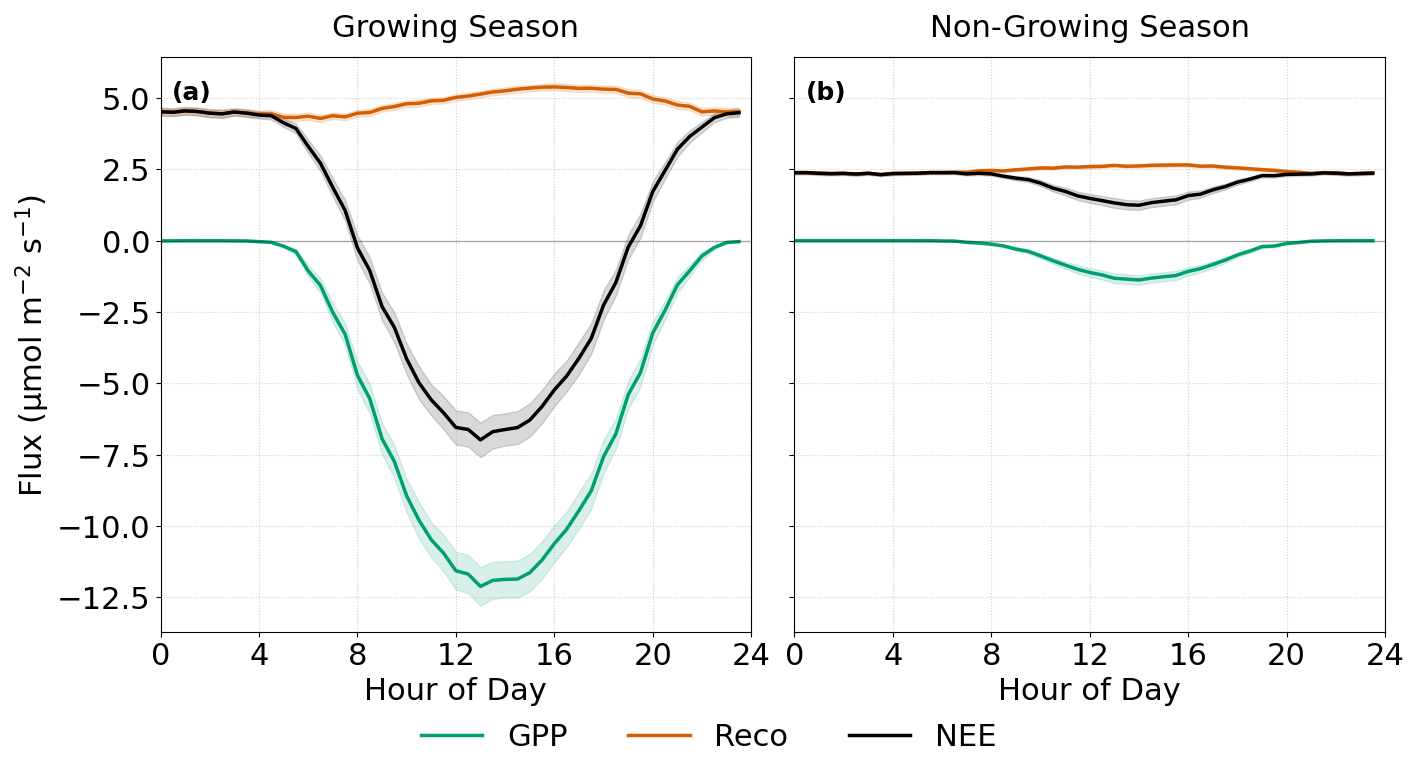
Figure 5Mean diurnal cycles of carbon flux components at the LD site (unmanaged drained peatland) in W-Iceland (2023–2024 data). Diurnal patterns of net ecosystem exchange (NEE), gross primary production (GPP), and ecosystem respiration (Reco) are shown for (a) the growing season (GS) and (b) the non-growing season (NGS). Shaded areas represent the 95 % confidence intervals.
3.4 Diurnal NEE, GPP and Reco
As expected, the average diurnal cycle of CO2 fluxes showed a clear seasonal contrast, reflecting the interplay between seasonal light availability, temperature, and phenological state (Fig. 5). During GS, the ecosystem acted as a strong daytime carbon sink, with NEE and GPP exhibiting synchronized diurnal patterns. Peak GPP uptake and maximum NEE sequestration occurred at 13:00 GMT, reaching −12.1 and −6.9 , respectively, close to local solar noon. In contrast, Reco peaked later at 16:00 GMT (5.4 ), reflecting thermal inertia and the delayed response to peak air and soil temperatures. The broad “shoulders” of the GPP curve indicate extended photosynthetic activity during long twilight periods at this high-latitude site.
In contrast, during the NGS, photosynthetic activity was strongly suppressed, and the ecosystem functioned as a persistent CO2 source (Fig. 5). GPP remained low, with a maximum uptake of −1.4 (≈ 10 % of GS peak), while Reco exceeded GPP throughout the day, resulting in consistently positive NEE values, peaking at 1.2 around midday. Although the diurnal amplitude of Reco was reduced compared to the GS, it still showed a cycle, with maximum values of 2.7 (∼ 50 % of GS peak). The sustained positive NEE during the extended NGS highlights the significant contribution of winter CO2 emissions to the annual carbon balance.
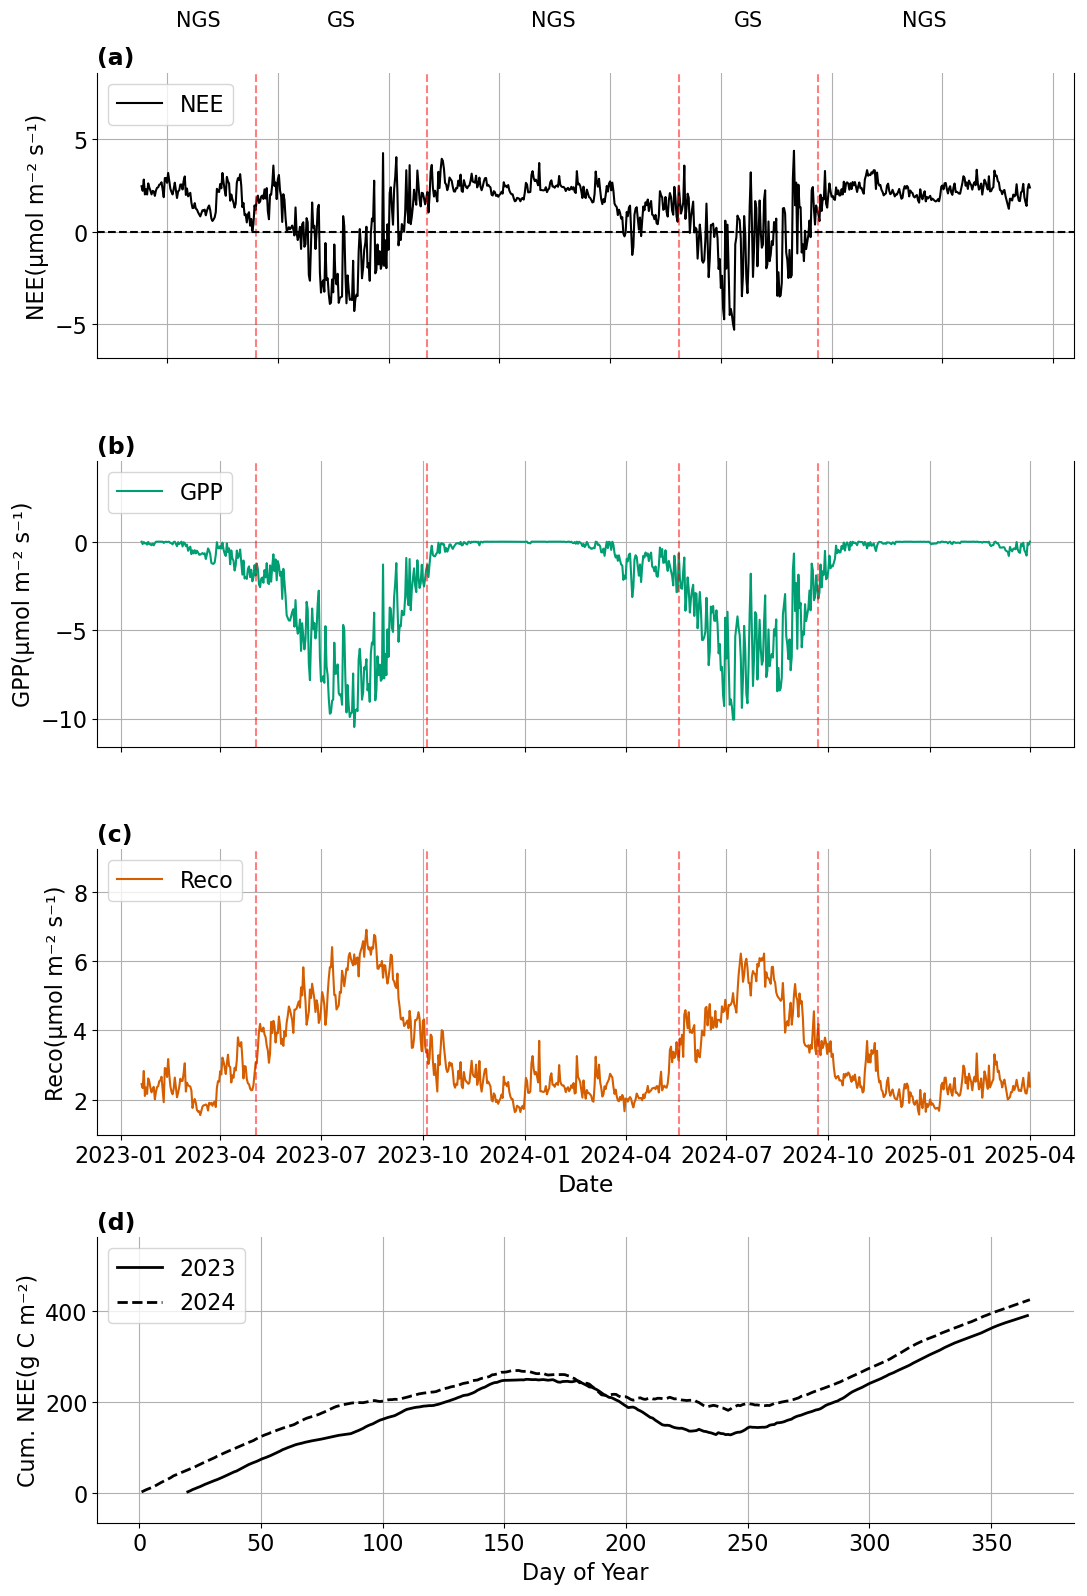
Figure 6Daily time series of net ecosystem exchange (NEE), gross primary production (GPP), and ecosystem respiration (Reco), over the study period (January 2023 to April 2025) and cumulative sum of NEE for 2023 and 2024 at the LD site (unmanaged, drained peatland) in W-Iceland. Negative cumulative NEE values show a net carbon sink, while positive values indicate a net carbon source. Vertical red dashed lines show the growing season (GS) and non-growing season (NGS) periods.
3.5 Seasonal NEE, GPP and Reco
The daily NEE time series showed that the unmanaged drained grassland acted as a net CO2 source during most of the year (Fig. 6a). During the NGS, NEE remained positive, fluctuating around 2 , indicating continuous CO2 release under the long, cold and light-limited conditions. With the onset of the GS, increasing temperature and PAR drove NEE toward negative values, reflecting net carbon uptake. The strongest sink strength was observed in July (∼ −4 ), corresponding to peak photosynthetic activity.
GPP showed particularly strong seasonality (Fig. 6b). Photosynthetic uptake started to increase sharply in May and peaked around −10 during July. The decline in late September was also rapid, marking the end of active vegetation growth under sharply shortening day length at high latitude.
Reco followed a similarly clear seasonal pattern (Fig. 6c). Reco increased rapidly in late spring (May), reached peak values of 6–7 around August, and declined gradually during autumn (late September). Winter respiration generally remained relatively high, (∼ 2 ), occasionally falling below 1 , but never ceasing entirely.
Despite a mid-season reduction in cumulative NEE reflecting temporary carbon uptake, emissions during the NGS dominated the annual balance (Fig. 6d). The consistently increasing cumulative NEE in both years confirms the system as a persistent net CO2 source, with slightly higher total emissions observed in 2024. Overall, these flux patterns revealed an ecosystem characterized by intense but short summer CO2 uptake on one hand, and continuous and substantial winter respiration on the other hand.
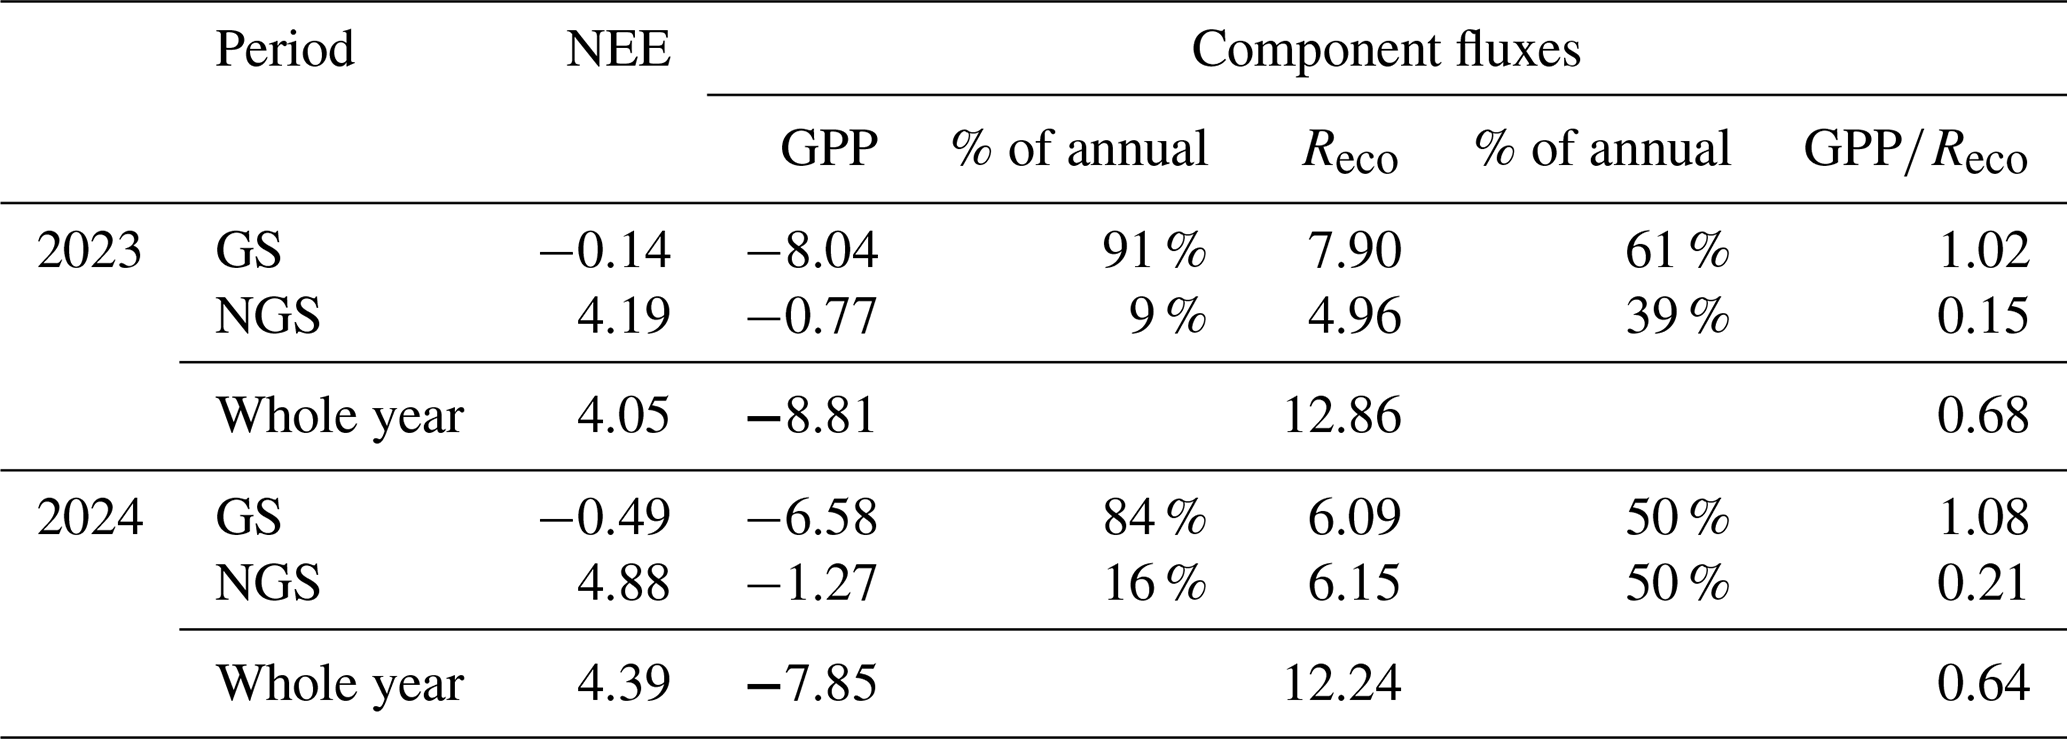
Table 3Annual and seasonal carbon budgets for net ecosystem exchange (NEE), gross primary production (GPP), and ecosystem respiration (Reco) in t CO2-C ha−1 at the LD site (unmanaged drained peatland) in W-Iceland during 2023 and 2024, partitioned into the growing season (GS), non-growing season (NGS), and the full calendar years. The GS duration was 156 d in 2023 and 127 d in 2024, while the NGS lasted 190 d in 2023 and 239 d in 2024.
3.6 Carbon budgets
The annual net C-budget (NEE) was surprisingly similar between the 2 years (Table 3), showing the drained unmanaged peatland being a C source to the atmosphere of 4.1 and 4.4 in 2023 and 2024, respectively (approximately an 8 % difference). All the net seasonal CO2-C loss from the unmanaged drained peatland occurred during the NGS, as the GSs were small sinks in both years.
When comparing the seasonal NEE budget between the 2 years, it should be noted that the NGS was shorter in 2023 than in 2024 (55 % versus 65 % of the year, respectively). The NGS NEE-sum was correspondingly lower in 2023 (Table 3). The GS NEE-sum was also less negative in 2023, when the seasonal temperature variation included a larger part of the late season within the defined GS.
The component fluxes (GPP and Reco) provided further insight into these annual patterns. The annual GPP was 11 % higher in 2023, which benefited from a longer GS, but the annual Reco was only 5 % higher in 2023 compared to 2024. The higher ratio in 2023 than in 2024 resulted in the site being a smaller net CO2 source in 2023 (Table 3).
While most of the GPP fluxes occurred during the defined GS, the Reco showed a more modest intra-annual variability, with an average of 39 % and 50 % of seasonal emissions occurring during the NGS in 2023 and 2024, respectively (Table 3). Consequently, in both years nearly half of the annual respiratory CO2 release occurred outside the GS. The average annual Reco-sum (12.6 ) was approximately 3 times larger than the average NEE-sum (4.2 ), showing the relative importance of the annual GPP in the site's C-balance (Table 3).
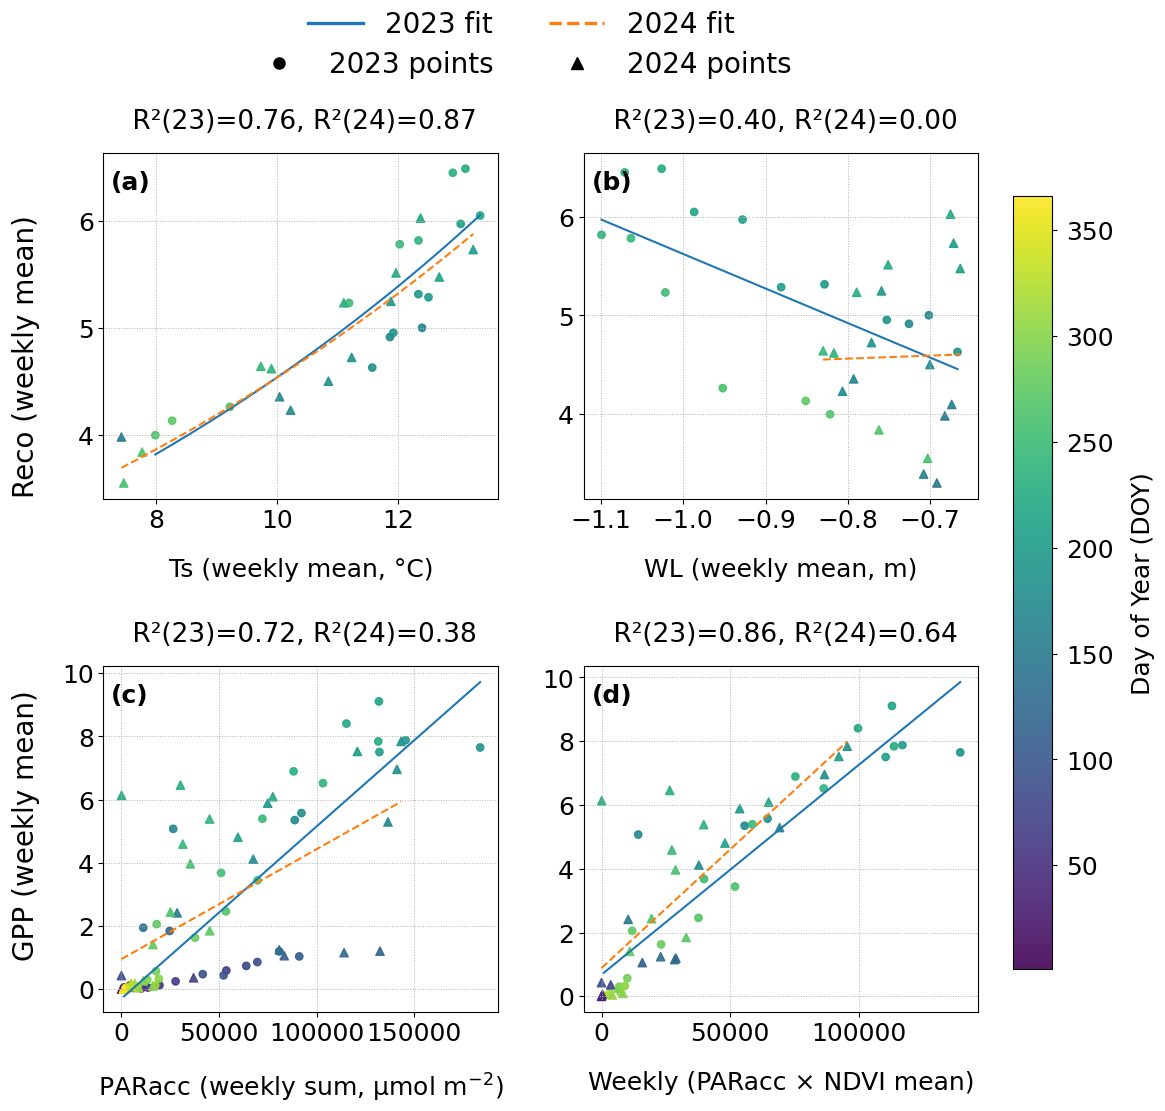
Figure 7Environmental drivers of carbon fluxes at the LD site (unmanaged drained peatland) in W-Iceland. Relationships are between weekly aggregated fluxes and biophysical drivers for 2023 and 2024 using non gap-filled data. (a) Weekly average ecosystem respiration (Reco; ) versus average soil temperature at 10 cm (Ts; °C) and (b) Reco versus water level (WL; m), both restricted to the growing season (GS) due to Ts and WL winter data gaps in 2023. (c) Gross primary production (GPP; ) versus accumulated photosynthetically active radiation (PARacc; µmol m−2) and (d) GPP versus the weekly radiation–vegetation product (Accumulative PAR × NDVI), both using full annual data.
3.7 Environmental controls on CO2 exchange
To explain the relatively small interannual differences in NEE despite contrasting weather conditions (2023 being warmer and drier while 2024 was colder and wetter), weekly aggregated Reco and GPP values were related to measured environmental drivers (Fig. 7). For Ts and WL, the analysis was restricted to observed GS data to ensure comparability between years, as winter data were unavailable for 2023. Conversely, for PAR and NDVI, the full annual dataset was used to capture the complete seasonal development of the radiation-use efficiency of the canopy.
Weekly Reco consistently followed a similar exponential temperature-response curve in both years relative to Ts (Fig. 7a; Q10 values of 2.37 in 2023 and 2.23 in 2024). While the range of weekly temperatures was also relatively similar across both years, 2024 experienced more weeks with lower Ts and fewer peak-temperature weeks compared to 2023 (Fig. 7a). This difference in frequency of high-temperature weeks primarily explained why Reco was significantly higher in 2023 (annual median Reco of 4.087 in 2023 and 2.751 in 2024; Mann–Whitney U test, p < 0.0001). Additionally, a significant negative relationship between WL and Reco was observed in 2023 (R2 = 0.40, p = 0.009), whereas no such relationship existed in 2024 (R2 = 0.00, p = 0.934) (Fig. 7b). Consequently, the higher cumulative Reco in 2023 was also driven, to a lesser extent, by the lower WL, which increased the peat volume exposed to aerobic microbial decomposition.
Weekly GPP reached higher peak values in 2023 compared to 2024 (Fig. 7c). PARacc alone explained 72 % of the variation in GPP during 2023 but only 38 % in 2024, where several weeks exhibited a low GPP:PARacc ratio following a delayed start to the GS. However, when GPP was plotted against the PARacc × NDVI product, the relationships for both years converged and explanatory power increased to 86 % and 64 % for 2023 and 2024, respectively (Fig. 7d). 2023 included several weeks with higher PARacc × NDVI values than any observed in 2024. Further relationships between the Reco and GPP with other environmental variables are provided in Appendix C.
4.1 Net annual C balance
The present study site is broadly representative of unmanaged drained peatlands in Iceland, where drainage commonly leads to a shift from wetland vegetation toward graminoid-dominated grassland communities, often influenced by land use such as grazing (Arnalds et al., 2016a). These systems are classified as “Grassland on organic soil” in the Icelandic National Inventory Report (Umhverfisstofnun, 2023) and cover approximately 4200 km2.
The results show that the drained unmanaged peatland remained a consistent net CO2 source despite different environmental conditions between 2023 (warmer and drier) and 2024 (colder and wetter), with a mean annual loss of 4.2 (Table 3). This value was 26 % lower than the IPCC (2014) default boreal EF of 5.7 that is currently used in Iceland's national reporting for unmanaged drained peatlands (Umhverfisstofnun, 2025). It is, however, notably similar to the 3.8 ± 0.65 that was obtained by chamber measurements on unmanaged drained peatland in western Iceland (Ólafsdóttir, 2015). Further, it is a similar value to estimated mean soil organic matter losses of approximately 4 in a regional study using chamber point measurements and NDVI-driven upscaling on similar seven unmanaged drained sites in W-Iceland (Guðmundsson et al., 2026). The obtained CO2-C loss in the present study is, however, higher than the mean annual loss estimated from the peat-stock change method in eight paired undrained and drained site-pairs in southern Iceland, which found on average annual topsoil loss of 1.7 t CO2-C ha−1 during 15–50 years of draining (Gunnarsdóttir, 2017). However, in that study a 1500 AD ash layer at 17–30 cm depth in the peat profile was used for the stock-change estimates, which may have underestimated the total CO2 loss from the whole drained peat profile as the WLs were generally lower.
Despite the similar NEE observed in this study compared to other measurements on drained peatlands in Iceland, the annual GPP (−7.85 to −8.8 t CO2-C ha−1) and Reco (12.2 to 12.7 t CO2-C ha−1) observed here were somewhat higher than most chamber-based estimates from other Icelandic drained sites (GPP: −4.3 to −7.4 t CO2-C ha−1 and Reco: 7.19 to 12.3 t CO2-C ha−1) (Guðmundsson et al., 2026; Ólafsdóttir, 2015), likely reflecting the broader spatial footprint and continuous temporal coverage of the EC method.
One pertinent question is whether the 60-year duration since initial drainage contributes to the lower CO2 emissions observed compared to the IPCC (2014) default EF. There is currently a general lack of long-term monitoring studies evaluating how long high CO2-C emissions are sustained post-drainage (Qiu et al., 2021). Truskavetskii (2014) demonstrated that the loss of peat organic matter in croplands was linear during the first 45 years following drainage, excluding enhanced losses during the initial 7-years period. Studies extending beyond 50 years have primarily focused on how decadal peat subsidence may reduce effective drainage (WL) over time, leading to decreasing rates of organic matter loss as the peat column compacts (Rojstaczer and Deverel, 1993; Liu et al., 2026). Evans et al. (2021) analyzed CO2 flux measurements from 16 EC towers on drained peatlands across the UK and concluded that mean annual effective WL represents the overwhelmingly dominant control on CO2 fluxes.
Given that the subsidence at the present study site was only −0.16 m since the onset of drainage (Streeper, 2026), and the present WL generally remained deep (mainly between −0.5 and −0.7 m), the age of the drainage (60 years) is unlikely to be the primary explanation for the lower CO2-C losses relative to the IPCC (2014) default EF for the boreal zone. Furthermore, both Gunnarsdóttir (2017) and Guðmundsson et al. (2026) investigated multiple drained peatland sites in Iceland using stock change and repeated chamber flux methods, respectively. They observed considerable variation in annual CO2-C losses among sites that was not correlated with the age of drainage. Consequently, it is recommended that for future assessments of unmanaged drained peatlands, sites should be classified by their effective annual WL rather than the time that has elapsed since drainage.
4.2 Winter fluxes
The annual CO2-C balance of the unmanaged drained peatland was strongly influenced by NGS emissions, which accounted for 39 % and 50 % of the annual Reco in 2023 and 2024, respectively. Notably, positive NEE occurred only during the NGS in both years, which turned the study site into an annual C source. For comparison, Alm et al. (1999) found that winter (November-May) CO2-C losses accounted for 23 % and 21 % of annual totals in undisturbed and drained peatlands, respectively, at latitudes of 62–65° N in Finland using a closed chamber method. In another study Tikkasalo et al. (2025) found by EC measurements over a drained peatland forest in southern Finland (latitude of 61° N), that only 28 % of the positive NEE was released during the winter season. Although the exact timing of NGS defined in the present study (October–April) differed from these reference studies (November–May), the duration was the same. This comparison suggests that the proportion of NGS CO2 flux relative to the annual flux is higher in the present study than other studies on drained peatlands at similar latitudes in Fenno-Scandia. Climatic shifts in these continental regions are most evident during the winter, a season that has warmed markedly over the past 30 years and is projected to experience the greatest degree of warming through the end of the century (Lind et al., 2023). Recent evidence suggests that the C balance of drained peatlands in Finland has already shifted toward becoming a larger CO2 source over the last three decades, due to warmer (winter) climates (Alm et al., 2023). In this context, Iceland may serve as a pertinent case study, illustrating how increasingly mild winters are likely to impact the annual C balance of drained peatlands at similar latitudes globally.
4.3 Environmental controls on CO2 fluxes
The year 2023 was an extreme weather year at the field site, characterized by the coldest winter since 1995, followed by an unusually warm and dry summer (including the driest July since the 1860s) and a warm autumn (Icelandic Meteorological Office, 2025a). The 2024 winter was also among the coldest on record but was followed by an unusually wet and cold summer (the coldest since 1998) and autumn (Icelandic Meteorological Office, 2025b). Despite these contrasting meteorological conditions between 2023 (drier and warmer) and 2024 (wetter and colder), the annual CO2-C balance remained surprisingly similar across both years (Table 3). The stabilizing mechanism that appears to have balanced the enhanced CO2 fluxes during the warm 2023 was a strong positive response in the productivity of the unmanaged grassland vegetation. This was reflected in higher PARacc × NDVI (indicating enhanced canopy development and higher irradiance) and elevated GPP values during a 6-week window of the relatively short GS (Fig. 7d). Although Reco was significantly higher in 2023 due to higher temperatures and reduced precipitation, which led to lower WL and greater peat exposure to aerobic microbial decomposition, the enhanced GPP largely offset this increase. Consequently, the annual NEE remained consistent across both years. High covariance between Reco and GPP which led to small interannual differences in NEE has been observed in other studies (Wohlfahrt et al., 2008). Previous research has shown that the NEE of drained peatlands can be relatively stable (e.g. Wilson et al., 2016), while other studies have highlighted significant interannual variability in NEE (e.g. Bubier et al., 2003). These differences in results often depend on whether interannual driving factors consistently stimulate both C uptake and release, or primarily influence only one side of the C balance.
Unmanaged grasslands at high latitudes, particularly in Iceland, have shown a robust positive response to warming, characterized by significant increases in biomass production and NDVI (Elmendorf et al., 2012; Mortier et al., 2024). This trend has also been noted for the country as a whole as MAT has increased since the 1980s (Raynolds et al., 2015). Such a strong positive relationship between GPP (or NDVI) and temperature is not unexpected at the northern limits of the boreal/Subarctic zone, particularly where water availability or biotic factors, such as high grazing pressure, do not limit aboveground biomass.
The summer drought in 2023 resulted in a significant drawdown of WL; however, no apparent negative drought response was observed in either GPP or Reco. In fact, Reco showed a significantly enhanced response to the lower WL and higher Ts. This aligns with findings from 16 EC towers on drained peatlands across the UK (Evans et al., 2021), which concluded that mean annual effective water-table depth represents the overwhelmingly dominant control on CO2 fluxes in these ecosystems. In the present study, however, the effect of lower WL was relatively small compared to the direct Ts effect on Reco.
The present study showed that the drained Icelandic unmanaged peatland consistently released CO2 to the atmosphere, with annual C loss being 26 % less than the IPCC (2014) default EF for drained grasslands in the northern boreal zone. The CO2-C loss was driven by relatively high respiration fluxes outside the growing season rather than by differences in summer productivity and CO2 emissions. Despite the clear contrast between a dry, warm year (2023) and a cool, wet year (2024), the overall carbon balance remained remarkably similar. This stability reflects the distinctive ecological setting of Icelandic peatlands: mild maritime winters that only partly inhibit microbial respiration, and cool summer climate where warm summers can greatly enhance vegetation growth and the growing season GPP. Together, these findings highlight the Icelandic peatlands function differently from many boreal or continental peatlands, where severe winters suppress respiration. As such, accurate carbon budgets for Icelandic sites require year-round flux measurements. The results also highlight the need for restoration measures that target reductions in non-growing-season respiration if long-term CO2 losses from drained peatlands are to be mitigated.
To ensure the EFOY fuel cell would not interfere with the EC system, its location was carefully selected based on the site's prevailing wind directions. As confirmed by the drone imagery (Fig. A1a), the fuel cell was positioned to the NW of the EC system, a sector from which the wind rarely blows. This strategic placement successfully mitigates potential CO2 pollution from the device, a conclusion supported by the 2023–2024 dataset (Fig. A1b) demonstrating minimal atmospheric CO2 concentration originating from the NW sector. Furthermore, this lack of interference is further supported by isolating data from the NGS of 2023 and 2024 (Fig. A1c), which consistently shows that CO2 contributions from the NW remain negligible throughout the year.
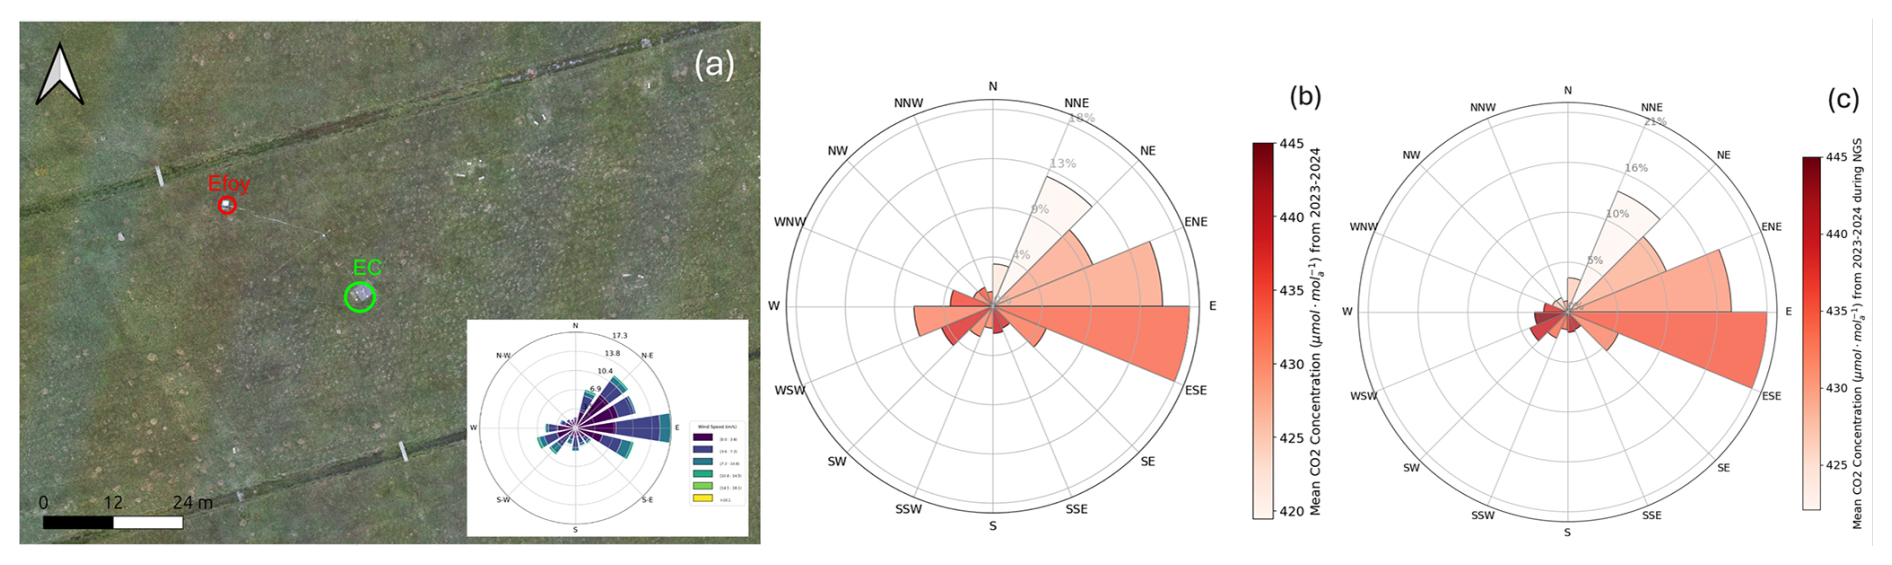
Figure A1Assessment of EFOY fuel cell placement and potential CO2 interference. (a) Location of the EFOY fuel cell situated to the northwest (NW) of the Eddy Covariance system at the LD site (unmanaged drained peatland) in W-Iceland. (b) Atmospheric CO2 concentrations originating from different wind sectors during the full 2023–2024 period. (c) CO2 concentrations from different wind sectors isolated to the non-growing seasons in 2023 and 2024.
Figure B1 shows the global feature attribution of the NEE gap-filling model, quantified using mean absolute SHAP values. This metric summarizes the relative importance of each predictor in explaining the variability of the CO2 flux residuals, where larger values indicate a stronger influence on the model's predictions. PAR emerged as the dominant predictor, reflecting its primary role in controlling photosynthetic uptake during the growing season. The high ranking of seasonal (sin_doy) and diurnal (cos_hour, sin_hour) harmonic transforms shows that the model captures recurring phenological and diurnal patterns in ecosystem exchange that are not fully resolved by instantaneous meteorological variables alone. Furthermore, the moderate importance of Ts and Ta highlights the underlying control of the thermal regime on ecosystem respiration, while the relatively low contribution of VPD suggests that atmospheric moisture demand was a secondary driver of flux variability at this high-latitude site during the study period.
Figure B2 shows the global feature attribution of the Reco model, quantified using mean absolute SHAP values. Ts emerged as the dominant predictor, confirming the primary control of soil thermal conditions on respiration processes at this site. The importance of Ta and the seasonal harmonic transform (sin_doy) further highlighted the model's ability to capture broader thermal regimes and phenological cycles. SWC showed moderate importance, reflecting its secondary but still meaningful role in modulating respiration. In contrast, the low contribution of VPD and diurnal proxies (cos_hour, sin_hour) suggested that atmospheric moisture demand and high-frequency hourly variability were minor drivers of respiration compared to soil temperature and seasonal dynamics.
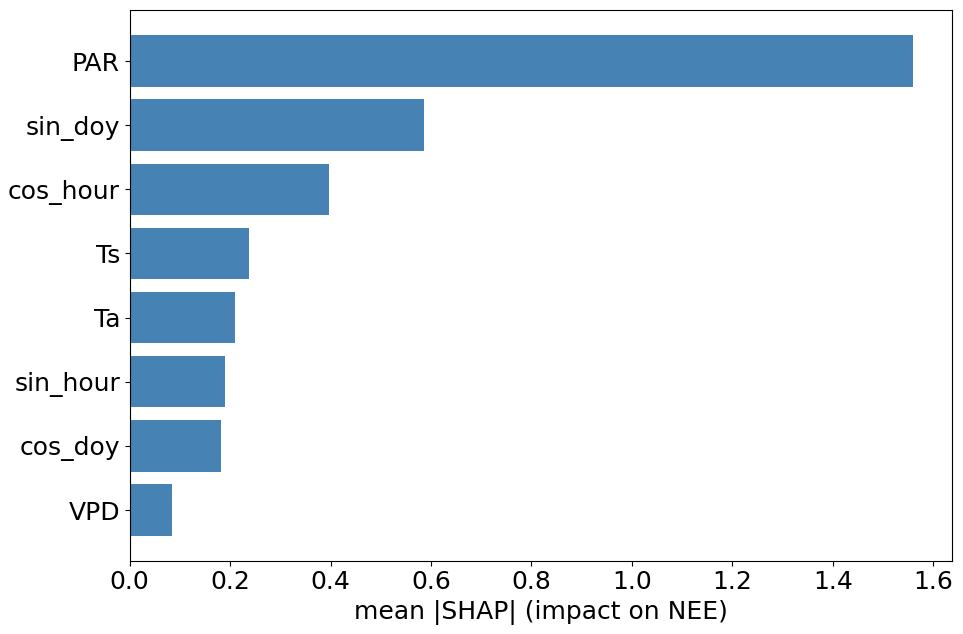
Figure B1Mean absolute SHAP values for the XGBoost CO2 flux gap-filling model applied to data from LD site (unmanaged, drained peatland) in W-Iceland during 2023–2025, showing the relative importance of each predictor. The results show that photosynthetically active radiation (PAR) is a strong predictor. Seasonal and diurnal harmonic proxies (sin_doy, cos_hour) and thermal variables (Ts, Ta) exhibit moderate importance, while vapor pressure deficit (VPD) contributes the least to the predicted flux variability.
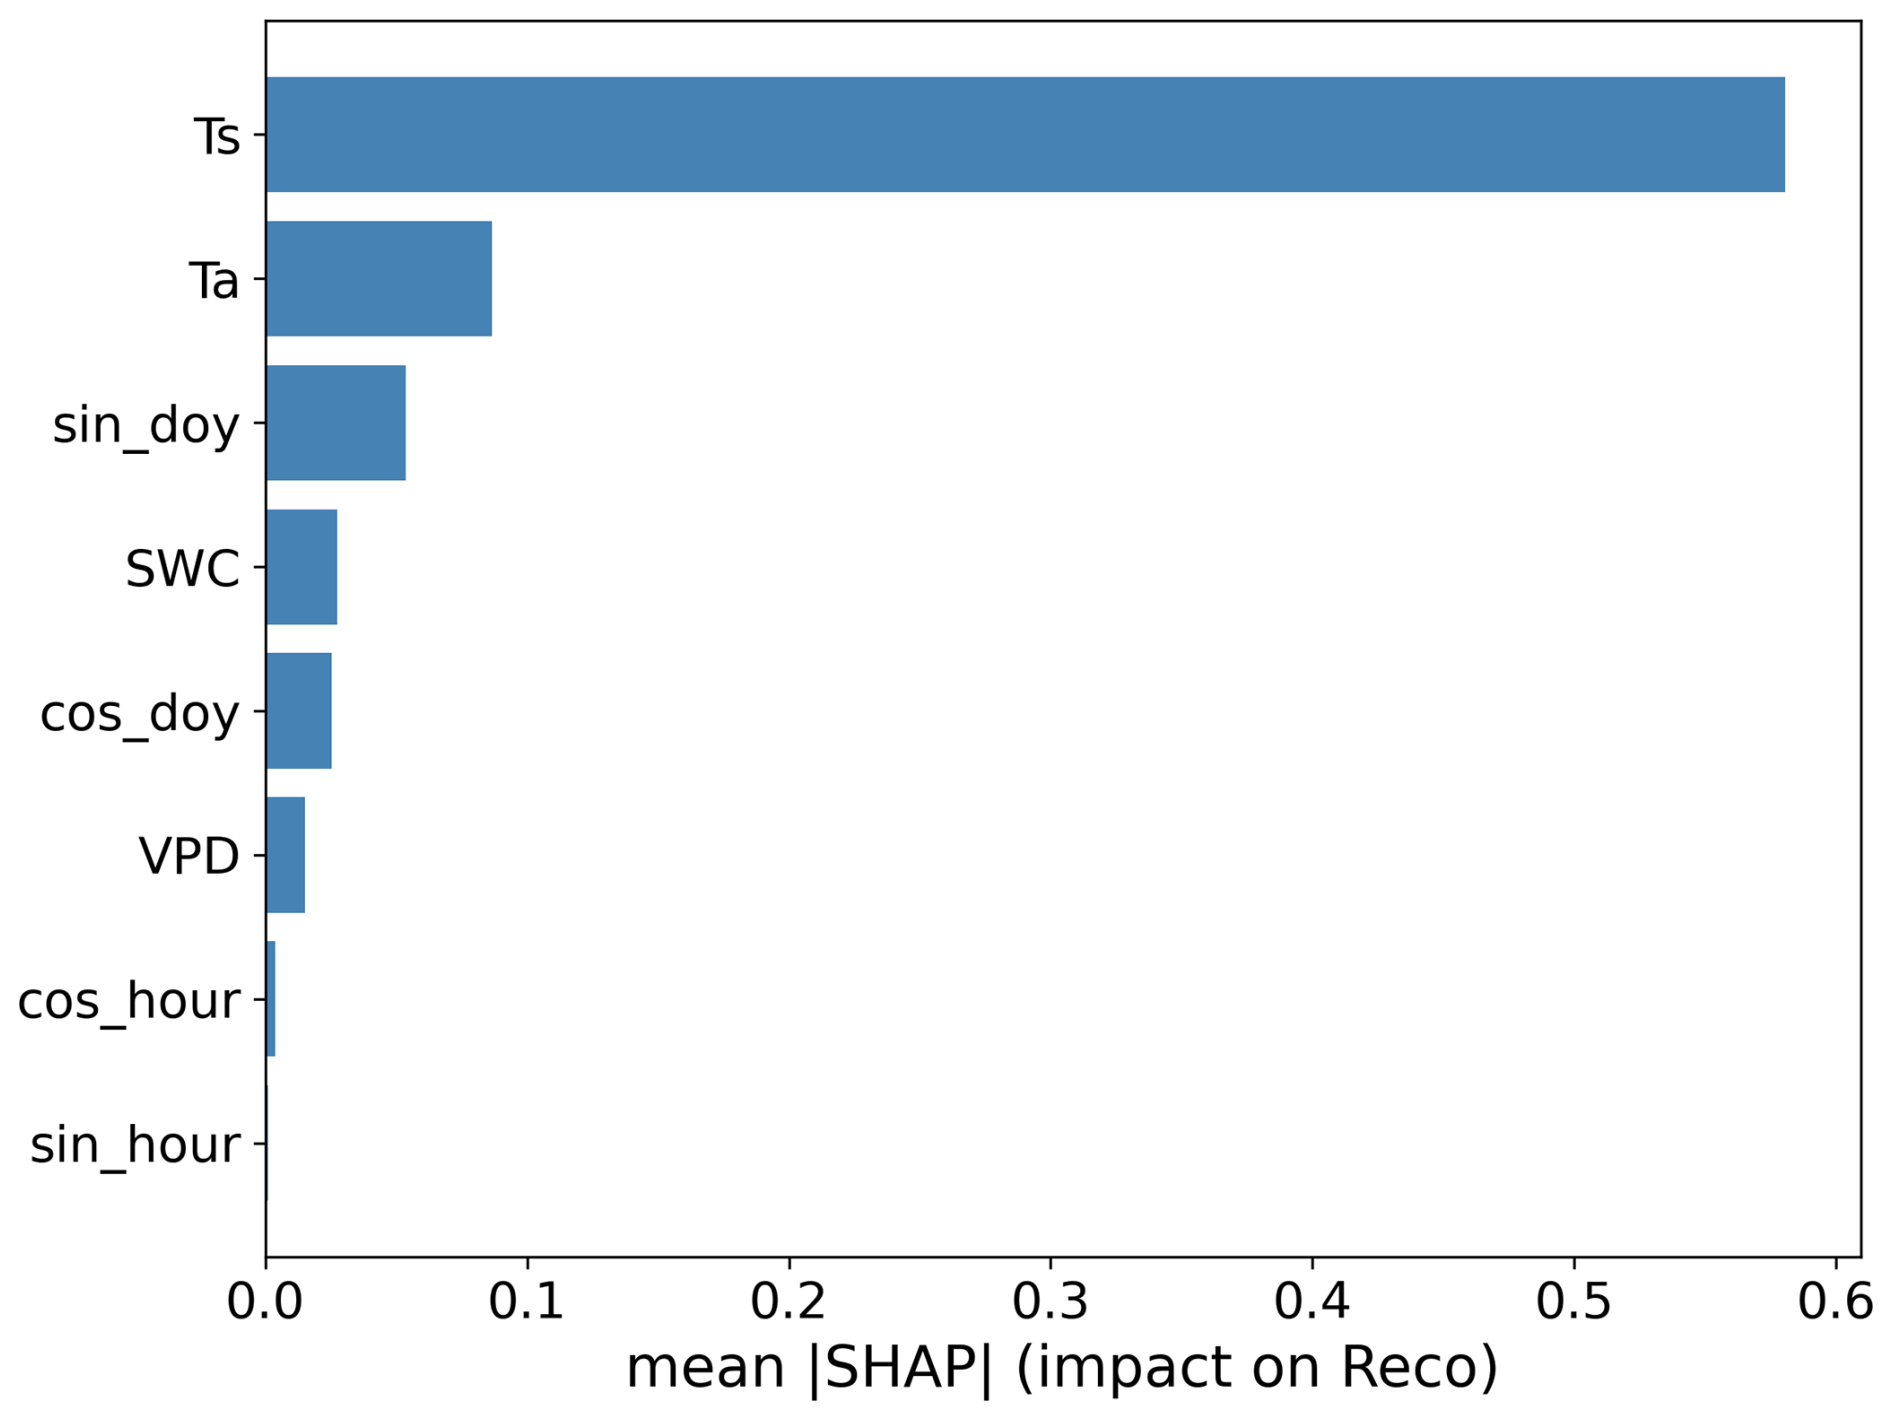
Figure B2Mean absolute SHAP values for the ecosystem respiration (Reco) model applied to data from the LD site (unmanaged, drained peatland) in W-Iceland during 2023–2025, showing the relative importance of each predictor. The results indicate that soil temperature (Ts) is the strongest predictor of respiration. Air temperature (Ta) and seasonal proxies (sin_doy) exhibit moderate importance, followed by soil water content (SWC). Diurnal harmonic transforms and vapor pressure deficit (VPD) contribute the least to the predicted respiration variability.
Figure C1 shows the relationships between various environmental drivers and NEE components (Reco and GPP) calculated as weekly means for the 2023 and 2024 periods using observed (non-gap filled) data. In 2023, Reco had significant negative relationships with SWC (R2 = 0.48, p = 0.0029), whereas in 2024, this relationship was statistically non-significant (R2 = 0.06, p = 0.36). A distinct negative relationship was observed between Reco and VPD in 2023 (R2 = 0.28, p = 0.016), while no relationship was found in 2024 (R2 = 0.00, p = 0.85). Furthermore, the relationship between R2 and NDVI was strong in both years (p < 0.0001), though it was stronger in 2023 (R2 = 0.88) than in 2024 (R2 = 0.70).
GPP showed a higher sensitivity to Ts in 2023 (R2 = 0.79, p < 0.0001) compared to 2024 (R2 = 0.61, p = 0.0006). In contrast, GPP exhibited a significant positive relationship with VPD in 2024 (R2 = 0.17, p = 0.0041), while the relationship remained non-significant in 2023 (R2 = 0.03, p = 0.2676). The relationship between GPP and SWC remained statistically non-significant in both years (p > 0.05). Overall, 2023 was characterized by stronger relationships with hydrological and thermal drivers, while 2024 showed more moderate relationships across most secondary environmental variables.
Figure C2 shows overall relationships between observed environmental drivers and NEE components (Reco and GPP) calculated as weekly means for the combined 2023–2024 dataset, quantified using Pearson correlation analysis. Ts showed the strongest correlations across all flux components, with a near-perfect positive correlation with Reco (r = 0.96) and a very strong correlation with GPP (r = 0.91). PAR and Ta were also highly correlated with carbon fluxes (p < 0.001). NDVI shows strong correlations with both GPP (r = 0.75) and Reco (r = 0.82). WL displays a significant but more moderate correlation with Reco (p < 0.001). VPD and SWC show non-significant correlations at the weekly timescale.
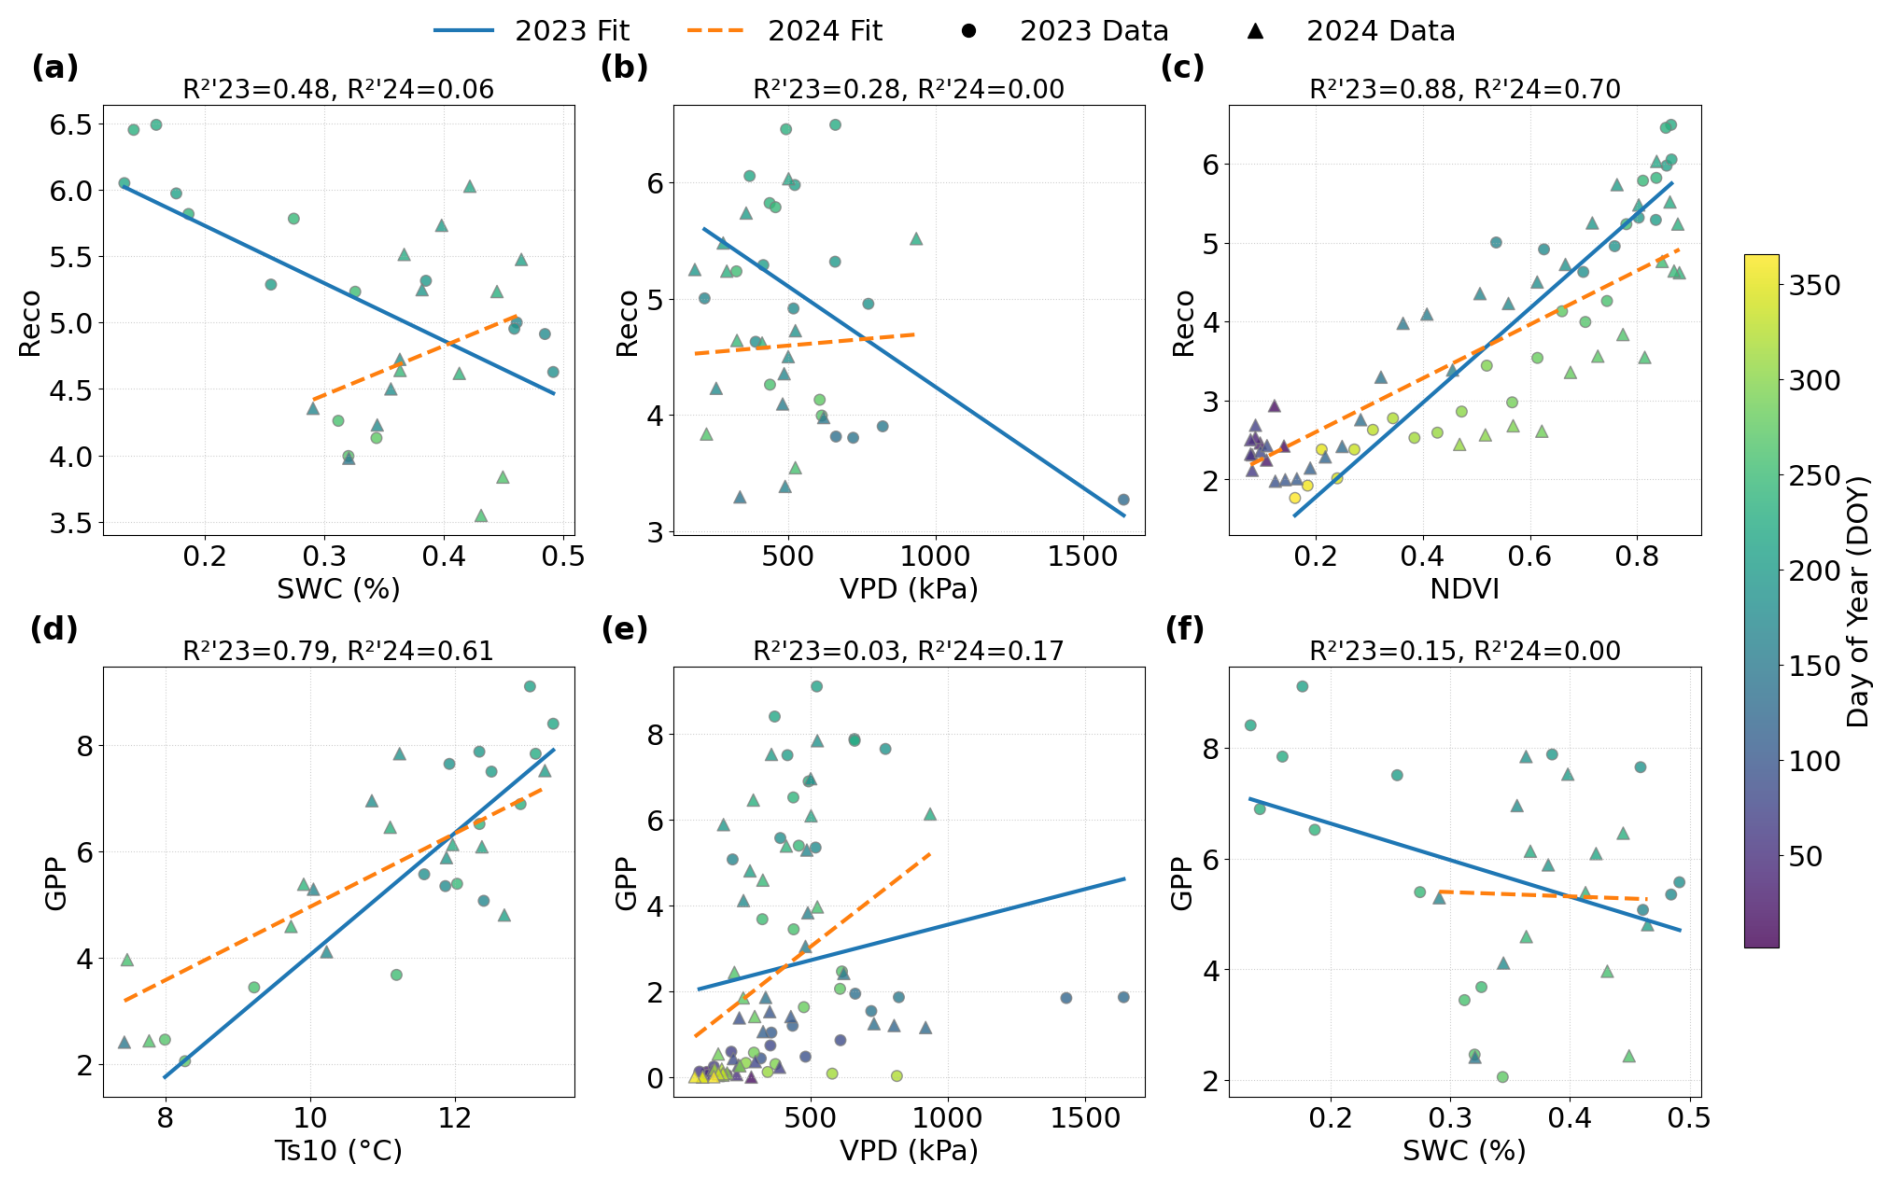
Figure C1Environmental drivers of carbon fluxes at the LD site (unmanaged drained peatland) in W-Iceland. Relationships are between weekly aggregated fluxes and biophysical drivers for 2023 and 2024. (a) Weekly average ecosystem respiration (Reco; ) versus soil water content at 10 cm depth (SWC; m3 m−3), (b) Reco versus vapor pressure deficit (VPD; kPa), (c) Reco versus normalized difference vegetation index (NDVI), (d) Gross primary productivity (GPP; ) versus soil temperature at 10 cm depth (Ts10; °C), (e) GPP versus VPD, (f) GPP versus SWC. The plots involving Ts or SWC are based on measured growing season (GS) data due to data gaps during the non-growing season (NGS), whereas all other plots use measured data from the full annual cycle.
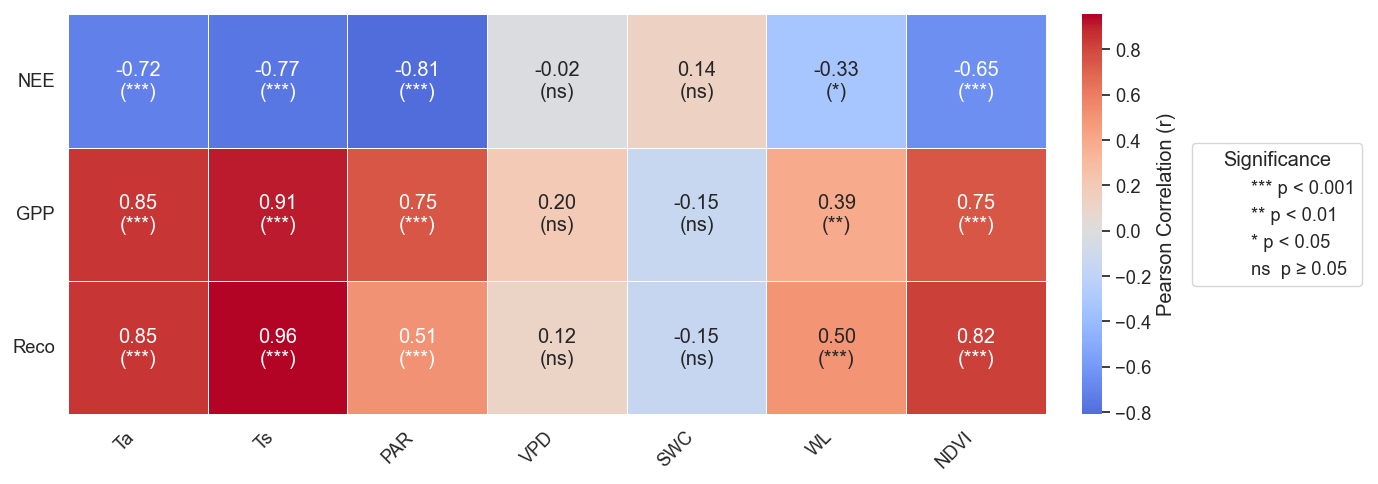
Figure C2Pearson correlation matrix (r) between observed weekly environmental drivers such as air temperature (Ta; °C), soil temperature (Ts; °C), photosynthetically active radiation (PAR; ), vapor pressure deficit (VPD; hPa), precipitation (Rain; mm), soil water content (SWC; m3 m−3), and water level (WL; m) and observed (non–gap-filled) CO2 fluxes including net ecosystem exchange (NEE; ), gross primary production (GPP; ), and ecosystem respiration (Reco; ) for the combined 2023–2024 study period at the LD site (unmanaged drained peatland) in W-Iceland. Colores represent the strength and direction of correlations, ranging from blue (negative) to red (positive). Significance levels are shown as follows: p < 0.001, p < 0.01, ∗ p < 0.05, and ns (not significant).
The weekly CO2 fluxes and environmental parameters used in this study are provided as a .csv file in the Supplement. The data processing and gap-filling were partially performed using the REddyProc package in R and were further developed in Python. The custom scripts used for secondary data analysis and figure generation are available from the corresponding author upon request.
The supplement related to this article is available online at https://doi.org/10.5194/bg-23-4011-2026-supplement.
BDS and BB conceptualized and designed the study. AS carried out the field experiments with support from BDS, BB, and HO. AS processed the data, developed the model code, performed the simulations, and analyzed the data. AS prepared the original manuscript draft, with BDS contributing as the primary co-author. All authors reviewed, edited, and approved the final version of the manuscript.
The contact author has declared that none of the authors has any competing interests.
Publisher's note: Copernicus Publications remains neutral with regard to jurisdictional claims made in the text, published maps, institutional affiliations, or any other geographical representation in this paper. The authors bear the ultimate responsibility for providing appropriate place names. Views expressed in the text are those of the authors and do not necessarily reflect the views of the publisher.
The authors would like to thank Svarmi and LOGS companies for their technical support and collaboration. We are grateful to Amir Hamedpour, Alejandro Salazar Villegas and all other individuals who assisted with the fieldwork and data collection. Special thanks are extended to the landowner, Vilhjálmur Ólafsson, for granting access to the site and supporting this research.
The author acknowledges the use of generative AI for technical assistance in Python coding and for refining the linguistic fluency and grammar of the manuscript. The AI-generated suggestions were carefully reviewed and edited by the author, who maintains full responsibility for the scientific content and the final wording of the text.
This research was supported by the Icelandic Research Fund (RANNÍS) under grant number 239948-051 and by the National Power Company of Iceland Research Fund (Orkurannsóknasjóður Landsvirkjunar), grant number NÝR-17 – 2022.
This paper was edited by Clément Duvert and reviewed by Julia Kelly and one anonymous referee.
Alm, J., Saarnio, S., Nykänen, H., Silvola, J., and Martikainen, P.: Winter CO2, CH4 and N2O fluxes on some natural and drained boreal peatlands, Biogeochemistry, 44, 163–186, https://doi.org/10.1007/BF00992977, 1999.
Alm, J., Wall, A., Myllykangas, J.-P., Ojanen, P., Heikkinen, J., Henttonen, H. M., Laiho, R., Minkkinen, K., Tuomainen, T., and Mikola, J.: A new method for estimating carbon dioxide emissions from drained peatland forest soils for the greenhouse gas inventory of Finland, Biogeosciences, 20, 3827–3855, https://doi.org/10.5194/bg-20-3827-2023, 2023.
Arnalds, O.: The Volcanic Aeolian Environments of Iceland, in: The Soils of Iceland, edited by: Arnalds, O., Springer Netherlands, Dordrecht, 139–152, https://doi.org/10.1007/978-94-017-9621-7_11, 2015.
Arnalds, O., Gudmundsson, J., Oskarsson, H., Brink, S. H., and Gisladottir, F. O.: Icelandic Inland Wetlands: Characteristics and Extent of Draining, Wetlands, 36, 759–769, https://doi.org/10.1007/s13157-016-0784-1, 2016a.
Arnalds, O., Dagsson-Waldhauserova, P., and Olafsson, H.: The Icelandic volcanic aeolian environment: Processes and impacts — A review, Aeolian Res., 20, 176–195, https://doi.org/10.1016/j.aeolia.2016.01.004, 2016b.
Aubinet, M., Chermanne, B., Vandenhaute, M., Longdoz, B., Yernaux, M., and Laitat, E.: Long term carbon dioxide exchange above a mixed forest in the Belgian Ardennes, Agr. Forest Meteorol., 108, 293–315, https://doi.org/10.1016/S0168-1923(01)00244-1, 2001.
Aubinet, M., Vesala, T., and Papale, D.: Eddy Covariance: A Practical Guide to Measurement and Data Analysis, Springer Science & Business Media, 451 pp., https://doi.org/10.1007/978-94-007-2351-1, 2012.
Aurela, M., Laurila, T., and Tuovinen, J.-P.: Annual CO2 balance of a subarctic fen in northern Europe: Importance of the wintertime efflux, J. Geophys. Res.-Atmos., 107, ACH 17-1–ACH 17-12, https://doi.org/10.1029/2002JD002055, 2002.
Aurela, M., Laurila, T., and Tuovinen, J.-P.: The timing of snow melt controls the annual CO2 balance in a subarctic fen, Geophys. Res. Lett., 31, https://doi.org/10.1029/2004GL020315, 2004.
Bjarnadottir, B., Aslan Sungur, G., Sigurdsson, B. D., Kjartansson, B. T., Oskarsson, H., Oddsdottir, E. S., Gunnarsdottir, G. E., and Black, A.: Carbon and water balance of an afforested shallow drained peatland in Iceland, Forest Ecol. Manag., 482, 118861, https://doi.org/10.1016/j.foreco.2020.118861, 2021.
Bjornsson, H., Jonsson, T., Gylfadottir, S. S., and Olason, E. O.: Mapping the annual cycle of temperature in Iceland, Meteorol. Z., 16, 45–56, https://doi.org/10.1127/0941-2948/2007/0175, 2007.
Bubier, J., Crill, P., Mosedale, A., Frolking, S., and Linder, E.: Peatland responses to varying interannual moisture conditions as measured by automatic CO2 chambers, Global Biogeochem. Cy., 17, https://doi.org/10.1029/2002GB001946, 2003.
Burba, G. G., McDERMITT, D. K., Grelle, A., Anderson, D. J., and Xu, L.: Addressing the influence of instrument surface heat exchange on the measurements of CO2 flux from open-path gas analyzers, Glob. Change Biol., 14, 1854–1876, https://doi.org/10.1111/j.1365-2486.2008.01606.x, 2008.
Carter, T. R.: Changes in the thermal growing season in Nordic countries during the past century and prospects for the future, Agr. Food Sci., 7, 161–179, https://doi.org/10.23986/afsci.72857, 1998.
Chen, T. and Guestrin, C.: XGBoost: A Scalable Tree Boosting System, in: Proceedings of the 22nd ACM SIGKDD International Conference on Knowledge Discovery and Data Mining, KDD '16, 785–794, https://doi.org/10.1145/2939672.2939785, 2016.
Dagsson-Waldhauserova, P., Arnalds, O., and Olafsson, H.: Long-term variability of dust events in Iceland (1949–2011), Atmos. Chem. Phys., 14, 13411–13422, https://doi.org/10.5194/acp-14-13411-2014, 2014.
Dandois, J. P. and Ellis, E. C.: High spatial resolution three-dimensional mapping of vegetation spectral dynamics using computer vision, Remote Sens. Environ., 136, 259–276, https://doi.org/10.1016/j.rse.2013.04.005, 2013.
Einarsson, M. Á.: Climate of Iceland, in: Climates of the Oceans (World Survey of Climatology, Vol. 15), edited by: van Loon, H., Elsevier, Amsterdam, The Netherlands, 673–697, ISBN 978-0444413376, 1984.
Elmendorf, S. C., Henry, G. H. R., Hollister, R. D., Björk, R. G., Bjorkman, A. D., Callaghan, T. V., Collier, L. S., Cooper, E. J., Cornelissen, J. H. C., Day, T. A., Fosaa, A. M., Gould, W. A., Grétarsdóttir, J., Harte, J., Hermanutz, L., Hik, D. S., Hofgaard, A., Jarrad, F., Jónsdóttir, I. S., Keuper, F., Klanderud, K., Klein, J. A., Koh, S., Kudo, G., Lang, S. I., Loewen, V., May, J. L., Mercado, J., Michelsen, A., Molau, U., Myers-Smith, I. H., Oberbauer, S. F., Pieper, S., Post, E., Rixen, C., Robinson, C. H., Schmidt, N. M., Shaver, G. R., Stenström, A., Tolvanen, A., Totland, Ø., Troxler, T., Wahren, C.-H., Webber, P. J., Welker, J. M., and Wookey, P. A.: Global assessment of experimental climate warming on tundra vegetation: heterogeneity over space and time, Ecol. Lett., 15, 164–175, https://doi.org/10.1111/j.1461-0248.2011.01716.x, 2012.
Evans, C. D., Peacock, M., Baird, A. J., Artz, R. R. E., Burden, A., Callaghan, N., Chapman, P. J., Cooper, H. M., Coyle, M., Craig, E., Cumming, A., Dixon, S., Gauci, V., Grayson, R. P., Helfter, C., Heppell, C. M., Holden, J., Jones, D. L., Kaduk, J., Levy, P., Matthews, R., McNamara, N. P., Misselbrook, T., Oakley, S., Page, S. E., Rayment, M., Ridley, L. M., Stanley, K. M., Williamson, J. L., Worrall, F., and Morrison, R.: Overriding water table control on managed peatland greenhouse gas emissions, Nature, 593, 548–552, https://doi.org/10.1038/s41586-021-03523-1, 2021.
FAO: Global Forest Resources Assessment 2020. Key findings, FAO, Rome, Italy, 16 pp., https://doi.org/10.4060/ca8753en, 2020.
Foken, T.: The Energy Balance Closure Problem: An Overview, Ecol. Appl., 18, 1351–1367, https://doi.org/10.1890/06-0922.1, 2008.
Førland, E. J., Skaugen, T. E., Benestad, R. E., Hanssen-Bauer, I., and Tveito, O. E.: Variations in Thermal Growing, Heating, and Freezing Indices in the Nordic Arctic, 1900–2050, Arct. Antarct. Alp. Res., 36, 347–356, https://doi.org/10.1657/1523-0430(2004)036[0347:VITGHA]2.0.CO;2, 2004.
Gorham, E.: Northern Peatlands: Role in the Carbon Cycle and Probable Responses to Climatic Warming, Ecol. Appl., 1, 182–195, https://doi.org/10.2307/1941811, 1991.
Guðmundsson, J. and Óskarsson, H.: Carbon dioxide emission from drained organic soils in West-Iceland, in: : Soil carbon sequestration for climate food security and ecosystem services, Reykjavík, Iceland, 155–159, 2014.
Guðmundsson, J., Óskarsson, H., Jansen, E., Kristinsson, S. Þ., Kjeld, A., and Gíslason, E. M.: Low nitrous oxide fluxes from mineral affected peatland soils in Iceland, Agr. Ecosyst. Environ., 376, 109247, https://doi.org/10.1016/j.agee.2024.109247, 2024.
Guðmundsson, J., Óskarsson, H., Pagneux, E. P., and Þórðarson, H. N.: Regional Estimates of CO2 Fluxes and Stock Losses from Drained Uncultivated Peatlands in West Iceland, Environ. Model. Assess., https://doi.org/10.1007/s10666-026-10105-w, 2026.
Gunnarsdóttir, G. E. G.: A novel approach to estimate carbon loss from drained peatlands in Iceland, Thesis, University of Iceland, Reykjavik, Iceland http://hdl.handle.net/1946/27731 (last access: 13 August 2025), 2017.
Hallsdóttir, B., Wöll, C., Gudmundsson, J., Snorrason, A., and Thorsson, J.: Emissions of greenhouse gases in Iceland from 1990 to 2010 National Inventory Report 2012, Submitted under the United Nations Framework Convention on Climate Change and the Kyoto Protocol, Environment Agency of Iceland, Reykjavík, Iceland, https://ust.is/library/Skrar/Atvinnulif/Loftslagsbreytingar/ICELAND NIR 2012.pdf (last access: 13 August 2025), 2012.
Hanssen-Bauer, I., Førland, E., Haddeland, I., Hisdal, H., Lawrence, D., Mayer, S., Nesje, A., Nilsen, J. E., Sandven, S., Sandø, A., Sorteberg, A., and Ådlandsvik, B.: Climate in Norway 2100, Norwegian Centre for Climate Services (NCCS), Oslo, Norway, NCCS report no. 1/2017, https://hdl.handle.net/11250/3746193 (last access: 27 December 2025), 2017.
Icelandic Meteorological Office: Tíðarfarsyfirlit 2023, Icelandic Meteorological Office, Reykjavík, Iceland, https://www.vedur.is/vedur/vedurfar/manadayfirlit/2023, last access: 30 December 2025a.
Icelandic Meteorological Office: Tíðafarsyfirlit 2024, Icelandic Meteorological Office, Reykjavík, Iceland, https://www.vedur.is/vedur/vedurfar/manadayfirlit/2024, last access: 30 December 2025b.
Icelandic Meteorological Office: Weather observations for Hafnarfjall (Station 31674) and Neðra-Skarð (station 97), Icelandic Meteorological Office, Reykjavík, Iceland, https://athuganir.vedur.is/, last access: 29 September 2025.
IPCC (Ed.): Climate change 2007: the physical science basis, Cambridge University Press, Cambridge, 2007.
IPCC: 2013 supplement to the 2006 IPCC guidelines for national greenhouse gas inventories: wetlands: methodological guidance on lands with wet and drained soils, and constructed wetlands for wastewater treatment, IPCC, Intergovernmental Panel on Climate Change, Geneva, Switzerland, 2014.
Jauhiainen, J., Alm, J., Bjarnadottir, B., Callesen, I., Christiansen, J. R., Clarke, N., Dalsgaard, L., He, H., Jordan, S., Kazanavičiūtė, V., Klemedtsson, L., Lauren, A., Lazdins, A., Lehtonen, A., Lohila, A., Lupikis, A., Mander, Ü., Minkkinen, K., Kasimir, Å., Olsson, M., Ojanen, P., Óskarsson, H., Sigurdsson, B. D., Søgaard, G., Soosaar, K., Vesterdal, L., and Laiho, R.: Reviews and syntheses: Greenhouse gas exchange data from drained organic forest soils – a review of current approaches and recommendations for future research, Biogeosciences, 16, 4687–4703, https://doi.org/10.5194/bg-16-4687-2019, 2019.
Jauhiainen, J., Heikkinen, J., Clarke, N., He, H., Dalsgaard, L., Minkkinen, K., Ojanen, P., Vesterdal, L., Alm, J., Butlers, A., Callesen, I., Jordan, S., Lohila, A., Mander, Ü., Óskarsson, H., Sigurdsson, B. D., Søgaard, G., Soosaar, K., Kasimir, Å., Bjarnadottir, B., Lazdins, A., and Laiho, R.: Reviews and syntheses: Greenhouse gas emissions from drained organic forest soils – synthesizing data for site-specific emission factors for boreal and cool temperate regions, Biogeosciences, 20, 4819–4839, https://doi.org/10.5194/bg-20-4819-2023, 2023.
Joosten, H. and Clarke, D.: Wise use of mires and peatlands: background and principles including a framework for decision-making, Internat. Mire Conservation Group [u.a.], Totnes, 304 pp., 2002.
Kandel, T. P., Lærke, P. E., and Elsgaard, L.: Annual emissions of CO2, CH4 and N2O from a temperate peat bog: Comparison of an undrained and four drained sites under permanent grass and arable crop rotations with cereals and potato, Agr. Forest Meteorol., 256–257, 470–481, https://doi.org/10.1016/j.agrformet.2018.03.021, 2018.
Kljun, N., Calanca, P., Rotach, M. W., and Schmid, H. P.: A simple two-dimensional parameterisation for Flux Footprint Prediction (FFP), Geosci. Model Dev., 8, 3695–3713, https://doi.org/10.5194/gmd-8-3695-2015, 2015.
Koskinen, M., Maanavilja, L., and Nieminen, M.: High Methane Emissions From Restored Norway Spruce Swamps in Southern Finland Over One Growing Season, Mires Peat, 17, https://doi.org/10.19189/MaP.2015.OMB.202, 2016.
Lasslop, G., Reichstein, M., Papale, D., Richardson, A. D., Arneth, A., Barr, A., Stoy, P., and Wohlfahrt, G.: Separation of net ecosystem exchange into assimilation and respiration using a light response curve approach: critical issues and global evaluation, Glob. Change Biol., 16, 187–208, https://doi.org/10.1111/j.1365-2486.2009.02041.x, 2010.
Leifeld, J. and Menichetti, L.: The underappreciated potential of peatlands in global climate change mitigation strategies, Nat. Commun., 9, 1071, https://doi.org/10.1038/s41467-018-03406-6, 2018.
Leifeld, J., Wüst-Galley, C., and Page, S.: Intact and managed peatland soils as a source and sink of GHGs from 1850 to 2100, Nat. Clim. Change, 9, 945–947, https://doi.org/10.1038/s41558-019-0615-5, 2019.
Lind, P., Belušić, D., Médus, E., Dobler, A., Pedersen, R. A., Wang, F., Matte, D., Kjellström, E., Landgren, O., Lindstedt, D., Christensen, O. B., and Christensen, J. H.: Climate change information over Fenno-Scandinavia produced with a convection-permitting climate model, Clim. Dynam., 61, 519–541, https://doi.org/10.1007/s00382-022-06589-3, 2023.
Liu, L., Ciais, P., Nguyen, T. H., Xi, Y., Qiu, C., Salmon, E., Kalhori, A., Guimbaud, C., Peichl, M., Ratcliffe, J. L., Noumonvi, K. D., and Li, X.: Modeling the impact of drainage on peatland CO2 and CH4 fluxes and its underlying drivers, Biogeosciences, 23, 2277–2308, https://doi.org/10.5194/bg-23-2277-2026, 2026.
Lloyd, J. and Taylor, J. A.: On the Temperature Dependence of Soil Respiration, Funct. Ecol., 8, 315–323, https://doi.org/10.2307/2389824, 1994.
Lohila, A., Minkkinen, K., Aurela, M., Tuovinen, J.-P., Penttilä, T., Ojanen, P., and Laurila, T.: Greenhouse gas flux measurements in a forestry-drained peatland indicate a large carbon sink, Biogeosciences, 8, 3203–3218, https://doi.org/10.5194/bg-8-3203-2011, 2011.
Loisel, J., Gallego-Sala, A. V., Amesbury, M. J., Magnan, G., Anshari, G., Beilman, D. W., Benavides, J. C., Blewett, J., Camill, P., Charman, D. J., Chawchai, S., Hedgpeth, A., Kleinen, T., Korhola, A., Large, D., Mansilla, C. A., Müller, J., van Bellen, S., West, J. B., Yu, Z., Bubier, J. L., Garneau, M., Moore, T., Sannel, A. B. K., Page, S., Väliranta, M., Bechtold, M., Brovkin, V., Cole, L. E. S., Chanton, J. P., Christensen, T. R., Davies, M. A., De Vleeschouwer, F., Finkelstein, S. A., Frolking, S., Gałka, M., Gandois, L., Girkin, N., Harris, L. I., Heinemeyer, A., Hoyt, A. M., Jones, M. C., Joos, F., Juutinen, S., Kaiser, K., Lacourse, T., Lamentowicz, M., Larmola, T., Leifeld, J., Lohila, A., Milner, A. M., Minkkinen, K., Moss, P., Naafs, B. D. A., Nichols, J., O'Donnell, J., Payne, R., Philben, M., Piilo, S., Quillet, A., Ratnayake, A. S., Roland, T. P., Sjögersten, S., Sonnentag, O., Swindles, G. T., Swinnen, W., Talbot, J., Treat, C., Valach, A. C., and Wu, J.: Expert assessment of future vulnerability of the global peatland carbon sink, Nat. Clim. Change, 11, 70–77, https://doi.org/10.1038/s41558-020-00944-0, 2021.
Lundberg, S. M. and Lee, S.-I.: A unified approach to interpreting model predictions, in: Advances in Neural Information Processing Systems 30, Curran Associates, Inc., Red Hook, NY, USA, 4765–4774, https://papers.nips.cc/paper/7062-a-unified-approach-to-interpreting-model-predictions (last access: 29 December 2025), 2017.
Maljanen, M., Sigurdsson, B. D., Guðmundsson, J., Óskarsson, H., Huttunen, J. T., and Martikainen, P. J.: Greenhouse gas balances of managed peatlands in the Nordic countries – present knowledge and gaps, Biogeosciences, 7, 2711–2738, https://doi.org/10.5194/bg-7-2711-2010, 2010.
Mauder, M. and Foken, T.: Documentation and instruction manual of the eddy-covariance software package TK3, Arbeitsergebnisse, Nr. 46, Universität Bayreuth, Abt. Mikrometeorologie, Bayreuth, Germany, 60 pp., https://epub.uni-bayreuth.de/342/ (last access: 29 December 2025), 2011.
Minkkinen, K. and Laine, J.: Long-term effect of forest drainage on the peat carbon stores of pine mires in Finland, Can. J. Forest Res., 28, 1267–1275, https://doi.org/10.1139/x98-104, 1998.
Möckel, S. C., Erlendsson, E., and Gísladóttir, G.: Andic Soil Properties and Tephra Layers Hamper C Turnover in Icelandic Peatlands, J. Geophys. Res.-Biogeo., 126, e2021JG006433, https://doi.org/10.1029/2021JG006433, 2021.
Möckel, S. C., Erlendsson, E., and Gísladóttir, G.: Effect of mineral soil constituents on carbon characteristics of peatlands in aeolian environments of Iceland, Wetl. Ecol. Manag., 31, 853–874, https://doi.org/10.1007/s11273-023-09956-x, 2023.
Moncrieff, J. B., Monteny, B., Verhoef, A., Friborg, Th., Elbers, J., Kabat, P., de Bruin, H., Soegaard, H., Jarvis, P. G., and Taupin, J. D.: Spatial and temporal variations in net carbon flux during HAPEX-Sahel, J. Hydrol., 188–189, 563–588, https://doi.org/10.1016/S0022-1694(96)03193-9, 1997.
Monteith, J. L.: Solar Radiation and Productivity in Tropical Ecosystems, J. Appl. Ecol., 9, 747, https://doi.org/10.2307/2401901, 1972.
Mortier, S., Hamedpour, A., Bussmann, B., Wandji, R. P. T., Latré, S., Sigurdsson, B. D., De Schepper, T., and Verdonck, T.: Inferring the relationship between soil temperature and the normalized difference vegetation index with machine learning, Ecol. Inform., 82, 102730, https://doi.org/10.1016/j.ecoinf.2024.102730, 2024.
Ojanen, P., Minkkinen, K., Alm, J., and Penttilä, T.: Soil–atmosphere CO2, CH4 and N2O fluxes in boreal forestry-drained peatlands, Forest Ecol. Manag., 260, 411–421, https://doi.org/10.1016/j.foreco.2010.04.036, 2010.
Ólafsdóttir, R.: Carbon budget of a drained peatland in Western Iceland and initial effects of rewetting, Thesis, Agricultural University of Iceland, Hvanneyri, Iceland http://hdl.handle.net/1946/22095 (last access: 12 November 2025), 2015.
Ottósson, J. G., Sveinsdóttir, A., and Harðardóttir, M.: VISTGERÐIR Á ÍSLANDI, Náttúrufræðistofnun, 2017.
Papale, D., Reichstein, M., Aubinet, M., Canfora, E., Bernhofer, C., Kutsch, W., Longdoz, B., Rambal, S., Valentini, R., Vesala, T., and Yakir, D.: Towards a standardized processing of Net Ecosystem Exchange measured with eddy covariance technique: algorithms and uncertainty estimation, Biogeosciences, 3, 571–583, https://doi.org/10.5194/bg-3-571-2006, 2006.
Pastorello, G., Trotta, C., Canfora, E., Chu, H., Christianson, D., Cheah, Y.-W., Poindexter, C., Chen, J., Elbashandy, A., Humphrey, M., Isaac, P., Polidori, D., Reichstein, M., Ribeca, A., van Ingen, C., Vuichard, N., Zhang, L., Amiro, B., Ammann, C., Arain, M. A., Ardö, J., Arkebauer, T., Arndt, S. K., Arriga, N., Aubinet, M., Aurela, M., Baldocchi, D., Barr, A., Beamesderfer, E., Marchesini, L. B., Bergeron, O., Beringer, J., Bernhofer, C., Berveiller, D., Billesbach, D., Black, T. A., Blanken, P. D., Bohrer, G., Boike, J., Bolstad, P. V., Bonal, D., Bonnefond, J.-M., Bowling, D. R., Bracho, R., Brodeur, J., Brümmer, C., Buchmann, N., Burban, B., Burns, S. P., Buysse, P., Cale, P., Cavagna, M., Cellier, P., Chen, S., Chini, I., Christensen, T. R., Cleverly, J., Collalti, A., Consalvo, C., Cook, B. D., Cook, D., Coursolle, C., Cremonese, E., Curtis, P. S., D'Andrea, E., da Rocha, H., Dai, X., Davis, K. J., Cinti, B. D., Grandcourt, A. de, Ligne, A. D., De Oliveira, R. C., Delpierre, N., Desai, A. R., Di Bella, C. M., Tommasi, P. di, Dolman, H., Domingo, F., Dong, G., Dore, S., Duce, P., Dufrêne, E., Dunn, A., Dušek, J., Eamus, D., Eichelmann, U., ElKhidir, H. A. M., Eugster, W., Ewenz, C. M., Ewers, B., Famulari, D., Fares, S., Feigenwinter, I., Feitz, A., Fensholt, R., Filippa, G., Fischer, M., Frank, J., Galvagno, M., et al.: The FLUXNET2015 dataset and the ONEFlux processing pipeline for eddy covariance data, Sci. Data, 7, 225, https://doi.org/10.1038/s41597-020-0534-3, 2020.
Pearson, K.: VII. Mathematical contributions to the theory of evolution.—III. Regression, heredity, and panmixia, Philos. T. R. Soc. Lond., 253–318, https://doi.org/10.1098/rsta.1896.0007, 1896.
Qiu, C., Ciais, P., Zhu, D., Guenet, B., Peng, S., Petrescu, A. M. R., Lauerwald, R., Makowski, D., Gallego-Sala, A. V., Charman, D. J., and Brewer, S. C.: Large historical carbon emissions from cultivated northern peatlands, Sci. Adv., 7, eabf1332, https://doi.org/10.1126/sciadv.abf1332, 2021.
Raich, J. W. and Schlesinger, W. H.: The global carbon dioxide flux in soil respiration and its relationship to vegetation and climate, Tellus B, 44, https://doi.org/10.3402/tellusb.v44i2.15428, 1992.
Raynolds, M., Magnússon, B., Metúsalemsson, S., and Magnússon, S. H.: Warming, Sheep and Volcanoes: Land Cover Changes in Iceland Evident in Satellite NDVI Trends, Remote Sens., 7, 9492–9506, https://doi.org/10.3390/rs70809492, 2015.
Reichstein, M., Falge, E., Baldocchi, D., Papale, D., Aubinet, M., Berbigier, P., Bernhofer, C., Buchmann, N., Gilmanov, T., Granier, A., Grünwald, T., Havránková, K., Ilvesniemi, H., Janous, D., Knohl, A., Laurila, T., Lohila, A., Loustau, D., Matteucci, G., Meyers, T., Miglietta, F., Ourcival, J.-M., Pumpanen, J., Rambal, S., Rotenberg, E., Sanz, M., Tenhunen, J., Seufert, G., Vaccari, F., Vesala, T., Yakir, D., and Valentini, R.: On the separation of net ecosystem exchange into assimilation and ecosystem respiration: review and improved algorithm, Glob. Change Biol., 11, 1424–1439, https://doi.org/10.1111/j.1365-2486.2005.001002.x, 2005.
Rojstaczer, S. and Deverel, S. J.: Time dependence in atmospheric carbon inputs from drainage of organic soils, Geophys. Res. Lett., 20, 1383–1386, https://doi.org/10.1029/93GL01339, 1993.
Rouse, J. W., Haas, R. H., Schell, J. A., and Deering, D. W.: Monitoring vegetation systems in the Great Plains with ERTS, NTRS Author Affiliations: Texas A&M Univ.NTRS Report/Patent Number: PAPER-A20NTRS Document ID: 19740022614NTRS, Research Center: Legacy CDMS (CDMS), 1974.
Ruosteenoja, K. and Jylhä, K.: Projected climate change in Finland during the 21st century calculated from CMIP6 model simulations, Geophysica, 56, 39–69 https://www.geophysica.fi/pdf/geophysica_2021_56_1_039_ruosteenoja.pdf (last access: 27 December 2025), 2022.
Sellers, P. J.: Canopy reflectance, photosynthesis and transpiration, Int. J. Remote Sens., 6, 1335–1372, https://doi.org/10.1080/01431168508948283, 1985.
Streeper, K. B.: Carbon stocks and properties of a drained and undrained peatland in West Iceland, Thesis, University of Iceland, 2026.
Tikkasalo, O.-P., Peltola, O., Alekseychik, P., Heikkinen, J., Launiainen, S., Lehtonen, A., Li, Q., Martínez-García, E., Peltoniemi, M., Salovaara, P., Tuominen, V., and Mäkipää, R.: Eddy-covariance fluxes of CO2, CH4 and N2O in a drained peatland forest after clear-cutting, Biogeosciences, 22, 1277–1300, https://doi.org/10.5194/bg-22-1277-2025, 2025.
Truskavetskii, R. S.: Carbon budget of drained peat bogs in Ukrainian Polesie, Eurasian Soil Sci.+, 47, 687–693, https://doi.org/10.1134/S1064229314050238, 2014.
Umhverfisstofnun: National Inventory Report, Environment Agency of Iceland (Umhverfisstofnun), Reykjavík, Iceland, https://ust.is/library/Skrar/loft/NIR/ISL_NIR 2023_15 april_on_web.pdf (last access: 9 January 2026), 2023.
Umhverfisstofnun: National Inventory Document, Umhverfisstofnun, 2025.
van Giersbergen, Q., Barthelmes, A., Couwenberg, J., Lång, K., Martin, N., Tegetmeyer, C., Fritz, C., and Tanneberger, F.: Identifying hotspots of greenhouse gas emissions from drained peatlands in the European Union, Nat. Commun., 16, 10825, https://doi.org/10.1038/s41467-025-65841-6, 2025.
Webb, E. K., Pearman, G. I., and Leuning, R.: Correction of flux measurements for density effects due to heat and water vapour transfer, Q. J. Roy. Meteor. Soc., 106, 85–100, https://doi.org/10.1002/qj.49710644707, 1980.
Westoby, M. J., Brasington, J., Glasser, N. F., Hambrey, M. J., and Reynolds, J. M.: `Structure-from-Motion' photogrammetry: A low-cost, effective tool for geoscience applications, Geomorphology, 179, 300–314, https://doi.org/10.1016/j.geomorph.2012.08.021, 2012.
Wilson, K., Goldstein, A., Falge, E., Aubinet, M., Baldocchi, D., Berbigier, P., Bernhofer, C., Ceulemans, R., Dolman, H., Field, C., Grelle, A., Ibrom, A., Law, B. E., Kowalski, A., Meyers, T., Moncrieff, J., Monson, R., Oechel, W., Tenhunen, J., Valentini, R., and Verma, S.: Energy balance closure at FLUXNET sites, Agr. Forest Meteorol., 113, 223–243, https://doi.org/10.1016/S0168-1923(02)00109-0, 2002.
Wilson, R. M., Hopple, A. M., Tfaily, M. M., Sebestyen, S. D., Schadt, C. W., Pfeifer-Meister, L., Medvedeff, C., McFarlane, K. J., Kostka, J. E., Kolton, M., Kolka, R. K., Kluber, L. A., Keller, J. K., Guilderson, T. P., Griffiths, N. A., Chanton, J. P., Bridgham, S. D., and Hanson, P. J.: Stability of peatland carbon to rising temperatures, Nat. Commun., 7, 13723, https://doi.org/10.1038/ncomms13723, 2016.
Wohlfahrt, G., Anfang, C., Bahn, M., Haslwanter, A., Newesely, C., Schmitt, M., Drösler, M., Pfadenhauer, J., and Cernusca, A.: Quantifying nighttime ecosystem respiration of a meadow using eddy covariance, chambers and modelling, Agr. Forest Meteorol., 128, 141–162, https://doi.org/10.1016/j.agrformet.2004.11.003, 2005.
Wohlfahrt, G., Hammerle, A., Haslwanter, A., Bahn, M., Tappeiner, U., and Cernusca, A.: Seasonal and inter-annual variability of the net ecosystem CO2 exchange of a temperate mountain grassland: Effects of weather and management, J. Geophys. Res.-Atmos., 113, https://doi.org/10.1029/2007JD009286, 2008.
Wutzler, T., Lucas-Moffat, A., Migliavacca, M., Knauer, J., Sickel, K., Šigut, L., Menzer, O., and Reichstein, M.: Basic and extensible post-processing of eddy covariance flux data with REddyProc, Biogeosciences, 15, 5015–5030, https://doi.org/10.5194/bg-15-5015-2018, 2018.
Xu, J., Morris, P. J., Liu, J., and Holden, J.: PEATMAP: Refining estimates of global peatland distribution based on a meta-analysis, CATENA, 160, 134–140, https://doi.org/10.1016/j.catena.2017.09.010, 2018.
Yu, Z., Loisel, J., Brosseau, D. P., Beilman, D. W., and Hunt, S. J.: Global peatland dynamics since the Last Glacial Maximum, Geophys. Res. Lett., 37, 2010GL043584, https://doi.org/10.1029/2010GL043584, 2010.
- Abstract
- Introduction
- Material and methods
- Results
- Discussion
- Conclusion
- Appendix A: Fuel cell placement and interference check
- Appendix B: Machine learning interpretability
- Appendix C: Secondary environmental controls on ecosystem exchange
- Code and data availability
- Author contributions
- Competing interests
- Disclaimer
- Acknowledgements
- Financial support
- Review statement
- References
- Supplement