the Creative Commons Attribution 4.0 License.
the Creative Commons Attribution 4.0 License.
 | 25 Jun 2026
Experimental assessment of benthic foraminifera as salinity bioindicators: Integrating morphological and eDNA approaches
Yifei Cao
Wenlong Fa
Benthic foraminifera are extensively used as bioindicators for paleoenvironmental reconstruction, and environmental DNA (eDNA) analysis provides a powerful lens to uncover their community diversity and environmental responses. Foraminifera are commonly used to assess salinity changes in estuary settings, but quantitative experimental studies of their responses to salinity gradients are scarce. Here, sediments from the intertidal zone of Qingdao Bay were subjected to a 10-week controlled culture across 13 salinity levels (0–60 Practical Salinity Units, PSU), and community dynamics were analysed using both morphological and eDNA approaches. Foraminifera exhibited broad salinity tolerance (0–60 PSU). Analyses of both morphological and molecular datasets revealed a significant increase in community diversity with salinity (p<0.05), accompanied by a marked decrease in the relative abundance of calcified Rotaliida (p<0.01). The inverse relationship for Rotaliida was quantitatively robust and well-described by a linear regression model. The eDNA analysis revealed that soft-bodied Monothalamiids, often overlooked morphologically, reached up to 76.2 % relative abundance (average 56.1 %). In contrast, the salinity-driven increase in high-Mg calcite-shelled Milioliida was observed only through morphological analysis. These results demonstrate the distinct but complementary nature of morphological and molecular methods. This study addresses the scarcity of experimental constraints on salinity responses, offering a calibrated reference for applying foraminifera in both ecological assessment and paleo-reconstruction in marginal marine environments.
- Article
(3008 KB) - Full-text XML
-
Supplement
(1147 KB) - BibTeX
- EndNote


Foraminifera are cosmopolitan unicellular protists widely distributed across marine environments. Highly sensitive to environmental changes, they preserve extensive environmental information within their tests and community structures, making them valuable proxies for environmental monitoring and paleoclimatic reconstructions (Bouchet et al., 2012; Ying et al., 2024). In coastal and shelf environments, seawater conditions are highly variable, and salinity is closely linked to local monsoons, precipitation, and continental runoff. The mixing of freshwater and evaporation alter the physicochemical properties of seawater, thereby influencing the growth of foraminiferal populations and the preservation of their tests (Murray and Alve, 1999; Nigam et al., 1992; Sen Gupta, 1999). Field investigations into salinity have revealed the presence of living foraminifera in environments ranging from extremely low salinity levels (down to 0.1 PSU in the Paraná River in South America) to hypersaline conditions (up to 92 PSU in the saline-alkaline regions of southern Europe) (Boltovskoy et al., 1991). However, both abnormally high and low salinities can induce morphological deformities, including changes in test size, increased proportions of abnormal individuals, loss of surface ornamentation, and delayed or even inhibited reproduction (Boltovskoy et al., 1991).
Laboratory culture experiments on salinity have traditionally focused on species-level responses, such as growth, reproduction, and test morphology, whereas the collective responses of entire benthic foraminiferal communities remain poorly understood. Bradshaw (1957) investigated the salinity tolerance of Ammonia beccarii (Linné) var. tepida (Cushman) and found that the optimal range for reproduction and growth lies between 20 and 40 PSU. When salinity dropped below 13 PSU, the time required for reproduction doubled compared to normal conditions, and growth ceased at salinities above 67 PSU. Similarly, Nigam et al. (2006) reported that both excessively high and low salinities adversely affect the growth rate of foraminifera; however, low salinity poses a greater threat than hypersaline conditions, as test dissolution tends to occur under reduced salinity.
Traditional studies have typically relied on morphological identification of foraminiferal taxa and statistical analyses of community composition to infer past or present environmental conditions. However, this approach is time-consuming and requires considerable taxonomic expertise. With the advancement of molecular biology, environmental DNA (eDNA) techniques have become increasingly popular. High-throughput sequencing (HTS) enables more efficient assessments of foraminiferal diversity, substantially reducing both time and labour costs (Pawlowski et al., 2020, 2022). Recently, eDNA-based approaches for foraminiferal research have been successfully applied to monitor biodiversity and to further assess environmental conditions (Maeda et al., 2024; O'Brien et al., 2024). In addition, analyses of foraminiferal ancient DNA (aDNA) extracted from sediment cores provide valuable complementary information on soft-bodied Monothalamiids taxa that are widespread in modern environments but rarely preserved in the fossil record, thereby enabling the reconstruction of past biodiversity and offering a more comprehensive understanding of paleoenvironmental changes (Demianiuk et al., 2025; Pawłowska et al., 2014). However, applications of the eDNA approach to investigate the responses of foraminiferal communities to environmental changes under controlled laboratory conditions remain very limited, which constrains the potential of foraminifera as reliable indicators for tracking short-term and long-term environmental variability.
In this study, sediment samples were used for culture experiments rather than single-species cultivation, allowing a more realistic simulation of the natural habitats of benthic foraminifera. Based on this setup, environmental salinity levels were manipulated to assess the ecological effects of environmental variability under controlled conditions. Intertidal sediment samples were collected from Qingdao Bay and cultured for ten weeks under 13 salinity levels ranging from 0 to 60 PSU. Both morphological and eDNA approaches were employed to analyse community parameters and taxonomic composition, and their relationships with salinity were quantitatively examined. The objectives of this study are to evaluate the consistency between morphological and eDNA-based estimates of benthic foraminiferal diversity, to identify the differential responses of distinct taxonomic groups to salinity variation, and to establish a practical framework for linking community dynamics with environmental levels, providing a valuable reference for modern environmental assessment and paleoenvironmental reconstruction.
2.1 Sample collection and laboratory culture
Sediment samples were collected from the intertidal zone of Qingdao Bay (36.03° N, 120.19° E, Fig. 1), a region where annual salinity typically ranges from 31 to 38 PSU (Lei et al., 2017). At the time of sampling, the in situ water temperature was 17.8 °C, and the seawater salinity was 33.1 PSU (measured by handheld refractometer, precision ±1 ‰, interpolated to 0.1 PSU). Ambient seawater collected for the experiment showed a pH of 8.21.
To ensure community representativeness, surface sediments (top 0–2 cm) were collected from approximately 20 random locations within the sampling area using a sterile spoon and pooled into a single composite sample. Upon transfer to the laboratory, the sediment was gently homogenized. Prior to aliquoting, the sediment was wet-sieved through a 300-mesh (∼48 µm) silk screen using ambient seawater. This pre-treatment removed clay and most fine to medium silt particles, as well as excess organic detritus, thereby improving pore-water oxygenation and preventing bacterial overgrowth during the subsequent static culture. From this processed material, an initial subsample (∼50 g) was preserved as the baseline (T0), and the remaining sediment was divided into 13 equal aliquots (approximately 50 g wet weight each) for the salinity gradient experiment.
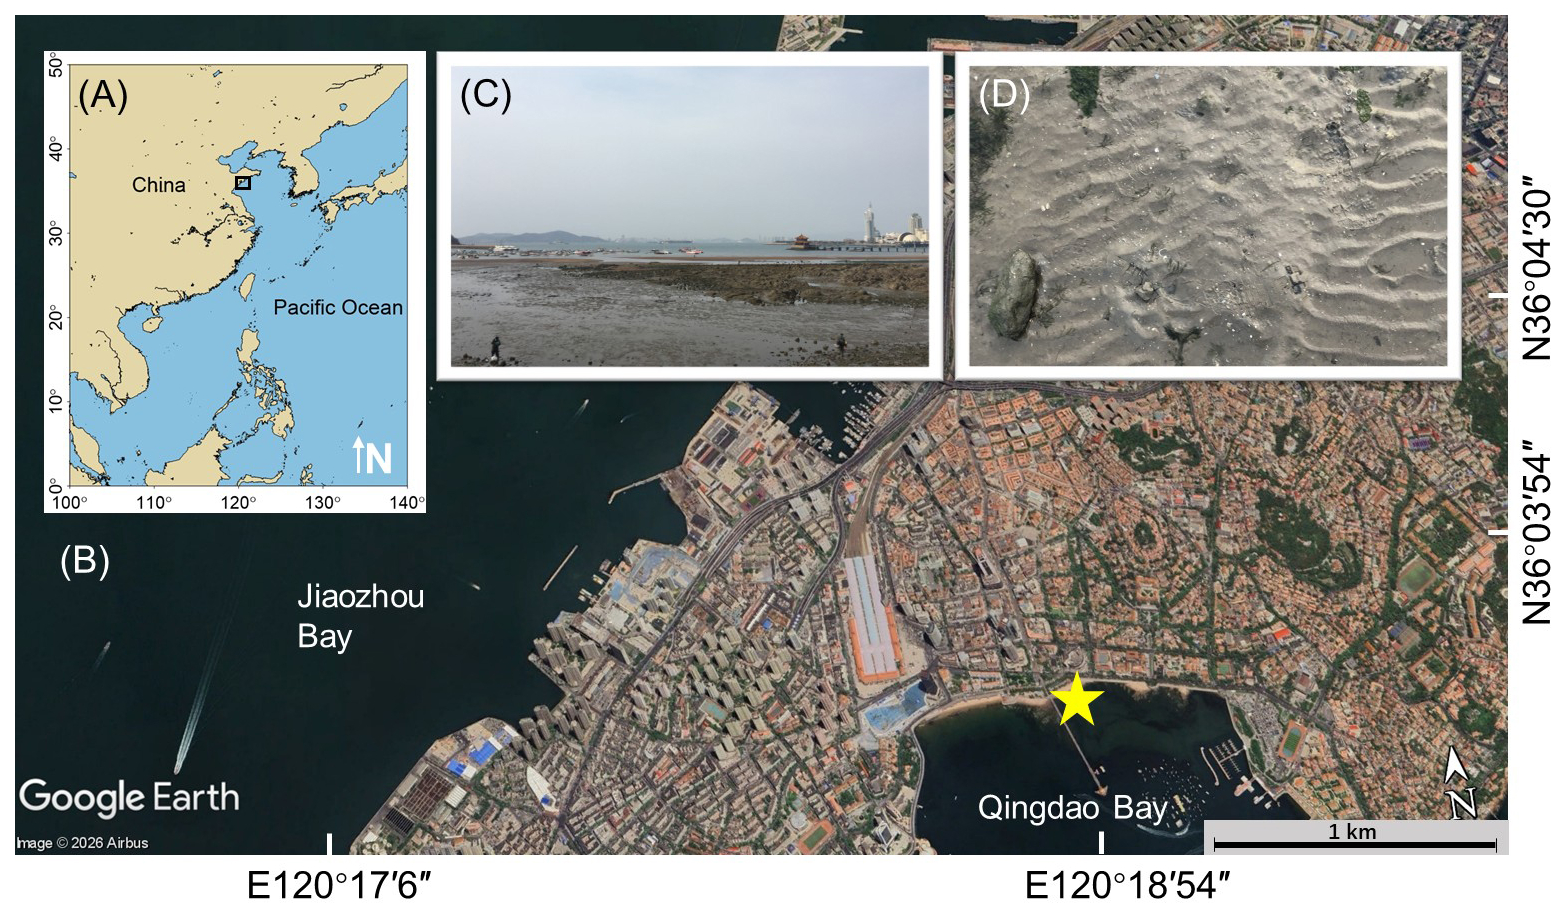
Figure 1Map of the sampling area. (A) Regional map with a black rectangle indicating the location of the detailed view. (B) Close-up map view of the sampling site, with the sampling location indicated by a yellow star (Imagery © 2026 Airbus; Map data © 2026 Google and respective data providers; Image date: 18 May 2025); (C) Photograph of the sampling area; (D) Photograph of sediment substrate conditions at the sampling site.
Sediment samples were cultured in clean, sterilized glass crystallizing dishes (90 mm in diameter) under 13 salinity levels of 0, 5, 10, 15, 20, 25, 30, 35, 40, 45, 50, 55, and 60 PSU. The dishes were incubated in a temperature-controlled chamber maintained at 18 °C, with a light: dark cycle of 12 h : 12 h and an illumination intensity of approximately 6000 lx. Seawater with different salinities was prepared using in situ seawater as the base. Prior to salinity adjustment, the seawater was filtered through a 0.45 µm membrane to remove impurities. High-salinity water was obtained by evaporative concentration in an oven, whereas low-salinity water was prepared by dilution with distilled water (Bradshaw, 1955; Dissard et al., 2010). During the culture experiment, an overlying water volume approximately equal to that of the sediment was maintained in each crystallization dish, which was covered with a gas-permeable membrane to prevent salinity fluctuations caused by evaporation. Throughout the 10-week culture, half of the overlying water was replaced every three days, and 20 µL of concentrated algal suspension was added as food at the same interval. The algal suspension of Phaeodactylum tricornutum Bohlin, cultivated using Guillard's f/2 medium, was pre-concentrated by centrifugation, homogenized, aliquoted into sterile 1.5 mL centrifuge tubes, and stored at −20 °C until use. During the culture period, the pH of the overlying water was regularly monitored and maintained at 7.7±0.16. After 10 weeks of culture, half of each sediment sample was used for morphological analysis, while the other half was reserved for eDNA extraction.
2.2 Sample processing by morphology
For morphological analysis, the samples were fixed for 48 h in a solution of 95 % ethanol mixed with 1 g L−1 Rose Bengal to distinguish living from dead foraminiferal individuals (Lei et al., 2017; Schönfeld et al., 2012). Subsequent morphological processing and analysis were conducted following ISO 23040:2021. After staining, samples were dried at 50 °C for 12 h, weighed, and wrapped in 300-mesh sieve netting, then soaked and rinsed in seawater. Foraminifera were concentrated by flotation using carbon tetrachloride (CCl4), followed by a second drying step. The residues were then dry-sieved through 0.150 and 0.063 mm mesh screens and split into two size fractions: >0.150 and 0.063–0.150 mm (Fontanier et al., 2002; Jian et al., 1999). The 0.063–0.150 mm fraction, consisting mainly of juveniles and very small specimens, was not picked. All stained (i.e., living) individuals from the >0.150 mm fraction were hand-picked under a stereomicroscope. Although all specimens were counted, only Rose Bengal-stained individuals were included in the final community analyses.
To provide a baseline for comparison, the original intertidal sediment samples were processed identically. The pre-experimental community composition is shown as T0. Species identification was conducted based on existing literature plates (Lei and Li, 2016), with pre-treatment viability determined by observing staining patterns. The identification of all living foraminiferal individuals in the selected samples was conducted to the level of species, and these were then grouped for quantitative analysis. In addition, community parameters were calculated, including total abundance, Margalef diversity index, Shannon–Wiener index, and Simpson index. For morphological data, relative abundance was calculated as the number of Rose Bengal-stained specimens of a given taxon divided by the total number of stained foraminiferal specimens in the sample.
2.3 Sample processing by eDNA metabarcoding
For sediment samples used in DNA extraction, 0.25 g replicates were collected from three distinct locations within each sample. This was done in order to minimize errors arising from sample heterogeneity. The sample was then processed using the QIAGEN (Germany) DNeasy PowerSoil Kit (12888-100), yielding 100 mL of environmental DNA solution. The process of polymerase chain reaction (PCR) was conducted utilizing the foraminifera-specific primers s14F3 and s17, which were designed to target the 37f hypervariable region of the foraminifera SSU ribosomal DNA. Each PCR reaction volume of 25 µL contains 12.5 µL of 2× High–Fidelity PCR Master Mix, 0.5 µL of each primer at 10 µM, 2 µL of DNA template, and 9.5 µL of ddH2O. The thermal cycling profile implemented a two-stage amplification strategy: an initial denaturation at 94 °C for 90 s, followed by 35 cycles of denaturation (94 °C, 60 s), annealing (55 °C, 60 s), and extension (72 °C, 45 s). This was immediately followed by an additional 10 cycles with modified timing (30 s denaturation, 30 s annealing, and 120 s extension) to ensure complete amplification.
Amplicons were purified using a DNA Gel Extraction Kit and verified via 1 % agarose gel electrophoresis. Library construction was carried out using the Illumina TruSeq DNA PCR-Free Library Preparation Kit, followed by quantification with Qubit. Sequencing was conducted on the Illumina NovaSeq 6000 platform to generate paired-end reads. The amplified target fragment was 380 bp in length, and paired-end sequencing with 250 bp reads was employed, resulting in a potential overlapping region of approximately 120 bp between forward and reverse reads.
Raw paired-end reads were demultiplexed based on unique barcodes and merged using FLASH (v1.2.7) (Magoc and Salzberg, 2011). Data quality was inspected using FastQC (Brown et al., 2017). To ensure high-quality datasets, low-quality sequences (quality score <30) were filtered out using QIIME (v1.9.1) (Bokulich et al., 2013). Finally, the filtered sequences were processed using the UNOISE3 pipeline (Edgar, 2016) to generate an OTU (Operational Taxonomic Units) table, with the similarity threshold set at 100 %. OTUs with fewer than 10 reads or appearing in fewer than 3 samples were removed to eliminate potential contaminants. Representative sequences were extracted from the OTU table and taxonomically annotated against the PR2 database (Protist Ribosomal Reference Database, Guillou et al., 2012) using BLAST (version 2.7.1). OTUs not classified under Foraminifera (rank 3 in the PR2 database) were subsequently discarded. OTUs annotated as Foraminifera yet unassigned at the Order level or lower were collectively categorized as “Others”.
For eDNA data, relative abundance was defined as the proportion of reads assigned to a given taxon relative to the total number of foraminiferal-derived reads in the sample. The OTU table was used to quantify the species number and relative abundance of each foraminifera taxon under different salinity conditions, as well as the alpha diversity indices of the community. Spearman correlation analysis between each taxon (as well as community diversity) and salinity was performed using SPSS software. For data showing significant correlations, figures were generated in Origin with linear fitting equations, plotted using a 95 % confidence interval. The eDNA based phylogenetic tree is available in the Supplement.
3.1 Morphological analysis of benthic foraminifera
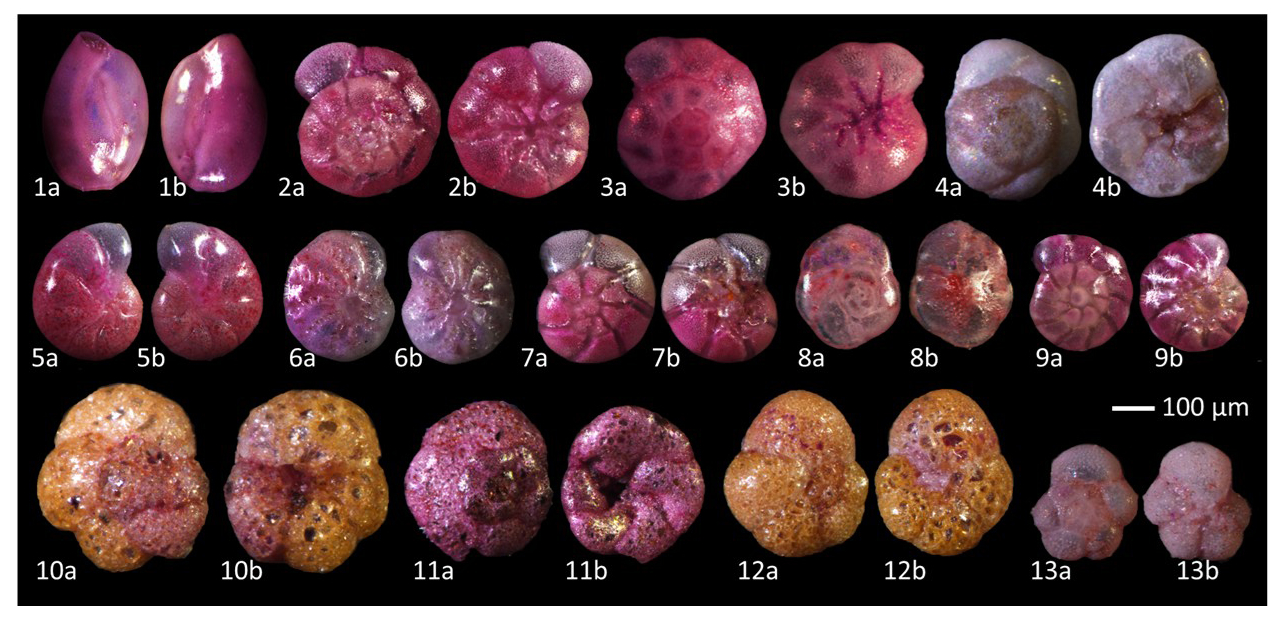
Figure 2Micrographs of benthic foraminifera. (The samples were fixed and stained with Rose Bengal dye to differentiate living organisms.) Note: 1. Quinqueloculina seminula, 2. Ammonia tepida, 3. Ammonia sobrina, 4. Rosalina vilardeboana, 5. Cribrononion gnythosuturatum, 6. Elphidium macellum, 7. Ammonia aomoriensis, 8. Buccella frigida, 9. Ammonia beccarii, 10. Ammoglobigerina globigeriniformis, 11. Trochammina squamata, 12. Trochammina inflata, 13. Murrayinella globosa.
In this study, traditional morphological methods identified a total of 9077 foraminiferal specimens belonging to 13 species, of which 7217 were stained live specimens (see Fig. 2, Table S1 in the Supplement). Foraminiferal abundance at each salinity level is shown at the top of the bar chart in Fig. 3A. Overall, foraminiferal abundance exhibited an increasing trend with increasing salinity. Foraminifera species numbers exhibited slight fluctuations across salinity levels, with the highest species count of 13 recorded at the 55 PSU salinity gradient and the lowest count of 10 species documented at 10 PSU. The relative abundance and species number of different taxonomic composition across salinity levels is demonstrated in Fig. 3 (A/B) and Table S3a in the Supplement. The Rotaliida group comprised nine species, accounting for 66.52 % of the total specimens. The relative abundance of these species peaked at 15 PSU, where they constituted 84.70 % of the total specimens. The Miliolida group comprised one species, accounting for 30.59 % of the total specimens. At its highest relative abundance, it reached 45.20 % at a salinity of 55 PSU. The Textulariida group comprised three species, accounting for 2.89 % of the total specimens. Their maximum relative abundance was recorded as 5.59 % at a salinity gradient of 30 PSU.
The dominant species in the community were Quinqueloculina seminula, Cribronion gnythosuturatum, Ammonia aomoriensis, Ammonia beccarii, and Ammonia tepida. The combined abundance of these five dominant species accounted for 89.18 % of the total foraminifera count. A Spearman correlation analysis was conducted between the relative abundances of the three taxonomic groups and salinity (Table 1). The results demonstrated a statistically significant negative correlation between the relative abundance of Rotaliida and salinity (p<0.01). The relative abundance of the Rotaliida group decreased from approximately 80 % at low salinities (5–20 PSU) to around 50 % at high salinity (55 PSU). A regression model (Fig. 4A), , was developed to describe the relationship between the variables (p<0.01, R2=0.69). The relative abundance of the Milioliida group showed a significant positive correlation with salinity (p<0.01).
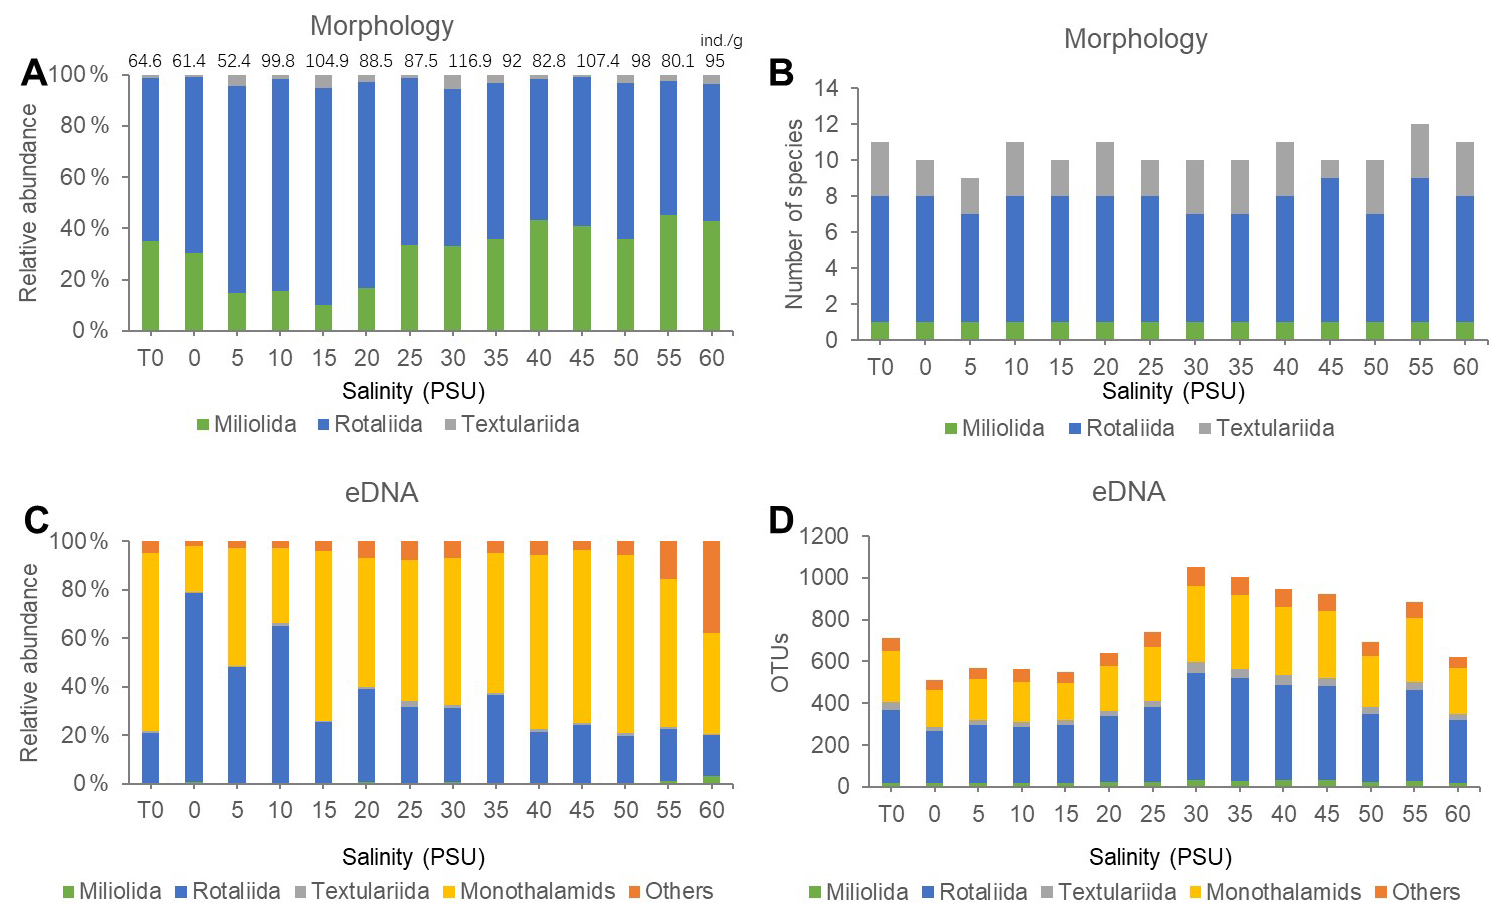
Figure 3Culture experiment results: relative abundance of taxa (A/C) at various salinities using morphological and eDNA methods, the number of species identified by morphological methods (B) and alongside the number of OTUs per taxon in the eDNA method (D). The total abundance of foraminifera is indicated above each bar in panel (A).
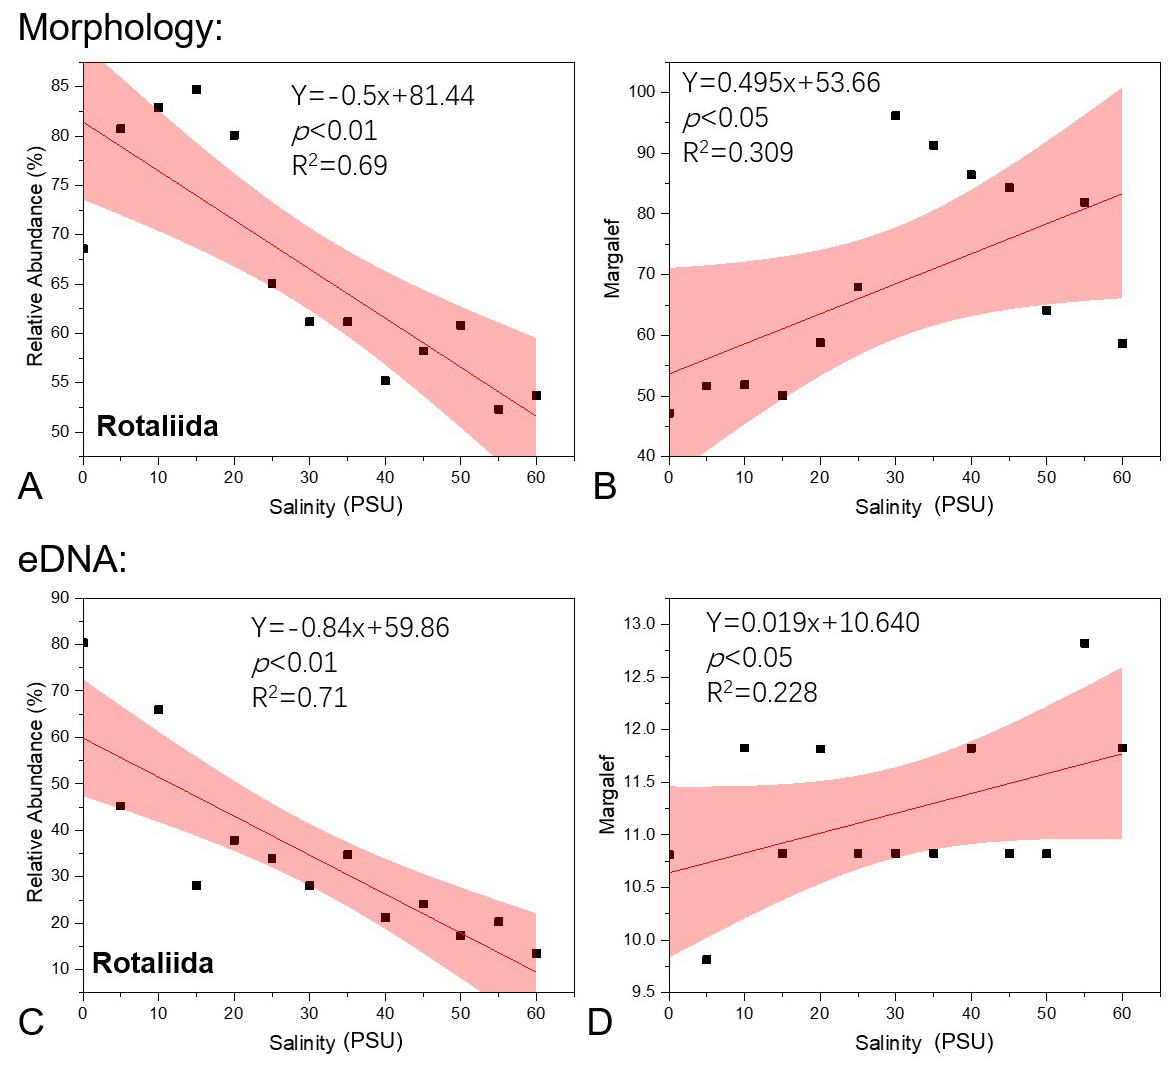
Figure 4Regression function fitting plots for the relative abundance of Rotaliida (A, C) and the Margalef diversity index of the foraminifera community (B, D) against salinity levels in this study's morphological and eDNA methods, with the pink area indicating the 95 % confidence interval.
Table 1Spearman correlation coefficients (R values) between foraminiferal taxa detected by morphological and eDNA methods and salinity levels.
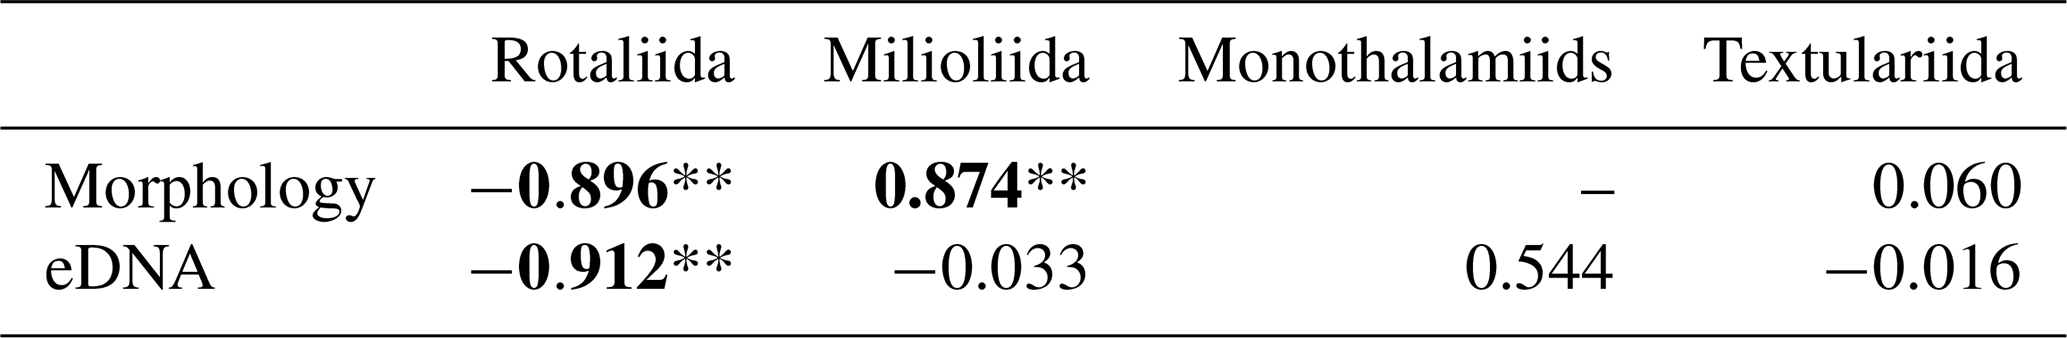
Bold text indicates statistically significant correlations (* p<0.05, ** p<0.01).
The alpha diversity of foraminiferal assemblages obtained using morphological methods at various salinities is shown in Table S3b in the Supplement. Based on morphological statistical results, the Spearman correlation analysis between benthic foraminiferal community diversity indices and salinity is presented in Table 2. The results indicate that the Margalef index exhibits a significant positive correlation with salinity, while the Simpson index of the community shows a significant negative correlation with salinity. The Margalef diversity index increased from 9.814 at the lowest salinity of 5 PSU to 12.823 at 55 PSU, while the Simpson index decreased from 0.978 to 0.796 over the same salinity range. Consequently, a linear regression function was established between the Margalef index and salinity gradient (Fig. 4B): (p<0.05, R2=0.309).
Table 2Spearman correlation coefficients between alpha diversity of foraminiferal communities detected by morphological and eDNA methods and salinity levels.
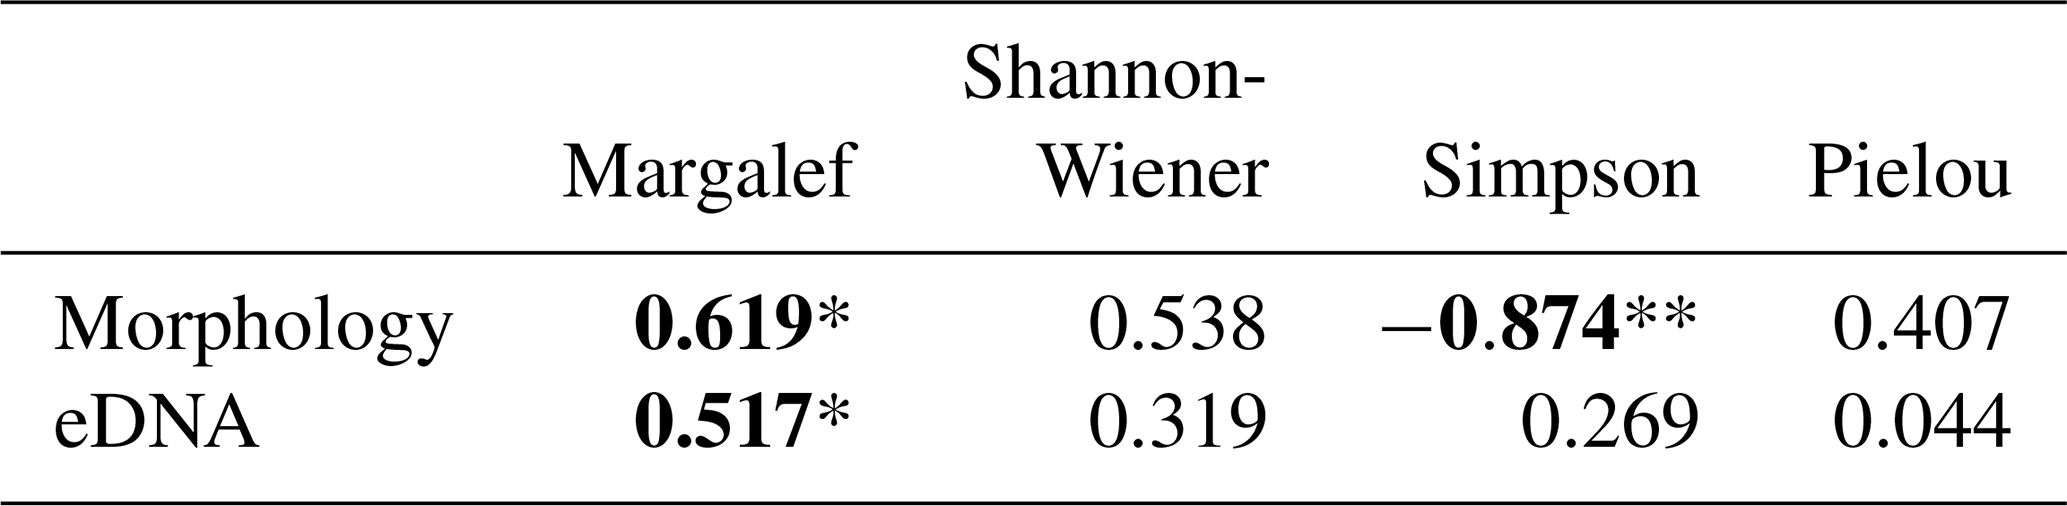
Bold text indicates statistically significant correlations (* p<0.05, ** p<0.01).
3.2 Environmental DNA results of benthic foraminifera
In this eDNA experiment, the amplified fragments utilized for sequencing exhibited an approximate length of 380 base pairs. Subsequent to the implementation of quality control measures, the results yielded a total of 773 819 DNA sequences, which were annotated into 1977 OTUs and matched to 103 species. Rarefaction analysis was performed on the eDNA data (Fig. 5A, Table S2 in the Supplement Materials). The curves for all treatment groups levelled off as the number of reads increased, suggesting that the sampling effort was adequate to represent the benthic foraminiferal diversity. The number of OTUs in samples at different salinities is shown in Fig. 3D. The results obtained from the study indicate that the total number of foraminiferal OTUs increased initially and then decreased under experimental conditions ranging from 0 to 60 PSU (Fig. 3A, Table S3b in the Supplement), with a peak observed near 30 PSU. Moreover, the trend was more pronounced in the low-salinity range (0–30 PSU) compared to the high-salinity range (35–60 PSU).
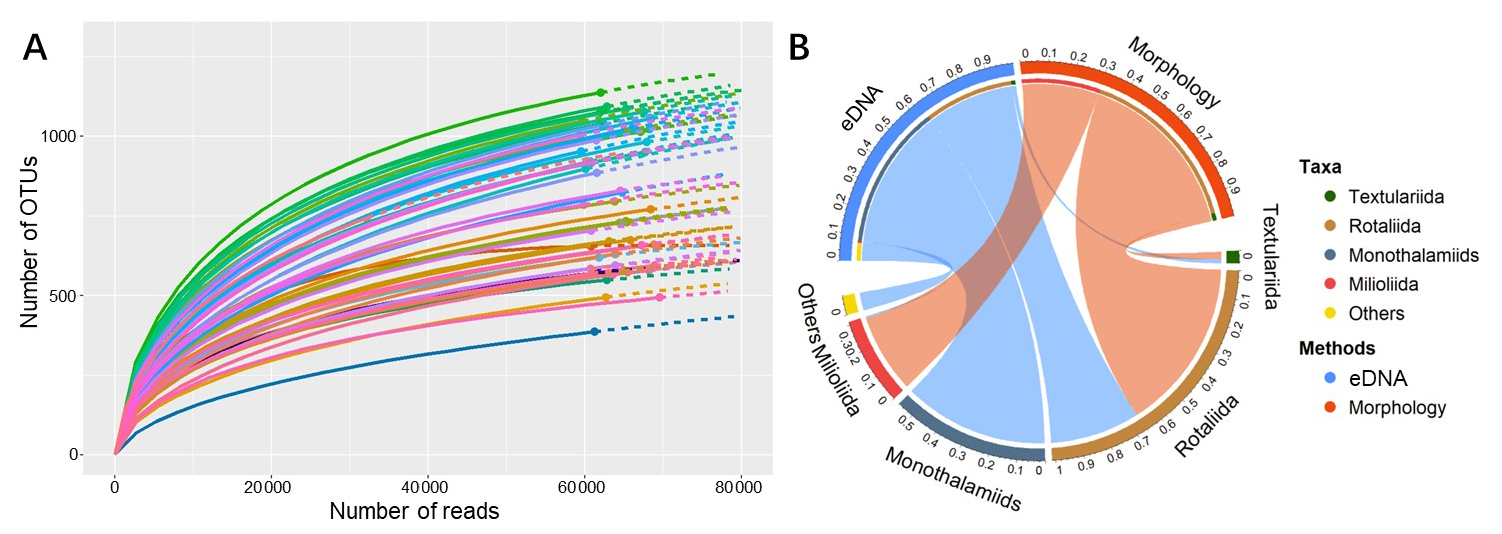
Figure 5(A) Rarefaction curves for eDNA samples, plotting the number of OTUs against sequencing reads. Colored curves represent individual samples from each salinity level, with replicates shown in distinct shades. (B) Chord diagram comparing the community composition of benthic foraminifera obtained by molecular (eDNA) and morphological approaches. Note: Each outer semicircle represents a method's dataset (Molecular/Morphology), independently normalized to 100 %. Numbers on the outer ring indicate relative abundance. Inner coloured arcs represent taxa; their widths equal the sum of relative abundances from both methods, showing total detection strength. Ribbons connect taxa to methods; their endpoint widths equal the taxon's relative abundance within that method's dataset.
In terms of taxonomic composition (Fig. 5B, Table S3a in the Supplement), the eDNA data detected Monothalamiids, a group typically overlooked by morphological analysis. Additionally, a portion of taxonomically unresolved taxa were grouped as “Others”. Monothalamiids exhibited the highest read count, accounting for 56.06 % of the total reads. The maximum relative abundance recorded for this group was 76.19 %, which was achieved under the 50 PSU salinity gradient (Fig. 3C). The Rotaliida constituted 34.65 % of the total reads, achieving a maximum relative abundance of 80.34 % under the 0 PSU salinity gradient. The Textulariida class accounted for 1.67 % of the total reads, with a maximum relative abundance of approximately 3.43 % at the 30 PSU salinity gradient. The Milioliida class constituted 0.66 % of the total reads, exhibiting a maximum relative abundance of 4.70 % at the 10 PSU salinity gradient.
As the salinity gradient increases, there is a concomitant decrease in the proportion of Rotaliida, accompanied by a slight increase in the proportion of Monothalamiids. A Spearman correlation analysis was conducted between each group and salinity, revealing a highly significant negative correlation (p<0.01) between Rotaliida relative abundance and salinity (Table 1). With increasing salinity, Rotaliida abundance dropped from 80.344 % (0 PSU) to 13.467 % (60 PSU), while Monothalamiids abundance increased from 18.088 % (0 PSU) to 76.195 % (50 PSU). As shown in Fig. 4C, the following linear regression equation was established: the regression equation can be expressed as (p<0.01, R2=0.71).
The number of reads, OTUs, and alpha diversity of each salinity treatment group obtained using the eDNA method are presented in Table S3b in the Supplement. Spearman's correlation analysis based on eDNA data revealed a significant positive correlation between the Margalef diversity index and salinity (Table 2). With increasing salinity, the foraminiferal community's Margalef diversity index showed an overall increase from 47.195 at 0 PSU to 81.902 at 55 PSU, peaking at 96.170 at an intermediate salinity of 30 PSU. Consequently, a regression model was established to quantify this relationship (Fig. 4D), yielding the following equation: (p<0.05, R2=0.228).
4.1 Investigation into the salinity adaptability of benthic foraminifera communities
The formation of foraminiferal community structures is driven by multiple environmental factors, including food supply, temperature, salinity, pH, and dissolved oxygen. These factors influence survival, reproduction, and shell preservation, thereby shaping sedimentary records (Gooday, 2003). For planktonic foraminifera, community dynamics are more strongly governed by hydrological conditions and variations in primary productivity. In contrast, for benthic foraminifera, particularly within marginal sea environments, abiotic factors such as temperature and salinity frequently exert a dominant influence (Chaabane et al., 2024; Groeneveld et al., 2018). This study, which was conducted through multi-gradient salinity culture experiments on intertidal sediments, found that both molecular and morphological methods could detect viable foraminifera even under extreme low-salinity (0 PSU) and high-salinity (60 PSU) conditions. Furthermore, the Margalef index demonstrated a significant increase in community diversity with rising salinity, indicating that salinity is a key driver influencing community structure, with high salinity promoting greater complexity in community composition.
Foraminifera exhibit a remarkably broad tolerance of salinity levels. In the Burullus Lagoon, large populations of Ammonia tepida flourish across a salinity range of 1.5 to 14.6 PSU, accounting for over 97 % of the total foraminiferal community (Orabi et al., 2017). Ammonia beccarii has been found in lagoons in southern California with a salinity range of 15–68 PSU and in salt marshes along the southern European coast with a salinity range of 7–92 PSU. It exhibits no discernible morphological variation in response to environmental conditions (Boltovskoy et al., 1991). However, such broad tolerances reported for single morphospecies should be interpreted with caution, as they may partly reflect the cumulative response of multiple cryptic species within the Ammonia genus – a group now recognized for its extensive genetic diversity (Goetz et al., 2025). This taxonomic complexity underscores the need for molecular identification to fully understand species-specific ecological responses. We recognize that integrating high-resolution genetic identification with traditional morphological analyses in future research is essential to fully resolve the ecological responses of distinct cryptic species within the Ammonia complex. This constitutes a key direction for subsequent studies. Nonetheless, changes in salinity levels often result in the deformation or dissolution of foraminifera shells, as well as alterations to the structure of the community (Amao et al., 2018; Saraswat et al., 2015).
Although foraminifera exhibit a broad tolerance to salinity variations, low-salinity environments cause a demonstrable decline in feeding and metabolic efficiency (Lintner et al., 2020; Nigam et al., 2006; Sujata et al., 2011). Conversely, the collective of foraminifera exhibits a higher degree of tolerance to physiological stress induced by elevated levels of salinity (Debenay, 1990; Gull et al., 2025). The present study also revealed a significant positive correlation between the Margalef index of foraminiferal communities and salinity, with the diversity of benthic foraminifera increasing as salinity rises. This finding aligns with in situ observations in the Yellow Sea, where diversity is primarily limited by freshwater input (Lei et al., 2017). However, it is crucial to contextualize this linear trend within broader global patterns. As noted by Poag (2015) in the Gulf of Mexico, extreme hypersaline environments (e.g., Laguna Madre) often exhibit low-diversity assemblages dominated by Milioliida, mirroring the stress response seen in hyposaline waters. The continuous increase in diversity observed in our experiment suggests that for the Qingdao Bay community, hyposaline stress exerts a more severe physiological filter than the hypersaline levels tested (up to 60 PSU). In order to apply salinity parameters to paleoenvironmental reconstructions, multiple experimental runs are required. Increases in both density and breadth of experimental setups, in conjunction with extended cultivation periods, would yield more precise results.
4.2 The Relationship Between the Biomineralizations of Two Calcareous Foraminiferal Groups and Salinity
The biomineralization mechanisms of different foraminiferal taxa are closely linked to their ecological environments (Weinkauf et al., 2013). In conditions of reduced seawater salinity, there is an increase in the solubility of carbon dioxide, resulting in calcium carbonate being placed in a low-concentration, unsaturated state. Porcelaneous foraminifera (Miliolida), representing an early-diverging lineage, utilize supersaturated seawater as a mother liquor (Bentov and Erez, 2006). The formation of acicular calcite crystals within cellular vesicles is a direct process, and these crystals are assembled at the site responsible for shell formation through a process of disordered precipitation (Nooijer et al., 2009). At higher salinities, the solubility of carbon dioxide is known to decrease, leading to calcium carbonate supersaturation. This environment is conducive to the growth of Miliolida, characterized by compact structures and disordered calcium carbonate crystal arrangements. Given the relatively elevated magnesium-to-calcium ratio characteristic of seawater, calcite formed under the shell-building mechanism of Miliolida exhibits elevated magnesium content (Nooijer et al., 2009). The magnesium content of different species of hyaline foraminifera (Rotaliida) varies considerably. In seawater of moderate salinity, where calcium carbonate approaches saturation or is slightly supersaturated, Rotaliida can gradually transform seawater into vesicles (Bentov et al., 2009), chemically modifying the seawater within the cell. This process involves the pumping out of hydrogen ions and magnesium ions, thereby raising the solution's pH. This process has been shown to facilitate the formation of more robust, less soluble, and orderly arranged low-magnesium calcite. This process has its origins in calcification genes that are unique to Rotaliida (Toyofuku et al., 2017; Ujiié et al., 2023).
Our quantitative data directly show that, in conditions of low salinity, there was a sharp decline in the abundance of foraminifera in Qingdao Bay. Among these, the high-magnesium calcite shells of porcelaneous Miliolida were prone to both physiological mortality and test dissolution, whereas the low-magnesium calcite shells of hyaline Rotaliida resisted dissolution more readily, leading to an increase in the relative abundance of Rotaliida. At higher salinities, the formation of shells was found to be more favourable for Miliolida, thereby explaining the higher relative abundance observed at elevated salinities in classical morphological analyses (Fig. 3A). Research undertaken hitherto has indicated that hyaline Rotaliida, for example Elphidium and Ammonia, exhibit a high level of tolerance to low-salinity environments, whereas porcelaneous Miliolida become more prevalent in highly saline conditions (Amao et al., 2018; Charrieau et al., 2018; Orabi et al., 2017).
Foraminifera, indicator organisms of great utility in the field of geology, are frequently employed to deduce paleo-oceanic temperatures by means of their shell magnesium-calcium ratios. Significant variations in the responses of different foraminiferal taxa are observed across salinity levels. In circumstances where species assemblages are divergent, the resultant community changes may manifest distinct patterns. Therefore, after controlling for temperature effects, foraminifera also serve as amplifiers of salinity variations, enabling salinity determination based on specific species assemblages (Murray, 2006; Strachan et al., 2015). Furthermore, when employing foraminifera as paleo-oceanic thermometers in geological studies, we recommend conducting faunal composition analyses beforehand to enhance the accuracy of results, a necessity further underscored by the fact that salinity influences -based thermometry (e.g., Lea et al., 1999; Katz et al., 2010).Regarding the direct reconstruction of paleo-salinity, the quantitative regression models derived in this study provide a specific reference framework. While our experimental results establish a specific reference framework for Qingdao Bay, we acknowledge that local environmental factors (e.g., temperature, substrate) vary across global estuaries. Thus, while the physiological trends (e.g., low-salinity sensitivity of Milioliida) are likely broadly applicable, the specific quantitative coefficients should be applied with caution when reconstructing paleo-salinity in geographically distant regions.
4.3 Traditional morphology and molecular biology methods
4.3.1 Complementarity of morphological and eDNA approaches
This study employed a combined approach of traditional morphology and environmental DNA (eDNA) analysis to examine the relationship between benthic foraminiferal communities and salinity response. The findings from both methodologies concurred on several conclusions: foraminiferal diversity exhibited a positive correlation with salinity, while the relative abundance of Rotaliida taxa demonstrated a significant negative correlation with salinity.
Molecular methods are a powerful tool for describing species diversity (Pawlowski et al., 2014). In this experiment, morphological analysis identified only 13 species, whereas eDNA detected 1977 OTUs annotated to 103 species, thereby better reflecting the diversity within the foraminiferan group. Moreover, soft-shelled Monothalamiids are often damaged during morphological preparation and lack distinct morphological characteristics, leading to their exclusion from traditional morphological studies due to the absence of relevant identification knowledge (Schönfeld et al., 2012). Molecular methods can detect these organic-walled groups, which constitute dominant taxa in eDNA analyses across all salinity levels. The discovery of this “hidden majority” has profound ecological implications. Relying solely on morphology leads to severe underestimation of benthic standing stock and biodiversity, and may result in misinterpretation of ecosystem resilience: while calcified taxa decline under stress, the persistence of soft-bodied forms represents a functional shift rather than a system collapse. Consequently, excluding this group limits our understanding of energy flow in the benthic food web.
Conversely, morphological methods provide valuable complementary insights that eDNA cannot fully capture. In this experiment, to avoid controversies arising from primer bias and sampling volume (Pawlowski et al., 2014), statistical analyses were conducted based on OTU counts and proportions rather than read abundances. In the eDNA dataset, the porcelaneous Milioliida group constituted a negligible proportion of total reads, making their community response to salinity gradients undetectable. In contrast, morphological analysis revealed that although the Milioliida assemblage was monospecific (represented only by Quinqueloculina seminula), its abundance was substantial, constituting a high proportion of total counts. Morphological quantification captured the dynamic response of this group to salinity stress: Milioliida are sensitive to low salinity (maintaining <20 % relative abundance at 5–20 PSU) but exhibit remarkable tolerance to hypersaline conditions, with relative abundances remaining high (∼40 %) at 40–60 PSU and peaking at 55 PSU. Notably, the slightly higher relative abundance at 0 PSU compared to 5 PSU is an artifact resulting from the sharp decline in total community density under extreme freshwater stress rather than a preference for freshwater. Additionally, traditional morphology enables observation of shell damage and deformities, providing insights into specific environmental impacts on foraminifera that molecular methods cannot offer.
Thus, integrating morphological and eDNA methods provides a holistic understanding of foraminiferal community responses to salinity, with morphology offering the essential reference for fossilizable taxa and eDNA revealing the full extent of biodiversity.
4.3.2 Methodological considerations and future directions
Both approaches are subject to inherent uncertainties when determining viability. Morphological identification is susceptible to factors such as staining efficiency and subjective judgment (Bernhard et al., 2006; Fontanier et al., 2002), while eDNA is unable to distinguish genetic signals originating from living, dead, or environmental residues (Pawlowski et al., 2014).
To minimize the potential impact of relic DNA, a well-recognized limitation of sediment based eDNA approaches, we homogenized the original sediment and split it equally across all culture dishes prior to the start of the experiment. Thus, all salinity treatments began with the same initial sediment pool and an identical baseline eDNA signal, allowing post incubation differences to be primarily attributed to differential community responses to salinity. Nevertheless, relic DNA may still introduce background noise and could dampen the detection of rapid community shifts. This may partly explain the discrepancy between morphological and eDNA data for the Miliolida. In the morphological dataset, Miliolida showed a clear increase in relative abundance with increasing salinity (Fig. 3A), consistent with their known tolerance to hypersaline conditions. In contrast, their eDNA signal was consistently low across most salinity treatments. A closer examination reveals that the relative abundance of Miliolida increased from 0.29 % at 0 PSU to 1.23 % at 60 PSU, indicating that the same directional trend, though much weaker, remains detectable. The attenuated signal may reflect lower DNA extraction efficiency, faster DNA degradation, or lower ribosomal copy numbers in this group, compounded by the masking effect of relic DNA from other taxa.
To address these limitations, environmental RNA (eRNA) has emerged as a promising tool for identifying metabolically active communities, due to its rapid degradation outside living cells, which better reflects contemporary biological activity (Chen et al., 2025; Qiao et al., 2025). Although eRNA methodology in foraminiferal research is still evolving and not yet standardized, recent studies, such as those revealing anaerobic metabolic adaptations in subseafloor foraminifera and the role of primary production in shaping benthic eukaryotic interactions, highlight its potential to uncover physiological and ecological responses inaccessible to traditional approaches (Mills et al., 2025; Orsi et al., 2020). The continued development and integration of eRNA with controlled laboratory culture systems will help directly resolve how salinity fluctuations influence active foraminiferal community structure and function, thereby extending the findings of this study toward more mechanistic, ecophysiologically meaningful insights.
This study involved collecting intertidal sediments for salinity gradient culture experiments. A combination of traditional morphological and molecular biological methods revealed that benthic foraminifera can survive under salinity conditions ranging from 0 to 60 PSU. The Margalef diversity index for benthic foraminifera increased markedly with increasing salinity, while the relative abundance of Rotaliida taxa decreased significantly. Specifically, robust linear regression models were established linking salinity to both the relative abundance of Rotaliida and community diversity. Moreover, the relative abundance of the Milioliida group, which dominates in morphological analyses, exhibits a positive correlation with salinity. Molecular methods employing high-throughput sequencing have detected a diverse array of Monothalamiids groups, whose relative abundance exceeds 50 %. The salinity-related linear functions derived in this study provide a critical quantitative baseline for calibrating proxies, supporting paleo-environmental reconstruction in the Yellow Sea and similar temperate marginal marine systems.
All data needed to evaluate the conclusions in the paper are presented in the paper and/or the Supplement.
The supplement related to this article is available online at https://doi.org/10.5194/bg-23-4187-2026-supplement.
YC and YL conceptualized the study and curated the data, and YC carried out the investigation and methodology. YC and FW developed the software and created the visualizations, with FW performing the formal analysis. YC prepared the original draft, and YL reviewed and edited the manuscript. YL also acquired funding, provided resources, and supervised the project.
The contact author has declared that none of the authors has any competing interests.
Publisher's note: Copernicus Publications remains neutral with regard to jurisdictional claims made in the text, published maps, institutional affiliations, or any other geographical representation in this paper. The authors bear the ultimate responsibility for providing appropriate place names. Views expressed in the text are those of the authors and do not necessarily reflect the views of the publisher.
We thank the supports from the international scientific program Ocean Negative Carbon Emissions (Global-ONCE).
This work received financial supports from the following project: the National Key Research and Development Program of China (grant no. 2022YFC2803800).
This paper was edited by Mark Lever and reviewed by Christopher Lowery and one anonymous referee.
Amao, A. O., Kaminski, M. A., and Babalola, L.: Benthic Foraminifera in Hypersaline Salwa Bay (saudi Arabia): an Insight into Future Climate Change in the Gulf Region?, J. Foraminifer. Res, 48, 29–40, https://doi.org/10.2113/gsjfr.48.1.29, 2018.
Bentov, S. and Erez, J.: Impact of biomineralization processes on the Mg content of foraminiferal shells: A biological perspective, Geochem. Geophys. Geosyst., 7, 11, https://doi.org/10.1029/2005GC001015, 2006.
Bentov, S., Brownlee, C., and Erez, J.: The role of seawater endocytosis in the biomineralization process in calcareous foraminifera, P. Natl. Acad. Ssi. USA, 106, 21500–21504, https://doi.org/10.1073pnas.0906636106, 2009.
Bernhard, J. M., Ostermann, D. R., Williams, D. S., and Blanks, J. K.: Comparison of two methods to identify live benthic foraminifera: A test between Rose Bengal and Cell Tracker Green with implications for stable isotope paleoreconstructions, Paleoceanography, 21, 1–8, https://doi.org/10.1029/2006pa001290, 2006.
Bokulich, N. A., Subramanian, S., Faith, J. J., Gevers, D., Gordon, J. I., Knight, R., Mills, D. A., and Caporaso, J. G.: Quality-filtering vastly improves diversity estimates from Illumina amplicon sequencing, Nat. Meth., 10, 57–59, https://doi.org/10.1038/nmeth.2276, 2013.
Boltovskoy, E., Scott, D. B., and Medioli, F. S.: Morphological variations of benthic foraminiferal tests in response to changes in ecological parameters: a review, J. Paleontol., 65, 175–185, https://doi.org/10.1017/S0022336000020394, 1991.
Bouchet, V. M. P., Alve, E., Rygg, B., and Telford, R. J.: Benthic foraminifera provide a promising tool for ecological quality assessment of marine waters, Ecol. Indic., 23, 66–75, https://doi.org/10.1016/j.ecolind.2012.03.011, 2012.
Bradshaw, J. S.: Laboratory Studies on the Rate of Growth of the Foraminifer, ”Streblus beccarii (Linné) var. tepida (Cushman)”, J. Paleontol., 31, 1138–1147, https://doi.org/10.12691/aees-7-6-6, 1957.
Bradshaw, J. S.: Preliminary Laboratory Experiments on Ecology of Foraminiferal Populations, Micropaleontology, 1, 351, https://doi.org/10.2307/1484479, 1955.
Brown, J., Pirrung, M., and Ann Mccue, L.: Fqc dashboard: integrates fastqc results into a web-based, interactive, and extensible fastq quality control tool, Bioinformatics, 33, 3137–3139, https://doi.org/10.1093/bioinformatics/btx373, 2017.
Chaabane, S., De Garidel-Thoron, T., Meilland, J., Sulpis, O., Chalk, T. B., Brummer, G.-J. A., Mortyn, P. G., Giraud, X., Howa, H., Casajus, N., Kuroyanagi, A., Beaugrand, G., and Schiebel, R.: Migrating is not enough for modern planktonic foraminifera in a changing ocean, Nature, 636, 390–396, https://doi.org/10.1038/s41586-024-08191-5, 2024.
Charrieau, L. M., Filipsson, H. L., Ljung, K., Chierici, M., Knudsen, K. L., and Kritzberg, E.: The effects of multiple stressors on the distribution of coastal benthic foraminifera: A case study from the Skagerrak-Baltic Sea region, Mar. Micropaleontol., 139, 42–56, https://doi.org/10.1016/j.marmicro.2017.11.004, 2018.
Chen, J., Zhao, J., Li, T., Qiao, L., Guo, Y., and Wu, Y.: Benthic foraminiferal community structure and response to environmental factors revealed through eDNA and eRNA metabarcoding in Beiji Archipelago, China, Environ. Monit. Assess, 197, https://doi.org/10.1007/s10661-025-14722-y, 2025.
Debenay, J.-P.: Recent foraminiferal assemblages and their distribution relative to environmental stress in the paralic environments of West Africa (Cape Timiris to Ebrie Lagoon), J. Foraminifer. Res., 20, 267–282, https://doi.org/10.2113/gsjfr.20.3.267, 1990.
Demianiuk, E., Baca, M., Popović, D., Barrenechea Angeles, I., Nguyen, N.-L., Pawlowski, J., Anderson, J. B., and Majewski, W.: Sedimentary ancient DNA insights into foraminiferal diversity near the grounding line in the western Ross Sea, Antarctica, Biogeosciences, 22, 2601–2620, https://doi.org/10.5194/bg-22-2601-2025, 2025.
Dissard, D., Nehrke, G., Reichart, G., and Bijma, J.: The impact of salinity on the Mg/Ca and Sr/Ca ratio in the benthic foraminifera Ammonia tepida: Results from culture experiments, Geochim. Cosmochim. Acta, 74, 928–940, https://doi.org/10.1016/j.gca.2009.10.040, 2010.
Edgar, R. C.: UNOISE2: improved error-correction for Illumina 16S and ITS amplicon sequencing, BioRxiv, 081257, https://doi.org/10.1101/081257, 2016.
Fontanier, C., Jorissen, F. J., Licari, L., Alexandre, A., Anschutz, P., and Carbonel, P.: Live benthic foraminiferal faunas from the Bay of Biscay: faunal density, composition, and microhabitats, Deep Sea Res. I, 49, 751–785, https://doi.org/10.1016/S0967-0637(01)00078-4, 2002.
Goetz, E. J., Yan, A., Hull, P. M., and Thomas, E.: Ammonia (foraminifera) in long island sound (USA): molecular and morphological diversity, J. Foraminifer. Res., 55, 45–59, https://doi.org/10.61551/gsjfr.55.1.45, 2025.
Gooday, A. J.: Benthic foraminifera (Protista) as tools in deep-water palaeoceanography: environmental influences on faunal characteristics, Adv. Mar. Biol., 46, 1–90, https://doi.org/10.1016/s0065-2881(03)46002-1, 2003.
Groeneveld, J., Filipsson, H. L., Austin, W. E. N., Darling, K., Mccarthy, D., Quintana Krupinski, N. B., Bird, C., and Schweizer, M.: Assessing proxy signatures of temperature, salinity, and hypoxia in the Baltic Sea through foraminifera-based geochemistry and faunal assemblages, J. Micropalaeontol., 37, 403–429, https://doi.org/10.5194/jm-37-403-2018, 2018.
Guillou, L., Bachar, D., Audic, S., Bass, D., Berney, C., Bittner, L., Boutte, C., Burgaud, G., de Vargas, C., Decelle, J., Del Campo, J., Dolan, J. R., Dunthorn, M., Edvardsen, B., Holzmann, M., Kooistra, W. H. C. F., Lara, E., Le Bescot, N., Logares, R., Mahé, F., Massana, R., Montresor, M., Morard, R., Not, F., Pawlowski, J., Probert, I., Sauvadet, A.-L., Siano, R., Stoeck, T., Vaulot, D., Zimmermann, P., and Christen, R.: The Protist Ribosomal Reference database (PR2): a catalog of unicellular eukaryote small sub-unit rRNA sequences with curated taxonomy, Nucleic Acids Res., 41, D597–D604, https://doi.org/10.1093/nar/gks1160, 2012.
Gull, H. M., Tawabini, B. S., Amao, A. O., Prayudi, S. D., Ayranci, K., and Kaminski, M. A.: Benthic Foraminiferal Response to a Salinity Gradient in the Uqair Hypersaline Lagoonal System, Gulf Coast of Saudi Arabia, Micropaleontology, 71, 261–279, https://doi.org/10.47894/mpal.71.3.04, 2025.
ISO 23040:2021, Marine environment impact assessment (MEIA) – Specification for marine sediments in seabed areas – Survey of interstitial biota, ISO copyright office, Geneva, Switzerland, 1–102 pp., ICS 07.080; 13.020.99; 47.020.99, 2021.
Jian, Z., Wang, L., Kienast, M., Sarnthein, M., Kuhnt, W., Lin, H., and Wang, P.: Benthic foraminiferal paleoceanography of the South China Sea over the last 40,000 years, Mar. Geol., 156, 159–186, https://doi.org/10.1016/S0025-3227(98)00177-7, 1999.
Katz, M. E., Cramer, B. S., Franzese, A., Hönisch, B., Miller, K. G., Rosenthal, Y., and Wright, J. D.: Traditional and emerging geochemical proxies in foraminifera, J. Foraminifer. Res., 40, 165–192, https://doi.org/10.2113/gsjfr.40.2.165, 2010.
Lea, D. W., Mashiotta, T. A., and Spero, H. J.: Controls on magnesium and strontium uptake in planktonic foraminifera determined by live culturing, Geochim. Cosmochim. Acta, 63, 2369–2379, https://doi.org/10.1016/S0016-7037(99)00197-0, 1999.
Lei, Y. and Li, T.: Atlas of Benthic Foraminifera from China Seas: The Bohai Sea and the Yellow Sea, Springer-Verlag GmbH Germany and Science Press, Beijing, 399 pp., ISBN 978-3-662-53876-0, 2016.
Lei, Y., Li, T., Jian, Z., and Nigam, R.: Taxonomy and distribution of benthic foraminifera in an intertidal zone of the Yellow Sea, PR China: Correlations with sediment temperature and salinity, Mar. Micropaleontol., 133, 1–20, https://doi.org/10.1016/j.marmicro.2017.04.005, 2017.
Lintner, M., Biedrawa, B., Wukovits, J., Wanek, W., and Heinz, P.: Salinity-dependent algae uptake and subsequent carbon and nitrogen metabolisms of two intertidal foraminifera (Ammonia tepida and Haynesina germanica), Biogeosciences, 17, 3723–3732, https://doi.org/10.5194/bg-17-3723-2020, 2020.
Maeda, A., Nishijima, M., Iguchi, A., Ota, Y., Suzumura, M., and Suzuki, A.: Environmental DNA metabarcoding of foraminifera for biological monitoring of bottom water and sediments on the Takuyo-Daigo Seamount in the northwestern Pacific, Front. Mar. Sci., 10–2023, https://doi.org/10.3389/fmars.2023.1243713, 2024.
Magoc, T. and Salzberg, S. L.: FLASH: fast length adjustment of short reads to improve genome assemblies, Bioinformatics, 27, 2957–2963, https://doi.org/10.1093/bioinformatics/btr507, 2011.
Mills, D. B., Vuillemin, A., Muschler, K., Coskun, Ö. K., and Orsi, W. D.: The Rise of Algae promoted eukaryote predation in the Neoproterozoic benthos, Sci. Adv., 11, eadt2147, https://doi.org/10.1126/sciadv.adt2147, 2025.
Murray, J. W.: Ecology and Applications of Benthic Foraminifera, Cambridge University Press, Cambridge, 426 pp., ISBN 978-0-521-82839-0, 2006.
Murray, J. W. and Alve, E.: Taphonomic experiments on marginal marine foraminiferal assemblages: how much ecological information is preserved?, Palaeogeogr. Palaeoclimatol. Palaeoecol., 149, 183–197, https://doi.org/10.1016/S0031-0182(98)00200-4, 1999.
Nigam, R., Khare, N., and Borole, D. V.: Can benthic foraminiferal morpho-groups be used as indicators of paleomonsoonal precipitation?, Estuar. Coast. Shelf S., 34, 533–542, https://doi.org/10.1016/S0272-7714(05)80060-5, 1992.
Nigam, R., Saraswat, R., and Kurtarkar Raikar, S.: Laboratory experiment to study the effect of salinity variations on benthic foraminiferal species – Pararotalia nipponica (Asano), J. Geol. Soc., India, 67, 41–46, https://doi.org/10.17491/jgsi/2006/670107, 2006.
Nooijer, L. J. d., Toyofuku, T., and Kitazato, H.: Foraminifera promote calcification by elevating their intracellular pH, P. Natl. Acad. Sci. USA, 106, 15374–15378, https://doi.org/10.1073/pnas.0904306106, 2009.
O'Brien, P., Barrenechea Angeles, I., Cermakova, K., Pawlowski, J., Alve, E., Nordberg, K., and Polovodova Asteman, I.: Assessing Environmental Quality in a Historically Polluted Fjord: A Comparison of Benthic Foraminiferal eDNA and Morphospecies Approaches, J. Geophys. Res.-Biogeosci., 129, e2023JG007781, https://doi.org/10.1029/2023JG007781, 2024.
Orabi, O. H., El-Badry, A. A., and Badr-Eldin, A. M.: Benthic foraminifera for heavy metal pollution monitoring: A case study from Burullus Lagoon of Egypt, Mar. Pollut. Bull., 121, 411–417, https://doi.org/10.1016/j.marpolbul.2017.06.015, 2017.
Orsi, W. D., Morard, R., Vuillemin, A., Eitel, M., Wörheide, G., Milucka, J., and Kucera, M.: Anaerobic metabolism of Foraminifera thriving below the seafloor, The ISME Journal, 14, 2580–2594, https://doi.org/10.1038/s41396-020-0708-1, 2020.
Pawłowska, J., Lejzerowicz, F., Esling, P., Szczuciński, W., Zajączkowski, M., and Pawlowski, J.: Ancient DNA sheds new light on the Svalbard foraminiferal fossil record of the last millennium, Geobiol., 12, 277–288, https://doi.org/10.1111/gbi.12087, 2014.
Pawlowski, J., Lejzerowicz, F., and Esling, P.: Next-generation environmental diversity surveys of foraminifera: preparing the future, Biol. Bull., 227, 93–106, https://doi.org/10.1086/BBLv227n2p93, 2014.
Pawlowski, J., Apothéloz-Perret-Gentil, L., and Altermatt, F.: Environmental DNA: What's behind the term? Clarifying the terminology and recommendations for its future use in biomonitoring, Mol. Ecol., 29, 4258–4264, https://doi.org/10.1111/mec.15643, 2020.
Pawlowski, J., Bruce, K., Panksep, K., Aguirre, F. I., Amalfitano, S., Apothéloz-Perret-Gentil, L., Baussant, T., Bouchez, A., Carugati, L., Cermakova, K., Cordier, T., Corinaldesi, C., Costa, F. O., Danovaro, R., Dell'anno, A., Duarte, S., Eisendle, U., Ferrari, B. J. D., Frontalini, F., Frühe, L., Haegerbaeumer, A., Kisand, V., Krolicka, A., Lanzén, A., Leese, F., Lejzerowicz, F., Lyautey, E., Maček, I., Sagova-Marečková, M., Pearman, J. K., Pochon, X., Stoeck, T., Vivien, R., Weigand, A., and Fazi, S.: Environmental DNA metabarcoding for benthic monitoring: A review of sediment sampling and DNA extraction methods, Sci. Total Environ., 818, 151783, https://doi.org/10.1016/j.scitotenv.2021.151783, 2022.
Poag, C. W.: Benthic foraminifera of the Gulf of Mexico: Distribution, ecology, paleoecology, Texas A&M University Press, ISBN 9781623491956, 2015.
Qiao, L., Wu, Y., Ren, C., Li, T., Guo, Y., and Zhao, A.: Benthic foraminiferal community structure and its response to heavy metals revealed using environmental DNA/RNA metabarcoding in Yueqing Bay, East China Sea, Mar. Pollut. Bull., 217, 118126, https://doi.org/10.1016/j.marpolbul.2025.118126, 2025.
Saraswat, R., Kouthanker, M., Kurtarkar, S. R., Nigam, R., Naqvi, S. W. A., and Linshy, V. N.: Effect of salinity induced pH/alkalinity changes on benthic foraminifera: A laboratory culture experiment, Estuarine, Estuar. Coast. Shelf S., 153, 96–107, https://doi.org/10.1016/j.ecss.2014.12.005, 2015.
Schönfeld, J., Alve, E., Geslin, E., Jorissen, F., Korsun, S., and Spezzaferri, S.: The FOBIMO (FOraminiferal BIo-MOnitoring) initiative – Towards a standardised protocol for soft-bottom benthic foraminiferal monitoring studies, Mar. Micropaleontol., 94–95, 1–13, https://doi.org/10.1016/j.marmicro.2012.06.001, 2012.
Sen Gupta, B. K.: Foraminifera in marginal marine environments. In Modern Foraminifera, Springer Netherlands, Dordrecht, 141–159 pp., ISBN 978-0-412-82430-2, 1999.
Strachan, K. L., Hill, T. R., Finch, J. M., and Barnett, R. L.: Vertical zonation of foraminifera assemblages in Galpins salt-marsh, South Africa, J. Foraminifer. Res., 45, 29–41, https://doi.org/10.2113/gsjfr.45.1.29, 2015.
Sujata, K. R., Nigam, R., Saraswat, L., and Rajeev, N.: Regeneration and abnormality in benthic foraminifera Rosalina leei: Implications in reconstructing past salinity changes, Riv. Ital. Paleontol. Stratigr., 117, 309–318, https://doi.org/10.13130/2039-4942/5970, 2011.
Toyofuku, T., Matsuo, M. Y., De Nooijer, L. J., Nagai, Y., Kawada, S., Fujita, K., Reichart, G.-J., Nomaki, H., Tsuchiya, M., Sakaguchi, H., and Kitazato, H.: Proton pumping accompanies calcification in foraminifera, Nat. Commun., 8, 14145, https://doi.org/10.1038/ncomms14145, 2017.
Ujiié, Y., Ishitani, Y., Nagai, Y., Takaki, Y., Toyofuku, T., and Ishii, S. i.: Unique evolution of foraminiferal calcification to survive global changes, Sci. Adv., 9, eadd3584, https://doi.org/10.1126/sciadv.add3584, 2023.
Weinkauf, M. F. G., Moller, T., Koch, M. C., and Kučera, M.: Calcification intensity in planktonic Foraminifera reflects ambient conditions irrespective of environmental stress, Biogeosciences, 10, 6639–6655, https://doi.org/10.5194/bg-10-6639-2013, 2013.
Ying, R., Monteiro, F. M., Wilson, J. D., Ödalen, M., and Schmidt, D. N.: Past foraminiferal acclimatization capacity is limited during future warming, Nature, 636, 385–389, https://doi.org/10.1038/s41586-024-08029-0, 2024.