the Creative Commons Attribution 4.0 License.
the Creative Commons Attribution 4.0 License.
 | 29 Jun 2026
Unlocking the potential of pollarded oaks: a 375-year hydroclimate reconstruction from northcentral Spain
Alba Sanmiguel-Vallelado
Max C. A. Torbenson
Jan Esper
Gabriel Sangüesa-Barreda
Carlos Prado-López
José Miguel Olano
Pollarded trees – traditionally pruned and maintained for centuries near rural settlements – represent an untapped resource for climate reconstruction in Mediterranean lowlands. In this study, we evaluate the potential of 102 pollarded deciduous oaks from two communal woodlands (dehesas) in northcentral Spain as proxies for past hydroclimatic variability. Using the correlation between latewood and November–June precipitation, we reconstruct regional precipitation variability from 1649 to 2023, achieving calibration/validation correlations of 0.84–0.71 against regional and large-scale instrumental datasets. The reconstruction reveals pronounced interannual to multidecadal variability, with precipitation ranging from 257 to 838 mm. The longest dry spell lasted 25 years (1818–1842), while the wettest sustained period extended over 21 years (1719–1739). We identify 8 extremely dry years and 19 extremely wet years consistently detected across the three threshold criteria considered. Pre-instrumental drought extremes are further supported by historical evidence, including Catholic pro pluvia rogations – ceremonies traditionally held in response to agricultural drought. Our findings demonstrate that pollarded trees, when sampled from sites with asynchronous management, preserve robust climate signals and provide reliable high-resolution information on precipitation variability across Mediterranean dehesas.
- Article
(5237 KB) - Full-text XML
-
Supplement
(2041 KB) - BibTeX
- EndNote


Precipitation variability, at both subseasonal to decadal timescales, is a primary driver of ecosystem productivity in Mediterranean environments (Bartsch et al., 2020; Gaona et al., 2022; Madrigal-González et al., 2017). Droughts, in particular, have long been a major concern, as evidenced by early documentary sources such as Arabic, Christian, and Byzantine chronicles and records (Brázdil et al., 2018; Dominguez-Castro and García-Herrera, 2016; Meklach et al., 2021). In fact, an increasing number of studies have linked extreme drought events to abrupt societal changes across the Mediterranean, from Ancient Greece to Medieval Spain (Camuera et al., 2023; Christian and Elbourne, 2018; Kaniewski et al., 2013). Although Mediterranean societies may have become more resilient to drought impacts (Savelli et al., 2022), reconstructing past precipitation variability remains essential for placing current changes (IPCC, 2023) into a broader temporal perspective and for distinguishing natural variability from anthropogenic forcing (Esper et al., 2024). This is particularly relevant considering the high uncertainty that still surrounds future precipitation projections (Hawkins and Sutton, 2011; Robinson et al., 2021; Rowell, 2012), and the fact that the Mediterranean region is recognized as a climate change hotspot (Giorgi, 2006).
However, long-term reconstructions of hydroclimate variability in lowland regions are still underrepresented, particularly in Mediterranean areas such as the Iberian Peninsula. To date, most dendrochronological reconstructions rely on mountain forests, for instance in the Central System (Ruiz-Labourdette et al., 2014) and the Iberian System (Esper et al., 2015; Tejedor et al., 2016, 2017), where tree growth mainly reflects late spring and summer precipitation. Yet, the high spatial variability of rainfall in mountainous areas limits the extrapolation of these data to lower elevations (Ljungqvist et al., 2020). Although several Mediterranean tree species, such as Pinus pinaster Ait. and Pinus halepensis Mill., show strong growth sensitivity to precipitation (Bogino and Bravo, 2008; Tejedor et al., 2020), a major limitation is the scarcity of long-lived individuals due to drought and human pressure (Peñuelas and Sardans, 2021; Piovesan and Biondi, 2021).
Pollarded oaks growing in dehesas could help fill this gap, as they are long-lived, highly sensitive to precipitation, and widespread in low- to mid-elevation areas close to human settlements (Olano et al., 2023). These culturally and ecologically emblematic open woodlands have been shaped over centuries by traditional practices such as pollarding and grazing (Butler, 2013; Harrison, 1996). Despite meeting key criteria of climate proxies, dehesas have been largely overlooked due to their regular management. Paradoxically, the same management has helped preserve ancient trees up to the present day, typically growing under low inter-tree competition, which enables the development of multi-centennial tree-ring chronologies (Camarero and Valeriano, 2023; Olano et al., 2023; Rozas, 2005). Pollarded trees exhibit robust precipitation signals spanning from prior autumn to current spring (Olano et al., 2023), a climatically critical period that encompasses key ecological and socio-economic phases, particularly those linked to staple crop production in nearby areas (Vicente-Serrano et al., 2013). Overall, dehesas represent a valuable yet underused resource for reconstructing long-term hydroclimatic variability in a region where high-quality and long climate records remain scarce (Leal et al., 2015).
Pollarding involves removing part of the tree canopy through systematic pruning at varying intensities (Petit and Watkins, 2003), traditionally aimed at obtaining essential provisioning materials such as poles for construction, charcoal, fodder for livestock and firewood (Ayanz, 1994; Moreno and López-Díaz, 2009). The management often leads to the formation of internal cavities with increasing tree age (Remm and Lõhmus, 2011), which poses a challenge for sampling and limits the development of long chronologies. Pollarding produces abrupt reductions in tree-ring width due to the interruption of latewood production immediately after cutting (Schweingruber, 2007). A previous study in deciduous oak dehesas of northcentral Spain found that this effect lasts on average about 3 years at a median pollarding interval of 21 years (Sanmiguel-Vallelado et al., 2024). The resulting growth anomalies have long been considered an obstacle for dendroclimatic research, as they were assumed to weaken the climatic signal. However, recent studies suggest that climatic signals can be preserved if pollarding occurred asynchronously among trees (Olano et al., 2023). As such, the pollarding effect may be seen as stochastic noise in the traditional dendroclimatic perspective of tree growth (Cook and Kairiukstis, 2013).
The main objective of this study was to use deciduous pollarded oaks for a formal climate reconstruction. To this end, we developed and analysed tree-ring width chronologies based on total ring width (RW), as well as earlywood and latewood widths (EW and LW, respectively) of Quercus faginea Lam. and Q. pyrenaica Willd. growing in two nearby communal woodlands of northcentral Spain. We pursued four objectives: (1) determine the species' growth sensitivity to precipitation; (2) assess to what extent traditional pollarding management alters the precipitation signal, both at the individual tree level and stand level; (3) evaluate the robustness and geographical reach of a low-elevation precipitation reconstruction model from pollarded oaks; (4) compare findings with existing large-scale reconstructions and historical documentary records. By presenting the first tree-ring-based hydroclimate reconstruction from pollarded oaks, we aim to advance understanding of the sensitivity of these culturally and ecologically important ecosystems.
2.1 Study area
The study area is located in the Soria province, northcentral Spain (Fig. 1). We sampled two communal woodlands that have been historically managed through asynchronous pollarding (Olano et al., 2023; Sanmiguel-Vallelado et al., 2024): Vilviestre (Vi; 41.88° N, 2.65° W, 1069 m a.s.l., 270 ha) and Valonsadero (Va; 41.81° N, 2.53° W, 1040 m a.s.l., 2793 ha), which are approximately 13 km apart. Both sites lie on sandstone-derived soils and experience a continental climate with Atlantic influences. Winters are typically cold with frequent frosts, while summers are hot, and the region is characterized by strong diurnal and seasonal temperature contrasts. The studied woodlands are dominated by deciduous oak species, although tree species composition varies between Vi, where Quercus faginea Lam. is more abundant, and Va, where Q. pyrenaica Willd. dominates. Data from both woodlands were combined to construct a single chronology for each ring component: total ring width, earlywood width, and latewood width.
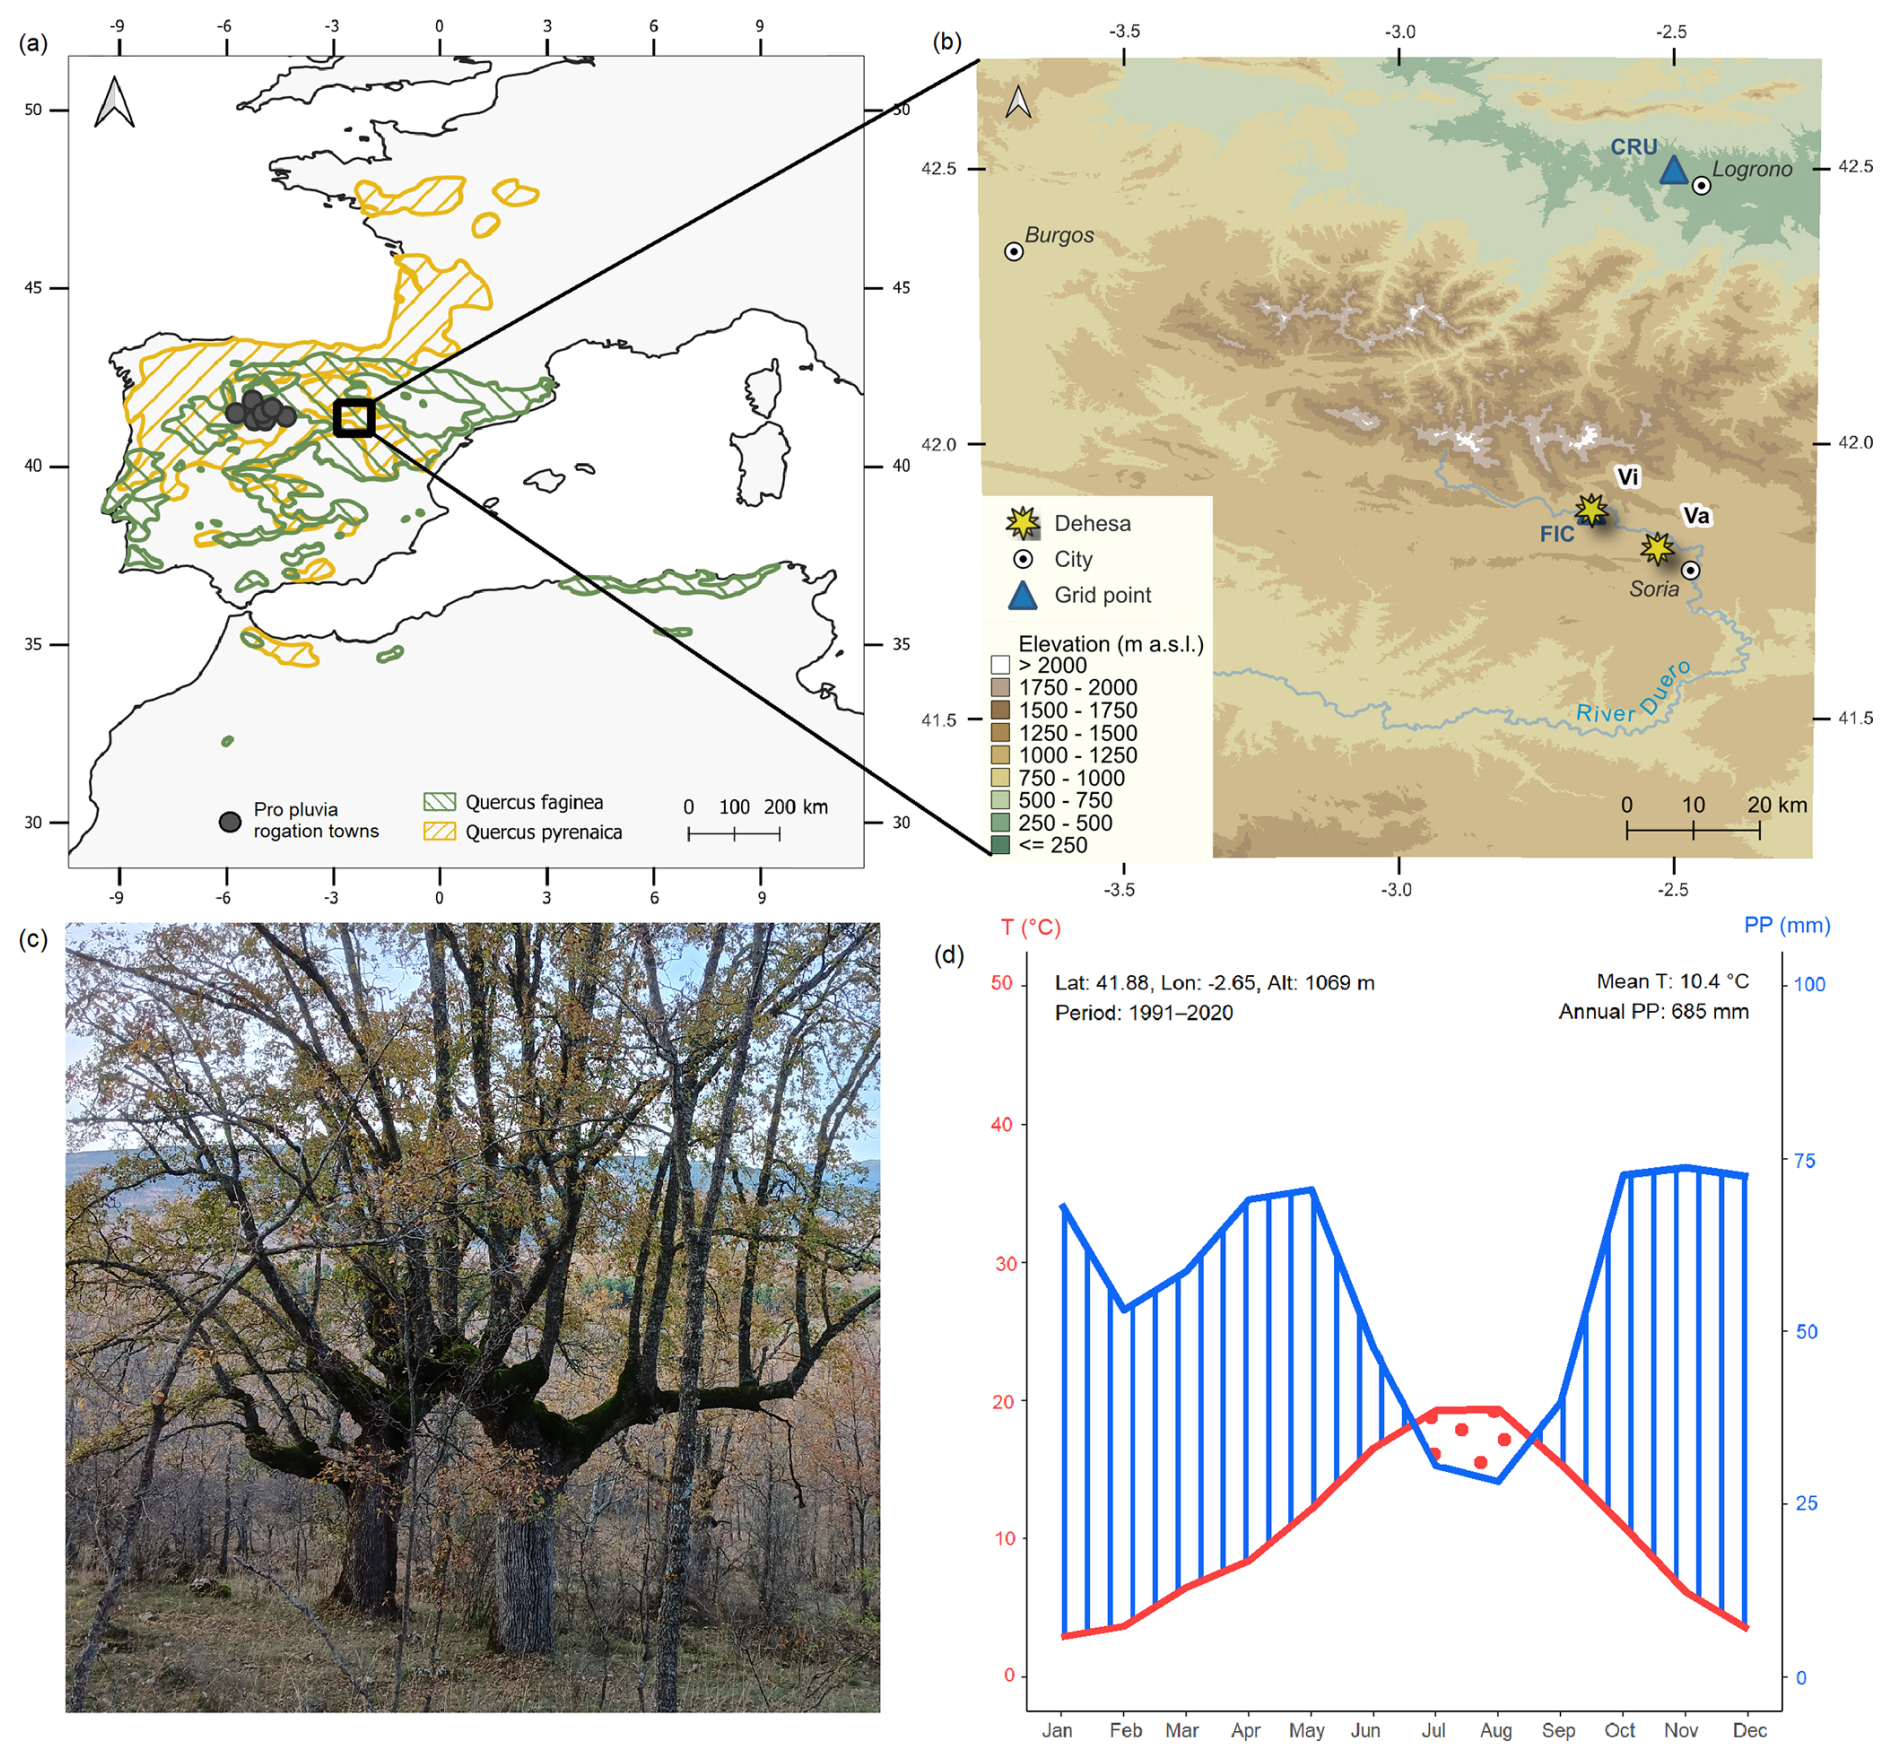
Figure 1(a) Distribution of Q. pyrenaica and Q. faginea in Europe and Northern Africa, adapted from Caudullo et al. (2017). (b) Location of the Vilviestre (Vi) and Valonsadero (Va) dehesas, northwest of Soria, as well as the central position of the grid cells from the Climate Research Unit (CRU) and Fundación para la Investigación del Clima (FIC) used to obtain climate data. Digital Terrain Model source: PNOA 1:200 000, ETRS89 HU30, Soria. (c) Pollarded Q. faginea trees in Vi. (d) Walter & Lieth climate diagram for Vi constructed from climate data from the FIC. The red line represents mean monthly temperature, and the blue line represents total monthly precipitation. Periods where precipitation falls below twice the temperature are classified as arid (shaded with red dots), while periods above this threshold are considered wet (shaded with blue lines).
2.2 Tree-ring data
Fieldwork was conducted between October 2022 and June 2024. Given the low competition and strong common signal among trees in the dehesas, we extracted only one core per tree using a Pressler increment borer (Olano et al., 2023). This sampling strategy prioritized the number of sampled individuals over multiple cores per tree in order to maximize the population-level common signal and avoid redundant management signals within the same individual. Although this design does not explicitly quantify within-tree growth variability, the large sample depth helps dilute individual-level noise in the mean chronology. To reduce the potential influence of synchronous management events, trees were sampled across the whole extent of each woodland. In total, 102 trees were sampled (62 in Vi, 40 in Va), comprising 45 Q. pyrenaica and 57 Q. faginea individuals. Tree cores were air-dried, mounted on wooden supports, and sanded with progressively finer grades ranging from 80 to 800 grit. High-resolution images were obtained using a CaptuRING device (García-Hidalgo et al., 2022), equipped with a Tokina Macro 100 mm f/2.8 lens mounted on a Nikon D7500 camera. Images were stitched using the PTGui software (New House Internet Services BV, Netherlands) resulting in a final resolution of 5897 dpi. Total ring width (RW), earlywood width (EW), and latewood width (LW) were measured manually using the CooRecorder software (Cybis Elektronik & Data AB, Sweden) at a precision of 0.004 mm. Cross-dating accuracy was assessed using the xDateR Shiny app.
To isolate the climate signal in tree-ring data, age-related growth trends were removed from individual RW, EW, and LW series using a cubic smoothing spline with a 50 % frequency-response cutoff set at two-thirds of the respective series length (Cook, 1985; Fritts, 1976). This procedure was applied identically to all three ring-width components and was implemented using the dplR package in R (Bunn, 2008, 2010; R Core Team, 2024). A sensitivity analysis comparing four detrending variants (a fixed-frequency spline with a 50-year cutoff and an age-dependent changing spline, each applied with and without prior power transformation) showed that correlations of the resulting LWI chronologies with FIC and CRU precipitation were not significantly different from those obtained with the selected method (pairwise Fisher z tests (Fisher, 1921), p > 0.05 in all cases; Table S1 in the Supplement). Ring width index (RWI), earlywood width index (EWI), and latewood width index (LWI) were calculated as the ratios between the observed values and fitted curves. All detrended series were then aggregated into residual chronologies by removing the remaining serial autocorrelation from a standard chronology previously computed using the bi-weight robust mean method (Cook, 1985). As part of the chronology-building procedure, separate site- and species-level latewood chronologies were examined for internal consistency, inter-correlation, and similarity in climate response. Because these subsets showed a coherent common signal and comparable precipitation sensitivity, the pooled latewood chronology was retained for reconstruction, as it maximized replication and chronology robustness without altering the target hydroclimatic signal. Chronology reliability was evaluated using the expressed population signal (EPS), calculated over 30-year windows lagged by 15 years. Chronologies were truncated to periods where EPS > 0.85, a commonly accepted threshold indicating sufficient signal strength for reliable population-level inference (Wigley et al., 1984).
2.3 Climate data
Monthly precipitation data for the study area were obtained from two sources: the Climate Research Unit (CRU) TS4.08 dataset (1901–2022; 0.5° resolution; Harris et al., 2020) and the Fundación para la Investigación del Clima (FIC, https://ficlima.org/, last access: 22 October 2024) database. The FIC database provides high-resolution gridded data (1 km2; 1951–2020) based on observed series from 5577 precipitation and 2515 temperature observatories across the Iberian Peninsula and the Balearic Islands. These series are interpolated monthly using a multivariable thin plate spline method (Duchon, 1976) that accounts for altitude, distance from the sea, longitude, latitude, and mountain range orientation. We used both datasets for subsequent analyses: FIC offers a high-resolution interpolated model, while CRU provides longer temporal coverage and is widely used in climate studies (Gebrechorkos et al., 2025; Kaser et al., 2010; Torbenson et al., 2025). Precipitation values from both sources were extracted for the grid point closest to Vi (Fig. 1).
2.4 Statistical analysis
2.4.1 Detection of climate signals in tree-ring chronologies
Correlation analyses between the RWI, EWI, and LWI chronologies and monthly/seasonal precipitation were performed using the treeclim package in R (Zang and Biondi, 2015). In consideration of lagged climate effects on tree growth (Fritts, 1976), both current-year and previous-year data were considered. We assessed the consistency of the climate signal over time, i.e., its temporal stability, by calculating moving correlations using 20-year windows. Additionally, spatial patterns were assessed by correlating the tree-ring chronologies with gridded CRU precipitation data across the Mediterranean basin.
2.4.2 Evaluation of the influence of pollarding on climate-growth relationships
Previous evidence indicates that growth reductions induced by pollarding diminish the climate signal in tree-ring series (Olano et al., 2023). We applied the method proposed by Sanmiguel-Vallelado et al. (2024) to identify pollarding events in individual tree-ring index series. This method uses a Random Forest model specifically trained to detect growth suppression and recovery patterns characteristic of pollarding.
We assessed the effect of pollarding events on the precipitation signal recorded in tree growth using CRU precipitation data. The procedure includes fitting three separate linear mixed-effects models (LMMs), one for each growth index (RWI, EWI, and LWI). The response variable in each model was the standardized tree-level growth index series. Fixed effects included the interaction between (1) time since the pollarding event – categorized as year 0 (the event itself), years 1 to 9, and year 10 (which includes all subsequent years) – and (2) the precipitation during the period most strongly correlated with each chronology (Sect. 3.2). Random effects accounted for repeated measures within individual trees.
To assess whether the pollarding-related signal loss observed at the tree level scales up to the stand-scale signal, we removed from each growth index series all post-pollarding years in which the climatic signal was significantly weakened. The filtered series were then used to build new chronologies following the same procedures described in Sect. 2.2. We subsequently recalculated and compared the strength of the precipitation signal between these chronologies and the original ones.
2.4.3 Calibration and validation of the reconstruction model using independent instrumental data
The reconstruction workflow comprised three sequential steps: (1) testing four calibration–validation schemes to identify the preferred modelling framework and assess model skill; (2) fitting the final regression model over the full FIC period and generating the raw reconstruction for 1649–2023; and (3) applying quantile mapping bias correction, trained against the CRU distribution over 1902–2022, to the entire reconstruction period. The bias-corrected series was then compared against the full CRU record as an evaluation of long-term consistency.
For step (1), we used the LWI chronology as the predictor and prior November–current June precipitation from the closest grid point as the response variable, selecting this seasonal window because it showed the strongest relationship among all tested combinations (Sect. 3.2). We adopted a cross-dataset calibration–validation approach using FIC data for late calibration (1962–2020) and CRU data for early validation (1902–1961), as this scheme provided the highest explained variance among the four alternatives tested (Table S8). Within each scheme, quantile mapping (QM) bias correction (Gudmundsson et al., 2012; Robeson et al., 2020) was applied using the RQUANT algorithm in the qmap R package (Gudmundsson, 2016), with the observed climate of the respective validation period as the target; the statistics in Table S8 therefore reflect the distributional fit of the QM-corrected series. Model performance was evaluated using adjusted coefficient of determination (adjusted R2), Pearson's correlation coefficient (r), reduction of error (RE), coefficient of efficiency (CE), and root-mean-square error (RMSE). Positive RE and CE values indicate model skill (Fritts, 1976). Prediction intervals at the 95 % confidence level were calculated using the predict() function from R's base stats package. For step (2), the final model was calibrated over the full available FIC period (1952–2020) to maximize temporal coverage and sample size. For step (3), QM bias correction was applied to the full raw reconstruction to correct distributional biases and better capture extreme values in the reconstruction, with the correction trained by mapping the raw reconstruction onto the observed CRU distribution over (1902–2022) and then applied unchanged to the entire 1649–2023 period.
2.4.4 Benchmarking against large-scale hydroclimate reconstructions and historical documentary records
To evaluate the reliability and regional consistency of the bias-corrected reconstruction, we compared it with several independent large-scale hydroclimatic reconstructions (Table 2). When applicable, series were extracted for the grid point closest to our study area: specifically, the 41.75° N, 2.75° W grid point for the European precipitation reconstruction (Pauling et al., 2006), the 40.74° N, 2.5° W grid point for the Paleo Hydrodynamics Data Assimilation product (PHYDA, Steiger et al., 2018), and the 42.25° N, 2.75° W grid point for the Great Eurasian Drought Atlas (GEDA, Cook et al., 2024). For reconstructions based on precipitation (rather than indices), seasonal values were summed to approximate the November–June seasonal window used in this study.
The reconstructed November–June precipitation covers the critical period for crop development in the region, a key socioeconomic sector strongly dependent on water availability throughout the growing season (Vicente-Serrano et al., 2020). Therefore, extremely dry years in the reconstruction likely reflect agricultural drought conditions. Extreme dry and wet years were identified using three alternative threshold criteria: values below or above ±1.5 standard deviations from the mean (Tejedor et al., 2017), values below the 5th percentile or above the 95th percentile (Link et al., 2020; Yu et al., 2025), and categories derived from the Standardized Precipitation Index (SPI), which expresses precipitation anomalies in standardized units (Svoboda et al., 2012). SPI was calculated in R using the spi() function from the SPEI package (Beguería and Vicente-Serrano, 2023) from the bias-corrected reconstructed November–June precipitation series. SPI-based extremes were defined as extremely wet (SPI ≥ 2.0), very wet (1.5 ≤ SPI < 2.0), very dry (−2.0 < SPI ≤ −1.5), and extremely dry (SPI ≤ −2.0). Multi-year dry or wet periods were defined as sequences of 10 or more consecutive years during which the 10-year running mean remained consistently below or above the mean (Niu et al., 2024).
To evaluate the reliability of these extreme values, we used historical records of pro pluvia rogations – Catholic ceremonies held to request rain during droughts affecting agriculture or livestock. These events are considered a robust proxy for pre-instrumental agricultural droughts in Spain (Dominguez-Castro and García-Herrera, 2016). From the rogations compiled by Domínguez-Castro et al. (2021), we selected 131 documented events corresponding to 81 different years between 1649 and 1929. These ceremonies took place in winter and spring across several localities surrounding the study area (latitude: 41 to 43°; longitude: −6.5 to −3.0°), consistent with the regional representativeness of our chronology (Fig. 2). The number of events held in each location is indicated in parentheses: Alaejos (1), Cabreros del Monte (1), Cuéllar (2), La Seca (2), Medina del Campo (1), Tordesillas (14), Valladolid (42), and Zamora (68). We then qualitatively evaluated the correspondence between pro pluvia rogation years and the dry extremes identified in the bias-corrected reconstruction using the three threshold criteria described above (±1.5 SD, 5th percentile, and SPI-based categories). This comparison was summarized in a table listing all reconstructed dry extremes and their documentary support (Bellido Blanco, 2017; Domínguez-Castro et al., 2010, 2012, 2021) and further illustrated with a figure showing rogation years superimposed on the SPI series. We also examined whether these years were corroborated by the Catalogue of Historical Droughts in Spain (Centro de Estudios Hidrográficos, 2013). For the instrumental period (1901–2023), drought episodes recorded in the Spanish Drought Catalogue (Trullenque-Blanco et al., 2024) were also considered. Finally, we used a Monte Carlo bootstrap test on the bias-corrected reconstructed precipitation series to assess whether mean precipitation during rogation years was significantly lower than expected by chance. We resampled 81 random years from the 1649–1929 period over 10 000 iterations and compared the observed mean for rogation years with the distribution of simulated means, from which two-tailed confidence intervals were derived.
3.1 Developed chronologies
A summary of the main descriptive statistics of the raw ring-width series (RW, EW, and LW) and the detrended series (RWI, EWI, and LWI) is presented in Table 1. All these metrics indicate that the sampled trees share a very strong common climate signal, which is stronger and more temporally coherent in the total ring-width and latewood components. Accordingly, the final truncated chronologies (EPS > 0.85) span 375 years (1649–2023) for RWI and LWI, with a sample size of 102 (Figs. S1 and S3), while the EWI chronology extends over a shorter period of 255 years (1769–2023) (Fig. S2). Running EPS values for detrended series are reported in Appendix A (Tables S2–S4). Data from both dehesas indicate that pollarding was markedly asynchronous among trees, with most events affecting only a small fraction of the available individuals: 75 % of detected events involved fewer than 6 % of trees available in the chronology at that time, and only 3 years exceeded 30 % synchrony (Fig. S4).
Table 1Descriptive tree-ring statistics. AR1 denotes first order autocorrelation. The mean correlation between trees (RBAR), signal-to-noise ratio (SNR), and expressed population signal (EPS) were calculated for detrended data.
3.2 Precipitation signal of the chronologies
Tree growth was primarily limited by moisture availability during and prior to the growing season, showing a strong positive correlation with winter–spring precipitation (Fig. S5). The LWI chronology exhibited the strongest association with November–June precipitation (r = 0.83, p < 0.001; Fig. S5). Precipitation from November to June accounted for an average of 75.64 % of the total annual precipitation, considering the hydrological year.
FIC and CRU precipitation series were highly correlated (r = 0.89, p < 0.001) and produced nearly identical growth–climate relationships during their overlapping period (RWI: r = 0.81–0.82; EWI: r = 0.56; LWI: r = 0.83; Fig. S6). These minor differences in correlations likely reflect the different spatial resolutions of the FIC and CRU datasets. However, when considering the full temporal extent of each dataset, the FIC series more effectively captured the climate signal embedded in the chronologies (r = 0.83; Fig. S5).
The spatial field correlation analysis confirmed that the LWI chronology captures a regional precipitation signal (1951–2022; Fig. 2a). The strongest correlations (r > 0.6) occurred across central and western Spain, excluding the Mediterranean seaboard. Significant but weaker correlations (r = 0.4–0.5) are also evident in western and southern France. Correlations performed for the earlier period (1902–1950; Fig. 2b) are spatially noisier and slightly weaker, reflecting the lower reliability of early instrumental data, but they remain significant and regionally consistent.
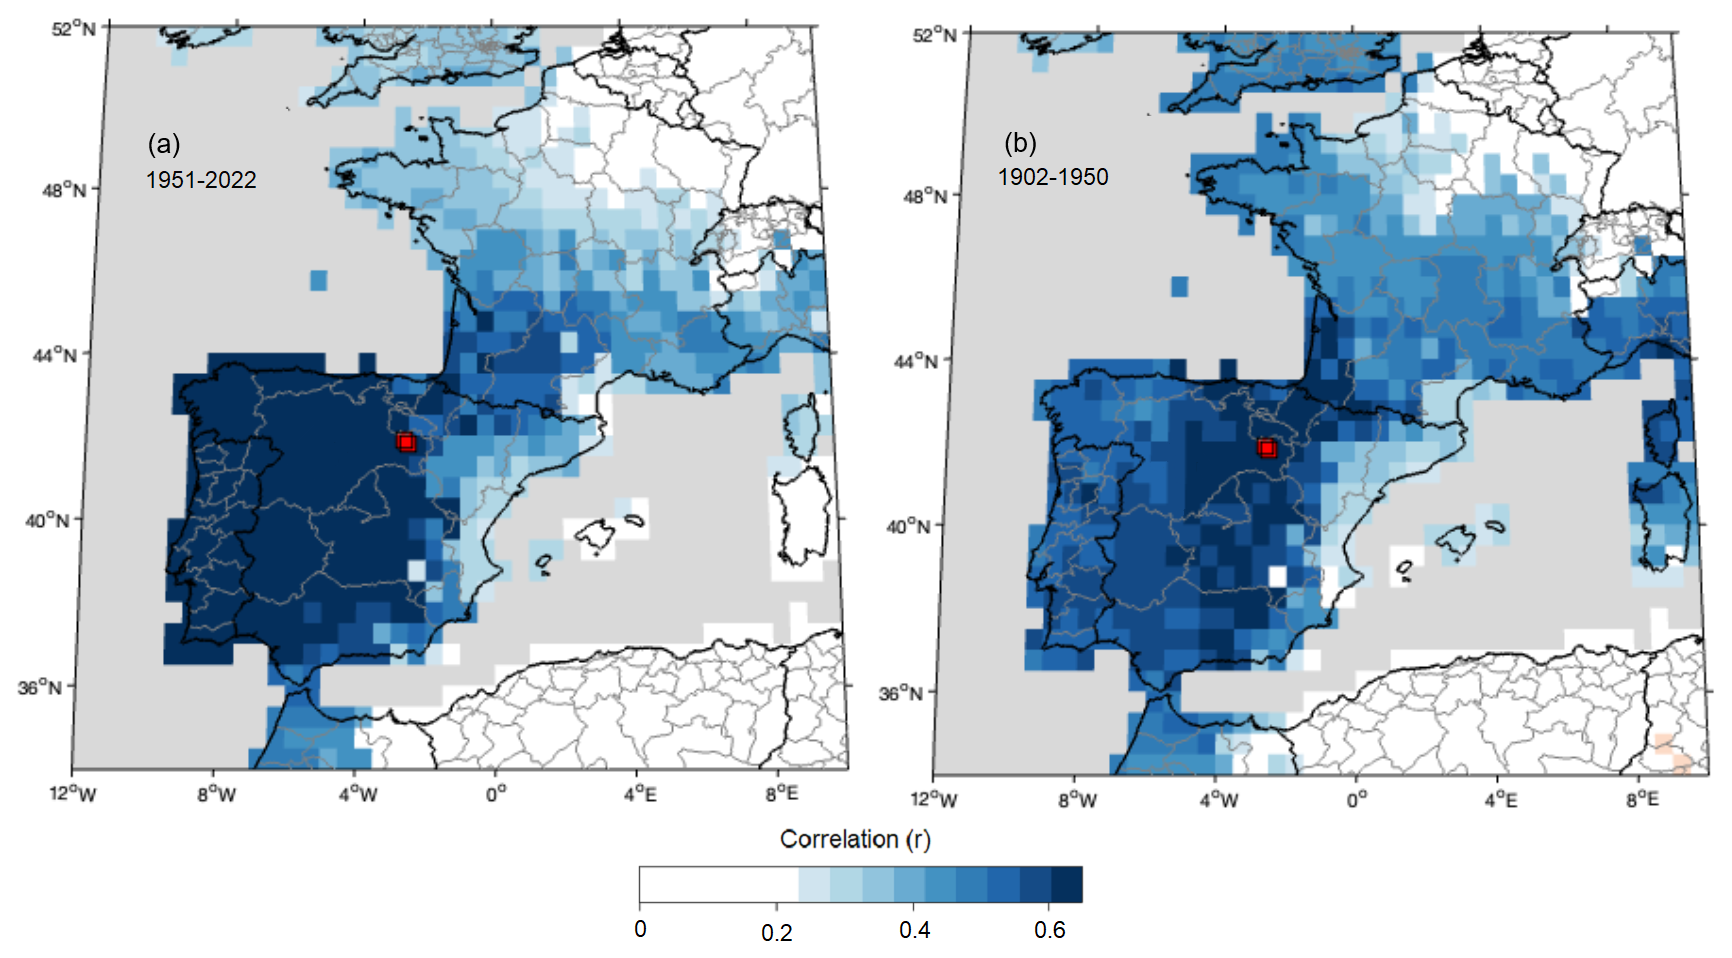
Figure 2Spatial field correlations (p < 0.05) between November–June precipitation (CRU) and the LWI chronology for two periods: (a) 1951–2022 and (b) 1902–1950. Red squares indicate the locations of the Vi and Va sampled dehesas.
3.3 Influence of pollarding on climate-growth relationships
Pollarding influenced the climate signal at the tree level. The climate sensitivity of the RWI series significantly declined in the second year after pollarding, while in the LWI series this effect persisted for 3 years (Fig. 3a; Tables S5–S7). During this period, growth in both the RWI and LWI series ceased to respond to climatic variations (Fig. 3b–c). However, from the eighth year onward, the climate sensitivity in both series surpassed pre-pollarding levels (Fig. 3a; Tables S5–S7). This increased sensitivity caused the growth of pollarded trees to reflect climatic variations in an amplified manner, showing stronger responses to drought episodes (reduced growth) as well as to periods of abundant rainfall (enhanced growth) compared to pre-pollarding conditions (Fig. 3b–c). In contrast, the EWI series did not show significant changes in its climate signal following pollarding (Fig. 3a; Table S6).
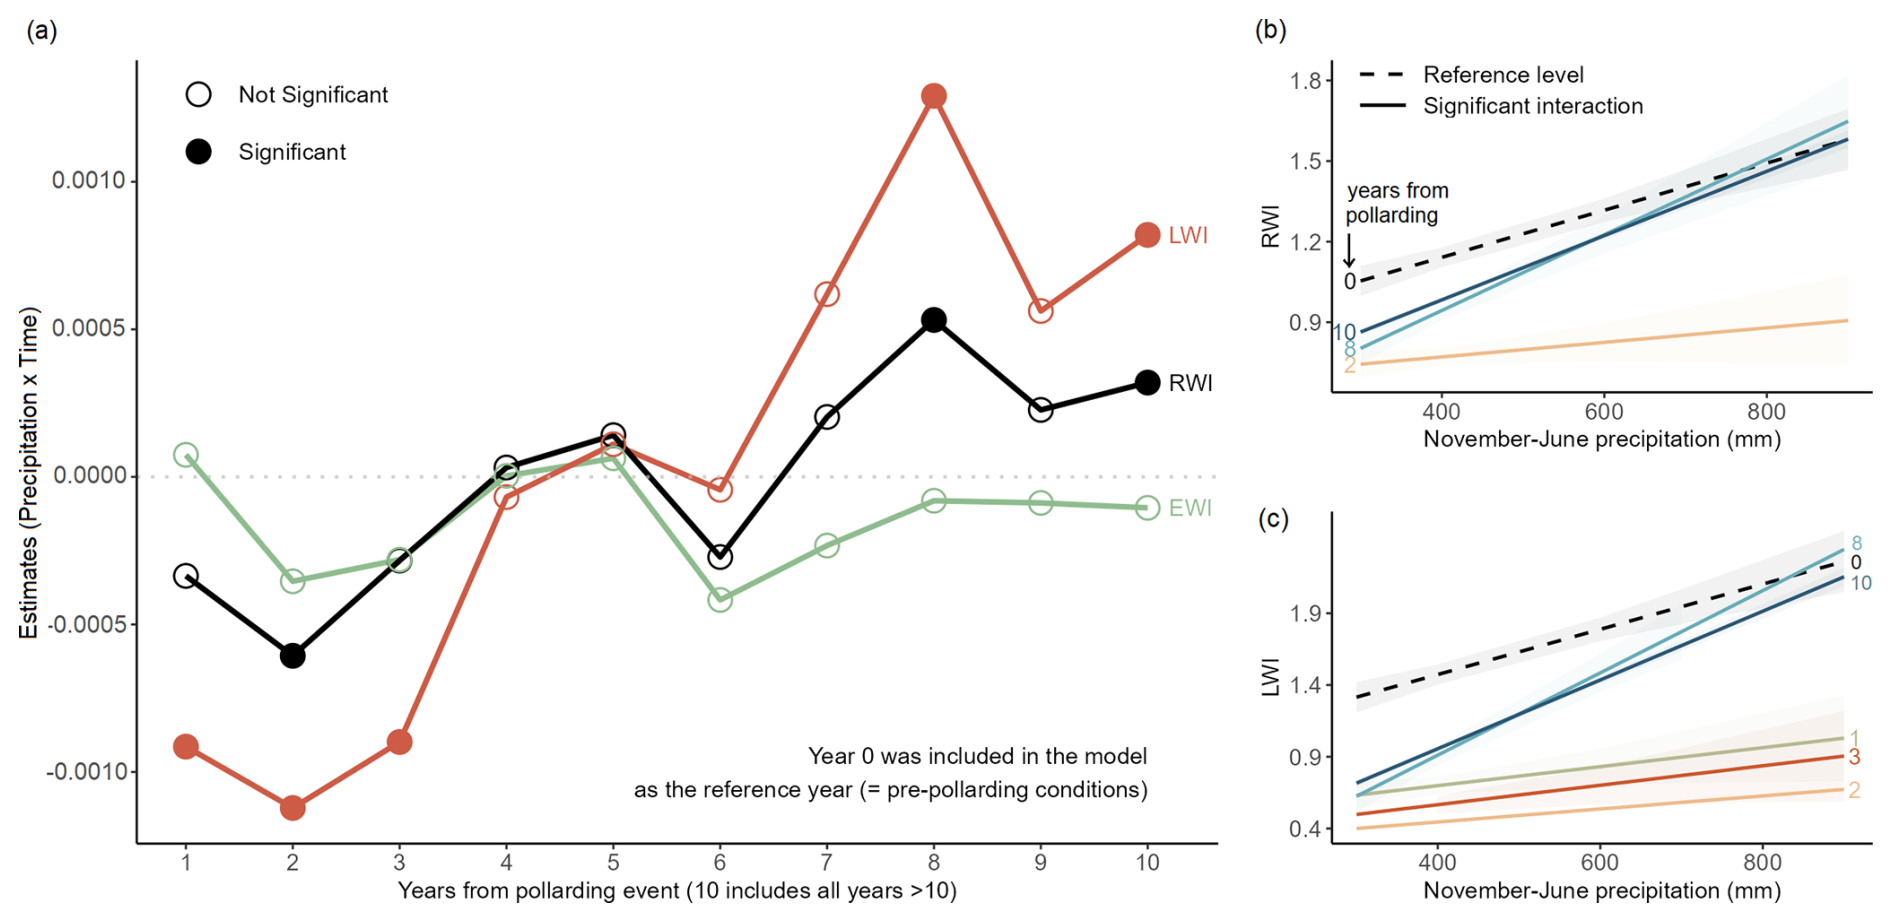
Figure 3(a) Changes in the seasonal precipitation signal following pollarding events (November–June for RWI and LWI; November–February for EWI). Years with signals significantly different from pre-pollarding conditions (p < 0.05) are marked with filled circles. (b–c) Significant interaction effects between November–June precipitation and time since pollarding on tree growth indices: (b) RWI and (c) LWI. Each line represents a different year since the pollarding event, with dashed lines indicating the reference year (Year 0) and solid lines representing years with significant interactions (p < 0.05). Shaded areas represent 95 % confidence intervals. Precipitation data source: CRU (1902–2022).
Despite this temporary reduction in climate signal at the tree level, filtering the affected years prior to building the stand-level chronologies (Fig. S7) – 1 year in RWI and 3 years in LWI – did not enhance their climate sensitivity (Fig. 4) or improve their temporal stability (Figs. S8–S9). Correlations between the RWI chronology and CRU precipitation data (1902–2022) remained stable before and after filtering (r = 0.74), as did correlations with FIC precipitation data (1952–2020; r = 0.82) (Fig. 4). The LWI chronology showed similar patterns, with correlations against CRU data consistently at 0.76 pre- and post-filtering, and correlations against FIC data increasing slightly from 0.83 to 0.84 after filtering (Fig. 4). These results indicate that pollarding did not compromise the climatic signal at the stand level, supporting the robustness of these chronologies for climate reconstruction without correction.
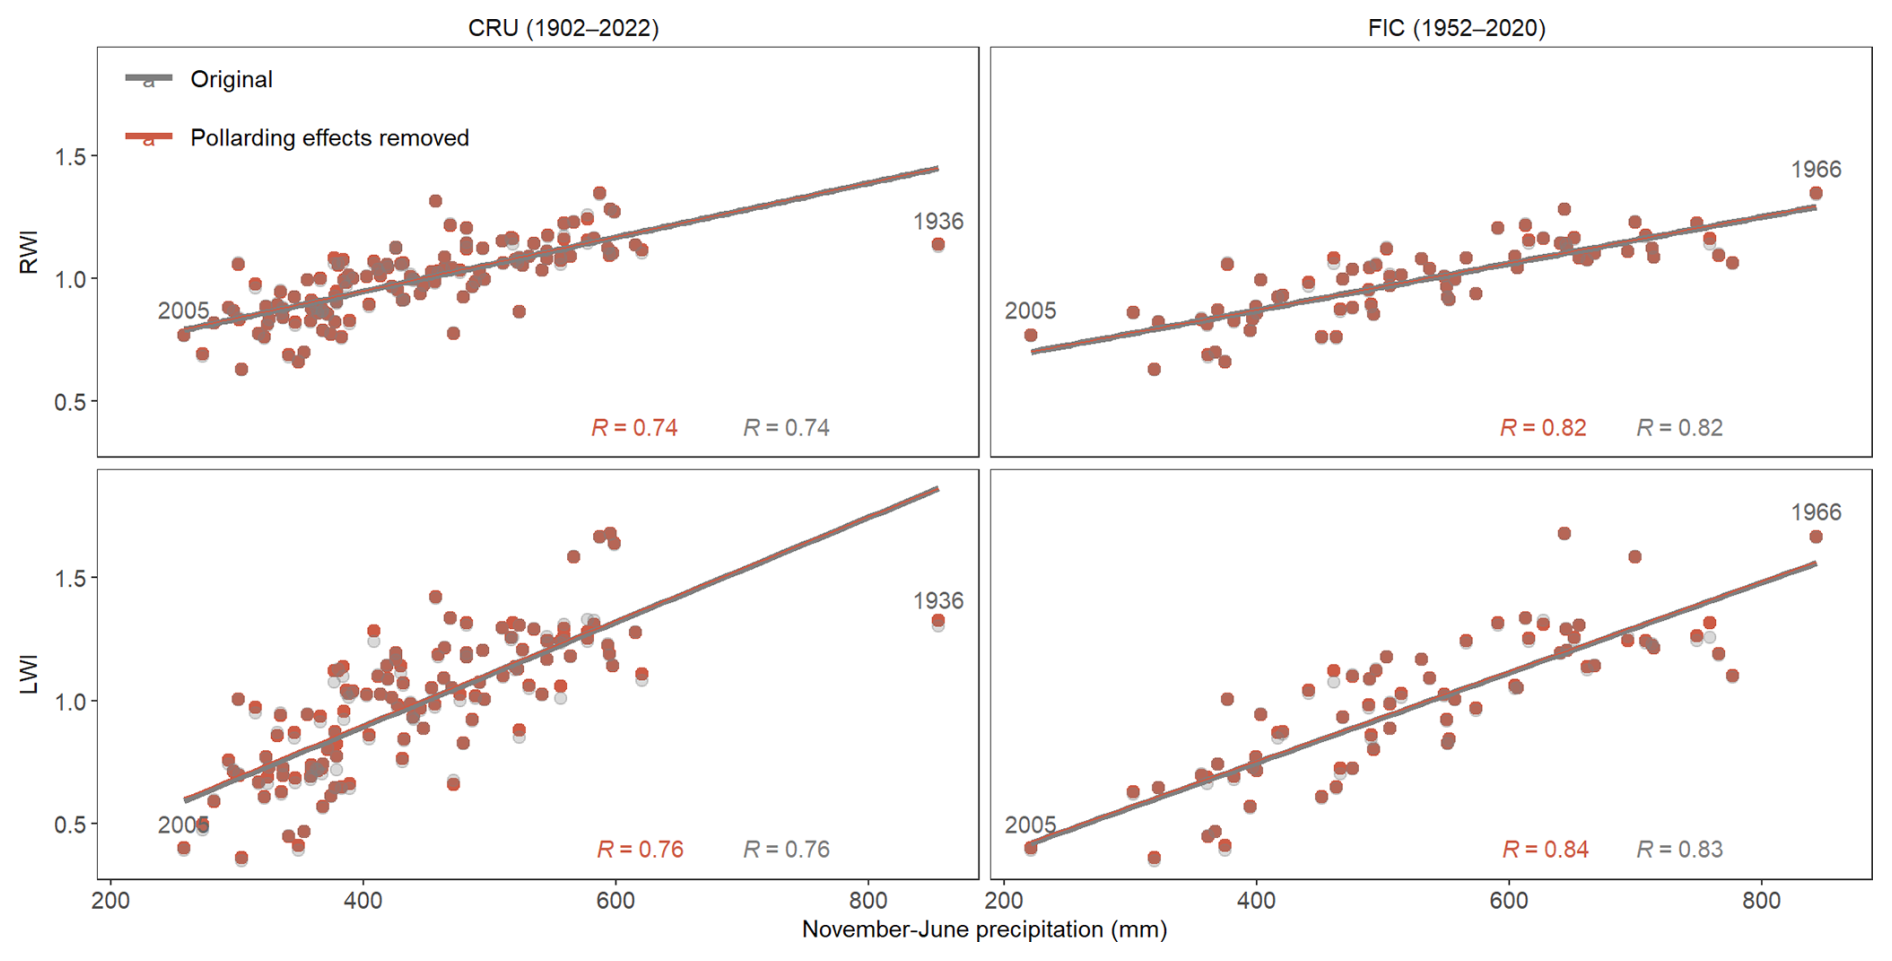
Figure 4Scatterplots showing the November–June precipitation signal in RWI (top) and LWI (bottom) regional chronologies, before (grey) and after (red) removing the effects of pollarding. Left panels: CRU data (1902–2022); right panels: FIC data (1952–2020).
3.4 Precipitation reconstruction and validation with independent instrumental data
Calibration against FIC precipitation data for 1962–2020 yielded an adjusted R2 of 0.70, while validation against CRU data for 1902–1961 produced a correlation of r = 0.71, with positive RE (0.44) and CE (0.45) values and an RMSE of 76.21 mm (Fig. 5a–c; Table S8). The reconstructed and observed series also showed comparable variability during the validation period and similar frequency distributions (Fig. 5d–e). Additional single-dataset calibration–validation tests using CRU and FIC alone yielded consistent results and confirmed that the selected late FIC–early CRU framework provided the highest calibration fit among the tested schemes (Table S8).
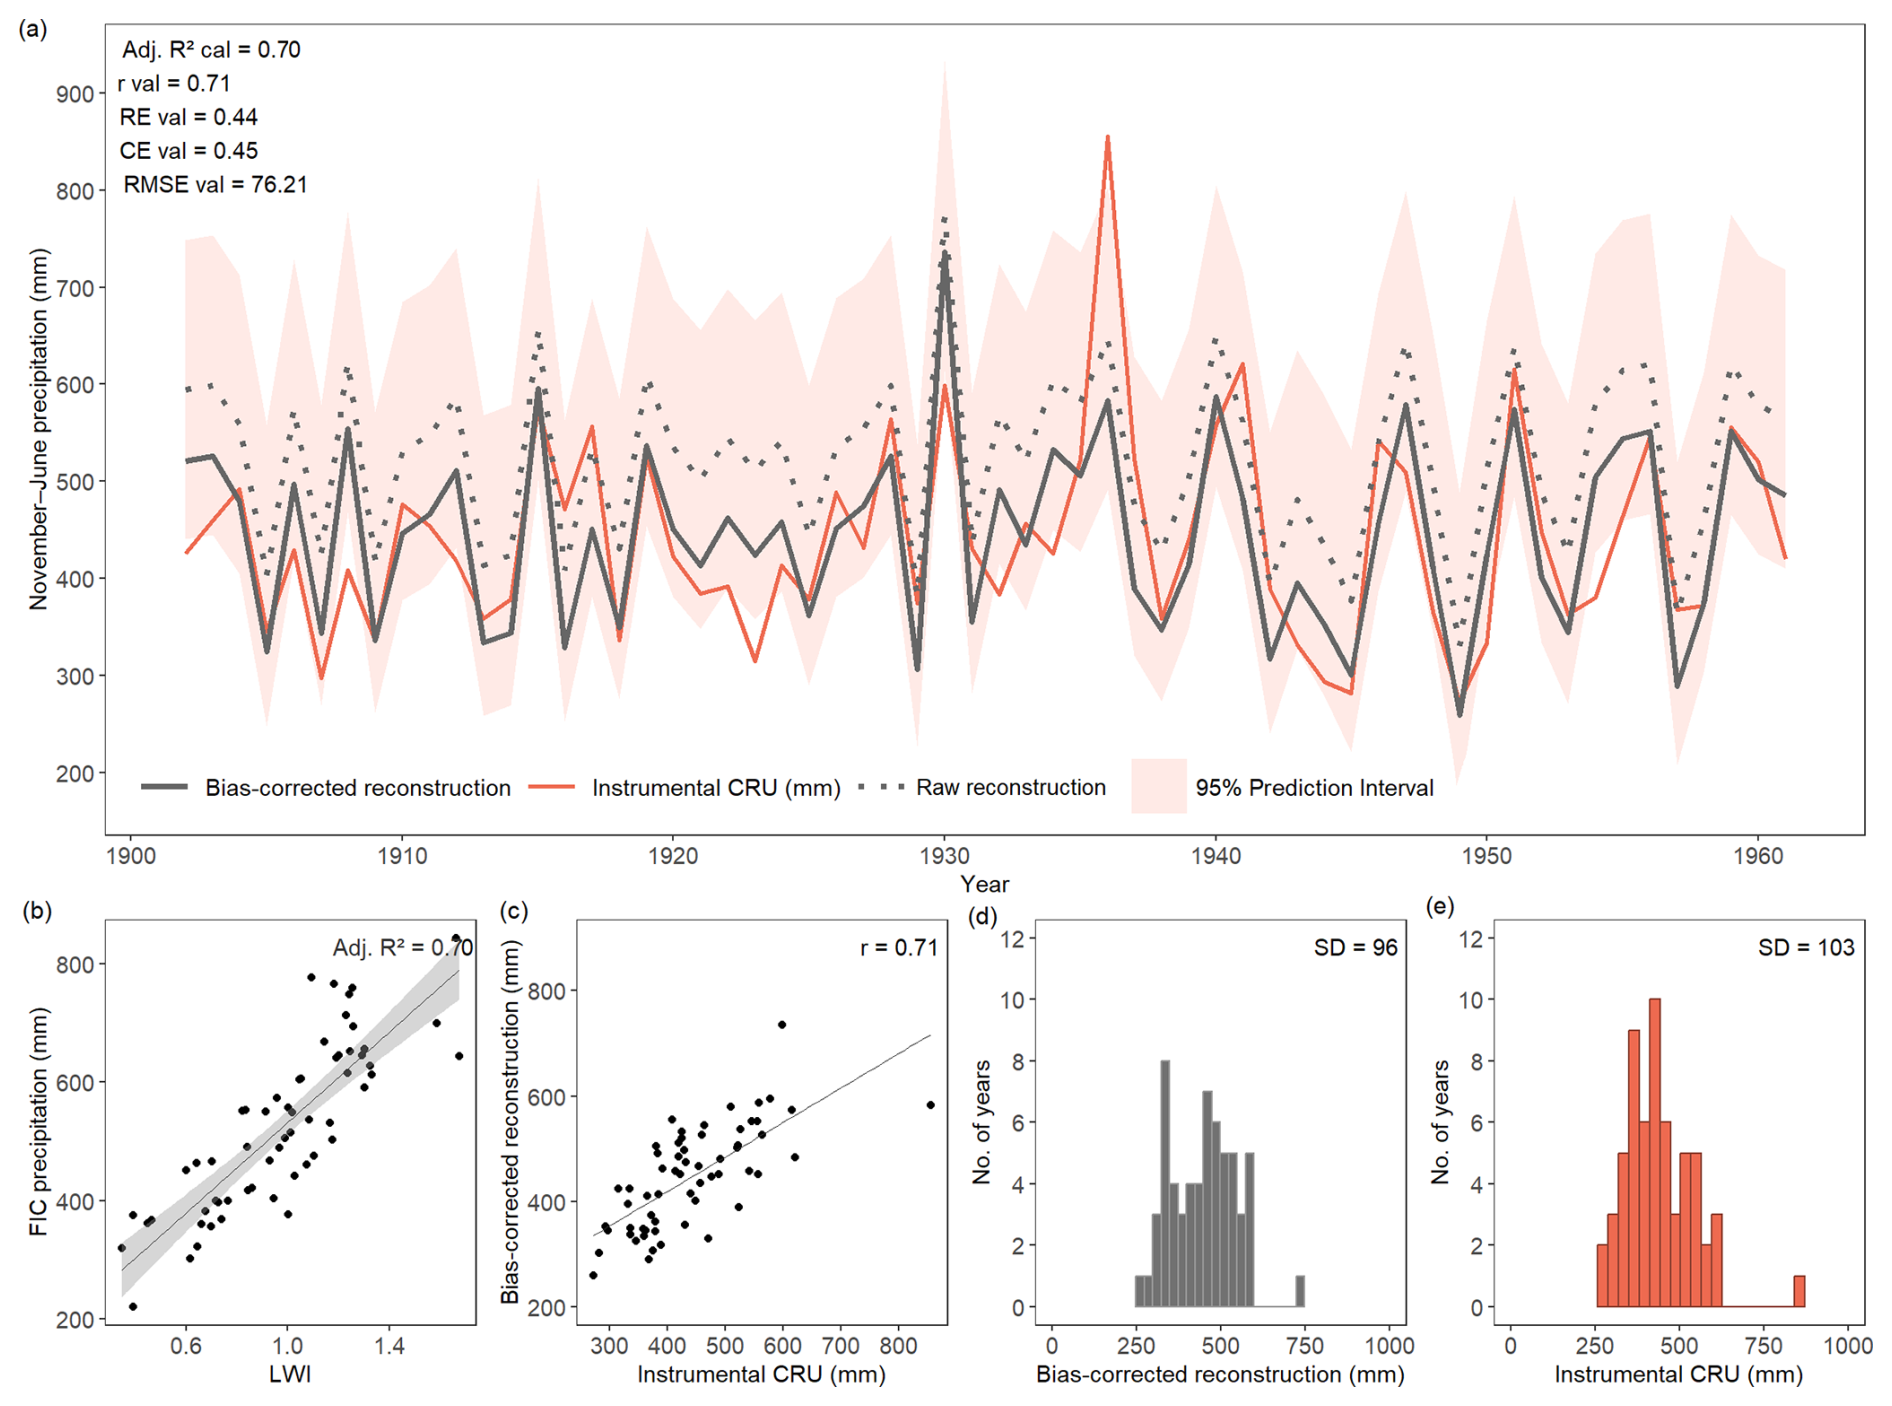
Figure 5(a) Validation results (CRU, 1902–1961) of the November–June precipitation reconstruction derived from pollarded oak LWI data in northcentral Spain. The red curve shows observed CRU precipitation; the dark grey solid curve shows the bias-corrected reconstruction; the light grey dotted curve shows the raw reconstruction; the shaded area represents the 95 % prediction interval of the calibration model. (b) Scatterplot of the linear regression between the LWI chronology and FIC precipitation (1962–2020; calibration). (c) Scatterplot of the linear regression between the bias-corrected reconstruction and CRU precipitation (1902–1961; validation). (d–e) Frequency distributions of the bias-corrected reconstruction and CRU precipitation, respectively (1902–1961).
The final reconstruction was calibrated over the full available FIC period (1952–2020) to maximize temporal coverage and sample size. The resulting transfer function was: November − June precipitation (mm) = 154.59 + 379.77 ⋅ LWI. The model explained 70 % of the calibration variance and, after bias correction, showed a strong agreement with CRU over 1902–2022 (r = 0.76, RE = 0.50, CE = 0.50, RMSE = 69.30 mm; Fig. S10), further supporting the robustness of the final reconstruction. The bias-corrected series more closely reproduced the variability and distributional range of the instrumental record than the raw reconstruction (Fig. S10). This improvement is reflected in its standard deviation, which was closer to that of CRU (100 mm vs. 98 mm) than that of the raw reconstruction (104 mm). Agreement at both distribution tails was also improved, with bias-corrected P5 and P95 values (317 and 586 mm, respectively) much closer to CRU (302 and 595 mm) than those of the raw reconstruction (368 and 659 mm). This correction also influenced the detection of extreme events, mainly in marginal cases close to the thresholds, whereas the most pronounced extremes remained largely consistent between the raw and bias-corrected reconstructions (Table S9). The extreme years identified are described in Sect. 3.6. Given its closer agreement with the variability and distribution of the instrumental target series, the bias-corrected reconstruction was therefore used for the identification and interpretation of extreme wet and dry years.
3.5 Validation of the reconstruction using previous large-scale reconstructions
Several independent hydroclimate reconstructions were used to assess the consistency of our bias-corrected November–June precipitation reconstruction spanning 1649–2023 (Table 2). Over the full overlapping periods, all reconstructions showed statistically significant correlations with our series. The strongest agreements were found with the GEDA (r = 0.41), followed by regional indices such as the Western Mediterranean precipitation reconstruction (r = 0.37), the Ebro Valley drought index (r = −0.36) and the Andalusia precipitation index (r = 0.31). By contrast, the weakest correlations were obtained with large-scale products, including PHYDA (r = 0.13 and 0.14 for MAM and JJA, respectively) and the European gridded precipitation reconstruction (r = 0.25). When analysed by century, all reconstructions – except PHYDA – showed significant correlations with our series during the 18th and 19th centuries. The highest agreements were observed with the Ebro Valley drought index (r = −0.50) in the 18th century and with the Andalusia precipitation index (r = 0.32) in the 19th century. Results for the 17th and 20th centuries were more variable, with the strongest correlations found with the Ebro Valley drought index (r = −0.50) and the GEDA (r = 0.54), respectively.
Table 2Statistical correlations between the bias-corrected November–June precipitation reconstruction and previous reconstructions of hydroclimate records. Correlations are calculated for the whole period (since 1649) and separately for each century. Pearson correlation is used in all cases, except for Tejedor et al. (2019), where a non-parametric Spearman correlation was applied. Significant values (p < 0.05) are indicated with an asterisk (*). IO refers to instrumental observations, DS to documentary sources, NP to natural proxies, and PS to the PHYDA paleoclimate series (reanalysis from multiple proxies and climate-model assimilation; Steiger et al., 2018). SPEI stands for the Standardized Precipitation Evapotranspiration Index, DJF for December–February accumulated precipitation, MAM for March–May, and JJA for June–August. NA indicates missing century-scale correlations due to a shorter common period between series.
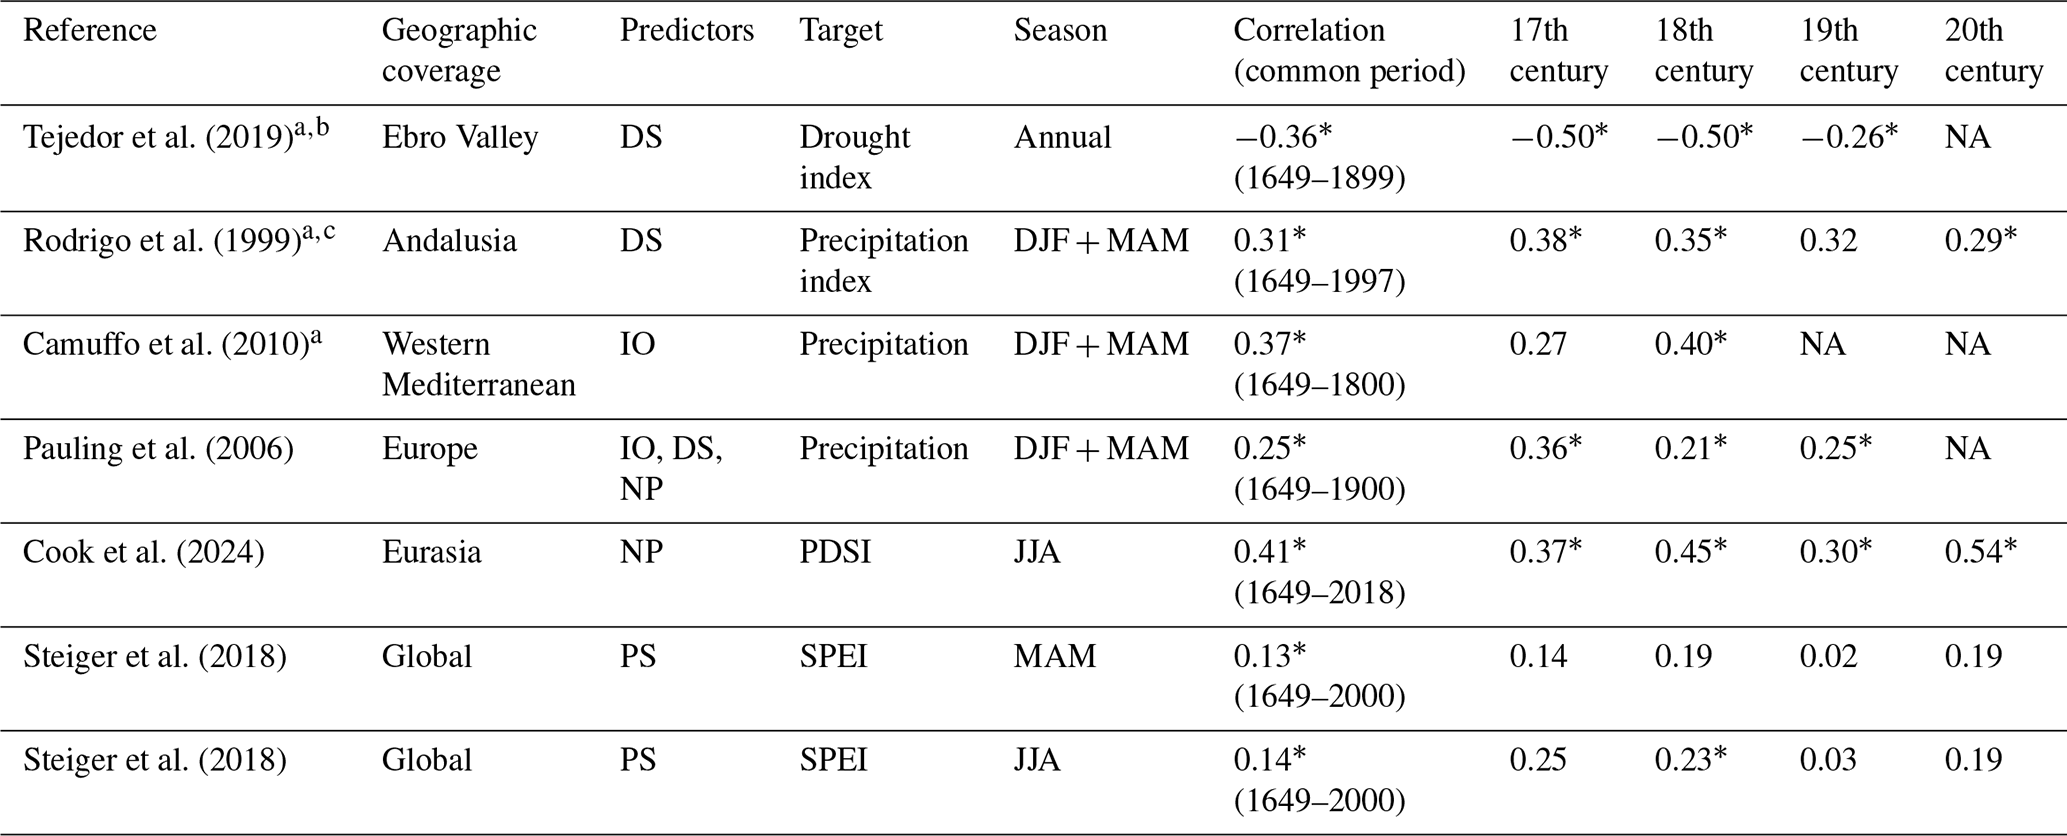
a Accessed via DOCU-CLIM, a global documentary climate dataset for climate reconstructions (Burgdorf et al., 2023).
b Categorical index from 0 (no drought) to 3 (severe drought); correlations based on Spearman's rho.
c Categorical index from −2 (low precipitation) to 2 (high precipitation); correlations based on Spearman's rho.
3.6 Validation of the reconstruction extremes using historical documentary records
Extreme wet and dry years identified from the bias-corrected reconstruction were broadly consistent across the three threshold criteria applied (Figs. 6, S11; Table S9). For dry extremes, 8 years were common to all three methods – 1683, 1734, 1737, 1775, 1995, 1999, 2005, and 2012 – highlighting them as the most robust drought events in the reconstruction. For wet extremes, agreement was similarly strong, with 19 years identified by all three methods: 1670, 1684, 1692, 1708, 1731, 1735, 1736, 1763, 1784, 1795, 1799, 1800, 1814, 1848, 1930, 1966, 1977, 1988, and 2021. Although additional events were detected only by one or two methods, the main temporal pattern remained unchanged, with dry extremes concentrated in the 1730s and during the late 20th to early 21st centuries, and wet extremes particularly frequent between the 1730s and 1800, with additional peaks during the 20th century. The longest dry period lasted 25 years (1818–1842), whereas the longest wet period extended for 21 years (1719–1739) (Table S11). However, the most severe dry period, based on mean November–June precipitation, occurred in the 17th century (1652–1669; with a mean of 400 mm), while the wettest period was recorded in the second half of the 20th century (1953–1970; with a mean of 478 mm) (Table S10).
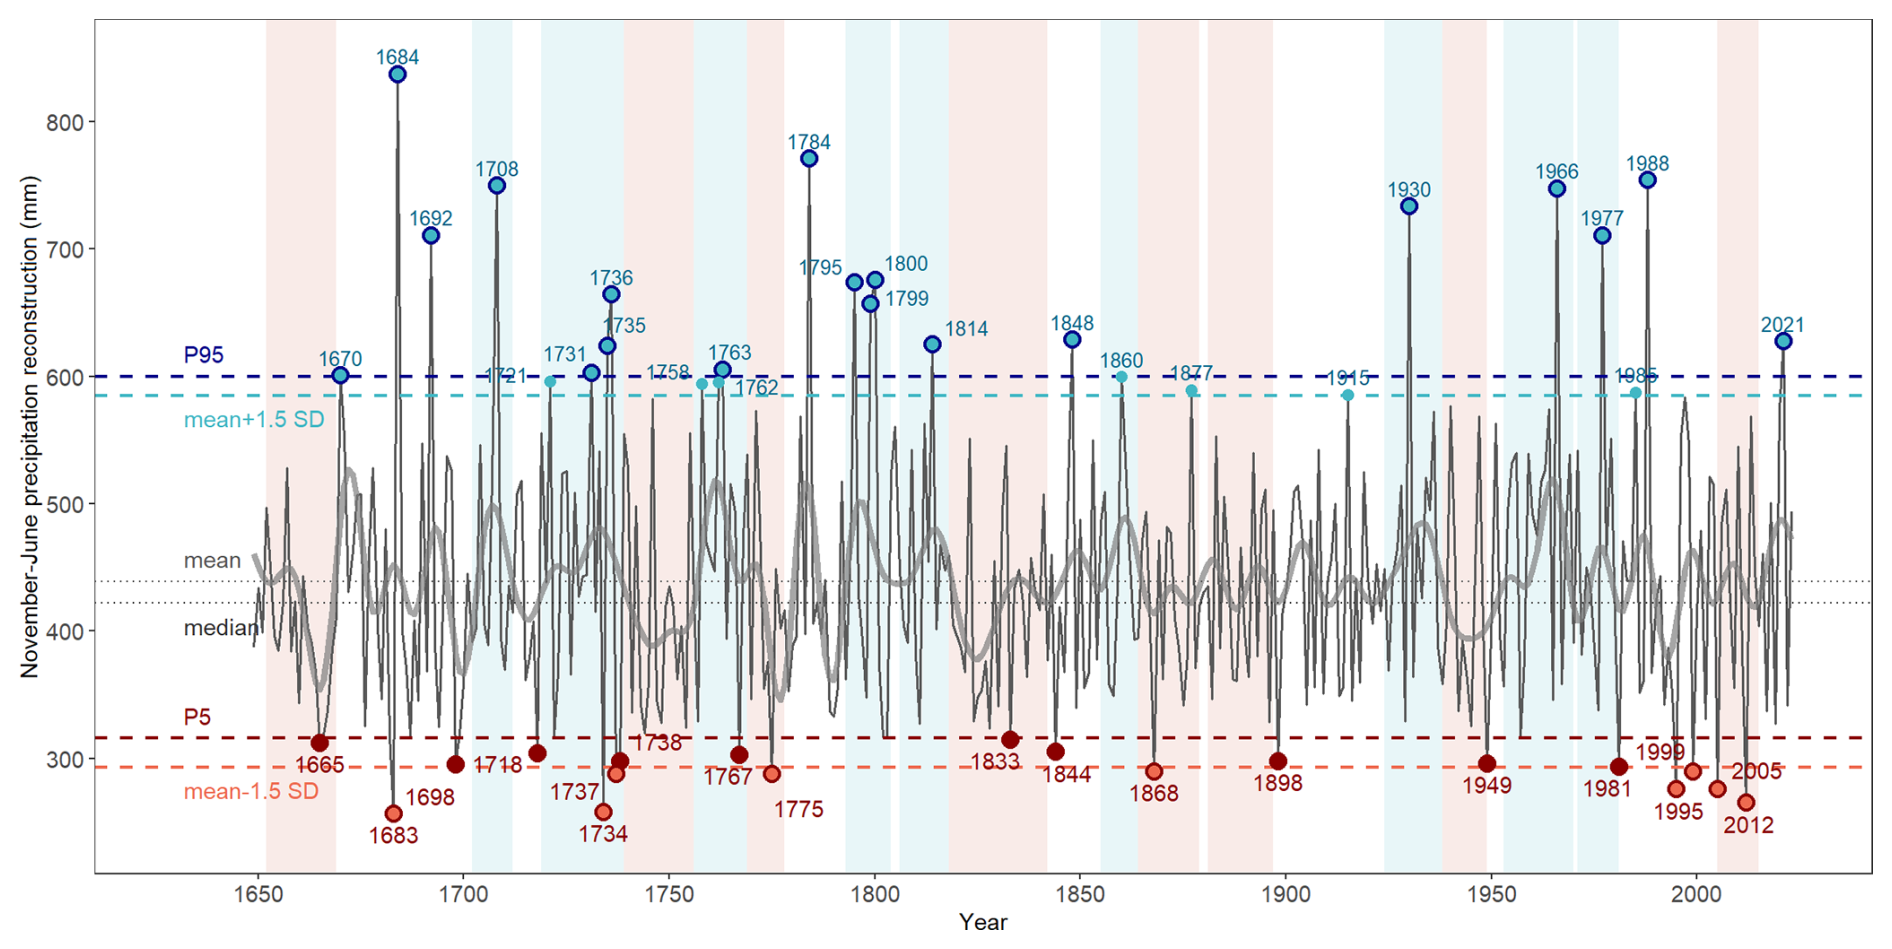
Figure 6Bias-corrected November–June precipitation reconstruction (1649–2023) based on pollarded oak LWI data. Shaded areas indicate wet (blue) and dry (red) multi-year periods. Years identified as extreme under the ±1.5 SD and 5th/95th percentile criteria are marked with blue (wet) and red (dry) dots. The thick curve is a 10-year low-pass filter. See Fig. S11 for SPI-based extreme years.
The robustness of the identified dry extremes in the bias-corrected reconstruction, likely triggers of agricultural droughts, was further evaluated against historical documentary records. This comparison encompasses all years identified as dry extremes by at least one of the three threshold criteria (Table S11) and shows consistent agreement regardless of which criterion is applied. During the instrumental period, extremely dry years matched drought episodes reported in the Spanish Drought Catalogue (Trullenque-Blanco et al., 2024) (Table S11). In the pre-instrumental period, dry years identified in the reconstruction overlapped with historical pro pluvia rogation records (Bellido Blanco, 2017; Domínguez-Castro et al., 2010, 2012, 2021) and were consistent with the Catalogue of Historical Droughts in Spain (Centro de Estudios Hidrográficos, 2013) (Fig. 7a; Table S11). Only 3 rogation years corresponded to moderately wet SPI values early in the series (1671, 1739, 1765), all of them spring ceremonies recorded in Zamora (Fig. 7a). None of the 81 rogation years coincided with very or extremely wet SPI values. Mean reconstructed precipitation for these 81 rogation years was 375 mm, below the 99 % Monte Carlo confidence interval (409–463 mm), indicating that their association with drought conditions was unlikely to be due to chance (Fig. 7b).
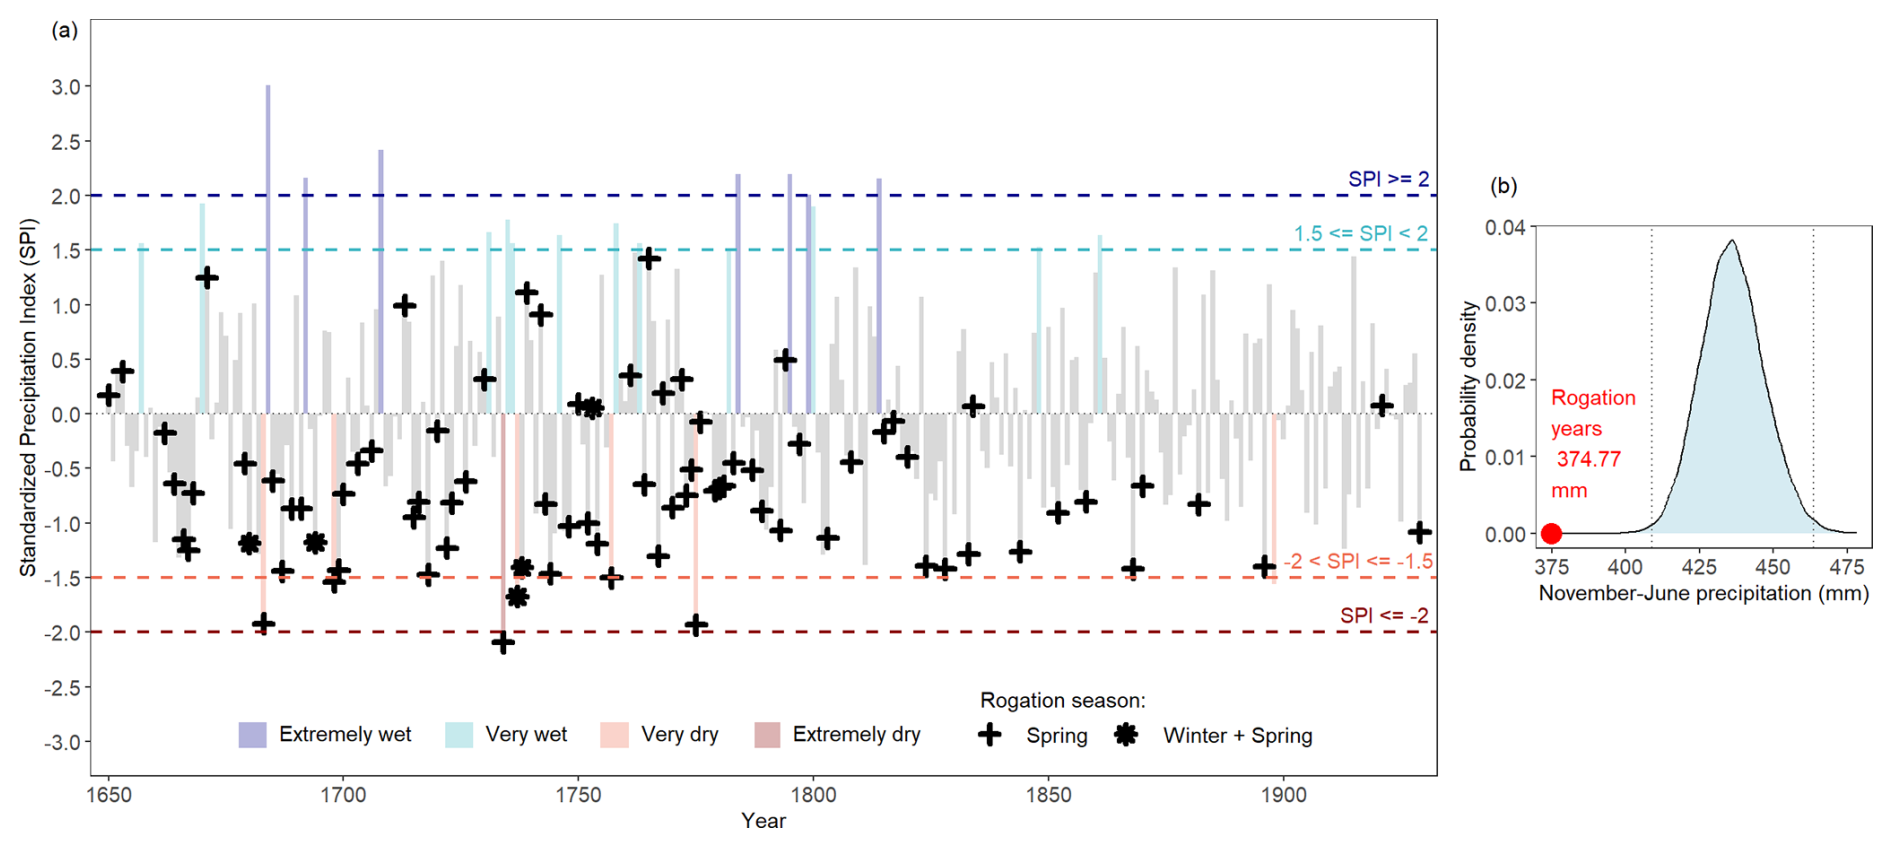
Figure 7(a) Comparison between SPI values derived from the bias-corrected November–June precipitation reconstruction and the occurrence of pro pluvia rogation ceremonies. Multiple ceremonies in a year may overlap. (b) Mean reconstructed precipitation for the 81 rogation years (1650–1929; red dot) compared with the Monte Carlo simulation distribution. Dotted lines indicate the 99 % confidence intervals.
For the first time, we produced a 375-year precipitation reconstruction based on tree-ring data from managed trees in communal dehesas of northcentral Spain. The reconstructed precipitation series (November–June) accounts for more than 75 % of the annual total, and up to 70 % of this signal is retained in the latewood component, which emerged as the most robust proxy. The reliability of the reconstructed signal was further supported by independent historical documentary evidence, including rogation ceremonies. Despite the growth reductions after pollarding, we demonstrated that the stands retained a coherent climate signal, owing to the asynchronous management of individuals within each dehesa. This opens the possibility of using the extensive network of dehesas scattered across the Mediterranean lowlands to develop high-resolution climate reconstructions in regions traditionally underrepresented in dendroclimatic studies.
The chronology stands out for the strength of its hydroclimatic signal, with latewood width explaining up to 70 % of the variability in seasonal precipitation. This level of explained variance equals or exceeds that reported in most existing oak-based reconstructions worldwide, including Quercus douglasii in California (51 %–70%, Gervais, 2006; Howard et al., 2023), Q. infectoria in Iran (50 %, Azizi et al., 2013), and Q. ilex in southern Portugal (65 %, Leal et al., 2015). In more humid temperate regions of Europe – such as Bohemia or southern England – explained variance declines markedly (≤ 34 %, Dobrovolný et al., 2018; Wilson et al., 2013). This exceptional signal strength likely reflects both regional environmental constraints and reduced inter-tree competition. In dry-summer Mediterranean climates, soil water reserves are rarely fully replenished each year, making oak growth largely dependent on accumulated precipitation (Gallego et al., 1994; Hernández-Santana et al., 2008). Furthermore, the artificial arrangement of trees on relatively flat surfaces enhances their exposure to thermal extremes, potentially leading to persistently higher evapotranspiration demands compared to closed canopy or naturally structured forests.
Our reconstruction highlights pronounced hydroclimatic extremes in northcentral Spain, showing that the region experienced abrupt shifts between exceptionally wet and dry conditions, as illustrated by the consecutive occurrence of the driest and wettest years in the series (1683: 257 mm; 1684: 838 mm of November–June precipitation). In addition, the identification of prolonged dry (1818–1842, 25 years) and wet periods (1719–1739, 21 years) indicates that hydroclimatic variability also operated at multi-decadal scales, with likely consequences for both ecosystem functioning and past human activities. Importantly, reconstructed dry extremes proved robust across the alternative threshold criteria considered, and all of them were supported by documentary evidence. During the pre-instrumental period, these dry years coincided with historical pro pluvia rogation ceremonies and/or with drought episodes recorded in the Catalogue of Historical Droughts in Spain, reinforcing the interpretation of these reconstructed minima as agriculturally relevant drought events (Domínguez-Castro et al., 2008). In central Iberia, cereal crops and livestock constituted the main staples for population subsistence, and their productivity depended directly on soil moisture, which is largely determined by precipitation levels (Vicente-Serrano et al., 2020). During drought years, pro pluvia rogations served as institutional mechanisms to address social stress triggered by the threat of harvest failures – events that often had far-reaching consequences, including malnutrition, market disruptions, and public health crises (Barriendos, 2005). Interestingly, few spring ceremonies coincided with years that were overall moderately wet years in our reconstruction. These departures may reflect abundant rainfall that occurred after the rogation was held Domínguez-Castro et al., 2012). However, their distribution was not random, as they were concentrated in Zamora during spring in the 17th century. The agreement between reconstructed drought extremes and documentary evidence underscores the robustness of our chronology, a conclusion further strengthened by its consistency with previous large-scale reconstructions.
Our reconstruction showed the strongest agreement with the Great Eurasian Drought Atlas (Cook et al., 2024), followed by regionally focused hydroclimate reconstructions, particularly the Western Mediterranean precipitation index (Camuffo et al., 2010), the Andalusia DJF precipitation index (Rodrigo et al., 1999), and the Ebro Valley drought index (Tejedor et al., 2019). The high correlation with the latter is somewhat unexpected, given that the Ebro Basin lies outside the core spatial domain of our chronology (Fig. 2). However, since the Ebro Valley drought index is based on documentary records of historical droughts, it likely captures broader hydroclimatic anomalies extending beyond its immediate geographical boundaries, which may explain its strong coherence with our precipitation series. In contrast, our reconstruction showed weaker correlations with large-scale products, such as the European gridded series by Pauling et al. (2006) and the global PHYDA reconstruction (Steiger et al., 2018). This likely reflects their lower regional and seasonal skill, which limits their capacity to resolve localized hydroclimatic variability. As such, pollarded oaks from northcentral Spain offer additional paleoclimatic information that captures interannual to decadal precipitation variability with high regional fidelity, serving as a valuable benchmark to refine and strengthen hydroclimate assessments beyond what is possible with previously available large-scale products.
In this regard, latewood was the most suitable proxy for hydroclimate reconstruction, as it is the tree-ring component most sensitive to precipitation while still preserving a coherent climatic signal at the chronology level despite recurrent pollarding. This apparently paradoxical result can be explained by the fact that latewood is formed later in the growing season, when radial growth depends more directly on current water availability, whereas earlywood formation begins earlier and can rely more strongly on previously stored resources (Kromer et al., 2024; Levanic et al., 2011). Thus, although latewood is also the ring component most strongly reduced after pollarding, it is simultaneously the component in which drought signals are most clearly expressed (Sanmiguel-Vallelado et al., 2024). Under stress conditions, earlywood is prioritized due to its hydraulic function, whereas latewood – primarily involved in mechanical support – is more expendable (Domec and Gartner, 2002). Consequently, earlywood production remained relatively stable after pollarding, buffering variability in total ring-width (Bernard et al., 2006; Rozas, 2005; Sanmiguel-Vallelado et al., 2024), while latewood formation was significantly reduced. This led to a temporary decline in the climatic signal captured by latewood at the tree level during the first 3 years post-pollarding. However, from the eighth year onward, the latewood index, together with the total ring-width index, exhibited enhanced sensitivity to precipitation compared to the pre-pollarding period. This pattern suggests that, as trees recover from pollarding, their growth becomes more responsive to water availability. Such a response aligns with previous studies that report growth stimulation following pollarding, largely due to enhanced light availability (Cañellas et al., 2004; Cutter et al., 1991; Mayor and Rodà, 1993; Tonelli et al., 2023). However, this greater sensitivity may also imply an increased vulnerability to intense or prolonged droughts. Importantly, our results suggest that pollarding at the individual level did not systematically obscure the stand-level chronology. This likely reflects two complementary factors: the enhancement of the climatic signal after pollarding and the marked asynchrony of pollarding events among trees, with most events affecting only a small fraction of the available individuals at any given time. Under these conditions, unpollarded trees may have compensated for the temporary reduction in climatic signal in managed individuals, allowing the common hydroclimatic signal to be preserved at the stand level (Olano et al., 2023; Sanmiguel-Vallelado et al., 2024).
The climatic sensitivity of Mediterranean deciduous oaks is well documented (Alla and Camarero, 2012; Camarero et al., 2024; Leal et al., 2015; Romagnoli et al., 2018; Sánchez-Salguero et al., 2020; Tessier et al., 1994). However, pollarded individuals within dehesa systems have received comparatively little scientific attention, despite recent studies highlighting the exceptional strength of their climate signal (Camarero and Valeriano, 2023; Olano et al., 2023). In this study, we unlock their full dendroclimatic potential for the first time, demonstrating that these trees retain a strong and coherent hydroclimate signal over centuries, even under the repeated disturbances associated with traditional management. Communal dehesas are relatively widespread across the Mediterranean Basin and offer a valuable opportunity to reconstruct long-term precipitation variability across different regions. Such reconstructions could significantly improve our understanding of current climate change dynamics, particularly for precipitation – one of the most uncertain components in future climate scenarios (Deser et al., 2012). Recognizing the dendroclimatic value of communal dehesas adds relevance to these landscapes of exceptional ecological and cultural significance (Olano et al., 2025). Preserving and studying these systems is therefore both essential and urgent, as the abandonment of traditional management, combined with increasing drought stress – especially affecting large, old trees (Pennisi, 2019) – has already led to widespread dieback (Colangelo et al., 2024).
Our findings demonstrate that deciduous pollarded oaks in communal dehesas constitute a reliable dendroclimatic archive, capable of capturing interannual to decadal precipitation variability over centuries in regions traditionally underrepresented in dendroclimatic research. Latewood is the most suitable proxy, retaining a strong and stationary hydroclimate signal at the chronology level despite temporary growth reductions following pollarding. When sampled from stands where cuts occur at different times among trees, these short-term, post-pollarding growth effects do not synchronize across individuals, and accounting for pollarding signatures has a negligible effect on the preserved climate signal. Reconstructions combining such data at the landscape level provide unique information on (i) ecological and cultural heritage, and (ii) past hydroclimate variability in lowland Mediterranean environments highly vulnerable to climate change.
The LWI chronology and the reconstructed November–June precipitation series (1649–2023) are deposited in the open repository of the Universidad de Valladolid (https://doi.org/10.71569/b9cw-c103, Sanmiguel-Vallelado et al., 2026b). The aggregated monthly precipitation series derived from the FIC high-resolution gridded data (1 km2, 1951–2020) for the study area is also deposited in the same repository (https://doi.org/10.71569/pznw-9644, Sanmiguel-Vallelado et al., 2026a). The original FIC gridded precipitation data are proprietary and cannot be redistributed; researchers wishing to access these data should contact the Fundación para la Investigación del Clima directly (https://ficlima.org/, last access: 22 October 2024). CRU TS4.08 gridded precipitation data are freely available (Harris et al., 2020). No custom code was developed for this study. All statistical analyses were performed in R (R Core Team, 2024) using open-source packages fully described and cited in the Methods section. These packages are freely available through the Comprehensive R Archive Network (CRAN; https://cran.r-project.org/, last access: 18 April 2026).
JMO, GS and AS conceptualized the study. Fieldwork was conducted by JMO, GS, and AS. Cross-dating was performed by JMO. Data curation was carried out by AS and JMO. Instrumental climate data (FIC) were provided by CP. AS performed the formal analysis under the guidance of MCAT. AS prepared the manuscript with contributions from all co-authors. Visualizations were created by AS and MCAT. Supervision was provided by JMO, GS, MCAT, and JE. Funding was acquired by JMO and GS. The project was administered by JMO and GS. All authors have read and agreed to the published version of the manuscript.
The contact author has declared that none of the authors has any competing interests.
Publisher's note: Copernicus Publications remains neutral with regard to jurisdictional claims made in the text, published maps, institutional affiliations, or any other geographical representation in this paper. The authors bear the ultimate responsibility for providing appropriate place names. Views expressed in the text are those of the authors and do not necessarily reflect the views of the publisher.
We are grateful to the “Servicio de Medio Ambiente de la Junta de Castilla y León”, and in particular to José Antonio Lucas, for granting the sampling permits. We also thank the local managers and environmental agents for sharing valuable information regarding the study sites and their management practices. We deeply appreciate the support of Juan Carlos Rubio and Alfonso Martínez, whose assistance was essential for sample preparation. Fieldwork and lab work were made possible thanks to the generous help of the members of the Cambium Research Group. We also wish to express our sincere thanks to all members of Jan Esper's research group at Johannes Gutenberg University Mainz, whose insightful comments greatly contributed to the development of this publication.
This research was supported by the project GIANTS (PID2023-147214NB-I00) funded by MICIU/AEI/10.13039/501100011033 and FEDER, UE. Alba Sanmiguel-Vallelado was supported by the postdoctoral grant JDC2022-048316-I, funded by MICIU/AEI/10.13039/501100011033 and by the European Union NextGenerationEU/PRTR. She also received funding from the “Movilidad Investigadores e Investigadoras UVa-Banco Santander 2024” program, which supported a research stay at Jan Esper's research group at Johannes Gutenberg University Mainz, Germany.
This paper was edited by Ny Riavo G. Voarintsoa and reviewed by three anonymous referees.
Alla, A. Q. and Camarero, J. J.: Contrasting responses of radial growth and wood anatomy to climate in a Mediterranean ring-porous oak: implications for its future persistence or why the variance matters more than the mean, Eur. J. Forest Res., 131, 1537–1550, https://doi.org/10.1007/s10342-012-0621-x, 2012.
Ayanz, A. S. M.: La dehesa española: origen, tipología, características y gestión, Fundacion Conde del valle de Salazar, ISBN 84-86793-24-6, 1994.
Azizi, G., Arsalani, M., Bräuning, A., and Moghimi, E.: Precipitation variations in the central Zagros Mountains (Iran) since A.D. 1840 based on oak tree rings, Palaeogeogr. Palaeocl., 386, 96–103, https://doi.org/10.1016/j.palaeo.2013.05.009, 2013.
Barriendos, M.: Climate and culture in Spain, religious responses to extreme climatic events in the Hispanic Kingdoms (16th–19th centuries), Kulturelle Konsequenzen der “Kleinen Eiszeit”, edited by: Behringer, W., Lehmann, H., and Pfister, C., Vandenhoeck & Ruprecht, Göttingen, 379–414, ISBN 978-3525358641, 2005.
Bartsch, S., Stegehuis, A. I., Boissard, C., Lathière, J., Peterschmitt, J.-Y., Reiter, I. M., Gauquelin, T., Baldy, V., Genesio, L., Matteucci, G., Fernandez, C., and Guenet, B.: Impact of precipitation, air temperature and abiotic emissions on gross primary production in Mediterranean ecosystems in Europe, Eur. J. Forest Res., 139, 111–126, https://doi.org/10.1007/s10342-019-01246-7, 2020.
Beguería, S. and Vicente-Serrano, S. M.: SPEI: Calculation of the Standardized Precipitation-Evapotranspiration Index, https://doi.org/10.32614/CRAN.package.SPEI, 2023.
Bellido Blanco, A.: Pidiendo ayuda a los cielos: rogativas en la provincia de Valladolid, Ediciones Universidad de Valladolid, ISBN 978-84-8448-918-4, 2017.
Bernard, V., Renaudin, S., and Marguerie, D.: Evidence of trimmed oaks (Quercus sp.) in north western France during the early Middle Ages (9th–11th centuries AD), Charcoal analysis: new analytical tools and methods for archaeology, BAR Int Ser, 1483, 103–108, 2006.
Bogino, S. M. and Bravo, F.: Growth response of Pinus pinaster Ait. to climatic variables in central Spanish forests, Ann. For. Sci., 65, 506–506, https://doi.org/10.1051/forest:2008025, 2008.
Brázdil, R., Kiss, A., Luterbacher, J., Nash, D. J., and Řezníčková, L.: Documentary data and the study of past droughts: a global state of the art, Clim. Past, 14, 1915–1960, https://doi.org/10.5194/cp-14-1915-2018, 2018.
Bunn, A. G.: A dendrochronology program library in R (dplR), Dendrochronologia, 26, 115–124, https://doi.org/10.1016/j.dendro.2008.01.002, 2008.
Bunn, A. G.: Statistical and visual crossdating in R using the dplR library, Dendrochronologia, 28, 251–258, https://doi.org/10.1016/j.dendro.2009.12.001, 2010.
Burgdorf, A.-M., Brönnimann, S., Adamson, G., Amano, T., Aono, Y., Barriopedro, D., Bullón, T., Camenisch, C., Camuffo, D., Daux, V., Del Rosario Prieto, M., Dobrovolný, P., Gallego, D., García-Herrera, R., Gergis, J., Grab, S., Hannaford, M. J., Holopainen, J., Kelso, C., Kern, Z., Kiss, A., Kuan-Hui Lin, E., Loader, N. J., Možný, M., Nash, D., Nicholson, S. E., Pfister, C., Rodrigo, F. S., Rutishauser, T., Sharma, S., Takács, K., Vargas, E. T., and Vega, I.: DOCU-CLIM: A global documentary climate dataset for climate reconstructions, Sci. Data, 10, 402, https://doi.org/10.1038/s41597-023-02303-y, 2023.
Butler, J.: Looking Back to the Future: Ancient, Working Pollards and Europe's Silvo-Pastoral Systems, in: Cultural Severance and the Environment, vol. 2, edited by: Rotherham, I. D., Springer Netherlands, Dordrecht, 371–376, https://doi.org/10.1007/978-94-007-6159-9_25, 2013.
Camarero, J. J. and Valeriano, C.: Responses of ancient pollarded and pruned oaks to climate and drought: Chronicles from threatened cultural woodlands, Sci. Total Environ., 883, 163680, https://doi.org/10.1016/j.scitotenv.2023.163680, 2023.
Camarero, J. J., Valeriano, C., and Rubio-Cuadrado, Á.: Old oaks show increasing growth synchrony after pollarding cessation as climate becomes more arid, Forest Ecol. Manag., 569, 122189, https://doi.org/10.1016/j.foreco.2024.122189, 2024.
Camuera, J., Jiménez-Espejo, F. J., Soto-Chica, J., Jiménez-Moreno, G., García-Alix, A., Ramos-Román, M. J., Ruha, L., and Castro-Priego, M.: Drought as a possible contributor to the Visigothic Kingdom crisis and Islamic expansion in the Iberian Peninsula, Nat. Commun., 14, 5733, https://doi.org/10.1038/s41467-023-41367-7, 2023.
Camuffo, D., Bertolin, C., Diodato, N., Barriendos, M., Dominguez-Castro, F., Cocheo, C., Della Valle, A., Garnier, E., and Alcoforado, M.-J.: The western Mediterranean climate: how will it respond to global warming?, Climatic Change, 100, 137–142, 2010.
Cañellas, I., Del Río, M., Roig, S., and Montero, G.: Growth response to thinning in Quercus pyrenaica Willd. coppice stands in Spanish central mountain, Ann. For. Sci., 61, 243–250, https://doi.org/10.1051/forest:2004017, 2004.
Caudullo, G., Welk, E., and San-Miguel-Ayanz, J.: Chorological maps for the main European woody species, Data in Brief, 12, 662–666, https://doi.org/10.1016/j.dib.2017.05.007, 2017.
Centro de Estudios Hidrográficos: Catálogo de Publicaciones sobre Sequías Históricas, Ministerio de Agricultura, Alimentación y Medio Ambiente, Secretaría de Estado de Medio Ambiente, Dirección General del Agua, Madrid, https://www.miteco.gob.es/content/dam/miteco/es/agua/enlaces-de-interes/catalogo-y-publicacion-sequias-historicas_tcm30-436651.pdf (last access: 22 June 2026), 2013.
Christian, C. and Elbourne, L.: Shocks to military support and subsequent assassinations in Ancient Rome, Econ. Lett., 171, 79–82, 2018.
Colangelo, M., Valeriano, C., de Andrés, E. G., Pizarro, M., Murria, E., and Julio Camarero, J.: Lack of management, land-use changes, poor site conditions and drought contribute to the decline of old pollarded oaks, Dendrochronologia, 86, 126232, https://doi.org/10.1016/j.dendro.2024.126232, 2024.
Cook, B. I., Cook, E. R., Anchukaitis, K. J., and Singh, D.: Characterizing the 2010 Russian Heat Wave–Pakistan Flood Concurrent Extreme over the Last Millennium Using the Great Eurasian Drought Atlas, J. Climate, 37, 4389–4401, https://doi.org/10.1175/JCLI-D-23-0773.1, 2024.
Cook, E. R.: A time series approach to tree-ring standardization, PhD thesis, University of Arizona, https://ltrr.arizona.edu/content/time-series-analysis-approach-tree-ring-standardization (last access: 22 June 2026), 1985.
Cook, E. R. and Kairiukstis, L. A.: Methods of dendrochronology: applications in the environmental sciences, Springer Science & Business Media, 2013.
Cutter, B. E., Lowell, K. E., and Dwyer, J. P.: Thinning effects on diameter growth in black and scarlet oak as shown by tree ring analyses, Forest Ecol. Manag., 43, 1–13, https://doi.org/10.1016/0378-1127(91)90071-3, 1991.
Deser, C., Phillips, A., Bourdette, V., and Teng, H.: Uncertainty in climate change projections: the role of internal variability, Clim. Dynam., 38, 527–546, https://doi.org/10.1007/s00382-010-0977-x, 2012.
Dobrovolný, P., Rybníček, M., Kolář, T., Brázdil, R., Trnka, M., and Büntgen, U.: May–July precipitation reconstruction from oak tree-rings for Bohemia (Czech Republic) since AD 1040, Int. J. Climatol., 38, 1910–1924, https://doi.org/10.1002/joc.5305, 2018.
Domec, J. and Gartner, B. L.: How do water transport and water storage differ in coniferous earlywood and latewood?, J. Exp. Bot., 53, 2369–2379, https://doi.org/10.1093/jxb/erf100, 2002.
Dominguez-Castro, F. and García-Herrera, R.: Documentary sources to investigate multidecadal variability of droughts, Cuadernos de Investigación Geográfica, 42, 13–27, 2016.
Domínguez-Castro, F., Santisteban, J. I., Barriendos, M., and Mediavilla, R.: Reconstruction of drought episodes for central Spain from rogation ceremonies recorded at the Toledo Cathedral from 1506 to 1900: A methodological approach, Global Planet. Change, 63, 230–242, https://doi.org/10.1016/j.gloplacha.2008.06.002, 2008.
Domínguez-Castro, F., García-Herrera, R., Ribera, P., and Barriendos, M.: A shift in the spatial pattern of Iberian droughts during the 17th century, Clim. Past, 6, 553–563, https://doi.org/10.5194/cp-6-553-2010, 2010.
Domínguez-Castro, F., Ribera, P., García-Herrera, R., Vaquero, J. M., Barriendos, M., Cuadrat, J. M., and Moreno, J. M.: Assessing extreme droughts in Spain during 1750–1850 from rogation ceremonies, Clim. Past, 8, 705–722, https://doi.org/10.5194/cp-8-705-2012, 2012.
Domínguez-Castro, F., Alcoforado, M. J., Bravo-Paredes, N., Fernández-Fernández, M. I., Fragoso, M., Gallego, M. C., García Herrera, R., Garnier, E., Garza-Merodio, G., El Kenawy, A. M., Latorre, B., Noguera, I., Peña-Angulo, D., Reig-Gracia, F., Silva, L. P., Vaquero, J. M., and Vicente Serrano, S. M.: Dating historical droughts from religious ceremonies, the international pro pluvia rogation database, Sci. Data, 8, 186, https://doi.org/10.1038/s41597-021-00952-5, 2021.
Duchon, J.: Fonctions-spline et esperances conditionnelles de champs gaussiens, Annales scientifiques de l'Université de Clermont, Mathématiques, 61, 19–27, 1976.
Esper, J., Großjean, J., Camarero, J. J., García-Cervigón, A. I., Olano, J. M., González-Rouco, J. F., Domínguez-Castro, F., and Büntgen, U.: Atlantic and Mediterranean synoptic drivers of central Spanish juniper growth, Theor. Appl. Climatol., 121, 571–579, https://doi.org/10.1007/s00704-014-1254-4, 2015.
Esper, J., Smerdon, J. E., Anchukaitis, K. J., Allen, K., Cook, E. R., D'Arrigo, R., Guillet, S., Ljungqvist, F. C., Reinig, F., Schneider, L., Sigl, M., Stoffel, M., Trnka, M., Wilson, R., and Büntgen, U.: The IPCC's reductive Common Era temperature history, Communications Earth & Environment, 5, 222, https://doi.org/10.1038/s43247-024-01371-1, 2024.
Fisher, R. A.: On the “Probable Error” of a Coefficient of Correlation Deduced from a Small Sample, Metron, 1, 3–32, 1921.
Fritts, H. C.: Tree rings and climate, Academic Press, London New York, ISBN 978-0-12-268450-0, 1976.
Gallego, H. A., Rico, M., Moreno, G., and Regina, I. S.: Leaf water potential and stomatal conductance in Quercus pyrenaica Willd. forests: vertical gradients and response to environmental factors, Tree Physiol., 14, 1039–1047, https://doi.org/10.1093/treephys/14.7-8-9.1039, 1994.
Gaona, J., Benito-Verdugo, P., Martínez-Fernández, J., González-Zamora, Á., Almendra-Martín, L., and Herrero-Jiménez, C. M.: Soil Moisture Outweighs Climatic Factors in Critical Periods for Rainfed Cereal Yields: An Analysis in Spain, Agriculture, 12, 533, https://doi.org/10.3390/agriculture12040533, 2022.
García-Hidalgo, M., García-Pedrero, Á., Colón, D., Sangüesa-Barreda, G., García-Cervigón, A. I., López-Molina, J., Hernández-Alonso, H., Rozas, V., Olano, J. M., and Alonso-Gómez, V.: CaptuRING: A do-it-yourself tool for wood sample digitization, Methods Ecol. Evol., 13, 1185–1191, https://doi.org/10.1111/2041-210X.13847, 2022.
Gebrechorkos, S. H., Sheffield, J., Vicente-Serrano, S. M., Funk, C., Miralles, D. G., Peng, J., Dyer, E., Talib, J., Beck, H. E., Singer, M. B., and Dadson, S. J.: Warming accelerates global drought severity, Nature, 642, 628–635, https://doi.org/10.1038/s41586-025-09047-2, 2025.
Gervais, B. R.: A three-century record of precipitation and blue oak recruitment from the Tehachapi Mountains, Southern California, USA, Dendrochronologia, 24, 29–37, https://doi.org/10.1016/j.dendro.2006.05.002, 2006.
Giorgi, F.: Climate change hot-spots, Geophys. Res. Lett., 33, https://doi.org/10.1029/2006GL025734, 2006.
Gudmundsson, L.: qmap: Statistical transformations for post-processing climate model output, R package version, 1–0, https://doi.org/10.32614/CRAN.package.qmap, 2016.
Gudmundsson, L., Bremnes, J. B., Haugen, J. E., and Engen-Skaugen, T.: Technical Note: Downscaling RCM precipitation to the station scale using statistical transformations – a comparison of methods, Hydrol. Earth Syst. Sci., 16, 3383–3390, https://doi.org/10.5194/hess-16-3383-2012, 2012.
Harris, I., Osborn, T. J., Jones, P., and Lister, D.: Version 4 of the CRU TS monthly high-resolution gridded multivariate climate dataset, Sci. Data, 7, 109, https://doi.org/10.1038/s41597-020-0453-3, 2020.
Harrison, R. J.: Arboriculture in South-West Europe: dehesas as managed woodlands, in: The Origins and Spread of Agriculture and Pastoralism in Eurasia, edited by: Harris, D. R., Routledge, London, 363–367, https://research-information.bris.ac.uk/en/publications/arboricul ture-in-south-west-europe-idehesasi-as-managed-woodlands/ (last access: 22 June 2026), 1996.
Hawkins, E. and Sutton, R.: The potential to narrow uncertainty in projections of regional precipitation change, Clim. Dynam., 37, 407–418, https://doi.org/10.1007/s00382-010-0810-6, 2011.
Hernández-Santana, V., Martínez-Fernández, J., Morán, C., and Cano, A.: Response of Quercus pyrenaica (melojo oak) to soil water deficit: a case study in Spain, Eur. J. Forest Res., 127, 369–378, https://doi.org/10.1007/s10342-008-0214-x, 2008.
Howard, I. M., Stahle, D. W., Dettinger, M. D., Poulsen, C., Ralph, F. M., Torbenson, M. C. A., and Gershunov, A.: A 440-Year Reconstruction of Heavy Precipitation in California from Blue Oak Tree Rings, J. Hydrometeorol., 24, 463–477, https://doi.org/10.1175/JHM-D-22-0062.1, 2023.
IPCC (Intergovernmental Panel On Climate Change): Climate Change 2022 – Impacts, Adaptation and Vulnerability: Working Group II Contribution to the Sixth Assessment Report of the Intergovernmental Panel on Climate Change, 1st edn., Cambridge University Press, https://doi.org/10.1017/9781009325844, 2023.
Kaniewski, D., Van Campo, E., Guiot, J., Le Burel, S., Otto, T., and Baeteman, C.: Environmental roots of the Late Bronze Age crisis, PloS one, 8, e71004, https://doi.org/10.1371/journal.pone.0071004, 2013.
Kaser, G., Großhauser, M., and Marzeion, B.: Contribution potential of glaciers to water availability in different climate regimes, P. Natl. Acad. Sci. USA, 107, 20223–20227, https://doi.org/10.1073/pnas.1008162107, 2010.
Kromer, B., Wacker, L., Friedrich, M., Lindauer, S., Friedrich, R., Bitterli, J., Treydte, K., Fonti, P., Martínez-Sancho, E., and Nievergelt, D.: ORIGIN AND AGE OF CARBON IN THE CELLULOSE OF MID-LATITUDE TREE RINGS, Radiocarbon, 66, 1898–1913, https://doi.org/10.1017/RDC.2024.38, 2024.
Leal, S., Campelo, F., Luz, A. L., Carneiro, M. F., and Santos, J. A.: Potential of oak tree-ring chronologies from Southern Portugal for climate reconstructions, Dendrochronologia, 35, 4–13, https://doi.org/10.1016/j.dendro.2015.05.003, 2015.
Levanic, T., Cater, M., and McDowell, N. G.: Associations between growth, wood anatomy, carbon isotope discrimination and mortality in a Quercus robur forest, Tree Physiol., 31, 298–308, https://doi.org/10.1093/treephys/tpq111, 2011.
Link, R., Wild, T. B., Snyder, A. C., Hejazi, M. I., and Vernon, C. R.: 100 years of data is not enough to establish reliable drought thresholds, Journal of Hydrology X, 7, 100052, https://doi.org/10.1016/j.hydroa.2020.100052, 2020.
Ljungqvist, F. C., Piermattei, A., Seim, A., Krusic, P. J., Büntgen, U., He, M., Kirdyanov, A. V., Luterbacher, J., Schneider, L., Seftigen, K., Stahle, D. W., Villalba, R., Yang, B., and Esper, J.: Ranking of tree-ring based hydroclimate reconstructions of the past millennium, Quaternary Sci. Rev., 230, 106074, https://doi.org/10.1016/j.quascirev.2019.106074, 2020.
Madrigal-González, J., Ballesteros-Cánovas, J. A., Herrero, A., Ruiz-Benito, P., Stoffel, M., Lucas-Borja, M. E., Andivia, E., Sancho-García, C., and Zavala, M. A.: Forest productivity in southwestern Europe is controlled by coupled North Atlantic and Atlantic Multidecadal Oscillations, Nat. Commun., 8, 2222, https://doi.org/10.1038/s41467-017-02319-0, 2017.
Mayor, X. and Rodà, F.: Growth response of holm oak (Quercus ilex L) to commercial thinning in the Montseny mountains (NE Spain), Ann. For. Sci., 50, 247–256, https://doi.org/10.1051/forest:19930302, 1993.
Meklach, Y., Camenisch, C., Merzouki, A., and Herrera, R. G.: Potential of Arabic documentary sources for reconstructing past climate in the western Mediterranean region from AD 680 to 1815, The Holocene, 31, 1662–1669, https://doi.org/10.1177/09596836211033202, 2021.
Moreno, G. and López-Díaz, M. L.: The Dehesa: The most extensive agroforestry system in Europe, Agroforestry systems as a technique for sustainable land management, 171–183, ISBN 978-84-96351-59-2, 2009.
Niu, J., Zhao, X., Chen, F., Chen, Y., and Yue, W.: Precipitation reconstructions in the northern and southern Qilian Mountains based on tree rings of Picea crassifolia, Theor. Appl. Climatol., 155, 9657–9671, https://doi.org/10.1007/s00704-024-05190-4, 2024.
Olano, J. M., García-López, M. A., Sangüesa-Barreda, G., Coca, M. E., García-Hidalgo, M., Houdas, H., Rozas, V., and Hernández-Alonso, H.: Forgotten giants: Robust climate signal in pollarded trees, Sci. Total Enviro., 903, 166591, https://doi.org/10.1016/j.scitotenv.2023.166591, 2023.
Olano, J. M., Micó, E., Durà-Alemañ, C. J., García-Hidalgo, M., and Sangüesa-Barreda, G.: Perspectives: Cessation of traditional pruning threatens communal dehesas of deciduous oaks in the Western Mediterranean, Forest Ecol. Manag., 593, 122914, https://doi.org/10.1016/j.foreco.2025.122914, 2025.
Pauling, A., Luterbacher, J., Casty, C., and Wanner, H.: Five hundred years of gridded high-resolution precipitation reconstructions over Europe and the connection to large-scale circulation, Clim. Dynam., 26, 387–405, https://doi.org/10.1007/s00382-005-0090-8, 2006.
Pennisi, E.: Forest giants are the trees most at risk, Science, 365, 962–963, https://doi.org/10.1126/science.365.6457.962, 2019.
Peñuelas, J. and Sardans, J.: Global Change and Forest Disturbances in the Mediterranean Basin: Breakthroughs, Knowledge Gaps, and Recommendations, Forests, 12, 603, https://doi.org/10.3390/f12050603, 2021.
Petit, S. and Watkins, C.: Pollarding Trees: Changing Attitudes to a Traditional Land Management Practice in Britain 1600–1900, Rural Hist., 14, 157–176, https://doi.org/10.1017/S0956793303001018, 2003.
Piovesan, G. and Biondi, F.: On tree longevity, New Phytolol., 231, 1318–1337, https://doi.org/10.1111/nph.17148, 2021.
R Core Team: R: A Language and Environment for Statistical Computing, R Foundation for Statistical Computing, Vienna, Austria, https://www.R-project.org/ (last access: 22 October 2024), 2024.
Remm, J. and Lõhmus, A.: Tree cavities in forests – The broad distribution pattern of a keystone structure for biodiversity, Forest Ecol. Manag., 262, 579–585, https://doi.org/10.1016/j.foreco.2011.04.028, 2011.
Robeson, S. M., Maxwell, J. T., and Ficklin, D. L.: Bias Correction of Paleoclimatic Reconstructions: A New Look at 1,200+ Years of Upper Colorado River Flow, Geophys. Res. Lett., 47, e2019GL086689, https://doi.org/10.1029/2019GL086689, 2020.
Robinson, A., Lehmann, J., Barriopedro, D., Rahmstorf, S., and Coumou, D.: Increasing heat and rainfall extremes now far outside the historical climate, npj Clim. Atmos, Sci,, 4, 45, https://doi.org/10.1038/s41612-021-00202-w, 2021.
Rodrigo, F. S., Esteban-Parra, M. J., Pozo-Vázquez, D., and Castro-Díez, Y.: A 500-year precipitation record in Southern Spain, Int. J. Climatol., 19, 1233–1253, 1999.
Romagnoli, M., Moroni, S., Recanatesi, F., Salvati, R., and Mugnozza, G. S.: Climate factors and oak decline based on tree-ring analysis. A case study of peri-urban forest in the Mediterranean area, Urban For. Urban Gree., 34, 17–28, https://doi.org/10.1016/j.ufug.2018.05.010, 2018.
Rowell, D. P.: Sources of uncertainty in future changes in local precipitation, Clim. Dynam., 39, 1929–1950, https://doi.org/10.1007/s00382-011-1210-2, 2012.
Rozas, V.: Dendrochronology of pedunculate oak (Quercus robur L.) in an old-growth pollarded woodland in northern Spain: establishment patterns and the management history, Ann. For. Sci., 62, 13–22, https://doi.org/10.1051/forest:2004091, 2005.
Ruiz-Labourdette, D., Génova, M., Schmitz, M. F., Urrutia, R., and Pineda, F. D.: Summer rainfall variability in European Mediterranean mountains from the sixteenth to the twentieth century reconstructed from tree rings, Int. J. Biometeorol., 58, 1627–1639, https://doi.org/10.1007/s00484-013-0766-4, 2014.
Sánchez-Salguero, R., Colangelo, M., Matías, L., Ripullone, F., and Camarero, J. J.: Shifts in Growth Responses to Climate and Exceeded Drought-Vulnerability Thresholds Characterize Dieback in Two Mediterranean Deciduous Oaks, Forests, 11, 714, https://doi.org/10.3390/f11070714, 2020.
Sanmiguel-Vallelado, A., Sangüesa-Barreda, G., García-Hidalgo, M., Coca, M. E., and Olano, J. M.: Reconstructing 450 Years of Pollarding Events in Spanish Deciduous Oak Woodlands Using Machine Learning, Forests, 15, 2090, https://doi.org/10.3390/f15122090, 2024.
Sanmiguel-Vallelado, A., Torbenson, M. C. A., Esper, J., Sangüesa-Barreda, G., Prado-López, C., and Olano, J. M.: FIC aggregated monthly gridded precipitation data (1 km2, 1952-2020) for the Vilviestre and Valonsadero study rea, Repositorio Documental de la Universidad de Valladolid (UVaDOC) [data set], https://doi.org/10.71569/pznw-9644, 2026a.
Sanmiguel-Vallelado, A., Torbenson, M. C. A., Esper, J., Sangüesa-Barreda, G., Prado-López, C., and Olano, J. M.: Latewood width chronology and bias-corrected November–June precipitation reconstruction for northcentral Spain (1649–2023), Repositorio Documental de la Universidad de Valladolid (UVaDOC) [data set], https://doi.org/10.71569/b9cw-c103, 2026b.
Savelli, E., Rusca, M., Cloke, H., and Di Baldassarre, G.: Drought and society: Scientific progress, blind spots, and future prospects, WIREs Climate Change, 13, e761, https://doi.org/10.1002/wcc.761, 2022.
Schweingruber, F.: Modification of the Tree-Ring Structure Due to Defoliation and Pollarding, in: Wood Structure and Environment, Springer Berlin Heidelberg, Berlin, Heidelberg, 139–178, https://doi.org/10.1007/978-3-540-48548-3_7, 2007.
Steiger, N. J., Smerdon, J. E., Cook, E. R., and Cook, B. I.: A reconstruction of global hydroclimate and dynamical variables over the Common Era, Sci. Data, 5, 180086, https://doi.org/10.1038/sdata.2018.86, 2018.
Svoboda, M., Hayes, M., and Wood, D.: Standardized precipitation index: user guide, World Meteorological Organization, ISBN 978-92-63-11090-9, 2012.
Tejedor, E., De Luis, M., Cuadrat, J. M., Esper, J., and Saz, M. Á.: Tree-ring-based drought reconstruction in the Iberian Range (east of Spain) since 1694, Int. J. Biometeorol., 60, 361–372, https://doi.org/10.1007/s00484-015-1033-7, 2016.
Tejedor, E., Saz, M. A., Esper, J., Cuadrat, J. M., and De Luis, M.: Summer drought reconstruction in northeastern Spain inferred from a tree ring latewood network since 1734, Geophys. Res. Lett., 44, 8492–8500, https://doi.org/10.1002/2017GL074748, 2017.
Tejedor, E., de Luis, M., Barriendos, M., Cuadrat, J. M., Luterbacher, J., and Saz, M. Á.: Rogation ceremonies: a key to understanding past drought variability in northeastern Spain since 1650, Clim. Past, 15, 1647–1664, https://doi.org/10.5194/cp-15-1647-2019, 2019.
Tejedor, E., Serrano-Notivoli, R., Saz, M. Á., Longares, L. A., Novak, K., Cuadrat, J. M., and de Luis, M.: Rain in the desert; A precipitation reconstruction of the last 156 years inferred from Aleppo Pine in the Bardenas Natural Park, Spain, Dendrochronologia, 64, 125759, https://doi.org/10.1016/j.dendro.2020.125759, 2020.
Tessier, L., Nola, P., and Serre-Bachet, F.: Deciduous Quercus in the Mediterranean region: tree-ring/climate relationships, New Phytol., 126, 355–367, https://doi.org/10.1111/j.1469-8137.1994.tb03955.x, 1994.
Tonelli, E., Vitali, A., Brega, F., Gazol, A., Colangelo, M., Urbinati, C., and Camarero, J. J.: Thinning improves growth and resilience after severe droughts in Quercus subpyrenaica coppice forests in the Spanish Pre-Pyrenees, Dendrochronologia, 77, 126042, https://doi.org/10.1016/j.dendro.2022.126042, 2023.
Torbenson, M. C. A., Martinez del Castillo, E., Reinig, F., Stahle, D. W., King, K. E., Maxwell, J. T., Harley, G. L., Ziaco, E., and Esper, J.: Lack of cold temperatures is driving recent high-summer warming in the southern Rocky Mountains, Int. J. Biometeorol., 69, 1475–1486, https://doi.org/10.1007/s00484-025-02904-9, 2025.
Trullenque-Blanco, V., Beguería, S., Vicente-Serrano, S. M., Peña-Angulo, D., and González-Hidalgo, C.: Catalogue of drought events in peninsular Spanish along 1916–2020 period, Sci. Data, 11, 703, https://doi.org/10.1038/s41597-024-03484-w, 2024.
Vicente-Serrano, S. M., Gouveia, C., Camarero, J. J., Beguería, S., Trigo, R., López-Moreno, J. I., Azorín-Molina, C., Pasho, E., Lorenzo-Lacruz, J., Revuelto, J., Morán-Tejeda, E., and Sanchez-Lorenzo, A.: Response of vegetation to drought time-scales across global land biomes, P. Natl. Acad. Sci. USA, 110, 52–57, https://doi.org/10.1073/pnas.1207068110, 2013.
Vicente-Serrano, S. M., Quiring, S. M., Peña-Gallardo, M., Yuan, S., and Domínguez-Castro, F.: A review of environmental droughts: Increased risk under global warming?, Earth-Sci. Rev., 201, 102953, https://doi.org/10.1016/j.earscirev.2019.102953, 2020.
Wigley, T. M. L., Briffa, K. R., and Jones, P. D.: On the Average Value of Correlated Time Series, with Applications in Dendroclimatology and Hydrometeorology, J. Appl. Meteorol. Clim., 23, 201–213, https://doi.org/10.1175/1520-0450(1984)023<0201:OTAVOC>2.0.CO;2, 1984.
Wilson, R., Miles, D., Loader, N. J., Melvin, T., Cunningham, L., Cooper, R., and Briffa, K.: A millennial long March–July precipitation reconstruction for southern-central England, Clim. Dynam., 40, 997–1017, https://doi.org/10.1007/s00382-012-1318-z, 2013.
Yu, B., Li, J., and Shang, S.: A 3.5-fold increase in the synchrony of extreme precipitation and temperature events across China from 1930 to 2022, Sci. Rep., 15, 27405, https://doi.org/10.1038/s41598-025-13415-3, 2025.
Zang, C. and Biondi, F.: treeclim: an R package for the numerical calibration of proxy-climate relationships, Ecography, 38, 431–436, https://doi.org/10.1111/ecog.01335, 2015.