the Creative Commons Attribution 4.0 License.
the Creative Commons Attribution 4.0 License.
 | 30 Jun 2026
Temperature and light regulated patterns of physiology, morphology and elemental stoichiometry in geographically distinct isolates of a cosmopolitan diatom
Alyson M. Theseira
Daniel A. Nielsen
Penelope Ajani
Katherina Petrou
Anthropogenic influence on climate change has profound and diverse consequences on marine ecosystems. At the base of the food web, phytoplankton, are experiencing altered temperature regimes. In south-east Australia, the southward extension of warm waters, driven in part by the East Australian Current (EAC), is rapidly warming regional ocean temperatures, leading to the intensification of marine heat waves (MHWs). In this study, we investigated thermally adapted Leptocylindrus danicus strains isolated from four distinct latitudes to determine how silica production rates vary with temperature and irradiance. We also explored how the intra-specific phenotypic variability affects physiology and silica production. We found strong latitudinal effects on strain-specific cell volume (ranging from 313±22 µm2 to 2070±105 µm3) and pigment quotas (chl a 1.04±0.21 to 3.70±1.17 pg per cell−1; chl c 0.26±0.07 to 2.09±1.50 pg per cell−1), both increasing with increasing temperature. There was also a significant effect of temperature on silicification rates, which varied depending on growth irradiance and cell normalisation. Our data add new evidence of the role of temperature and light in modulating diatom silica production and highlight the importance in testing and understanding phenotypic variability across strains/isolates. By linking diatom elemental composition with biomineralisation rates, this study provides an assessment on how key diatom traits vary along a latitudinal gradient, providing unique insight into how ocean warming may influence resilience and adaptation potential of L. danicus, and how shift in physiology may impact diatom-regulated carbon and silicon cycling.
- Article
(1458 KB) - Full-text XML
-
Supplement
(444 KB) - BibTeX
- EndNote


Ocean warming is recognised as one of the major anthropogenic environmental stressors threatening marine ecosystem structure and functioning (Bindoff et al., 2013; Doney et al., 2012). It is well understood that temperature controls phytoplankton physiology and metabolic processes, and therefore defines the biogeographical range and distribution of a species (Boscolo-Galazzo et al., 2018; Thomas et al., 2012). The Eastern Australian Current (EAC) is a dominant oceanographic feature of the east coast of Australia, and is identified as a future “hotspot” for ocean warming, with models predicting up to an 8 °C warming trend for the 2001–2050 time-period examined (Hobday and Pecl, 2014; Popova et al., 2016). As the EAC continues to strengthen with climate change due to a “spin-up” of the South Pacific gyre, warm, nutrient-poor water is being driven southward along the east coast and is combined with ocean temperatures already increasing at a faster rate than projected, and as such, these trends are likely to have consequences for ecological processes and communities (Phillips et al., 2020). Furthermore, warmer surface waters can cause a shallowing of the surface mixed layer, forming a barrier to vertical exchange of nutrients from depth and constraining phytoplankton in the upper surface waters, exposing them to high irradiances and reduced nutrient availability (Li et al., 2020). Therefore, understanding species-specific responses to temperature is crucial for predicting changes in phytoplankton abundance and community composition and how this will affect primary productivity, food web interactions, biogeochemical cycles and the biological pump.
Diatoms (Bacillariophyta) are siliceous organisms, responsible for an estimated 20 % of global primary productivity (Field et al., 1998). They are of significant ecological importance and recognised as one of the most diverse phytoplankton groups in the marine environment (Malviya et al., 2016). Their unique silicified cell walls (frustules) differentiate them from other phytoplankton and is the morphological feature that confers their central importance to global biogeochemical cycling of carbon and silicon in the oceans (Tréguer et al., 2018). Diatoms are ubiquitously distributed, but tend to dominate dynamic coastal upwelling regions of the ocean where favourable conditions permit for the generation of blooms (Benoiston et al., 2017; Malviya et al., 2016). During these blooms, diatoms are major drivers of biological carbon sequestration in the oceans, however pronounced differences in growth, size, silicification and grazing pressure means that species abundance and composition is a determining factor of silica and carbon export in any given location at any point in time (Baines et al., 2010; Tréguer et al., 2018).
Leptocylindrus danicus is a cylindrical, chain-forming diatom with cosmopolitan distribution, and a major component of phytoplankton communities in coastal upwelling regions (Nanjappa et al., 2013). Along the south-east coast of Australia, L. danicus often dominates the coastal communities and is seen in greatest abundance during the spring (Ajani, et al., 2016). The continued success of L. danicus in these regions may be attributed to a combination of their widespread distribution (suggesting a broad thermal tolerance), rapid growth rates, large cell size (reduced pressure and predation by grazers) and life cycle strategy (reproduce both asexually and sexually via the formation of auxospores and resting spores), giving them a competitive advantage to survive and adapt with each spring bloom due to their diverse phenotypic and genetic variability (Ajani et al., 2021; Ajani et al., 2016; Nanjappa et al., 2013).
Diatoms incorporate soluble silica from seawater, in the form of silicic acid, and transport it across their cell membrane into intracellular pools via silica deposition vesicles (SDVs) for frustule (cell wall) biosynthesis (Thamatrakoln and Hildebrand, 2008). This process, however, has been shown to vary with silicic acid concentrations in the environment, which coincide with changes in temperature and seasons, in turn influencing diatom growth because of its direct influence on their cell cycle (Hildebrand and Lerch, 2015; Shrestha et al., 2012; Shrestha and Hildebrand, 2015). Temperature-driven responses in physiological, morphological and biochemical traits were revealed using thermal performance curves (TPCs) on the diatom Thalassiosira pseudonana, and most notable of these trait changes was a reduction in silicification at higher temperatures (Baker et al., 2016; Sheehan et al., 2020). Previous work on L. danicus strains grown at a fixed temperature (18 °C), on the other hand, demonstrated a latitudinal effect on silicification, whereby higher silicification rates were observed for strains isolated from lower latitudes compared to those from higher latitudes, likely due to strain-specific differences in thermal performance (Ajani et al., 2021). As such, while it is well known that temperature affects phytoplankton physiology and metabolic processes, there is a need to understand strain variability and the potential role of geographical adaptation in the phenotypic plasticity of individuals within a population in the context of ocean warming (Bennett et al., 2019). Here, we aim to identify temperature regulated patterns in silicification in multiple strains of L. danicus, and look at the intraspecific variability and thermal plasticity as a means of forecasting species-specific responses to warming. By looking at L. danicus strains with locally adapted thermal niches, we aim to provide new insights into how ocean warming may influence a species' growth and equally how diatom phenotypic plasticity provides resilience to rapid environmental change.
2.1 Leptocylindrus danicus isolates
Clonal culture isolates of the cosmopolitan diatom Leptocylindrus danicus used in this study were originally collected and established via single-cell isolation by Dr. P. Ajani between December 2015 to February 2016 (Table 1). For the present laboratory latitudinal study, strains were selected from four thermally distinct latitudes along the south-eastern Australian coastline, spanning from the north coast to south coast of New South Wales: Coffs Harbour (30.2986° S, 153.1094° E), Forster (32.1796° S, 152.5118° E), Maroubra (33.9495° S, 151.2437° E) and Twofold Bay (37.0844° S, 149.9277° E) (Table 1; Fig. 1). Prior to acclimation for experiments (described below), the established L. danicus strains from Coffs Harbour, Maroubra and Twofold Bay were maintained in 33 ppt salinity fresh seawater (FSW, 0.2 µm filtered) enriched and autoclaved with medium (Guillard and Ryther, 1962). Batch cultures were maintained in 50 mL culture flasks at 18 °C and illuminated at ∼35 µmol photons m−2 s−1 on a 12 : 12 h light : dark cycle under white light. At the time of this study, the L. danicus Forster strain was discontinued from Penelope Ajani's culture collection, and instead retrieved from the Australian National Algae Culture Collection (ANACC), Hobart, Tasmania; CSIRO strain CS-1164 (Table 1). This strain was maintained in medium at 20 °C, with ∼60 µmol photons m−2 s−1 illumination on a 12 : 12 h ligh : dark cycle using LED light panels. All cultures were transferred (1 : 100) into fresh medium at least every three weeks to maintain actively growing cells.
Table 1List of Leptocylindrus danicus strains used in this study: originating L. danicus sampling locations along the coastline of New South Wales, strain designation, collection dates, mean annual and spring sea surface temperature (SST) (°C) for the period 2015–2019 at each location.
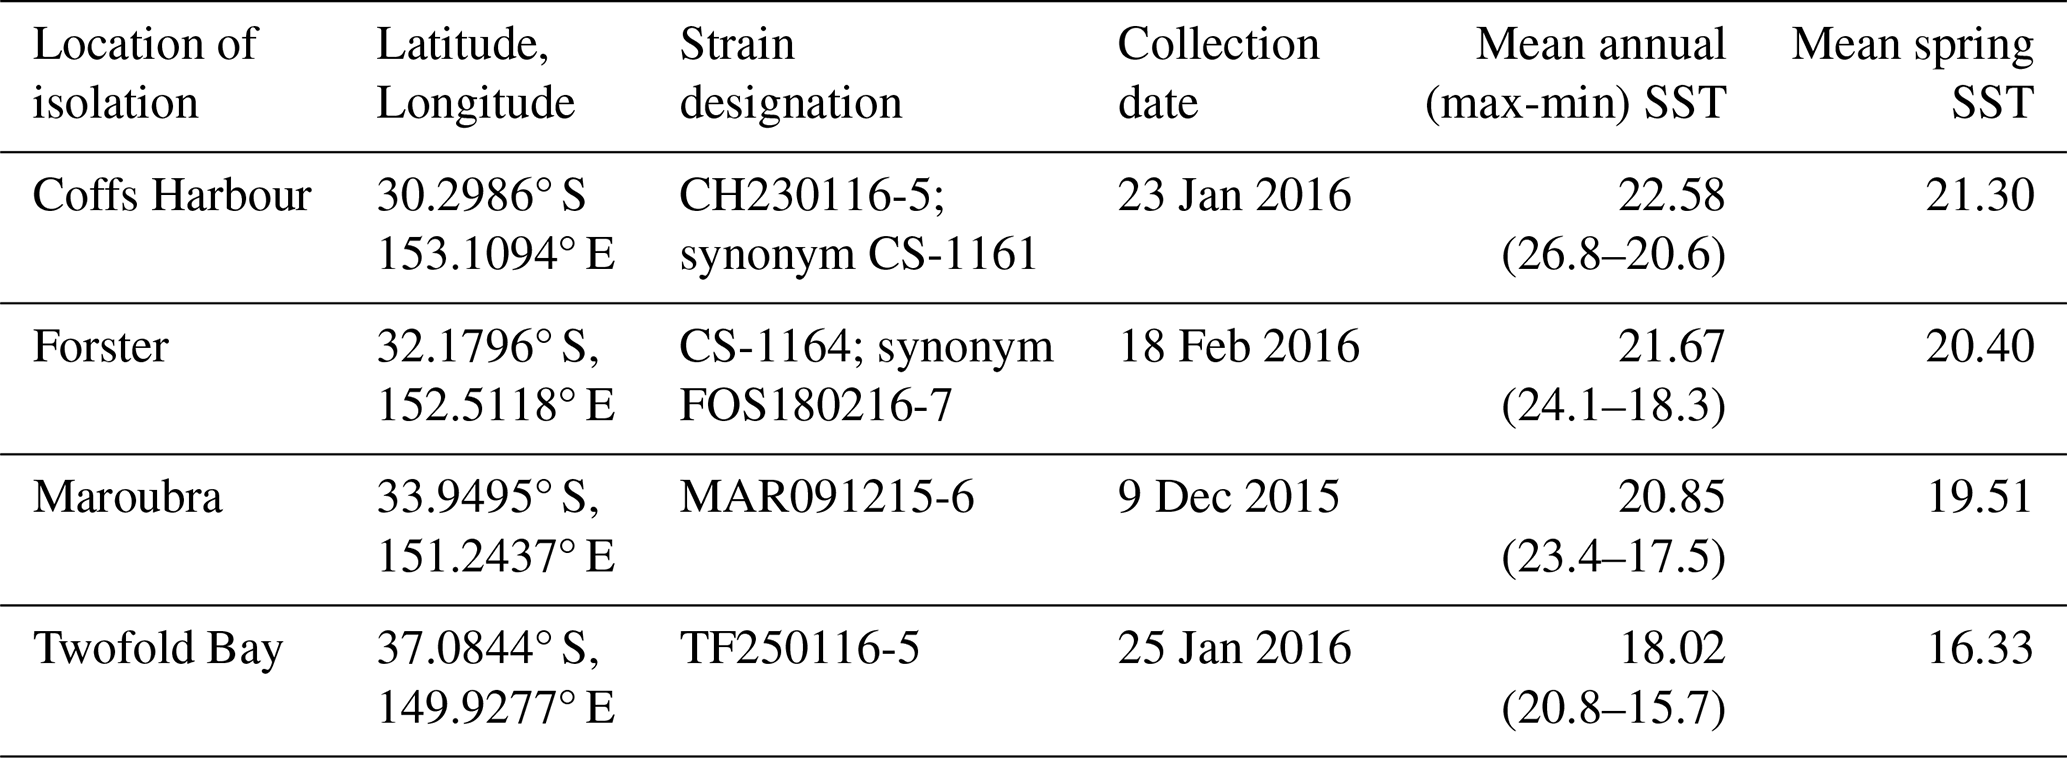
Annual and spring mean SST calculated from monthly data at ° spatial resolution from 2015–2019 (Jean-Michel et al., 2021).
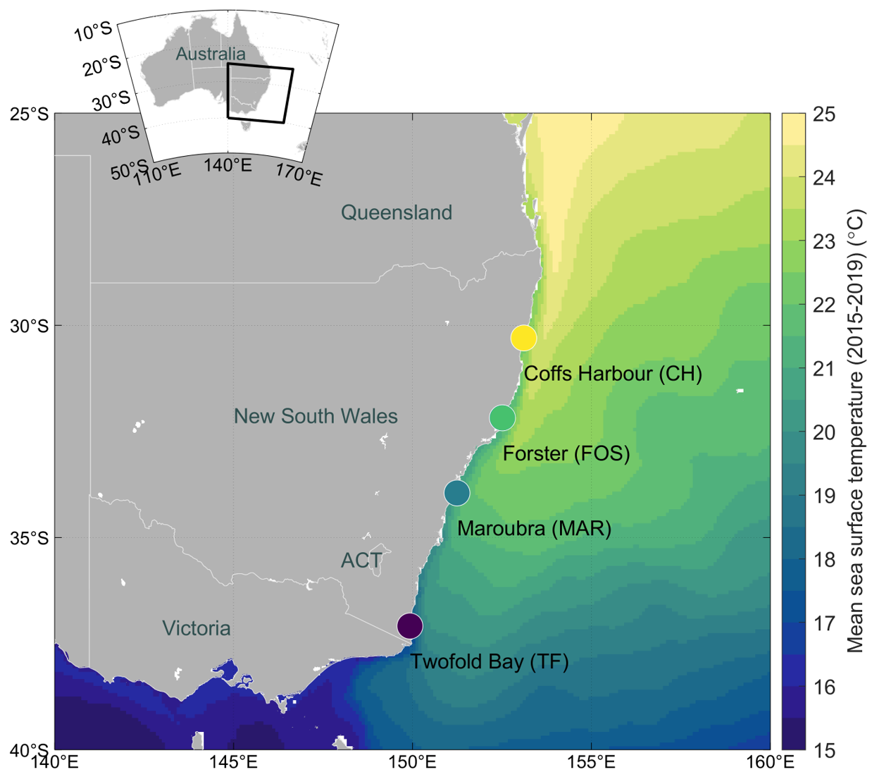
Figure 1Mean annual sea surface temperature (SST) map with sampling locations. Locations sampled on the coastline of south-eastern Australia for Leptocylindrus danicus strain isolates used in the current latitudinal study, from the north to south coast of New South Wales: Coffs Harbour (CH), Forster (FOS), Maroubra (MAR) and Twofold Bay (TF) are shown. Sampling locations are overlayed on an annual mean SST map calculated from monthly data at ° spatial resolution from 2015–2019 (Jean-Michel et al., 2021). Colour bar shows temperature (°C).
2.2 Experimental design and culture maintenance
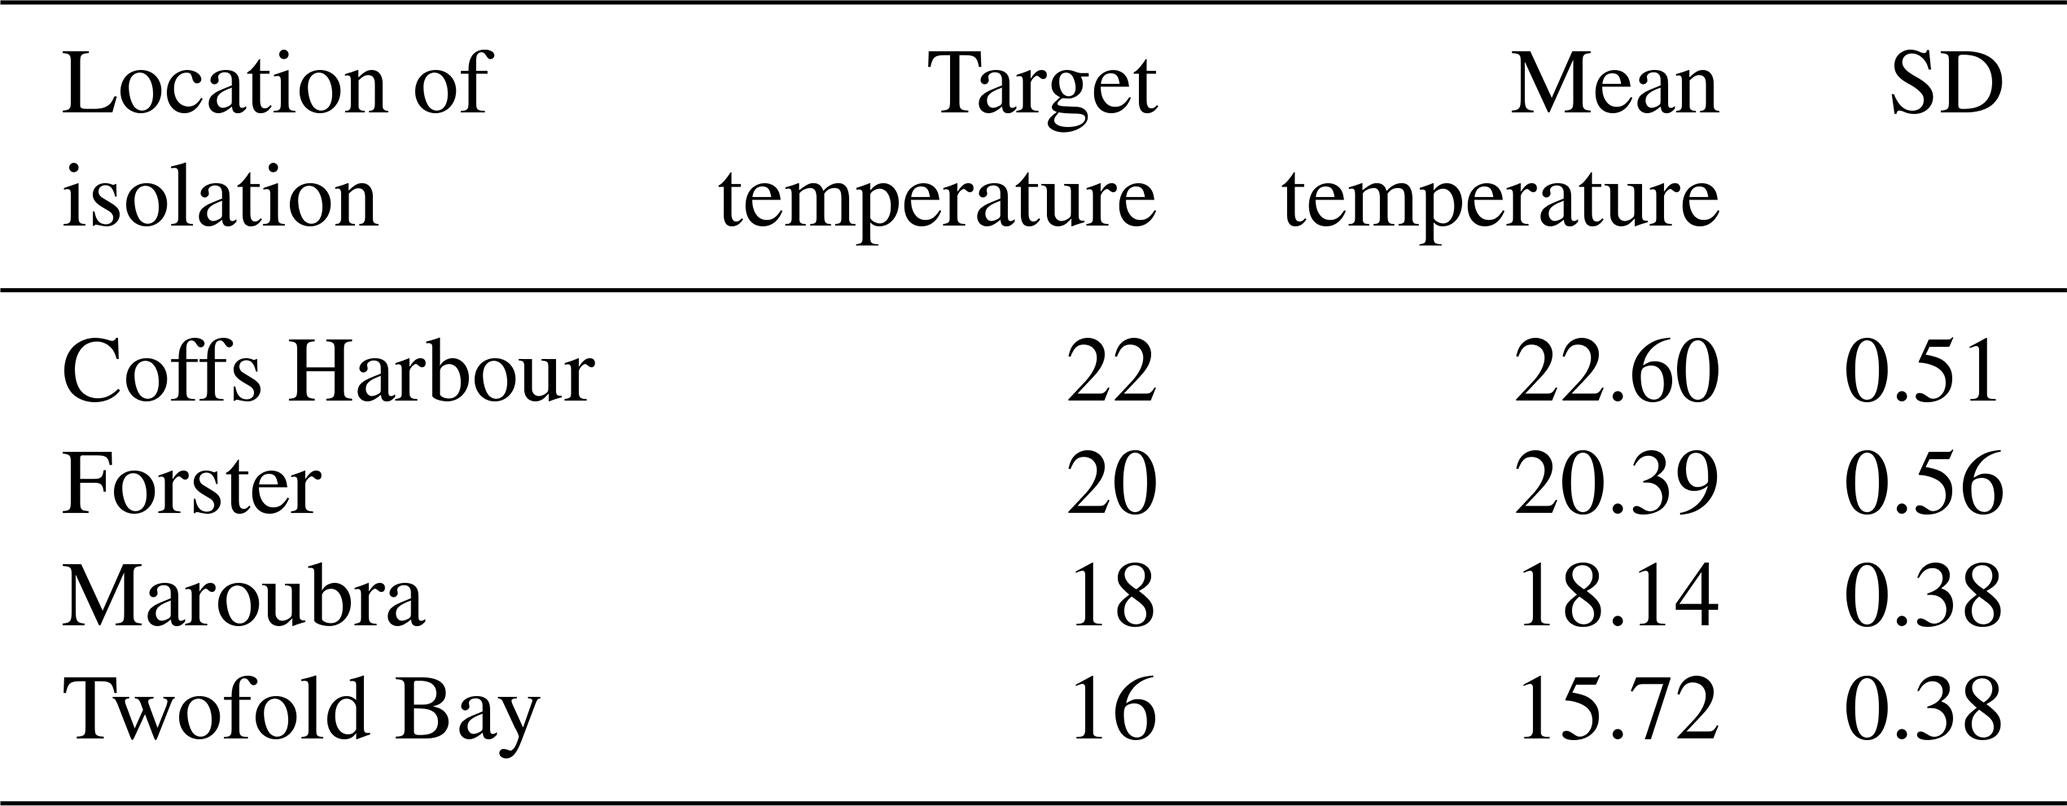
For the experiment, Leptocylindrus danicus strains from each of the four locations were acclimated and grown in locally sourced offshore seawater (0.2 µm filtered and autoclaved) enriched with medium (Guillard and Ryther, 1962) and modified with the addition of silicate (acidified with 0.5 M HCl in a 1.5 : 1 ratio). Cultures were maintained under controlled light and temperature conditions in Plant Growth Cabinets (CLIMATRON-1100-SL-H, Thermoline Scientific) fitted overhead with LED neutral white light (4000 K). Light was supplied on a 12 : 12 h light : dark cycle, with cultures grown under two light intensities provided at approximately 55 and 100 µmol photons m−2 s−1 (photosynthetically active radiation; PAR, using a LI-COR Light Meter, LI-250A, equipped with a 2Pi Quantum Sensor). To achieve the lower light intensity, growth cabinets were fitted with neutral density filters (90 % shading; LEE Filters). Cultures were grown at four different temperatures: 16, 18, 20, or 22 °C (Table 2), selected based on the natural average spring sea surface temperature (SST) for the period 2015–2019 at the approximate location of which the strains were isolated (see Table 1). Temperature was kept constant and monitored every 15 min throughout the acclimation and experimental period using iButton® temperature loggers (Thermochron) (Table 2).
Table 2Study temperatures. Assigned target experimental temperature and mean measured temperature (°C) ± standard deviation (SD). Data were collected every 15 min throughout acclimation period and experiment using temperature loggers.
At each light intensity, quadruplicate batch cultures (200 mL) of each strain were acclimated and grown for more than two months prior to measurement. Cultures were inoculated at ∼5000 cells mL−1 into sterile medium and grown in 250 mL Erlenmeyer flasks at their respective temperatures and irradiances. Throughout the acclimation and experimental periods, all cultures were transferred into fresh media every 10–14 d under sterile (biosafety cabinet) conditions to maintain healthy growing cells. The Twofold Bay L. danicus cultures were unable to establish at 100 µmol photons m−2 s−1, and therefore, only low light (55 µmol photons m−2 s−1) incubations were completed for this strain. All measurements were performed on cultures during their exponential growth.
2.3 Cell enumeration, growth rates and morphology
To establish growth rates, aliquots of 1 mL were sub-sampled daily from each flask and fixed with glutaraldehyde (2 % final concentration). Cell counts were performed manually using a Sedgewick Rafter counting chamber by counting to a minimum of 400 cells as per Ajani et al. (2016), using an upright Nikon Eclipse Ci fluorescence microscope ( magnification). Of note, most cultures grew as colonial chains, except for Forster, which was solitary at high irradiance, but formed short chains under low light (Fig. S1 in the Supplement). Growth rates were monitored via light microscopy until the stationary phase was reached. Maximum average growth rates (μMax in divisions per day) for each strain were calculated during the exponential growth phase according to Guillard (1973).
Cell counts and cell volume measurements for data normalisation were taken on the day of experimental sampling for each strain when cultures were in exponential growth using a fixed 2 mL sub-sample (2 % glutaraldehyde). Cells were imaged under a microscope (Nikon Eclipse Ci fluorescence microscope) at 200× magnification using the Infinity Analyze 7 software, (version 7.1.0.1215; Teledyne Lumenera). To estimate cell sizes for each strain and replicate, the first 50 cells encountered were measured using the approximate cell diameters (width) and length, in the image processing package Fiji (Fiji is Just ImageJ) (Schindelin et al., 2012). Cell volume was then calculated assuming cylindrical cells, as per Hillebrand et al. (1999).
2.4 PDMPO labelling protocol and sampling
To assess biogenic silica (bSi) content and silica incorporation rates, exponentially growing cultures were harvested and inoculated in quadruplicate at 10 000 cells mL−1 into new 250 mL Falcon Tissue Culture Flasks in 155 mL (final volume) of filtered seawater amended with media. Cultures were inoculated with the fluorescent stain PDMPO (LysoSensor Yellow/Blue DND-160; ThermoFisher Scientific, Australia) to a final concentration of 0.125 µM (Leblanc and Hutchins, 2005) and incubated under experimental conditions for 24 h. Following 24 h incubation, labelled cultures were sampled for cell density, bSi content, PDMPO incorporation, and measurement of the photosynthetic health of cells ().
To determine bSi content and silica incorporation rates from PDMPO incubations, 100 mL aliquots from each incubation flask were filtered under low vacuum onto a 47 mm, 0.4 µm Nucleopore Polycarbonate Track-Etch (PCTE) Membrane filter (Cytiva, Whatman). Filters were rinsed with 0.2 µm FSW (1 mL, three times) to remove any residual and unbound PDMPO. Using sterile tweezers, filters were folded into quarters and placed toward the bottom of a 1.8 mL cryovial. Immediately after sampling, samples were flash frozen in liquid N2 and stored at −80 °C until further processing. Samples were prepared for processing by first thawing and removing filters from cryovials, unfolded onto a filter tower, and covered in 2 mL of 10 % HCl for 2 min to disrupt cell membranes. To further osmotically lyse cells and remove any unbound PDMPO and cellular debris, filters were subsequently rinsed with milli-Q water (1 mL, three times). HCl washed filters were then transferred to 15 mL Falcon tubes to digest frustules in a NaOH-HCl matrix for analyses using established methods (Leblanc and Hutchins, 2005). Briefly, 8 mL of 0.2 M NaOH was added to sample tubes before digestion in a hot water bath (∼95 °C) for 3 h. Samples were cooled in an ice bath and neutralised by adding 2 mL of 0.8 M HCl and mixed well. Filters were removed from sample tubes before centrifugation at 4000 rcf for 5 min to pellet any remaining debris. Samples were then split for processing of bSi and PDMPO analyses.
BSi production in samples were determined by withdrawing 2.5 mL of supernatant for analysis using the colorimetric analysis of reactive silicate, as in Strickland and Parsons (1972). To ensure samples fell within the range of the standard curve, samples (supernatant) were diluted with milli-Q water (2.5 mL final volume) prior to the addition of reagents for bSi content assays on both high light (1 : 10 dilution) and low light (1 : 2 dilution) samples. Absorbance was measured on a UV-VIS Spectrophotometer (Shimadzu UV-1280) at 810 nm and compared against a standard curve (R2≥0.997) prepared with a sodium metasilicate stock (10 mM) to a maximum concentration of 200 µmol L−1. Another 2.5 mL supernatant was withdrawn for measurement of PDMPO in the solution using a spectrofluorometer (Shimadzu RF-6000), equipped with a xenon lamp. Excitation was set at 380 nm (5 nm bandwidth) and emission peaks measured at 542 nm (10 nm bandwidth) with a 200 nm min−1 scanning speed. A standard curve (R2≥0.998) was prepared using a dilution of the original PDMPO stock culture (1 mM) for calibration standards (i.e. 1 µM stock concentration) in the NaOH-HCl digestion matrix to a maximum concentration of 0.1 µmol L−1. All PDMPO data were converted to bSi production using the recommended ratio of 2916 mol bSi per mol PDMPO (McNair et al., 2015) to enable quantitative comparisons. All measurements were made using a quartz cuvette (10 mm light path), results corrected against blanks and normalised to cell density and surface area.
2.5 Macronutrient determination
To estimate initial concentrations of cellular uptake and drawdown of phosphate and nitrate/nitrite (NOx) following 24 h PDMPO incubations, filtrate from each replicate was collected from experimental flasks (30 mL) and PDMPO incubation flasks (100 mL) using 0.2 µm PCTE filters. Macronutrients were analysed using the methods of Ringuet et al. (2011) for phosphate assays, and NOx assays based on Schnetger and Lehners (2014). Briefly, phosphate assays were prepared by adding 200 µL of sample to a 96 Well Tissue Culture Plate with 50 µL reducing agent and gently vortexed on a microplate shaker for 30 min. Absorbance was measured at 880 nm and results compared to a standard curve (R2≥0.99) prepared with a potassium phosphate monobasic (KH2PO4) stock solution. NOx (NO NO) assays were prepared by adding 180 µL of samples to a 96 Well Tissue Culture Plate with 120 µL reducing agent and incubated at 45 °C for 60 min. Absorbance was measured at 540 nm and results compared to a standard curve (R2≥0.99) prepared with a potassium nitrate (KNO3) stock solution. All samples were conducted using triplicate technical samples and absorbance measurements made on a TECAN Spark® Multimode Microplate Reader (Spark Control version 3.1).
2.6 Photophysiology
The photo-physiological condition of exponentially growing L. danicus cultures were analysed via a multi-step (eight light levels) steady state light curve, using a pulse amplitude modulated (PAM) fluorometer (Water PAM, Walz GmbH, Effeltrich, Germany) following the protocol outlined in Petrou et al. (2011). Prior to analyses, live subsamples (2 mL) were dark-adapted under subdued light for 15 min. Following dark acclimation, a saturating pulse of light for 0.8 s with an intensity of 8 was applied for determination of minimum (FO) and maximum (FM) fluorescence to calculate the maximum quantum efficiency of PSII (), where: = (FM–FO) . To estimate the efficiency of photosystem II (PSII), a series of saturating pulses (30 s apart) of light under actinic illumination (4 min) at eight intensities for both high light (72, 107, 163, 240, 360, 540, 764, 1050 µmol photons m−2 s−1) and low light adapted cultures (48, 72, 107, 163, 240, 360, 540, 764 µmol photons m−2 s−1) were conducted, and the average of the last three measurements at each light step recorded. For each saturating pulse, the effective quantum yield of PSII [Y(II)], non-photochemical quenching (NPQ), and relative electron transport rates (rETR) were calculated automatically by the Water PAM (Walz) in the WinControl-3 software. Using a custom-made macro in SigmaPlot version 14.5 (Systat Software, Inc.), a curve fitting model was applied to rETR as a function of irradiance (PAR; µmol photons m−2 s−1), and the maximum relative electron transport rate (rETRmax), light utilisation efficiency (alpha; α) and minimum saturating irradiance (Ik) calculated as in Ralph and Gademann (2005). To determine whether PDMPO negatively affected cells, the maximum quantum efficiency of PSII () was determined before and following 24 h incubations.
2.7 Chlorophyll a and c determination
To determine chlorophyll a and c (c1+c2) content, 50 mL aliquots from each replicate of exponentially growing culture were filtered onto 25 mm Whatman GF/F filters (0.7 µm nominal pore size) under low vacuum (≤15 mm Hg). Filters were placed at the bottom of 15 mL Falcon tubes and immediately stored at −30 °C until further processing. Exposure of chlorophyll extracts to light was avoided to evade degradation of products. Pigments were extracted from cells by adding 3 mL of 90 % acetone () to thawed samples, vortexed, filters pressed to the bottom of the tube, then allowed to stand in a refrigerator in the dark for at least 15 h at 4 °C. Following overnight extraction, samples were vortexed again, filters removed, then centrifuged at 4000 rcf for 5 min at 4 °C to remove any remaining cellular debris. Chlorophyll content from each sample was determined by loading 2 mL of supernatant into a quartz cuvette (10 mm light path) and absorbance measured at 630 and 664 nm using a UV-VIS spectrophotometer (Shimadzu, UV-1280). Prior to sample measurements, a 90 % acetone blank was run to correct for background fluorescence. Chlorophyll a and c concentrations were calculated (µg mL−1) using the equations of Jeffrey and Humphrey (1975), later refined by Ritchie (2006), then normalised to cell density and cell volume.
2.8 Particulate organic carbon (POC) and nitrogen (PON)
For POC/PON determination, samples (100 mL) of exponentially growing cultures (one per biological replicate) were collected by vacuum filtration (<20 mm Hg) onto pre-combusted (450 °C for 5 h) 47 mm Whatman GF/F filters (0.7 µm nominal pore size). Individual filters were then wrapped in pre-combusted aluminium foil and immediately stored at −30 °C until further processing. Filters were prepared for analysis by first thawing, then acidifying with 1 M HCl dropwise until the filter was saturated. Acidified filters were then left in a drying oven at 60 °C for at least 48 h before being cut into quarters, wrapped and pelletised in 9 mm tin capsules (Elemental Microanlysis, UK). To quantify and correct for background concentrations, four “blanks” (filters with 100 mL of medium only) were also collected onto pre-combusted GF/F filters and processed, as above. Carbon and nitrogen analyses were conducted by the Biogeochemical Stable Isotope Facility at the University of Hawai'i at Mānoa using a Costech Elemental Combustion System with a Zero Blank Autosampler (ECS 4010) coupled with a Thermo Scientific Delta V Advantage, connected through a Thermo Scientific Conflo IV isotope ratio mass spectrometer.
2.9 Data analyses
All figures and data analyses were performed in RStudio version 2024.12.0+467 (R Core Team, 2024). Morphological and physiological trait data were tested for temperature-driven responses using linear regression. When no significant linear relationship was found, a one-way analysis of variance (ANOVA) was used to test for significant differences in phenotypic traits between strains at each light intensity. To ensure assumptions of normality and equal variance were satisfied, a Levene's test for homogeneity of variance was applied to all data, a priori. When treatment groups varied significantly, a Tukey's honestly significant difference (HSD) post hoc was used to isolate which groups differed significantly from each other. In cases where the assumption of equal variances was violated, a Bartlett's test was performed, followed by a Welch's ANOVA. If the F ratio was found to be significant, a Games-Howell post hoc test was performed to determine which treatment groups differed. Statistical significance was determined at α=0.05 for all samples. All figures were generated using add-on package ggplot2 v. 3.5.1 (Wickham, 2016).
Growth rates did not differ with growth irradiance for L. danicus strains acclimated to 18–22 °C (Fig. 2). Under low light conditions, we saw a significant temperature-dependent response (, P<0.001) with significantly lower growth rates recorded for Twofold Bay strains (16 °C; ) compared with the other strains (P<0.001; Fig. 2). Under high light conditions, we saw a significant effect of temperature on mean specific growth rate (μ) between L. danicus strains (, P=0.023) where the Maroubra strains grew significantly faster (P=0.018) than the Coffs Harbour strains; 0.71±0.05 d−1 and 0.59±0.03 d−1, respectively (Fig. 2). Growth morphology varied between strains (Fig. S1), with long colonial chains of more than four cells in cultures from Coffs Harbour, Maroubra and Twofold Bay. The Forster strain grew as either solitary cells (high light) or short chains of up to three cells (low light), and the cells were generally wider and shorter. The strains from Maroubra and Twofold Bay were much thinner than those from the two northern sites.
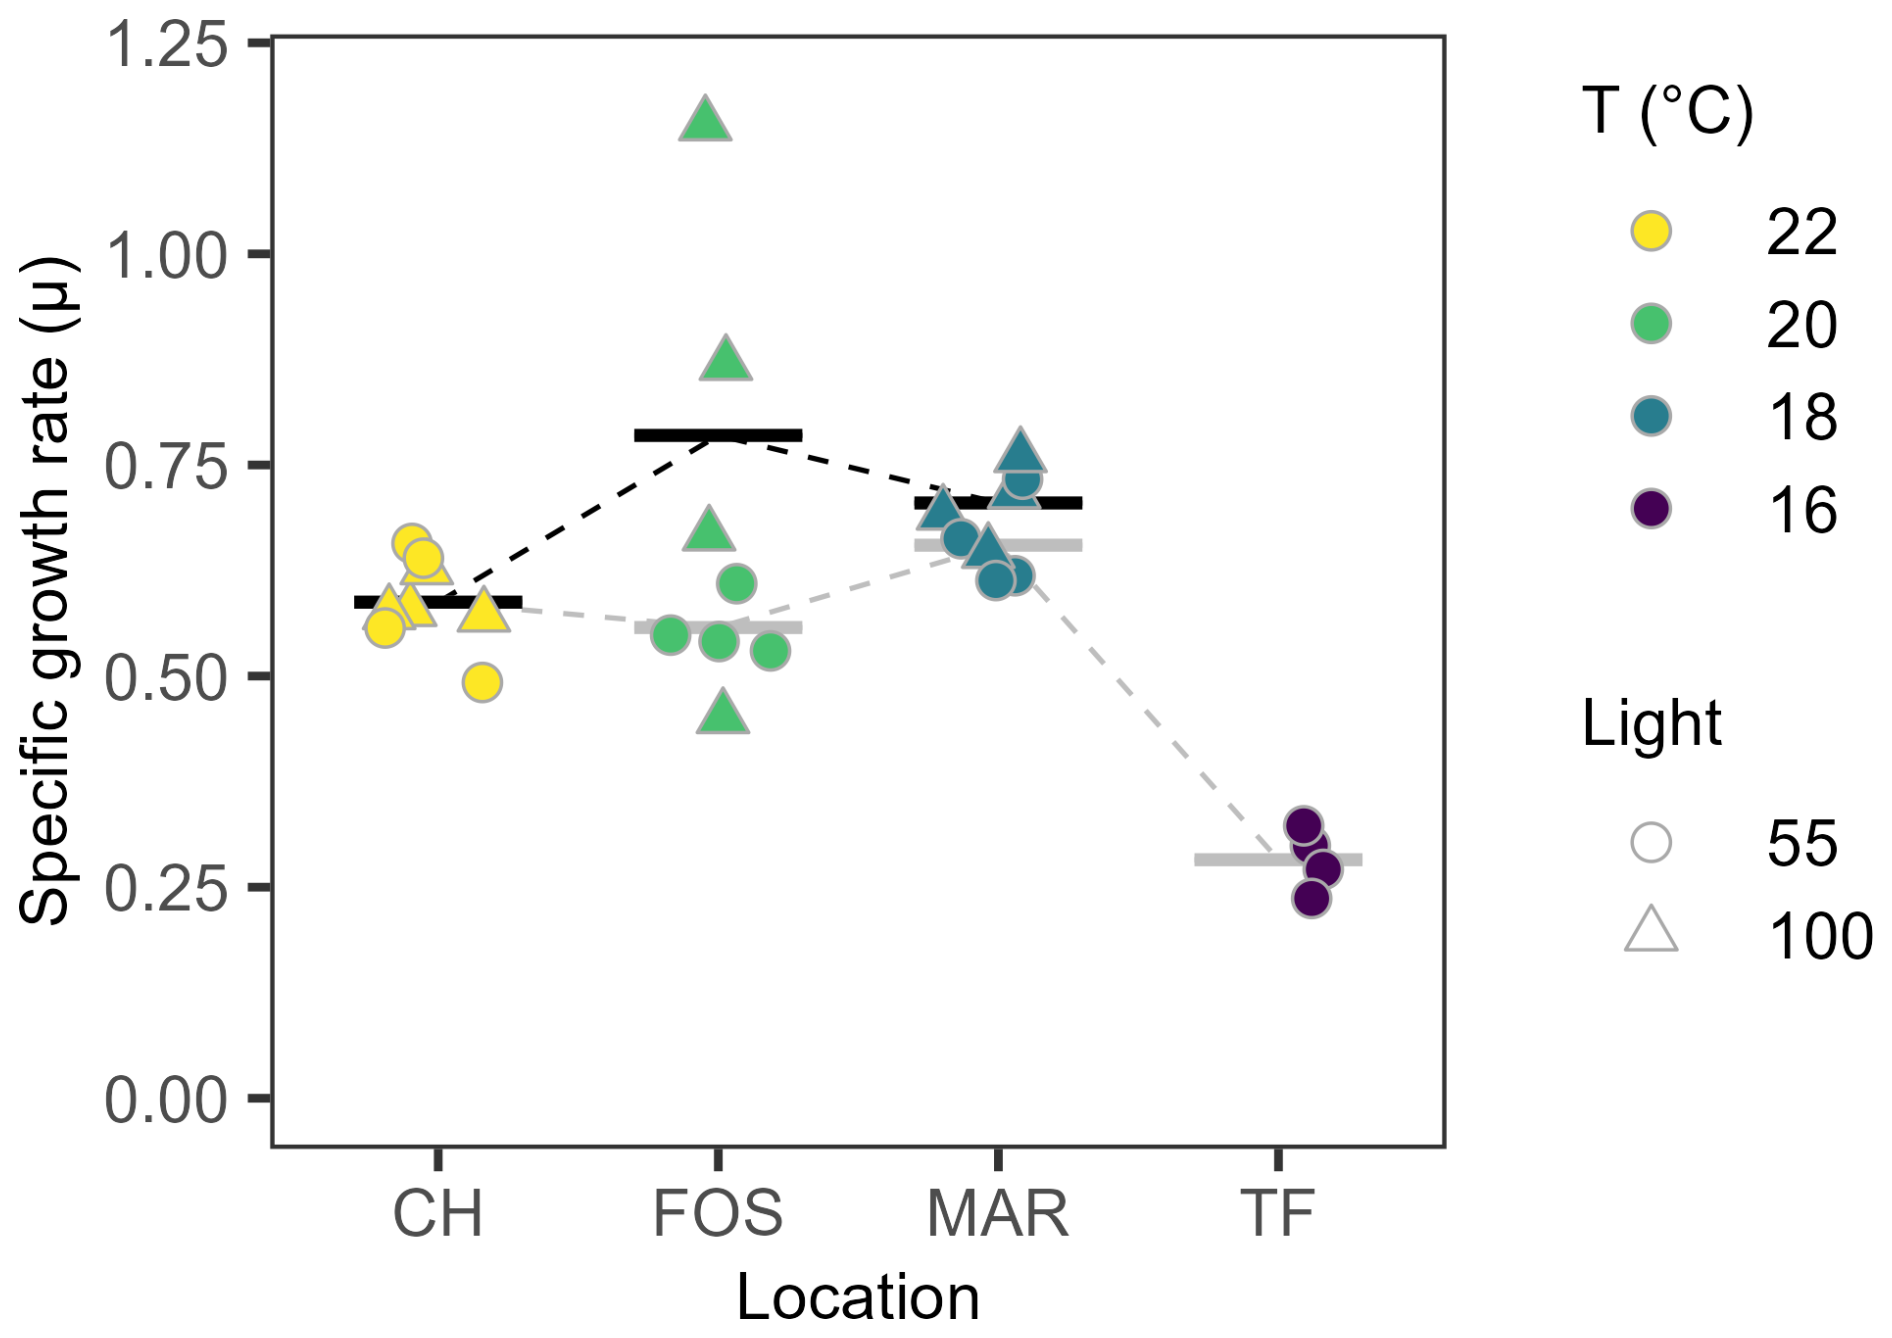
Figure 2Temperature and light dependent growth rates. Maximum specific growth rates (μMax in divisions per day) of Leptocylindrus danicus strains in response to temperature under 55 µmol photons m−2 s−1 (circles) and 100 µmol photons m−2 s−1 (triangles). Data are individual replicates (n=4) and bars represent their mean value, stippled lines between means are there as a visual guide.
Despite strong differences in growth morphology between strains – some forming long chains, others short chains or solitary cells – we saw a clear latitudinal pattern with cell size measurements during exponential growth in both light treatments (Fig. 3A, B). Mean cell surface area under low light ranged from 313±22 µm2 for Twofold Bay strains to 902±73 µm2 for Coffs Harbour strains (R2=0.881, P<0.0001; Fig. 3A), while high light cell volume ranged from 624±55 µm2 for Maroubra strains to 1104±37 µm2 for Coffs Harbour strains (R2=0.861, P<0.0001; Fig. 3A). For low light strains, there was a six-fold increase in mean cell volume across the temperate range from 239±27 µm3 for Twofold Bay strains to 1444±143 µm3 for Coffs Harbour strains (R2=0.899, P<0.0001; Fig. 3B) and mean cell volume more than doubled from 18 to 22 °C under high light, from 853±99 µm3 for Maroubra strains to 2070±105 µm3 for Coffs Harbour strains (R2=0.854, P<0.0001; Fig. 3B). An inverse response was observed in the surface area to volume ratio, which was negatively correlated with increasing temperature for both low (R2=0.851, P<0.0001; Fig. 3C) and high light treatments (R2=0.717, P=0.0005; Fig. 3C). We also detected a significant interaction (P=0.0025) with growth irradiance and strain (temperature), where the difference in SA : V diminished at higher light (Fig. 3C).
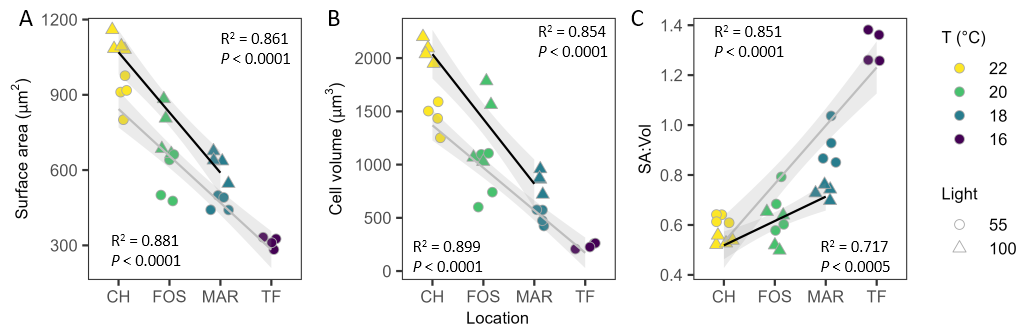
Figure 3Cell size and physiological trait variability. (A) Surface area (µm2), (B) cell volume (µm3), (C) surface area to volume ratio (SA : Vol) of Leptocylindrus danicus strains in their respective temperatures, under low (circles) and high (triangles) light. Data are independent replicates (n=4). The lines show the linear regression and the grey shaded area represent 95 % confidence intervals.
Steady-state light curves revealed temperature differentiation in effective quantum yield of PSII (Y(II)), relative electron transport rates (rETR) and non-photochemical quenching (NPQ), with a split between low light strains, where the warmer strains (Coffs Harbour and Forster) had higher photosynthetic rates and lower NPQ than the cooler strains and maximal NPQ in the Maroubra strain (Fig. 4A–C). When grown under higher irradiances, an inverse temperature trend was seen, with photosynthetic rates and NPQ decreasing with increasing temperatures (Fig. 4A–C). There was a significant effect of light or temperature on maximum quantum yield of PSII (FV : FM) at both low (, P<0.0001) and high (, P=0.033) irradiance (Fig. 4D). Under low light conditions, both Coffs Harbour and Forster strains demonstrated a significantly higher rETRmax compared to Maroubra and Twofold Bay strains (, P<0.001; Fig. 4E). Under high growth irradiance, maximum relative electron transport rates (rETRmax) increased with declining temperature (, P=0.009; Fig. 4E), being significantly higher in Maroubra strains compared to Coffs Harbour strains. Light utilisation efficiency (α) differed with temperature under low (, P<0.001; ) and high light (, P=0.002; P<0.001; Fig. 4F) conditions, but without a clear temperature trend. Minimum saturating irradiances (Ik) closely mirrored rETRmax, varying significantly between strains under low (, P<0.001) and high light (, P=0.039; Fig. 4G).
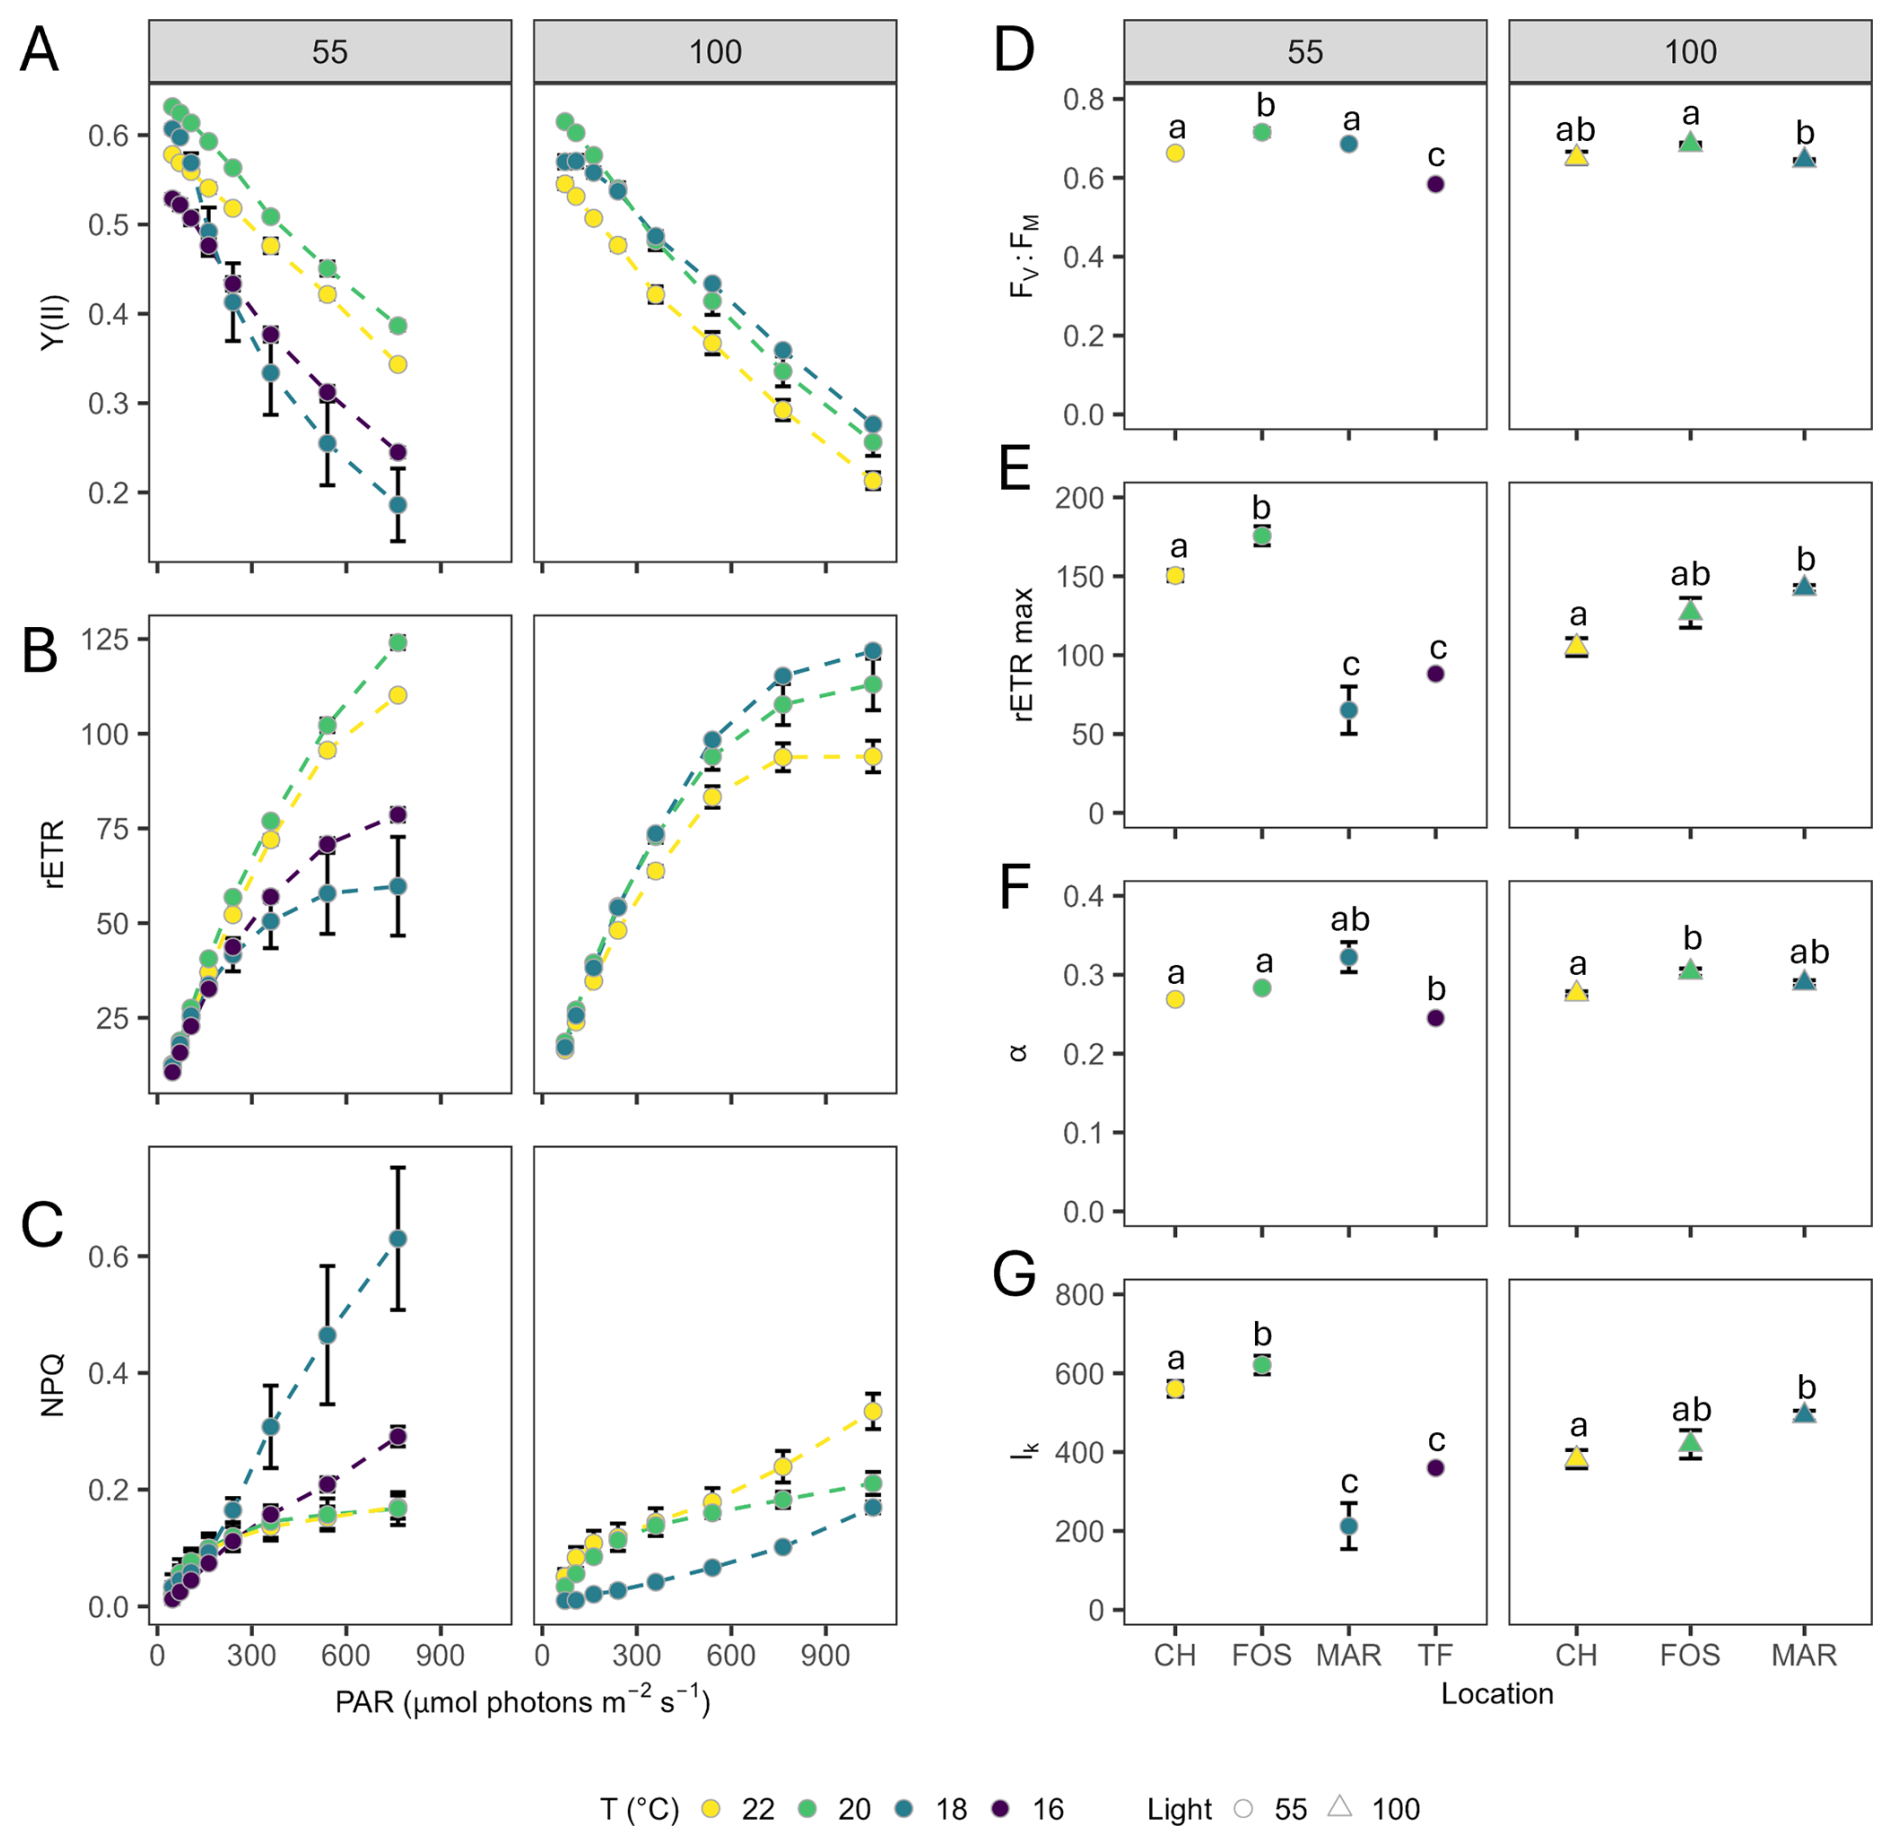
Figure 4Chlorophyll fluorescence parameters. (A) Effective quantum yield of PSII [Y(II)], (B) relative electron transport rates (rETR), and (C) non-photochemical quenching (NPQ), as a function of irradiance (PAR), (D) maximum quantum yield of PSII (FV : FM), (E) maximum rETRmax (µmol electrons m−2 s−1), (F) light utilisation efficiency (alpha; α) and (G) minimum saturating irradiance (Ik) (µmol photons m−2 s−1) determined for Leptocylindrus danicus strains acclimated to temperature conditions under each low (left) and high (right) light treatment. Data represent the mean of four biological replicates ± SD. Different letters indicate significant differences between strains (α=0.05).
There was a significant temperature effect on silicification rates (bSi incorporation rate measured from PDMPO incorporation) per cell under low light, with cells silicifying more with increased temperature (R2=0.804, , P<0.0001; Fig. 5A). Silicification rates also differed across strains under high light (, P=0.041), where at 18 °C, Maroubra cells silicified more (249.69±77.33 fmol per cell−1 d−1) than Forster strains at 20 °C (141.98±33.77 fmol per cell−1 d−1; Fig. 5A). Normalised to surface area, however, the temperature-dependent relationship seen in the low light data was less pronounced, with rates ranging from 0.14±0.03 fmol µm−2 d−1 to 0.20±0.13 fmol µm−2 d−1 (Fig. 5B). Conversely, we saw a significant temperature-dependent response on silicification in high light strains (, P=0.005), with the highest silicification seen at the lowest temperature in Maroubra strains (0.4±0.13 fmol µm−2 d−1), while both Forster and Coffs Harbour strains silicified less than half this amount at 0.19±0.02 fmol µm−2 d−1 (Fig. 5B). When normalised to cell volume, bSi showed a similar pattern for both low and high light cultures (Fig. 5C), with a significantly higher incorporation rate in the Maroubra strain grown at high irradiance (, P=0.0018) compared with the others, and a higher incorporation rate for the Twofold Bay strain (, P=0.001), when compared with the other strains grown at low light (Fig. 5C). We found no negative effect of PDMPO addition on the , confirming no potential toxicity of the stain at the concentration used (Table S1).
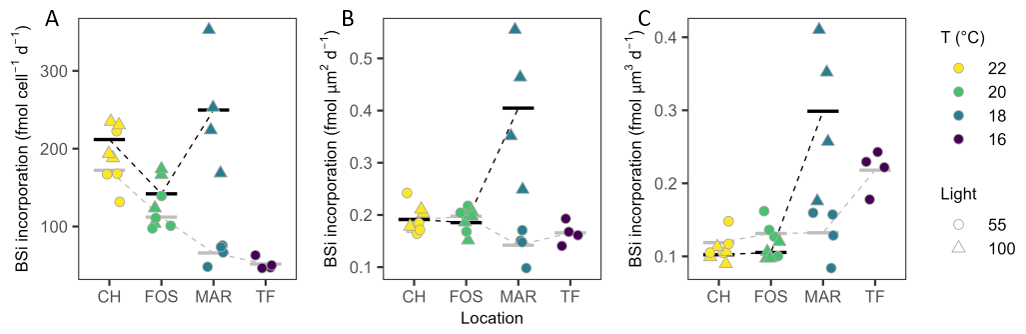
Figure 5Silicification rates. Biogenic silicate (bSi) incorporation from 24 h incubations, normalised to (A) cell density (fmol per cell−1 d−1), (B) surface area (fmol µm2 d−1), and (C) cell volume (µm3) of Leptocylindrus danicus strains for low (circles) and high (triangles) light treatment. Data are individual measurements (n=4), and horizontal bars represent their mean value. Stippled lines between means are provided as a visual guide only.
Under low light, mean carbon content varied significantly across strains (, P<0.001), with higher total carbon seen in Forster strains (78.81±20.69 pg per cell−1) compared to the strains from Twofold Bay (17.40±1.72 pg per cell−1), Maroubra (32.18±4.48 pg per cell−1), and Coffs Harbour (31.23±16.25 pg per cell−1; Fig. 6A). Total carbon per cell differed across strains grown under high light, showing an increase with increasing temperature (, P=0.001), where both Forster and Coffs Harbour strains had significantly higher carbon content (61.60±11.11 pg per cell−1 and 72.58±8.24 pg per cell−1, respectively) than Maroubra strains (31.31±13.41 pg per cell−1; Fig. 6A). Cell specific nitrogen content showed a similar pattern to carbon, with mean nitrogen content greatest under warmer conditions under low light (, P<0.001; Fig. 6B), where there were higher values for Forster (19.46±2.38 pg per cell−1) and Coffs Harbour strains (14.92±2.22 pg per cell−1), compared with strains from Maroubra (6.90±0.74 pg per cell−1) and Twofold Bay (3.85±0.26 pg per cell−1). Likewise, higher nitrogen content in both Forster (14.62±0.57 pg per cell−1) and Coffs Harbour (14.05±0.90 pg per cell−1) strains under high light (, P<0.001; Fig. 6B). . Mean carbon to nitrogen ratios (C : N) showed no significant difference or latitudinal trend between strains in the high light treatment (Fig. 6C), whereas low light C:N differed across strains (, P<0.001), with significantly lower C:N for the Coffs Harbour strain (Fig. 6B).
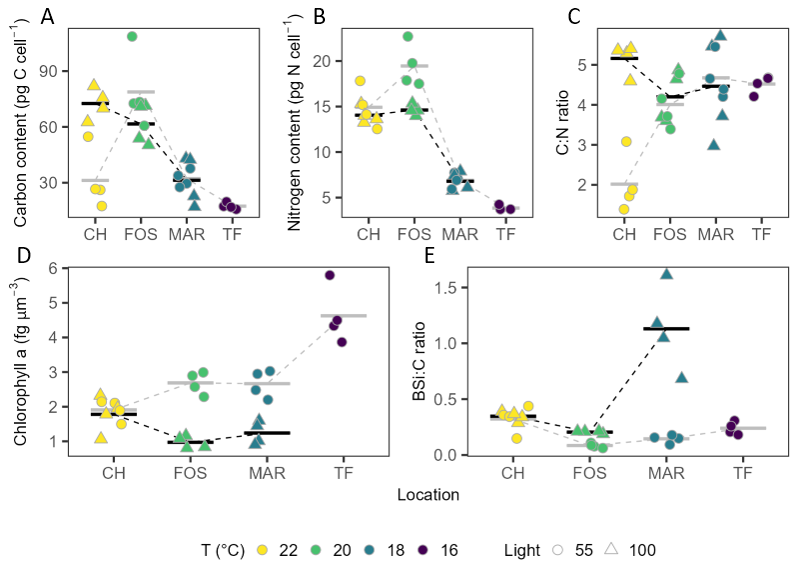
Figure 6Elemental composition. (A) total carbon per cell (pg), (B) total nitrogen per cell (pg), (C) carbon to nitrogen ratio (C : N), (D) chlorophyll a per cell volume (fg µm−3), EUR biogenic silicate to carbon (bSi) ratio of Leptocylindrus danicus strains from low (circles) and high (triangles) light. Data are individual replicates (n=4) and horizontal bars represent their mean value. Stippled lines between means are provided as a visual guide.
Chlorophyll content followed a latitudinal trend at which chlorophyll a and c pigments increased with increasing temperature under both light treatments (Table 3). Under high light, we saw significantly higher concentrations of chlorophyll a per cell at Coffs Harbour than the other two sites (, P=0.018). Significantly higher chlorophyll a content per cell was also seen for lower latitude strains exposed to low light (, P<0.001). Chlorophyll c per cell followed the same latitudinal trend with higher mean chlorophyll c concentrations in Coffs Harbour strains (2.09±1.50 pg per cell−1) than Maroubra strains (0.26±0.07 pg per cell−1; P=0.037) (Table 3), and higher chlorophyll c per cell in the Coffs Harbour strains (0.98±0.17 pg per cell−1) compared to all other latitudes grown under low light (, P<0.001; Table 3). When normalised to cell volume, mean chlorophyll a concentration differed across strains (, P=0.039), with low light cultures showing a latitudinal trend (, P<0.001), of higher chlorophyll a per volume in Twofold Bay strains (4.62±0.83 fg µm−3) compared to all other strains, ranging between 1.91 to 2.69 fg µm−3 (Fig. 6D). High light cultures showed significantly more chlorophyll a per unit volume in Coffs Harbour strains (1.78±0.53 fg µm−3)than Forster strains (0.97±0.18 fg µm−3; P=0.034; Fig. 6D). Per volume mean chlorophyll c content did not differ across strains under high light (Table 3). However, in low light conditions, chlorophyll c per cell volume decreased with warmer temperatures (, P<0.001; Table 3).
Table 3Chlorophyll pigments. Chlorophyll a and c content normalised per cell (pg per cell−1) and per volume (fg µm3) for Leptocylindrus danicus strains in response to temperature under each light treatment. Data represent the mean of four biological replicates ± SD. Different letters indicate significant differences between strains within light condition (α=0.05).
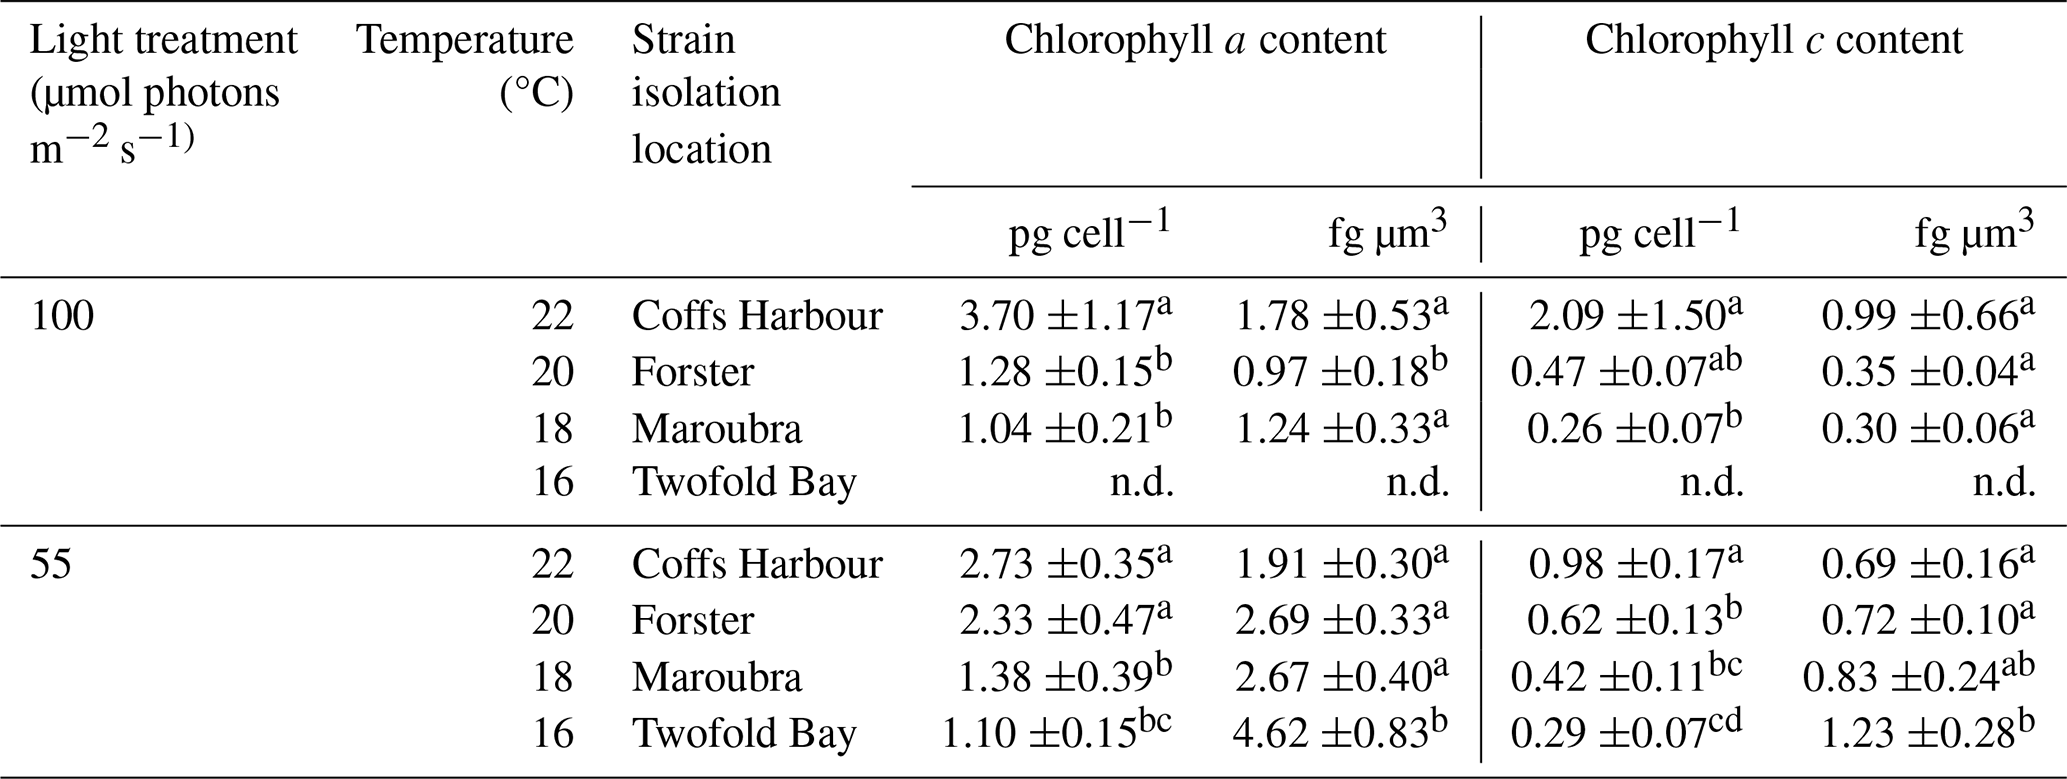
Superscript letters indicate statistical significance, where different letters indicate significant differences between sites, n.d. denotes “no data”.
Biogenic silica to carbon ratios (bSi : C) differed across strains. In the low light acclimated strains, bSi : C was highest in Coffs Harbour strain (0.32±0.12) compared to the Twofold Bay (0.24±0.06) and Maroubra (0.15±0.04) strains, and lowest in the Forster (0.09±0.02) strain (, P=0.003; Fig. 6E). For the high light strains, we found the highest ratio for Maroubra (1.13±0.38), followed by the Coffs Harbour (0.35±0.04), and Forster (0.24±0.06) strains (, P<0.00; Fig. 6E).
Principal component analysis (PCA) of physiological and morphological traits revealed strain separation associated with temperature and light, with PC1 explaining 37.6 % of the variation, while PC2 explained 22.8 % of variation (Fig. 7A). Cell size (SA : V) was anticorrelated with growth rate, having the greatest influence along PC1 (Fig. 7B). A key trait driving separation along PC2 was bSi : C, closely aligning with silicification rate, both of which were anti-correlated with photosynthetic efficiency ().
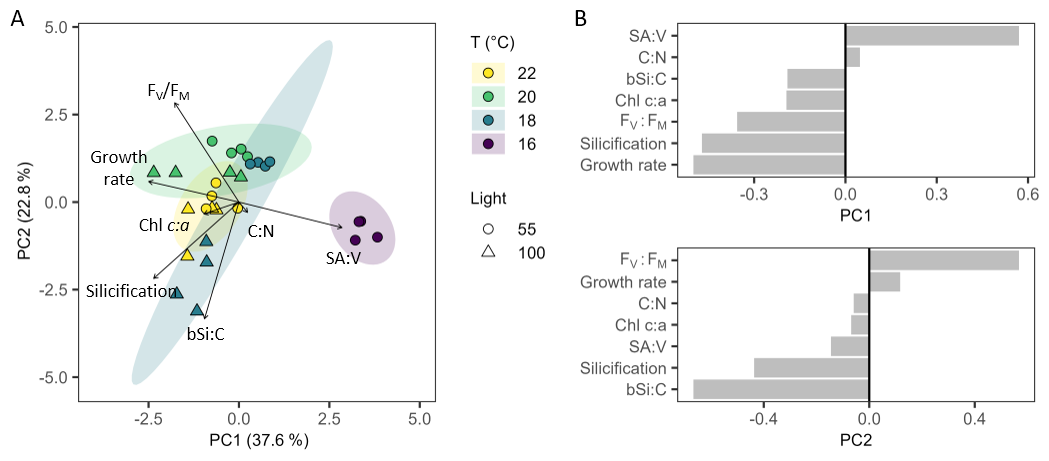
Figure 7Principal component analysis and loadings. (A) PCA with vectors of parameters contributing to differences in Leptocylindrus danicus strains grown at 22, 20, 18, and 16 °C under 55 and 100 µmol photons m−2 s−1; morphological (growth rate, cell surface area to volume ratio), and physiological traits (chlorophyll a, , silicification rate, carbon to nitrogen ratio (C : N), carbon to biogenic silica ratio (bSi : C)). (B) PCA loadings showing the contributions of each trait to PC1 and PC2 variation.
Here we investigated thermally adapted Leptocylindrus danicus strains isolated from four distinct latitudes to determine how strain-specific physiology, morphology and silica production rates differ with temperature and irradiance. We found strong latitudinal effects on cell volume and pigment content, both diminishing with temperature, and an inverse pattern in photosynthetic efficiency at different growth irradiances, where the higher temperature acclimated strains performed better at low light, while lower temperature strains performed better when grown at higher irradiance. Cell-specific silica incorporation rates were lower at cooler temperatures under low irradiance, but the pattern reversed when normalised to surface area, suggestive of development of thicker frustules in the strains acclimated to cooler temperatures. These data provide new insight into ways in which growth temperature and irradiance modulate physiology and silicification in L. danicus, enhancing our understanding of plasticity, physiological trade-offs and the adaptation potential of a cosmopolitan diatom to ocean warming.
4.1 Temperature and light have a positive effect on growth and cell size
Cell size is considered a key phenotypic trait influencing the extent at which phytoplankton respond to changes in the environment (Litchman et al., 2010). This study revealed significant intraspecific morphological variability between L. danicus isolates in response to acclimation to their locally adapted thermal niche (as experienced during spring), including differences in chain forming and chain length between strains. We confirmed a broad thermal niche in L. danicus, as in Ajani et al. (2021), and uncovered a strong temperature-dependent and latitudinal effect on growth rate and individual cell size (surface area and volume) for each strain, independent of whether strains were colonial or solitary. Under low light, low temperature conditions (Twofold Bay), we saw a significant reduction in mean growth rate which was anticorrelated with higher cell surface area to volume ratio. This higher surface area to volume ratio, typical of smaller cells, provides a competitive advantage over their larger counterparts, such as improving nutrient uptake through the reduced diffusive boundary layer thickness, and lower nutrient requirements to achieve maximum growth (Aksnes and Egge, 1991). Generally, phytoplankton are expected to decrease in size with increased surface warming, due to resource constraints and increased division rates (Hattich et al., 2024; Sommer et al., 2017). The strength of these shifts toward smaller species are likely to intensify with longer and more intense MHWs, and reduced nutrient supply from weakened coastal upwelling (Zhan et al., 2024). However, the response of diatoms to increasing temperatures is conflicting, with some species increasing in cell size, likely due to evolving different optimal growth temperatures (Liang et al., 2019). The increase in cell size of L. danicus at higher temperatures may be a direct physiological response to warming due to differences in phenotypic thermal performance (Baker et al., 2016; Schulte et al., 2011; Sheehan et al., 2020) or driven by an increased need for resources (Hattich et al., 2024).
4.2 The effect of growth irradiance on carbon allocation and elemental stoichiometry
Climate-induced changes in phytoplankton physiology and community structure are likely to alter the efficiency of the biological carbon pump (Basu and Mackey, 2018). This is because the nutritional quality (elemental and biochemical composition) and quantity of organic matter that ultimately influences the transfer of energy to higher trophic levels and carbon export to depth is largely dependent on species composition, their abundance, and their individual elemental stoichiometry (Duncan et al., 2022; Finkel et al., 2010). We found that under low growth irradiance, Coffs Harbour strains (22 °C) reduced their chlorophyll a content per unit area, compared to the other strains that displayed increased intracellular chlorophyll a with decreasing temperature. We also saw that low light acclimated Coffs Harbour strains had enhanced photosynthetic capacity through higher rETR and lower NPQ. This was also reflected in the increased rETRmax and Ik. The highest rates of NPQ were seen in the low-light acclimated Maroubra strain, which correlated with lower photosynthetic efficiencies, suggesting light limitation. The relatively lower intracellular chlorophyll a content of the larger, low light grown Coffs Harbour cells can be explained by the limitation of self-shading of pigments within the cell due to packaging effects with cell size, therefore providing absorptive efficiency of photosynthetic pigments (Finkel et al., 2004).
The low C : N ratios shown by Coffs Harbour strains grown at low light are consistent with a previous study that found light limitation caused a change in the uptake ratio and elemental composition of diatoms, specifically reduced carbon (Saito and Tsuda, 2003). In a warmer ocean, phytoplankton access to nutrients are proposed to decline, altering elemental ratios, while simultaneouly access to light for cells entrained in the surface layer will increase, reducing carbon limitation. In this study, the differences in elemental composition were not correlated to temperature or growth rates, but shifted in response to growth irradiance in the Coffs Harbour strain, suggesting that the stoichiometric plasticity is a response to low light acclimation (Sauterey and Ward, 2022; Yang et al., 2020). Therefore, under anticipated conditions caused by climate change induced stratification, our results indicate increased C : N with higher light availability could lead to decreased food quality (lower nitrogen supply) for grazing zooplankton (Finkel et al., 2010; Marinov et al., 2010). Importantly however, the strains used in this study were grown under nutrient replete conditions, thus precluding nutrient limitation as an influencing factor (Table S2), therefore the inclusion of nutrient manipulations in future temperature and light experiments would be important to further advance knowledge on how species adapt under the triad (temperature, light and nutrients) of critical environmental factors.
4.3 Temperature effects on silica production
Diatom size and silicification are both important phenotypic traits driving species performance, in turn influencing the structure and functioning of diatom assemblages and food web dynamics (Finkel et al., 2010; Sommer et al., 2017). Together, growth morphology and silica content, which varies across diatom species and strains (Martin-Jézéquel et al., 2000), can influence susceptibility to grazing pressure and sinking capacity (Tréguer et al., 2018). Our study revealed a clear latitudinal trend in silicification with temperature, and revealed strong size-dependent relationships, independent of whether chain-forming or solitary. We observed a reduction in silica deposition per cell with lower temperature (under low growth irradiance), however when differences in individual cell surface areas were accounted for, there was little difference in silicification rates across strains. When normalised to cell volume, strong trends appeared with lower temperature strains showing higher incorporation rates. Together, these results infer that under low light conditions, L. danicus from Twofold Bay (16 °C) have thicker frustules, which may in part be due to the lower growth rates of this strain, and therefore the increased length of time cultures underwent the cell wall synthesis phase, i.e. allowed for maximum silica incorporation into the frustule (Martin-Jézéquel et al., 2000; Su et al., 2018). The higher silica content in these cells would result in higher density and therefore more efficient sinking, as well as increased mechanical protection (in response to copepod cues), which are key ecological strategies for the smaller, slower growing diatoms that may otherwise be easily grazed in surface waters (Grønning and Kiørboe, 2020; Liu et al., 2016).
On the other hand, under high light conditions, L. danicus showed the highest silica incorporation per cell, per surface area and per volume under the lowest temperature (18 °C, Maroubra strain), confirmed by the highest bSi : C ratio, contrasting with the typical inverse correlation of silicification to growth rate (Flynn and Martin-Jézéquel, 2000). This strong increase in silicification of strains grown at lower temperature is consistent with previous studies looking at temperature-regulated responses on silicification using the diatom T. pseudonana (Baker et al., 2016; Sheehan et al., 2020). These data suggest that while the mechanistic uptake of silica, polymerisation and deposition of frustules may be thermally constrained, and independent of cell division (Sheehan et al., 2020), a combination of both increased temperature and light may elicit a similar diminished rate of silica deposition as seen in other stressors, such as seawater acidification, as seen in some species of an Antarctic diatom community (Petrou et al., 2019), high irradiance and pCO2 in T. weissflogii (FitzGerald-Lowry et al., 2025), or osmotic stress at higher salinities (Vrieling et al., 1999). Considering the phenotypic differences observed here, in the context of future oceans with combined warmer temperature and increased pH where diatoms are larger with reduced silica content, these data would suggest that diatoms in coastal upwelling systems may be subjected to increased grazing pressure, making them less efficient vectors for silica export (via sinking), and influencing trophic energy transfer to higher levels (Tréguer et al., 2018; Zhang et al., 2017).
4.4 Ecological implications of a warmer ocean
As temperatures in the EAC continue to warm, these data suggest that we may see changes to primary productivity and a reduction in silica production rates in L. danicus in this region. Such responses could have important implications for local silicon cycling and carbon sequestration given the dominant role of L. danicus in coastal communities and spring blooms on the Australian coast (Ajani et al., 2016). The large strain variability observed for L. danicus, a non-isolated cosmopolitan species, indicate that strain-specific responses to temperature are unlikely to be uniform (Ajani et al., 2021; Ajani et al., 2016; Koester et al., 2013). Therefore, further studies are necessary to isolate whether such responses are solely due to strain variability or whether the responses we are seeing are in fact temperature-driven (owing to their phenotypic plasticity). While L. danicus is known to encompass a number of functional traits that allow them to rapidly diversify and adapt with fluctuating conditions in upwelling systems (Ajani et al., 2021; Ajani et al., 2016), the potential reductions in cell density under warmer conditions may counteract the success of this species in this region. As such, further studies into species-specific responses with temperature are required to provide a better understanding of the major taxonomic groups that are likely to be affected under future oceanic conditions. This will enhance our understanding of how warmer oceans will alter species composition, abundance, distribution and food web interactions, which are essential for shaping marine nutrient cycling and carbon export.
All data is available in the Supplement.
The supplement related to this article is available online at https://doi.org/10.5194/bg-23-4305-2026-supplement.
AMT: methodology, investigation, data curation, data visualisation, formal analysis, writing original draft; DAN: methodology, data visualisation; PA: conceptualisation; KP: conceptualisation, methodology, investigation, data visualisation, formal analysis, funding acquisition, supervision, writing – review and editing.
The contact author has declared that none of the authors has any competing interests.
Publisher's note: Copernicus Publications remains neutral with regard to jurisdictional claims made in the text, published maps, institutional affiliations, or any other geographical representation in this paper. The authors bear the ultimate responsibility for providing appropriate place names. Views expressed in the text are those of the authors and do not necessarily reflect the views of the publisher.
AMT is supported by an Australian Government Research Training Program Scholarship. This study has been conducted using E.U. Copernicus Marine Service Information; https://doi.org/10.48670/moi-00021. Jointly assimilated observations include satellite altimeter data, sea surface temperature, and in situ vertical profiles of temperature and salinity. We thank Patrick J. Duke for putting the SST data together. The authors would like to thank Natalie Wallsgrove and the Biogeochemical Stable Isotope Facility at the University of Hawai'i at Mānoa for their assistance with processing our samples.
This research has been supported by the Australian Research Council (grant no. DP210101360) awarded to KP.
This paper was edited by Pierre Amato and reviewed by Johann Lavaud and one anonymous referee.
Ajani, P. A., Armbrecht, L. H., Kersten, O., Kohli, G. S., and Murray, S. A.: Diversity, temporal distribution and physiology of the centric diatom Leptocylindrus Cleve (Bacillariophyta) from a southern hemisphere upwelling system, Diatom Res., 31, 351–365, https://doi.org/10.1080/0269249X.2016.1260058, 2016.
Ajani, P. A., Petrou, K., Larsson, M. E., Nielsen, D. A., Burke, J., and Murray, S. A.: Phenotypic trait variability as an indication of adaptive capacity in a cosmopolitan marine diatom, Environ. Microbiol., 23, 207–223l, https://doi.org/10.1111/1462-2920.15294, 2021.
Aksnes, D. L. and Egge, J. K.: A theoretical model for nutrient uptake in phytoplankton, Mar. Ecol. Prog. Ser., 70, 65–72, https://doi.org/10.3354/meps070065, 1991.
Baines, S. B., Twining, B. S., Brzezinski, M. A., Nelson, D. M., and Fisher, N. S.: Causes and biogeochemical implications of regional differences in silicification of marine diatoms, Global Biogeochem. Cy., 24, 1–15, https://doi.org/10.1029/2010GB003856, 2010.
Baker, K. G., Robinson, C. M., Radford, D. T., McInnes, A. S., Evenhuis, C., and Doblin, M. A.: Thermal performance curves of functional traits aid understanding of thermally induced changes in diatom-mediated biogeochemical fluxes, Frontiers in Marine Science, 3, 1–14, https://doi.org/10.3389/fmars.2016.00044, 2016.
Basu, S. and Mackey, K. R. M.: Phytoplankton as key mediators of the biological carbon pump: Their responses to a changing climate, Sustainability-Basel, 10, https://doi.org/10.3390/su10030869, 2018.
Bennett, S., Duarte, C. M., Marbà, N., and Wernberg, T.: Integrating within-species variation in thermal physiology into climate change ecology, Philos. T. R. Soc. B., 374, https://doi.org/10.1098/rstb.2018.0550, 2019.
Benoiston, A. S., Ibarbalz, F. M., Bittner, L., Guidi, L., Jahn, O., Dutkiewicz, S., and Bowler, C.: The evolution of diatoms and their biogeochemical functions, Philos. T. R. Soc. B., 372, https://doi.org/10.1098/rstb.2016.0397, 2017.
Bindoff, N. L., Stott, P. A. A., AchutaRao, K. M., Allen, M. R. R., Gillett, N., Gutzler, D., Hansingo, K., Hegerl, G., Hu, Y., Jain, S., Sebbari, R., Zhang, X., Aldrin, M., Sarojini, B. B., Beer, J., Boucher, O., Braconnot, P., Browne, O., Chang, P., Zhang, R.: Detection and Attribution of Climate Change: from Global to Regional, in: Climate change 2013: The physical science basis. Contribution of Working Group I to the Fifth Assessment Report of the Intergovernmental Panel on Climate Change, edited by: Stocker, T. F., Qin, D., Plattner, G.-K., Tignor, M., Allen, S. K., Boschung, J., Nauels, A., Xia, Y., Bex, V., and Midgley, P. M., Midgley, Cambridge University Press, 867–952, https://doi.org/10.1038/ncomms13676, 2013.
Boscolo-Galazzo, F., Crichton, K. A., Barker, S., and Pearson, P. N.: Temperature dependency of metabolic rates in the upper ocean: A positive feedback to global climate change?, Global Planet. Change, 170, 201–212, https://doi.org/10.1016/j.gloplacha.2018.08.017, 2018.
Doney, S. C., Ruckelshaus, M., Emmett Duffy, J., Barry, J. P., Chan, F., English, C. A., Galindo, H. M., Grebmeier, J. M., Hollowed, A. B., Knowlton, N., Polovina, J., Rabalais, N. N., Sydeman, W. J., and Talley, L. D.: Climate change impacts on marine ecosystems, Ann. Rev. Mar. Sci., 4, 11–37, https://doi.org/10.1146/annurev-marine-041911-111611, 2012.
Duncan, R. J., Nielsen, D. A., Sheehan, C. E., Deppeler, S., Hancock, A. M., Schulz, K. G., Davidson, A. T., and Petrou, K.: Ocean acidification alters the nutritional value of Antarctic diatom, New Phytol., 233, 1813–1827, https://doi.org/10.1111/nph.17868, 2022.
Field, C. B., Behrenfeld, M. J., Randerson, J. T., and Falkowski, P.: Primary production of the biosphere: Integrating terrestrial and oceanic components, Science, 281, 237–240, https://doi.org/10.1126/science.281.5374.237, 1998.
Finkel, Z. V., Irwin, A. J., and Schofield, O.: Resource limitation alters the 3/4 size scaling of metabolic rates in phytoplankton, Mar. Ecol. Prog. Ser., 273, 269–279, https://doi.org/10.3354/meps273269, 2004.
Finkel, Z. V., Beardall, J., Flynn, K. J., Quigg, A., Rees, T. A. V., and Raven, J. A.: Phytoplankton in a changing world: Cell size and elemental stoichiometry, J. Plankton Res., 32., 119–137, https://doi.org/10.1093/plankt/fbp098, 2010.
FitzGerald-Lowry, B., Nielsen, D. A., Duncan, R. J., Theseira, A. M., Thompson, G., and Petrou, K.: Multi-trait responses in two marine diatoms to pH and irradiance reveal interactive effect of light and acidification, mediated by silicification, Limnol. Oceanogr., 70, 1137–1151, https://doi.org/10.1002/lno.70014, 2025.
Flynn, K. J., and Martin-Jézéquel, V.: Modelling Si–N-limited growth of diatoms, J. Plankton Res., 22, 447–472, https://doi.org/10.1093/plankt/22.3.447, 2000.
Grønning, J. and Kiørboe, T.: Diatom defence: Grazer induction and cost of shell-thickening, Funct. Ecol., 34, 1790–1801, https://doi.org/10.1111/1365-2435.13635, 2020.
Guillard, R. R. L.: Division rates, Handbook of Phycological Methods: Culture Methods and Growth Measurements, Cambridge University Press, 1973.
Guillard, R. R. L., and Ryther, J. H.: Studies of marine planktonic diatoms: I. Cyclotella nana Hustedt, and Detonula confervacea (Cleve) Gran, Can. J. Microbiol., 8, 229–239, https://doi.org/10.1139/m62-029, 1962.
Hattich, G. S. I., Jokinen, S., Sildever, S., Gareis, M., Heikkinen, J., Junghardt, N., Segovia, M., Machado, M., and Sjöqvist, C.: Temperature optima of a natural diatom population increases as global warming proceeds, Nat. Clim. Change, 14, 518–525, https://doi.org/10.1038/s41558-024-01981-9, 2024.
Hildebrand, M. and Lerch, S. J. L.: Diatom silica biomineralization: Parallel development of approaches and understanding, Semin. Cell Dev. Biol., 46, 27–35, https://doi.org/10.1016/j.semcdb.2015.06.007, 2015.
Hillebrand, H., Dürselen, C. D., Kirschtel, D., Pollingher, U., and Zohary, T.: Biovolume calculation for pelagic and benthic microalgae, J. Phycol., 35, 403–424, https://doi.org/10.1046/j.1529-8817.1999.3520403.x, 1999.
Hobday, A. J. and Pecl, G. T.: Identification of global marine hotspots: Sentinels for change and vanguards for adaptation action, Rev. Fish Biol. Fisher., 24, 415–425, https://doi.org/10.1007/s11160-013-9326-6, 2014.
Jean-Michel, L., Eric, G., Romain, B.-B., Gilles, G., Angélique, M., Marie, D., Clément, B., Mathieu, H., Olivier, L. G., Charly, R., Tony, C., Charles-Emmanuel, T., Florent, G., Giovanni, R., Mounir, B., Yann, D., and Pierre-Yves, L. T.: The Copernicus Global 1/12° Oceanic and Sea Ice GLORYS12 Reanalysis, Front. Earth Sci., 9, https://doi.org/10.3389/feart.2021.698876, 2021.
Jeffrey, S. W. and Humphrey, G. F.: New spectrophotometric equations for determining chlorophylls a, b, c1 and c2 in higher plants, algae and natural phytoplankton, Biochem. Physiol. Pfl., 167, 191–194, https://doi.org/10.1016/S0015-3796(17)30778-3, 1975.
Koester, J. A., Swanson, W. J., and Armbrust, E. V.: Positive selection within a diatom species acts on putative protein interactions and transcriptional regulation, Mol. Biol. Evol., 30, 422–434, https://doi.org/10.1093/molbev/mss242, 2013.
Leblanc, K. and Hutchins, D. A.: New applications of a biogenic silica deposition fluorophore in the study of oceanic diatoms, Limnol. Oceanogr.-Methods, 3, 462–476, https://doi.org/10.4319/lom.2005.3.462, 2005.
Li, G., Cheng, L., Zhu, J., Trenberth, K. E., Mann, M. E., and Abraham, J. P.: Increasing ocean stratification over the past half-century, Nat. Clim. Change, 10, 12, https://doi.org/10.1038/s41558-020-00918-2, 2020.
Liang, Y., Koester, J. A., Liefer, J. D., Irwin, A. J., and Finkel, Z. V.: Molecular mechanisms of temperature acclimation and adaptation in marine diatoms, ISME J., 13, 2415–2425, https://doi.org/10.1038/s41396-019-0441-9, 2019.
Litchman, E., de Tezanos Pinto, P., Klausmeier, C. A., Thomas, M. K., and Yoshiyama, K.: Linking traits to species diversity and community structure in phytoplankton, Hydrobiologia, 653, 15–28, https://doi.org/10.1007/s10750-010-0341-5, 2010.
Liu, H., Chen, M., Zhu, F., and Harrison, P. J.: Effect of diatom silica content on copepod grazing, growth and reproduction, Front. Mar. Sci., 3, 1–8, https://doi.org/10.3389/fmars.2016.00089, 2016.
Malviya, S., Scalco, E., Audic, S., Vincent, F., Veluchamy, A., Poulain, J., Wincker, P., Iudicone, D., De Vargas, C., Bittner, L., Zingone, A., and Bowler, C.: Insights into global diatom distribution and diversity in the world's ocean, P. Natl. Acad. Sci. USA, 113, E1516–E1525, https://doi.org/10.1073/pnas.1509523113, 2016.
Marinov, I., Doney, S. C., and Lima, I. D.: Response of ocean phytoplankton community structure to climate change over the 21st century: partitioning the effects of nutrients, temperature and light, Biogeosciences, 7, 3941–3959, https://doi.org/10.5194/bg-7-3941-2010, 2010.
Martin-Jézéquel, V., Hildebrand, M., and Brzezinski, M. A.: Silicon metabolism in diatoms: Implications for growth, J. Phycol., 36, 821–840, https://doi.org/10.1046/j.1529-8817.2000.00019.x, 2000.
McNair, H. M., Brzezinski, M. A., and Krause, J. W.: Quantifying diatom silicification with the fluorescent dye, PDMPO, Limnol. Oceanogr.-Methods, 13, 587–599, https://doi.org/10.1002/lom3.10049, 2015.
Nanjappa, D., Kooistra, W. H. C. F., and Zingone, A.: A reappraisal of the genus Leptocylindrus (Bacillariophyta), with the addition of three species and the erection of Tenuicylindrus gen. nov, J. Phycol., 49, 917–936, https://doi.org/10.1111/jpy.12102, 2013.
Petrou, K., Doblin, M. A., and Ralph, P. J.: Heterogeneity in the photoprotective capacity of three Antarctic diatoms during short-term changes in salinity and temperature, Mar. Biol., 158, 1029–1041, https://doi.org/10.1007/s00227-011-1628-4, 2011.
Petrou, K., Baker, K. G., Nielsen, D. A., Hancock, A. M., Schulz, K. G., and Davidson, A. T.: Acidification diminishes diatom silica production in the Southern Ocean, Nat. Clim. Change, 9, 781–786, https://doi.org/10.1038/s41558-019-0557-y, 2019.
Phillips, L. R., Carroll, G., Jonsen, I., Harcourt, R., and Roughan, M.: A Water Mass Classification Approach to Tracking Variability in the East Australian Current, Frontiers in Marine Science, 7, 1–10, https://doi.org/10.3389/fmars.2020.00365, 2020.
Popova, E., Yool, A., Byfield, V., Cochrane, K., Coward, A. C., Salim, S. S., Gasalla, M. A., Henson, S. A., Hobday, A. J., Pecl, G. T., Sauer, W. H., and Roberts, M. J.: From global to regional and back again: Common climate stressors of marine ecosystems relevant for adaptation across five ocean warming hotspots, Glob. Change Biol., 22, 2038–2053, https://doi.org/10.1111/gcb.13247, 2016.
R Core Team, R: A Language and Environment for Statistical Computing (2024.12.0+467), R Foundation for Statistical Computing, https://www.r-project.org (last access: 24 June 2026), 2024.
Ralph, P. J. and Gademann, R.: Rapid light curves: A powerful tool to assess photosynthetic activity, Aquatic Bot., 82, 222–237, https://doi.org/10.1016/j.aquabot.2005.02.006, 2005.
Ringuet, S., Sassano, L., and Johnson, Z. I.: A suite of microplate reader-based colorimetric methods to quantify ammonium, nitrate, orthophosphate and silicate concentrations for aquatic nutrient monitoring, J. Environ. Monitor., 13, 370–376, 2011.
Ritchie, R. J.: Consistent sets of spectrophotometric chlorophyll equations for acetone, methanol and ethanol solvents, Photosynth. Res., 89, 27–41, https://doi.org/10.1007/s11120-006-9065-9, 2006.
Saito, H. and Tsuda, A.: Influence of light intensity on diatom physiology and nutrient dynamics in the Oyashio region, Prog. Oceanogr., 57, 251–263, https://doi.org/10.1016/s0079-6611(03)00100-9, 2003.
Sauterey, B. and Ward, B. A.: Environmental control of marine phytoplankton stoichiometry in the North Atlantic Ocean, P. Natl. Acad. Sci. USA, 119, 1–6, https://doi.org/10.1073/pnas.2114602118, 2022.
Schindelin, J., Arganda-Carreras, I., Frise, E., Kaynig, V., Longair, M., Pietzsch, T., Preibisch, S., Rueden, C., Saalfeld, S., Schmid, B., Tinevez, J.-Y., White, D. J., Hartenstein, V., Eliceiri, K., Tomancak, P., and Cardona, A.: Fiji: an open-source platform for biological-image analysis, Nat. Methods, 9, 676, https://doi.org/10.1038/nmeth.2019, 2012.
Schnetger, B. and Lehners, C.: Determination of nitrate plus nitrite in small volume marine water samples using vanadium (III) chloride as a reduction agent, Mar. Chem., 160, 91–98, 2014.
Schulte, P. M., Healy, T. M., and Fangue, N. A.: Thermal Performance Curves, Phenotypic Plasticity, and the Time Scales of Temperature Exposure, Integr. Comp. Biol., 51, 691–702, https://doi.org/10.1093/icb/icr097, 2011.
Sheehan, C. E., Baker, K. G., Nielsen, D. A., and Petrou, K.: Temperatures above thermal optimum reduce cell growth and silica production while increasing cell volume and protein content in the diatom Thalassiosira pseudonana, Hydrobiologia, 847, 4233–4248, https://doi.org/10.1007/s10750-020-04408-6, 2020.
Shrestha, R. P. and Hildebrand, M.: Evidence for a regulatory role of diatom silicon transporters in cellular silicon responses, Eukaryot. Cell, 14, 29–40, https://doi.org/10.1128/EC.00209-14, 2015.
Shrestha, R. P., Tesson, B., Norden-Krichmar, T., Federowicz, S., Hildebrand, M., and Allen, A. E.: Whole transcriptome analysis of the silicon response of the diatom Thalassiosira pseudonana, BMC Genomics, 13, https://doi.org/10.1186/1471-2164-13-499, 2012.
Sommer, U., Peter, K. H., Genitsaris, S., and Moustaka-Gouni, M.: Do marine phytoplankton follow Bergmann's rule sensu lato?, Biol. Rev., 92, 1011–1026, https://doi.org/10.1111/brv.12266, 2017.
Strickland, J. D. H. and Parsons, T. R.: A Practical Handbook of Seawater Analysis, 2nd edn., Vol. 167, 311, Bulletin of Fisheries Research Board of Canada, Ottawa, 1972.
Su, Y., Lundholm, N., and Ellegaard, M.: The effect of different light regimes on diatom frustule silicon concentration, Algal Res., 29, 36–40, https://doi.org/10.1016/j.algal.2017.11.014, 2018.
Thamatrakoln, K. and Hildebrand, M.: Silicon uptake in diatoms revisited: A model for saturable and nonsaturable uptake kinetics and the role of silicon transporters, Plant Physiol., 146, 1397–1407, https://doi.org/10.1104/pp.107.107094, 2008.
Thomas, M. K., Kremer, C. T., Klausmeier, C. A., and Litchman, E.: A global pattern of thermal adaptation in marine phytoplankton, Science, 338, 1085–1088, https://doi.org/10.1126/science.1224836, 2012.
Tréguer, P. J., Bowler, C., Moriceau, B., Dutkiewicz, S., Gehlen, M., Aumont, O., Bittner, L., Dugdale, R., Finkel, Z., Iudicone, D., Jahn, O., Guidi, L., Lasbleiz, M., Leblanc, K., Levy, M., and Pondaven, P.: Influence of diatom diversity on the ocean biological carbon pump, Nature Geosci., 11, 27–37, https://doi.org/10.1038/s41561-017-0028-x, 2018.
Vrieling, E., Poort, L., Beelen, T., and Gieskes, W.: Growth and silica content of the diatoms Thalassiosira weissflogii and Navicula salinarum at different salinities and enrichments with aluminium, Eur. J. Phycol., 34, 307–316, https://doi.org/10.1080/09670269910001736362, 1999.
Wickham, H: ggplot2: Elegant Graphics for Data Analysis, Springer-Verlag, New York, ISBN 978-3-319-24277-4, https://ggplot2.tidyverse.org (last access: 24 June 2026), 2016.
Yang, X., Liu, L., Yin, Z., Wang, X., Wang, S., and Ye, Z.: Quantifying photosynthetic performance of phytoplankton based on photosynthesis–irradiance response models, Environ. Sci. Europe, 32, https://doi.org/10.1186/s12302-020-00306-9, 2020.
Zhan, W., Feng, M., Zhang, Y., Shen, X., Zhan, H., and He, Q.: Reduced and smaller phytoplankton during marine heatwaves in eastern boundary upwelling systems, Communications Earth and Environment, 5, 1–11, https://doi.org/10.1038/s43247-024-01805-w, 2024.
Zhang, S., Liu, H., Ke, Y., and Li, B.: Effect of the silica content of diatoms on protozoan grazing, Frontiers in Marine Science, 4, https://doi.org/10.3389/fmars.2017.00202, 2017.